Embed Size (px)
Citation preview

Cost Saving Alternatives for the
Quabbin Regional School District
April 27, 2017
Edward J. Collins, Jr. Center for Public Management
McCORMACK GRADUATE SCHOOL OF POLICY AND GLOBAL STUDIES

THIS PAGE IS INTENTIONALLY BLANK

Table of Contents Executive Summary ....................................................................................................................................... 1
Challenges Facing the Quabbin Regional School District .............................................................................. 7
Historic Challenges .................................................................................................................................... 7
Current Challenges .................................................................................................................................. 10
Population Change .............................................................................................................................. 10
Enrollment Change .............................................................................................................................. 11
Academic Performance ....................................................................................................................... 15
Per Pupil Spending .............................................................................................................................. 16
Recent Budget Reductions .................................................................................................................. 18
Spending per Pupil per School ............................................................................................................ 19
Special Education Costs ....................................................................................................................... 20
Space Utilization .................................................................................................................................. 21
Class Size per School per Grade .......................................................................................................... 23
Four Dimensions of Review ........................................................................................................................ 25
Identification of Community Values ........................................................................................................... 26
Data collection .................................................................................................................................... 26
Data analysis ....................................................................................................................................... 27
Findings ............................................................................................................................................... 27
Collins Center Principles ............................................................................................................................. 29
Alternatives Analysis ................................................................................................................................... 31
Best Practices Recommendations ............................................................................................................... 33
Space Use Alternatives................................................................................................................................ 65
Where Students Live ........................................................................................................................... 66
Assumptions ........................................................................................................................................ 69
Format of Alternatives Analysis .......................................................................................................... 69
Alternatives to Increase Enrollment at Quabbin Regional Middle/High School ..................................... 71
Enrollment Implications ...................................................................................................................... 71
Alternatives to Consolidate Elementary School Students ...................................................................... 81
Single-Elementary School Alternatives ............................................................................................... 83
Multi-Elementary School Alternatives ................................................................................................ 95
Alternatives Found to be Infeasible ...................................................................................................... 108
Next Steps ............................................................................................................................................. 108
Appendices ................................................................................................................................................ 109

Appendix A: Studies of School Quality and Conditions ........................................................................ 111
Appendix B: Summary of Values and Recommendations ..................................................................... 115
Appendix C Paraprofessional Staffing SY2017 ...................................................................................... 121
Appendix D Teacher Stipends ............................................................................................................... 122
Appendix E Sample Nepotism Policies .................................................................................................. 125
Appendix F Cost Savings Calculations for Space Alternatives ............................................................... 127
Cost Saving Alternatives for the Quabbin Regional School District Page 1 Edward J. Collins, Jr. Center for Public Management
1
EXECUTIVE SUMMARY
The Edward J. Collins, Jr. Center for Public Management at the University of Massachusetts Boston was hired by the Quabbin Regional School District (QRSD or District) and the five member towns of Barre, Hardwick, Hubbardston, New Braintree, and Oakham to identify and analyze alternatives to reduce District costs. This effort is being funded by a Community Compact grant from the Baker-Polito administration. The project included three separate deliverables including the Community and Schools Trends Report, the three Community Conversations held in October and November 2016, and this Cost Saving Alternatives report. The overarching task initially defined for the Center was “to identify and analyze alternatives to reduce costs for the district” based upon the preliminary understanding that the resources available from state and local sources were not sufficient to fund the continuation of regular year over year cost increases and that multi-year declines in student enrollment called into question whether District facilities could/should be consolidated. Since then it has become evident that per pupil spending at QRSD is already below state average, indicating that a strategy of continued cuts will not be viable over the long term. Further, the recent declines in test scores and the rapid increases in the number and percentage of students with disabilities suggest that students are not receiving needed supports that will allow them to thrive within District classrooms. In recognition that simply reducing costs will not successfully address the breadth issues facing QRSD, the project team came to the understanding that its responsibility was to develop ideas on how the District can best increase its financial stability – as opposed to simply reducing costs. To that end, this report includes a series of “best practices” actions that the Center would recommend the District undertake to strengthen its financial stability and improve student achievement whether enrollment was increasing or decreasing. These include 11 best practice recommendations that will improve student achievement, increase trust and information sharing, and control some of the cost drivers affecting the District’s budget. In addition, the report offers eleven interrelated Space Use Alternatives that consider changes to the grade configurations at the District’s elementary, middle, and high schools, up to and including school closings, in an effort to improve academic attainment while also reducing costs by between as much as $1.5 million in two of the alternatives. All recommendations and alternatives presented in this report are evaluated through four lenses identified by the Center – financial, operational, academic, and community values/sense of community.

Cost Saving Alternatives for the Quabbin Regional School District Page 2 Edward J. Collins, Jr. Center for Public Management
2
THIS PAGE IS INTENTIONALLY BLANK

Cost Saving Alternatives for the Quabbin Regional School District Page 3 Edward J. Collins, Jr. Center for Public Management
3
SUMMARY OF COSTS/SAVINGS OF BEST PRACTICE RECOMMENDATIONS Quabbin Regional School District
Page Recommendation Time
Frame Cost
Increase Cost
Reduction
Recommendation 1: Reduce special education enrollment and costs by enhancing regular education programming, special education data collection and controls, and reducing out-of-district placements.
Begin spring 2017
Intent to slow the
rapid growth in costs in the short
term, with a long term
goal of actual cost
reductions
1a. Ensure that the team chairpersons are well-trained, accountable, and the only people involved in team meetings with the authority to commit District dollars (at least for initial team meetings).
Ongoing None
1b. Review current and historic out-of-district placement data to determine how the District might encourage the creation of better located collaborative programs, partner with private providers, and/or offer additional special education programs in house, as appropriate.
Summer 2017
None
1c. Staff every kindergarten and first grade classroom with a paraprofessional, thereby reducing or eliminating the need for including one-to-one paraprofessionals in IEPs.
Begin fall 2017
To be funded by
redeploying existing
staff
1d. Ensure that appropriate Response to Intervention (RtI) Tier 2 and 3 strategies and staffing are available in all schools and grade spans to ensure necessary regular education interventions and reduce/control the number of IEPs.
Begin fall 2017
TBD
1e. Locate district-wide special education programs at central locations and in schools that offer at least three (3) classes per grade level. In addition, relocate the pre-kindergarten program to a centrally located facility that will be accessible to more children and families.
Fall 2018 Nominal cost to outfit
classrooms
1f. Enhance data collection around special education to ensure that creation of programming and other targeted interventions will reduce costs and improve services to students.
Summer 2017
None
1g. Focus professional learning spending on strategies for inclusion and meeting the needs of all students in the regular education classroom, enhancing child study teams, and other topics designed to enable classroom teachers to better meet the needs of students, with a focus on district and building goals and priorities
Fall 2017 and
ongoing
None
Recommendation 2: Increase enrollment in the high school by increasing offerings and incenting students/parents to choose the regional public school for their secondary education.
Spring 2017
None
Intent to increase
revenues by growing
enrollment
2a. Consider partnering with a local vocational school to provide programming not currently available at those schools, while also considering doing so without a partner,
Ongoing TBD, but grant funds
available
2b. Actively strive to retain 7-8th graders within the District as Spring None

Cost Saving Alternatives for the Quabbin Regional School District Page 4 Edward J. Collins, Jr. Center for Public Management
4
SUMMARY OF COSTS/SAVINGS OF BEST PRACTICE RECOMMENDATIONS Quabbin Regional School District
Page Recommendation Time
Frame Cost
Increase Cost
Reduction
they move to high school. 2017
Recommendation 3: Conduct an outside review of the costs and benefits of the International Baccalaureate program.
Fall 2017 Est. $20,000 one time
None
Recommendation 4: Enhance the District’s nepotism policy to eliminate the perception of preferential hiring for relatives of central office administrators and school committee members.
Fall 2017 None None
Recommendation 5: Place accountability for performance with the adults, not with students. For example, adopt language designed to ensure that the needs of low income and special education students are not “blamed” for District budget concerns.
Begin Fall 2017
None None
Recommendation 6: Increase transparency in the process of developing the annual budget.
Begin spring 2017
Minor staff time
impacts
Staff time saved by having budget
approved by July 1
6a. Establish a regional budget advisory board to serve as the member towns’ single point of contact with the District around finances.
6b. Distribute supplemental summary data on all spending from revolving funds such as school choice, circuit breaker, and grant funds to the budget advisory board and the general public.
Recommendation 7: Control/moderate fiscal impact of future teachers’ cost of living and annual step increases on the budget.
Spring 2017
None anticipated
Est. $181,000/yr by year 3 of
contract
7a. Given the fiscal outlook of the District, the School Committee should exercise more fiscal discipline when negotiating future teachers’ contracts.
7b. Appoint a municipal representative to the District’s collective bargaining process.
7c. Review administrative salaries to ensure that they are within area medians.
7d. Review stipends in teachers’ contract to make sure that they are still necessary, that the stipend amount is consistent with the hours needed to undertake the responsibilities, and that the stipend should be continued.
Recommendation 8: Continue to engage in discussions with surrounding communities around joining the district, negotiating a tuition agreement to accept a community’s pupils in particular grades or otherwise sharing services.
Ongoing
None anticipated
Potential revenue if
communities added and potential
savings from shared
services
8a. Advocate for the creation of a western Worcester County Education Task Force to consider enrollment challenges across the area and discuss the potential for increased regionalization in education.
Fall 2017
8b. Continue to participate in the Massachusetts Small and Rural School Districts Coalition.
Ongoing
Recommendation 9: Improve communication with students Ongoing Minor None

Cost Saving Alternatives for the Quabbin Regional School District Page 5 Edward J. Collins, Jr. Center for Public Management
5
SUMMARY OF COSTS/SAVINGS OF BEST PRACTICE RECOMMENDATIONS Quabbin Regional School District
Page Recommendation Time
Frame Cost
Increase Cost
Reduction
and parents, and increase their sense of commitment to QRSD.
anticipated
9a. Create and distribute an electronic survey to middle/high school students and electronic/paper surveys to parents to identify areas of concern and gather positive feedback on accomplishments.
Winter 2017-18
Minor staff time and software
9b. Send a regular newsletter to parents keeping them informed about District activities and progress.
9c. Allow students to have a greater say at School Committee meetings, beyond the minimum required by state law.
Fall 2017 None anticipated
Recommendation 10: Engage in a multi-town visioning and planning process to develop an action plan to improve economic development and increase the number of families living in the area.
Spring 2018
Potential costs for outside
facilitation, could be
funded by grant
None, intent is to increase local tax base and revenues
10a. Present the findings of the Community and School Trends Report at a series of community meetings and work with participants to develop a vision for the future of the area.
10b. Establish a planning group to review the land use plans and policies of the member towns, and analyze how they align with the community vision and support potential future economic development.
Recommendation 11: Amend the regional agreement to provide the School Committee and District administrators with authority to respond to changing enrollment and financial conditions.
Fall 2017 None
anticipated
TBD, but will allow School Committee to respond
more quickly to
enrollment changes
11a. Modify the regional agreement to provide the School Committee with the authority to close a school with a 2/3 majority vote after a series of prescribed public hearings.
11b. Amend the way capital costs are allocated among member towns.
11c. Amend the way in which students are assigned to elementary schools.

Cost Saving Alternatives for the Quabbin Regional School District Page 6 Edward J. Collins, Jr. Center for Public Management
6
SUMMARY OF SCHOOL CONFIGURATION ALTERNATIVES Quabbin Regional School District
Page Alternative Year 1
Savings Long Term Saving/Yr
MIDDLE/HIGH SCHOOL ALTERNATIVES
Alternative A: Relocate 6th graders to the middle school. $59,931 $110,706
Alternative B: Relocate 5
th and 6
th graders to the middle school. $74,648 $161,484
Alternative C: Create a “comprehensive” high school that includes academic and vocational programming.
TBD TBD
ELEMENTARY SCHOOL ALTERNATIVES
Single Building Alternatives (require Alt A above)
Alternative A1: Close Ruggles Lane (Barre) Elementary School. $606,679 $816,874
Alternative A2: Close Hardwick Elementary School. $560,681 $742,619
Alternative A3: Close Hubbardston Center Elementary School. $426,460 $585,490
Alternative A4: Close New Braintree Elementary School. $251,841 $318,417
Alternative A5: Close Oakham Center Elementary School. $453,119 $601,672
Multi-Building Alternatives (require either Alt A or Alt B above)
Alternative A6: Close Hardwick and New Braintree elementary schools. $752,528 $950,330
Alternative A7: Close the Hubbardston and New Braintree elementary schools.
$618,369 $793,200
Alternative A8: Close the New Braintree and Oakham elementary schools.
$690,246 $869,310
Alternative A9: Close Hardwick, New Braintree, and Oakham elementary schools.
$1,236,146 $1,561,152
Alternative B10: Close the Hardwick, Hubbardston, and New Braintree elementary schools.
$1,042,339 $1,355,735
Alternative B11: Close Hardwick, New Braintree, and Oakham elementary schools.
$1,160,430 $1,492,074
Cost Saving Alternatives for the Quabbin Regional School District Page 7 Edward J. Collins, Jr. Center for Public Management
7
CHALLENGES FACING THE QUABBIN REGIONAL SCHOOL DISTRICT
HISTORIC CHALLENGES Historically a center of agricultural activity in Massachusetts, the QRSD study area became an attractive location for families leaving urban centers and pursuing more suburban or rural lifestyles in the post-WWII era. This resulted in significant housing construction and population growth between 1940 (7,566 residents) and 2010 (15,671 residents). In response to this population growth, the regional school district was formed in 1965 to construct and operate a single middle/high school for the towns of Barre, Hardwick, Hubbardston, and Oakham. In 1985, New Braintree was added and the District was charged with operating the elementary schools in the area in addition to the middle/high school. As the student body grew, new schools were built in Hardwick (1992) and New Braintree (1997), and major renovations/additions were made at the other schools including Ruggles Lane (Barre) (1988), Hubbardston (1990), Oakham (1990), and the Quabbin Regional Middle/High School (1997). However, the 50+ year trajectory of a rapidly growing student population ended in 2005 and a downward trend has taken its place. Significantly, since 2000 the five-town area has experienced a decline in the number of children aged 0-19. Compounding this, more families are choosing to send their children to schools other than those in QRSD, and the number of students living elsewhere who choose to attend QRSD schools has also declined. Projections are that the number of children in the area will continue to decline in the future. This projection can be seen even today as there are fewer young children (0-5) in the area than there are older children and teens. As these 0-5 year olds go to school, they will fill fewer seats than the kindergarteners and first graders do today. Despite this, the cost of education has continued to rise, placing an increasingly large burden on town resources as state assistance to the school district – which is based upon enrollment – has stayed flat or declined. Potential exists for the QRSD to enter what has been called a “death spiral” where cuts in funding for student supports and teachers which are required in light of constrained resources, then compel parents to choose other schools for their children (thereby reducing revenues further) or to request special accommodations for their children in the form of individualized educational programs (IEPs) (thereby increasing costs). This then starts another cycle of cuts, followed by more departures and more students on IEPs. Specific trends that have affected the District and its member towns over time include: o A shift to an older residential population, with an absolute decline in the number of school-age
residents since 2000. o Declining enrollment in QRSD schools, due to population declines and increasing numbers of parents
sending their children to charter or vocational schools. The drop-off between middle and high school is particularly dramatic.
o Projections that show the student population will continue to decline in the future, and which can be seen coming into fruition today.

Cost Saving Alternatives for the Quabbin Regional School District Page 8 Edward J. Collins, Jr. Center for Public Management
8
o Continued budget increases despite cost-cutting measures taken by the District, at the same time that State support, which is tied to enrollment, has declined. Teaching and student-support positions have been reduced in recent years.
o Increases in town contributions of $3.7 million (+31.8%) over nine years from FY2008-FY2017). o Limited tax base and low per-capita income levels in member towns placing constraints on towns’
capacity to cover funding gaps. o Ongoing impacts of the Great Recession on home values which have not returned to their pre-2007
prices. o Fewer business establishments and employment opportunities in the area since the Great
Recession. On the bright side, housing in the member towns is markedly more affordable than other parts of the state and is generally of high quality, and the communities’ location near employment centers across Worcester County make it a desirable location for households seeking a quiet suburban lifestyle. As such, the health and vitality of the five-town area is not just tied to local policy decisions and planning efforts, the economies of cities such as Worcester, Leominster, and Fitchburg, among others, can have a marked impact on the QRSD area. The Community and School Trends Report for the Quabbin Regional School District prepared by the Collins Center describes the trends affecting the area in detail and can be found on the QRSD website.

Cost Saving Alternatives for the Quabbin Regional School District Page 9 Edward J. Collins, Jr. Center for Public Management
9
Cost Saving Alternatives for the Quabbin Regional School District Page 10 Edward J. Collins, Jr. Center for Public Management
10
CURRENT CHALLENGES
Population Change
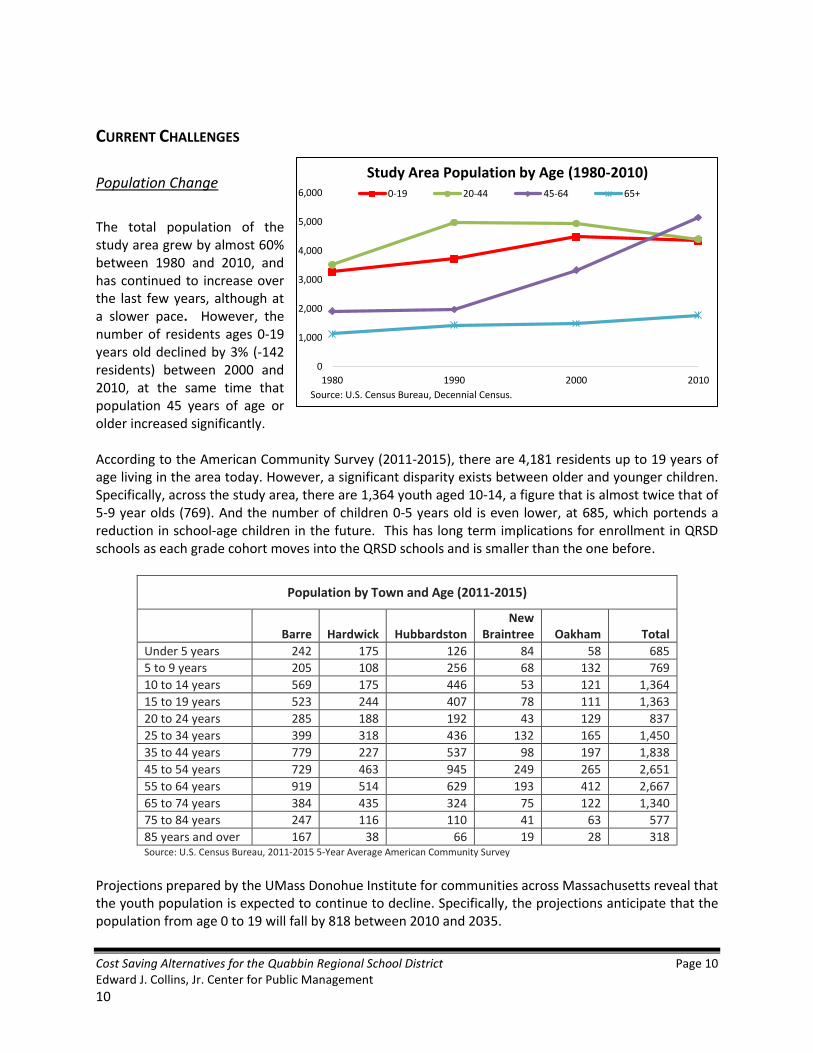
The total population of the study area grew by almost 60% between 1980 and 2010, and has continued to increase over the last few years, although at a slower pace. However, the number of residents ages 0-19 years old declined by 3% (-142 residents) between 2000 and 2010, at the same time that population 45 years of age or older increased significantly. According to the American Community Survey (2011-2015), there are 4,181 residents up to 19 years of age living in the area today. However, a significant disparity exists between older and younger children. Specifically, across the study area, there are 1,364 youth aged 10-14, a figure that is almost twice that of 5-9 year olds (769). And the number of children 0-5 years old is even lower, at 685, which portends a reduction in school-age children in the future. This has long term implications for enrollment in QRSD schools as each grade cohort moves into the QRSD schools and is smaller than the one before.
Population by Town and Age (2011-2015)
Barre Hardwick Hubbardston New
Braintree Oakham Total
Under 5 years 242 175 126 84 58 685
5 to 9 years 205 108 256 68 132 769
10 to 14 years 569 175 446 53 121 1,364
15 to 19 years 523 244 407 78 111 1,363
20 to 24 years 285 188 192 43 129 837
25 to 34 years 399 318 436 132 165 1,450
35 to 44 years 779 227 537 98 197 1,838
45 to 54 years 729 463 945 249 265 2,651
55 to 64 years 919 514 629 193 412 2,667
65 to 74 years 384 435 324 75 122 1,340
75 to 84 years 247 116 110 41 63 577
85 years and over 167 38 66 19 28 318 Source: U.S. Census Bureau, 2011-2015 5-Year Average American Community Survey
Projections prepared by the UMass Donohue Institute for communities across Massachusetts reveal that the youth population is expected to continue to decline. Specifically, the projections anticipate that the population from age 0 to 19 will fall by 818 between 2010 and 2035.
0
1,000
2,000
3,000
4,000
5,000
6,000
1980 1990 2000 2010
0-19 20-44 45-64 65+
Source: U.S. Census Bureau, Decennial Census.
Study Area Population by Age (1980-2010)

Cost Saving Alternatives for the Quabbin Regional School District Page 11 Edward J. Collins, Jr. Center for Public Management
11
Population Projections for Study Area and State by Age (2010 and 2035)
Study Area Massachusetts
Age Census 2010
Projection 2035
Change 2010-2035
Percent Change
Census 2010
Projection 2035
Change 2010-2035
Percent Change
0-19 4,342 3,524 -818 -19% 1,621,143 1,564,122 -57,021 -4%
20-44 4,396 5,175 779 18% 2,207,958 2,243,003 35,045 5%
45-64 5,153 4,504 -649 -13% 1,815,804 1,832,427 16,623 1%
65+ 1,780 5,199 3,419 192% 902,724 1,679,917 777,193 86%
Total 15,671 18,402 2,731 17% 6,547,629 7,319,469 771,840 12% Source: UMass Donohue Institute, Population Projections for Massachusetts Municipalities
Enrollment Change
Enrollment in QRSD schools has recently declined by nearly 32%, from a peak of 3,286 students districtwide in 2005,1 to 2,248 in the current 2016-2017 school year. (The 2,248 figure represents the total students in District school facilities. An additional 46 special education students attend school at out of district facilities as their needs cannot be met at District schools at present.) The largest decline was in the number of high school students, which grew by 70% (+432 students) from 1994 to 2005 (when it reached a peak of 1,045 students), before dropping by 34% (-356 students), to a total of 689 students this school-year. The number of elementary students, meanwhile, has been declining since the late 1990s. Students in grades pre-Kindergarten through 6th, the number of which peaked in 1997 at 1,817 students, fell by 37.5% (-682 students) to a total of 1,135 in the current school-year. Projections prepared for the District indicate that the downward trend in enrollment is expected to continue in the future. This study forecasts that student enrollment would fall by 463 between SY2017 and SY2025. At a ratio of 23 students per class, this would translate into 20 fewer classrooms being needed by 2025 – a figure that equals just over 10% of the 192 classrooms in operation today. (It should be noted that the projections expected enrollment in the current school year to be 2,282, but actual enrollment was 2,248 – a difference of 34 students to the negative.)
1 Enrollment is from District reports of school-year enrollment to the Massachusetts Department of Elementary
and Secondary Education (DESE), as of Oct. 1 of the prior calendar year (i.e. SY2017 enrollment recorded as of October 1, 2016).
0
500
1,000
1,500
2,000
2,500
3,000
3,500
19
94
19
95
19
96
19
97
19
98
19
99
20
00
20
01
20
02
20
03
20
04
20
05
20
06
20
07
20
08
20
09
20
10
20
11
20
12
20
13
20
14
20
15
20
16
PK-6 7 & 8 9-12 Total
Source: Massachusetts Department of Elementary and Secondary Education.
QRSD Enrollment by Grade (SY1994-2016)

Cost Saving Alternatives for the Quabbin Regional School District Page 12 Edward J. Collins, Jr. Center for Public Management
12

Cost Saving Alternatives for the Quabbin Regional School District Page 13 Edward J. Collins, Jr. Center for Public Management
13
Enrollment Projections by Grade (SY2016-SY2025)
School Year K-6 7-8 9-12 K-12 PK-12
2015-2016 1,156 429 733 2,318 2,395
2016-2017 1,074 435 708 2,217 2,282
2017-2018 1,060 414 702 2,176 2,241
2018-2019 1,018 392 691 2,101 2,165
2019-2020 1,009 366 677 2,051 2,115
2020-2021 1,003 347 663 2,013 2,079
2021-2022 984 362 622 1,968 2,032
2022-2023 998 333 591 1,922 1,989
2023-2024 1,003 305 582 1,889 1,957
2024-2025 981 341 546 1,868 1,932 Source: Collins Center calculations of projections by New England School Development Council.2
The projected declines in student enrollment stem in part from the fact that fewer children are anticipated to be living in the 5-town area, but also because parents are increasingly choosing other educational options for their children. Specifically, the number of students attending non-district schools rose from 324 to 402 (+78) between SY2000 and SY2016, while the total number of students in-district fell by nearly 800. Details can be found in the table below, but it should be noted that DESE only began to separately tabulate charter and home-school enrollment after 2010.
Numbers of School-Attending Residents in Study Area (SY2000-SY2016)
2000 2005 2010 2016
Change 2000-2016
% Change
Total School-Attending Residents 3,108 3,251 2,872 2,394 -714 -23%
In District Public School 2,784 2,896 2,498 1,992 -792 -28%
All Non-District 324 355 374 402 78 24%
Voc/Tech Regional Schools 93 94 115 152 59 63%
Collaboratives 1 16 9 16 15 1500%
Private and Parochial Schools 80 187 173 68 -12 -15%
Charter Schools n/a n/a n/a 27 n/a n/a
Out-of-District Public Schools 150 58 77 65 -85 -57%
Home Schooled n/a n/a n/a 74 n/a n/a Source: Massachusetts Department of Elementary and Secondary Education.
The trend in increasing numbers of students seeking to attend vocational/technical schools is not unique to QRSD. In fact, across Massachusetts, the number of applicants to vocational schools exceeds the number of seats available. In response, the Baker-Polito administration has placed a priority on identifying strategies to increase the number of available seats in vocational, technical, and agricultural programs. In support of this policy, the State has already funded two rounds of competitive grants to
2 New England School Development Council grade-specific projections of yearly rates of change in QRSD resident-
only enrollment, as calculated in May 2015, applied to actual student enrollment (resident and non-resident) from SY2016.

Cost Saving Alternatives for the Quabbin Regional School District Page 14 Edward J. Collins, Jr. Center for Public Management
14
incent schools to find creative means of increasing the number of seats to better match student needs. The District has also growing percentage of students with individual learning challenges. The percent of students with disabilities has increased almost in a straight line from 2004 when the District as at 9.8% to 20.3% in 2017 (growing from 316 students in 2004 to 466 in 2017). SY2013 was the first year where the percentage of students with special needs exceeded the state average. The District experienced a particularly steep upturn between 2014 and 2017 when the percentages grew from 17.4% (439 students) to 20.3 (466 students). Over the past 20+ years, the percentage across the state has remained nearly unchanged, growing from 17.0% in 1994 to 17.4% in 2017. District reports show there are 468 special education students being supported in SY2017 (2 more than the DESE report), including 45 students between the age of 6 and 21 who attend non-District schools (18 in other public schools, 22 in private schools, and 5 in residential schools). One 3-5 year old also receives an out-of-district placement. The number out of district appears to be higher for upper grades (31 students in grades 6-12 and 5 who receive special education services beyond the 12th grade), as compared to 9 students in grades K-5.) Among the 431 special education students that are ages 6-213, most (335 students) receive special instruction or services less than 21% of their time, with the rest of their time spent in full inclusion with regular education classes and activities. Another 16 students receive partial (21-60% time) special instruction, and 35 have substantially separate (over 60% of the time) instruction. Over ½ of the students in substantially separate classrooms are in the 6th through 9th grades (19 students).
QRSD Special Education Student Share by School (SY2011-SY2015)
2011 2012 2013 2014 2015 2016
State 16% 16% 17% 17% 17% 17.0%
District-wide Total 15% 14% 18% 16% 18% 17.1%
Ruggles Lane (Barre) 19% 19% 23% 19% 22% 20%
Hardwick Elementary 10% 9% 15% 15% 21% 18%
Hubbardston Center 16% 13% 15% 14% 20% 17%
New Braintree Grade4 31% 30% 35% 29% 33% 29%
3 Metrics for inclusion are different for special education students in pre-school (i.e. ages 3-5), and are not directly
comparable to those used for older special education students. 4 Note that New Braintree currently houses the district-wide Pre-K program. Therefore, the special education
0.0
5.0
10.0
15.0
20.0
25.0
19
94
19
95
19
96
19
97
19
98
19
99
20
00
20
01
20
02
20
03
20
04
20
05
20
06
20
07
20
08
20
09
20
10
20
11
20
12
20
13
20
14
20
15
20
16
20
17
% of Students with Disabilities (SY1994-2017)
QRSD State

Cost Saving Alternatives for the Quabbin Regional School District Page 15 Edward J. Collins, Jr. Center for Public Management
15
QRSD Special Education Student Share by School (SY2011-SY2015)
2011 2012 2013 2014 2015 2016
Oakham Center 24% 21% 25% 22% 25% 18%
Middle School 12% 15% 21% 16% 16% 17%
High School 11% 10% 12% 13% 15% 15% Source: Massachusetts Department of Elementary and Secondary Education.
The range of issues being treated include physical/sensory impairments (18 students), emotional (41), chronic health challenges (59), developmental delays (42), autism (42), and specific learning disabilities (128).
Academic Performance
Coupled with its enrollment and budgetary challenges, QRSD has also recently experienced declines in academic performance, as demonstrated by results on the state-wide MCAS exams and a falling graduation rate. Between 2013 and 2015, the share of QRSD students who scored at least ‘proficient’ on the MCAS declined from 72% to 69% in English Language Arts, from 61% to 59% in Math, and from 57% to 53% in Science and Technology. These shares are at or below state-wide averages in each subject.
In the Massachusetts Department of Elementary and Secondary Education accountability rating system, all QRSD schools5 are rated as Level 2 on a scale of 1-5 (1=strongest performing schools). Level 1 ratings were granted in the recent past, however, to Quabbin Middle School (2012), Quabbin High School (2013), Hubbardston Center (2013), and Oakham
numbers for this school may be artificially inflated by the fact that many of these students are eligible for special education services. 5 Except for New Braintree, which is not rated due to students being too young to take the MCAS.
74%
76%
78%
80%
82%
84%
86%
88%
90%
2006 2007 2008 2009 2010 2011 2012 2013 2014 2015
QRSD MassachusettsLinear (QRSD) Linear (Massachusetts)
Source: Massachusetts Department of Elementary and Secondary Education.
Graduation Rates (2006-2015)
40%
45%
50%
55%
60%
65%
70%
75%2
008
20
09
20
10
20
11
20
12
20
13
20
14
20
15
20
08
20
09
20
10
20
11
20
12
20
13
20
14
20
15
20
10
20
11
20
12
20
13
20
14
20
15
English Language Arts Mathematics Science
QRSD Massachusetts
Source: Massachusetts Department of Elementary and Secondary Education.
Share of Students Scoring Proficient+ on MCAS (2008-2015)

Cost Saving Alternatives for the Quabbin Regional School District Page 16 Edward J. Collins, Jr. Center for Public Management
16
Center (2014). Both the high school and middle school have also declined in their position relative to comparable schools in the state, from rankings in the top 40% in 2012 to the bottom half in 2016. Over the past 10 years, Massachusetts high school graduation rates have steadily increased from 80% to 87%. During this time period, graduation rates at QRSD have shown some volatility, with dips in 2009, 2014, and 2015. Although the overall trend line has been moving in a positive direction, most recent data place the District at below State average.
Per Pupil Spending
DESE provides detailed and summary data on school spending, and tabulates spending per pupil for students that are “in-district”, (i.e., attending district schools), and that are “out-of-district”, (i.e., are residents of the community but attend a school outside the district at a cost borne by the district). DESE also provides data on spending for all students which includes in-district and out-of-district students combined. At the time of writing, DESE financial data was only available through FY2015 (July 2014 through June 2015). The amount spent by QRSD per pupil has risen sharply over the last decade+, growing from $8,832 per pupil in 2005 to $13,957 in 2015 as fixed costs for the District are apportioned over shrinking enrollments. Over this time period, the District has remained below state average in spending but has become increasingly close to the state. That said, despite this growth, the District still spends approximately $1,000 less per student than the state average of $14,936 in 2015.
For in-district students, over the past three fiscal years QRSD spending has increased by approximately $1,000 per student, growing from $12,380 per pupil in 2013 to $13,330 in 2015. This represents an increase of between 3.4% and 6.6% each year during this period. At the same time, the number of in-district students has fallen from 2,559 to 2,445 (-114 students). However, despite this growth, spending per-pupil in-district has
$8,832
$13,957
$10,626
$14,936
$8,000
$9,000
$10,000
$11,000
$12,000
$13,000
$14,000
$15,000
$16,000
2005 2006 2007 2008 2009 2010 2011 2012 2013 2014 2015
QRSD
Massachusetts
Source: Massachusetts Department of Elementary and Secondary Education.
Per-Pupil Spending (2005-2015)
$5,000
$10,000
$15,000
$20,000
$25,000
$30,000
$35,000
$40,000
0 1,000 2,000 3,000 4,000
FTE Pupils In-district
Spending Per Pupil In-District (2015)
Source: Massachusetts Department of Elementary & Secondary Education
Cost Saving Alternatives for the Quabbin Regional School District Page 17 Edward J. Collins, Jr. Center for Public Management
17
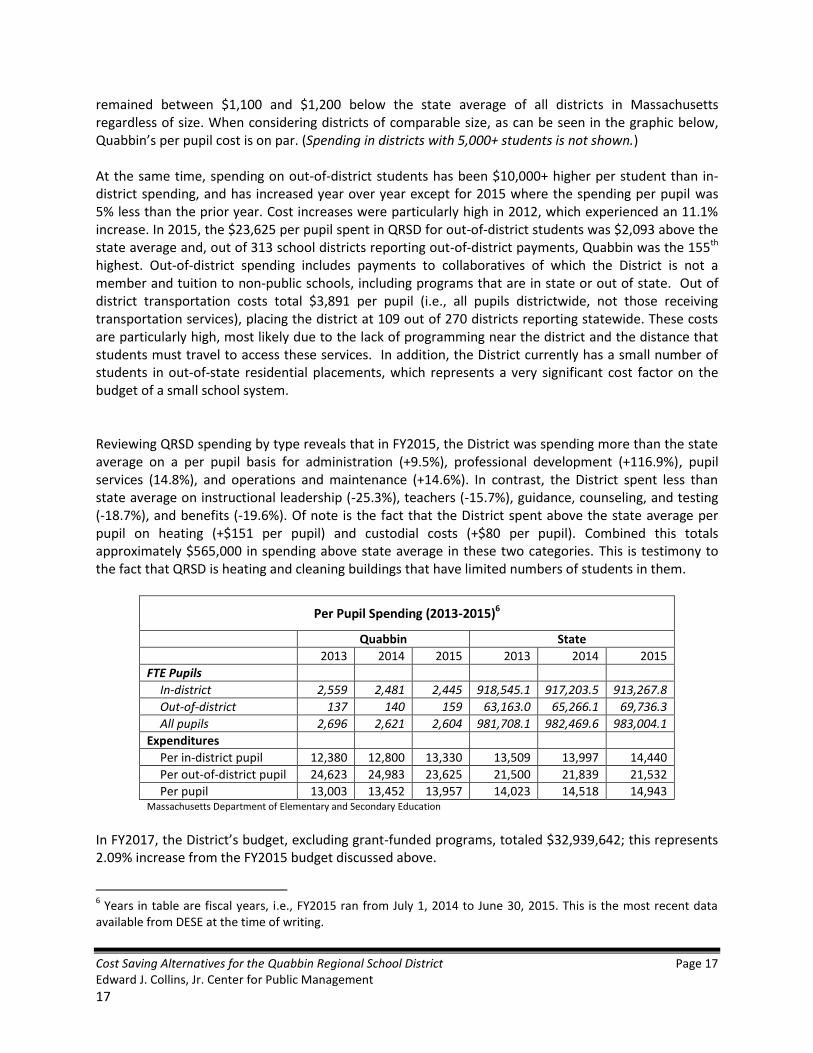
remained between $1,100 and $1,200 below the state average of all districts in Massachusetts regardless of size. When considering districts of comparable size, as can be seen in the graphic below, Quabbin’s per pupil cost is on par. (Spending in districts with 5,000+ students is not shown.) At the same time, spending on out-of-district students has been $10,000+ higher per student than in-district spending, and has increased year over year except for 2015 where the spending per pupil was 5% less than the prior year. Cost increases were particularly high in 2012, which experienced an 11.1% increase. In 2015, the $23,625 per pupil spent in QRSD for out-of-district students was $2,093 above the state average and, out of 313 school districts reporting out-of-district payments, Quabbin was the 155th highest. Out-of-district spending includes payments to collaboratives of which the District is not a member and tuition to non-public schools, including programs that are in state or out of state. Out of district transportation costs total $3,891 per pupil (i.e., all pupils districtwide, not those receiving transportation services), placing the district at 109 out of 270 districts reporting statewide. These costs are particularly high, most likely due to the lack of programming near the district and the distance that students must travel to access these services. In addition, the District currently has a small number of students in out-of-state residential placements, which represents a very significant cost factor on the budget of a small school system. Reviewing QRSD spending by type reveals that in FY2015, the District was spending more than the state average on a per pupil basis for administration (+9.5%), professional development (+116.9%), pupil services (14.8%), and operations and maintenance (+14.6%). In contrast, the District spent less than state average on instructional leadership (-25.3%), teachers (-15.7%), guidance, counseling, and testing (-18.7%), and benefits (-19.6%). Of note is the fact that the District spent above the state average per pupil on heating (+$151 per pupil) and custodial costs (+$80 per pupil). Combined this totals approximately $565,000 in spending above state average in these two categories. This is testimony to the fact that QRSD is heating and cleaning buildings that have limited numbers of students in them.
Per Pupil Spending (2013-2015)6
Quabbin State
2013 2014 2015 2013 2014 2015
FTE Pupils
In-district 2,559 2,481 2,445 918,545.1 917,203.5 913,267.8
Out-of-district 137 140 159 63,163.0 65,266.1 69,736.3
All pupils 2,696 2,621 2,604 981,708.1 982,469.6 983,004.1
Expenditures
Per in-district pupil 12,380 12,800 13,330 13,509 13,997 14,440
Per out-of-district pupil 24,623 24,983 23,625 21,500 21,839 21,532
Per pupil 13,003 13,452 13,957 14,023 14,518 14,943 Massachusetts Department of Elementary and Secondary Education
In FY2017, the District’s budget, excluding grant-funded programs, totaled $32,939,642; this represents 2.09% increase from the FY2015 budget discussed above.
6 Years in table are fiscal years, i.e., FY2015 ran from July 1, 2014 to June 30, 2015. This is the most recent data
available from DESE at the time of writing.

Cost Saving Alternatives for the Quabbin Regional School District Page 18 Edward J. Collins, Jr. Center for Public Management
18
Recent Budget Reductions
Since FY2015, the District has made a number of budget reductions to maintain a balanced budget and mitigate some of the financial impacts on the five towns. Over the two year period, a total of 28 FTE have been cut from the budget including teaching positions at the elementary, middle, and high school level and student support positions such as a school psychologist, school nurse, several paraprofessionals, and two intervention teachers among others. In addition, facility maintenance and capital budgets, and the information technology budget have been reduced significantly. Budget reductions are identified below.
QRSD Budget Reductions (FY2016-FY2017)
FY2016 Reductions / Increased Revenues FY2017 Reductions / Increased Revenues
Reduce six elementary school teachers (-$392,819)
Reduce specialist teacher/add 1/2 SPED (-$24,591)
Reduce 1.5 FTE support staff (-48,771)
Add PT HS math teacher, paraprofessional hours ,
misc. (+$64,615)
Reduce discretionary spending (-$209,309)
Reduce Nature's Classroom Stipends (-$8,100)
Reduce info technology (-$168,688)
Reduce facility maintenance (-$66,075)
Reduce capital spending (-$966,357)
Reduce two elementary teachers ($63,977) (one
funded by school choice funds)
Reduce elementary art, music, PE & media
positions (9.5 fte) (-$718,746)
Reduce elementary PE teacher (-$62,997)
Reduce kindergarten teacher (-$62,977)
Reduce 0.8 paraprofessional (kindergarten) (-
$16,076)
Reduce elementary substitutes (-$45,000)
Reduce MHS world language teacher (-$63,311)
Reduce HS science teacher (-$62,977)
Reduce HS math teacher (-$78,971)
Reduce HS English teacher (-$51,923)
Reduce HS social studies teacher (-$53,482)
Reduce 2 intervention tutors (-$63,972)
Reduce school nurse (-$62,977)
Reduce school psychologist (-$88,614)
Reduce 2.5 paraprofessionals (special ed) (-
$61,845)
Reduce junior executive assistant (-$43,285)
Reduce copy center tech (-$30,978)
Transfer athletic programs to revolving (-$50,000)
Transfer custodian to revolving account (-$39,062)
Reduce MS IB program (-$13,320)
Reduce special education (-$87,334)
Reduce multiple stipends (-$26,167)
Reduce facilities maintenance (-$415,441)
Reduce discretionary spending (-$107,004)
Reduce info technology (-$276,041)
Reduce copier lease (-$25,282)
Increase unemployment (est.) ($86,400)

Cost Saving Alternatives for the Quabbin Regional School District Page 19 Edward J. Collins, Jr. Center for Public Management
19
QRSD Budget Reductions (FY2016-FY2017)
FY2016 Reductions / Increased Revenues FY2017 Reductions / Increased Revenues
Reduce health insurance (-$67,663)
Reduce Medicare expense (-$35,322) TOTAL REDUCTIONS =$2,745,950 and 27.8 FTE
Anecdotal evidence suggests that reducing student supports, such as reading specialists, intervention specialists, etc. can actually result in cost increases as more parents feel compelled to pursue IEPs – a legally binding document - for their children to receive support that they would have received previously from the specialists provided by the District.
Spending per Pupil per School
Over the past three fiscal years, an increasing portion of the QRSD budget is being taken up by: a) districtwide expenses; b) school choice and charter school tuition; and, c) benefits, capital spending, and miscellaneous expenses, leaving less funding available at each school site. Districtwide expenses include contractual services for special education, special education transportation, collaboratives, and tuition to out-of-state schools, Massachusetts schools and non-public schools for students whose needs cannot be met within the District. School choice and charter funding are funds that are sent elsewhere for regular education students who elect to attend non-district schools. Districtwide expenses have increased by $987,508 over the past three fiscal years from 11.5% of the budget in FY2015 to 14.2% in FY2017. School choice and charter expenses have increased by $287,254, and from 2.7% to 3.5% of the budget, and benefits and capital spending have increased by $1,041,909 over this same time period, from 16.5% to 19.4% of the budget. The impact at the school level has been that total school site funding has fallen from $20.84 million in FY2015 to $19.14 million in FY2017 (-$1.7 million), or from 64.6% to 58.1% of total budget. Non-school site spending has increased from $11.42 million to $13.80 million (+$2.38 million), or from 35.4% to 41.9% of the total budget over the same time period. District records indicate that per pupil spending is greatest at the Hardwick, New Braintree, and Oakham elementary schools – the two smallest schools in QRSD. (Pre-kindergarten students at New Braintree were counted as 0.5 in the table below since they attend a half-day program.) In contrast, per pupil spending at Ruggles Lane and Hubbardston Central schools is markedly lower.

Cost Saving Alternatives for the Quabbin Regional School District Page 20 Edward J. Collins, Jr. Center for Public Management
20
Change in Budget by School (FY2015-FY2017) ($)
FY2015 Actual
FY2016 Actual
FY2017 Budget
Enrollment (2017)
$ per pupil (FY2017)
Ruggles Lane Elementary (Barre) 2,981,512 2,830,911 2,730,129 424 6,439
Hardwick Elementary 1,971,772 1,899,429 1,877,239 194 9,676
Hubbardston Elementary 2,510,696 2,325,051 2,086,208 316 6,602
New Braintree Grade 1,014,646 1,033,591 902,556 75.57 11,954
Oakham Center Elementary 1,592,282 1,588,438 1,551,336 149 10,412
Quabbin Middle School 3,339,260 3,206,636 3,411,648 424 8,046
Quabbin High School 7,430,476 7,316,969 6,576,138 689 9,544
School Spending Sub-total 20,840,644 20,201,025 19,135,254
% of total budget 64.6% 62.9% 58.1%
Central Office 1,523,511 1,562,664 1,588,076
Districtwide Expenses 3,694,492 3,572,114 4,682,000
School Choice & Charter Tuition 867,954 1,111,395 1,155,208
Benefits, Capital, Misc. 5,337,195 5,662,029 6,379,104
Non-school Spending Subtotal 11,423,152 11,908,202 13,804,388
% of total budget 35.4% 37.1% 41.9%
TOTAL 32,263,796 32,109,227 32,939,642
PERCENT CHANGE -0.5% 2.6%
Special Education Costs
A review of District financial records reveals that special education costs increased by 39% (+$1.67 million) between FY2015 and FY2017. Since the overall budget increase between FY2015 and FY2017 was approximately $675,000, this indicates that special education is taking up an increasingly large share of the District’s budget. More specifically, while special education costs constituted 13.3% of the QRSD budget in FY2015, by FY2017, this had increased to 18.1%. Although increases in spending at school sites did take place – at New Braintree, in particular – the vast majority of increase was for “district-wide” expenses. With the exception of transportation, which includes students in-district and out-of-district these expenses were for out-of-district special education placements. Of note are the increases in contractual services (+$494,506), out-of-state tuition (+$213,305), and non-public school tuition (+$634,554).
7 Pre-Kindergarten students were reduced to 0.5 each because they attend a half-day program.

Cost Saving Alternatives for the Quabbin Regional School District Page 21 Edward J. Collins, Jr. Center for Public Management
21
Special Education Spending (FY2015-FY2017)
Location Expenditure Type FY2015 Actual
FY2016 Actual
FY2017 Budget
$ Change FY15-17
% Change FY15-17
SCHOOL-SPECIFIC
Ruggles Lane (Barre)
Instructional Salaries SPED
252,482 264,919 268,421 15,939 6.3%
Hardwick 93,502 114,585 130,853 37,351 39.9%
Hubbardston 221,291 288,659 188,877 -32,414 -14.6%
New Braintree 36,213 122,062 131,184 94,971 262.3%
Oakham 78,578 103,462 119,472 40,894 52.0%
Middle School 326,890 326,427 346,399 19,509 6.0%
High School 436,035 471,712 421,994 -14,041 -3.2%
SUB-TOTAL 1,444,991 1,691,826 1,607,200 162,209 11.2%
DISTRICT-WIDE
SPED Contracted Services 410,342 485,282 904,848 494,506 120.5%
SPED Transportation 1,115,987 1,098,524 1,171,881 55,894 5.0%
Tuition MA Public Schools 7,631 83,524 58,635 51,004 668.4%
Tuition Out-of-State Schls 89,341 142,434 302,646 213,305 238.8%
Tuition Non-Public Schools 695,803 1,014,244 1,330,357 634,554 91.2%
Tuition Collaboratives 518,730 522,219 579,555 60,825 11.7%
SUB-TOTAL 2,837,834 3,346,227 4,347,922 1,510,088 53.2%
TOTAL 4,282,825 5,038,053 5,955,122 1,672,297 39.0% Source: QRSD
The figures above do not include special education expenditures funded by other sources such as state and federal grants, school choice/tuition revolving funds, and “circuit breaker”, which are unexpended balances from prior years that can be used in future budgets. The FY2017 budget for special education includes $408,500 in federal grants and $192,400 in revolving funds used for in-district staffing and $766,500 in circuit breaker for out-of-district special education placements. This adds $1.37 million to the figures above.
Space Utilization
While QRSD schools are generally in good condition, their square footage and number of classrooms are well above state measures given current and projected enrollment figures. When evaluating projects for potential funding, the Massachusetts School Building Authority (MSBA) uses two space measures to determine the level of funding they will provide. The MSBA measures are used here to evaluate space utilization in QRSD schools as impartial benchmarks; they are not intended to indicate that all facilities much match these benchmarks. (A school district could elect to provide more space than the MSBA will reimburse for, but this additional space would have to be funded locally, as opposed to being funded by the State, or they could make an appeal for a special circumstance.) One measure used by the MSBA is the ratio of gross square feet of building per student, where the

Cost Saving Alternatives for the Quabbin Regional School District Page 22 Edward J. Collins, Jr. Center for Public Management
22
MSBA’s figures vary depending upon the type of school (e.g., elementary, middle, and high school) and the number of students projected to be enrolled. District-wide, the QRSD schools contain more than 71,000 square feet (17%) above the MSBA ratio and all schools are underutilized. The high school and middle school are closest to their measures, while the Oakham and New Braintree elementary schools are 1.72 and 1.43 times the standard. This leaves considerable unused and underused space, which is being used and maintained at a cost to the District and the member communities.
Space Needs by Square Foot per Student
Square
Footage Grades served
10/2016 Enroll-
ment # Class- rooms
Gross SF/student
SF per student (MSBA)
SF needed (MSBA)
SF above standard Diff %
Ruggles Lane (Barre) 72,470 K-6 368 30 172 63,296 9,174 114.5%
Hardwick Elem 44,125 K-6 194 15 180 34,920 9,205 126.4%
Hubbardston Center 64,740 K-6 316 22 179 56,564 8,176 114.5%
New Braintree 27,750 PK-1 108 9 180 19,440 8,310 142.7%
Oakham Center 46,000 2-6 149 21 180 26,820 19,180 171.5%
Middle School 82,957 7-8 424 35 188 79,712 3,245 104.1%
High School 162,893 9-12 689 60 216 148,824 14,069 109.5%
TOTAL 500,935
2,248 192 429,576 71,359 116.6%
By using an average classroom size of 850 to 900 square feet, the 71,000 square feet in above standard space translates into 81 classrooms worth of space – or nearly equal to the Ruggles Lane, Hubbardston Center, New Braintree, and Oakham Center classrooms combined (82 classrooms total). The second MSBA measure - number of students per classroom - calculates that the schools have 94 classrooms above the MSBA measure, i.e., 192 classrooms instead of the 98 classrooms needed for current enrollment. While all schools are underutilized by this measure, the Oakham Center School stands out as particularly underutilized, having more than 3 times the number of classrooms the MSBA measure suggests (21 existing classrooms as compared to the 6.5 needed per the MSBA measure). This is consistent with District reports which indicate that only 8 of 21 classrooms are presently in use.
Space Needs by Students per Classroom
10/2016
Enrollment # Class-rooms
MSBA student per classroom
Classrm needed (MSBA)
Classrms above
standard Diff %
Ruggles Lane (Barre) 368 30 23 16.0 14.0 188%
Hardwick Elem 194 15 23 8.4 6.6 179%
Hubbardston Center 316 22 23 13.7 8.3 161%
New Braintree 108 9 23 4.7 4.3 191%
Oakham Center 149 21 23 6.5 14.5 323%
Middle School 424 35 23 18.4 16.6 190%
High School 689 60 23 30.0 30.0 200%
TOTAL 192 98 94 197%

Cost Saving Alternatives for the Quabbin Regional School District Page 23 Edward J. Collins, Jr. Center for Public Management
23
In terms of the greatest number of classrooms above MSBA measures, the middle/high school has 47 underutilized classrooms, indicating that the facility is approximately twice the size that would be reimbursed by the MSBA based upon the current enrollment.
Class Size per School per Grade
Section IX of the QRSD Regional Agreement states that “…it is intended that, whenever practicable, all pupils will receive their elementary school education in facilities that are located in the member towns in which said pupils reside…”8. It does allow the superintendent to make exceptions if a different school is needed to: a) address IEP requirements; b) respond to a parental request if in the best interest of the student’s interest; or, c) respond to a building administrator’s request to assist in social and emotional development. The superintendent may also relocate entire grades if needed to provide a better educational program, but all grades may not be located out of any individual school. This last provision was used in 2010 when New Braintree and Oakham were configured so that New Braintree houses pre-K through 1st grade and Oakham contains 2nd through 6th graders. A review of the average number of students per classroom and number of classrooms per school per grade reveals that the District’s policy has led to variability among the elementary schools. For example, 1st grade classrooms vary from 12 students per class on average in New Braintree to 19.5 students per class in Hubbardston. In addition, Barre has thee 1st grade classrooms while the other three schools have two classrooms. The smallest average classroom size is 12 students (1st grade at New Braintree and 3nd grade at Hardwick) and the largest is 25 students per class in the 3rd grade in Hubbardston. In addition, although three classrooms per grade in a school offers greater opportunity to provide inclusion for special need students and to offer specials such as art and music efficiently, few of the elementary schools offer three or more classrooms per grade. In fact, only Ruggles Lane has three classrooms per grade for most grades (1-3 and 5-6) and Hubbardston has only two grades with three classrooms (kindergarten and 2nd grade).
Average Students per Classroom and Classrooms per School SY2017
Grade Measure Ruggles Lane
(Barre) Hardwick Hubbardston
New Braintree
Oakham
Kinder-garten
Students/Class 19.5 19.0 15.3 17.0
Classrooms 2 1 3 1
1st
Students/Class 18.0 14.0 19.5 12.0
Classrooms 3 2 2 2
2nd
Students/Class 19.3 12.0 15.0
13.0
Classrooms 3 2 3
2
3rd
Students/Class 19.0 17.0 25.0
24.0
Classrooms 3 2 2
1
4th
Students/Class 21.5 16.0 20.5
13.0
Classrooms 2 2 2
2
8 Quabbin Regional School District Agreement, Section IX Pupils, August 21, 2014, p. 9

Cost Saving Alternatives for the Quabbin Regional School District Page 24 Edward J. Collins, Jr. Center for Public Management
24
Average Students per Classroom and Classrooms per School SY2017
Grade Measure Ruggles Lane
(Barre) Hardwick Hubbardston
New Braintree
Oakham
5th
Students/Class 20.3 14.0 21.0
13.0
Classrooms 3 2 2
2
6th
Students/Class 18.7 14.5 23.5
16.0
Classrooms 3 2 2
2
QRSD targets for students per class per grade are 18-22 students for kindergarten through 2nd grade and 22-25 students for 3rd to 6th grade. However, more than half of the kindergarten through 2nd grade classrooms (15 out of 26 classrooms) have fewer students than the target minimum. For 3rd to 6th grade, an even smaller proportion of classrooms reach the 22-student minimum target. In those grades, only 5 out of 34 classrooms contain at least 22 students on average. (It should be noted that these figures are derived by dividing total students per grade by classrooms. Conceivably one classroom could be within the target range but the other classroom(s) would be markedly smaller.) If QRSD administrators had greater flexibility in assigning students to schools, they could clearly consolidate classrooms even today and reduce costs.

Cost Saving Alternatives for the Quabbin Regional School District Page 25 Edward J. Collins, Jr. Center for Public Management
25
FOUR DIMENSIONS OF REVIEW
As part of the original scope of work, the Collins Center indicated that all alternatives would be reviewed through four lenses. These include:
Financial – How does the potential alternative help improve the District’s financial stability? What costs and savings are associated? Are outside resources potentially available?
Operational – How does the potential alternative impact District operations, e.g., facility maintenance, transportation, administrative oversight, etc.? Are there operational savings involved, including saved time and money?
Academic – How does the potential alternative strengthen the District academically? How will student learning be improved? Will additional supports, services, and course offerings be available to students? Is the alternative consistent with the District’s improvement plan? If not, why not?
Community Values / Sense of Community – How well does the alternative align with identified community values (see below)? How might it impact residents’ sense of community?
In the Alternatives Analysis section below, best practices recommendations and alternatives will be reviewed through four lenses

Cost Saving Alternatives for the Quabbin Regional School District Page 26 Edward J. Collins, Jr. Center for Public Management
26
IDENTIFICATION OF COMMUNITY VALUES
In recognition that community engagement is central to the success of any project intended to ensure long-term financial health and effectiveness of a school district, the Collins Center facilitated three “Community Conversations Regarding the Future of QRSD”. These public activities were intended to enable residents to share their perspectives in four areas: the current state of the district and the partner communities, an envisioned future for the district and communities, values and ideas that could contribute to desired outcomes, and possibilities and concerns that might influence future changes. Data from these community conversations was used to identify a wide range of values and ideas important to residents. The data collection and subsequent analyses are rooted in the principles of decision modeling, or the process of using data to inform decisions regarding short-term activities and long-term strategies that optimize objectives important to various stakeholders.
Data collection
Results from the three Community Conversation meetings were used to identify values, priorities, and ideas that could guide the development of recommendations for QRSD. These conversations were based on the “World Café” model of community engagement (http://www.theworldcafe.com/) in which large numbers of participants are encouraged to share their ideas, concerns, and priorities in multiple small-group settings to maximize the level of comfort and willingness to connect with neighbors and friends in a non-judgmental and flexible environment. Three World Café events were held in the Quabbin district, on Thursday, October 20, Wednesday, October 26, and Saturday, November 5, 2016. The first event was limited to students attending Quabbin Regional Middle/High School. The remaining two were open to all who wished to attend. Open meeting participants included current and former parents of Quabbin students, several QRSD students two of whom also attended the student session, and other interested community members. Each Community Conversation event was about three hours long, and consisted of an overview of the community, the school district and current challenges, followed by breakout conversations at multiple tables of 6 – 8 participants, on themes consisting of ‘present’, ‘future’, ‘values and ideas’ and ‘possibilities and concerns’. After each conversation, participants were encouraged to circulate among tables to keep the conversations fresh. Participants wrote notes on large, tabletop graphics during the course of each of their conversations. At the end of conversations three and four, participants summarized their thoughts in two ‘harvests’ and reported their thoughts out to the entire group. Harvest notes were captured on the tabletop sheets and also on a graphic recording at the front of the room that was created as people spoke. Of primary interest to this effort are the conversations devoted to values and ideas. The questions provided to prompt and guide participant discussions were:
(1) Given the fact that hard decisions will have to be made, what do we Value? How might those values guide us?
(2) What Creative Ideas do we have to strengthen the District financially and help students get a

Cost Saving Alternatives for the Quabbin Regional School District Page 27 Edward J. Collins, Jr. Center for Public Management
27
great education? Participants were encouraged to think broadly, and to focus on positive, forward-looking ideas. Conversations across the room were lively and no lulls were heard in the discussions. All participants were encouraged to take the opportunity to contribute to the discussion. Community conversation data were collected from the tabletop graphics and in the graphic recording captured on a large sheet in the front of the room, as recorded by a Collins Center team member. All impressions were transcribed into word processing documents.
Data analysis
The project team’s analysis of the community conversation data was based on the principles of ‘values-focused thinking’, an extension of a decision modeling domain called decision analysis that was developed by Dr. Ralph Keeney over two decades ago (Keeney, 1992). Transcriptions of community members’ contributions to the three community conversations were used to build ‘values structures’ by which the team could identify connections between ‘fundamental values’, or principles that that guide the participation of residents in the life of the school district, ‘means objectives’, or more-specific principles that can provide guidance to stakeholders on changes to consider for the district, and ‘metrics’, or candidate measures by which progress towards achieving goals represented by ‘means objectives’ could be measured. The team then used these objectives and metrics, combined with an understanding of the practical concerns associated with implementing wide-ranging changes to school district operations and strategy, to build a framework by which QRSD may decide which particular recommendations made by the Collins Center team should be pursued, in what sequence and at what time. Implementation of the suggestions the Center team has created is beyond the scope of the current project.
Findings
The table below summarizes the results of the analysis. It distinguishes between values findings associated with all residents (the October 26th and November 5th community conversations) and those associated with students (the October 20th community conversation), as the differences between these groups in age, life experience, and engagement with public education, may have perspectives that significantly differ. A ‘core’ fundamental value, or a statement of purpose that guides members of each group in their attitudes and activities with respect to QRSD is recorded. Contributing, or ‘means’ values that contribute to achievement of the core fundamental value, and metrics associated with the ‘means’ values are also identified. Metrics can be used to evaluate progress made towards the ‘means’ values according to policy, operations and strategy recommendations ultimately selected QRSD.

Cost Saving Alternatives for the Quabbin Regional School District Page 28 Edward J. Collins, Jr. Center for Public Management
28
The Future of Quabbin Regional School District Values and Metrics
General Community Values • Maximize school and community values • Improve educational outcomes (*) • Maximize District reputation • Make District financially sustainable (*) • Improve in-school experience • Make best use of physical infrastructure • Increase enrollment (*)
Student Values • Improve in-school experience (*) • Strengthen local community • Improve educational outcomes (*) • Increase enrollment (*) • Make District financially sustainable (*) • Improve District administration
Community Performance Metrics • Educational outcomes • Student safety • Level of extracurricular activities • Perceived strength of community • Perceived support for community values • Perceived level of engagement by students,
teachers and businesses in the community • Student diversity • Teacher quality • Level of preparation for a new or changed
curriculum • Positive perception of administrative
leadership • Level of financial resources • Class size • Variety in facility uses • Curriculum quality • District reputation
Student-generated Performance Metrics • Educational outcomes • Positive perception of school • Variety and level of extracurricular activities • Quality of curricular innovations • Level of teacher engagement and support • Financial health • Attractiveness to potential students • Level of community engagement • Sense of community pride
(*) – values held in common
Cost Saving Alternatives for the Quabbin Regional School District Page 29 Edward J. Collins, Jr. Center for Public Management
29
COLLINS CENTER PRINCIPLES
In the course of gathering information regarding the schools and towns, but prior to identifying potential alternatives for action, the project team developed a series of professional principles to filter out ideas that ultimately would not be consistent with the Center’s mission of:
…improving efficiency, effectiveness, governance, and accountability at all levels of government, with a particular focus on state and local government. The Center’s aim is to enable public entities to provide high quality services to the people they serve on a sustainable basis.
The identified principles and the thoughts behind them are listed below: • Acknowledge that change needs to occur –As noted above, to date, the response of the five towns
and the District to declining enrollment and increased costs has been to increase town contributions while also reducing the District’s budget. Taken to their end, these trajectories will leave the towns without the capacity to provide other municipal services while at the same time offering students fewer academic offerings and services. Neither of these two end states is positive and, as a result, this principle acknowledges that a course correction is needed.
• Maximize funding spent in classroom – In all school districts, at all times, the goal should be to
ensure that dollars are spent on students. This means that regular education supports, preventative services, and professional learning focused on the needs of students and creating classrooms where all students can flourish should be the priority for spending in a district and schools. In other words, dollars spent in central administration and in facilities should be reviewed carefully to ensure they are needed.
Use space efficiently and use the “best” space first – this principle recognizes that space is an asset to be used, just as funding is used, to support student achievement. Studies have shown a connection between the quality of the physical environment and academic performance (see Appendix A); In particular, these studies have found that:
o Students in poor buildings tend to perform less well than students in functional buildings.
o Most researchers found students in poor buildings scored between 5 to 10 percentile rank points lower than students in functional buildings, after controlling for socioeconomic status.
o The difference in scores for students in poor buildings can be as high as 17 percentile rank points.9
9 Earthman, GI, “Prioritization of 31 Criteria for School Building Adequacy”, American Civil Liberties Union
Foundation of Maryland. Retrieved from http://www.schoolfunding.info/policy/facilities/ACLUfacilities_report1-04.pdf, February 19, 2014, p. 8-9.

Cost Saving Alternatives for the Quabbin Regional School District Page 30 Edward J. Collins, Jr. Center for Public Management
30
• Place students at the center of all decisions – By asking what is best for students at every juncture in the process of deciding how to move QRSD forward, it is hoped that common ground can be developed and the optimal outcome can be found. This may mean that individual preferences will have to be set aside in favor of student learning.
• Rigor, transparency, and accountability in decisions – This principle applies to all three
governmental entities engaged in this effort, and to the project team’s work itself. All need to recognize that if members of the public are not provided detailed information about finances and financial decision-making they can lose trust in the budgetary process and in the organizations themselves. This will make difficult choices even harder to make.
• Consider a new concept of ‘small-town’ that involves collaboration, and does not emphasize
autonomy – The QRSD represents a 50+ year partnership between the towns of Barre, Hardwick, Hubbardston, New Braintree, and Oakham and the District has been able to combine administrative functions, teacher oversight and academic offerings, and build an outstanding middle/high school. However, at the elementary school level, separation has remained. At present, the significant financial difficulties the District faces demands increased community collaboration so that an action plan can be put in place that will provide a high quality education to those students who rely on the District, even if this action plan requires that significant changes occur.
• Provide 3+ classrooms per grade per school – This principle has been added since the January 11th
presentation to reflect the academic difficulties that arise in the operation of a very small school. Experience has shown that small elementary schools (with 1-2 classrooms per grade level) often fail to provide students with the full or partial inclusionary opportunities required for success. This then tends to result in more students on IEPs and more students exiting the building to district-wide or out-of-district special education programs. In addition, these smaller schools tend not to be able to provide programs and services (e.g., art, music, academic and social emotional support, etc.) in an efficient manner. In the experience of the project team, schools that can offer 3-4 classes per grade level have more opportunities for inclusion and support and can provide a wider array of programs and support in an economical fashion.

Cost Saving Alternatives for the Quabbin Regional School District Page 31 Edward J. Collins, Jr. Center for Public Management
31
ALTERNATIVES ANALYSIS
This section provides a description of the various best practices recommendations and space use alternatives developed by the Collins Center for consideration by the Quabbin Regional School District and its partner towns. As mentioned in the Executive Summary, when the scope of the project was being developed, the task for the Collins Center was “to identify and analyze alternatives to reduce costs” and, at that time, the Center anticipated that it would merely identify alternatives the District could consider, but would not make formal recommendations. Since then, the project team’s thinking has evolved in two ways. First, upon realizing that per pupil spending at QRSD is already below state average, it became apparent that the project really was about identifying ways to improve the financial stability of the District. In some instances, stability may be promoted by reducing spending, but in other areas increased spending may show results that will lead toward improved stability. Second, while researching the trends affecting the District and towns, and the District’s budget, the project team came across a series of areas where it would recommend action be taken even if the District did not have a challenge with student enrollment, i.e., there are “best practices” actions that the Center would recommend the District undertake regardless of the size of the student body. “Best practices” is a term used to describe efficient and effective practices seen in high performing organizations. As a result, this report is not constrained to only ideas that reduce costs in the short term, it also identifies investments that are needed to stabilize the District and the potential actions the District may undertake are divided into Best Practices Recommendations and Space Use Alternatives. All will be evaluated through the lenses identified by the Center – financial, operational, academic, and community values/sense of community.

Cost Saving Alternatives for the Quabbin Regional School District Page 32 Edward J. Collins, Jr. Center for Public Management
32
THIS PAGE IS INTENTIONALLY BLANK

Cost Saving Alternatives for the Quabbin Regional School District Page 33 Edward J. Collins, Jr. Center for Public Management
33
BEST PRACTICES RECOMMENDATIONS
Recommendation 1: Reduce special education enrollment and costs by enhancing regular education programming, special education data collection and controls, and reducing out-of-district placements.
Background As mentioned above and in the Trends Report, the percent and number of students with disabilities has grown significantly since 2004 at the same time that the state average has remained constant. In fact, the percent of students with disabilities increased in QRSD from 9.8% (316 students) in 2004 to 20.3% (466 students) in 2017.10 Of the students with disabilities in the current year, 46 attend school out of district but at a cost borne by the District. Perhaps not surprisingly, the costs for special education services – especially for students out-of-district – has increased dramatically. Costs rose by nearly $1.7 million between FY2015 and FY2017, of which $1.5 million was attributable to out-of-district placements. Across Massachusetts, districts are facing challenges with growing number of students being identified with special needs and cost increases, but QRSD’s is particularly dramatic. While certain costs for special education are a given for public school districts, steps can be taken to improve the regular education program and strategies and, as a result, better control special education costs. Generally, these include improving data collection and analysis, ensuring robust regular education intervention services, establishing appropriate special education programming in the district,, and enhancing early education programming and services. The District presently has three team chairpersons who are responsible for facilitating and managing special education team meetings across the school system. They are assigned to assist students and parents at different grade levels including early elementary (grade PK to 3), later elementary through middle school (grades 4 to 7), and secondary school level (grades 8 to 12). This model seems to work well in that it focuses authority for financial decision-making with respect to special education with three specially training individuals. In addition, creating a model where responsibilities among the three people overlap across schools can lead to better transitions for students as they move from elementary to middle (and then to high) school. The District currently provides the following substantially separate programs to serve students who require a more restrictive educational environment: Elementary School
o Integrated Preschool (at New Braintree); o Language Based Class (grades 4-6 at Hubbardston); o New England Center for Children: Autism/PDD (grades PK-1 at New Braintree); o New England Center for Children: Autism/PDD (grades 2-6 at Oakham); o Project CREATE Functional Academics/Life Skills (grades 3-6 at Oakham);
10
DESE has a figure of 466 students with disabilities for SY2017; QRSD administration has provided a figure of 468.

Cost Saving Alternatives for the Quabbin Regional School District Page 34 Edward J. Collins, Jr. Center for Public Management
34
Middle/High School
o Therapeutic Learning Center (at Quabbin Regional Middle and High School); o Project INVOLVE Functional Academics/Life Skills (at Quabbin Regional Middle and High School); o New England Center for Children: Autism/PDD (at Quabbin Regional Middle School); and, o Transition to Adulthood (for Post Graduates).
In FY2017, the District has 56.35 paraprofessionals budgeted districtwide, consisting of 4.60 general education paraprofessionals, 35.75 special education aides, and another 16 support personnel associated with the New England Center Children Partnership Program (special education). Among the residents who receive support services from the District are the students who live at the Stetson School. Located less than one mile from the QRMSHS, the Stetson School was founded in 1899. Since March 2013, it has been affiliated with the Seven Hills Foundation of Worcester and has focused on serving adolescent boys who have experienced trauma and have complex developmental issues, among other challenges. The Stetson School is licensed by the State and in SY16 had 63 on-site students. Quabbin is designated as the programmatic district for Stetson, meaning that District staff write IEPs and make certain that services are delivered to Stetson students. Currently three (3) Stetson students attend Quabbin middle/high school, with four (4) students awaiting placement. Quabbin is currently fiscally responsible for a total of eight (8) students (the three attending Quabbin, the four awaiting placement, and one other non-special education student). Actions To stem the growth in the numbers of students on IEPs, begin to bring the District closer to the State average and, most importantly, provide all students with appropriate services to best meet their needs in the least restrictive environment, a series of actions will be needed. These include: 1a. Ensure that the team chairpersons are well-trained, accountable, and the only people involved in team meetings with the authority to commit District dollars (at least for initial team meetings). The District is to be commended for having three team chairpersons already in place, thereby undertaking efforts to structure and centralize authority for allocating special services to students. In particular, the project team applauds the assignment of chairpersons in a manner that overlaps schools; by doing so, the structure seeks to provide appropriate transitions between upper elementary and middle school grades, as well as upper middle school and high school grades. This ensures a continuity of services that will assist special needs students and their parents as they make significant transitions during their schooling. However, it is critical that the chairpersons be well training in meeting facilitation and remain up-to-date regarding special education practice and law. In addition, they must be held accountable for the student cases they facilitate and that they have regular, data driven conversations with the Special Education Director. To control costs, the District must continue to ensure that a limited number of people be given the opportunity to commit District dollars during the team meeting process.
1b. Review current and historic out-of-district placement data to determine how the District might encourage the creation of better located collaborative programs, partner with private providers, and/or offer additional special education programs in house, as appropriate.

Cost Saving Alternatives for the Quabbin Regional School District Page 35 Edward J. Collins, Jr. Center for Public Management
35
With out-of-district special education costs increasing by approximately $1.5 million in the past two years, immediate attention needs to be paid to how to offer needed services more cost effectively. Special education collaboratives represent one tool to do so as they offer an opportunity to create programming that will meet the needs of Quabbin students, while also serving other members of the collaborative. The administration should be complemented on their increased use of collaborative placements in recent years, but efforts need to be taken to determine if these can be increased further. In addition, based on out-of-district data, it appears that the District would be well served by creating and/or enhancing in-district social emotional programming across the grade spans beginning in 4th grade, if not earlier. Studies have shown that children who have experienced trauma early in life, perhaps due to separation from one or more parents due to divorce, placement in the foster care system, exposure to in-home or neighborhood violence, or being a victim of violence or abuse have a lowered capacity to handle the stressors of daily life as a result of physiological changes in the brain11. These students may be perceived as “problem students” as some of the ways that their diagnosed or undiagnosed trauma expresses itself can be in use of inappropriate language, lying, or physical violence such as overturning desks or pushing teachers or other students in response to seemingly minor stimulus. Fortunately, considerable research and training is available to assist caregivers, including teachers, in learning how to support these children as they grow and learn. QRSD administrators should schedule site visits to other districts that offer successful programs for students with social-emotional challenges to gather ideas on how to develop an in-house program best-suited for its students. Resources include the Childhood Trauma Academy (childhoodtrauma.org) and the Beyond Consequences Institute (beyondconsequences.org), among others. The District should work collaboratively with the Stetson School to ensure that appropriate programming for students is available within the District, whenever possible, and to ensure regular communication occurs between the District and the residential program. QRSD administrators and Stetson staff should meet in a series of facilitated discussions to develop an action plan geared at addressing the needs of Stetson residents who have been authorized to attend public school, while also gathering insights into how the District can improve the social-emotional supports it makes available to all students. The District should work with Stetson case managers to prepare appropriate transition plans for students as they move from grade to grade, and especially as they transition into middle and high school. 1c. Staff every kindergarten and first grade classroom with a paraprofessional, thereby reducing or eliminating the need for including one-to-one paraprofessionals in IEPs. The benefits of providing students with appropriate classroom supports in kindergarten and grade one cannot be overemphasized. As noted earlier, school districts that provide the necessary regular education supports and interventions at these younger grades tend to see less of a need for 1:1 and/or small group (2:1 or 3:1) paraprofessionals and IEPs in the later primary, intermediate, and middle grades. For these reasons, it is recommended that regular education paraprofessionals be deployed in each kindergarten and first grade classroom throughout the district, even though this could represent a substantial cost in the initial years of the program.
11
Perry, Bruce, Stress, Trauma, and Post-Traumatic Stress Disorders in Children, published by the Childhood Trauma Academy, retrieved from http://childtrauma.org/cta-library/trauma-ptsd/, April 18, 2017.

Cost Saving Alternatives for the Quabbin Regional School District Page 36 Edward J. Collins, Jr. Center for Public Management
36
District budget data suggests that today the vast majority of paraprofessionals are assigned to support special education services (51.75 FTE) and a limited number are assigned to general education classrooms (4.60 FTE). Over time, as appropriate based on student needs, and with appropriate student grouping and grade configuration patterns, the District should strive to reassign the paraprofessionals to create more a more preventative support system at the classroom level. For example, the District may want to look closely at the current allotment of 16 paraprofessionals who serve the 13 students in the New England Center’s autism programs. This strategy will be cost effective as additional funding will not be needed, yet support will be provided to greater numbers of students and teachers. The District presently has paraprofessionals budgeted at all pre-K classrooms and in three out of seven kindergarten classrooms. The nine first grade classrooms are not assigned classroom-wide paraprofessionals. Under the current school and grade configuration, a total of 13 paraprofessionals would need to be added or redeployed to provide support to all of the kindergarten and first grade classrooms. 1d. Ensure that appropriate Response to Intervention (RtI) Tier 2 and 3 strategies and staffing are available in all schools and grade spans to ensure necessary regular education interventions and reduce/control the number of IEPs. As noted above, the project team believes that the increase in students with IEPs in the district is at least partially due to the decreased level of regular education supports available. When these supports are not available as part of the regular education program or are increasingly constrained, parents and teachers will seek them through special education, thereby creating a legal mandate for long-term intervention. Providing increased support in literacy, mathematics, and guidance/adjustment counselor support, as well as through special education facilitation, will help ensure that more families can receive services without the need for an individualized education plan (IEP). These supports will also assist the District in improving student achievement overall. The number of elementary schools (along with the small size of a number of these schools) actually accentuates this problem. Specifically, it is very difficult to provide the appropriate regular education interventions and supports in elementary schools with less than 3-4 classes per grade level. Moreover, even when these supports are provided in the district, many of the service providers must travel between schools, leading to increased cost for a mileage among these professionals, as well as a significant amount of lost time to travel. 1e. Locate district-wide special education programs at central locations and in schools that offer at least three (3) classes per grade level. In addition, relocate the pre-kindergarten program to a centrally located facility that will be accessible to more children and families. District-wide special education programs are not currently located in appropriate locations with respect to the residences of district students and/or with respect to schools that include enough sections per grade level to allow for maximum levels of inclusion. Locating these programs more centrally would accomplish both of these goals, given that the centrally located QRSD schools tend to greater enrollment than other schools in the district. This will increase opportunities for inclusion and could reduce transportation costs.

Cost Saving Alternatives for the Quabbin Regional School District Page 37 Edward J. Collins, Jr. Center for Public Management
37
Likewise, the District does not seem to be taking advantage of the possibility of maximizing participation in the pre-kindergarten program by locating these classes in New Braintree. Relocating these classes to a more central school could increase enrollment among residents of these larger towns. Given that quality pre-k is appropriately viewed as a preventative measure with respect to special education referrals, the project team believes that these measures will increase preschool enrollments and, over time, reduce special education costs. 1f. Enhance data collection around special education to ensure that creation of programming and other targeted interventions will reduce costs and improve services to students. Data should be collected to examine how students are being referred to special services (e.g., teachers, parents, others), the types of evaluations being conducted, and the needs that are being identified, etc. Regular review of these data will help identify when additional interventions are needed to provide appropriate services to students without requiring an IEP, as well as when additional special education programs and services could be created in-district and/or through collaboratives. In addition, out-of-district placements will also need to be closely monitored as it is often more cost effective to offer programming in house or via a collaborative than through an outside placement. Data on students seeking outside placement and IEPs should be reviewed with principals on a regular basis and as part of their annual evaluation review. Moreover, as noted in Recommendation 1a, the Director of Special Education should engage team facilitators in regular, thoughtful conversations regarding these important data points. It is only through this serious analysis that the District will determine the reasons for their significant areas of concern (e.g., out-of-district special education numbers).
1g. Focus professional learning spending on strategies for inclusion and meeting the needs of all students in the regular education classroom, enhancing child study teams, and other topics designed to enable classroom teachers to better meet the needs of students, with a focus on district and building goals and priorities. While the District appears to budget adequately for professional learning, it is not as apparent that this spending is happening around a clear professional development plan, which includes measurable goals, benchmarks, and regular performance reports to the public. Moreover, this plan needs to be focused on the areas of greatest system and building needs, as identified by performance data. Based on the data that the project team has reviewed (including out-of-district placement numbers, student performance indicators, special education numbers, etc.), it seems clear that specific goals, measurements and dollars should be targeted to better enabling teachers to meet the needs of all students in their classes.
REVIEW LENSES
Finance There may be a need for investments in a number of areas in order to realize longer-term savings. For example, the addition of paraprofessionals in every kindergarten and first grade classroom may be achieved through the redeployment of current aides, although some short-term spending on these positions may be necessary. In addition, although creating certain in-district special education programs may not be immediately offset with savings in out-of-district (collaborative and private school) placements, future placements

Cost Saving Alternatives for the Quabbin Regional School District Page 38 Edward J. Collins, Jr. Center for Public Management
38
will be reduced or eliminated. A return on these investments will be seen, however, in improved test scores and parent satisfaction in the near term, with financial savings occurring over several years.
Operations A focus on systems, data, accountability, all students, and professional learning around district and school goals will need to be implemented with discipline throughout the District. Over time, teachers will receive additional in-classroom support via the deployment of paraprofessionals.
Academic The academic benefits of the actions designed to bring the District’s special needs numbers closer to the state average are multifold. First, the assignment of paraprofessionals in all kindergarten and first grade classes will help students become accustomed to classroom expectations and allow them focus on learning. Teachers will be better able to create flexible small groups so that learning can be better tailored to student needs. Second, as the District enhances its social emotional supports, some students who are presently out-of-district may be able to rejoin their local school, and collaboratives will be engaged to provide other special education services. All students will benefit when others (both those with IEPs and those considered part of regular education) have the support that they need.
Community Values Consistent with values of ‘Improve educational outcomes’, ‘Make best use of physical infrastructure’, and ‘Improve District administration’. See Appendix B for details.
Transportation
This depends on the school building and grade configuration model(s) chosen. Obviously, keeping students in the district (instead of at collaboratives and private schools) saves money on special education transportation costs. In addition, basing programs at larger schools (instead of schools that might have more space) will generally save dollars on transportation, depending on where these students reside.
Class Size No impact on class size, but as the District focuses on inclusion, classroom diversity can increase.
SWOT ANALYSIS
Strengths: o This series of actions will directly target one of
the Districts greatest cost drivers – rapidly escalating special needs costs
o All students will benefit from additional supports and will benefit as students with behavioral challenges get the support that they need
o With the support of paraprofessionals, teachers will have greater capacity to work with individual students and sub-groups in the classroom to meet their unique needs
Weaknesses: o Parents will need to feel confident that the
District will meet their child’s needs outside of a formal IEP process
o Costs could increase over the near term to create the paraprofessional (kindergarten and first grade) structure, to add Tier 2 and 3 supports, and to build needed district-wide special education programs.
Opportunities: o Academic performance of all District students
can be improved, not just that of students on IEPs today
Threats: o District leaders must foster a belief that
Quabbin is a school system for all students o Teacher and principal support for inclusion is

Cost Saving Alternatives for the Quabbin Regional School District Page 39 Edward J. Collins, Jr. Center for Public Management
39
o Improved supports will improve teacher morale
o Parent confidence in the district will grow as they see it meeting their child’s needs
needed o Low income and special education students
should not be “blamed” for District budget concerns

Cost Saving Alternatives for the Quabbin Regional School District Page 40 Edward J. Collins, Jr. Center for Public Management
40
Recommendation 2: Increase enrollment in the high school by increasing offerings and incenting students/parents to choose the regional public school for their secondary education.
Background Declining enrollment, particularly decreases associated with resident students choosing to attend another school through choice, charter enrollment, or the local vocational schools, adversely impacts District resources in several ways. First, funding is transferred away from Quabbin to the school that students have selected to attend. Second, fixed costs for electricity, heating, and even teachers and support services does not go down in a linear way so that the loss of 1 student in a classroom reduces all costs by 1/20th. Instead, a classroom will not be eliminated or a wing of a school closed until dramatic declines have taken place. Until then, costs will remain largely the same, but revenues will decrease. A particularly steep decline in enrollment can be seen between 8th and 9th grade in QRSD as an increasing number of Quabbin students are choosing to attend other public school districts, as well as Pathfinder Vocational School (including 18 students from Hardwicke, 9 students from New Braintree, and 15 students from Oakham at present) and Montachusett Regional Vocational School (including 41 students from Barre and 75 students from Hubbardston at present), and charter schools. From this, it appears that these schools actively recruit Quabbin students to attend their programs, but Quabbin Regional High School does not do the same for its own students. More specifically, it appears that many of the advantages that could be garnered from having middle and high school students in one building are squandered. Specifically, there seem to be a number of barriers created to prevent middle school students from taking advantage of being in a high school building. For example, middle school students are not permitted to take part in high school clubs and activities and they are not encouraged, where it might be appropriate, to take classes in the high school. Mentor programs do not appear to exist. Further, anecdotal evidence suggests that representatives from the high school, including professionals and students, are actively discouraged from interacting with the middle school students and informing them of all that the high school as to offer. All of these strategies could be used to improve programming at the school and to retain more Quabbin students within the district. Actions 2a. Consider partnering with a local vocational school to provide programming not currently available at those schools or to offer satellite classrooms open to ACRSD students. Consider providing programming on own. As noted above, Quabbin Regional loses a substantial number of rising 9th grade students to Pathfinder and Montachusett each year. While both schools provide students with a quality vocational experience, there are vocational programs not currently offered by the schools which are popular in many other vocational schools and which train students for jobs that exist in Massachusetts (e.g., biotechnology, environmental science, etc.). In addition, a number of important programs are oversubscribed at one or both of the vocational schools and could be replicated (e.g., plumbing). Moreover, the Commonwealth has prioritized creating additional seats in vocational schools/programs

Cost Saving Alternatives for the Quabbin Regional School District Page 41 Edward J. Collins, Jr. Center for Public Management
41
through grant funding, given the number of students currently on waiting lists across the state. These grants are designed to reward partnerships, so Quabbin staff should approach both Pathfinder and Montachusett and other vocational schools (Smith Agricultural HS) to discuss how they could collaborate around shared programming, preferably concepts that could utilize space at the Quabbin Regional High School. 2b. Actively strive to retain 7-8th graders as they move to high school (e.g., allow to participate in appropriate extracurricular activities with high school students, have high school student liaisons visit the middle school, take middle school students on tour and allow to sit in classes; allow adequately prepared middle school students to take classes at the high school. Students at the community conversation reported that they felt that high school officials had not reached out to them much regarding offerings at the high school when they were in 7th and 8th grade – even though they are located in the same building. They were also displeased that they were not able participate in extra-curricular activities with the high school students. They indicated they would have liked more interaction, tours, and visits from older students as they were deciding where to go for 9th grade. Of course District officials should determine which extracurricular activities are appropriate across a larger grade span, but while doing so should recognize how important these groups and activities are to creating a sense of school spirit. For example, the enthusiasm 7th and 8th graders have for the school drama club can continue as they move to the high school level and serve as mentors for the younger participants. See also Space Use Alternative C.
REVIEW LENSES
Finance Increasing enrollment at the high school will over time benefit District revenues as students decide not to choose another high school and choice-in students select Quabbin Regional HS. Grant funds are available to fund vocational offerings, including capital costs, as this is a high priority at present for the state. Costs for increasing marketing to middle schools is largely staff time, although some written materials may be needed.
Operations Reducing underutilized space will be better for school operations and will reduce the cost per pupil for fixed costs like electricity and heating.
Academic Continued decline in enrollment at Quabbin Regional HS will continue to impact the academic program. For example, less high school students generally means more “singleton” courses, which will impact the ability of students to schedule the classes that they are interested in taking. As District resources become healthier and enrollment grows, the District should strive to offer distinctive and challenging new classes designed to retain students and incent school choice students to come from other school systems. A student survey could be used to find out what types of classes the students would like to see.
Community Values Consistent with values of ‘Increase enrollment’, ‘Make best use of physical infrastructure and ‘Improve in-school experience. See Appendix B for details.
Transportation No impact
Class Size The District can monitor class sizes as students select courses and ensure that

Cost Saving Alternatives for the Quabbin Regional School District Page 42 Edward J. Collins, Jr. Center for Public Management
42
class size is appropriate for the subject matter.
SWOT ANALYSIS
Strengths: o Will ensure the great space in the building is
used by age groups that can best benefit o Revenue increases with increased enrollment,
either through retaining more Quabbin students and/or through incenting more school choice students to attend the HS
o More academic and extra-curricular offerings (and less singleton offerings) possible with more students
Weaknesses: o High school administrators will need to change
the way they do business and begin to market to middle school students
o Considerable work will be needed to create partnerships and apply for grant funds to offer vocational programs
Opportunities: o HVHS can be reenergized by a larger student
body o Enthusiastic teachers and students will
improve test scores
Threats: o Potential complacency by high school
administrators o Potential obstacles created by middle school
administrators

Cost Saving Alternatives for the Quabbin Regional School District Page 43 Edward J. Collins, Jr. Center for Public Management
43
Recommendation 3: Conduct an outside review of the costs and benefits of the International Baccalaureate program.
Background Quabbin Regional High School became one of the very few International Baccalaureate (IB) schools in the Commonwealth in the 2013-2014 school year. This approach, which allows students to study a range of subjects and bring them together to “build new interdisciplinary understanding” could provide QRHS with a curricular design that represents a significant competitive advantage over neighboring districts, in addition to providing students with quality teaching and learning throughout the curriculum. The District has seen some progress with this program, with 2 students achieving the IB Diploma in 2015, 9 earning their IB Diploma in 2016, and another 4 IB diploma candidates in 2017. Beyond the issue of IB diplomas, the District currently has 78 students enrolled in IB courses seeking certificate status. However, it is clear from the community conversation with students that reaction to the implementation of IB remains mixed. Specifically, some students pointed to IB as one of the important advantages of a Quabbin education, while others said that it should be the first thing to be eliminated. These students complained of its impact on other aspects of the schedule (e.g., being forced into an IB course because of the lack of sections) and other issues. In addition, the District had originally planned to implement the middle grades IB program in 2018-2019, a step which has been put on hold and has not yet occurred. Actions While the International Baccalaureate program could certainly become an approach that enables Quabbin to retain resident students and attract students from other districts through school choice, it appears that the program was not fully embraced by staff, students and parents at implementation. While student participation and achievement data indicate that this has improved somewhat, it is evident that many students (and staff) continue to have reservations about IB and its impact on other aspects of the school. A comprehensive evaluation of the Quabbin program, can be used to determine if the approach could successfully distinguish the District from surrounding schools or if the expenditures, impact on other aspects of the school, and overall student perception indicate that it should be eliminated.
REVIEW LENSES
Finance There is a cost (particularly with respect to professional development) in implementing the International Baccalaureate program. In addition, it appears that the model may be creating additional “singleton” sections at the high school, which represents a cost in additional teachers and/or loss of flexibility for students in scheduling. While a study of this approach will certainly cost dollars, it could also help the system with implementation strategies for students, staff and parents.

Cost Saving Alternatives for the Quabbin Regional School District Page 44 Edward J. Collins, Jr. Center for Public Management
44
Operations As noted earlier in this report, a declining student population and curricular approaches which create more singleton sections is not a good recipe for a successful high school.
Academic The academic value of the IB model is beyond question. This approach has proven to be a successful academic concept in many parts of the country. However, the key is successful implementation with and buy-in from students, staff and parents.
Community Values Consistent with values of ‘Improve educational outcomes’, ‘Make District financially sustainable’, and ‘Improve in-school experience’. See Appendix B for details.
Transportation No impact
Class Size An increase in singleton sections will cause increases in class size (or course denials) for students, particularly in a smaller high school.
SWOT ANALYSIS
Strengths: o IB represents a strong academic model that
has been successfully implemented in many school systems throughout the country.
Weaknesses: o Based on interaction with staff and students,
the model does not appear to have gained traction with student consumers.
Opportunities: o If done correctly, the District has an
opportunity here to offer something that neighboring systems do not possess.
o This could assist in retaining Quabbin students at the high school and attracting school choice students to the district.
Threats: o Continuing on the current path, which
represents a real division among students and staff over the value of this approach, threatens to undue the tremendous upside that could be available through the implementation of IB

Cost Saving Alternatives for the Quabbin Regional School District Page 45 Edward J. Collins, Jr. Center for Public Management
45
Recommendation 4: Enhance the District’s nepotism policy to eliminate the perception of preferential hiring for relatives of central office administrators and school committee members.
Background One of the issues that was raised during interviews and the community conversations was the issue of perceived nepotism in District hiring. While much of what was heard was anecdotal in nature, the clear perception is that QRSD has a practice of giving preferential hiring treatment to relatives and friends of current employees. While this may not be the case, the perception that seems to exist throughout the community can only be harmful to the District’s reputation and, ultimately, to students. QRSD has a policy that addresses State ethics/conflicts of interest that states, in part:
In order to avoid the appearance of any possible conflict, it is the policy of the Quabbin Regional School Committee that when an immediate family member, as defined in the Conflict of Interest statute, of a Quabbin Regional School Committee member or district administrator is to be hired into or promoted within the School District, the Superintendent shall file public notice with the School Committee and the Town or District Clerk at least two weeks prior to executing the hiring in accordance with the law.
Actions The District, through the Superintendent and School Committee, should take consider an update to the District’s existing nepotism policy. Although the QRSD policy is not inadequate, the existence of the public perception of nepotism despite the existing policy is cause for concern. Model policies are available through the Massachusetts Association of School Committees (MASC) and other school systems (see Appendix XX for examples). Some instances districts, such as Framingham and Brookline, outright prohibit the hiring of close family members of the superintendent and members of the school committee. In addition, some policies do not permit the hiring of relatives to positions where they could be supervised or evaluated by their family members. While this may not be appropriate for QRSD, discussion should be held regarding the merits of such a clear and direct policy. The revised policy should then be available on the District website and well-advertised in the communities. Furthermore, District administration should provide the School Committee with a public report at least annually regarding hiring practices, retention rates, and other aspects of the recruitment, induction, and retention practices in order to provide transparency regarding these important functions.
REVIEW LENSES
Finance No impact.
Operations Hiring processes will need to follow the requirements of the nepotism policy. This may mean that the composition of interview panels, advertising of positions, and reporting to the School Committee may need to change.
Academic No impact other than the perception of the District will improve
Community Values Consistent with values of ‘Maximize school and community values’, ‘Maximize District reputation’, and ‘Improve District administration’. See Appendix B for

Cost Saving Alternatives for the Quabbin Regional School District Page 46 Edward J. Collins, Jr. Center for Public Management
46
details.
Transportation No impact
Class Size No impact
SWOT ANALYSIS
Strengths: o This is a best practice that should be in place in
all districts o Will increase public confidence in the District
and its hiring practices
Weaknesses: o Once in writing, the policy must be followed o In certain high need areas (special education,
sciences, world language) the policy may narrow an already small pool of applicants
Opportunities: o Participating in thorough and transparent
hiring processes can increase the confidence of the candidate selected and their peers
o An annual hiring report for the School Committee and other governmental bodies will increase confidence in the schools and allow for an open discussion of areas of challenge in human resources.
Threats: o Some candidates may not make it through the
hiring process and may be disgruntled

Cost Saving Alternatives for the Quabbin Regional School District Page 47 Edward J. Collins, Jr. Center for Public Management
47
Recommendation 5: Place accountability for performance with the adults, not with students. For example, adopt language designed to ensure that the needs of low income and special education students are not “blamed” for District budget concerns.
Background The project team has been struck throughout its work in Quabbin by the negative tone sometimes taken regarding students with disabilities and those families who are living in poverty. This has taken many forms, including open discussion of particular student situations and their cost to the District, a parent speaking up at a legislative meeting to ask if “we can stop blaming kids” for our budget issues, etc. In addition, there is a clear undercurrent of blame directed at the Stetson School and the perceived impact that its residents have on the District and its budget. While the budgetary conditions that they District faces have clearly been exacerbated by the lack of appropriate state funding and District-specific trends in special education noted throughout this report, blaming the most vulnerable students is never an acceptable strategy. Actions District leadership must adopt creative approaches to serving all students in an efficient and effective manner. This includes a focus on regular education interventions, building appropriate structures (team facilitators, child study teams, specialists, etc.) to serve students without the need for an IEP whenever possible, focusing on data to determine needs for programs and services, improving inclusion opportunities, and creating in-district programs whenever possible. In addition, District leadership must not permit students to be blamed for budget problems. Creating norms for meetings and other interactions that demonstrate that all students are important and that the District seeks to serve the needs of all students is critical. Sending this message to the community each and every day, in all forms of communication and practice, must be the expectation, not the exception. As noted in other sections of this report, District leadership needs to find ways to work with Stetson through a “they are all our students” lens. It would be very easy to take a more negative view of the school and its students, most of whom are not originally Quabbin residents. Doing so would be short-sighted, however, and ignore the positive impact that the District could have on the lives of these students and their families if true partnerships were created with Stetson’s administration and teaching staff.
REVIEW LENSES
Finance There are no additional costs associated with taking an “all students and their families have value here” approach. In fact, in the experience of project team members, districts with this belief have better relationships with their parents and, therefore, are trusted more often to do the right thing (in a regular education setting, whenever possible), often at a lesser cost.
Operations This approach involves setting a non-negotiable set of norms about how staff and the School Committee treat and talk about students and families. It

Cost Saving Alternatives for the Quabbin Regional School District Page 48 Edward J. Collins, Jr. Center for Public Management
48
requires discipline in all situations and context and, most importantly, it begins at the top with the Superintendent and School Committee.
Academic This belief fosters an approach centered on inclusion and on keeping kids in Quabbin (whenever possible). It means that professional development dollars are spent on enabling teachers to support the needs of all students in their classrooms. It means that the District adopts a view that “all means all” and live that belief in all situations every day.
Community Values Consistent with values of ‘Maximize school and community values’, ‘Improve in-school experience’, and ‘Improve District administration’. See Appendix B for details.
Transportation No impact
Class Size No impact
SWOT ANALYSIS
Strengths: o This approach creates an inclusive
environment where all students and their families are valued.
o It would allow for partnership opportunities with Stetson, centered on a different model of thinking about the needs of their students.
Weaknesses: o This can be incredibly difficult for a system
that has experienced a loss of students, growing special education costs, and financial turmoil. It is much easier to point to specific cost centers (like special education) as one of the “reasons” for all budgetary woes.
Opportunities: o Increased inclusion, more regular education
interventions, focused professional learning, adoption of a growth mindset
Threats: o Leadership (school committee,
superintendent, and central administration) who do not embrace an “all students” approach.
Cost Saving Alternatives for the Quabbin Regional School District Page 49 Edward J. Collins, Jr. Center for Public Management
49
Recommendation 6: Increase transparency in the process of developing the annual District budget.
Background In recent years, the budget process for QRSD has been difficult. Rising costs related to contractual obligations to staff, employee benefits, special education, building costs and choice and charter assessments have made it challenging to sustain services. Further complicating the situation is the fact that members’ required contributions have been changing at disparate rates over the last several years, with some towns’ required local contribution increasing (e.g., Hubbardston, Oakham) while others have been flat or decreasing (e.g., Barre, Hardwick and New Braintree). This can result in uneven increases in total assessments among the member towns. Budget dollars have been constrained as well by the minimum increases in state Chapter 70 aid in recent years and the dim prospects for future significant revenue increases. For their part, the member towns have limited financial ability to absorb large increases in school costs within their annual tax levy increase. Virtually all of the town administrative staff the project team spoke with expressed concern about whether their town could continue to afford Quabbin’s budget. Though three towns have attempted overrides of Proposition 2 ½ to fund operating increases in the Quabbin budget over the last 25 years, none have been successful in approving an operating override for the QRSD budget. It appears that the different perspectives of the member towns and the District administration/School Committee regarding the District’s finances have made it difficult to adopt a timely District budget. In fact, the District has not had an approved budget by the July 1st start of the fiscal year in four of the most recent six years (FY2012-FY2017), requiring the Commissioner of Education to intervene and establish a temporary budget. By law, if the District does not have a legally adopted budget by July 1st, the Commissioner may established a budget of one-twelfth of the prior year or such higher amount as the Commissioner may determine. If the District budget has not been approved locally by December 1st of that year, the Commissioner shall assume fiscal control of the District and establish a final budget for the year. In FY2013, the Commissioner established an initial temporary budget and, when a budget was not approved by December 1st, assumed fiscal control and set a final budget. To its credit, the District publishes a large volume financial and budget data to its website. However, this has not quelled beliefs among the member towns that the District is not being completely forthright or transparent around its budget. Three of the municipal administrators the project team spoke with commented on the District’s practice of proposing a high budget, threatening cuts if not approved, but then “finding” a way to fund the threatened cuts even with a lower budget approved. As an example, in FY2017, there were several iterations of the District budget, with the first version being about $3.4 million (+10%) more than FY2016 (including $982,000 in teacher salaries charged to school choice revolving in FY2016). The amount was then reduced by $2.5 million in the second version of the budget. The final version of the FY2017 budget approved by the member towns was reduced by more than another $1 million. The perception of a lack of transparency around the budget is not likely helped by the fact that the District receives significant revenues that are not part of the general fund budget approved by the members, including the school choice and circuit breaker revolving funds which may be spent by the

Cost Saving Alternatives for the Quabbin Regional School District Page 50 Edward J. Collins, Jr. Center for Public Management
50
School Committee without further appropriation. Taken together, these revolving fund revenues supported more than $8 million in District spending from FY2015 through FY2017. In FY2016, $2.6 million in school choice funds was appropriated by the School Committee, with nearly to $2.3 million of that amount used to fund teachers’ salaries. Not only was this appropriation well in excess of what the District receives annually from school choice tuitions (about $1.8 million), it made consistent comparison between the FY2016 and FY2017 budget very difficult. In effect, teachers’ salaries were shifted in FY2016 from the general fund to the choice tuition revolving fund and back again in FY2017. While it is not productive to put budgets before the member towns that they cannot afford, it is also not realistic to assume that the District can continue to “cut” its way to success. Member towns need to feel that their financial concerns are being heard, while they also need to better appreciate the financial issues that are likely to confront the District for years to come. Actions 6a. Establish a regional budget advisory board to serve as the member towns’ single point of contact with the District around finances. The membership might consist of the town administrator and finance committee chair (or designees) from each town. In the late fall, at the beginning of the budget process, the advisory board will meet with the District administration and School Committee to share information about the fiscal outlook for each entity, the challenges that must be addressed in the coming year and how they can better accommodate the conflicting or competing needs of the participants. The District administration will ensure that the advisory board members receive detailed budget documents for the District’s general fund budget. The District should be explicit about proposed new positions and programs and their merits, so that they can be considered separately from contractual obligations or increases to benefit costs, etc. that represent no change to the District’s programmatic offerings. 6b. Distribute supplemental summary data on all spending from revolving funds such as school choice, circuit breaker, and grant funds to the budget advisory board and the general public. This would be for informational purposes only and not subject to action by the member towns. However, this may help the member towns understand District finances better and de-mystify these "off-budget" revenue sources.
REVIEW LENSES
Finance Will increase public confidence in District financial needs
Operations Will require additional meetings and preparation of data for public review. However, should reduce the amount of time and difficulty in approving the annual District budget.
Academic Will increase public willingness to invest in new/expanded programming as community members understand the merits
Community Values Consistent with values of ‘Make District financially sustainable’, ‘Improve District administration’, and ‘Maximize District reputation’. See Appendix B for details.
Transportation No impact
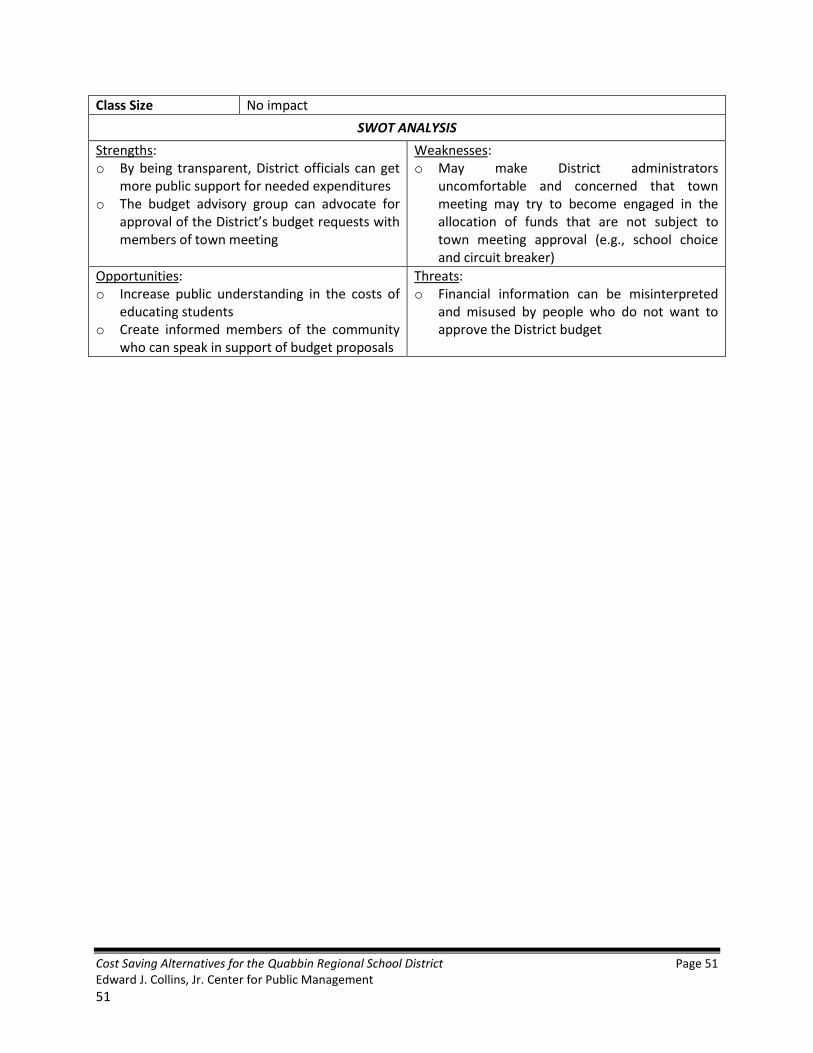
Cost Saving Alternatives for the Quabbin Regional School District Page 51 Edward J. Collins, Jr. Center for Public Management
51
Class Size No impact
SWOT ANALYSIS
Strengths: o By being transparent, District officials can get
more public support for needed expenditures o The budget advisory group can advocate for
approval of the District’s budget requests with members of town meeting
Weaknesses: o May make District administrators
uncomfortable and concerned that town meeting may try to become engaged in the allocation of funds that are not subject to town meeting approval (e.g., school choice and circuit breaker)
Opportunities: o Increase public understanding in the costs of
educating students o Create informed members of the community
who can speak in support of budget proposals
Threats: o Financial information can be misinterpreted
and misused by people who do not want to approve the District budget

Cost Saving Alternatives for the Quabbin Regional School District Page 52 Edward J. Collins, Jr. Center for Public Management
52
Recommendation 7: Control/moderate fiscal impact of future teachers’ cost of living and annual step increases on the budget.
Background In FY2016, the District spent more than $11.6 million on total teachers’ salaries from all funding sources. When the Quabbin Regional Teachers Association (QRTA) contract was settled for the fiscal years FY2015 through FY2017, the School Committee granted cost of living adjustments (COLAs) of 2.5 percent per year. On top of these COLAs, the teachers’ salary schedule calls for 3 percent step increases each year over 16 total steps. As a consequence, a teacher still receiving step increases would receive an increase in total compensation of more than 16.5 percent over three years. Annual payroll increases for teachers in the form of step increases and cost of living adjustments (COLA) are one of the greatest cost drivers affecting QRSD year after year. For example, the COLA alone, at 2.5 percent per year for three years, adds about $900,000 to the cost of employing teachers by the third year of the contract. COLA increases should be carefully negotiated as the actual cost of living in the U.S. has risen less than 2% per year since 2012. Actions 7a. Given the fiscal outlook of the District, the School Committee should exercise more fiscal discipline when negotiating future teachers’ contracts. Generous COLAs and step increases create budgetary pressures that make it difficult for the District to avoid cuts in staffing and meet other budget obligations each year. Therefore, the District administration and School Committee should be careful about committing future District resources for cost of living increases the District cannot afford. The annual step increases appear to be on the high end as well, at a uniform 3 percent over 16 total steps. Though it will be difficult for the District to negotiate significant revisions to the salary schedule for existing employees, the District could propose more modest steps for new hires (2-2.5 percent). 7b. Appoint a municipal representative to the District’s collective bargaining process. Pursuant to MGL c.150E, Section 1, the member towns have the option to designate a representative to serve on the School Committee on collective bargaining matters. Not less than 21 days prior to commencing bargaining negotiations, the Superintendent should notify the Town Administrators or Selectmen of each member town of a meeting to be held to select a municipal representative (603 CMR 41.04). Once the member towns select their representative, the municipal representative will serve as a member of the School Committee on all matters related to collective bargaining by the regional school district. The municipal representative may also serve on the school district bargaining team if selected by the School Committee. The municipal representative shall have one vote in all school committee deliberations on collective bargaining. Designating a town representative to the School Committee for collective bargaining purposes will allow the towns to offer input and participate in discussions on future contract proposals. Participation in School Committee discussions around bargaining also gives the member towns a means to better

Cost Saving Alternatives for the Quabbin Regional School District Page 53 Edward J. Collins, Jr. Center for Public Management
53
understanding the District’s financial needs and challenges. 7c. Review administrative salaries to ensure that they are within area medians. As mentioned in the Trends Report, the cost of housing in the Quabbin area is well below the state average, contributing to an area cost of living that is 21% below the state. As housing costs are a major driver of cost of living, local salaries should be determined by the area cost of living into account. 7d. Review stipends in teachers’ contract to make sure that they are still necessary, that the stipend amount is consistent with the hours needed to undertake the responsibilities, and that the stipend should be continued. The District should make sure that all teachers’ stipends are current and necessary. Careful attention should be paid to whether teachers are compensated by stipends for duties that should be performed within their regular compensation. (See Appendix D for list of stipends included in QRTA contract. However, just because a stipend is listed does not mean that it is being paid.)
REVIEW LENSES
Finance Moderating future cost of living increases will offer savings and allow the District to retain more of its existing staff in subsequent fiscal years
Operations Ability to retain more teaching staff
Academic More staff to address District educational priorities
Community Values Consistent with values of ‘Make District financially sustainable’ and ‘Improve District administration’. See Appendix B for details.
Transportation No impact
Class Size Moderating cost of living will help reduce financial pressures that can lead to increased class size
SWOT ANALYSIS
Strengths: o Will result in cost savings o Will allow District to retain more staff in the
future
Weaknesses: o Will require contract negotiation to address o District may not welcome municipal
representative for collective bargaining
Opportunities: o More involvement of member towns in District
collective bargaining by designation of a municipal representative on the School Committee for collective bargaining matters
o Member towns more aware of District fiscal needs and challenges
Threats: o Senior teachers at (or near) top step may
receive less generous cost of living adjustments, may negatively impact morale

Cost Saving Alternatives for the Quabbin Regional School District Page 54 Edward J. Collins, Jr. Center for Public Management
54
Recommendation 8: Continue to engage in discussions with surrounding communities around joining the district, negotiating a tuition agreement to accept a community’s pupils in particular grades or otherwise sharing services.
Background As noted earlier, the number of youth in the five-town area is projected to continue to decline. That trend is not unique to QRSD and is prevalent across much of central and western Massachusetts. QRSD was a leader in accepting school choice students for many years until other districts also began to participate, and while the District still accepts more students than it loses, the difference has been getting smaller in recent years. One option to increase enrollment is to encourage additional towns to join the QRSD partnership. Actions 8a. Advocate for the creation of a western Worcester County Education Task Force with a mission of considering enrollment challenges across the area and discussing the potential for increased regionalization in education. Berkshire County recently received grant funding to undertake a county-wide effort to analyze projected enrollment and school facilities over a large area and, while the results of their study are not yet available, the process is worth monitoring and possibly emulating. Since the enrollment declines are occurring across such a large section of Massachusetts, and many districts are resource-constrained it makes sense to contemplate what is happening in abutting and nearby communities. 8b. Continue to participate in the Massachusetts Small and Rural School Districts Coalition. Although this group is fairly new to the statewide conversation around declining enrollments, increased special education costs, the impact of charter school and school choice on regional and rural schools, and the effect of stagnate state funding on rural Massachusetts, they have quickly seized upon some creative ideas. One concept is a pilot program designed to share administrative (and other) services across regional and rural school systems in an effort to increase efficiencies and save dollars. Quabbin should embrace the possibility of being part of this pilot program. The District has a track record of success with respect to this approach (given the shared Superintendent model utilized in the District a few years ago) and look creatively at how to design shared models with respect to other administrative roles.
REVIEW LENSES
Finance Increasing student enrollment via school choice and tuition will increase revenues. If a new community wishes to join the regional district, then the agreement would need to be modified to include the new community’s share of expenses.
Operations If another community joined QRSD, the regional agreement would need to be modified

Cost Saving Alternatives for the Quabbin Regional School District Page 55 Edward J. Collins, Jr. Center for Public Management
55
Academic Larger student enrollment, particularly at the high and middle schools can allow the District to maintain its offerings in courses and extracurricular activities, if not expand them.
Community Values Consistent with values of make District financially sustainable, make best use of physical infrastructure, and increase enrollment. See Appendix B for details.
Transportation Potential change depending upon if other communities are added to the District.
Class Size No change anticipated
SWOT ANALYSIS
Strengths: o Increasing the size of the district and can
improve QRSD’s financial stability o Participating in broader regional efforts will
strengthen relationships and produce partners to assist in these efforts
Weaknesses: o Adding another community will require
modification to the regional agreement and a different leadership composition
o Collaboration is difficult o Abutting communities appear unlikely to join
another district o Some bus routes are already lengthy. They
would need to be reviewed in detail if another community was added
Opportunities: o The challenges facing QRSD are not unique
and through a multi-community partnership a broader solution could be found
Threats: o QRSD may have to give up something (e.g.,
different number of seats on the school committee) in order to have another community join

Cost Saving Alternatives for the Quabbin Regional School District Page 56 Edward J. Collins, Jr. Center for Public Management
56
Recommendation 9: Improve communication with students and parents, and increase their sense of commitment to QRSD.
Background Since a majority of member towns have not approved the QRSD budget by July 1st in four of the past six years, the District has experienced multiple years of uncertainty regarding what its budget and staffing would be. Although it is hoped that this report will help the District and the member communities to ultimately come together to select and implement a solution that will stabilize the District’s finances in a way that best benefits the children of the five towns, none of the alternatives under consideration will be easy nor will they be universally pleasing. Unfortunately, this multi-year uncertainty and conflict between the towns and the District, as evidenced in the budget process, can give parents reason to consider other school options for their children and qualified teachers to consider looking for new positions – both of which will only make the current situation worse. However, confidence can be restored and sense of commitment increased if - as the District strives to stabilize its finances - communication with parents, students, community members, and teachers is frequent and transparent. Communication, of course, flows two ways so information can and should also be gathered from these same groups as the District moves forward. Actions 9a. Create and distribute an electronic survey to middle/high school students and electronic/paper surveys to parents to identify areas of concern to students and/or parents, and to gather positive feedback on accomplishments. Surveys should be distributed to students and parents to understand their level of satisfaction / dissatisfaction with the District. Questions should be largely kept the same over a number of years to see how responses change, but other questions could be added at times to gather input into potential actions or activities that are unique to any one or two years. Survey results should be tabulated and reported to the School Committee and be made available communitywide. 9b. Send a regular newsletter to parents keeping them informed about District activities and progress. After this report has been published and presented to the School Committee, QRSD Task Force, and community members, considerable dialog will need to take place to identify the preferred alternative(s). Fortunately, District officials report that they will be able to balance the FY2018 budget without any of the more substantial changes contemplated in this report so time is available to have such a dialog. In addition, the Division of Local Services has issued a second grant to QRSD and the towns in order to provide for facilitation services over the next year as all consider the options available, and to make the Collins Center available for additional technical assistance in support of this effort. Nevertheless, the District holds the primary responsibility for informing parents and community members about this effort and other activities that are underway in the schools. A regular newsletter could include information not only from the Superintendent, but also from different schools and programs. After an approach has been chosen, the newsletter can keep everyone involved regarding

Cost Saving Alternatives for the Quabbin Regional School District Page 57 Edward J. Collins, Jr. Center for Public Management
57
implementation progress. 9c. Allow students to have a greater say at School Committee meetings, beyond the minimum required by state law. Based on the level of student participation in the community conversations, it is clear that Quabbin HS students care deeply about their school system and are very willing to share their views. It is recommended that the District take advantage of this enthusiasm be creating opportunities for student engagement, including: a) establishing a voting seat for a Quabbin student on the School Committee; b) having Quabbin students provide regular reports to the Boards of Selectmen in each of the member communities; and, c) creating a Superintendent Student Cabinet to meet monthly with the Superintendent to provide input to budget, program, and other key issues.
REVIEW LENSES
Finance May require a modest cost to access an online survey tool and make photo copies of paper surveys.
Operations Someone in the District should be assigned to facilitate communication and outreach as a portion of their job.
Academic Increased communication can lead to new ideas to strengthen academics and greater support for the District as a whole.
Community Values Consistent with values of ‘Maximize school and community values’, Strengthen local community’, ‘Maximize District reputation’. . See Appendix B for details.
Transportation No impact
Class Size No impact
SWOT ANALYSIS
Strengths: o Regular and transparent communication is an
expectation of parents and community members across the U.S.
o Regular communication will strengthen the District and make conversations about difficult choices easier to have
Weaknesses: o Attention will need to be paid to
communicating in advance of changes, as opposed to telling people after the fact
o Staff will need to tabulate and report on survey results
Opportunities: o A regular survey will let District officials know
how they are doing and what the needs of their customers are
o Enhanced student participation on the School Committee will give committee members improved access to student ideas and will be an important leadership opportunity for student members
Threats: o A survey could result in a series of questions
and concerns that officials may wish to downplay, but should not
o Individual-specific information should not be published in survey results at the risk of demoralizing staff or committee members

Cost Saving Alternatives for the Quabbin Regional School District Page 58 Edward J. Collins, Jr. Center for Public Management
58
Recommendation 10: Engage in a multi-town visioning and planning process to develop an action plan to improve economic development and increase the number of families living in the area.
Background Just as the health and vitality of the towns is affected by the quality of education available to area students, so, too is the funding for education affected by the health and vitality of the towns. In other words, economic development, school funding and student performance, and quality of life are all interrelated. After 50 years of consistent growth in student enrollment, it is reasonable that District and town officials could not have anticipated the rapid enrollment downturn that began in 2005 and was exacerbated by the Great Recession in 2007. However, now that this is recognized, it is incumbent upon the towns and the District to not only plan for the future of the District, but do so for the towns as well. Today, QRSD is not alone in the challenges it faces with declining school enrollment – many other districts are facing similar challenges. Much of central and western Massachusetts is experiencing a decline in student population, at the same time that some districts close to the employment centers of Boston and Cambridge are experiencing rapid growth in their student enrollment. While difficult, potential exists for the five member towns to attract more families to the Quabbin area, given that the area has considerable benefits to offer including low housing costs, large homes, and a quality educational system. Many families in eastern Massachusetts are challenged by the high cost of living close to the state’s economic centers and may welcome an opportunity to relocate as long as they have access to well-paying jobs in their fields of expertise. Actions 10a. Present the findings of the Community and School Trends Report at a series of community meetings and work with participants to develop a vision for the future of the area. Based upon the vision, develop an action plan to increase the area’s attractiveness for economic development and to encourage families to move into the area. 10b. Establish a planning group with representatives from each of the five communities to review the land use plans and policies of the member towns, and analyze how they align with the community vision and support potential future economic development. The towns should consider how they could share resources to fund planning and economic development staff who can recommend amendments to zoning bylaws, market the area to employers, and facilitate permitting and development.
REVIEW LENSES
Finance As new growth increases in member towns they will have better capacity to accommodate increased spending on education and on municipal services
Operations No impact
Academic No impact
Community Values Consistent with values of ‘Maximize school and community values’,

Cost Saving Alternatives for the Quabbin Regional School District Page 59 Edward J. Collins, Jr. Center for Public Management
59
‘Strengthen local community’, ‘Make District financially sustainable’. See Appendix B for details.
Transportation No impact
Class Size No impact
SWOT ANALYSIS
Strengths: o By working together, the 5 towns can pool
resources and expertise and develop a common vision that supports economic development
o Towns can engaged in a shared marketing effort to encourage families to move to the area
Weaknesses: o May require some changes to land use
regulations to encourage increased economic growth
Opportunities: o If the towns can develop a common vision of
the type of economic development they seek and articulate that in their zoning bylaws, developers will be more likely to be able to provide it
Threats: o Will likely require change to existing policies
and some residents may not be comfortable with the change

Cost Saving Alternatives for the Quabbin Regional School District Page 60 Edward J. Collins, Jr. Center for Public Management
60
Recommendation 11: Amend the regional agreement to provide the School Committee and District administrators with authority to respond to changing enrollment and financial conditions. Background Although the Quabbin Regional School District has been in existence since 1967, in many ways it does not act as a single, unified district. This is caused by the ways in which the regional agreement constrains the School Committee’s decision making authority and the way school facilities are owned/funded, among other provisions. That said, this situation is not unique to QRSD and is, in many ways, the result of the thinking at the time the agreement was originally signed. At that time, population in the area was beginning to grow, taxing the local school districts’ ability to accommodate the growth, and the State was encouraging the regionalization of school districts. (Later, in 1974, the State began offering increased financial incentives for regional school districts.) In 1985, nearly 20 years after the District was created, New Braintree was added and all five towns’ elementary schools were incorporated into the agreement. (The QRSD was amended most recently in August 2014.) However, the District’s ability to manage elementary education is constrained in ways that its ability to manage middle and high school education is not. In an environment in which enrollment is growing these constraints may not be as impactful as they are in today’s environment of steeply declining enrollment. Specific constraints include:
o Each town owns the elementary school building within its borders and leases it to the District (Section II(A) Lease of Schools);
o Capital costs above a threshold defined in the lease are paid for by the owning town (Section II(A) Lease of Schools);
o Students will receive elementary education in the school within the town in which they live except for certain exceptions approved by the superintendent or the school committee (Section IX(A) Pupils Rights to Attend Regional School District Schools);
o Students can only attend other elementary schools if: a) their IEP requires participation in a specialized program located in another school; b) their parent has requested the transfer and the superintendent concurs; or c) the building administrator requests the transfer for the social/emotional development of the student and the superintendent concurs(Section IX(A)(1-3) Pupils Rights to Attend Regional School District Schools);
o Grades can only be transferred from one school to another if a 2/3 vote of the school committee approves the transfer after: a) at least one joint public hearing of all of the Boards of Selectmen of all of the towns; and b) at least one public hearing of the School Committee(Section IX(A)(4) Pupils Rights to Attend Regional School District Schools); and,
o A school can only be closed only after a 2/3 vote of the School Committee held after: a) at least one joint public hearing of all of the Boards of Selectmen of all of the towns; and b) at least one public hearing of the School Committee. If the vote is approved, the School Committee sends a letter to the member town and the town will hold a “single issue” special town meeting no less than 3 months, but no later than 6 months after the School Committee vote. A majority vote of the special town meeting is required to close the school.
As a result of these provisions elementary school students, and their parents, have not come together as if they were part of a single unified district in the same way that the middle/high school has. If new

Cost Saving Alternatives for the Quabbin Regional School District Page 61 Edward J. Collins, Jr. Center for Public Management
61
combined school buildings had been built in the 1980’s, the way a new high school was built in the 1960s when the original agreement was signed, then students (and their parents) from multiple communities would have had decades of experience being in the same school building. Relationships would have been built across communities as parents from multiple towns worked together on parent teacher associations and saw each other at concerts and school pickup/drop off times, for those whose children did not take the bus. And, at a time when difficult choices might need to be made, there would have been stronger bonds across towns than we have today. At the present moment, as school closings may need to be considered to stabilize the District’s finances and to continue to provide high quality education to students, the steps required in the agreement to close a school – especially the requirement that a town vote to close its own school – are very steep and do not offer the School Committee the authority to make decisions for the best of the entire student body. Ultimately, failure to take action to address the financial situation could result in declines student achievement as key supports, elective classes, and extracurricular activities are reduced and eliminated to balance the budget. Situations such as this – where a resource is held in common, but instead of acting in the common interest, individuals act in their own interest, and thereby deplete the common resource – is called a “tragedy of the commons”. Research has shown, through game-based experiments, that group dynamics can affect the outcome of such a situation. Specifically, the smaller the group is, the more likely they are to cooperate (or hold each other accountable), and that cooperation begets cooperation. So, if someone starts a series of transactions with cooperation that can multiply as participants come to trust each other.12 Other studies have found that an enforcement mechanism, or punishment, is needed to stop overconsumption of a shared resource, together with an incentive for under-users.13 Actions 11a. Modify the regional agreement to provide the School Committee with the authority to close a school with a 2/3 majority vote after a series of prescribed public hearings. A tragedy of the commons is a very real potential outcome for the QRSD situation. Having a vote a town meeting to close an elementary school is a very high threshold to cross to make what may be a critically important financial decision for the District. While possible, it will be difficult for such a vote to occur and, if it does not, and enrollment continues to decline, District resources will decline as well. Ultimately, this results in a series of budget reductions that can begin a spiral that ultimately negatively impacts student achievement. 11b. Amend the way capital costs are allocated among member towns so that all have a share in all capital expenses.
12
Johnson, Scott, “Group dynamics key to avoiding tragedy of the commons”, in ArsTechnica, June 8, 2011, retrieved from https://arstechnica.com/science/2011/06/group-dynamics-key-to-avoiding-tragedy-of-the-commons/, April 23, 2017. 13 Kareva, Irina, et als, “Preventing the tragedy of the commons through punishment of over-consumers and
encouragement of under-consumers”, Cornell University library, December 16, 2012, retrieved from
https://arxiv.org/abs/1212.3807, April 23, 2017.

Cost Saving Alternatives for the Quabbin Regional School District Page 62 Edward J. Collins, Jr. Center for Public Management
62
Under the current agreement, towns must fund all capital expenses above a certain threshold defined in the leases. This means that if a town has recently put money into a school, they have an even greater vested interest in seeing it remain open and that can negatively impact their ability to put the students’ needs ahead of the town needs. Further, if a school or schools are closed, then question exists regarding how the capital expenses in the remaining schools should be allocated. One alternative, which will need to be reviewed by the District’s legal counsel, is that those towns that do not have a school building would not pay for capital improvements. This would increase the burden on the other towns, but would provide the town(s) that experienced school closings with some financial relief. A second alternative would be to divide the capital costs based upon the students in the building, and a third alternative would be to divide them on the total districtwide enrollment at the elementary school level. 11c. Amend the way in which students are assigned to elementary schools. Theoretically, the existing provision that students are expected to attend school in the town in which they live could mean that some students are travelling farther to that school than one in another town that is closer (the project team has not done any analysis to find out if this is the case). As an alternative, students could be assigned to the school closest to their home, or parents could be allowed some choice of elementary schools, perhaps having 2 options to choose from. In any circumstance, if the policy is changed, families should be allowed to enroll younger children in the same school that their older children attend, but families who do not already have children in the school system should be expected to comply with the new provision.
REVIEW LENSES
Finance Amending the school closing process will allow the School Committee to move more expeditiously to address declining enrollment, thereby reducing expenses more quickly than the process in place today.
Operations If the school selection process was modified to allow in-district choice, staff would need to review parents’ requests and see if they could be accommodated. If students were assigned to the closest school, the bus manager would need to determine the optimal routes.
Academic See Space Use Alternatives section for details. However, in general, consolidating grades and facilities in order to have at least three sections per grade has positive benefits in terms of inclusion and ability to efficiently offer specials, such as art and music
Community Values Consistent with values of ‘Make District financially sustainable’. ‘Improve District administration’. ‘Make best use of physical infrastructure’.. See Appendix B for details.
Transportation Would be part of deliberation process for School Committee, if agreement is modified.
Class Size Would be part of deliberation process for School Committee, if agreement is modified.
SWOT ANALYSIS
Strengths: o Would make the School Committee
responsible for making hard decisions to
Weaknesses: o Towns would have to give up some autonomy
and trust that the School Committee would

Cost Saving Alternatives for the Quabbin Regional School District Page 63 Edward J. Collins, Jr. Center for Public Management
63
benefit all District children o A well-designed process would allow for
substantial parent and community input prior to making a decision
make a well thought out decision o Some town or towns may experience a school
closing
Opportunities: o Allowing the School Committee to make the
school closing decision would give the District the ability to respond more rapidly to changing enrollment
o Changing the process would help avoid the “death spiral” in which budget reductions reduce services and offerings so parents choose other schools and/or special education costs rise, which further reduces funding and results in additional costs.
Threats: o Town residents may not want to give up
authority for making a decision to close a school. And yet, when given the authority to do so, they will not likely vote in favor of closing their own school building.

Cost Saving Alternatives for the Quabbin Regional School District Page 64 Edward J. Collins, Jr. Center for Public Management
64
THIS PAGE IS INTENTIONALLY BLANK

Cost Saving Alternatives for the Quabbin Regional School District Page 65 Edward J. Collins, Jr. Center for Public Management
65
SPACE USE ALTERNATIVES
Based upon current enrollment, all schools in the Quabbin Regional School District are underutilized. Using MSBA space use ratios reveals that the District’s school inventory contains at least 71,00014 square feet and 88 classrooms more than the agency would fund under current day standards. This is equivalent to nearly the entire square footage of the Ruggles Lane Elementary School in Barre and as much as all of the classrooms in elementary school buildings combined (91 total). The amount of underutilized space will only increase if enrollment projections- which anticipate continued declines in the student population - are correct. The costs to the District for such an expansive physical plant are not just constrained to facilities-related expenses, such as oil/gas, electricity, and capital expenses. They also include considerable personnel costs as each school has its own administrative staff, and teaching staff is larger than it would be if students were co-located and classrooms could be consolidated to reach the District’s target for the minimum number of seats. Special education costs are also higher because fewer inclusion opportunities are available as a result of the small class sizes and the limited number of classrooms per grade per school. (As can be seen below, QRSD presently has 118 classroom teachers, including special education teachers working in substantially separate classrooms.) Mentorship opportunities for new teachers are limited by the fact that in many instances there are only two classrooms per grade per school. Ultimately, student performance can suffer as teachers cannot communicate efficiently across grade levels to identify and address trends in student learning. Further, a level of inequity exists among the schools as class size varies from school to school.
Space Needs by Students per Classroom
Schools 10/16 Enroll
# Class-
rooms15
Classroom Need (MSBA) Classroom Use (QRSD)
Classrm needed
# Above Stand
% Above Stand
Classrms Used
Classrms Unused
Actual: Used
Ruggles Lane (Barre) 368 28 16.0 12.0 175% 19 9 147%
Hardwick Elem 194 14 8.4 5.6 166% 13 1 108%
Hubbardston Center 316 22 13.7 8.3 160% 17 5 129%
New Braintree 108 8 4.7 3.3 170% 6 2 133%
Oakham Center 149 19 6.5 12.5 293% 11 8 173%
Middle School 424 36 18.4 17.6 195% 21 15 171%
High School 689 59 30.0 29.0 197% 31 28 190%
TOTAL 2,248 186 97.7 88.3 190% 118 68 158%
14
The amount of space may be even greater than presently calculated if the middle/high school square footage numbers represent net square feet instead of gross square feet as the project team believes. If this is the case, then the amount of unused space at the middle/high school would grow to around 35,000 s.f., and the district-wide figure would increase to approximately 89,500 sf. Due to the net vs gross question, for the remainder of this analysis, the number of classrooms available will be used to determine if a school is fully utilized or underutilized as opposed to square footage. 15
Total number of classrooms reduced from 192 (included in original trends report) to 186 to align with District space calculations. Specifically, rooms dedicated to art, music have been taken out of the calculations.

Cost Saving Alternatives for the Quabbin Regional School District Page 66 Edward J. Collins, Jr. Center for Public Management
66
The District and member towns have an extremely difficult challenge before them which is to develop a space use solution that will stabilize the District financially and provide the greatest benefits to the students. Failure to do so will only continue to drain District resources away from the classroom and into administrative, facility, and transportation costs. At least four of the principles developed by the Collins Center address the use of space in District facilities and how spending on facilities affects other budget categories. These principles include:
• Maximize funding spent in classroom; • Use space efficiently and use the best space first; • Place students at the center of all decisions; and, • Provide 3+ classrooms per grade per school.
It is with these principles in mind that the project team developed the space use alternatives included in this report. Using limited financial and human resources to support underutilized buildings is inconsistent with the principle of maximizing funding in the classroom, using space efficiently and the best space first, and placing students at the center of all decisions. In addition, depending on how underutilized a building is, it may not fulfill the fourth principle which is to provide 3+ classrooms per grade. A series of community values were identified that are clearly associated with this difficult decision. These include: “Make District financially sustainable”, “Improve District administration” and “Make best use of physical infrastructure”. Moreover, one could argue that outcomes associated with the choice of any of these space use alternatives should be evaluated on the basis of metrics derived from the community conversations, such as “Educational outcomes”, “Level of financial resources” and “Class size”, as presented in Appendix B.
Where Students Live
The Districts two largest elementary schools (Ruggles Lane and Hubbardston Center) are located in the northern half of the five-town area. This is consistent with 2010 Census data (see next page) which shows large number of children across much of Hubbardston, clustered near the centers of Hardwick, New Braintree, and Oakham, and in Barre center and along the town’s north-south axis. (The Census data should be used with some caution as it is somewhat challenging to interpret as the census blocks are not all the same size and the data is several years old at this point.) The one outlier is a block in Hardwick off of Old Petersham Road; this is the location of the Eagle Hill School which is a residential private school. The students are recorded by the Census as living on this block, but they do not attend QRSD schools and will not therefore be considered as part of the alternatives analysis. Since the schools have been reconfigured, the kindergarten through 6th grade students at New Braintree and Oakham elementary schools come from both towns. However, the pre-K students come from across the District. As a result, if the pre-K numbers are taken out, New Braintree and Oakham combined have 195 students, a figure that is equivalent to the Hardwick enrollment. New Braintree and Oakham experienced the greatest declines in youth population between 2000 and 2010, but more recent data is not available so it is not possible to see if this trend has changed.

Cost Saving Alternatives for the Quabbin Regional School District Page 67 Edward J. Collins, Jr. Center for Public Management
67

Cost Saving Alternatives for the Quabbin Regional School District Page 68 Edward J. Collins, Jr. Center for Public Management
68
School Enrollment and Residents Enrolled per Grade (S2017)
Ruggles Lane (Barre) Hardwick Elem Hubbardston Center New Braintree Oakham Center TOTAL
Grade Total Resid Diff Total Resid Diff Total Resid Diff Total Resid Diff Total Resid Diff Total Resid Diff
K 39 35 4 19 18 1 46 36 10 19 8 11 10 -10 123 107 16
1 54 53 1 28 26 2 39 35 4 24 7 17 15 -15 145 136 9
2 58 58 0 24 22 2 45 41 4 12 -12 28 13 15 155 146 9
3 57 57 0 34 32 2 50 41 9 8 -8 26 13 13 167 151 16
4 43 42 1 32 27 5 42 33 9 12 -12 29 15 14 146 129 17
5 61 56 5 28 29 -1 46 36 10 9 -9 29 22 7 164 152 12
6 56 59 -3 29 26 3 48 47 1 13 -13 37 14 23 170 159 11
Total 368 360 8 194 180 14 316 269 47 43 69 -26 149 102 47 1,070 980 90
Pre-K Enrollment by Town
Barre Hardwick Hubbardston New
Braintree Oakham
29 10 7 7 13

Cost Saving Alternatives for the Quabbin Regional School District Page 69 Edward J. Collins, Jr. Center for Public Management
Assumptions
The alternatives below do not project any declines in student enrollment resulting from the changes under consideration. The reason for this is multifold. First, there is no way to accurately project how many families will make a choice to enroll their children elsewhere in response to QRSD changes and how many will return. Second, the ability to transfer a student to another district is contingent upon seat availability in another district, availability that varies year to year. Additional assumptions include: 1. Students were relocated as a group in alternative(s) where their home school is closed (with the
exception of the Ruggles Lane closure alternative) – this is done so that calculations of space use can be made for each alternative. However, this does not mean that upon implementation the District will relocate these students one-for-one to the receiver school identified in the alternative. The District could elect to allow parents to choose among schools or could adopt a policy that each student is to attend the school closest to their home. Either way, the alternatives have been developed to ensure that sufficient classroom space remains to accommodate enrollment.
2. Additional bus routes will be added where needed to keep trips for elementary school students to one hour or less each way – the cost of a new bus route is $30,500 in FY2017, of which approximately 70% ($21,350) will be reimbursed by the State in the 2nd year of operation. Transportation impacts will be discussed under each alterative and where new bus routes are anticipated, the cost is already incorporated into the net cost saving estimates. However, final number of buses and their routes will be decided by the District at a much more fine grained level than could be produced by the project team. Nevertheless, the cost of adding more buses is not cost-prohibitive to any of the alternatives included in this report.
3. Calculations of classroom availability will shift from MSBA ratios to actual space availability – the MSBA standards were used to determine if District facilities were underutilized relative to neutral ratios used across the state. However, to determine if schools have capacity to accommodate the enrollment changes under consideration in the various scenarios, it is critical to use local information about room availability. In order to allow the project team to do so, QRSD staff has been extremely helpful by generating a series of spreadsheets looking at classroom availability, including rooms for substantially separate programs, and class size implications for the alternatives. Those calculations will be used here forward in this report.
Format of Alternatives Analysis
The alternatives analysis will be divided into three subsections – alternatives to increase enrollment at the middle/high school, alternatives to consolidate elementary school students, and alternatives not included for consideration. Each section will begin with some background data and then each alternative will be described and will be reviewed through the lenses of finance, operations, academics, and community values. Information will be provided regarding transportation impacts and anticipated classroom sizes and the strengths, opportunities, weaknesses, and strengths (SWOT) of each will be identified.

Cost Saving Alternatives for the Quabbin Regional School District Page 70 Edward J. Collins, Jr. Center for Public Management
Each alternative will include a one sentence description at the top, along with relevant data such as savings anticipated in Year 1 of implementation and long term
savings (since unemployment payments will decline and state transportation reimbursement will be in place in Year 2 and subsequent years savings will increase in Year 2). It will identify the number of classrooms used versus available at the level (e.g., elementary school, middle school, and high school), and total utilization districtwide. The number of bus routes added as part of the cost savings calculations will also be specified. Small maps will be included with each elementary school alternative and will identify the schools that will remain open under each.
Alternative XX: Relocate ____ to ____ school.
Year 1 Savings
Long Term Savings/Yr
Classrooms Used
District Utilization
Bus Routes Added

Cost Saving Alternatives for the Quabbin Regional School District Page 71 Edward J. Collins, Jr. Center for Public Management
ALTERNATIVES TO INCREASE ENROLLMENT AT QUABBIN REGIONAL MIDDLE/HIGH SCHOOL With 95 classrooms, the Quabbin Regional Middle/High School (QRMSHS) is the District’s single largest building. It is also more centrally located than other schools in the five-town area and has many educational amenities including 15 science labs, 5 computer labs, 4 art rooms, 2 music rooms, a 5,000 square foot library, two gyms – one for each school, and a 450 seat auditorium. In 2012, $3.6 million in local and MSBA funding was invested in the building to replace the roof. Since the school provides the best quality space for academic learning of all facilities, three alternatives were developed that increase the number of students attending that school and take it from being underutilized to being more fully utilized. These alternatives include:
Alternative A: Transfer 6th graders to the middle school portion of the building;
Alternative B: Transfer 5th and 6th graders to the middle school portion of the building; and,
Alternative C: Create a “comprehensive” high school that includes academic and vocational programming.
Enrollment Implications
Under Alternatives A and B, middle school enrollment would increase to either 594 or 758 students, respectively. Although Alternative B enrollment is higher than the 2005 peak when the facility contained 572 middle schoolers, it is still within the MSBA ratio of classrooms per student and, if needed, some rooms could be reallocated from the high school to the middle school to provide additional classrooms as discussed below.
Potential Enrollment for Quabbin Regional Middle School (Alternatives A-B)
Existing Alternative A Alternative B
Grades 7-8 6-8 5-8
Enrollment 424 594 758
Classrooms needed 21 28 36
Classrooms available 36 36 36
Underused 15 8 0
Quantifying the enrollment implications at the high school is much more difficult, and enrollment changes will likely occur over a longer period of time as different vocational programs are added, as the District markets its high school offerings to middle school students (see Recommendation 2), and as it enhances special education services and brings more students in-district (see Recommendation 1). District data indicate that 270 9th to 12th graders who live in one of the five towns attend school elsewhere in SY2017. These include:
59 students using school choice to attend other academic high schools (of these, 5 attend an online school);
116 students at Montachusett Regional Vocational Technical School;
42 students at Pathfinder Regional Technical High School;
23 students who are home-schooled;

Cost Saving Alternatives for the Quabbin Regional School District Page 72 Edward J. Collins, Jr. Center for Public Management
29 students at out-of-district special education placements;
1 student at a “referral services school”; and,
6 residents of the Stetson Home who do not attend QRSD schools. Separate and apart from the figures above, 148 students who live in other communities have elected to attend QRHS in the current school year through the school choice program. This figure could also grow as the District enhances the offerings at the high school. That said, the District has the ultimate authority about whether to accept school choice students and how many as each year they identify the number of seats and grades to be made available based upon anticipated enrollment. The project team does not have the ability to anticipate how many town residents would continue to QRHS if enhancements are made as identified in the best practices recommendations and space use alternatives. However, it is clear that per QRSD space use figures, 28 out of 59 classrooms in the high school are underutilized today so space is available for growth while also allowing some of the rooms presently dedicated to the high school to be transferred to the middle school if needed, and to be able to contemplate some of the vocational programs that need a lot of space. Note that classroom calculations for the high school are essentially tabulating the number of home rooms, since the students move from classroom to classroom each day. The District uses a range of 20-25 students per classroom for the high school and some hypothetical enrollment increases are shown below.
Potential Enrollment for Quabbin Regional High School (Alternatives C)
(22 students per classroom on average)
Existing Low High
Grades 9-12 9-12 9-12
Enrollment 689 789 889
Classrooms needed 31 36 40
Classrooms existing 59 59 59
Underused 28 23 19

Cost Saving Alternatives for the Quabbin Regional School District Page 73 Edward J. Collins, Jr. Center for Public Management
Alternative A: Relocate 6th graders to the middle school.
Year 1 Savings
Long Term Savings/Yr
Classrooms Used
District Utilization
Bus Routes Added
$59,931 $110,706 28/36 62% 1
Description In this alternative, 6th graders from four elementary schools (New Braintree serves pre-K to first grade) will be reassigned to the middle school. This will include a total of 164 students who would occupy seven classrooms with 23-24 students each. Two students who are in substantially-separate classrooms will also be relocated. Cost savings from this alternative are modest, but relocating the 6th graders will better utilize the space available at the middle school and will make space available to reduce the number of elementary schools, as will be seen in the alternatives that follow. Savings come from the reduction of two classroom teachers together with associated benefits. From an academic perspective, instruction in the 6th grade could take place in a middle school structure, (i.e., students will transfer among classrooms for part of their instruction) or instruction could continue in an elementary school format (i.e., students remain with their classroom teacher except for specials such as art and science). Middle schools across the country that include 6th grade utilize a variety of structures for different grade levels, subject to the curriculum and programmatic goals of the district. Specifically, there is no one “right way” to do 6th grade (with respect to self-contained classrooms v. subject area specialty teachers). District officials have already expressed some hesitancy regarding this alternative based upon an understanding that some teachers will require different licenses if the 6th grade is moved to the middle school. However, the 6th grade could continue to operate in an elementary school structure or the District could seek short-term waivers for elementary licensed teachers (if they were to decide to operate in a subject-specific manner). Another alternative that would enable this approach would be to move subject certified teachers to the 6th grade and transfer the current 6th grade teachers who are elementary certified. Still another possibility is a hybrid approach, including tenents of the models described above. However, if 6th grade were to operate on a different schedule from the 7th and 8th graders, the District would need to be cognizant of the impact on specialist (art, music, physical education, etc.) schedules. For example, if the middle school operates 45 minute period and elementary students receive something less for their specials, the schedules of specialists could be complicated and it is possible that additional staffing could be required. All of these issues can be overcome with appropriate planning, partnership with teachers, parents, and the appropriate unions, and a creative problem solving approach. In terms of transportation it was assumed that, in the larger towns of Barre and Hubbardston, an existing elementary bus would be converted to a middle/high school route to provide additional capacity needed to transport the 6th grade students along with the other students. However, in the other towns, existing middle/high school routes may be able to accommodate the additional pupils. Cost estimates for this alternative include the addition of one more bus route to provide flexibility to the District as it considers what transportation changes are needed. Even if a second route was needed, the net cost would only be approximately $9,100 per bus per year (the total cost per bus is $30,500, but 70% of this will be eligible for reimbursement after the first year) so an additional route could be added and savings would still be realized.

Cost Saving Alternatives for the Quabbin Regional School District Page 74 Edward J. Collins, Jr. Center for Public Management
This alternative will not fully utilize the space available in the middle school. Collectively, this alternative will use 28 classrooms (25 classrooms for regular education and 3 classrooms for special education) out of the 36 available for use.
REVIEW LENSES
Finance While this alternative in itself will offer limited savings, it will create the opportunity to close one or more elementary schools with the potential for up to $1.56 million in savings.
Operations Some space in the middle school section of the building may need to be reassigned to accommodate the 6th grade classrooms. School administrators will have a larger student body to support. No administrative staff increases are contemplated in this alternative.
Academic This approach could add a number of positive elements to the middle level program including multiple classes per grade and ability for 6th grade teachers to collaborate on curriculum improvements. In addition, research on middle schools suggests that these schools should be at least three grades (allowing for at least one grade in the middle that provides the “glue” or continuity for the building).
Community Values Consistent with values of ‘Make District financially sustainable’, ‘Make best use of physical infrastructure’, and ‘Increase enrollment’. See Appendix B for details.
Transportation
As described above, the cost estimate includes the addition of one bus route, with existing middle/high routes in Hardwick, New Braintree, and Oakham to be reviewed to determine if they have capacity for 6th graders as is. It is assumed that one route each in Barre and Hubbardston will be converted from an elementary to a middle school route. From a student perspective, the middle school is centrally located in the five-town area and the students will be taking these same routes starting in 7th grade – this alternative moves that to earlier in their student career.
Class Size
Classes will be between 23-24 students each which is within the District’s target of 20-25 students per class for middle school classrooms. 6th grade class sizes presently range from an average of 14.5 students (Hardwick) to 23.5 (Hubbardston).
SWOT ANALYSIS
Strengths: o Will increase activity level and vitality at QRHS o No capital improvements anticipated o May encourage more students to stay with the
district for high school o Centrally located school has sense of
ownership from all communities o Will reduce the number of excess classrooms
at the middle school from 15 to 8 o Will allow 6th grade teachers to more easily
collaborate to enhance the curriculum o Offers seven 6th grade classrooms which will
allow ample opportunity for inclusion and the
Weaknesses: o Potential exists for some teachers to need new
licenses. District may need to offer technical and/or financial assistance to teachers as they prepare for required tests
o 6th graders will arrive at school earlier than they do at the elementary schools today
o Some students may have longer bus trips to school, although some mitigation is possible with route design

Cost Saving Alternatives for the Quabbin Regional School District Page 75 Edward J. Collins, Jr. Center for Public Management
more efficient offering of “specials” such as science, art, music, etc.
o Allows the District to decide the format that will best benefit 6th graders – either a middle school format, an elementary school format, or a combination of both
Opportunities: o 6th graders can participate in MS and HS
extracurricular activities, as deemed appropriate
o High schoolers can tutor or mentor younger students
o Ability to enliven QRMSHS by using spaces more fully
Threats: o Some teachers may not be interested in taking
additional testing needed for middle school licenses. Accommodations may be needed to allow them to transfer to a lower grade

Cost Saving Alternatives for the Quabbin Regional School District Page 76 Edward J. Collins, Jr. Center for Public Management
Alternative B: Relocate 5th and 6th graders to the middle school.
Year 1 Savings
Long Term Savings/Yr
Classrooms Used
District Utilization
Bus Routes Added
$74,648 $161,484 36/36 62% 2
Description In this alternative, 5th and 6th graders from across the district will be reassigned to the middle school. This will include 164 6th graders who would occupy 7 classrooms and 165 5th graders who would occupy an additional 7 classrooms. Class sizes for both grades would be 23-24 on average. A Language Based Program would have to be instituted at the middle school and would serve five students who are presently at Hubbardston Elementary. Cost savings from this alternative are slightly larger than Alternative A which only relocates the 6th grade. Considerable space will be made available at the elementary schools, allowing for a number of alternatives to be feasible that would not be possible when only moving the 6th grade. Savings come from the reduction of three teachers together with associated benefits. With regard to teacher licensure, since the 5th and 6th grades would be relocating to the middle school facility at the same time, it will be more likely that the District will continue to use the elementary school model, where students stay with the teacher for the majority of the day, instead of converting to a middle school model. This would reduce the need for teachers to secure new licenses for the middle school. The transportation impacts will be very similar to the description above under Alternative A. However, funding for 1 additional bus route has been added to the savings calculations. Again, if more routes are needed, the cost is nominal compared to the savings. This alternative will fully utilize the classrooms available in the middle school.
REVIEW LENSES
Finance While this alternative in itself will offer limited savings, it will create the opportunity to close one or more elementary schools with the potential for up to $1.56 million in savings.
Operations Some space in the middle school section of the building may need to be reassigned to accommodate the 5th-6th grade classrooms. School administrators will have a larger student body to support. No administrative staff increases are contemplated in this alternative.
Academic This approach would make it more likely that the District could continue to utilize an elementary schedule for both 5th and 6th grades, leading to less potential difficulty for specialist teacher schedules. In addition, it would provide 5th and 6th grade teachers with a significant elementary cohort for planning, sharing, and collaborating.
Community Values Consistent with values of ‘Make District financially sustainable’, ‘Make best use of physical infrastructure’, and ‘Increase enrollment’. See Appendix B for details.
Transportation The cost estimate includes the addition of two bus routes, with existing

Cost Saving Alternatives for the Quabbin Regional School District Page 77 Edward J. Collins, Jr. Center for Public Management
middle/high routes in Hardwick, New Braintree, and Oakham to be reviewed to determine if they have capacity for 5th-6th graders as is. It is assumed that one or more routes in Barre and Hubbardston will be converted from elementary to a middle school routes. From a student perspective, the middle school is centrally located in the five-town area and the students will be taking these same routes starting in 7th grade – this alternative moves that to two years earlier in their student career.
Class Size
Classes will be between 23-24 students each which is within the District’s target of 20-25 students per class for middle school classrooms. 6th grade class sizes presently range from an average of 13 students (5th grade in Oakham) to 23.5 (6th grade in Hubbardston).
SWOT ANALYSIS
Strengths: o Will fully utilize classrooms at QRMS – based
upon SY2017 enrollment o No capital improvements anticipated o May encourage more students to stay with the
district for high school o Centrally located school has sense of
ownership from all communities o Will reduce the number of excess classrooms
from 15 to 0 o Will allow 5th and 6th grade teachers to more
easily collaborate to enhance the curriculum o Offers seven 5th and 6th grade classrooms each
which will allow ample opportunity for inclusion and the more efficient offering of “specials” such as science, art, music, etc.
o Allows the District to decide the format that will best benefit 6th graders – either a middle school format, an elementary school format, or a combination of both
Weaknesses: o Depending on the structure selected, potential
exists for some 6th grade teachers to need new licenses. District may need to offer technical and/or financial assistance to teachers as they prepare for required tests
o 5th and 6th graders will arrive at school earlier (7:30 am) than they do at the elementary schools today
o Some students may have longer bus trips to school, although some mitigation is possible with route design
Opportunities: o Students may be able to participate in MS and
HS extracurricular activities, as deemed appropriate
o High schoolers can tutor or mentor younger students
o Ability to enliven QRMSHS by using spaces more fully
Threats: o Some teachers may not be interested in taking
additional testing needed for middle school licenses. Accommodations may be needed to allow them to transfer to a lower grade

Cost Saving Alternatives for the Quabbin Regional School District Page 78 Edward J. Collins, Jr. Center for Public Management
Alternative C: Create a “comprehensive” high school that includes academic and vocational programming.
Year 1 Savings
Long Term Savings/Yr
Classrooms Used
% Utilized Bus Routes Added
TBD TBD TBD TBD TBD
Description This alternative expands upon two best practice recommendations including markets high school offerings to middle school students (see Recommendation 2), and enhance special education services and brings more students in-district (see Recommendation 1), but will require an even greater commitment by the District for implementation, with greater risks of failure. Under this alternative, the QRHS would become a comprehensive high school that incorporates strong academic and strong vocational/technical programs with the hope that this would encourage area residents to choose QRHS and that students from other communities would .do so as well, thereby leading to increases in enrollment that (at least partially) offset the cost of the new programming. Beginning in the 1960s, with an eye to providing vocational education in an efficient and cost-effective manner, Massachusetts moved to a model where vocational/technical schools are distinct and separate from academic high schools, although combined schools are common elsewhere in the U.S. and some can be found in Massachusetts including Medford and Somerville. The State has placed constraints on academic high schools and makes it more difficult for them to offer vocational programming that is already available at vocational schools in the vicinity. Some of the programmatic areas not addressed at Monty Tech or Pathfinder include biotechnology and environmental technology. In addition, the project team has recently learned that Pathfinder is closing their plumbing program. QRHS students who participated in the community conversations expressed a strong desire to be able to take vocational classes and learn “practical skills” as part of their high school education and were particularly frustrated by the fact that the community conversation was held in a room immediately adjacent to a wood shop space that is no longer in use. They anecdotally mentioned students they knew who elected to attend a vocational school because they were not able to get that kind of instruction at QRHS. While this alternative offers potential benefits to the District and students, careful analysis is warranted. Specific actions recommended include: o Continue conversations with Montachusett Vocational School regarding shared programming. While
programming that would allow Quabbin students to access their vocational programs after school are important and should be pursued, that will not be likely to substantially change enrollment patterns. Creation of a true satellite program at QRHS would offer instruction during the school day. One potential might be a plumbing program, created in partnership with Monty Tech, to attract students who will no longer be able to access this programming at Pathfinder Vocational School. Monty’s plumbing program is completely subscribed, so they may be willing to work with QRSD on this.
o Consider possible partnerships with Smith Agricultural School (given that students from some of the Quabbin member towns have indicated an interest in attending that school) to see if it would be possible to create partnership programs located at Quabbin (or, at least, closer to the school system).
o Perform a detailed cost benefit analysis of any vocational program under consideration, taking into account the program’s unique operating and capital costs, along with the extent of space needed. The

Cost Saving Alternatives for the Quabbin Regional School District Page 79 Edward J. Collins, Jr. Center for Public Management
District should identify specific enrollment targets required to make implementation financially worthwhile and survey students/parents to determine the level of interest that exists. A strong discount factor should be applied to survey results as people often express interest in something in concept but do not actually participate when the opportunity actually exists.
Another idea in this same vein is to continue conversations regarding potential articulation agreements with Mount Wachusett Community College, where college level classes would be offered locally. This will not likely permanently occupy underutilized classroom space, as the classes would likely be held in the evenings, but it could increase student and community enthusiasm for the school.
REVIEW LENSES
Finance The financial implications of this alternative cannot be calculated at present; detailed analysis will be needed for each potential vocational program under consideration. Overall, the concept is to increase District revenues by encouraging more students to attend QRHS, but careful attention will need to be paid to potential capital and operating costs. Capital costs include the purchase of equipment and reconfiguration of building space. Towns may receive savings in vocational assessments as more students attend school locally.
Operations This alternative could have significant implications for operations as vocationally-trained administrators and instructors will need to be hired, and space allocated for the vocational programs.
Academic Creating partnership programs with Montachusett Vocational School could add programs of high interest and need at QRHS. Many students find that the hands-on approach offered through vocational programming resonates and improves academic outcomes.
Community Values Consistent with values of ‘Make District financially sustainable’, ‘Make best use of physical infrastructure’, and ‘Improve in-school experience’. See Appendix B for details.
Transportation Reduced travel time for students who attend QRHS instead of a vocational school elsewhere.
Class Size If high school enrollment is increased some class sizes may be increased, but other new classes may be offered.
SWOT ANALYSIS
Strengths: o Has the potential to attract new students to
QRHS and retain middle school students transitioning to the high school
o Will increase offerings for current students o Current students expressed an interest in
learning tangible skills such as those offered at a vocational program
o Participation in vocational classes may help college-bound students distinguish themselves in the application process
o Grant funding is available to expand vocational offerings
Weaknesses: o Will require considerable upfront costs
including staff time to evaluate the potential develop curriculum, and market the program(s), as well as capital costs to ensure that space is properly outfitted for the new classes
o QRHS has been an academically focused school for many years, will administrators be equipped to facilitate the transition to a new model
o If enrollment is too low, vocational programs could increase the District’s financial difficulties

Cost Saving Alternatives for the Quabbin Regional School District Page 80 Edward J. Collins, Jr. Center for Public Management
Opportunities: o QRHS could become a major draw within the
region o Students who appreciate hands on learning
could be energized by new classes
Threats: o If other District financial pressures are not
addressed successfully, including the cost of special education and underutilized space, the addition of new (and potentially costly) programming could dramatically speed up the “death spiral” of budget cuts and lowering enrollment.

Cost Saving Alternatives for the Quabbin Regional School District Page 81 Edward J. Collins, Jr. Center for Public Management
ALTERNATIVES TO CONSOLIDATE ELEMENTARY SCHOOL STUDENTS After either 6th graders or 5th and 6th graders are relocated to the Quabbin Regional Middle School, fewer students will remain at the elementary schools and they can be consolidated to increase building utilization and reduce costs. However, such a consolidation will not only offer operational and financial benefits, it will also provide multiple academic benefits. Although all QRSD schools are rated as Level 2 by the State, in 2011, MCAS test results began to fall in English Language Arts (-3 percentage points on a 100 point scale) Math (-2), and Science (-4). This could be the beginning of an undesirable trend and steps will need to be taken to improve scores. Academic benefits from elementary school consolidation include:
Student to teacher ratios can be better equalized among schools so that students at the same grade have more or less equal class sizes.
Class size can be better equalized within a single school. Specifically, schools with 1-2 sections per grade level often see more variation among class sizes than schools of 3+ sections where variations can be more easily accommodated.
Generally speaking, schools with 3+ sections per grade level are able to offer a more varied program of special programs and extra-curricular activities than smaller schools.
Regular education supports (Tier 2 and 3) are more evenly distributed in schools with three sections per grade level than in smaller buildings, where these services are often part-time or shared between buildings.
Opportunities for inclusion, along with the resulting savings in special education costs, are more feasible in a school that offers at least three classrooms per grade level. Having fewer than three classes per grade level makes this more difficult because of increased variance in class sizes and less availability of appropriate supports in smaller schools (particularly regular education supports).
Districtwide special education programs and pre-kindergarten can potentially be relocated more centrally within the district, ideally reducing travel time for some students, and in larger buildings. At present, it appears that in some instances the District may have located special education programs in buildings with very low occupancy so that it can comply with the Regional Agreement.
Eleven elementary school consolidation alternatives were developed including five single-building alternatives, in which one elementary school is closed in each, and six multi-building alternatives in which 2-3 schools are closed. To make space at the elementary school level, the alternatives require that either 6th graders be relocated to the middle school (identified with an “A” in the title) or 5th and 6th graders be relocated (identified with a “B” in the title). Single Building Alternatives
o Alternative A1: Close Ruggles Lane (Barre) Elementary School o Alternative A2: Close Hardwick Elementary School o Alternative A3: Close Hubbardston Center Elementary School o Alternative A4: Close New Braintree Elementary School o Alternative A5: Close Oakham Center Elementary School
Multi-Building Alternatives
o Alternative A6: Close the Hubbardston and New Braintree elementary schools. o Alternative A7: Close the New Braintree and Oakham elementary schools. o Alternative A8: Close Hardwick and New Braintree elementary schools. o Alternative A9: Close Hardwick, New Braintree, and Oakham elementary schools.

Cost Saving Alternatives for the Quabbin Regional School District Page 82 Edward J. Collins, Jr. Center for Public Management
o Alternative B10: Close the Hardwick, Hubbardston, and New Braintree elementary schools. o Alternative B11: Close Hardwick, New Braintree, and Oakham elementary schools.
In every alternative described below, dedicated rooms are still available to offer “specials”, e.g., art and music, and special education. Student enrollment by grade and school, effective October 1, 2016, and the number of classrooms per school building are identified below.
Elementary School Students by Grade and School (2017)
PK K 1 2 3 4 5 6 Total Class-
rooms #
Used
Ruggles Lane (Barre) 39 54 58 57 43 61 56 368 28 19
Hardwick Elem 19 28 24 34 32 28 29 194 14 13
Hubbardston Center 46 39 45 50 42 46 48 316 22 17
New Braintree 6516
19 24 108 8 6
Oakham Center 28 26 29 29 37 149 19 9
TOTAL 65 123 145 155 167 146 164 170 1,135 91 64
At present, 64 of 91 classrooms are used by the District for educational purposes, including rooms dedicated to special education, but excluding specialist rooms which are used for art, music, etc. Based upon number of classrooms, this represents a 70% utilization rate, but this does not take into account the fact that many classes are undersubscribed and are well below the District’s targets for the minimum number of students.
16
Includes students from across the five-town area.

Cost Saving Alternatives for the Quabbin Regional School District Page 83 Edward J. Collins, Jr. Center for Public Management
Single-Elementary School Alternatives
Alternatives A1 to A5 require the relocation of 6th graders to the middle school (Alternative A) and close one elementary school each. They are conveyed in alphabetical order by the town in which the school is located. The first step in creating these alternatives was to take the 6th grade classrooms out of all elementary schools, except for New Braintree, which only includes pre-K to 1st grade. This reduces the utilization of the elementary schools from 73% today (this figure is only so high because of the small class sizes that exist because the elementary school students are not consolidated) to 63%. After this, each alternative removes one elementary school at a time and transfers those students to another school and quantifies the number of classrooms needed and compares that to the number of classrooms available.
Classroom Utilization Rates for Single Building Closure Alternatives (Alternatives A1-A5)
# Classrms
in Bldg
2017 Use
(QRSD)
Classes after Alt A
A1 Close Ruggles
A2 Close Hardwick
A3 Close Hubb’stn
A4 Close N Braintree
A5 Close Oakham
Ruggles Lane (Barre) 28 19 16
22 28 16 22
Hardwick Elem 14 13 11 11
11 11 11
Hubbardston Center 22 17 15 20 15
15 15
New Braintree 8 6 6 7 6 6
6
Oakham Center 19 11 9 14 9 10 15
Classrooms Used
66 57 52 52 55 57 54
Classrooms Avail 91 91 91 63 77 69 83 72
Unused Classrooms
25 34 11 25 14 26 18
Elem Utilization
73% 63% 83% 68% 80% 69% 75%

Cost Saving Alternatives for the Quabbin Regional School District Page 84 Edward J. Collins, Jr. Center for Public Management
Alternative A1: Close Ruggles Lane (Barre) Elementary School.
Year 1 Savings
Long Term Savings/Yr
Elem Classrooms Used Bus Routes Added Number Percent
$606,679 $816,874 52/63 83% 3
Description This alternative would close the Ruggles Lane Elementary School in Barre, the single largest school by enrollment and number of classrooms in the building. It is associated with Alternative A (relocate 6th graders to the middle school) and along with A1-A9, is made possible by the relocation of the 6th graders. All other “A” alternatives, other than this one, relocate students as a group from one school to another, but due to the size of the student body, no other district school has the physical capacity accept all of the Ruggles Lane students. Instead, in this alternative the students will be divided between the Hubbardston, Oakham, and New Braintree Elementary schools in varying numbers. In 2012, the Commonwealth and the Town of Barre invested $2.8 million on the installation of a new roof at the school, together with new windows and doors. In the current school year, 330 residents of the Town of Barre are enrolled in the pre-K to 5th grades. Savings in this alternative will be generated by reducing administrative positions, facility- and technology- related positions and expenses including school custodians, and reducing five additional teacher positions (two other are reduced in Alternative A due to the ability to consolidate 6ht grade classrooms). The savings estimates allow a portion of the administrative and facility positions to be redeployed to other schools which will then have more students and activities to support. Ruggles Lane does not have any substantially separate classrooms for students with disabilities, so those students will not be affected. In this alternative, the Hubbardston and Oakham schools will have at least 3 classrooms per grade while Hardwick and New Braintree will continue with two classrooms per grade. Class sizes at Hardwick will continue to be very small (e.g., 12-14 students on average in kindergarten and 1st grade) because no students are added to that school in this alternative. Class sizes in Hubbardston and Oakham will be around 21-22 students per class. The elementary school utilization rate will increase to 83% because if Ruggles Lane was closed, the inventory of elementary classrooms would go down by 28 – greatest of all elementary schools – so the number unused would fall sharply to 11 unused. Since Ruggles Lane is the most centrally located elementary school and the largest, and the students that are presently enrolled there would be reassigned to one of several different schools, this alternative will have considerable transportation impacts. Seven existing bus routes presently bring elementary school students to the Barre site, and funding for an additional three is incorporated into the cost savings calculations to provide the District with additional flexibility. A greater number of students will need to travel from Barre to New Braintree than do today (Barre pre-K students currently attend New Braintree and bus NBE1-pm travels nearly 25 miles to drop off on Barre Road (Rt2) near Rockingstone Park Road – an estimated 61 minute trip). A decision would need to be made regarding how students would be reassigned and whether parents could request what school they wanted their child to attend. A process of honoring parental requests may be difficult given the number of bus routes that would be in effect and the fact that students would be travelling in several different directions.

Cost Saving Alternatives for the Quabbin Regional School District Page 85 Edward J. Collins, Jr. Center for Public Management
REVIEW LENSES
Finance Since the Ruggles Lane school is so large, this alternative will have the greatest savings of all of the single-building alternatives. However, the savings will be less than nearly all of the two-building alternatives. Transportation cost will increase as three new buses have been added to this alternative.
Operations This will relocate at least 16 teachers to other schools in the district. They will be farther away from the District’s administrative offices and the middle/high school which can affect communication which could impact efficient communication and access to teacher training. Travel time for any specialist teachers or other support services may go up, if they have to cover multiple schools
Academic Consolidation of students to provide three or more classrooms per grade can offer multiple benefits described earlier.
Community Values Consistent with values of ‘Make District financially sustainable’, ‘Make best use of physical infrastructure’, and ‘Increase enrollment’. See Appendix B for details.
Transportation
The District will likely have to redesign the existing routes that feed this school and add more routes since students will be divided among three schools in this alternative. Travel time for students will increase especially for those assigned to New Braintree. Funding for three additional buses is included.
Class Size Classrooms at Hubbardston and Oakham will reach District minimum targets, while Hardwick will remain below target.
SWOT ANALYSIS
Strengths: o Improves overall elementary classroom
utilization by eliminating 28 classrooms at Ruggles Lane
o Offers benefits from increased consolidation of students
Weaknesses: o This alternative is the most inefficient of all
under review since the District’s most centrally located and largest school would be closed and students would be distributed to more outlying schools
o Does not move students from Barre as a group; they must be divided among 3 schools in order to prevent over utilization at any school
o Travel times for Ruggles Lane students assigned to New Braintree will grow significantly
o Likely to increase travel time for at least some teachers and student-support personnel such as therapists who are assigned to more than one school, thereby reducing the time they can serve students
o Other alternatives offer greater savings with fewer impacts to students
Opportunities: o Creates a cluster of southern schools that can
be consolidated with each other if enrollment continues to decline
Threats: o Could affect sense of community in Barre as
students are divided into multiple schools

Cost Saving Alternatives for the Quabbin Regional School District Page 86 Edward J. Collins, Jr. Center for Public Management
Alternative A2: Close Hardwick Elementary School.
Year 1 Savings
Long Term Savings/Yr
Elem Classrooms Used Bus Routes Added Number Percent
$560,681 $742,619 52/77 68% 2
Description This alternative would close Hardwick Elementary School and transfer all students to Ruggles Lane (Barre) Elementary. Hardwick is the District’s 3rd largest elementary school in terms of enrollment and 4th largest school in terms of number of classrooms in the school building. This alternative is associated with Alternative A (relocate 6th graders to the middle school) and along with A1, and A3-A9, is made possible by the relocation of the 6th graders. Hardwick Elementary is the district’s southernmost school and is located 10 miles from Ruggles Lane Elementary School. District administrators report the building needs new windows, smoke detectors, and a new roof. In the current school year, 164 residents of the Town of Hardwick are enrolled in the pre-K to 5th grades. Savings in this alternative will be generated by reducing administrative positions, facility- and technology-related positions and expenses including school custodians, and five additional teacher positions (two other are reduced in Alternative A due to the ability to consolidate classrooms). The savings estimates allow a portion of the administrative and facility positions to be redeployed to other schools which will then have more students and activities to support. In this alternative, Ruggles Lane will have 3-4 classrooms per grade while Hubbardston, New Braintree, and Oakham remain unchanged with two classrooms per grade for the most part (Oakham presently has only 1 3rd grade classroom) with no change to classroom size because no students are added to those schools in this alternative. Class sizes in Ruggles Lane will be around 19-21 students in K-2nd and 24-25 for upper grades, within the Districts minimum and maximum targets. The overall elementary school classroom utilization rate will increase to 68%, with 28 classrooms still unused. Hardwick does not have any substantially separate classrooms for students with disabilities, so those students will not be affected. With regard to transportation, Hardwick presently has four bus routes and funding for two additional bus routes is added in this alternative. The longest route today in terms of time (52 minutes) is one that brings students who live to the north of Hardwick Elementary into Gilbertville center and then out to the elementary school; the pick-up/drop off sequence for this route will likely be reversed to pick up students to the south and bring them to Ruggles Lane.
REVIEW LENSES
Finance Offers the second greatest amount of savings of the single-building alternatives, but less than all of the multi-building alternatives. Needed capital improvements would not need to be made for school purposes.
Operations Will reduce the school that is one of the two farthest from District administration (7.8 miles).
Academic Consolidation of students to provide three or more classrooms per grade can offer multiple benefits described earlier. However, Hubbardston, New Braintree, and Oakham will continue with mostly two classrooms per grade.
Community Values Consistent with values of ‘Make District financially sustainable’, ‘Make best use

Cost Saving Alternatives for the Quabbin Regional School District Page 87 Edward J. Collins, Jr. Center for Public Management
of physical infrastructure’, and ‘Increase enrollment’. See Appendix B for details.
Transportation The sequence of some of the southbound buses can be reversed to head north to Ruggles Lane. Funding for 2 additional bus routes are included in this alternative to provide increased flexibility in scheduling
Class Size Class sizes at Ruggles Lane will be within District targets, but Hubbardston, New Braintree, and Oakham will remain unchanged.
SWOT ANALYSIS
Strengths: o Ability to consolidate students with Ruggles
Lane to improve districtwide elementary classroom utilization to 68%
o Offers benefits from increased consolidation of students
Weaknesses: o Class sizes and building utilization in three
schools will remain unchanged o Distance traveled for students who live in the
southern part of Hardwick will increase; careful route design will be needed to mitigate time increases
Opportunities: o Increased collaboration and mentorship
among additional teachers at Ruggles Lane
Threats: o Some parents may consider transferring
students to nearby communities

Cost Saving Alternatives for the Quabbin Regional School District Page 88 Edward J. Collins, Jr. Center for Public Management
Alternative A3: Close Hubbardston Center Elementary School.
Year 1 Savings
Long Term Savings/Yr
Elem Classrooms Used Bus Routes Added Number Percent
$426,460 $585,490 55/69 80 3
Description In this alternative, the Hubbardston Center Elementary school will be closed and the regular education students will be relocated to Ruggles Lane. The Language Based Program (LBP) substantially separate classroom will be relocated to Oakham Center. Hubbardston Elementary is the district’s second largest elementary school in terms of enrollment and number of classrooms in the building. This alternative is associated with Alternative A (relocate 6th graders to the middle school) and along with A1-A2 and A4-A9, is made possible by the relocation of the 6th graders. Hubbarston Elementary is the district’s northernmost school and is located 7.5 miles from Ruggles Lane Elementary School. The school is located immediately adjacent to Town Hall and the Hubbardston Police Department. District administrators report there have been repeated leaks in the roof around the clock tower. In the current school year, 229 residents of the Town of Hubbardston are enrolled in the pre-K to 5th grades. Savings in this alternative will be generated by reducing administrative positions, facility- and technology-related positions and expenses including school custodians, and two additional teacher positions (two other are reduced in Alternative A due to the ability to consolidate 6th grade classrooms). The savings estimates allow a portion of the administrative and facility positions to be redeployed to other schools which will then have more students and activities to support. In this alternative, Ruggles Lane will have 4-5 classrooms per grade while Hardwick, New Braintree, and Oakham remain unchanged with two classrooms per grade for the most part (Hardwick presently has one kindergarten class and Oakham has only 1 3rd grade classroom) with no change to classroom size because no students are added to those schools in this alternative. Class sizes in Ruggles Lane will be around 19-21 students in K-2nd and 21-22 in the upper grades, within the Districts minimum and maximum targets. The overall elementary school classroom utilization rate will increase to 80%, with 14 classrooms still unused. This is due to the fact that Hubbardston has 22 classrooms and this alternative will take them out of the inventory. Hubbardston Elementary presently has five bus routes. It is assumed that one of these will be redirected to the middle school in order to accommodate the increased 6th grade enrollment. The elementary school alternative then accounts for an increase of three buses, for a total of seven serving Hubbardston. The longest bus route in terms of time today is HUE3 during the morning. This route is very close to Hubbardston Center and is likely lengthy due to the number of stops along the route. With additional buses, all routes could be designed to have fewer stops although they would travel a longer distance overall. The Hubbardston Town Administrator has expressed an interest in having town offices occupy a portion of the school building. The preferred space would be the wing that presently contains two kindergarten classrooms, a small special education classroom, and two maintenance offices. This potential use is not accounted for specifically in any of the alternatives described herein, but could be used to modestly reduce excess capacity in any alternative selected that keeps Hubbardston Center open. If the building is closed, all of it would be available for reuse.

Cost Saving Alternatives for the Quabbin Regional School District Page 89 Edward J. Collins, Jr. Center for Public Management
REVIEW LENSES
Finance Offers the second lowest amount of savings of the single building alternatives and significantly less than the multi-building alternatives.
Operations Will reduce the northern-most school and bring students and teachers closer in to the center of the district. However, it will require the relocation of the second greatest number of students in the single-building alternatives.
Academic Consolidation of students to provide three or more classrooms per grade can offer multiple benefits described earlier. However, Hardwick, New Braintree, and Oakham will continue with mostly two classrooms per grade.
Community Values Consistent with values of ‘Make District financially sustainable’, ‘Make best use of physical infrastructure’, and ‘Increase enrollment’. See Appendix B for details.
Transportation Funding for three additional buses is included in this alternative which would allow for the Hubbardston routes to be redesigned so they have fewer stops and can therefore reach Ruggles Lane as quickly as possible.
Class Size
Ruggles Lane class sizes will be slightly smaller than in other alternatives while those in Hardwick, New Braintree, and Oakham will remain unchanged. The greater number of teachers is why this alternative offers fewer savings than other single building alternatives.
SWOT ANALYSIS
Strengths: o Ability to consolidate students with Ruggles
Lane to improve districtwide elementary classroom utilization to 80%
o Offers benefits from increased consolidation of students
o Location of school in center of Hubbarston and immediately adjacent to Town Hall may make reuse of the building somewhat easier than other more-remote schools
Weaknesses: o School building is nearly 65,000 sf in size and a
large occupant(s) would need to be found to reuse the building
o Any reuse plan may need to convert some existing park/playground space to parking
o Class sizes and building utilization in three other schools will remain unchanged
Opportunities: o Increased collaboration and mentorship
among additional teachers at Ruggles Lane o Potential to reuse school building to support
economic development in the center of Hubbardston while also meeting Town facility needs
Threats: o Savings from this alternative are modest and
may not be sufficient to stabilize the District financially for long
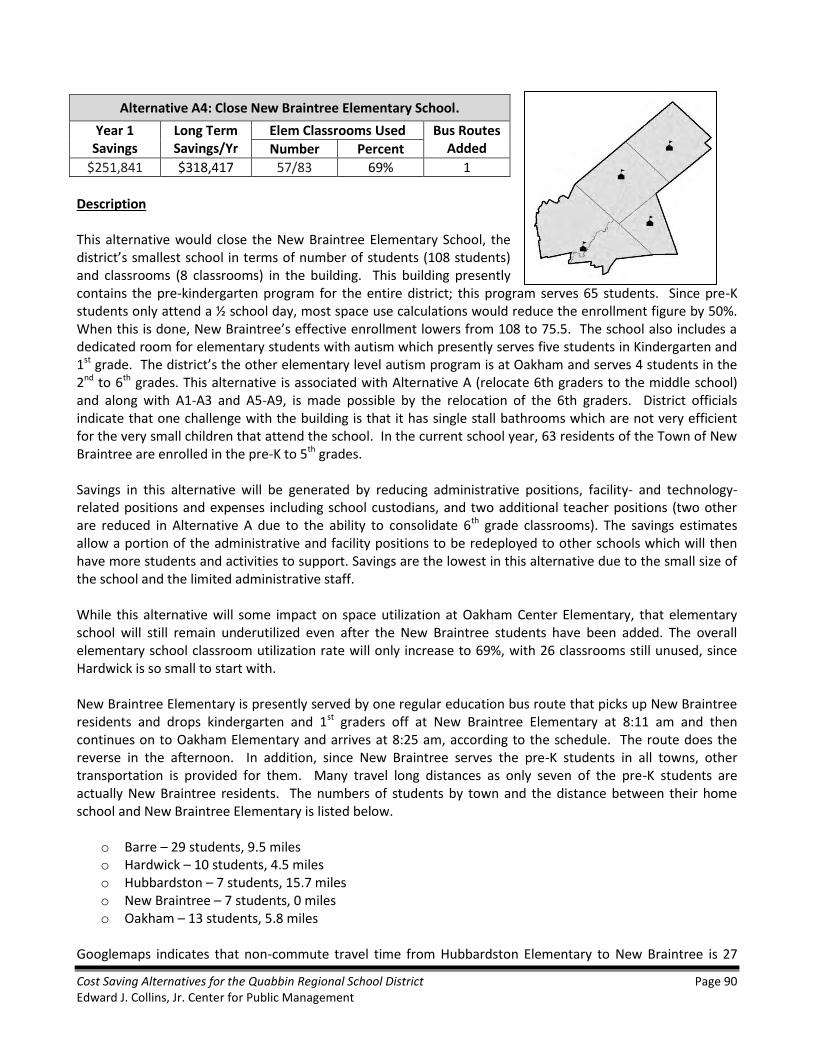
Cost Saving Alternatives for the Quabbin Regional School District Page 90 Edward J. Collins, Jr. Center for Public Management
Alternative A4: Close New Braintree Elementary School.
Year 1 Savings
Long Term Savings/Yr
Elem Classrooms Used Bus Routes Added Number Percent
$251,841 $318,417 57/83 69% 1
Description This alternative would close the New Braintree Elementary School, the district’s smallest school in terms of number of students (108 students) and classrooms (8 classrooms) in the building. This building presently contains the pre-kindergarten program for the entire district; this program serves 65 students. Since pre-K students only attend a ½ school day, most space use calculations would reduce the enrollment figure by 50%. When this is done, New Braintree’s effective enrollment lowers from 108 to 75.5. The school also includes a dedicated room for elementary students with autism which presently serves five students in Kindergarten and 1st grade. The district’s the other elementary level autism program is at Oakham and serves 4 students in the 2nd to 6th grades. This alternative is associated with Alternative A (relocate 6th graders to the middle school) and along with A1-A3 and A5-A9, is made possible by the relocation of the 6th graders. District officials indicate that one challenge with the building is that it has single stall bathrooms which are not very efficient for the very small children that attend the school. In the current school year, 63 residents of the Town of New Braintree are enrolled in the pre-K to 5th grades. Savings in this alternative will be generated by reducing administrative positions, facility- and technology-related positions and expenses including school custodians, and two additional teacher positions (two other are reduced in Alternative A due to the ability to consolidate 6th grade classrooms). The savings estimates allow a portion of the administrative and facility positions to be redeployed to other schools which will then have more students and activities to support. Savings are the lowest in this alternative due to the small size of the school and the limited administrative staff. While this alternative will some impact on space utilization at Oakham Center Elementary, that elementary school will still remain underutilized even after the New Braintree students have been added. The overall elementary school classroom utilization rate will only increase to 69%, with 26 classrooms still unused, since Hardwick is so small to start with. New Braintree Elementary is presently served by one regular education bus route that picks up New Braintree residents and drops kindergarten and 1st graders off at New Braintree Elementary at 8:11 am and then continues on to Oakham Elementary and arrives at 8:25 am, according to the schedule. The route does the reverse in the afternoon. In addition, since New Braintree serves the pre-K students in all towns, other transportation is provided for them. Many travel long distances as only seven of the pre-K students are actually New Braintree residents. The numbers of students by town and the distance between their home school and New Braintree Elementary is listed below.
o Barre – 29 students, 9.5 miles o Hardwick – 10 students, 4.5 miles o Hubbardston – 7 students, 15.7 miles o New Braintree – 7 students, 0 miles o Oakham – 13 students, 5.8 miles
Googlemaps indicates that non-commute travel time from Hubbardston Elementary to New Braintree is 27

Cost Saving Alternatives for the Quabbin Regional School District Page 91 Edward J. Collins, Jr. Center for Public Management
minutes each way direct, i.e., if not stopping to pick up additional students along the way. This travel time is significant for a ½ day program and may be artificially constraining enrollment since many parents may not want their small children on a bus for so much time each day. The project team does not know the home location of the five students with autism at New Braintree, but given that the only other elementary program is located at Oakham, this means students with autism from the northern towns may also be travelling significant distances. Funding for one additional bus route is included in this alternative.
REVIEW LENSES
Finance This alternative offers the smallest amount of savings of those under consideration. It appears that District administrators have attempted to be creative in finding ways to keep New Braintree Elementary open in compliance with the regional agreement. However, the very small enrollment and large distance travelled by some students amplify the per-student costs at the school and may be artificially lowering enrollment in the pre-K program – both of these adversely impact the District’s budget.
Operations This alternative will move programs closer to the center of the district.
Academic This alternative will have limited impacts on student consolidation since so few New Braintree students will be relocated. However, the project team questions whether the autism program can be more centrally located given space availability. The District should consider relocating the program to Ruggles Lane or Hubbardston to reduce travel time and allow for increased opportunities for inclusion.
Community Values Consistent with values of ‘Make District financially sustainable’, ‘Make best use of physical infrastructure’, and ‘Increase enrollment’. See Appendix B for details.
Transportation This alternative will begin to remedy some of the transportation impacts on pre-K students and students with autism who must travel long distances to New Braintree daily. Relocating the pre-K classrooms and autism program to Ruggles Lane would improve access for many families.
Class Size Minimal change to Oakham only. 1st and 2nd grade classes will be 12-13 students each and 4th and 5th grade classes will include 13 students each – both of which are well below District targets.
SWOT ANALYSIS
Strengths: o Will allow the District to more centrally locate
its pre-K program and offer a classroom for autistic students at one of the northern schools (if the project team’s recommendation is followed)
o Can significantly decrease travel time for pre-K students and potentially increase enrollment as parents realize the program is closer to their homes
o Building could be reused as a community or senior center
Weaknesses: o One taskforce member mentioned that use of
the New Braintree library fell when New Braintree and Oakham were reconfigured. Closing the school may further impact the library. The library is presently open 4 days per week, 20 hours total.
Opportunities: o Offers an opportunity to rethink where
districtwide programs are located
Threats: o The District should consideration whether the
Oakham residents enrolled at New Braintree

Cost Saving Alternatives for the Quabbin Regional School District Page 92 Edward J. Collins, Jr. Center for Public Management
should also be relocated to Barre. If yes, then enrollment at New Braintree will fall further.
o If pre-K enrollment increases, adequate classroom space will be needed.
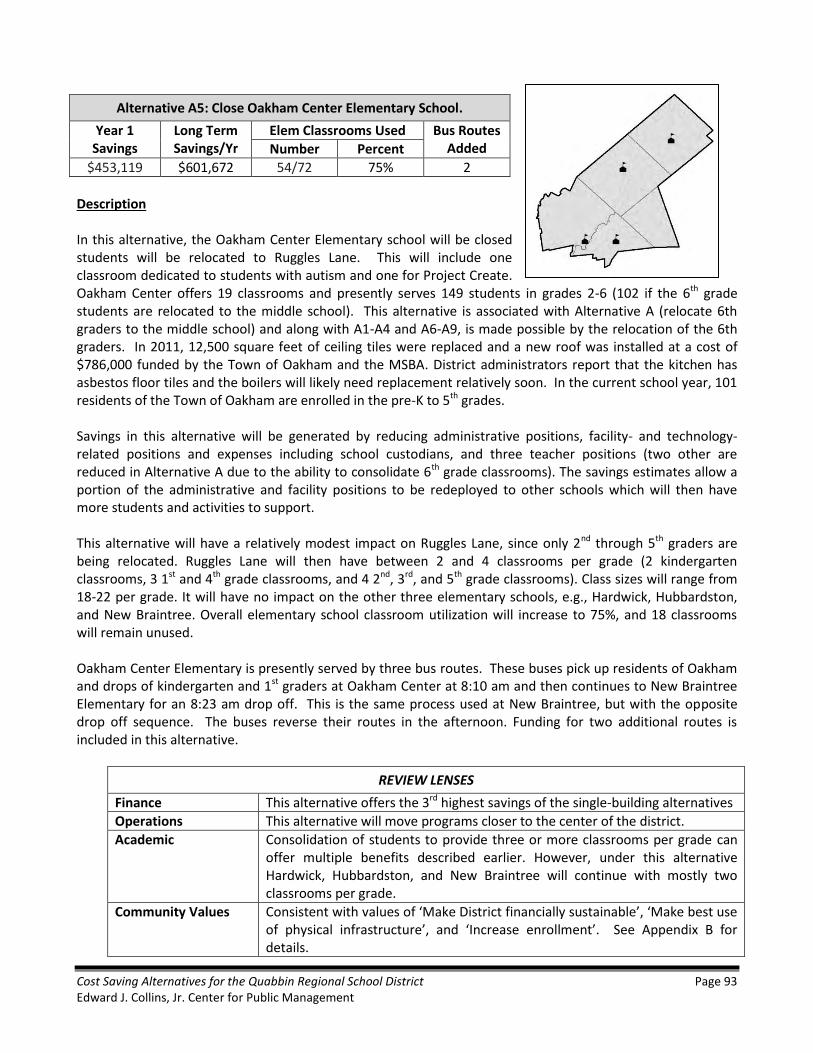
Cost Saving Alternatives for the Quabbin Regional School District Page 93 Edward J. Collins, Jr. Center for Public Management
Alternative A5: Close Oakham Center Elementary School.
Year 1 Savings
Long Term Savings/Yr
Elem Classrooms Used Bus Routes Added Number Percent
$453,119 $601,672 54/72 75% 2
Description In this alternative, the Oakham Center Elementary school will be closed students will be relocated to Ruggles Lane. This will include one classroom dedicated to students with autism and one for Project Create. Oakham Center offers 19 classrooms and presently serves 149 students in grades 2-6 (102 if the 6th grade students are relocated to the middle school). This alternative is associated with Alternative A (relocate 6th graders to the middle school) and along with A1-A4 and A6-A9, is made possible by the relocation of the 6th graders. In 2011, 12,500 square feet of ceiling tiles were replaced and a new roof was installed at a cost of $786,000 funded by the Town of Oakham and the MSBA. District administrators report that the kitchen has asbestos floor tiles and the boilers will likely need replacement relatively soon. In the current school year, 101 residents of the Town of Oakham are enrolled in the pre-K to 5th grades. Savings in this alternative will be generated by reducing administrative positions, facility- and technology-related positions and expenses including school custodians, and three teacher positions (two other are reduced in Alternative A due to the ability to consolidate 6th grade classrooms). The savings estimates allow a portion of the administrative and facility positions to be redeployed to other schools which will then have more students and activities to support. This alternative will have a relatively modest impact on Ruggles Lane, since only 2nd through 5th graders are being relocated. Ruggles Lane will then have between 2 and 4 classrooms per grade (2 kindergarten classrooms, 3 1st and 4th grade classrooms, and 4 2nd, 3rd, and 5th grade classrooms). Class sizes will range from 18-22 per grade. It will have no impact on the other three elementary schools, e.g., Hardwick, Hubbardston, and New Braintree. Overall elementary school classroom utilization will increase to 75%, and 18 classrooms will remain unused. Oakham Center Elementary is presently served by three bus routes. These buses pick up residents of Oakham and drops of kindergarten and 1st graders at Oakham Center at 8:10 am and then continues to New Braintree Elementary for an 8:23 am drop off. This is the same process used at New Braintree, but with the opposite drop off sequence. The buses reverse their routes in the afternoon. Funding for two additional routes is included in this alternative.
REVIEW LENSES
Finance This alternative offers the 3rd highest savings of the single-building alternatives
Operations This alternative will move programs closer to the center of the district.
Academic Consolidation of students to provide three or more classrooms per grade can offer multiple benefits described earlier. However, under this alternative Hardwick, Hubbardston, and New Braintree will continue with mostly two classrooms per grade.
Community Values Consistent with values of ‘Make District financially sustainable’, ‘Make best use of physical infrastructure’, and ‘Increase enrollment’. See Appendix B for details.

Cost Saving Alternatives for the Quabbin Regional School District Page 94 Edward J. Collins, Jr. Center for Public Management
Transportation An additional bus route is added in this alternative to offer flexibility to keep travel times low.
Class Size Impacts on class size are limited to Ruggles Lane and the 2nd to 5th grades only since those are the students that would transfer from Oakham. Class sizes at Ruggles Lane will be well within the District targets.
SWOT ANALYSIS
Strengths: o Ability to consolidate students with Ruggles
Lane to improve districtwide elementary classroom utilization to 75%
o Offers benefits from increased consolidation of students
Weaknesses: o Class sizes and building utilization in three
schools will remain unchanged o The District will still have 18 unused
elementary school classrooms
Opportunities: o Increased collaboration and mentorship
among additional teachers at Ruggles Lane
Threats: o The District should consideration whether the
Oakham residents enrolled at New Braintree should also be relocated to Barre. If yes, then enrollment at New Braintree will fall further.

Cost Saving Alternatives for the Quabbin Regional School District Page 95 Edward J. Collins, Jr. Center for Public Management
Multi-Elementary School Alternatives
The purpose of the single building alternatives (A1-A5) was to consider the impacts and implications of closing each of the elementary school independently and how that might be of benefit to students and the District’s financial stability. In doing so, what has become clear is that each of them only offers the benefits of consolidation to two schools at a time – and elementary school space districtwide remains underutilized. In other words, in the single building alternatives each receiver school has sufficient capacity to absorb all of the students from the school being closed, leaving the remaining three unaffected and in a “status quo” situation with less than three classrooms per grade per building, unduly small class sizes, and unused classrooms. (The only exception to this is A1 Close Ruggles Lane (Barre) which would distribute students to three schools, but that alternative is highly inefficient. None of the multi-school alternatives contemplate closing Ruggles Lane for this reason.) As a result, multi-building alternatives that generate more savings that would stabilize the District’s finances further, and would optimally offer some financial relief to the member towns, are clearly feasible. Therefore, in order to offer the academic benefits of school consolidation to all QRSD elementary school students, more efficiently use space, and generate additional savings, multi-building alternatives have been developed by the project team. Some of the alternatives below are feasible if the 6th grade is moved into the middle school facility; these start with the letter "A", “referencing Alternative A Relocate 6th Grader to the Middle School. Other alternatives are feasible only if the 5th and 6th grades are relocated to the middle school; these start with the letter “B”, referencing Alternative B Relocate 5th and 6th Graders to the Middle School. Multi-building alternatives that require the relocation of 6th graders are shown below. These are listed in alphabetical order and are described more fully in the following pages.
Classroom Utilization Rates for Multi Building Closure Alternatives (Alternatives A6-A9)
# Classrms
in Bldg
2017 Use
(QRSD)
Classes after Alt A
A6 Close Hardwick /
NB
A7 Close Hubbard-ston / NB
A8 Close NB /
Oakham
A9 Close Hardwick,
NB, Oakham
Ruggles Lane (Barre) 28 19 16 24 28 27 25
Hardwick Elem 14 13 11 0 11 11 0
Hubbardston Center 22 17 15 15 0 15 22
New Braintree 8 6 6 0 0 0 0
Oakham Center 19 11 9 13 16 0 0
Classrooms Used
66 57 52 55 53 47
Classrooms Avail 91 91 91 69 61 64 50
Unused Classrooms
25 34 17 6 11 3
Elem Utilization
73% 63% 75% 90% 83% 94%
Multi-building alternatives that require the relocation of 5th and 6th graders are shown below. These are listed in alphabetical order and are described more fully in the following pages.
Classroom Utilization Rates for Multi Building Closure Alternatives

Cost Saving Alternatives for the Quabbin Regional School District Page 96 Edward J. Collins, Jr. Center for Public Management
(Alternatives B10-B11)
# Classrms
in Bldg
2017 Use
(QRSD)
Classes after Alt B
B10 Close Hardwick,
Hubbardston, NB
B11 Close Hardwick,
NB, and Oakham
Ruggles Lane (Barre) 28 19 13 24 20
Hardwick Elem 14 13 9
Hubbardston Center 22 17 13 20
New Braintree 8 6 6
Oakham Center 19 11 7 19
Classrooms Used
66 48 43 40
Classrooms Avail 91 91 91 47 50
Unused Classrooms
25 43 4 10
Elem Utilization
73% 53% 91% 80%
In considering the multi-building elementary school alternatives, it is important to recognize that only Alternative B fully uses the existing middle school classrooms and, under A and B, 28 out of 60 high school classrooms remain unused. Although Alternative C offers a way to increase use of the high school space, it will take a number of years to analyze and implement. This offers a really large cushion for enrollment changes - in the event that elementary school enrollment increases significantly, the 4th grade could be relocated to the MSHS creating space at the elementary school level. Or, if enrollment continues to decline, the 4th grade could be relocated to the MSHS and an additional school or school-wing could be closed.
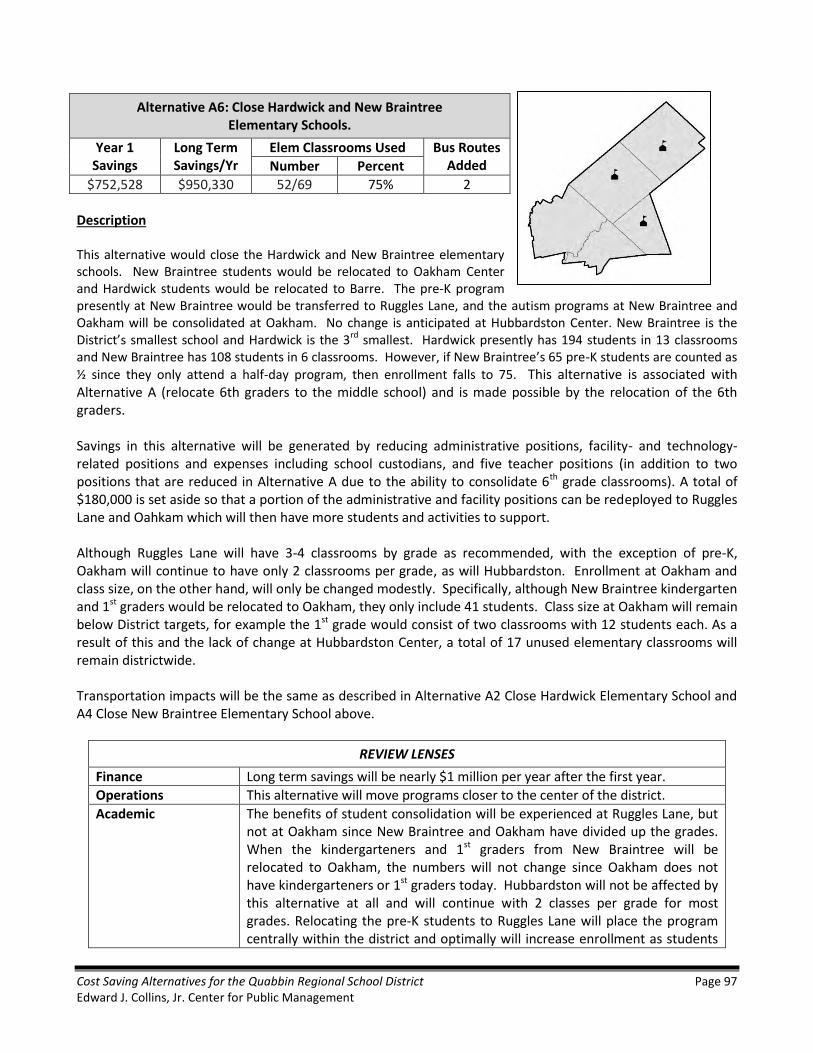
Cost Saving Alternatives for the Quabbin Regional School District Page 97 Edward J. Collins, Jr. Center for Public Management
Alternative A6: Close Hardwick and New Braintree Elementary Schools.
Year 1 Savings
Long Term Savings/Yr
Elem Classrooms Used Bus Routes Added Number Percent
$752,528 $950,330 52/69 75% 2
Description This alternative would close the Hardwick and New Braintree elementary schools. New Braintree students would be relocated to Oakham Center and Hardwick students would be relocated to Barre. The pre-K program presently at New Braintree would be transferred to Ruggles Lane, and the autism programs at New Braintree and Oakham will be consolidated at Oakham. No change is anticipated at Hubbardston Center. New Braintree is the District’s smallest school and Hardwick is the 3rd smallest. Hardwick presently has 194 students in 13 classrooms and New Braintree has 108 students in 6 classrooms. However, if New Braintree’s 65 pre-K students are counted as
½ since they only attend a half-day program, then enrollment falls to 75. This alternative is associated with Alternative A (relocate 6th graders to the middle school) and is made possible by the relocation of the 6th graders. Savings in this alternative will be generated by reducing administrative positions, facility- and technology-related positions and expenses including school custodians, and five teacher positions (in addition to two positions that are reduced in Alternative A due to the ability to consolidate 6th grade classrooms). A total of $180,000 is set aside so that a portion of the administrative and facility positions can be redeployed to Ruggles Lane and Oahkam which will then have more students and activities to support. Although Ruggles Lane will have 3-4 classrooms by grade as recommended, with the exception of pre-K, Oakham will continue to have only 2 classrooms per grade, as will Hubbardston. Enrollment at Oakham and class size, on the other hand, will only be changed modestly. Specifically, although New Braintree kindergarten and 1st graders would be relocated to Oakham, they only include 41 students. Class size at Oakham will remain below District targets, for example the 1st grade would consist of two classrooms with 12 students each. As a result of this and the lack of change at Hubbardston Center, a total of 17 unused elementary classrooms will remain districtwide. Transportation impacts will be the same as described in Alternative A2 Close Hardwick Elementary School and A4 Close New Braintree Elementary School above.
REVIEW LENSES
Finance Long term savings will be nearly $1 million per year after the first year.
Operations This alternative will move programs closer to the center of the district.
Academic The benefits of student consolidation will be experienced at Ruggles Lane, but not at Oakham since New Braintree and Oakham have divided up the grades. When the kindergarteners and 1st graders from New Braintree will be relocated to Oakham, the numbers will not change since Oakham does not have kindergarteners or 1st graders today. Hubbardston will not be affected by this alternative at all and will continue with 2 classes per grade for most grades. Relocating the pre-K students to Ruggles Lane will place the program centrally within the district and optimally will increase enrollment as students

Cost Saving Alternatives for the Quabbin Regional School District Page 98 Edward J. Collins, Jr. Center for Public Management
to not need to travel as far as they do to New Braintree. Teachers and administrators will be able to collaborate more easily across three facilities with identical grade levels than they do across five today.
Community Values Consistent with values of ‘Make District financially sustainable’, ‘Make best use of physical infrastructure’, and ‘Improve District administration’. See Appendix B for details.
Transportation Funding for two new bus routes has been accounted for in the cost savings.
Class Size Classes will remain below District targets at Hubbardston and Oakham.
SWOT ANALYSIS
Strengths: o Relocates pre-K program to a central location
(e.g., Ruggles Lane)
Weaknesses: o Does not make much impact on
underutilization since District will only be 75% used
o No consolidation benefits will be experienced at Hubbardston or Oakham
Opportunities: o Will allow District to reconsider where autism
programs are located
Threats: o Will not offer many academic benefits and
community members may question the concept if this alternative is implemented
o Likely that another school will need to be closed in the near term as enrollment has not yet been optimized

Cost Saving Alternatives for the Quabbin Regional School District Page 99 Edward J. Collins, Jr. Center for Public Management
Alternative A7: Close Hubbardston and New Braintree Elementary Schools.
Year 1 Savings
Long Term Savings/Yr
Elem Classrooms Used Bus Routes Added Number Percent
$618,369 $793,200 55/61 90% 3
This alternative will close the Hubbardston Center and New Braintree elementary schools. Students from Hubbardston will be transferred to Ruggles Lane (Barre), students from New Braintree will be transferred to Oakham, and the Language Based Program (LBP) presently located at
Hubbardston will be relocated to Oakham. This alternative is associated with Alternative A (relocate 6th graders to the middle school) and is made possible by the relocation of the 6th graders. No change is anticipated at Hardwick. As described above, the consolidation of New Braintree and Oakham will not offer any improvements in class sizes or number of classrooms per grade because the two schools do not have overlapping grades at present. The only net change from Alternative 6 for Oakham will be that one more classroom will be occupied, this time by the LBP. In contrast, Ruggles Lane will experience a significant increase in the number of students, growing from 312 to 575. All 28 classrooms at Ruggles Lane will be fully used. Savings in this alternative will be generated by reducing administrative positions, facility- and technology-related positions and expenses including school custodians at the two schools being closed. In addition, this alternative will reduce two teacher positions (in addition to two positions that are reduced in Alternative A due to the ability to consolidate 6th grade classrooms). A total of $180,000 is set aside so that a portion of the administrative and facility positions can be redeployed to Ruggles Lane and Oahkam which will then have more students and activities to support. Although the districtwide utilization rate will grow significantly, this is not because classes are more efficient at Hardwick or Oakham. Instead, the change comes predominantly as a result of the elimination of Hubbardston’s 22 classrooms. Transportation impacts will be the same as described in Alternative 3 Close Hardwick Elementary School and Alternative 4 Close New Braintree Elementary School above.
REVIEW LENSES
Finance Will result in nearly $800,000 in savings in year 2 and forward
Operations Will consolidate operations somewhat, but Hardwick Elementary will be a significant distance away from the nearest school
Academic Will not offer all of the benefits of consolidation possible since the New Braintree to Oakham transfer does not result in any reductions in number of classes or increases in students per class to align with District targets. Hardwick will remain unchanged and the school will continue to have inequitably small classrooms such as two 2nd grade classrooms with 12 students each.
Community Values Consistent with values of ‘Make District financially sustainable’, ‘Make best use of physical infrastructure’ and ‘Improve District administration’. See Appendix B for details.
Transportation Same as described in Alternative 3 Close Hardwick Elementary School and

Cost Saving Alternatives for the Quabbin Regional School District Page 100 Edward J. Collins, Jr. Center for Public Management
Alternative 4 Close New Braintree Elementary School
Class Size Will result in significant variation between Ruggles Lane, where classes will be between 19 and 22 students in size, which is at the District’s target, and Hardwick and Oakham which may have classes with 12 to 14 students.
SWOT ANALYSIS
Strengths: o Will result in savings to the District o Will fully utilize the Ruggles Lane School
Weaknesses: o Consolidation will not benefit Hardwick or
Oakham students o All of the district’s substantially separate
classrooms will be located at Oakham which could be interpreted as being discriminatory, but is actually a function of the complete use of the Ruggles Lane building. This is not beneficial to the regular or special education students, especially as the very few and very small regular education classrooms will make inclusion highly unlikely
Opportunities: o More teachers and administrators will be
centrally located at Ruggles Lane
Threats: o More students live in the norther communities
of Barre and Hubbardston than do in the southern communities. Parents may find it inequitable to keep two southern schools open when closing Hubbardston

Cost Saving Alternatives for the Quabbin Regional School District Page 101 Edward J. Collins, Jr. Center for Public Management
Alternative A8: Close New Braintree and Oakham Elementary Schools.
Year 1 Savings
Long Term Savings/Yr
Elem Classrooms Used Bus Routes Added Number Percent
$690,246 $869,310 53/64 83% 2
In this alternative, the New Braintree and Oakham elementary schools will be closed and the students from both will be relocated to Ruggles Lane (Barre). New Braintree and Oakham are already acting as one combined school with pre-K to 1st graders being located at New Braintree with 2nd to 6th graders at Oakham. Combined, they offer educational services to 65 pre-kindergarteners and 192 Kindergarten to 6th graders. When the 6th grade is transferred to the middle school, this leaves 155 full time students and 65 half-time students. These two schools will fit within the Ruggles Lane School by using 27 of the school’s 28 classrooms. Ruggles Lane will also house the districtwide pre-K program and 3 substantially separate classrooms (two for autism and one for Project Change). No change is anticipated at Hardwick or Hubbardston elementary schools. This alternative is associated with Alternative A (relocate 6th graders to the middle school) and is made possible by the relocation of the 6th graders. Savings in this alternative will be generated by reducing administrative positions, facility- and technology-related positions and expenses including school custodians at the two schools being closed. In addition, this alternative will reduce four teacher positions as students are consolidated into Ruggles Lane (in addition to two positions that are reduced in Alternative A due to the ability to consolidate 6th grade classrooms). A total of $180,000 is set aside so that a portion of the administrative and facility positions can be redeployed to Ruggles Lane which will then have more students and activities to support. The lack of change at the Hardwick and Hubbardston schools will mean that both will continue with only two classrooms per grade and will have small class sizes of approximately 12 to 15 students in some grades. At the same time, Ruggles Lane’s classes will hold between 18 and 22 students. Transportation impacts will be the same as described in Alternative 4 Close New Braintree Elementary School and Alternative 5 Close Oakham Elementary above, although since both towns share the existing bus routes, the redesign may be easier.
REVIEW LENSES
Finance Will save nearly $870,000 in Year 2.
Operations Will consolidate operations somewhat, but Hardwick Elementary will be a significant distance (10 miles) away from the nearest school
Academic The benefits of consolidation will be experienced at Ruggles Lane, but not at Hardwick or Hubbardston
Community Values Consistent with values of ‘Make District financially sustainable’, ‘Make best use of physical infrastructure’, and ‘Improve District administration’. See Appendix B for details.
Transportation Since both towns share the existing bus routes, the redesign may be somewhat easier. Two additional bus routes are funded in the cost savings esimates
Class Size Will have different sizes between Ruggles Lane, which will be at the District targets, and Hardwick and Hubbardston, which will have much smaller class sizes

Cost Saving Alternatives for the Quabbin Regional School District Page 102 Edward J. Collins, Jr. Center for Public Management
SWOT ANALYSIS
Strengths: o Will reduce two of the most underutilized
schools o Three of Hubbardston’s classrooms could
potentially be used by Town offices, thereby reducing the number of unused classrooms. However, it is unclear if this will generate any additional revenue for the District
Weaknesses: o Will have no impact on underused space in
Hardwick and Hubbardston schools o Space use by the Town of Hubbardston will
not affect class size
Opportunities: o Hardwick and Hubbardston are located
relatively close to communities that could conceivably join the district
Threats: o Parents could be concerned about the unequal
class sizes among the three schools

Cost Saving Alternatives for the Quabbin Regional School District Page 103 Edward J. Collins, Jr. Center for Public Management
Alternative A9: Close the Hardwick, New Braintree, and Oakham Elementary Schools.
Year 1 Savings
Long Term Savings/Yr
Elem Classrooms Used Bus Routes Added Number Percent
$1,236,146 $1,561,152 47/50 97% 3
This alternative would close the Hardwick, New Braintree, and Oakham elementary schools. Students would be relocated as follows: New Braintree and Oakham students would be transferred to Hubbardston and Hardwick students would be transferred to Ruggles Lane (Barre). The pre-K program and one of the substantially separate classrooms for autism would be relocated to Ruggles Lane and the second autism classroom and Project Create would be relocated to Hubbardston. All of Hubbardston’s classrooms would be used, while 25 of Ruggles Lane’s classrooms would be used, creating a districtwide utilization of 97%. This alternative is associated with Alternative A (relocate 6th graders to the middle school) and is made possible by the relocation of the 6th graders. The two remaining schools would have 3-4 classrooms per grade as is a principle of the project team and would offer opportunities for inclusion to special education students. In addition, the two schools would be located relatively close together, allowing teachers to not only collaborate within their school site, but also across schools with relative ease. Savings would be generated by considerable reductions in administrative staff, and facility and IT expenditures in addition to the reduction of 10 teacher positions (in addition to two positions that are reduced in Alternative A due to the ability to consolidate 6th grade classrooms). The transportation impacts for Hardwick would be the same as described in Alternative A2 Close Hardwick Elementary School and in which route design would need to be done carefully to minimize travel time for students. Transferring New Braintree and Oakham to Hubbardston is not discussed above. The New Braintree school is 15.6 miles from Hubbardston Center, while Oakham is 12.9 miles away , if travelling through Barre center. Both of these distances are on the order of 25-30 minutes en route and that is if the vehicle does not stop to pick up other students along the way. This can pose a significant challenge to bus route design.
REVIEW LENSES
Finance This alternative offers $1.5 million in savings in Year 2 and after. This can be used to reinvest in the schools while also offer considerable saving to the member towns
Operations The two schools would be located near District administration and the middle/high school which would allow for opportunity for face-to-face collaboration
Academic All of the benefits of school consolidation and the provision of 3 classes per grade would be available at both schools. However, the dividing of the two autism classrooms among schools should be reconsidered given the likelihood that it will be challenging for these students to transition from building to building as they advance in grade.
Community Values Consistent with values of ‘Make District financially sustainable’, ‘Make best use of physical infrastructure’, and ‘Improve educational outcomes’. See Appendix B for details.
Cost Saving Alternatives for the Quabbin Regional School District Page 104 Edward J. Collins, Jr. Center for Public Management
Transportation
Transportation is the single biggest challenge with this alternative. Although fewer students live in the towns of Hardwick, New Braintree, and Oakham, it is not beneficial for them to be spending large portions of their day on the bus. A detailed analysis beyond the capacity of the project team will need to be done to determine if time-efficient routes can be developed. Given the significant cost savings multiple new routes could be developed without significantly altering the financial benefits of this alternative. Relocating the pre-K and autism programs more centrally in the district is of benefit to those students.
Class Size Class sizes would be within the District targets or slightly under depending upon actual enrollment. Importantly, class size will be equitable across both schools.
SWOT ANALYSIS
Strengths: o Optimizes the use of elementary school space
in the district o Offers similar utilization of space and equitable
class size between the two buildings o Allows for increased teacher collaboration
within the school site and among the two schools
o All schools will be located close to District administration
o Significant savings in facility maintenance would be realized and a portion could be applied to the two schools to maintain them in outstanding condition
Weaknesses: o The design of transportation routes that are
not overly long will be a challenge o Winter weather conditions and commuter
traffic could affect bus times o Would not provide the Town of Hubbardston
with any building space o Space may be so fully utilized it will be difficult
to accommodate new elementary students
Opportunities: o Focusing energies on two schools instead of
five could allow the District to create really terrific curriculum, specialist classes, extra curriculars, etc.
o Special education costs could be reduced as students have access to academic supports and inclusion is increased
Threats: o Considerable change will be felt by all towns,
but particularly the three southernmost communities

Cost Saving Alternatives for the Quabbin Regional School District Page 105 Edward J. Collins, Jr. Center for Public Management
Alternative B10: Close Hardwick, Hubbardston, and New Braintree Elementary Schools.
Year 1 Savings
Long Term Savings/Yr
Elem Classrooms Used Bus Routes Added Number Percent
$1,042,339 $1,355,735 43/47 91 5
This alternative would close the Hardwick, Hubbardston, and New Braintree elementary schools. Students would be relocated as follows: Hubbardston students would be relocated to Ruggles Lane (Barre) and Hardwick and New Braintree students would be relocated to Oakham. The Language Based Program presently at Hubbardston would be moved to Barre, while Oakham would house the pre-K classes, and the substantially separate classrooms for autism and Project Create. This alternative is associated with Alternative B (relocate 5th and 6th graders to the middle school) and is only possible if 5th and 6th graders are relocated to the middle school. As with Alternative A9 above, both buildings would be well utilized with 24 of Ruggles Lane’s 28 classrooms being used and all 19 of Oakham’s classrooms as well. (If the pre-K program is instead located at Ruggles Lane, this would provide both schools with two open classrooms.) Ruggles Lane will have 4-5 classrooms per grade from 1st to 4th grade (unless the two pre-K classrooms are relocated) and Oakham would have 3 classrooms per grade, with the exception of Kindergarten and pre-K which would have 2 classrooms each. Class sizes would be at District targets with the exception of 2 classrooms at Oakham that would have 17 students based upon SY17 enrollment, and which could change next year. In addition, the two schools would be located relatively close together, allowing teachers to not only collaborate within their school site, but also across schools with relative ease. Savings would be generated by considerable reductions in administrative staff, and facility and IT expenditures. A total of 8 teacher positions are reduced across the district in this alternative including 2 from the 6th grade consolidation, 2 from the 5th grade consolidation, and 4 from the remaining elementary consolidation, meaning that 70% of the savings come from non-teaching expenses, and more funds remain in the classroom. The savings calculations for this alternative account for approximately $300,000 to be redeployed to the two schools for administrative, IT, and facilities personnel which will be needed given the increased student enrollment in both. The transportation impacts of relocating Hubbardston students to Ruggles Lane are addressed in Alternative A3 Close Hubbardston Center Elementary School. Relocating students from New Braintree to Oakham will actually reduce travel time as the bus routes for the schools presently drop students off at both schools each day. Hardwick Elementary is 9.3 miles from Oakham Center, and Googlemap estimates are the route will take 16 minutes during commute hours. Funding for 5 additional bus routes is included in this alternative.
REVIEW LENSES
Finance Savings generated by this alternative are only exceeded by alternatives A9/B10 described elsewhere. The majority of the savings are generated by administrative, facilities, and IT savings, with some teacher reductions as well.
Operations The two schools would be located near District administration and the middle/high school which would allow for opportunity for face-to-face collaboration. If the pre-K was located at Ruggles Lane, both schools would have 2 unassigned classrooms which would provide them with some flexible

Cost Saving Alternatives for the Quabbin Regional School District Page 106 Edward J. Collins, Jr. Center for Public Management
space to use in the event that additional substantially separate classrooms or regular classrooms are needed
Academic All of the benefits of school consolidation and the provision of 3 classes per grade would be available at both schools. Teachers will be able to collaborate within each school and between schools with relative ease
Community Values Consistent with values of ‘Make District financially sustainable’, ‘Make best use of physical infrastructure’, and ‘Improve educational outcomes’. See Appendix B for details.
Transportation
Does not have the negative transportation impacts that Alternative A9/B10 has. Travel time for New Braintree and Oakham students may go down modestly since buses will no longer have to go to both school sites. Funding for 5 additional bus routes is included
Class Size Class sizes would be within the District targets or slightly under depending upon actual enrollment. Importantly, class size will be equitable across both schools.
SWOT ANALYSIS
Strengths: o Optimizes the use of elementary school space
in the district o Offers similar utilization of space and equitable
class size between the two buildings o Allows for increased teacher collaboration
within the school site and among the two schools
o All schools will be located close to District administration
o Significant savings in facility maintenance would be realized and a portion could be applied to the two schools to maintain them in outstanding condition
Weaknesses: o Space may be so fully utilized it will be difficult
to accommodate new elementary students and/or provide additional substantially separate classes, if needed
Opportunities: o Focusing energies on two schools instead of
five could allow the District to create really terrific curriculum, specialist classes, extra curriculars, etc.
o Special education costs could be reduced as students have access to academic supports and inclusion is increased
Threats: o Considerable change will be felt by all towns

Cost Saving Alternatives for the Quabbin Regional School District Page 107 Edward J. Collins, Jr. Center for Public Management
Alternative B11: Close Hardwick, New Braintree, and Oakham Elementary Schools.
Year 1 Savings
Long Term Savings/Yr
Elem Classrooms Used Bus Routes Added Number Percent
$1,160,430 $1,492,074 40/50 80 4
This is the same as Alternative A9 discussed above with the exception that in this version, 5th graders are relocated to the middle school. This allows the two elementary schools to be very well utilized, but provides a few more classrooms to remain uncommitted and available for changing enrollment patterns or increases in substantially separate classrooms. In Alternative A9 discussed above, all Hubbardston classrooms are used and 25 out of 28 at Ruggles Lane producing a utilization rate of 97%. In this alternative, 20 out of 28 Ruggles Lane classrooms will be used and 20 out of 22 Hubbardston classrooms.
REVIEW LENSES
See Alternative A9 above.
SWOT ANALYSIS
See Alternative A9 above.

Cost Saving Alternatives for the Quabbin Regional School District Page 108 Edward J. Collins, Jr. Center for Public Management
ALTERNATIVES FOUND TO BE INFEASIBLE Additional alternatives were explored and found to be not feasible. They are listed below with an explanation of why they are not viable: o Close Hardwick, Hubbardston and New Braintree and only relocate 6th graders – space is not sufficient in
Oakham to accommodate Hardwick and New Braintree o Close Hubbardston, New Braintree, and Oakham – even with the 5th graders being relocated to the middle
school, space is not sufficient in Hardwick to accommodate New Braintree and Oakham
NEXT STEPS Clearly the above alternatives provide the District and towns with many options to consider- perhaps even too many. One of the first steps after absorbing the information in this report would be for participants to begin to narrow down the alternatives to a few that warrant more detailed analysis and discussion. Area residents should begin a series of facilitated meetings to allow them to discuss the merits of the alternatives remaining and how they can be improved so that sufficient residents would be willing to act at town meeting to approve the change. Readers may have observed that the values identified for the school closure alternatives are the same for all. That is because, at a high level, each will ‘Make District financially sustainable’, ‘Make best use of physical infrastructure’, and ‘Improve educational outcomes’. They each will have town-specific and area-wide strengths and weaknesses that should be discussed resident-to-resident in a structured way that will allow everyone to hear each other’s perspectives. Residents across the area may also need time to mourn together the changes that are impending – even those schools that will remain open will be different and everyone will need to become accustomed to the changes. Part of the process should give voice to the sadness that all must feel so that they can come together and support each other instead of being divided. That said, change is also impending if the towns and District do not affirmatively vote to take action on the best practices and space use alternatives. That change is more dire as increased costs and underutilized space continue to tax the District’s budget so that it enters a cycle of year to year cuts, diminished academic performance, and declines in enrollment as parents seek support for their children elsewhere.

Page 109
APPENDICES
A. Studies of School Quality and Conditions B. Summary of Values and Recommendations C. Paraprofessional Staffing D. Teacher Stipends E. Sample Nepotism Policies F. Potential Cost/Savings per Configuration

Page 110
THIS PAGE IS INTENTIONALLY BLANK

Page 111
APPENDIX A: STUDIES OF SCHOOL QUALITY AND CONDITIONS Impacts of Teacher Absences
Miller, R (2008). Tales of Teacher Absence: New Research Yields Patterns That Speak to Policymakers. Center for American Progress. https://cdn.americanprogress.org/wp-content/uploads/issues/2008/10/pdf/teacher_absence.pdf: A study of teacher absences finds that they negatively affect student performance, with every 10 absences reducing mathematics achievement by the same amount as a 2-3 decrease in teacher experience level. It also finds that absences appear to be in large part a function of the culture and policies governing absences at individual schools, rather than district-wide or region-wide conditions. This suggests that as many of half of teacher absences could be eliminated if schools develop incentives for taking fewer off-days (e.g. buy-back programs for unused sick days) or put more responsibility on the teacher for accounting for their absences (e.g. requiring them to report absences directly to the principal).
Black, S. (2009). The Absentee Teacher. American School Board Journal, p. 48-49. http://elearning.nccsc.k12.in.us/pluginfile.php/93417/mod_resource/content/0/General_Information/The_Absentee_Teacher.pdf: Recommendations for reducing teacher absences include monitoring and reporting of absences to parents, setting clear expectations for teacher attendance and vigorously holding teachers to those standards, adopting incentives and rewards for high attendance, and scheduling non-instructional events so that they do not conflict with classroom time.
Joseph, N. (2014). Roll Call: The Importance of Teacher Attendance. National Council on Teacher Quality, p. 1-14. http://www.nctq.org/dmsView/RollCall_TeacherAttendance: Study of teacher absences in 40 metropolitan school districts. Some strategies used by these districts to reduce absences include payouts for unused time off, rewards for high attendance rates (e.g. tickets to local events), and including attendance data on teacher evaluations. No clear associations were found, however, between different incentive/punitive policies and lower short-term absenteeism, though some improvement was noted in chronic absenteeism.
Impacts of Poor Conditions in Schools on Student Achievement
Earthman, G.I. (2004). Prioritization of 31 Criteria for School Building Adequacy. American Civil Liberties Union Foundation of Maryland. http://www.schoolfunding.info/policy/facilities/ACLUfacilities_report1-04.pdf: The author, a professor emeritus at Virginia Polytechnic Institute and State University, finds that the physical condition of the learning environment influences student performance and educational outcomes. Specifically, his review suggests students in buildings in poor condition score lower on achievement tests than those in functional buildings. The conditions that he finds have the greatest importance on performance are (in order):
(1) Human comfort – i.e., temperatures within the human comfort range as regulated by appropriate HVAC systems (2) Indoor air quality – i.e., appropriate ventilation and filtering systems also as regulated by appropriate HVAC systems (3) Lighting (4) Acoustical control (5) Secondary science laboratories (6) Student capacity – elementary (7) Student capacity – secondary

Page 112
Higgins, S. et al (2005). The Impact of School Environments: A Literature Review. The Center for Learning and Teaching, School of Education, Communication and Language Science, University of New Castle. http://www.ncl.ac.uk/cflat/news/DCReport.pdf: The authors review the literature on the effect of school condition and design, including everything from mechanical systems to classroom layout. They find convincing evidence that while design and quality matter, though the magnitude of effects is heavily influenced by the context in which the school operates (e.g. a poor quality school may be reflective of a community in decline, imposing other ancillary effects on student performance). They also find, however, that small improvements can have a notable positive effect, as they signal to students that their educational environment matters.
Cole, A. L. (2011). Critical Review of Elementary School Design. Architecture + Design Program, Department of Art, Architecture and Art History, University of Massachusetts Amherst. http://scholarworks.umass.edu/cgi/viewcontent.cgi?article=1749&context=theses: An exploratory comparison of two Massachusetts elementary schools with difference designs. The author contrasts a factory model school with an open plan school, and highlights how the two styles influence and are reflected in materials, use, flow, and functionality. Objective assessment of school performance, however, is not considered.
Impacts of School Performance on House Prices
Haurin, D., & Brasington, D. (1996). School Quality and Real House Prices: Inter- and Intrametropolitan Effects. Journal of Housing Economics 5(4), p. 351-368. https://www.researchgate.net/profile/Donald_Haurin/publication/4892839_The_effect_of_property_taxes_on_urban_areas/links/546427b20cf2c0c6aec4fd7c.pdf: Considered a foundational study of school effects on metropolitan house prices, this paper finds that school test scores are the most impactful variable to explain variations in house values. Specifically, each percentage point increase in the pass rate on ninth-grade proficiency exams is associated with a 0.5% increase in house prices. This effect was greater than distance from center cities, transportation accessibility, crime rates, demographic characteristics, average income, and presence of metro area cultural amenities.
Nguyen-Hoang, P. & Yinger, J. (2011). The Capitalization of School Quality into House Values: A Review. Journal of Housing Economics 20, p. 30-48 https://www.researchgate.net/profile/Phuong_Nguyen-Hoang/publication/227419011_The_Capitalization_of_School_Quality_into_House_Values_A_Review/links/55d3943708ae7fb244f58c58.pdf: A detailed review of recent studies (from 2000-2010) on the effect of school quality on house prices. The authors find that, while methodological approaches and the inclusion of different variables greatly affect the outcome of different analyses, house prices are almost always positively associated with school quality, in the range of 1-4% increases in prices for each standard deviation (SD) improvement in test scores. Non-score measures of school quality (i.e. rankings), however, are not associated with differences in house prices in any U.S.-based studies (two European studies did find small effects).
Clapp et al (2007). Which School Attributes Matter? The Influence of School District Performance and Demographic Composition on Property Values. Journal of Urban Economics 63(2), p. 451-466. http://citeseerx.ist.psu.edu/viewdoc/download?doi=10.1.1.534.2194&rep=rep1&type=pdf: The authors compare the simultaneous effect of school quality and neighborhood demographic characteristics on property values in Connecticut from 1994-2004, and find that the latter has more effect than the former. One standard deviation improvement in test scores is associated with a 1.3% increase in house values, while a 10% change in the share of African-American or Hispanic residents in the neighborhood are associated with 3.5% and 4.0% decrease in house values. That the effect of test scores is lower than in other studies that do not account for neighborhood demographic characteristics is taken as
Page 113
evidence that such characteristics are correlated with test scores and should be considered. Impacts of School Closure/Absence on Student Outcomes and Local Community
Bogart, W. T., & Cromwell, B. A. (2000). How Much Is a Neighborhood School Worth? Journal of Urban Economics 47, p. 280-305. https://sites.duke.edu/niou/files/2011/06/BC_neighborhood-school.pdf: A study of school redistricting (which included closing some schools) in an affluent and high-quality district in suburban Cleveland, Ohio in 1987. The authors use a difference-in-difference analysis of a repeat sales index to consider the change in house prices on properties that were sold in the 7 years after the 1987 redistricting, while differentiating between properties that did and did not change their assigned school district. They find that, all else equal (including changes in neighborhood and school racial composition, neighborhood characteristics, school test scores, school physical condition, and the addition of school bus service to the neighborhood due to redistricting), homes that did change districts had sales prices that were 9.9% lower (or $5,738) than those that did not change districts. The effect was found to diminish over time, however. The authors also found that introducing bus service to a neighborhood that did not previously receive it increased property values by 2.6%.
Lyson, T. A. (2002). What Does a School Mean to a Community? Assessing the Social and Economic Benefits of Schools to Rural Villages in New York. Working Paper, Department of Rural Sociology, Cornell University. http://files.eric.ed.gov/fulltext/ED464777.pdf: Comparison of house values and other municipal economic characteristics in small rural villages in New York with and without local schools (though not necessarily as a result of school closures). Using descriptive statistics that do not control for exogenous variables, the author finds that small villages (populations 500 or less) with schools had a median house value that was 32% greater than those without schools, and medium-sized villages (populations 501-2,500) with schools had a median house value that was 16% greater than those without schools. Villages with schools also tended to have newer housing stock, municipal water and sewer systems, less income inequality (though not higher median incomes), lower poverty rates and receipt of public assistance, and higher employment – all of which may also contribute to the higher house values in these communities.
Brasington, D. M (1997). School District Consolidation, Student Performance, and Housing Values. The Journal of Regional Analysis and Policy, 27 (2), p. 43-54. http://www.jrap-journal.org/pastvolumes/1990/v27/27-2-4.pdf: The author looks at municipalities in Ohio, comparing those that share a joint school district with those that maintain independent districts. He finds that consolidated districts have larger schools, which correlates with lower performance on state proficiency exams (i.e. a doubling of school size resulting in 1% lower passage rate). Furthermore, consolidated districts have property values that are $1,344 less than independent districts, all else equal. The author concludes that $400 of this difference (or about a third) is due to the lower passage rate in consolidated districts.
Billger, S. M. (2008). What Happens when the Local High School Closes? “Economies of Size” in Illinois. Working Paper, Department of Economics, Illinois State University. http://citeseerx.ist.psu.edu/viewdoc/download?doi=10.1.1.209.906&rep=rep1&type=pdf: Longitudinal data on public high schools in Illinois (excluding Cook County) reveals determinants and effects when a high school closes and students are absorbed into a neighboring school. Schools that closed had smaller enrollments, less experienced teachers, and were more likely to be located in rural/agricultural communities with little diversity and low incomes/higher poverty. After the closure, house values in these communities declined, but in strong housing markets (i.e. no effect on weak markets with already depressed prices).
Hu, Y. & Yinger, J. (2008). The Impact of School District Consolidation on Housing Prices. National Tax Journal 61(4), p. 609-633.

Page 114
http://sites.maxwell.syr.edu/efap/Publications/Impact_of_Consolidation.pdf: A study of consolidating districts in New York State finds that the impact on house values varies with both the size of the district and economic condition of the community. In very small districts (enrollment <500), the impact of consolidation is an increase in house values of 24%, though this effect shrinks to 5.5% increase in districts with 1,500 students. Similar effects were found on building rents, though the magnitude was less than for house values. When median income of the community is included in the analysis, however, the effect of consolidation turns negative for high-income areas (though it remains positive and significant in low-income areas, and moderately positive in medium-income areas – see Fig 3).

Page 115
APPENDIX B: SUMMARY OF VALUES AND RECOMMENDATIONS Recommendations
Associated objectives/values from public discussions Associated metric/attribute from public discussions Constraints/limitations/concerns from analyst discussions
Value 1 Value 2 Value 3 Metric 1 Metric 2 Metric 3 Constraint 1 Constraint 2 Constraint 3
1. Reduce special education enrollment and costs by enhancing regular education programming, special education data collection and controls, and reducing out-of-district placements.
Improve educational outcomes
Make best use of physical infrastructure
Improve District administration
Educational outcomes
Teacher quality Quality of curricular innovations
Ensure parent buy-in to new SPED programs and evaluations
Increased managerial and data analytic capacity required
Costs of transporting SPED students to central locations and larger schools
2. Increase enrollment in the high school by increasing offerings and incenting students/parents to choose the regional public school for their secondary education.
Increase enrollment
Make best use of physical infrastructure
Improve in-school experience
Class size District reputation
Educational outcomes
Changes in administrator attitudes about marketing to and engaging young people
Time and resources necessary to build partnerships
3. Conduct an outside review of the costs and benefits of the International Baccalaureate program.
Improve educational outcomes
Make District financially sustainable
Improve in-school experience
Curriculum quality
Positive perception of school
Level of teacher engagement and support
Costs and benefits may not be easily comparable
Need to assess weights (priorities) on various impact categories
Define maximum costs that would make IB unsustainable
4. Enhance the District’s nepotism policy to eliminate the perception of preferential hiring for relatives of central office administrators and school committee members.
Maximize school and community values
Maximize District reputation
Improve District administration
Perceived support for community values
Positive perception of administrative leadership
Positive perception of school
Additional administrative oversight
Allow flexibility in implementation where administratively or programmatically essential
Anticipate legal action by passed-over applicants
5. Place accountability for performance with the adults, not with students.
Maximize school and community values
Improve in-school experience
Improve District administration
Perceived support for community values
Level of teacher engagement and support
Sense of community pride
Changing attitudes towards students may cause backlash
Requires examination of core values of District
Need to infuse respect for all students throughout administration
6. Increase transparency in the process of developing the annual budget.
Make District financially sustainable
Improve District administration
Maximize District reputation
Positive perception of administrative leadership
Level of financial resources
Level of community engagement
Improved management of financial data made public
Improved management of public meetings on financial issues
Increased capacity of town members to make sense of financial data
7. Control/moderate fiscal impact of future teachers’ cost of living and annual step increases on the budget.
Make District financially sustainable
Improve District administration
Level of financial resources
Financial health District reputation
Need to define minimum and maximum allowable COLA increases
Manage expectations of teachers
Transparency on both sides to encourage trust

Page 116
Recommendations
Associated objectives/values from public discussions Associated metric/attribute from public discussions Constraints/limitations/concerns from analyst discussions
Value 1 Value 2 Value 3 Metric 1 Metric 2 Metric 3 Constraint 1 Constraint 2 Constraint 3
8. Continue to engage in discussions with surrounding communities around joining the district, negotiating a tuition agreement to accept a community’s pupils in particular grades or otherwise sharing services.
Make District financially sustainable
Make best use of physical infrastructure
Increase enrollment
Level of financial resources
Class size Sense of community pride
Need to compute impacts on metrics to determine optimal size and composition of QRSD
Limit maximum bus routes
Accept reduction in autonomy in larger district
9. Improve communication with students and parents, and increase their sense of commitment to QRSD.
Maximize school and community values
Strengthen local community
Maximize District reputation
Positive perception of administrative leadership
Level of community engagement
District reputation
Need professional help to create, distribute and analyze surveys
Create strategy for communicating results
Change mindset of administrators to give students and parents substantive say into policy and strategy
10. Engage in a multi-town visioning and planning process to develop an action plan to improve economic development and increase the number of families living in the area.
Maximize school and community values
Strengthen local community
Make District financially sustainable
Perceived strength of community
Attractiveness to potential students
District reputation
Planning process will require experts from multiple disciplines
High level of community engagement
Transparency in planning process
11. Amend the regional agreement to provide the School Committee and District administrators with authority to respond to changing enrollment and financial conditions.
Make District financially sustainable
Improve District administration
Make best use of physical infrastructure
Positive perception of administrative leadership
Financial health ‘Tragedy of the commons’ effect may require expert intervention e.g. conflict resolution experts
Increased transparency of financial negotiations
Need increased awareness of need for individual and shared sacrifice for common good.
12. Space use alternatives: Increase enrollment at Quabbin Regional Middle/High School
12a. Transfer 6th graders to the middle school portion of the building.
Make District financially sustainable
Make best use of physical infrastructure
Increase enrollment
Educational outcomes
Level of financial resources
Class size May require ‘community charettes’ so that community members can easily understand impacts of space use alternatives
Introduce ‘teach-ins’ so that community members can productively participate in process
Manage public relations and social media strategies to give voice to different stakeholders but retain influence over community conversation

Page 117
Recommendations
Associated objectives/values from public discussions Associated metric/attribute from public discussions Constraints/limitations/concerns from analyst discussions
Value 1 Value 2 Value 3 Metric 1 Metric 2 Metric 3 Constraint 1 Constraint 2 Constraint 3
12b. Transfer 5th and 6th graders to the middle school portion of the building.
Make District financially sustainable
Make best use of physical infrastructure
Increase enrollment
Educational outcomes
Level of financial resources
Class size May require ‘community charettes’ so that community members can easily understand impacts of space use alternatives
Limit maximum trip time for students making new bus trips
Teachers may require recertification, with workflow and cost implications
12c. Create a “comprehensive” high school that includes academic and vocational programming.
Make District financially sustainable
Make best use of physical infrastructure
Improve in-school experience
Educational outcomes
Level of financial resources
Positive perception of school
May require ‘community charettes’ so that community members can easily understand impacts of space use alternatives
Benefits will be short-lived unless other District financial pressures are addressed.
Manage public relations and social media strategies to give voice to different stakeholders but retain influence over community conversation
13. Space use alternatives: Consolidate elementary school students – Single building alternatives
13a. Close Ruggles Lane (Barre) Elementary School
Make District financially sustainable
Make best use of physical infrastructure
Increase enrollment
Educational outcomes
Level of financial resources
Class size May require ‘community charettes’ so that community members can easily understand impacts of space use alternatives
Limit maximum trip time for students making new bus trips
Manage public relations and social media strategies to give voice to different stakeholders but retain influence over community conversation
13b. Close Hardwick Elementary School
Make District financially sustainable
Make best use of physical infrastructure
Increase enrollment
Educational outcomes
Level of financial resources
Level of community engagement
May require ‘community charettes’ so that community members can easily understand impacts of space use alternatives
Limit maximum trip time for students making new bus trips
Manage public relations and social media strategies to give voice to different stakeholders but retain influence over community conversation

Page 118
Recommendations
Associated objectives/values from public discussions Associated metric/attribute from public discussions Constraints/limitations/concerns from analyst discussions
Value 1 Value 2 Value 3 Metric 1 Metric 2 Metric 3 Constraint 1 Constraint 2 Constraint 3
13c. Close Hubbardston Center Elementary School
Make District financially sustainable
Make best use of physical infrastructure
Increase enrollment
Educational outcomes
Level of financial resources
Level of community engagement
May require ‘community charettes’ so that community members can easily understand impacts of space use alternatives
Limit maximum trip time for students making new bus trips
Manage public relations and social media strategies to give voice to different stakeholders but retain influence over community conversation
13d. Close New Braintree Elementary School
Make District financially sustainable
Make best use of physical infrastructure
Increase enrollment
Educational outcomes
Level of financial resources
Level of community engagement
May require ‘community charettes’ so that community members can easily understand impacts of space use alternatives
Limit maximum trip time for students making new bus trips
Manage public relations and social media strategies to give voice to different stakeholders but retain influence over community conversation
13e. Close Oakham Center Elementary School
Make District financially sustainable
Make best use of physical infrastructure
Increase enrollment
Educational outcomes
Level of financial resources
Level of community engagement
May require ‘community charettes’ so that community members can easily understand impacts of space use alternatives
Introduce ‘teach-ins’ so that community members can productively participate in process
Manage public relations and social media strategies to give voice to different stakeholders but retain influence over community conversation
14. Space use alternatives: Consolidate elementary school students – Multi-building alternatives
14a. Close Hardwick and New Braintree Elementary Schools
Make District financially sustainable
Make best use of physical infrastructure
Improve District administration
Educational outcomes
Level of financial resources
Class size May require ‘community charettes’ so that community members can easily understand impacts of space use alternatives
Introduce ‘teach-ins’ so that community members can productively participate in process
Manage public relations and social media strategies to give voice to different stakeholders but retain influence over community conversation

Page 119
Recommendations
Associated objectives/values from public discussions Associated metric/attribute from public discussions Constraints/limitations/concerns from analyst discussions
Value 1 Value 2 Value 3 Metric 1 Metric 2 Metric 3 Constraint 1 Constraint 2 Constraint 3
14b. Close Hubbardston and New Braintree Elementary Schools
Make District financially sustainable
Make best use of physical infrastructure
Improve District administration
Educational outcomes
Level of financial resources
Class size May require ‘community charettes’ so that community members can easily understand impacts of space use alternatives
Limit maximum trip time for students making new bus trips
Manage public relations and social media strategies to give voice to different stakeholders but retain influence over community conversation
14c. Close New Braintree and Oakham
Elementary Schools
Make District financially sustainable
Make best use of physical infrastructure
Improve District administration
Educational outcomes
Level of financial resources
Variety in facility uses
May require ‘community charettes’ so that community members can easily understand impacts of space use alternatives
Introduce ‘teach-ins’ so that community members can productively participate in process
Encourage discussion about equity impacts related to unequal class sizes
14d. Close Hardwick, New Braintree, and Oakham elementary schools
Make District financially sustainable
Make best use of physical infrastructure
Improve educational outcomes
Educational outcomes
Level of financial resources
Class size May require ‘community charettes’ so that community members can easily understand impacts of space use alternatives
Limit maximum trip time for students making new bus trips
Manage public relations and social media strategies to give voice to different stakeholders but retain influence over community conversation
14e. Close the Hardwick, Hubbardston, and New Braintree elementary schools
Make District financially sustainable
Make best use of physical infrastructure
Improve educational outcomes
Educational outcomes
Level of financial resources
Class size May require ‘community charettes’ so that community members can easily understand impacts of space use alternatives
Introduce ‘teach-ins’ so that community members can productively participate in process
Manage public relations and social media strategies to give voice to different stakeholders but retain influence over community conversation
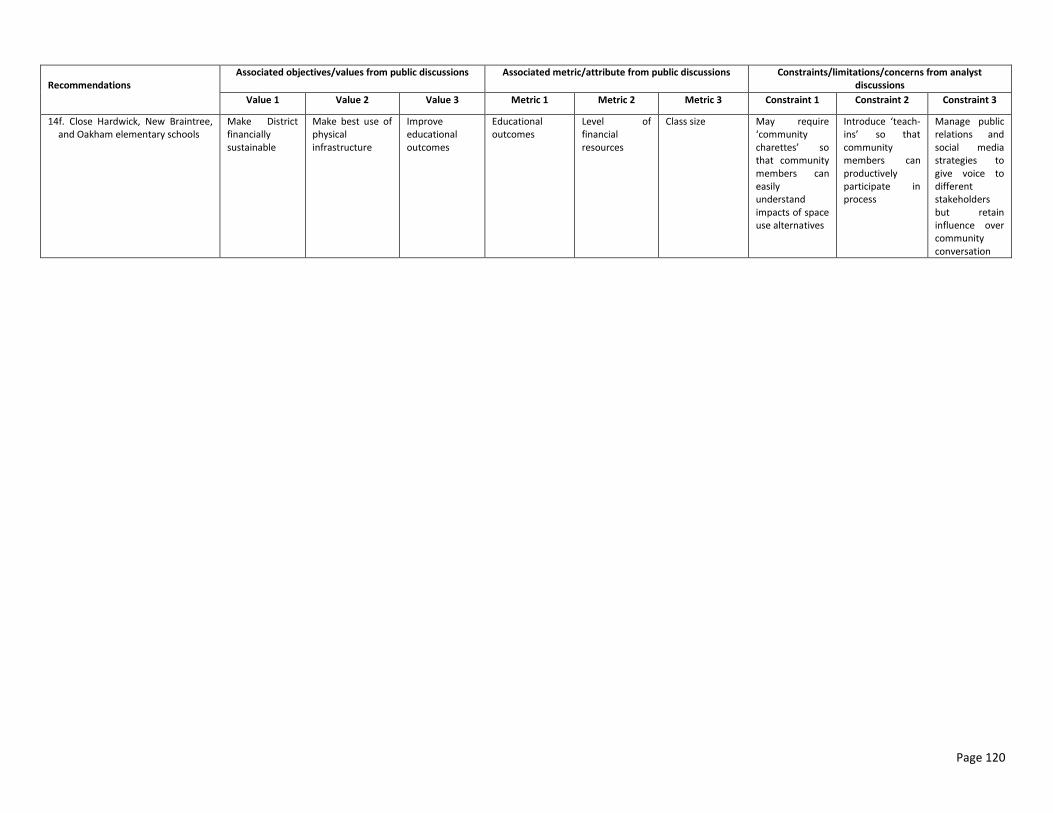
Page 120
Recommendations
Associated objectives/values from public discussions Associated metric/attribute from public discussions Constraints/limitations/concerns from analyst discussions
Value 1 Value 2 Value 3 Metric 1 Metric 2 Metric 3 Constraint 1 Constraint 2 Constraint 3
14f. Close Hardwick, New Braintree, and Oakham elementary schools
Make District financially sustainable
Make best use of physical infrastructure
Improve educational outcomes
Educational outcomes
Level of financial resources
Class size May require ‘community charettes’ so that community members can easily understand impacts of space use alternatives
Introduce ‘teach-ins’ so that community members can productively participate in process
Manage public relations and social media strategies to give voice to different stakeholders but retain influence over community conversation

Page 121
APPENDIX C PARAPROFESSIONAL STAFFING SY2017
Paraprofessional Staffing SY2017
SUM OF FTE Ruggles
Lane Hardwick Hubbardston New
Braintree Oakham Middle School
High School TOTAL
Aide - Therap Prog 0 0 0 0 0 0 1 1
Aide Autism 0 0 0 7 6 3 0 16
Aide ESL 0 0 0 0 0 0 0.9 0.9
Aide Kindergarten 0.3 0.85 0.85 0.9 0 0 0.9 3.8
Aide Media 0 0 0 0 0 0 2 2
Aide Sped 3.9 1 5.4 5.25 1.7 2.8 3.75 23.8
Aide Sped - 1-1 0 0 1 0 1 0 1 3
Aide Sped - Create 0 0 0 0 2 0 0 2
Aide Sped - Involve 0 0 0 0 0 1 2 3
TOTAL 4.2 1.85 7.25 13.15 10.7 6.8 11.55 55.5
COUNT OF PARAS Ruggles
Lane Hardwick Hubbardston New
Braintree Oakham Middle School
High School TOTAL
Aide - Therap Prog 0 0 0 0 0 0 1 1
Aide Autism 0 0 0 7 6 3 0 16
Aide ESL 0 0 0 0 0 0 1 1
Aide Kindergarten 1 1 1 1 0 0 1 5
Aide Media 0 0 0 0 0 0 2 2
Aide Sped 4 1 6 6 2 3 4 26
Aide Sped - 1-1 0 0 1 0 1 0 1 3
Aide Sped - Create 0 0 0 0 2 0 0 2
Aide Sped - Involve 0 0 0 0 0 1 2 3
TOTAL 5 2 8 14 11 7 12 59

Page 122
APPENDIX D TEACHER STIPENDS Elementary Supervisory Stipends
Position FY2017 Stipend
Department Heads* $1790, plus $284 per teacher/counselor supervised
Elementary Guidance Coordinator $1790, plus per teacher/counselor supervised + $150 annually for travel
Elementary Mentor Coordinator $1,000
Secondary Mentor Coordinator $1,000
Elementary Intramurals Instructor $2,000
K-12 Speech Supervisor Stipend of $2239 (Includes two additional work days) + $150 annually for travel
Media Director .10x regular salary based upon experience and professional preparation. Includes ten (10) additional work days.
MCAS Alternate Assessment $100 per ALT Assessment
Music Director $1000 (in addition to his/her regular Department Head stipend)
Middle School/Elementary/Secondary Teacher Leaders Negotiated
Webmaster $10,289 stipend
504 Plan Coordinator $500 stipend
* Department Head stipends (those paid per person) will be prorated for part-time staff members, e.g., • 100% for person teaching 4-6 periods in department • 50% for person teaching 3 periods in department • 17% for person teaching 1 period in department QRSD will allocate no less than $5,000.00 annually to fund elementary teacher leader positions.
Middle/High School Advisors Stipend Schedule
Position FY2017 Stipend
High School Yearbook Advisor $4,476.54
High School Band $2,855.12
Drama Club Advisor $2,801.34
High School Chorus $2,466.29
Drill Team Coach* $2,281.40
Senior Class Advisor $1,969.90
Student Government Advisor $1,773.80
LINKS Crew Advisor $1,773.80
High School Orchestra $1,672.96
National Honor Society Advisor $1,476.86
Junior Class Advisor $1,476.86
Envirothon Coach #1 $1,476.86
Envirothon Coach #2 $1,476.86
SADD Advisor $1,117.18
Sophomore Class Advisor $1,116.06
Freshman Class Advisor $1,116.06
Poetry Club Advisor $887.47
High School Publications $887.47

Page 123
Model Congress/UN Advisor $887.47
Marksmanship Advisor $887.47
Jets Club Advisor $887.47
International Club $887.47
Greenhouse Manager $887.47
Glee Club Advisor^ $887.47
Classics Club Advisor (formerly Latin) $887.47
Chinese Club Advisor $887.47
Blue/Gold Key Advisor $887.47
GSA Advisor $717.14
SAT Coordinator $597.24
Ultimate Frisbee Club Advisor $560.26
Ski Club Advisor $560.26
Sub-Total High School $43,524.96
Middle School Middle School Yearbook $1,904.91
Middle School Student Govt $1,773.80
Middle School Band 7th $1,672.96
Middle School Band 8th $1,672.96
Middle School Chorus $1,672.96
Middle School Orchestra $1,672.96
Washington DC Advisor $1,194.49
Washington DC Bookkeeper $1,194.49
National Jr Honor Society $987.19
Middle School Store $887.47
Sub-Total Middle School $14,634.18
Total Advisor Stipends FY2017 $58,159.10
Nature's Classroom (overnight experiences/$ night) $145.67
Middle/High School Athletic Coaches Stipend Schedule
Sport FY2017 Stipend
High School Football-Varsity $6,082.26
Basketball-Varsity Boys $5,227.29
Basketball-Varsity Girls $5,227.29
Wrestling-Varsity $5,227.29
Baseball-Varsity $4,365.60
Cheerleading-Varsity $4,365.60
Cheerleading-Varsity Football $4,365.60
Field Hockey-Varsity $4,365.60
Soccer-Varsity Boys $4,365.60
Soccer-Varsity Girls $4,365.60
Softball-Varsity $4,365.60
Cross Country-Boys $3,801.97
Cross Country-Girls $3,801.97
Golf-Boys $3,801.97
Golf-Girls $3,801.97
Tennis-Boys $3,801.97
Tennis-Girls $3,801.97

Page 124
Track-Boys $3,801.97
Track-Girls $3,801.97
Indoor Track-Boys $3,420.99
Indoor Track-Girls $3,420.99
Football-Assistant Varsity $3,333.59
Football-JV $3,326.87
Football-Assistant JV $3,326.87
Basketball-JV Boys $3,136.38
Basketball-JV Girls $3,136.38
Wrestling-JV $3,136.38
Baseball-JV $2,852.88
Field Hockey-JV $2,852.88
Soccer-JV Boys $2,852.88
Soccer-JV Girls $2,852.88
Softball-JV $2,852.88
Cheerleading-JV $1,900.42
Sub-Total High School $125,142.35
Middle School Sport 2016-2017
Baseball $2,281.40
Basketball-Boys $2,281.40
Basketball-Girls $2,281.40
Cross Country-Boys $2,281.40
Cross Country-Girls $2,281.40
Field Hockey $2,281.40
Soccer-Boys $2,281.40
Soccer-Girls $2,281.40
Softball $2,281.40
Track-Boys $2,281.40
Track-Girls $2,281.40
Wrestling $2,281.40
Sub-Total Middle School $27,376.84
Total Athletic Stipends FY2017 $152,519.19
Additional Experience Stipend = 2% x # of years of coaching x base salary (max 5 years)

Page 125
APPENDIX E SAMPLE NEPOTISM POLICIES
SAMPLE NEPOTISM POLICIES State Ethics Commission – Advisory on Nepotism http://www.mass.gov/ethics/education-and-training-resources/educational-materials/advisories/advisory-86-02-nepotism.html Concord-Carlisle The School Committees recognize that nepotism in the school system can be detrimental to the efficient conduct of business. No person shall be employed under circumstances which are in violation of Conflict of Interest laws and regulations. Framingham The Committee will not employ any teacher or other employee if such teacher or other employee is the father, mother, brother, sister, wife, husband, son, daughter, son-in-law, daughter-in-law, or brother-in-law of the Superintendent or of any member of the Committee. This shall not apply to any person within such relationship or relationships who has been regularly employed by the Committee prior to the inception of the relationship, the adoption of this policy, or a Committee member's election. Hampton-Wilbraham The District permits the employment of qualified relatives of employees to the extent that such employment does not, in the opinion of the District, create a conflict of interest or the appearance of a conflict of interest. For the purposes of this policy, relatives are defined as immediate family members of the employee: his/her spouse and their respective parents, children, brothers, and sisters. No employee shall be permitted to work within the "chain of command" of a relative such that one relative's work responsibilities, salary or career progress could be determined by the other relative or influenced to the degree that a conflict of interest or appearance of conflict could be created. Individuals who are related based upon the definition contained in the above paragraph are permitted to work in the same program or building, to the extent that no direct reporting, supervisory or management relationship exists. Should any conflicts arise as a result of passage of this policy, reassignments or transfers shall be in accordance with relevant collective bargaining agreements. In cases where a conflict is determined not to exist, the following requirements must still be met: In accordance with the provisions of the

Page 126
Education Reform Act of 1993, the District will neither employ a member of the immediate family (see above) of the Superintendent, Central Office administrators, or School Committee members or assign a member of the immediate family (see above) of the Principal as an employee at the Principal's school unless written notice is given to the School Committee of the proposal to employ at least two weeks in advance of such person's employment or assignment. Hanover A School Committee member, or any member of his/her family, shall not have any direct or indirect pecuniary interest in or contract with the school district, nor shall he/she furnish directly any labor, equipment or supplies to the district. No member of the School Committee shall be employed as an employee in any public school within the district, regardless of the remuneration or the number of hours worked. The Hanover School Department shall not hire, in any capacity, a member of the immediate family of a School Committee member, the Superintendent, or any member of the administrative team of the school system. The Superintendent, or any member of the administrative staff, shall not use his/her position to obtain employment for him/her, family members, or close associates

Page 127
APPENDIX F COST SAVINGS CALCULATIONS FOR SPACE ALTERNATIVES
Cost Savings Calculations for Space Alternatives
Configuration
Savings Building Closure
Potential Teaching Positions
Saved
Savings District
Efficiencies
Total Estimated
Savings Year Two Savings Buses
Move 6th to Middle School $0 2 $59,932 $59,932 $110,706 Assume one additional bus required to move 6th
to MS, in larger towns swap one elementary for additional MS/HS
Move 5th and 6th to Middle Sch. $0 3 $74,648 $74,648 $161,484 Assume two additional buses required to move
5th and 6th to MS, in larger towns swap one elementary for additional MS/HS
Move 6th; Close New Braintree $244,278 2 $7,564 $251,841 $318,417 One additional MS bus, no additional bus needed
when NB closed
Move 6th; Close Hardwick $412,544 7 $148,075 $560,618 $742,619 One additional bus for MS; one bus to transport
Hardwick to Barre in less than 60 minutes
Move 6th; Close Oakham $399,599 5 $53,519 $453,119 $601,672 One additional bus for MS; one bus to transport
Oakham to Barre in less than 60 minutes
Move 6th; Close Hubbardston $444,077 4 -$17,617 $426,460 $585,490 One additional bus for MS; two buses to transport
Hubbardston to Barre in less than 60 minutes
Move 6th; Close Barre $505,986 7 $100,693 $606,679 $816,874 One additional bus for MS; two buses to transport
Barre to Hubbardston, Oakham and New Braintree in less than 60 minutes
Move 6th, Close NB & HUB $688,354 4 -$69,985 $618,369 $793,200
Move 6th, Close NB & OAK $643,877 6 $46,370 $690,246 $869,310
Move 6th, Close NB & HAR $656,821 7 $95,706 $752,528 $950,330
Move 6th, Close HAR, NB & OAK $1,056,421 12 $179,726 $1,236,146 $1,561,152
Move 5th&6th, Close HUB, HAR & NB
$1,100,898 8 -$58,558 $1,042,339 $1,355,735
Move 5th&6th, Close HAR, NB & OAK
$1,056,421 11 $104,010 $1,160,430 $1,492,074

Page 128
THIS PAGE IS INTENTIONALLY BLANK
ABOUT THE CENTER
The Edward J. Collins, Jr. Center for Public Management in the McCormack Graduate School of Policy and Global Studies at the University of Massachusetts Boston was established in 2008 to improve the efficiency and effectiveness of all levels of government. The Center is funded by the Commonwealth and through fees charged for its services.
Edward J. Collins, Jr. Center for Public Management John W. McCormack Graduate School of Policy and Global Studies
University of Massachusetts Boston 100 Morrissey Blvd. Boston, MA 02125 (617) 287-4824 (t) (617) 287-5566 (f)
http://www.umb.edu/cpm