Embed Size (px)
Citation preview
COST-EFFECTIVENESS OF CANAGLIFLOZIN VERSUS SITAGLIPTIN WHEN ADDED TO METFORMIN AND SULFONYLUREA IN TYPE 2 DIABETES IN CANADA Suthakar Sabapathy1, Cheryl Neslusan2, Kim Yoong1, Anna Teschemaker2, Pierre Johansen3, Michael Willis3 1Janssen Inc., Toronto, Ontario, Canada; 2Janssen Global Services, LLC, Raritan, NJ, USA; 3The Swedish Institute for Health Economics, Lund, Sweden Corresponding Author: [email protected] _____________________________________________________________________________________ ABSTRACT Background Canagliflozin, an agent that inhibits sodium glucose co-transporter 2, is approved as add-on to metformin plus sulfonylurea for the treatment of type 2 diabetes in Canada. Canagliflozin offers greater glycemic control, as well as important additional benefits such as weight loss and blood pressure reductions, versus dipeptidyl peptidase-4 inhibitors such as sitagliptin. Objective This analysis evaluated the cost-effectiveness of canagliflozin 300 mg and canagliflozin 100 mg versus sitagliptin 100 mg in patients with type 2 diabetes inadequately controlled on metformin plus sulfonylurea from the perspective of the Canadian Agency for Drugs and Technologies in Health. Methods A 40-year cost-effectiveness analysis was performed using the validated Economic and Health Outcomes Model of Type 2 Diabetes Mellitus (ECHO-T2DM). Patient characteristics, treatment effects, and rates of hypoglycemia and adverse events were sourced from the canagliflozin clinical program. Canada-specific costs and utilities were applied. Sensitivity analyses were conducted using alternative values for key model inputs. Results Both canagliflozin 300 and 100 mg dominated sitagliptin 100 mg over 40 years, providing quality-adjusted life-year gains of 0.31 and 0.28, and cost offsets of $2,217 and $2,560, respectively. Both canagliflozin doses dominated sitagliptin in each of the sensitivity analyses. Conclusions Simulation results suggested that canagliflozin 300 and 100 mg provided better health outcomes and lower costs than sitagliptin 100 mg as a third-line therapy added-on to metformin and sulfonylurea in patients with type 2 diabetes in Canada. Key Words: Canagliflozin, cost-effectiveness analysis, sitagliptin, third-line therapy, type 2 diabetes
n 2010, an estimated 6.4% of people ≥12 years of age were living with diabetes in Canada.1
The majority (~90%) had type 2 diabetes mellitus (T2DM), which is characterized by chronic hyperglycemia, insulin resistance, and decreased β-cell function.2 Inadequately controlled T2DM is
associated with increased risks of debilitating micro- and macrovascular complications and an elevated risk of premature mortality.2 Overall, diabetes management imposes a substantial economic burden to patients and payers, as annual health care costs in Canada are 3 to 4 times higher
I
J Popul Ther Clin Pharmacol Vol 23(2):e151-e168; July 15, 2016
© 2016 Journal of Population Therapeutics and Clinical Pharmacology. All rights reserved. e151
Cost-effectiveness of canagliflozin versus sitagliptin when added to metformin and sulfonylurea in type 2 diabetes in Canada
for patients with diabetes compared to individuals without diabetes3,4 and the total economic burden of diabetes in 2010 was estimated to be ~$12.2 billion (with direct costs accounting for 3.5% of public health care spending).5
The Canadian Diabetes Association (CDA) recommends maintaining glycated hemoglobin (HbA1c) <7.0% for most patients with T2DM to reduce the risk of complications, combined with a multifactorial therapeutic approach to control risk factors including weight, blood pressure (BP), and lipid levels.6 However, despite the variety of available anti-hyperglycemic agents (AHAs) and anti-hypertensive and lipid-lowering medications, a recent survey of primary care physicians in Canada found that only ~50% of their patients with T2DM achieved HbA1c ≤7.0%, and only 13% achieved HbA1c ≤7.0%, low-density lipoprotein cholesterol (LDL-C) ≤77 mg/dL (2.0 mmol/L), and BP <130/80 mmHg, indicating a substantial unmet need.7
Lifestyle modifications, including improved diet and exercise, are the cornerstone of T2DM management. However, in order to meet glycemic targets, most patients require pharmacologic therapy with AHAs.6 Metformin is the standard first-line pharmacologic therapy for T2DM, and initially provides adequate control for many patients. Given the progressive nature of T2DM however, AHA combination therapy is often required to reach HbA1c target levels over the long run. The CDA recommends that subsequent AHAs be individualized according to patient characteristics,6 and the Canadian Agency for Drugs and Technologies in Health (CADTH) issued Optimal Use Reports to aid in the selection of efficacious and cost-effective second- and third-line therapies for patients with T2DM in Canada.8,9 For example, CADTH considered the combination of metformin and sulfonylurea to be cost-effective for dual therapy,8 and when additional glycemic control is needed, neutral protamine Hagedorn (NPH) insulin was found to be cost-effective for third-line therapy.9 Because insulin is a poor option for many patients, CADTH designated dipeptidyl peptidase-4 (DPP-4) inhibitors as a cost-effective choice for third-line therapy in those patients9; they are currently
the most commonly used product class for third-line therapy in Canada (with sitagliptin being the current market leader in this class).10 DPP-4 inhibitors lower blood glucose by increasing incretin levels, thereby lowering glucagon secretion and increasing insulin secretion.11 Compared with insulin, which is associated with weight gain and an increased risk of hypoglycemia, DPP-4 inhibitors have minimal or neutral effects on weight and a low inherent risk of hypoglycemia.11
A new type of AHA lowers glucose by inhibiting sodium glucose co-transporter 2 (SGLT2) and is available in Canada for the treatment of adults with T2DM. SGLT2 inhibition lowers plasma glucose levels in patients with T2DM by decreasing the renal threshold for glucose (RTG), thereby increasing urinary glucose excretion (UGE) and leading to a mild osmotic diuresis and a net caloric loss.12 Furthermore, there is an intrinsically low risk of hypoglycemia with SGLT2 inhibition since the lowered RTG remains above the defined threshold for hypoglycemia (≥70 mg/dL [3.9 mmol/L]). As this mechanism of action works independently of insulin, it is complementary to other AHAs (including exogenous insulin).
Canagliflozin was the first agent in this class to be approved in Canada, and it is recommended by CADTH as an add-on to metformin plus sulfonylurea when insulin is not an option.13 In Phase 3 studies, canagliflozin has demonstrated multiple benefits for the treatment of T2DM, including dose-dependent reductions in HbA1c, body weight, and systolic BP (SBP) when used in combination with various background AHAs.14 Canagliflozin was associated with an increased incidence of adverse events (AEs) potentially related to the mechanism of SGLT2 inhibition, such as genital mycotic infections (e.g., yeast infections) and urinary tract infections.14 However, it was generally well tolerated, as evidenced by the low rate of discontinuations attributable to AEs.14
The unique renal mechanism of glucose lowering with SGLT2 inhibition could provide renoprotection in patients with T2DM and is being evaluated in ongoing clinical trials.15,16 Across studies, transient reductions in estimated
J Popul Ther Clin Pharmacol Vol 23(2):e151-e168; July 15, 2016
© 2016 Journal of Population Therapeutics and Clinical Pharmacology. All rights reserved. e152
Cost-effectiveness of canagliflozin versus sitagliptin when added to metformin and sulfonylurea in type 2 diabetes in Canada
glomerular filtration rate (eGFR) were seen with canagliflozin shortly after treatment initiation that attenuated and stabilized near baseline levels with prolonged treatment; this effect was sustained over at least 2 years, the longest follow-up with canagliflozin to date.15 Consistent with this finding from the canagliflozin clinical trial program is a recently reported finding on the SGLT2 inhibitor empagliflozin in the EMPA-REG OUTCOME trial, in which eGFR was observed to remain stable in T2DM patients treated with this SGLT2 inhibitor over the full 4 years of follow-up.17 Longer-term studies of canagliflozin including the CANagliflozin cardioVascular Assessment Study renal endpoints (CANVAS-R; ClinicalTrials.gov identifier, NCT01989754) and the Canagliflozin and Renal Events in Diabetes with Established Nephropathy Clinical Evaluation (CREDENCE; NCT02065791) trials will formally evaluate the potential renoprotective effects of canagliflozin in patients with T2DM. While data from some clinical studies of DPP-4 inhibitors have signaled that this class may also exhibit renoprotective effects, there is no mechanistic explanation for this effect beyond glucose lowering.18 Furthermore, there was no evidence for renoprotection with sitagliptin based on evidence from the Trial Evaluating Cardiovascular Outcomes Study (TECOS).19
Due to the growing burden of T2DM in Canada, strategies to better control the multiple risk factors of T2DM are needed, which could lead to lower long-term costs of managing T2DM and its complications. SGLT2 inhibitors, like canagliflozin, may be suitable alternatives for patients requiring third-line therapy in Canada due to their good glycemic control and low intrinsic risk of hypoglycemia, along with the added benefits of weight loss and BP reduction. However, the most recent CADTH Optimal Use Report for third-line therapy was released before SGLT2 inhibitors were available in Canada, so evaluation of the cost-effectiveness of canagliflozin in this line of therapy versus other AHAs was not included. CADTH is currently in the process of updating its Optimal Use Report for third-line therapy, in which SGLT2 inhibitors will be included, but it is yet to be published.20 Given
the chronic nature of T2DM, the benefits of treatment interventions are fully realized only over long time horizons. Few clinical trials have sufficiently long durations to capture the long-run consequences of T2DM intervention,21,22 so economic computer modeling has become a widely used and accepted tool for generating economic evidence (e.g., expected long-term health outcomes and costs of alternative competing interventions).21,22
In this paper, we describe a cost-effectiveness evaluation investigating the use of canagliflozin versus sitagliptin in patients with T2DM inadequately controlled with metformin plus sulfonylurea from the perspective of CADTH in Canada.
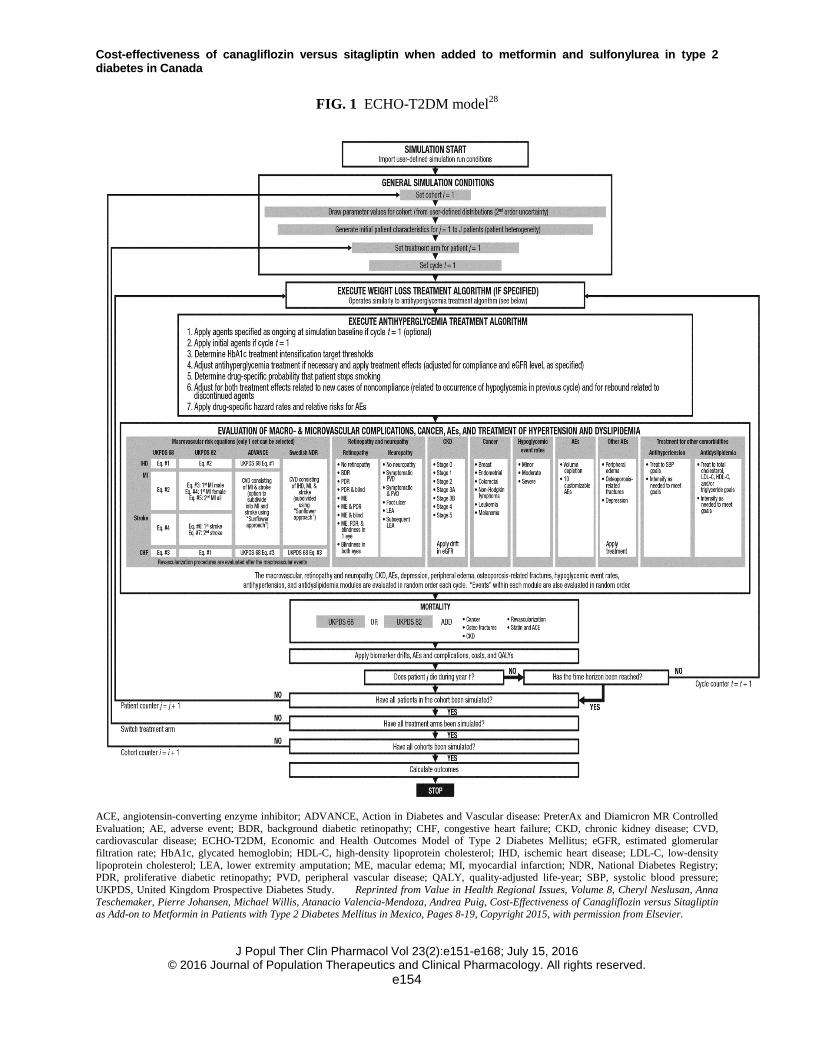
METHODS Model Overview and Simulation Description The Economic and Health Outcomes Model of T2DM (ECHO-T2DM) was used to perform the simulations. ECHO-T2DM is a stochastic, Markov-based, microsimulation model for estimating the cost-effectiveness of alternative treatments for T2DM. It has been reviewed by health technology assessment (HTA) agencies, including CADTH and Québec Institut National d’Excellence en Santé et en Services (INESSS) in Canada, the UK National Institute for Health and Care Excellence (NICE), Scottish Medicines Consortium (SMC), and the National Centre for Pharmacoeconomics (NCPE) in Ireland. The analyses were performed in accordance with CADTH’s guidelines for economic evaluations.23 ECHO-T2DM has been externally validated24,25 and has participated in the 3 most recent Mount Hood Challenges, in which diabetes modelers meet biennially and conduct cross-validation exercises.21,26,27 The application of ECHO-T2DM to cost-effectiveness simulations using data from the canagliflozin program has been described previously.28
In ECHO-T2DM, health is captured with Markov health states reflective of T2DM, including micro- and macrovascular complications, hypoglycemia and treatment-related AEs, and mortality (Figure 1).24
J Popul Ther Clin Pharmacol Vol 23(2):e151-e168; July 15, 2016
© 2016 Journal of Population Therapeutics and Clinical Pharmacology. All rights reserved. e153
Cost-effectiveness of canagliflozin versus sitagliptin when added to metformin and sulfonylurea in type 2 diabetes in Canada
FIG. 1 ECHO-T2DM model28
ACE, angiotensin-converting enzyme inhibitor; ADVANCE, Action in Diabetes and Vascular disease: PreterAx and Diamicron MR Controlled Evaluation; AE, adverse event; BDR, background diabetic retinopathy; CHF, congestive heart failure; CKD, chronic kidney disease; CVD, cardiovascular disease; ECHO-T2DM, Economic and Health Outcomes Model of Type 2 Diabetes Mellitus; eGFR, estimated glomerular filtration rate; HbA1c, glycated hemoglobin; HDL-C, high-density lipoprotein cholesterol; IHD, ischemic heart disease; LDL-C, low-density lipoprotein cholesterol; LEA, lower extremity amputation; ME, macular edema; MI, myocardial infarction; NDR, National Diabetes Registry; PDR, proliferative diabetic retinopathy; PVD, peripheral vascular disease; QALY, quality-adjusted life-year; SBP, systolic blood pressure; UKPDS, United Kingdom Prospective Diabetes Study. Reprinted from Value in Health Regional Issues, Volume 8, Cheryl Neslusan, Anna Teschemaker, Pierre Johansen, Michael Willis, Atanacio Valencia-Mendoza, Andrea Puig, Cost-Effectiveness of Canagliflozin versus Sitagliptin as Add-on to Metformin in Patients with Type 2 Diabetes Mellitus in Mexico, Pages 8-19, Copyright 2015, with permission from Elsevier.
J Popul Ther Clin Pharmacol Vol 23(2):e151-e168; July 15, 2016
© 2016 Journal of Population Therapeutics and Clinical Pharmacology. All rights reserved. e154

Cost-effectiveness of canagliflozin versus sitagliptin when added to metformin and sulfonylurea in type 2 diabetes in Canada
The cycle length is 1 year and the time
horizon is defined by the user. ECHO-T2DM accounts explicitly for both first-order uncertainty (due to patient-level variability) and second-order uncertainty (related to uncertainty regarding the true value of the underlying parameters). Cohorts of individual hypothetical patients with T2DM are generated based on initial patient demographics, biomarker values, and disease indicators observed in randomized controlled trials. Risk factor clustering of key biomarkers is supported (e.g., individuals who have higher body mass index [BMI] values tend to have less favorable cholesterol values).29 Biomarker values are updated annually to reflect changes associated with treatments and any underlying deterioration in the biomarkers over time.30
The hypothetical patients are assigned risks for micro- and macrovascular complications and for mortality that are individualized to patient characteristics using risk functions. Transition probabilities for microvascular health states are sourced from previous modeling efforts in this area and reflect differences in HbA1c levels and/or duration of T2DM.31-33 ECHO-T2DM supports multiple sets of macrovascular and mortality event risk prediction equations; in this analysis, risk functions from the United Kingdom Prospective Diabetes Study (UKPDS 82) were used.34 Specifically, the UKPDS 82 risk equations include the 4 macrovascular complications included in ECHO-T2DM (including second events for myocardial infarction [MI] and stroke and separate risks for first MI events for males and females) and 4 unique mortality risk equations (the one used at each time point depending on whether an individual patient has a prior history of diabetes-related complications and has experienced an event during the current cycle). The risks are tailored to each patient’s current health history (including age, gender, disease duration, biomarker values, and micro- and macrovascular health history) at each point in time.
A treatment algorithm based on treatment thresholds was used to simulate AHA treatment over time; AHAs can be added or changed to maintain HbA1c target values and/or avoid AEs
(including an option for contraindication, which can result in discontinuation). Treatment algorithms for medical management of hypertension and dyslipidemia can be applied where treatment can be intensified when BP and lipid targets are not met. Deterioration of patient biomarker values are accounted for via specification of annualized measures of deterioration in biomarkers over time (i.e., “drifts”; HbA1c, 0.14%; SBP, 0.3 mmHg; lipids, 0.3 mg/dL), which are updated within each cycle.30,35 Natural deterioration of eGFR over time occurs in line with the validated Centers for Disease Control and Prevention (CDC) Model of Chronic Kidney Disease (CKD).33 Specifically, eGFR declines by 1.1, 4.1, 2.8, and 5.2 mL/min/1.73 m2 per cycle in patients with eGFR >60 mL/min/1.73 m2 and normoalbuminuria, eGFR >60 mL/min/1.73 m2 and albuminuria, eGFR <60 mL/min/1.73 m2 and normoalbuminuria, and eGFR <60 mL/min/1.73 m2 and albuminuria, respectively.33,36
ECHO-T2DM can accommodate parameterizing up to 3 different levels of severity for hypoglycemic events. In the present application, severe and non-severe symptomatic hypoglycemic episodes were modeled, where severe was defined as episodes requiring the assistance of another individual or resulting in seizure or loss of consciousness and non-severe symptomatic was defined as symptoms accompanied by a glucose reading ≤70 mg/dL (3.9 mmol/L) that were not considered to be severe. AEs potentially associated with the SGLT2 mechanism of action (e.g., genital mycotic infections [e.g., yeast infections],37 urinary tract infections38) were also included explicitly.
Costs were assigned individually for each patient based on treatment, micro- and macrovascular complications, severe hypoglycemic events, and AEs experienced during the simulation (i.e., according to individual patient histories). Patient preferences for health states were captured similarly using quality-adjusted life-year (QALY) disutility weights (i.e., decrements in quality of life). Model outcomes include life-years (LYs) and QALYs; cost and cost-effectiveness metrics; biomarker evolution curves; cumulative incidences for each type of health outcome; and relative risk
J Popul Ther Clin Pharmacol Vol 23(2):e151-e168; July 15, 2016
© 2016 Journal of Population Therapeutics and Clinical Pharmacology. All rights reserved. e155
Cost-effectiveness of canagliflozin versus sitagliptin when added to metformin and sulfonylurea in type 2 diabetes in Canada
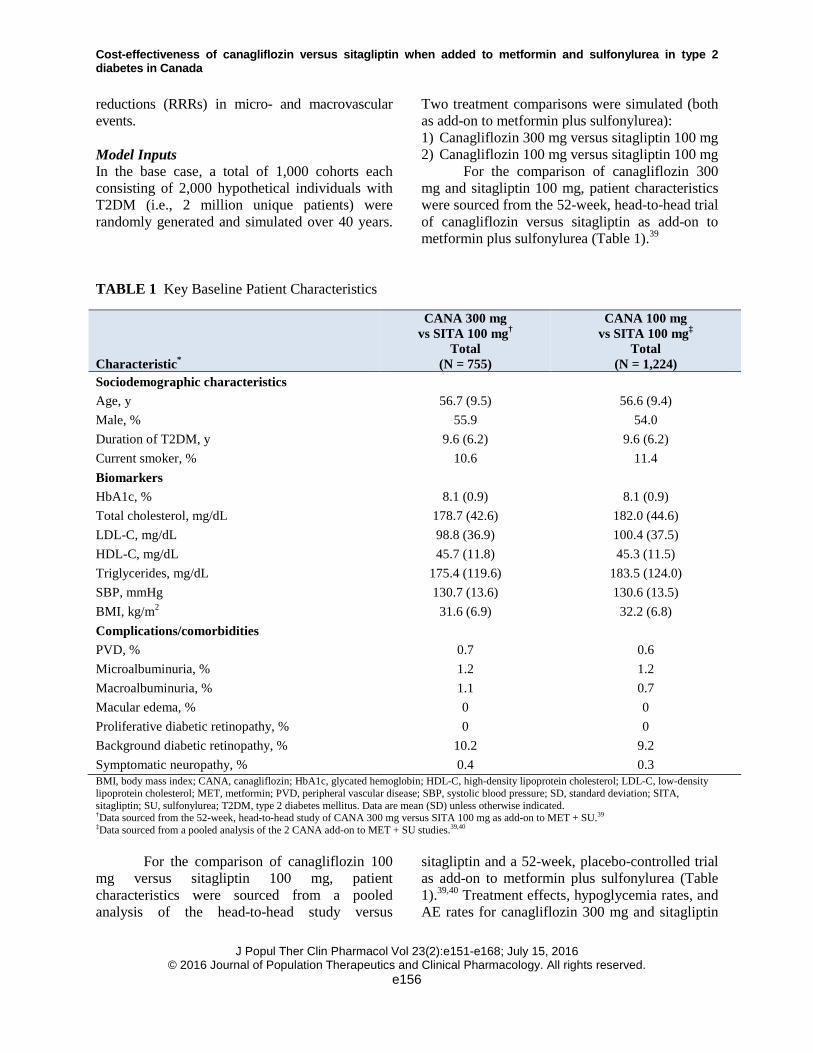
reductions (RRRs) in micro- and macrovascular events. Model Inputs In the base case, a total of 1,000 cohorts each consisting of 2,000 hypothetical individuals with T2DM (i.e., 2 million unique patients) were randomly generated and simulated over 40 years.
Two treatment comparisons were simulated (both as add-on to metformin plus sulfonylurea): 1) Canagliflozin 300 mg versus sitagliptin 100 mg 2) Canagliflozin 100 mg versus sitagliptin 100 mg
For the comparison of canagliflozin 300 mg and sitagliptin 100 mg, patient characteristics were sourced from the 52-week, head-to-head trial of canagliflozin versus sitagliptin as add-on to metformin plus sulfonylurea (Table 1).39
TABLE 1 Key Baseline Patient Characteristics
Characteristic*
CANA 300 mg vs SITA 100 mg†
Total (N = 755)
CANA 100 mg vs SITA 100 mg‡
Total (N = 1,224)
Sociodemographic characteristics Age, y 56.7 (9.5) 56.6 (9.4) Male, % 55.9 54.0 Duration of T2DM, y 9.6 (6.2) 9.6 (6.2) Current smoker, % 10.6 11.4 Biomarkers HbA1c, % 8.1 (0.9) 8.1 (0.9) Total cholesterol, mg/dL 178.7 (42.6) 182.0 (44.6) LDL-C, mg/dL 98.8 (36.9) 100.4 (37.5) HDL-C, mg/dL 45.7 (11.8) 45.3 (11.5) Triglycerides, mg/dL 175.4 (119.6) 183.5 (124.0) SBP, mmHg 130.7 (13.6) 130.6 (13.5) BMI, kg/m2 31.6 (6.9) 32.2 (6.8) Complications/comorbidities PVD, % 0.7 0.6 Microalbuminuria, % 1.2 1.2 Macroalbuminuria, % 1.1 0.7 Macular edema, % 0 0 Proliferative diabetic retinopathy, % 0 0 Background diabetic retinopathy, % 10.2 9.2 Symptomatic neuropathy, % 0.4 0.3 BMI, body mass index; CANA, canagliflozin; HbA1c, glycated hemoglobin; HDL-C, high-density lipoprotein cholesterol; LDL-C, low-density lipoprotein cholesterol; MET, metformin; PVD, peripheral vascular disease; SBP, systolic blood pressure; SD, standard deviation; SITA, sitagliptin; SU, sulfonylurea; T2DM, type 2 diabetes mellitus. Data are mean (SD) unless otherwise indicated. †Data sourced from the 52-week, head-to-head study of CANA 300 mg versus SITA 100 mg as add-on to MET + SU.39 ‡Data sourced from a pooled analysis of the 2 CANA add-on to MET + SU studies.39,40
For the comparison of canagliflozin 100 mg versus sitagliptin 100 mg, patient characteristics were sourced from a pooled analysis of the head-to-head study versus
sitagliptin and a 52-week, placebo-controlled trial as add-on to metformin plus sulfonylurea (Table 1).39,40 Treatment effects, hypoglycemia rates, and AE rates for canagliflozin 300 mg and sitagliptin
J Popul Ther Clin Pharmacol Vol 23(2):e151-e168; July 15, 2016
© 2016 Journal of Population Therapeutics and Clinical Pharmacology. All rights reserved. e156
Cost-effectiveness of canagliflozin versus sitagliptin when added to metformin and sulfonylurea in type 2 diabetes in Canada
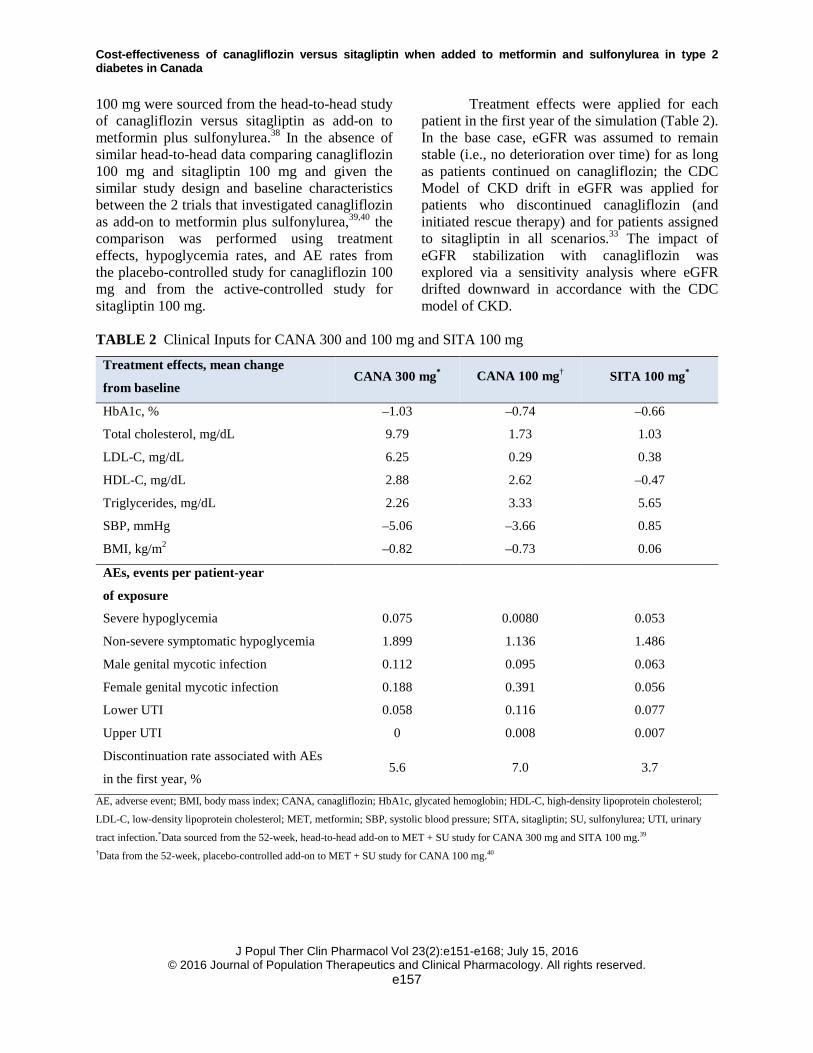
100 mg were sourced from the head-to-head study of canagliflozin versus sitagliptin as add-on to metformin plus sulfonylurea.38 In the absence of similar head-to-head data comparing canagliflozin 100 mg and sitagliptin 100 mg and given the similar study design and baseline characteristics between the 2 trials that investigated canagliflozin as add-on to metformin plus sulfonylurea,39,40 the comparison was performed using treatment effects, hypoglycemia rates, and AE rates from the placebo-controlled study for canagliflozin 100 mg and from the active-controlled study for sitagliptin 100 mg.
Treatment effects were applied for each patient in the first year of the simulation (Table 2). In the base case, eGFR was assumed to remain stable (i.e., no deterioration over time) for as long as patients continued on canagliflozin; the CDC Model of CKD drift in eGFR was applied for patients who discontinued canagliflozin (and initiated rescue therapy) and for patients assigned to sitagliptin in all scenarios.33 The impact of eGFR stabilization with canagliflozin was explored via a sensitivity analysis where eGFR drifted downward in accordance with the CDC model of CKD.
TABLE 2 Clinical Inputs for CANA 300 and 100 mg and SITA 100 mg
Treatment effects, mean change
from baseline CANA 300 mg* CANA 100 mg† SITA 100 mg*
HbA1c, % –1.03 –0.74 –0.66
Total cholesterol, mg/dL 9.79 1.73 1.03
LDL-C, mg/dL 6.25 0.29 0.38
HDL-C, mg/dL 2.88 2.62 –0.47
Triglycerides, mg/dL 2.26 3.33 5.65
SBP, mmHg –5.06 –3.66 0.85
BMI, kg/m2 –0.82 –0.73 0.06
AEs, events per patient-year
of exposure
Severe hypoglycemia 0.075 0.0080 0.053
Non-severe symptomatic hypoglycemia 1.899 1.136 1.486
Male genital mycotic infection 0.112 0.095 0.063
Female genital mycotic infection 0.188 0.391 0.056
Lower UTI 0.058 0.116 0.077
Upper UTI 0 0.008 0.007
Discontinuation rate associated with AEs
in the first year, % 5.6 7.0 3.7
AE, adverse event; BMI, body mass index; CANA, canagliflozin; HbA1c, glycated hemoglobin; HDL-C, high-density lipoprotein cholesterol;
LDL-C, low-density lipoprotein cholesterol; MET, metformin; SBP, systolic blood pressure; SITA, sitagliptin; SU, sulfonylurea; UTI, urinary
tract infection.*Data sourced from the 52-week, head-to-head add-on to MET + SU study for CANA 300 mg and SITA 100 mg.39 †Data from the 52-week, placebo-controlled add-on to MET + SU study for CANA 100 mg.40
J Popul Ther Clin Pharmacol Vol 23(2):e151-e168; July 15, 2016
© 2016 Journal of Population Therapeutics and Clinical Pharmacology. All rights reserved. e157
Cost-effectiveness of canagliflozin versus sitagliptin when added to metformin and sulfonylurea in type 2 diabetes in Canada
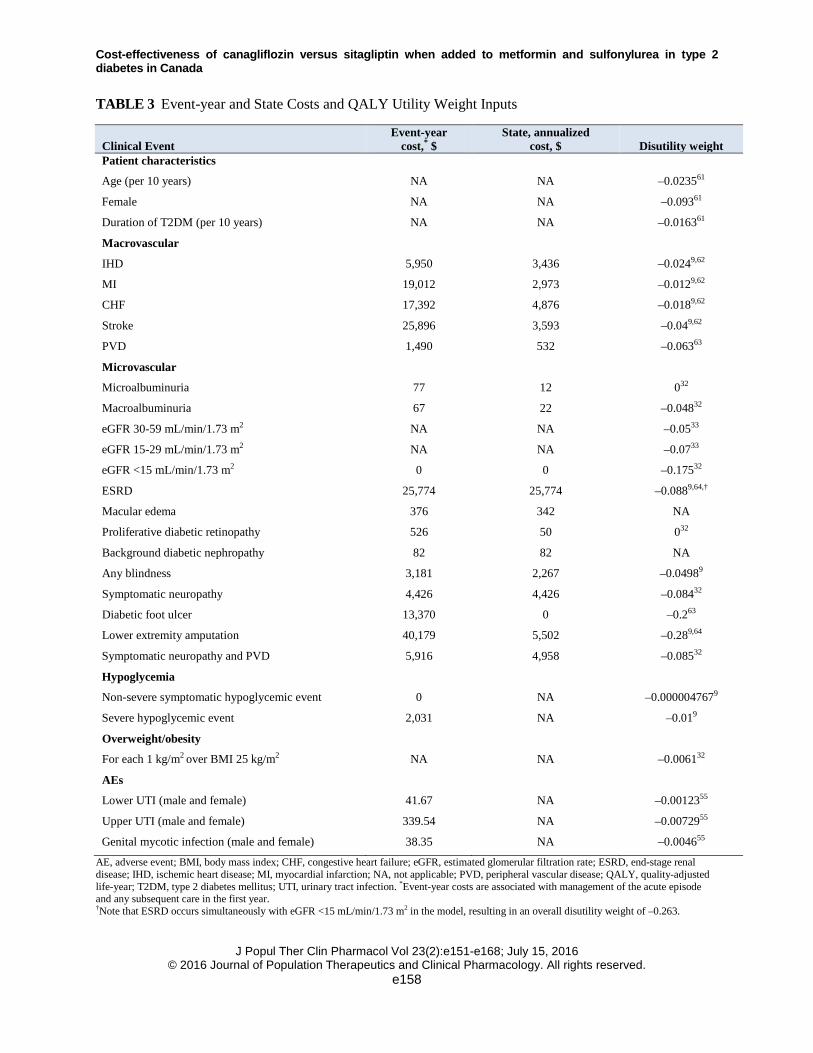
TABLE 3 Event-year and State Costs and QALY Utility Weight Inputs
Clinical Event Event-year
cost,* $ State, annualized
cost, $ Disutility weight Patient characteristics
Age (per 10 years) NA NA –0.023561
Female NA NA –0.09361
Duration of T2DM (per 10 years) NA NA –0.016361
Macrovascular
IHD 5,950 3,436 –0.0249,62
MI 19,012 2,973 –0.0129,62
CHF 17,392 4,876 –0.0189,62
Stroke 25,896 3,593 –0.049,62
PVD 1,490 532 –0.06363
Microvascular
Microalbuminuria 77 12 032
Macroalbuminuria 67 22 –0.04832
eGFR 30-59 mL/min/1.73 m2 NA NA –0.0533
eGFR 15-29 mL/min/1.73 m2 NA NA –0.0733
eGFR <15 mL/min/1.73 m2 0 0 –0.17532
ESRD 25,774 25,774 –0.0889,64,†
Macular edema 376 342 NA
Proliferative diabetic retinopathy 526 50 032
Background diabetic nephropathy 82 82 NA
Any blindness 3,181 2,267 –0.04989
Symptomatic neuropathy 4,426 4,426 –0.08432
Diabetic foot ulcer 13,370 0 –0.263
Lower extremity amputation 40,179 5,502 –0.289,64
Symptomatic neuropathy and PVD 5,916 4,958 –0.08532
Hypoglycemia
Non-severe symptomatic hypoglycemic event 0 NA –0.0000047679
Severe hypoglycemic event 2,031 NA –0.019
Overweight/obesity
For each 1 kg/m2 over BMI 25 kg/m2 NA NA –0.006132
AEs
Lower UTI (male and female) 41.67 NA –0.0012355
Upper UTI (male and female) 339.54 NA –0.0072955
Genital mycotic infection (male and female) 38.35 NA –0.004655
AE, adverse event; BMI, body mass index; CHF, congestive heart failure; eGFR, estimated glomerular filtration rate; ESRD, end-stage renal disease; IHD, ischemic heart disease; MI, myocardial infarction; NA, not applicable; PVD, peripheral vascular disease; QALY, quality-adjusted life-year; T2DM, type 2 diabetes mellitus; UTI, urinary tract infection. *Event-year costs are associated with management of the acute episode and any subsequent care in the first year. †Note that ESRD occurs simultaneously with eGFR <15 mL/min/1.73 m2 in the model, resulting in an overall disutility weight of –0.263.
J Popul Ther Clin Pharmacol Vol 23(2):e151-e168; July 15, 2016
© 2016 Journal of Population Therapeutics and Clinical Pharmacology. All rights reserved. e158
Cost-effectiveness of canagliflozin versus sitagliptin when added to metformin and sulfonylurea in type 2 diabetes in Canada
In this case, treatment with canagliflozin 300 mg was discontinued when eGFR fell below 60 mL/min/1.73 m2 and canagliflozin 100 mg was discontinued when eGFR fell below 45 mL/min/1.73 m2 as per the label.41 Note that when simulated eGFR fell below 60 mL/min/1.73 m2 for patients who received canagliflozin 100 mg, hazard ratios from the pooled canagliflozin trial data for patients with moderate renal impairment (eGFR ≥45 and <60 mL/min/1.73 m2)42,43 were used to adjust the treatment effects for HbA1c, weight, and SBP.
Rescue therapy was applied as follows: when HbA1c first exceeded 8.0%, basal insulin (10 IU/day NPH) was added and titrated as needed to maintain HbA1c ≤8.0%, up to a maximum dose of 60 IU/day; after NPH reached the maximum dose, prandial insulin (insulin glulisine) was added as needed to maintain glycemic control, starting at a dose of 5 IU/day and titrated up to a maximum dose of 200 IU/day. Treatment effects and rates of hypoglycemia associated with the use of basal and prandial insulin were sourced from the literature.44-46 Anti-hypertension and anti-dyslipidemia treatment algorithms were also applied based on meeting SBP and LDL-C targets recommended by the CDA Clinical Practice Guidelines.6 Treatment for hypertension was initiated with an angiotensin-converting enzyme inhibitor (ramipril 5 mg) to maintain SBP <130 mmHg, followed by a calcium channel blocker (amlodipine 5 mg) if additional SBP control was needed. Treatment for dyslipidemia was initiated using atorvastatin 10 mg to maintain LDL-C ≤77 mg/dL (2.0 mmol/L), which could be intensified to 20 mg if additional LDL-C control was needed.
This analysis was conducted from the perspective of a Canadian provincial ministry of health and Canada’s federal plans, and Canada-specific costs were applied (Table 3).9,47-51 The unit price for sitagliptin 100 mg was $2.62 per day based on the lowest public list price in Canada (Quebec).52 The price for both canagliflozin doses was based on the lowest list price in Canada (Quebec; $2.62 per day).52 Other drug costs were obtained from the Ontario Public Drug Program (2013) or the Quebec public plan (2013).52,53 Costs were inflated as necessary to 2013 Canadian dollars using the health care component of the Consumer
Price Index. Costs and health outcomes (i.e., QALYs) were discounted at 5% per CADTH guidelines.23
QALY disutility weights relevant to Canada (primarily sourced from the CADTH third-line therapy report9) were applied to baseline utilities for each applicable year and were assumed to be additive when patients experienced more than 1 event in a cycle (Table 3). For example, a 50-year-old male with 10 years of T2DM duration and a history of ischemic heart disease (IHD) who is experiencing an MI during the current cycle (but has no other disutility-causing conditions) is applied a QALY weight of 1.027 (the intercept) minus 0.00235 for each year of age (i.e., 0.00235 × 50 years = 0.1175), 0.00163 for each year of T2DM duration (i.e., 0.00163 × 10 years = 0.0163), 0.024 for IHD history, and 0.012 for experiencing an MI, yielding a total of 0.8572 QALYs for that cycle. In the absence of Canada-specific disutility weights, values were sourced from the literature.32,40,54 Disutility weights for AEs potentially associated with SGLT2 inhibition were obtained from a time trade-off study.55 Outcomes Economic outcomes of this analysis included mean LYs, QALYs, and survival; incremental cost-effectiveness ratios (ICERs); and scatterplots of the cost-effectiveness planes. Patient outcomes, such as cumulative incidence rates for each type of micro- and macrovascular outcome, AE event rates, and RRRs for the micro- and macrovascular complications, were also calculated and are presented to facilitate interpretation of the primary results. Sensitivity Analyses One-way sensitivity analyses were conducted to explore the robustness of the base case results with respect to the choice of discount rate, time horizon, HbA1c treatment intensification threshold, disutility associated with weight gain, and eGFR drift as follows: • Discount rate: reduced discount rate of 0%
(SA1) or 3% (SA2) • Time horizon: shorter time horizon of 10
years (SA3) or 5 years (SA4)
J Popul Ther Clin Pharmacol Vol 23(2):e151-e168; July 15, 2016 © 2016 Journal of Population Therapeutics and Clinical Pharmacology. All rights reserved.
e159

Cost-effectiveness of canagliflozin versus sitagliptin when added to metformin and sulfonylurea in type 2 diabetes in Canada
• eGFR drift: apply the eGFR drift from the CDC Model of CKD33 to canagliflozin (SA5)
• Alternative treatment thresholds: HbA1c treatment intensification threshold at HbA1c of 7.0% (SA6) or 9.0% (SA7)
• Weight-related disutility assumptions: assume disutility due to BMI increase from CADTH report (–0.0019501359; SA8) or 0 (SA9)
For each of these analyses, 1,000 cohorts of
1,000 hypothetical patients (i.e., 1 million unique patients) were generated and simulated.
RESULTS Base Case Analyses The differences in the product profiles of canagliflozin 300 and 100 mg and sitagliptin 100 mg translated into differences in health outcomes and patient costs over 40 years (Table 4). For the canagliflozin 300 mg comparison, canagliflozin-treated patients experienced 0.23 more LYs and 0.31 more QALYs than sitagliptin-treated patients, with total health-related costs that were $2,217 lower ($44,680 vs $46,897). At the end of the simulation (40 years), 8.5% of patients in the canagliflozin 300 mg group and 5.2% of patients in the sitagliptin 100 mg were still alive (difference of 3.3 percentage points).
TABLE 4 Base Case Results: Costs of Complications and AEs, Average Costs, and Benefits per Person Over 40 Years
CANA 300 mg
SITA 100 mg Difference
CANA 100 mg
SITA 100 mg Difference
Costs, $ Macrovascular MI 4,160 4,265 –104 4,360 4,465 –105 IHD 2,559 2,674 –115 2,769 2,899 –130 CHF 2,606 2,770 –164 2,732 2,879 –147 Stroke 1,878 1,980 –101 1,977 2,063 –86
Microvascular Retinopathy 944 939 5 945 904 40 Nephropathy 85 1,396 –1,311 101 1,350 –1,249 Neuropathy 9,465 9,390 75 9,638 9,422 216
AHA Oral agents 13,542 13,491 51 13,411 13,570 –160 Insulin 5,803 6,668 –865 6,969 6,886 83
Prescription treatment Hypoglycemia 1,676 1,234 443 344 1,248 –904 AEs 107 94 13 155 95 60 Hypertension 687 917 –230 715 918 –202 Dyslipidemia 1,167 1,080 87 1,130 1,109 21
Total costs, $ 44,680 46,897 –2,217 45,247 47,807 –2,560 Health indicators
LYs 11.99 11.76 0.23 12.04 11.83 0.21 QALYs 8.65 8.35 0.31 8.64 8.37 0.28 Survival,* % 8.5% 5.2% 3.3% 8.6% 5.5% 3.1%
Cost per QALY, $ Dominating Dominating AE, adverse event; AHA, antihyperglycemic agent; CANA, canagliflozin; CHF, congestive heart failure; IHD, ischemic heart disease; LY, life-year; MI, myocardial infarction; QALY, quality-adjusted life year; SITA, sitagliptin. *Percent alive at simulation end.
J Popul Ther Clin Pharmacol Vol 23(2):e151-e168; July 15, 2016
© 2016 Journal of Population Therapeutics and Clinical Pharmacology. All rights reserved. e160
Cost-effectiveness of canagliflozin versus sitagliptin when added to metformin and sulfonylurea in type 2 diabetes in Canada
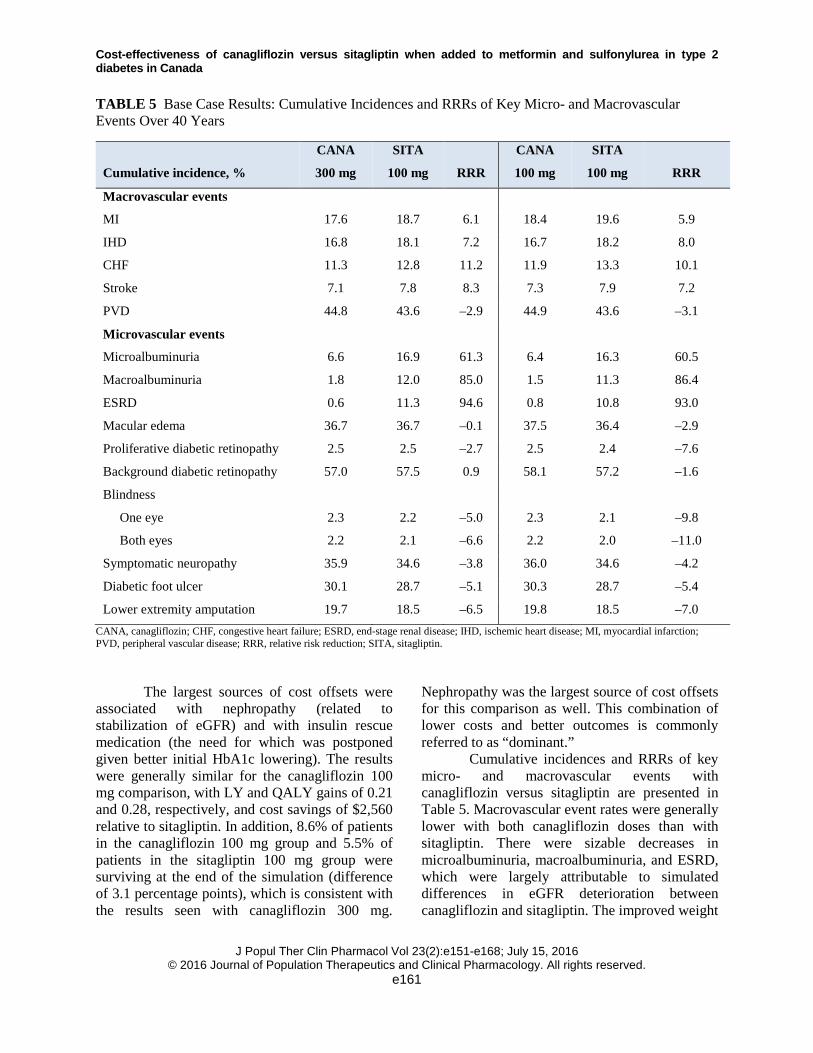
TABLE 5 Base Case Results: Cumulative Incidences and RRRs of Key Micro- and Macrovascular Events Over 40 Years
Cumulative incidence, %
CANA
300 mg
SITA
100 mg RRR
CANA
100 mg
SITA
100 mg RRR
Macrovascular events
MI 17.6 18.7 6.1 18.4 19.6 5.9
IHD 16.8 18.1 7.2 16.7 18.2 8.0
CHF 11.3 12.8 11.2 11.9 13.3 10.1
Stroke 7.1 7.8 8.3 7.3 7.9 7.2
PVD 44.8 43.6 –2.9 44.9 43.6 –3.1
Microvascular events
Microalbuminuria 6.6 16.9 61.3 6.4 16.3 60.5
Macroalbuminuria 1.8 12.0 85.0 1.5 11.3 86.4
ESRD 0.6 11.3 94.6 0.8 10.8 93.0
Macular edema 36.7 36.7 –0.1 37.5 36.4 –2.9
Proliferative diabetic retinopathy 2.5 2.5 –2.7 2.5 2.4 –7.6
Background diabetic retinopathy 57.0 57.5 0.9 58.1 57.2 –1.6
Blindness
One eye 2.3 2.2 –5.0 2.3 2.1 –9.8
Both eyes 2.2 2.1 –6.6 2.2 2.0 –11.0
Symptomatic neuropathy 35.9 34.6 –3.8 36.0 34.6 –4.2
Diabetic foot ulcer 30.1 28.7 –5.1 30.3 28.7 –5.4
Lower extremity amputation 19.7 18.5 –6.5 19.8 18.5 –7.0 CANA, canagliflozin; CHF, congestive heart failure; ESRD, end-stage renal disease; IHD, ischemic heart disease; MI, myocardial infarction; PVD, peripheral vascular disease; RRR, relative risk reduction; SITA, sitagliptin.
The largest sources of cost offsets were
associated with nephropathy (related to stabilization of eGFR) and with insulin rescue medication (the need for which was postponed given better initial HbA1c lowering). The results were generally similar for the canagliflozin 100 mg comparison, with LY and QALY gains of 0.21 and 0.28, respectively, and cost savings of $2,560 relative to sitagliptin. In addition, 8.6% of patients in the canagliflozin 100 mg group and 5.5% of patients in the sitagliptin 100 mg group were surviving at the end of the simulation (difference of 3.1 percentage points), which is consistent with the results seen with canagliflozin 300 mg.
Nephropathy was the largest source of cost offsets for this comparison as well. This combination of lower costs and better outcomes is commonly referred to as “dominant.”
Cumulative incidences and RRRs of key micro- and macrovascular events with canagliflozin versus sitagliptin are presented in Table 5. Macrovascular event rates were generally lower with both canagliflozin doses than with sitagliptin. There were sizable decreases in microalbuminuria, macroalbuminuria, and ESRD, which were largely attributable to simulated differences in eGFR deterioration between canagliflozin and sitagliptin. The improved weight
J Popul Ther Clin Pharmacol Vol 23(2):e151-e168; July 15, 2016
© 2016 Journal of Population Therapeutics and Clinical Pharmacology. All rights reserved. e161
Cost-effectiveness of canagliflozin versus sitagliptin when added to metformin and sulfonylurea in type 2 diabetes in Canada
profile was associated with 0.047 and 0.037 lower QALY disutility (i.e., yielding higher utility) related to excess weight for canagliflozin 300 and 100 mg, respectively.
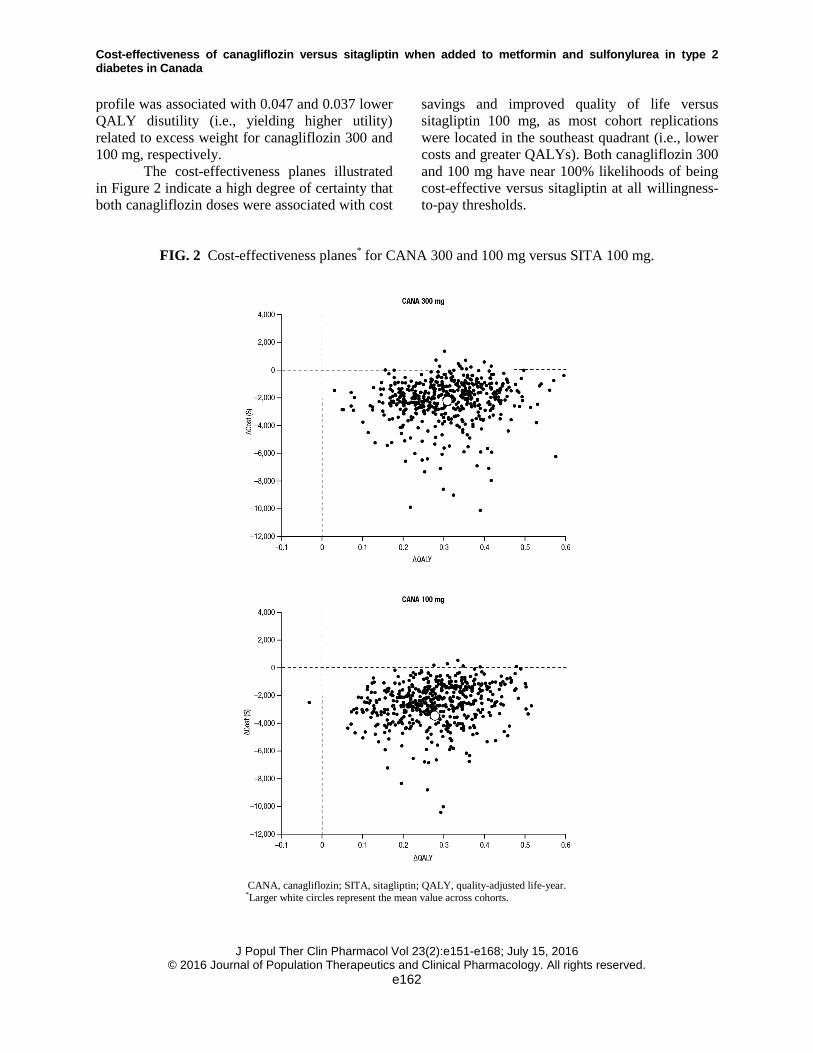
The cost-effectiveness planes illustrated in Figure 2 indicate a high degree of certainty that both canagliflozin doses were associated with cost
savings and improved quality of life versus sitagliptin 100 mg, as most cohort replications were located in the southeast quadrant (i.e., lower costs and greater QALYs). Both canagliflozin 300 and 100 mg have near 100% likelihoods of being cost-effective versus sitagliptin at all willingness-to-pay thresholds.
FIG. 2 Cost-effectiveness planes* for CANA 300 and 100 mg versus SITA 100 mg.
CANA, canagliflozin; SITA, sitagliptin; QALY, quality-adjusted life-year. *Larger white circles represent the mean value across cohorts.
J Popul Ther Clin Pharmacol Vol 23(2):e151-e168; July 15, 2016
© 2016 Journal of Population Therapeutics and Clinical Pharmacology. All rights reserved. e162
Cost-effectiveness of canagliflozin versus sitagliptin when added to metformin and sulfonylurea in type 2 diabetes in Canada
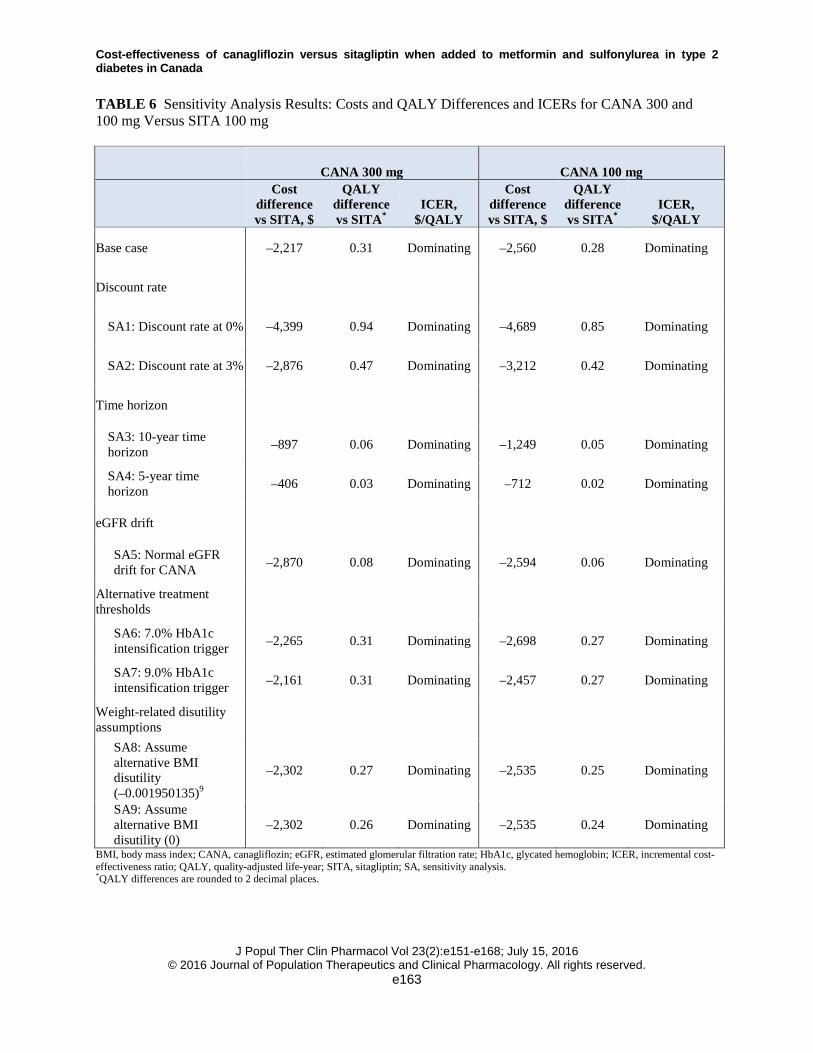
TABLE 6 Sensitivity Analysis Results: Costs and QALY Differences and ICERs for CANA 300 and 100 mg Versus SITA 100 mg
CANA 300 mg CANA 100 mg
Cost difference vs SITA, $
QALY difference vs SITA*
ICER, $/QALY
Cost difference vs SITA, $
QALY difference vs SITA*
ICER, $/QALY
Base case –2,217 0.31 Dominating –2,560 0.28 Dominating
Discount rate
SA1: Discount rate at 0% –4,399 0.94 Dominating –4,689 0.85 Dominating
SA2: Discount rate at 3% –2,876 0.47 Dominating –3,212 0.42 Dominating
Time horizon
SA3: 10-year time horizon –897 0.06 Dominating –1,249 0.05 Dominating
SA4: 5-year time horizon –406 0.03 Dominating –712 0.02 Dominating
eGFR drift
SA5: Normal eGFR drift for CANA –2,870 0.08 Dominating –2,594 0.06 Dominating
Alternative treatment thresholds
SA6: 7.0% HbA1c intensification trigger –2,265 0.31 Dominating –2,698 0.27 Dominating
SA7: 9.0% HbA1c intensification trigger –2,161 0.31 Dominating –2,457 0.27 Dominating
Weight-related disutility assumptions
SA8: Assume alternative BMI disutility (–0.001950135)9
–2,302 0.27 Dominating –2,535 0.25 Dominating
SA9: Assume alternative BMI disutility (0)
–2,302 0.26 Dominating –2,535 0.24 Dominating
BMI, body mass index; CANA, canagliflozin; eGFR, estimated glomerular filtration rate; HbA1c, glycated hemoglobin; ICER, incremental cost-effectiveness ratio; QALY, quality-adjusted life-year; SITA, sitagliptin; SA, sensitivity analysis. *QALY differences are rounded to 2 decimal places.
J Popul Ther Clin Pharmacol Vol 23(2):e151-e168; July 15, 2016
© 2016 Journal of Population Therapeutics and Clinical Pharmacology. All rights reserved. e163
Cost-effectiveness of canagliflozin versus sitagliptin when added to metformin and sulfonylurea in type 2 diabetes in Canada
Sensitivity Analyses Results from the sensitivity analyses were robust and support the findings from the base case analysis, with canagliflozin 300 and 100 mg dominating sitagliptin 100 mg in each scenario (Table 6). Not surprisingly, with lower discount rates of 0% or 3%, canagliflozin 300 and 100 mg dominated sitagliptin 100 mg as future cost offsets and QALY gains were no longer down-weighted. Given the chronic nature of T2DM treatment, larger cost offsets and QALY gains with both canagliflozin doses versus sitagliptin 100 mg were estimated over the longer base case time horizon of 40 years versus the shorter time frames considered in sensitivity analyses; however, even in periods as short as 5 and 10 years, canagliflozin dominated sitagliptin, though the magnitude of the cost savings and QALY gains were naturally smaller. Canagliflozin 300 and 100 mg dominated sitagliptin 100 mg in the simulations that assumed that eGFR drifted down over time with canagliflozin. Canagliflozin 300 and 100 mg also continued to dominate sitagliptin 100 mg in the sensitivity analyses that varied the treatment intensification thresholds, including the higher HbA1c threshold of 9.0% (which may be more reflective of the glycemic control of many actual Canadian T2DM patients).7 Consistent with the base case, canagliflozin dominated sitagliptin across a range of weight-related disutility values.
DISCUSSION In this economic evaluation, canagliflozin 300 and 100 mg dominated sitagliptin 100 mg as add-on to metformin plus sulfonylurea, providing more QALYs at a lower cost, from the perspective of CADTH in the Canadian setting. In the base case sets of simulations, QALY gains with both canagliflozin doses were largely composed of a decreased incidence of CKD, improved longevity, and canagliflozin-related initial weight loss. Approximately half of the cost savings associated with the use of canagliflozin 300 and 100 mg relative to sitagliptin 100 mg in third-line therapy were due to reductions in the costs of treating nephropathy, consistent with the assumption that renal function does not deteriorate while on canagliflozin treatment. Other important sources
of cost savings include reduction in macrovascular complications (both doses), insulin rescue therapy (300 mg dose), hypoglycemia (100 mg dose), and hypertension medication (both doses). Scatterplots of the incremental costs and QALYs for canagliflozin 300 and 100 mg versus sitagliptin 100 mg indicate a high degree of certainty, as most cohort replications were associated with lower costs and increased QALYs; results indicated a high likelihood of canagliflozin being cost-effective relative to sitagliptin.
Because CKD is a serious complication of T2DM, the base case assumption that renal function does not deteriorate while on canagliflozin treatment was an important driver of the associated cost offsets and QALY gains, though removing this assumption did not reverse canagliflozin “dominance” for either dose, as demonstrated in the sensitivity analysis. This assumption is supported by recent evidence from a long-term outcomes trial with the SGLT2 inhibitor empagliflozin, which found stable eGFR over 4 years of treatment (i.e., the full study period)17 and is consistent with results from the longest available canagliflozin trial data to date (2 years).56 Of note, the initial decline in eGFR with agents that inhibit SGLT2 is transient and, as such, no renal damage (glomerular or tubular) is expected to occur.15 Additionally, indirect evidence from clinical trials of canagliflozin indicates that treatment may confer renoprotection not only due to favorable efficacy in terms of HbA1c lowering, weight loss, and BP reductions, but fundamentally via its mechanism of action.15 The CANVAS-R and CREDENCE trials were designed to explicitly evaluate the long-term impact of canagliflozin on renal outcomes.
Findings from sensitivity analyses support the robustness of the base case; canagliflozin 300 and 100 mg dominated sitagliptin 100 mg in each of the sensitivity analyses. Weight change generally appears to be a key driver of uncertainty in health economic models, and weight management can improve clinical outcomes related to T2DM; however, previous HTA assessments have raised concerns about the use of overly optimistic weight-related disutility values. In the base case, we applied a conservative weight-related disutility from a population of
J Popul Ther Clin Pharmacol Vol 23(2):e151-e168; July 15, 2016
© 2016 Journal of Population Therapeutics and Clinical Pharmacology. All rights reserved. e164
Cost-effectiveness of canagliflozin versus sitagliptin when added to metformin and sulfonylurea in type 2 diabetes in Canada
patients with T2DM.32 Canagliflozin continued to dominate sitagliptin when a very small weight-related disutility value from the CADTH Optimal Use Report was used, the original source of which was based on a group of people without T2DM (from the NICE obesity guidelines).57,58 Even in the scenario where no decrement in utility from weight gain was assumed, canagliflozin dominated sitagliptin. Findings from the base case were also robust in the sensitivity analyses that varied other model parameters, including discount rate, time horizon, and HbA1c treatment intensification threshold.
This analysis derived key modeling parameters from robust clinical trial data, including a head-to-head study of canagliflozin 300 mg versus sitagliptin 100 mg and a placebo-controlled study that included canagliflozin 100 mg.39,40 In addition, the results of these simulations were tailored to the Canadian health care system by using Canadian costs and Canadian-relevant disutility estimates where possible. However, as with all long-term economic evaluations in T2DM and owing to the absence of long-term clinical evidence for alternative T2DM treatments, a key caveat for this analysis is the use of short-term clinical data (i.e., HbA1c, BP, and lipid changes) to predict the occurrence of complications over time. The importance of this caveat for the finding that both canagliflozin doses dominate sitagliptin 100 mg in third-line therapy is minimized via the use of a well-validated model. In addition, ECHO-T2DM was explicitly tailored to reflect some of the unique aspects of SGLT2 inhibition, including side effects potentially related to this mechanism of action. However, conventional macrovascular and mortality risk equations, such as UKPDS 82, were not estimated using patients taking SGLT2 inhibitors.34 Recent findings from the EMPA-REG cardiovascular outcomes trial found that the SGLT2 inhibitor empagliflozin significantly reduced cardiovascular mortality, all-cause mortality, and hospitalization for heart failure.59 Therefore, use of conventional risk equations may underestimate cardiovascular risk reductions associated with SGLT2 inhibitors,60 resulting in a conservative estimate of cost-effectiveness for
canagliflozin versus sitagliptin in these simulations.
CONCLUSIONS These economic simulations suggest that canagliflozin is associated with lower costs and more LYs and QALYs than sitagliptin in patients inadequately controlled with metformin plus sulfonylurea in the Canadian setting, with key drivers of these results being better glucose, weight, and SBP control, as well as delayed progression of CKD. As such, canagliflozin is likely to provide good “value for money,” with lower costs and better health outcomes, compared with sitagliptin, when used in third-line therapy with metformin and sulfonylurea in Canada. Acknowledgments and Funding This analysis was sponsored by Janssen Inc. and was based on data from studies supported by Janssen Research & Development, LLC. The authors thank Andreas Nilsson, MSc, of the Swedish Institute for Health Economics, for assistance with the data analysis. Medical writing support was provided by Alaina Mitsch, PhD, of MedErgy, and was funded by Janssen Global Services, LLC. Canagliflozin has been developed by Janssen Research & Development, LLC, in collaboration with Mitsubishi Tanabe Pharma Corporation. Conflict of Interest This analysis was sponsored by Janssen Inc. and was based on data from studies supported by Janssen Research & Development, LLC. S.S. and K.Y. are employees of Janssen Inc. C.N. and A.T. are employees of Janssen Global Services, LLC. P.J. and M.W. are employees of the Swedish Institute for Health Economics, which has provided consulting services for Janssen Global Services, LLC.
J Popul Ther Clin Pharmacol Vol 23(2):e151-e168; July 15, 2016
© 2016 Journal of Population Therapeutics and Clinical Pharmacology. All rights reserved. e165
Cost-effectiveness of canagliflozin versus sitagliptin when added to metformin and sulfonylurea in type 2 diabetes in Canada
REFERENCES 1. Statistics Canada. Diabetes, 2010.
http://www.statcan.gc.ca/pub/82-625-x/2011001/article/11459-eng.htm. Accessed December 2, 2015.
2. International Diabetes Federation. IDF Diabetes Atlas. 6th ed. Brussels, Belgium: International Diabetes Federation; 2013.
3. Public Health Agency of Canada. Diabetes in Canada. Facts and figures from a public health perspective, 2011. http://www.phac-aspc.gc.ca/cd-mc/publications/diabetes-diabete/facts-figures-faits-chiffres-2011/pdf/facts-figures-faits-chiffres-eng.pdf. Accessed March 2, 2016.
4. Dawson KG, Gomes D, Gerstein H, Blanchard JF, Kahler KH. The economic cost of diabetes in Canada, 1998. Diabetes Care 2002;25(8):1303-7.
5. Canadian Diabetes Association. An economic tsunami: the costs of diabetes in Canada, December 2009. http://www.diabetes.ca/CDA/media/documents/publications-and-newsletters/advocacy-reports/economic-tsunami-cost-of-diabetes-in-canada-english.pdf. Accessed March 2, 2016.
6. Canadian Diabetes Association. Canadian Diabetes Association Clinical Practice Guidelines Expert Committee. Canadian Diabetes Association 2013 clinical practice guidelines for the prevention and management of diabetes in Canada. Can J Diabetes 2013;37(suppl 1):S1-212.
7. Leiter LA, Berard L, Bowering CK, et al. Type 2 diabetes mellitus management in Canada: is it improving? Can J Diabetes 2013;37(2):82-9.
8. Canadian Agency for Drugs and Technologies in Health. CADTH Optimal Use Report. Second-line pharmacotherapy for type 2 diabetes– update. http://www.cadth.ca/media/pdf/OP0512_DiabetesUpdate_Second-line_e.pdf.
9. Canadian Agency for Drugs and Technologies in Health. CADTH Optimal Use Report. Third-line pharmacotherapy for type 2 diabetes– update. http://www.cadth.ca/media/pdf/OP0512_Diabetes%20Update_Third-line_e.pdf. Accessed March 2, 2016.
10. Morgan S, Smolina K, Mooney D, et al. The Canadian Rx Atlas. 3rd ed. UBC Centre for Health Services and Policy Research; 2013.
11. Inzucchi SE, Bergenstal RM, Buse JB, et al. Management of hyperglycemia in type 2 diabetes, 2015: a patient-centered approach: update to a position statement of the American Diabetes Association and the European Association for the
Study of Diabetes. Diabetes Care 2015;38(1):140-9.
12. Jabbour SA. SGLT2 inhibitors to control glycemia in type 2 diabetes mellitus: a new approach to an old problem. Postgrad Med 2014;126(1):111-7.
13. Canadian Drug Expert Committee. Common drug review: CDEC final recommendation, canagliflozin (Invokana, Janssen Inc.). http://www.cadth.ca/media/cdr/complete/cdr_complete_SR0370_Invokana_Jan-19_15.pdf. Accessed March 2, 2016.
14. Rosenthal N, Meininger G, Ways K, et al. Canagliflozin: a sodium glucose co-transporter 2 inhibitor for the treatment of type 2 diabetes mellitus. Ann N Y Acad Sci 2015;1358:28-43.
15. Perkovic V, Jardine M, Vijapurkar U, Meininger G. Renal effects of canagliflozin in type 2 diabetes mellitus. Curr Med Res Opin 2015;31(12):2219-31.
16. Weir MR. The kidney and type 2 diabetes mellitus: therapeutic implications of SGLT2 inhibitors. Postgrad Med 2016;128(3):290-8.
17. Wanner C, Inzucchi SE, Lachin JM, et al. Empagliflozin and progression of kidney disease in type 2 diabetes. N Engl J Med 2016; doi:10.1056/NEJMoa1515920.
18. Schernthaner G, Mogensen CE, Schernthaner GH. The effects of GLP-1 analogues, DPP-4 inhibitors and SGLT2 inhibitors on the renal system. Diab Vasc Dis Res 2014;11(5):306-23.
19. Green JB, Bethel MA, Armstrong PW, et al. Effect of sitagliptin on cardiovascular outcomes in type 2 diabetes. N Engl J Med 2015;373(3):232-42.
20. Canadian Agency for Drugs and Technologies in Health. New drugs for type 2 diabetes: a therapeutic review update. https://www.cadth.ca/new-drugs-type-2-diabetes-therapeutic-review-update. Accessed February 25, 2016.
21. Palmer AJ; The Mount Hood 5 Modeling Group. Computer modeling of diabetes and its complications: a report on the fifth Mount Hood Challenge meeting. Value Health 2013;16(4):670-85.
22. American Diabetes Association. Guidelines for computer modeling of diabetes and its complications. Diabetes Care 2004;27(9):2262-5.
23. Canadian Agency for Drugs and Technologies in Health. Guidelines for the Economic Evaluation of Health Technologies: Canada. 3rd ed 2006. https://www.cadth.ca/media/pdf/186_EconomicGuidelines_e.pdf. Accessed March 2, 2016.
J Popul Ther Clin Pharmacol Vol 23(2):e151-e168; July 15, 2016
© 2016 Journal of Population Therapeutics and Clinical Pharmacology. All rights reserved. e166
Cost-effectiveness of canagliflozin versus sitagliptin when added to metformin and sulfonylurea in type 2 diabetes in Canada
24. Willis M, Asseburg C, He J. Validation of economic and health outcomes simulation model of type 2 diabetes mellitus (ECHO-T2DM). J Med Econ 2013;16(8):1007-21.
25. Asseburg C, Willis M, Johansen P, Nilsson A, Neslusan C, Schroeder M. Update of the model validation of the Economic and Health Outcomes Model of Type 2 Diabetes Mellitus (ECHO-T2DM). Poster presented at: 21st Annual Meeting of the International Society for Pharmacoeconomics and Outcomes Research (ISPOR); May 21-25 2016; Washington, DC.
26. Mount Hood 4 Modeling Group. Computer modeling of diabetes and its complications: a report on the fourth Mount Hood Challenge meeting. Diabetes Care 2007;30(6):1638-46.
27. Brown JB, Palmer AJ, Bisgaard P, Chan W, Pedula K, Russell A. The Mt. Hood Challenge: cross-testing two diabetes simulation models. Diabetes Res Clin Pract 2000;50(suppl 3):S57-64.
28. Neslusan C, Teschemaker A, Johansen P, Willis M, Valencia-Mendoza A, Puig A. Cost-effectiveness of canagliflozin versus sitagliptin as add-on to metformin in patients with type 2 diabetes mellitus in Mexico. Value Health Regional Issues 2015;8:8-19.
29. Brown JB, Russell A, Chan W, Pedula K, Aickin M. The global diabetes model: user friendly version 3.0. Diabetes Res Clin Pract 2000;50(suppl 3):S15-46.
30. UK Prospective Diabetes Study (UKPDS) Group. Intensive blood-glucose control with sulphonylureas or insulin compared with conventional treatment and risk of complications in patients with type 2 diabetes (UKPDS 33). Lancet 1998;352(9131):837-53.
31. Eastman RC, Javitt JC, Herman WH, et al. Model of complications of NIDDM. II. Analysis of the health benefits and cost-effectiveness of treating NIDDM with the goal of normoglycemia. Diabetes Care 1997;20(5):735-44.
32. Bagust A, Beale S. Modelling EuroQol health-related utility values for diabetic complications from CODE-2 data. Health Econ 2005;14(3):217-30.
33. Hoerger TJ, Wittenborn JS, Segel JE, et al. A health policy model of CKD: 1. model construction, assumptions, and validation of health consequences. Am J Kidney Dis 2010;55(3):452-62.
34. Hayes AJ, Leal J, Gray AM, Holman RR, Clarke PM. UKPDS outcomes model 2: a new version of a model to simulate lifetime health outcomes of patients with type 2 diabetes mellitus using data
from the 30 year United Kingdom Prospective Diabetes Study: UKPDS 82. Diabetologia 2013;56(9):1925-33.
35. Kahn SE, Haffner SM, Heise MA, et al. Glycemic durability of rosiglitazone, metformin, or glyburide monotherapy. N Engl J Med 2006;355(23):2427-43.
36. Boulware LE, Jaar BG, Tarver-Carr ME, Brancati FL, Powe NR. Screening for proteinuria in US adults: a cost-effectiveness analysis. JAMA 2003;290(23):3101-14.
37. Nyirjesy P, Sobel JD, Fung A, et al. Genital mycotic infections with canagliflozin, a sodium glucose co-transporter 2 inhibitor, in patients with type 2 diabetes mellitus: a pooled analysis of clinical studies. Curr Med Res Opin 2014;30(6):1109-19.
38. Nicolle LE, Capuano G, Fung A, Usiskin K. Urinary tract infection in randomized phase III studies of canagliflozin, a sodium glucose co-transporter 2 inhibitor. Postgrad Med 2014;126(1):7-17.
39. Schernthaner G, Gross JL, Rosenstock J, et al. Canagliflozin compared with sitagliptin for patients with type 2 diabetes who do not have adequate glycemic control with metformin plus sulfonylurea: a 52-week, randomized trial. Diabetes Care 2013;36(9):2508-15.
40. Wilding JP, Charpentier G, Hollander P, et al. Efficacy and safety of canagliflozin in patients with type 2 diabetes mellitus inadequately controlled with metformin and sulphonylurea: a randomised trial. Int J Clin Pract 2013;67(12):1267-82.
41. INVOKANA® (canagliflozin) tablets, for oral use [package insert]. Titusville, NJ: Janssen Pharmaceuticals; 2014.
42. Janssen Research & Development. Integrated summary of efficacy. Canagliflozin as an adjunctive treatment to diet and exercise alone or co-administered with other antihyperglycemic agents to improve glycemic control in adults with type 2 diabetes mellitus. 2012.
43. Yamout HM, Perkovic V, Davies M, et al. Efficacy and safety of canagliflozin in patients with type 2 diabetes and stage 3 nephropathy. Am J Nephrol 2014;40(1):64-74.
44. Rosenstock J, Davies M, Home PD, Larsen J, Koenen C, Schernthaner G. A randomised, 52-week, treat-to-target trial comparing insulin detemir with insulin glargine when administered as add-on to glucose-lowering drugs in insulin-naive people with type 2 diabetes. Diabetologia 2008;51(3):408-16.
J Popul Ther Clin Pharmacol Vol 23(2):e151-e168; July 15, 2016
© 2016 Journal of Population Therapeutics and Clinical Pharmacology. All rights reserved. e167
Cost-effectiveness of canagliflozin versus sitagliptin when added to metformin and sulfonylurea in type 2 diabetes in Canada
45. Riddle MC, Vlajnic A, Zhou R, Rosenstock J. Baseline HbA1c predicts attainment of 7.0% HbA1c target with structured titration of insulin glargine in type 2 diabetes: a patient-level analysis of 12 studies. Diabetes Obes Metab 2013;15(9):819-25.
46. Fonseca V, Gill J, Zhou R, Leahy J. An analysis of early insulin glargine added to metformin with or without sulfonylurea: impact on glycaemic control and hypoglycaemia. Diabetes Obes Metab 2011;13(9):814-22.
47. Clarke PM, Glasziou P, Patel A, et al. Event rates, hospital utilization, and costs associated with major complications of diabetes: a multicountry comparative analysis. PLoS Med 2010;7(2):e1000236.
48. Tarride JE, Gordon A, Vera-Llonch M, Dukes E, Rousseau C. Cost-effectiveness of pregabalin for the management of neuropathic pain associated with diabetic peripheral neuropathy and postherpetic neuralgia: a Canadian perspective. Clin Ther 2006;28(11):1922-34.
49. Sibbald RG, Torrance G, Hux M, Attard C, Milkovich N. Cost-effectiveness of becaplermin for nonhealing neuropathic diabetic foot ulcers. Ostomy Wound Manage 2003;49(11):76-84.
50. O'Brien JA, Patrick AR, Caro J. Estimates of direct medical costs for microvascular and macrovascular complications resulting from type 2 diabetes mellitus in the United States in 2000. Clin Ther 2003;25(3):1017-38.
51. O'Reilly D, Hopkins R, Blackhouse G, et al. Long-term cost-utility analysis of a multidisciplinary primary care diabetes management program in Ontario. Can J Diabetes 2007;31(3):205-14.
52. Regie de l'assurance maladie du Quebec. Liste des médicaments. Règlement concernant la liste des médicaments couverts par le régime général d'assurance médicaments. http://www.ramq.gouv.qc.ca/fr/publications/citoyens/publications-legales/Pages/liste-medicaments.aspx. Accessed March 2, 2016.
53. Ontario Ministry of Health and Long-term Care. Drugs funded by Ontario Drug Benefit (ODB) program. http://www.health.gov.on.ca/en/pro/programs/drugs/odbf_eformulary.aspx. Accessed March 2, 2016.
54. Evans M, Khunti K, Mamdani M, et al. Health-related quality of life associated with daytime and nocturnal hypoglycaemic events: a time trade-off survey in five countries. Health Qual Life Outcomes 2013;11:90.
55. Shingler S, Fordham B, Evans M, et al. Utilities for treatment-related adverse events in type 2 diabetes. J Med Econ 2015;18(1):45-55.
56. Leiter LA, Yoon KH, Arias P, et al. Canagliflozin provides durable glycemic improvements and body weight reduction over 104 weeks versus glimepiride in patients with type 2 diabetes on metformin: a randomized, double-blind, phase 3 study. Diabetes Care 2015;38(3):355-64.
57. National Institute for Health and Clinical Excellence. Obesity prevention: NICE guidelines [Clinical guideline 43]. http://www.nice.org.uk/guidance/CG43/. Accessed December 3, 2015.
58. Macran S. The relationship between body mass index and health-related quality of life (Discussion paper 190). http://www.york.ac.uk/che/pdf/DP190.pdf. Accessed March 2, 2016.
59. Zinman B, Wanner C, Lachin JM, et al. Empagliflozin, cardiovascular outcomes, and mortality in type 2 diabetes. N Engl J Med 2015;373(22):2117-28.
60. Kansal A, Zheng Y, Proskorovsky I, Krotneva S, Kandaswamy P, Ruffolo A. Modeling cardiovascular outcomes of treatment with empagliflozin in type 2 diabetes based on hard outcomes data. Poster presented at: 21st Annual Meeting of the International Society for Pharmacoeconomics and Outcomes Research (ISPOR); May 21-25 2016; Washington, DC.
61. O'Reilly D, Burke N, Blackhouse G, Tsoi B, Campbell K, Jegathisawaran J. Review of the cost and health-related quality of life associated with diabetes and diabetes-related complications. 2012;TEMMP-D045-2012.REP.
62. Sullivan PW, Lawrence WF, Ghushchyan V. A national catalog of preference-based scores for chronic conditions in the United States. Med Care 2005;43(7):736-49.
63. Morgan CL, McEwan P, Morrissey M, Peters JR, Poole C, Currie CJ. Characterization and comparison of health-related utility in people with diabetes with various single and multiple vascular complications. Diabet Med 2006;23(10):1100-5.
64. Clarke P, Gray A, Holman R. Estimating utility values for health states of type 2 diabetic patients using the EQ-5D (UKPDS 62). Med Decis Making 2002;22(4):340-9.
J Popul Ther Clin Pharmacol Vol 23(2):e151-e168; July 15, 2016
© 2016 Journal of Population Therapeutics and Clinical Pharmacology. All rights reserved. e168


![AusPAR Attachment 1: Product Information for Canagliflozin ...C]canagliflozin dose to healthy subjects, 41.5%, 7.0%, and 3.2% of the administered radioactive dose was recovered in](https://img.dokumen.tips/doc/110x75/5e2cee0a2324423f1429435d/auspar-attachment-1-product-information-for-canagliflozin-ccanagliflozin-dose.jpg)
![Ertugliflozin and Sitagliptin Co-initiation in Patients ...sitagliptin and metformin [18], and in combi-nation with sitagliptin as an add on to met-formin [19, 20] improved glycemic](https://img.dokumen.tips/doc/110x75/5e2a04698dc7ef19de3a2141/ertugliflozin-and-sitagliptin-co-initiation-in-patients-sitagliptin-and-metformin.jpg)
![Oral Semaglutide Versus Empagliflozin, Sitagliptin and ... · specific life tables published by the World Health Organisation (Electronic Supplementary Material [ESM] Table S1) [20]](https://img.dokumen.tips/doc/110x75/5f083a1b7e708231d420f6cd/oral-semaglutide-versus-empagliflozin-sitagliptin-and-speciic-life-tables.jpg)