Embed Size (px)
Citation preview

Cost effectiveness of AF
monitoring strategies in a
post-stroke population
LAUREN E. CIPRIANO
JEFF HEALEY
OMAR AKHTAR
KAREN LEE
LUCIANO A. SPOSATO
APRIL 12, 2016
Disclosures
Funding: CADTH
Conflicts: None to report

Atrial fibrillation in patients with a
history of stroke or TIA
• ~ 20% of stroke patients have a known history of AF
• ~ 20 - 25% of stroke patients without a prior AF diagnosis,
have AF
• History of stroke & AF 10-15% risk of recurrent
stroke in year 1
2

Oral anticoagulation treatment
• Reduce the risk of recurrent stroke (HR = 0.3-0.65)
• Increase the risk of bleeding (HR = 1.5-3.0)
• NOAC lower the risk of ICH but increase the risk of non-
brain bleeding compared to warfarin
• Warfarin is inexpensive, but has many contraindications and
requires regular visits for patients
• NOACs are expensive, similarly effective to warfarin, and
require less follow-up visits to ensure safety /efficacy
3

Post discharge AF monitoring
4
Patient with stroke or TIA
ECG
Hospital discharge
Age 70 CHADS-VASC ~4
24+ hr monitoring
(sometimes)
Focus of our analysis
24 hr – 7 days monitoring?
30 days monitoring?
2-3 years monitoring?
(implantable device)

Objective
To evaluate the cost effectiveness of outpatient cardiac
monitoring devices for the evaluation of atrial fibrillation in
discharged patients with a recent history of stroke or TIA
Variation in clinical evaluations of monitoring strategies
made many desired comparisons difficult to evaluate.
5

Research Question
Three separate cost effectiveness analyses
6
Study Higgins et al. (2013) Gladstone et al. (2014) Sanna et al. (2014)
Cohort: Ischemic stroke or TIA
within 7 days
Cryptogenic stroke or
TIA within 6 months
Cryptogenic stroke or
TIA within 90 days
Prior AF
monitoring: 12-lead ECG
12-lead ECG and
≥ 24-hour Holter
12-lead ECG and
≥ 24-hour Holter
Intervention: 7 day cardiac event
monitoring (ELR)
30-day event triggered
recorder (ELR)
3-yr insertable cardiac
monitor (ILR )
Comparator:
Standard practice
(60% received
24-hour Holter)
24-hour Holter
Standard practice
(30% ≥ 1 ECG and
8% 24-hour Holter)
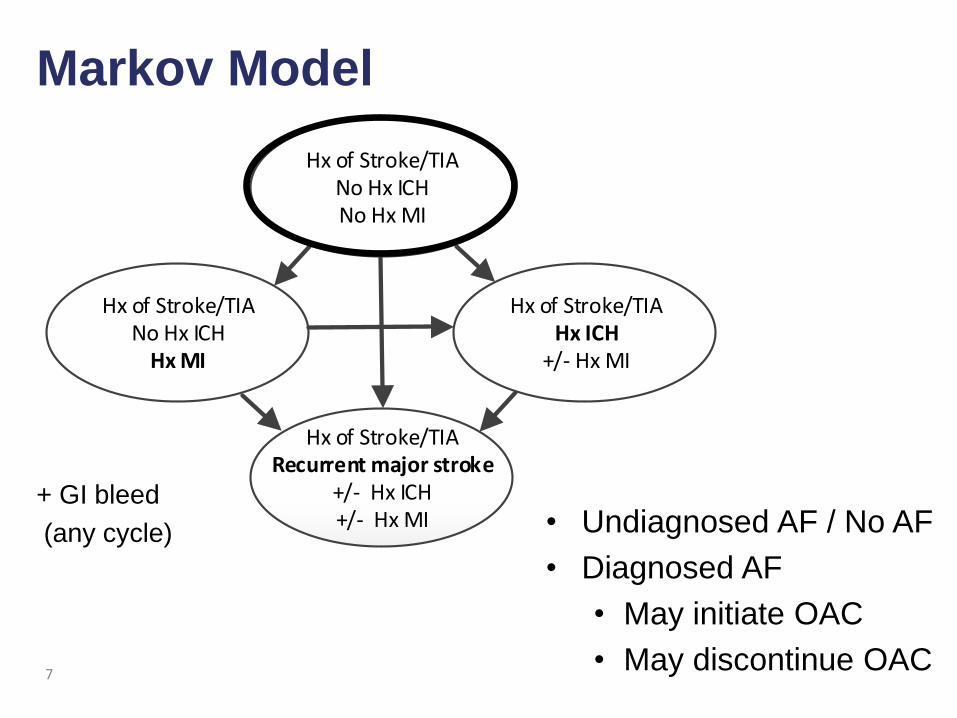
Hx of Stroke/TIANo Hx ICHNo Hx MI
Hx of Stroke/TIANo Hx ICH
Hx MI
Hx of Stroke/TIAHx ICH
+/- Hx MI
Hx of Stroke/TIARecurrent major stroke
+/- Hx ICH+/- Hx MI
True Negative AF Diagnosis
Not on OAC treatment
Markov Model
7
• Undiagnosed AF / No AF
• Diagnosed AF
• May initiate OAC
• May discontinue OAC
+ GI bleed
(any cycle)

Model assumptions
• Monthly cycles & Lifetime horizon
• Perspective: Public payer and Soceital
• Input parameters
• Medical literature
• Expert opinion
• Validated to Oxford Vascular Study
• Life-expectancy, QALYs, and 5-year recurrent strokes
8

OAC assumptions
• 61% of patients initiate OAC after diagnosis
• 16% of patients on OACs quit each year
• OACs reduce the risk of recurrent stroke
• Warfarin: 36% reduction compared to aspirin
• Apixiban: 45% reduction compared to aspirin
Annual Cost Disutility Patient time*
Warfarin $396 - 0.013 2 hours every 3 weeks
Dabigatran $1288 - 0.006 -
Rivaroxaban $1157 - 0.006 -
Apixaban $1288 - 0.006 -
* Assume a caregiver attends all visits; patient and caregiver time @ $25/hr

Model-based outcomes
10
Outcomes AF without
diagnosis
AF with diagnosis
Warfarin Apixaban
Within 2 years (per 10,000)
Recurrent IS, severe or fatal 1,087 709 636
Recurrent stroke, any 1,724 1,223 1,093
ICH 47 99 42
GI bleed 171 276 264
AF diagnosis:
Non-fatal strokes Fatal strokes
Bleeds

Model-based outcomes
11
Outcomes AF without
diagnosis
AF with diagnosis
Warfarin Apixaban
LE 4.31 4.53 4.60
Discounted LY 3.59 3.75 3.80
Discounted QALYs 2.30 2.39 2.45
Costs
Baseline 229,025 238,458 241,473
OAC 0 843 2,870
Acute events 19,876 17,223 15,952
Total 248,901 256,525 260,294
Life expectancy Quality-adjusted life expectancy
AF diagnosis:
Costs

Minimum diagnostic yield
to be cost effective
12
61% of AF patients initiate OAC 100% of AF patients initiate OAC

Minimum diagnostic yield
to be cost effective
13
61% of AF patients initiate OAC 100% of AF patients initiate OAC
7d 7d 30d 30d
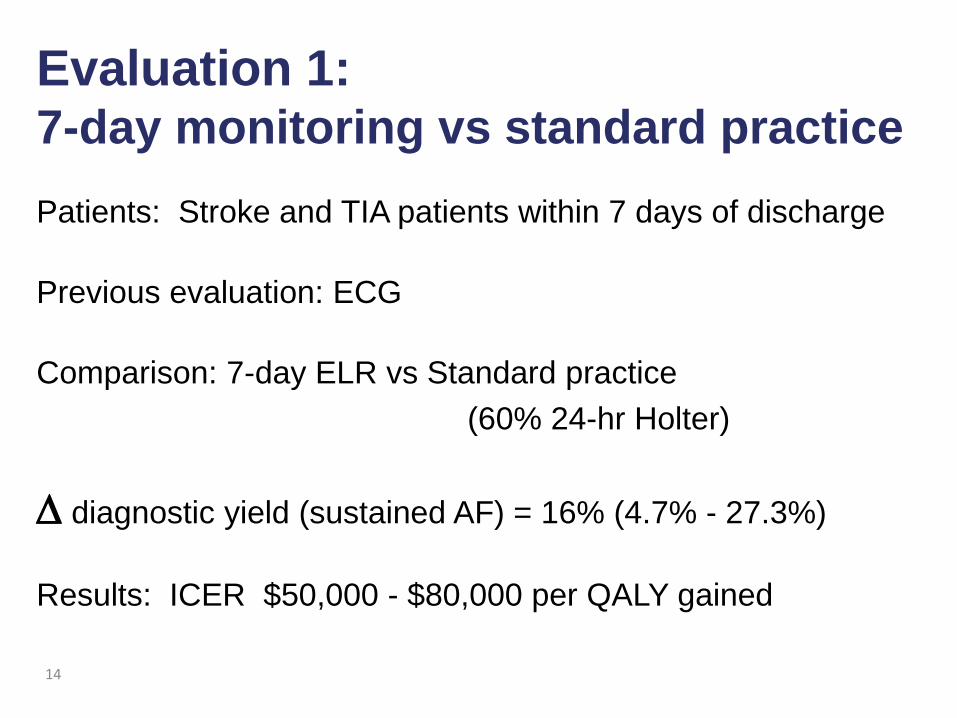
Evaluation 1: 7-day monitoring vs standard practice
Patients: Stroke and TIA patients within 7 days of discharge
Previous evaluation: ECG
Comparison: 7-day ELR vs Standard practice
(60% 24-hr Holter)
diagnostic yield (sustained AF) = 16% (4.7% - 27.3%)
Results: ICER $50,000 - $80,000 per QALY gained
14

Base case analysis
15
Health economic outcomes OAC treatment
Warfarin Apixaban
Lifetime Costs
Cost of FN diagnosis $151,148 $151,435
Cost of TP diagnosis $153,490 $155,140
Incr. cost of correct diagnosis $2,342 $3,705
Incr. cost of monitoring $139 $139
Lifetime benefits
QALYs of FN diagnosis 2.30 2.31
QALYs of TP diagnosis 2.36 2.40
Incr. QALYs of correct diagnosis 0.055 0.088
Incr. cost effectiveness ratio
(ICERs) ($/QALY gained) $58,800 $52,200

Sensitivity analysis
7-day monitoring ICER <$100,000 / QALY gained with
incremental diagnostic yield as low as 5%
Patient characteristics that increase cost effectiveness
• Higher risk of recurrent stroke (>10% py)
• Lower baseline risk of bleeding
• Healthier / Fewer comorbidities (lower baseline mortality risk; lower
baseline health care costs; higher baseline utility)
• Higher likelihood of OAC uptake if diagnosed
Societal perspective (apixaban)
• ICER $75,000 – 85,000 / QALY gained
• ICER <$70,000 if OAC if patient is above average baseline health
16
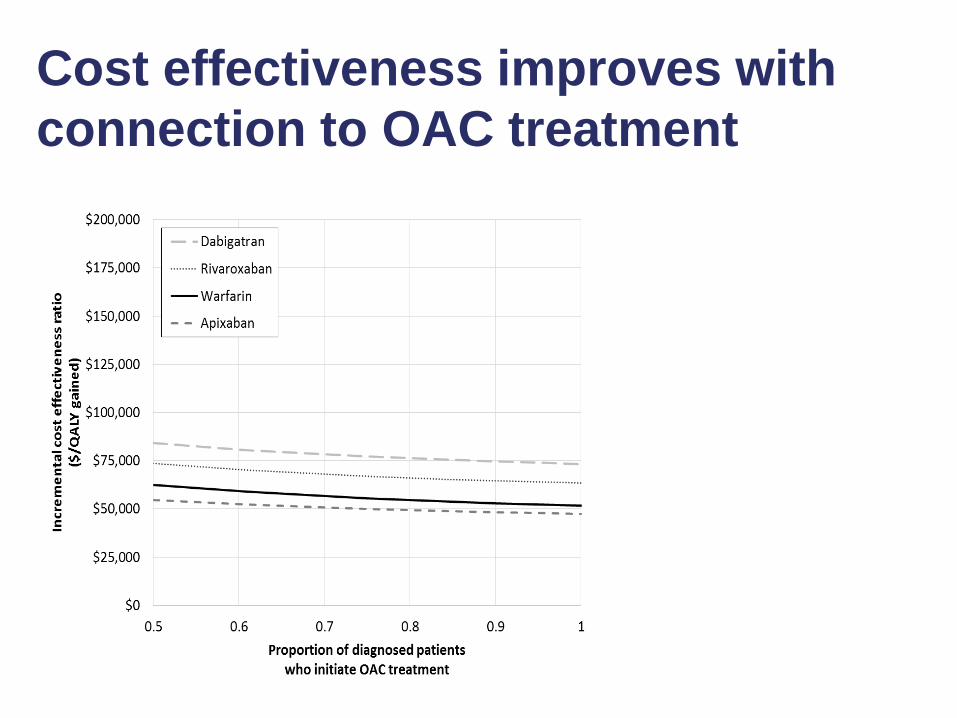
Cost effectiveness improves with
connection to OAC treatment
17

Cost of monitoring is critical factor
influencing cost effectiveness
18

Summary: 7-day monitoring vs standard practice
ICER likely between $40,000-$80,000 per QALY gained
• Patient population
• Unselected stroke and TIA patients within 7 days
• Prior monitoring: only ECG
• Targeted patient populations ICER <$50,000 per QALY gained
• > 20% incremental diagnostic yield
• high rate of connection to OAC treatment
• low OAC discontinuation rate
• selection of relatively healthy patients
• Unable to evaluate 7-day monitoring vs. universal 24-hour monitoring
• Optimal duration of monitoring is unknown
19

Evaluation 2:
30-day ELR vs 24-hour Holter
Patients: Cryptogenic stroke patients within 6 months
Previous evaluation: ECG and at least 24-hrs of Holter
Comparison: 30-day ELR vs 24-hr Holter
Incremental diagnostic yield = 12.9% (8.0% - 17.6%)
Results: ICER $90,000 - $120,000 per QALY gained
20

Sensitivity analysis
30-day monitoring followed by treatment with warfarin and
apixaban has an ICER < 100,000 per QALY gained
• Incremental diagnostic yield > 20%
• Incremental cost of monitoring < $300
• OAC uptake > 85%
• Patients with above average baseline health
• Patient and system factors alone insufficient to make 30-day
monitoring cost effective compared to 24-hour Holter without
greater diagnostic yield and/or lower incremental cost
• Societal perspective: base case >$110,000 per QALY gained
22

Summary
30-day ELR vs 24-hour Holter
Unlikely to be cost effective (ICER > $100,000/QALY gained)
• Patient population
• Cryptogenic stroke and TIA patients within 6 months
• Prior monitoring: ECG and 24-hour Holter
• Unable to compare 24-hour Holter to no monitoring
• Unclear if any monitoring after ECG and 24-hour Holter is cost effective
• Unable to evaluate whether evaluating patients sooner (within 30 or
90 days of stroke) would improve cost effectiveness
24

Evaluation 3:
3-years of ILR vs standard practice
Patients: Cryptogenic stroke patients within 90 days
Previous evaluation: ECG and at least 24-hrs of Holter
Comparison: 3-years of ILR vs. standard practice
(38% ECG or 24-hour Holter within 6 months)
30% of patients in ILR group diagnosed with AF
vs. 3% in the standard practice group
Incremental cost: EV ~$3400 ($2800 implantation + monitoring)
Results: ICER > $250,000 per QALY gained
25

Post discharge AF monitoring Evaluation 1: 7-day ELR vs. standard care
28
Patient with stroke or TIA
ECG in Hospital
Hospital discharge
Age 70 CHADS-VASC ~4
7-day ELR
Standard care
Conclusion: Likely cost effective • $40,000-80,000/QALY gained • ∆ diagnostic yield > 10-20% • Patient factors
• ↑risk of stroke; ↓risk of bleeding • Relatively healthy • ↑ connection to OAC
∆ diagnostic yield = 16% ∆ cost = $140

Post discharge AF monitoring Evaluation 2: 30-day ELR vs. 24-hr Holter
29
Patient with cryptogenic stroke or TIA
ECG in Hospital
Hospital discharge
Age 70 CHADS-VASC ~4
30-day ELR
24-hour Holter
Conclusion: Not cost effective • $90,000-120,000 / QALY gained • <$100,000 if ∆ diagnostic yield > 20% • <$100,000 if ∆ cost < $300 • Patient or system factors alone are unlikely to be sufficient
∆ diagnostic yield = 13% ∆ cost = $476
24-hr Holter

Post discharge AF monitoring Evaluation 3: ILR vs. standard care
30
Patient with cryptogenic stroke or TIA
ECG in Hospital
Hospital discharge
Age 70 CHADS-VASC ~4
3-year ILR
Standard care
Conclusion: Not cost effective • ICER > $250,000 / QALY gained
∆ diagnostic yield = 27% ∆ cost = $3400
24-hr Holter

Summary
In a stroke or TIA patient who received ECG in hospital
• 7-days of monitoring is likely cost effective compared to standard care
• Unclear if cost effective vs. universal 24-hour monitoring
• Unclear if 7-days is the optimal duration of monitoring
• Unlikely to be cost effective in a patient who has received in-patient
Holter/CICT/cECG monitoring (needs large incremental diagnostic yield)
In a cryptogenic stroke or TIA patient who received ECG and 24-hr Holter
• 30-day monitoring is unlikely cost effective compared to 24-hr Holter
• ILR is not cost effective compared to standard care
• Unclear 24-hour Holter is cost effective compared to no further monitoring
• Unclear if 30-days of monitoring is cost effective compared to 7-days in a
patient cohort without prior 24-hr Holter
31

Limitations
• Many comparisons of interest were not evaluated • Optimal sequence of monitoring technologies remains unknown
• Many simplifying structural assumptions • Assume a constant rate of recurrent stroke
• AF diagnosis after subsequent event
• OAC adherence, quitting after a bleeding event, and re-starting after a
clotting event
• Model considers patients at average risk • Explored the influence of patient factors on cost effectiveness of monitoring
• Do not consider correlation between patient factors
• Do not consider the incidence of AF after stroke • Incident AF will be captured by longer-monitoring technologies (ILR)
32

33

Evaluation 1: 7-day ELR vs. standard care
OAC Adherence
34

Evaluation 2: 30-day ELR vs. 24-hr Holter
OAC Adherence
35

Comparisons to other models
Kamel et al.
Cost effectiveness of dabigatran, apixaban vs. warfarin in
post-stroke patients with AF
36
Kamel et al. QALY
CADTH Base case OAC discontinuation No OAC discontinuation QALY LY QALY LY
Dabigatran 4.27 2.57 4.01 2.64 4.12
Apixaban 4.19 2.63 4.08 2.74 4.24
Warfarin 3.91 2.56 4.02 2.63 4.14
* 3% annual discount rate
Utility weight for initial health state = 0.994-0.987 vs. 0.68

Comparisons to other models
Coyle et al.
Cost effectiveness of NOACs vs. warfarin in post-stroke
patients with AF
• Lifetime QALYs with warfarin
• Coyle et al. Mild stroke (utility = 0.75): 4.45 QALYs
• Coyle et al. Severe stroke (utility = 0.33): 2.2 QALYs
• Our model Mixed cohort (utility = 0.68): 2.4 QALYs (3.75 LY)
37
* 5% annual discount rate
Our rate of recurrent stroke on warfarin is greater. Coyle et al. = 0.035 (base rate of 0.016 x HR of 2.2) Our model = 10.2% annual rate on aspirin x HR of 0.63 = 0.068

Model-based outcomes
38
Outcomes AF without
diagnosis
AF with diagnosis
Warfarin Apixaban
Within 2 years (per 10,000)
Recurrent IS, severe or fatal 1,087 709 636
Recurrent stroke, any 1,724 1,223 1,093
ICH 47 99 42
GI bleed 171 276 264
Within 5 years (per 10,000)
Recurrent IS, severe or fatal 2,002 1,455 1,345
Recurrent stroke, any 3,189 2,459 2,266
ICH 87 170 80
GI bleed 316 487 471
LE 4.31 4.53 4.60

Model-based outcomes
39
Outcomes AF without
diagnosis
AF with diagnosis
Warfarin Apixaban
LE 4.31 4.53 4.60
Discounted LY 3.59 3.75 3.80
Discounted QALYs 2.30 2.39 2.45
Costs
Baseline 229,025 238,458 241,473
OAC 0 843 2,870
Acute events 19,876 17,223 15,952
Total 248,901 256,525 260,294

Model Validation
40

Comparison to Oxford Vascular Study
Oxford vascular study • 440 TIA and 748 stroke patients (2002-2007) followed up for 5-10 years
• 17% prior history of stroke
• 18% prior diagnosis of AF
41
Life years QALYs
TIA 4.3 3.3
Stroke 3.6 2.5
Mild 4.1 2.9
Moderate 2.8 1.7
Severe 1.4 0.7
Overall 3.8 2.7
Adjusted (12%) 4.4 3.1
Life years QALYs
No AF 7.2 4.73
AF without diagnosis 4.3 2.75
AF with diagnosis
Warfarin 4.5 2.88
Apixaban 4.6 2.95
Our model Oxford Vascular Study

Comparison to Oxford Vascular Study
Oxford vascular study • 440 TIA and 748 stroke patients (2002-2007) followed up for 5-10 years
• 17% prior history of stroke
• 18% prior diagnosis of AF
42
5-year risk of recurrent stroke
TIA 16%
Stroke 20%
5-year risk of recurrent stroke
No AF 8.1%
AF without diagnosis 31.9%
AF with diagnosis
Warfarin 24.6%
Apixaban 22.7%
Our model Oxford Vascular Study

Inputs: Natural history
Recurrent stroke
MI ICH GI bleed
Annual risk of event
No AF 2.2% 2.6% 0.3% 1.1%
AF no OAC 10.2% 5.1% 0.3% 1.1%
HR with OAC (compared to aspirin*)
Warfarin 0.38 0.89 2.60 2.50
Dabigatran 0.38 1.42 1.08 4.11
Rivaroxaban 0.36 0.72 1.74 3.65
Apixaban 0.35 0.78 1.09 2.23
43

Inputs: Costs and Utilities
Recurrent stroke
Death GI bleed MI ICH TIA/Mild* Mod-Sev
Month of
Mortality (no OAC/OAC) 0% 11% 31%/44% 39% / 29%
Cost $43,600 $9,975 $18,400 $36,000 $16,200 $55,000
QOL - 0.03 - 0.01 - 0.05 - 0.02 - 0.13
History of
Annual mortality (no AF/AF) 12 % / 16 % 16 % / 22 %
Direct health costs 18,400 18,400 18,400 30,900
Unpaid caregiver costs 15,000 15,000 15,000 25,000
QOL 0.65 0.62 0.68 0.31

Comparison to Yong et al.
Cost effectiveness of 30-day ELR vs 24-hr Holter
46 * 5% annual discount rate ** assumes 16.1% AF prevalence
Key differences • Yong et al. are modeling a healthier cohort
• Annual mortality rate = 5.4% per year vs. 12.1% per year • Baseline utility = 0.93 vs. 0.68 • Baseline costs associated with history of stroke = $9301 vs. $43,200
Yong et al. CADTH
30-day ELR LE = 8.158 years LE = 6.8 years
24-hr Holter LE = 8.138 years LE = 6.2 years
ICER Cost saving $151,208 / QALY gained

AF diagnosis
occurs over time
Assumed
• 30% AF prevalence
• While undiagnosed, patients
(with and without AF) may
die or have recurrent stroke
• Considered censored
• Calculated the rate of AF
identification in undiagnosed
patients to match KM curves in
Sanna (NEJM 2014)
47

Cohort with 30% AF prevalence
48
Outcomes Warfarin
Standard practice ILR
Apixaban
Standard practice ILR
Within 2 years (per 10,000)
Recurrent IS, severe or fatal 475 449 474 443
Recurrent stroke, any 780 746 777 735
ICH 51 54 50 49
GI bleed 183 190 183 189
LE 6.31 6.33 6.31 6.34
Discounted LY 4.82 4.83 4.82 4.84
Discounted QALY 3.18 3.19 3.18 3.19

Cohort with 30% AF prevalence
49
Outcomes Warfarin
Standard practice ILR
Apixaban
Standard practice ILR
Costs
Baseline $292,815 $293,792 $292,959 $294,14
Testing $40 $1,129 $40 $1,129
OAC $41 $118 $138 $402
Acute Events $11,651 $11,404 $11,591 $11,227
TOTAL $304,547 $306,443 $304,727 $306,971
Incr. cost of ILR monitoring $1,896 $2,244
Incr. QALYs 0.009 0.015
Incr. cost effectiveness ratio
(ICERs) ($/QALY gained)
$205,169 $151,208

Sensitivity analysis
ILR monitoring vs. standard care
• ICER > 100,000 per QALY gained is robust
• Doubling the diagnosis rate (diagnosing patients faster)
W: $175,400 per QALY gained A: $132,600 per QALY gained
• Immediate diagnosis in ILR arm
W: $154,300 per QALY gained A: $120,500 per QALY gained
• Cost of implantation = $0 ICER > $100,000 per QALY gained
• Cost of monitoring =$0 ICER > $100,000 per QALY gained
• ICER < 100,000 per QALY gained Cost of implantation and
monitoring 25% of base case
50

Comparison to Diamantopoulos et al.
Cost effectiveness of ILR vs standard care
51
* 3.5% annual discount rate ** 5% annual discount rate
Key differences • Baseline mortality rate in Diamantopoulos et al. is based on UK life tables (no increase in mortality rate for history of stroke) • Baseline utility = 0.76 vs. 0.68 • Low costs of long-term care
• e.g., £578 per year after a mild stroke (vs. $43,200) • e.g., £1,712 per year after a recurrent major stroke (vs. $65,000)
Diamantopoulos et al.* CADTH**
ILR 7.367 QALY 4.84 QALY
Standard care 7.216 QALY 4.82 QALY
ICER £ 17,175 / QALY gained $151,208 / QALY gained