Embed Size (px)
Citation preview
ORIGINAL RESEARCH ARTICLE
Cost-Effectiveness Analysis of Crohn’s Disease Treatmentwith Vedolizumab and Ustekinumab After Failure of TumorNecrosis Factor-a Antagonist
Przemysław Holko1• Paweł Kawalec1
• Andrzej Pilc1,2
Published online: 17 April 2018
� The Author(s) 2018
Abstract
Objective The aim was to evaluate the cost-effectiveness
of Crohn’s disease (CD) treatment with vedolizumab and
ustekinumab after failure of therapy with tumor necrosis
factor-a antagonists (anti-TNFs).
Methods The Markov model incorporated the lifetime
horizon, synthesis-based estimates of biologics’ efficacy in
relation to anti-TNF exposure, and administration of bio-
logics reflecting clinical practice (e.g., sequence of bio-
logics, retreatment, 12-month treatment). The utilities, non-
medical costs and indirect costs were derived from a study
of 200 adult patients with CD, while the healthcare costs
were from a study of 1393 adults with CD who used bio-
logics in Poland. The quality-adjusted life years (QALYs)
and costs (the societal perspective) were discounted with
the annual rates of 3.5 and 5%, respectively.
Results The addition of vedolizumab (ustekinumab) to the
sequence of available anti-TNFs (after first-line infliximab
or after second-line adalimumab) led to a gain of 0.364
(0.349) QALYs at an additional cost of €5600.24
(€6593.82). The incremental cost-effectiveness ratios
(ICERs) were €15,369 [95% confidence interval (CI)
7496–61,354] and €18,878 (95% CI 9213–85,045) per
QALY gained with vedolizumab and ustekinumab,
respectively. Sensitivity analyses revealed a high impact on
the ICERs of the relapse rate after discontinuation of bio-
logic treatment. The highest value of vedolizumab/ustek-
inumab was estimated after the failure of therapies with
both anti-TNFs.
Conclusions CD treatment with ustekinumab or vedolizu-
mab after failure of anti-TNF therapy appears to be cost-
effective at a threshold of €31,500. The replacement of the
second-line anti-TNF with ustekinumab/vedolizumab and
the course of the disease after discontinuation of biologics
are influential drivers of the cost-effectiveness.
Electronic supplementary material The online version of thisarticle (https://doi.org/10.1007/s40273-018-0653-2) contains supple-mentary material, which is available to authorized users.
& Przemysław Holko
Paweł Kawalec
Andrzej Pilc
1 Drug Management Department, Institute of Public Health,
Faculty of Health Sciences, Jagiellonian University Medical
College, Grzegorzecka 20, 31-531 Krakow, Poland
2 Department of Neurobiology, Polish Academy of Sciences,
Smetna 12, 31-343 Krakow, Poland
PharmacoEconomics (2018) 36:853–865
https://doi.org/10.1007/s40273-018-0653-2

Key points
Ustekinumab and vedolizumab are effective
treatments of Crohn’s disease (CD) with uncertain
pharmacoeconomic value after failure of therapy
with tumor necrosis factor-a antagonists (anti-
TNFs).
Ustekinumab and vedolizumab treatment after
failure of anti-TNF therapy appears to be cost-
effective from the societal perspective
Sensitivity analyses revealed that the conclusion was
influenced by the course of the disease (e.g., relapse
rate) among patients who failed or had
contraindications to therapy with infliximab and
adalimumab. The highest economic value of
ustekinumab or vedolizumab was estimated after
failure of therapies with both anti-TNFs
1 Introduction
Crohn’s disease (CD) is a chronic and recurrent inflam-
matory bowel disease, which is often associated with par-
enteral symptoms (up to 40% of patients) and related
immune disorders. It is not possible to cure the disease, but
proper treatment can significantly reduce the symptoms
and lead to long-term remission. Aminosalicylates, gluco-
corticoids, immunomodulatory drugs and antibiotics are
used to treat active CD (standard treatments). The use of
biologic drugs is recommended mainly among patients
who cannot use the standard treatments because of intol-
erance, no response or contraindications. The tumor
necrosis factor-a antagonists (anti-TNFs), namely, inflix-
imab and adalimumab, have been the mainstay of biologic
treatment of CD [1]. Recently, new biologic agents,
namely, vedolizumab and ustekinumab, were approved for
the treatment of CD in Europe. Vedolizumab is a second-
generation monoclonal antibody directed against the
intestinal tissue-specific a4b7 integrin. Ustekinumab is a
monoclonal antibody directed against the p40 subunit of
interleukins 12 and 23. Those biologics are usually posi-
tioned after failure of therapy with anti-TNF because of a
different mechanism of action, possibly lower efficacy and/
or a possibly higher cost [2].
Only three cost-effectiveness studies of vedolizumab in
the treatment of CD [3–5] and no study of ustekinumab
have been published [see the Electronic Supplementary
Material (ESM), Supplementary Table 1]. However, the
appraisals of the manufacturers’ economic evaluations of
those biologics are available [6, 7]. The limitations of the
published studies make them of little use in terms of
obtaining plausible conclusions for the population of
patients who failed therapy with anti-TNFs. For example,
the clinical data indicated a difference in efficacy between
anti-TNF–naive and anti-TNF–failure patients [2, 8], but
the studies did not address this issue [4, 5]. Additionally,
Erim et al. [3] assumed continuation of anti-TNF treatment
despite no response, which cannot be applied to all patients
after failure of anti-TNF therapy in real-world practice.
The failure of anti-TNF therapy is usually defined as no
response, loss of response or intolerance of anti-TNF, and
there are usually no contraindications to use another anti-
TNF. Moreover, in clinical practice, patients can be treated
several times with the same agent (retreatment) [6]. The
inclusion of vedolizumab or ustekinumab in the treatment
of CD will result in its use among patients who cannot use
anti-TNFs because of failure of therapy, those who would
have another treatment with the same anti-TNF, and those
who would start another anti-TNF in the absence of
ustekinumab or vedolizumab. Therefore, the research
problem is not limited to a comparison between no biologic
treatment and the treatment with vedolizumab or
ustekinumab.
Authorities in some countries (e.g., Poland, UK) have
introduced a limitation of treatment duration because of the
lack of long-term data and/or other reasons. Despite the
limit, retreatment is usually allowed [9]. There has been no
economic evaluation that would incorporate both aspects of
CD treatment (the limitation of treatment duration and
retreatment) [6]. Bodger et al. [10] incorporated anti-TNF
treatment durations of 12 and 24 months, but did not
consider the possibility of retreatment and a different
course of the disease after discontinuation of biologic
treatment. Available evidence indicates that the risk of
relapse after discontinuation of biologic treatment of CD is
very high [11, 12]. The failure to capture the progressive
and chronic nature of CD was indicated as the major lim-
itation of the economic models for biologic treatment [6].
CD constitutes a significant burden for the patient and
society [13]. The indirect costs are relevant in an economic
evaluation adopting a societal perspective, and inclusion of
indirect cost is often advocated [14]. Poor data on indirect
costs were indicated as one of the major challenges in the
cost-effectiveness analysis of biologic treatment of CD
[15].
Therefore, our aim was to evaluate the cost-effective-
ness of CD treatment with vedolizumab and ustekinumab
after failure of anti-TNF therapy from the societal per-
spective, using a model incorporating the efficacy of bio-
logics in relation to previous exposure to anti-TNF, indirect
costs and treatment reflecting clinical practice (sequence of
854 P. Holko et al.
biologic agents, retreatment allowed, maximum treatment
duration of 12 months, maintenance treatment among
responders to induction only, and utilization of drugs dur-
ing induction treatment according to product
characteristics).
2 Methods
The population included adult patients with moderate to
severe CD, not adequately treated with standard treatments.
The cohort of patients was observed from the start of the
first biologic treatment to death (lifetime horizon). Up to
three lines of biologic treatments were considered, and
each treatment could not last longer than 12 months.
Retreatment with the same agent was allowed among
patients who were successfully treated previously, that is,
patients after either elective discontinuation or completion
of the 12-month treatment period. Three competitive
treatment strategies were considered: (1) second-line
adalimumab after failure of therapy with infliximab in the
first line (status quo); (2) adalimumab or vedolizumab in
the second line after failure of therapy with infliximab, and
each of the second-line treatments after another one in the
third line; and (3) adalimumab or ustekinumab in the sec-
ond line after failure of therapy with infliximab, and each
of the second-line treatments after another one in the third
line. A standard dosage regimen was used for all biologics
[16]. It was assumed that some patients could not start a
subsequent line of the biologic treatment; therefore, they
were subjected to intensified standard treatments (including
surgery). To distinguish patients excluded from the sub-
sequent line of biologic treatment from those after suc-
cessful biologic treatment, the standard CD treatments used
in both groups were named best supportive care (BSC) and
standard of care, respectively. In a base-case analysis, it
was assumed that one-third of the patients did not receive
the last line of biologic treatment and two-thirds of the
patients received vedolizumab or ustekinumab in the sec-
ond line of the new strategies. The remaining patients
could use the treatment or BSC in the third line, after
failure of therapy with second-line anti-TNF (see the ESM,
Supplementary Figure 1).
The Markov model incorporated synthesis-based esti-
mates of the efficacy of biologics (details in Sect. 2.3) and
patient-level data on costs and utilities obtained from
recent studies from Poland: a survey among 200 adult
patients [13] and an analysis of resource utilization among
1393 adult patients treated with biologics who were iden-
tified from the national database [17]. The setting of this
study was the same as the country of the cost data (Poland).
The health outcomes and costs were discounted at an
annual rate of 3.5 and 5%, respectively [18].
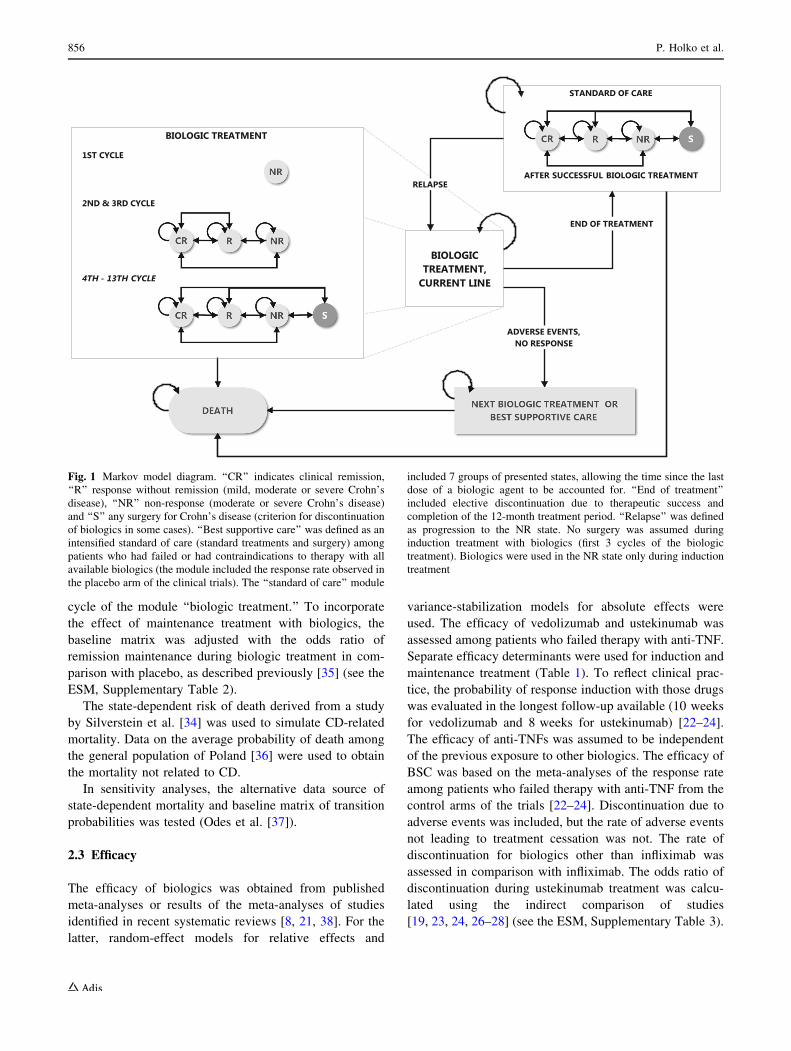
2.1 Decision Model
Health states differing by the severity of CD symptoms,
response to treatment, and type of treatment were included
in the model (Fig. 1). The disease course of clinical
remission (CR), response to treatment without remission
(R), non-response (NR), and surgery (S) states was simu-
lated with 4-week cycles. The cycle length was based on
dosing intervals of the biologics, duration of the biologic
treatment in clinical practice, and available information on
transition probabilities (Sect. 2.2). The induction (three
cycles) and maintenance phases of biologic treatment were
included. Patients entered the model in the NR state of the
‘‘biologic treatment’’ module and faced movement to
subsequent health states. Overall, the model included 384
states for each strategy and was implemented in Microsoft
Excel (Microsoft Corporation, Redmond, WA). The main
parameters of the model are presented in Table 1.
2.2 Natural Course of the Disease
The baseline matrix of transition probabilities between the
states was derived from the study by Silverstein et al. [34].
The original eight-state matrix [34] was reduced to health
states included in the model, using a previously described
method [35] (i.e., weighting the combined states using the
total time spent in those states, which preserves the course
of the disease observed in the original study [34]). The
medical and post-surgery remission states were combined
into the CR state; the ‘‘mild’’ and ‘‘drug-responsive’’ states
into the R state; and the ‘‘drug-dependent’’ and ‘‘drug-re-
fractory’’ states into the NR state; the surgery state was
unchanged [10]. A meta-analysis of observational studies
revealed that the cumulative risk of relapse was 38, 40, and
49% at 6, 12, and[24 months, respectively, after elective
discontinuation of biologic treatment [11]. Compared to
prediction of the baseline matrix, the relapse rate was
significantly higher during the first 6 months (38 vs. 4.9%),
but slightly lower between 6 and 12 months after discon-
tinuation (3.2 vs. 5.7%). Hence, an increased relapse rate
was assumed during the first 6 months after elective dis-
continuation of biologic treatment (e.g., due to therapeutic
success) or completion of the 12-month treatment period.
Among patients who discontinued biologic treatment due
to failure, a more severe course of the disease was
assumed, which included: (1) a higher increase in the
relapse rate compared with the rate after elective discon-
tinuation [12] and (2) an increase in the relapse rate without
time limit. The relapse rates derived from studies by Gis-
bert et al. [11] and Casanova et al. [12] were used to adjust
the baseline matrix of transition probabilities.
The efficacy of biologics for induction treatment was
used to embed patients to health states during the second
Value of CD Treatment After Anti-TNF Therapy 855
cycle of the module ‘‘biologic treatment.’’ To incorporate
the effect of maintenance treatment with biologics, the
baseline matrix was adjusted with the odds ratio of
remission maintenance during biologic treatment in com-
parison with placebo, as described previously [35] (see the
ESM, Supplementary Table 2).
The state-dependent risk of death derived from a study
by Silverstein et al. [34] was used to simulate CD-related
mortality. Data on the average probability of death among
the general population of Poland [36] were used to obtain
the mortality not related to CD.
In sensitivity analyses, the alternative data source of
state-dependent mortality and baseline matrix of transition
probabilities was tested (Odes et al. [37]).
2.3 Efficacy
The efficacy of biologics was obtained from published
meta-analyses or results of the meta-analyses of studies
identified in recent systematic reviews [8, 21, 38]. For the
latter, random-effect models for relative effects and
variance-stabilization models for absolute effects were
used. The efficacy of vedolizumab and ustekinumab was
assessed among patients who failed therapy with anti-TNF.
Separate efficacy determinants were used for induction and
maintenance treatment (Table 1). To reflect clinical prac-
tice, the probability of response induction with those drugs
was evaluated in the longest follow-up available (10 weeks
for vedolizumab and 8 weeks for ustekinumab) [22–24].
The efficacy of anti-TNFs was assumed to be independent
of the previous exposure to other biologics. The efficacy of
BSC was based on the meta-analyses of the response rate
among patients who failed therapy with anti-TNF from the
control arms of the trials [22–24]. Discontinuation due to
adverse events was included, but the rate of adverse events
not leading to treatment cessation was not. The rate of
discontinuation for biologics other than infliximab was
assessed in comparison with infliximab. The odds ratio of
discontinuation during ustekinumab treatment was calcu-
lated using the indirect comparison of studies
[19, 23, 24, 26–28] (see the ESM, Supplementary Table 3).
BIOLOGICTREATMENT,
CURRENT LINE
STANDARD OF CARE
AFTER SUCCESSFUL BIOLOGIC TREATMENTRELAPSE
ADVERSE EVENTS,NO RESPONSE
END OF TREATMENT
BIOLOGIC TREATMENT
1ST CYCLE
2ND & 3RD CYCLE
4TH - 13TH CYCLE
Fig. 1 Markov model diagram. ‘‘CR’’ indicates clinical remission,
‘‘R’’ response without remission (mild, moderate or severe Crohn’s
disease), ‘‘NR’’ non-response (moderate or severe Crohn’s disease)
and ‘‘S’’ any surgery for Crohn’s disease (criterion for discontinuation
of biologics in some cases). ‘‘Best supportive care’’ was defined as an
intensified standard of care (standard treatments and surgery) among
patients who had failed or had contraindications to therapy with all
available biologics (the module included the response rate observed in
the placebo arm of the clinical trials). The ‘‘standard of care’’ module
included 7 groups of presented states, allowing the time since the last
dose of a biologic agent to be accounted for. ‘‘End of treatment’’
included elective discontinuation due to therapeutic success and
completion of the 12-month treatment period. ‘‘Relapse’’ was defined
as progression to the NR state. No surgery was assumed during
induction treatment with biologics (first 3 cycles of the biologic
treatment). Biologics were used in the NR state only during induction
treatment
856 P. Holko et al.
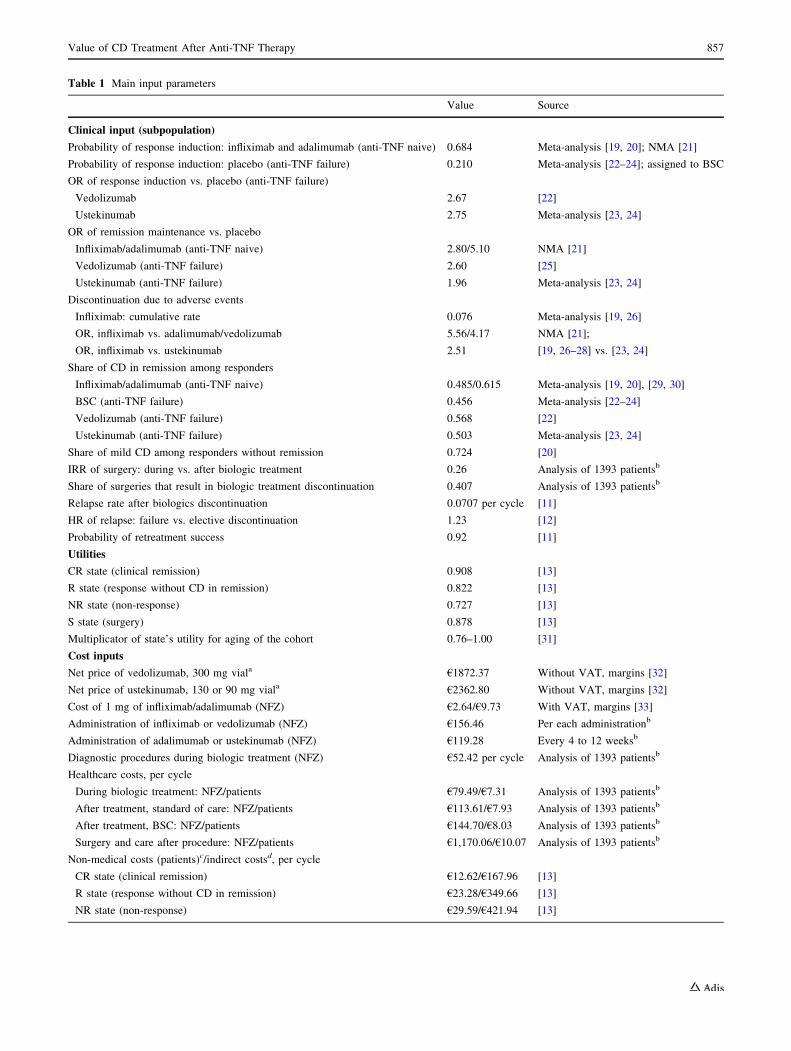
Table 1 Main input parameters
Value Source
Clinical input (subpopulation)
Probability of response induction: infliximab and adalimumab (anti-TNF naive) 0.684 Meta-analysis [19, 20]; NMA [21]
Probability of response induction: placebo (anti-TNF failure) 0.210 Meta-analysis [22–24]; assigned to BSC
OR of response induction vs. placebo (anti-TNF failure)
Vedolizumab 2.67 [22]
Ustekinumab 2.75 Meta-analysis [23, 24]
OR of remission maintenance vs. placebo
Infliximab/adalimumab (anti-TNF naive) 2.80/5.10 NMA [21]
Vedolizumab (anti-TNF failure) 2.60 [25]
Ustekinumab (anti-TNF failure) 1.96 Meta-analysis [23, 24]
Discontinuation due to adverse events
Infliximab: cumulative rate 0.076 Meta-analysis [19, 26]
OR, infliximab vs. adalimumab/vedolizumab 5.56/4.17 NMA [21];
OR, infliximab vs. ustekinumab 2.51 [19, 26–28] vs. [23, 24]
Share of CD in remission among responders
Infliximab/adalimumab (anti-TNF naive) 0.485/0.615 Meta-analysis [19, 20], [29, 30]
BSC (anti-TNF failure) 0.456 Meta-analysis [22–24]
Vedolizumab (anti-TNF failure) 0.568 [22]
Ustekinumab (anti-TNF failure) 0.503 Meta-analysis [23, 24]
Share of mild CD among responders without remission 0.724 [20]
IRR of surgery: during vs. after biologic treatment 0.26 Analysis of 1393 patientsb
Share of surgeries that result in biologic treatment discontinuation 0.407 Analysis of 1393 patientsb
Relapse rate after biologics discontinuation 0.0707 per cycle [11]
HR of relapse: failure vs. elective discontinuation 1.23 [12]
Probability of retreatment success 0.92 [11]
Utilities
CR state (clinical remission) 0.908 [13]
R state (response without CD in remission) 0.822 [13]
NR state (non-response) 0.727 [13]
S state (surgery) 0.878 [13]
Multiplicator of state’s utility for aging of the cohort 0.76–1.00 [31]
Cost inputs
Net price of vedolizumab, 300 mg viala €1872.37 Without VAT, margins [32]
Net price of ustekinumab, 130 or 90 mg viala €2362.80 Without VAT, margins [32]
Cost of 1 mg of infliximab/adalimumab (NFZ) €2.64/€9.73 With VAT, margins [33]
Administration of infliximab or vedolizumab (NFZ) €156.46 Per each administrationb
Administration of adalimumab or ustekinumab (NFZ) €119.28 Every 4 to 12 weeksb
Diagnostic procedures during biologic treatment (NFZ) €52.42 per cycle Analysis of 1393 patientsb
Healthcare costs, per cycle
During biologic treatment: NFZ/patients €79.49/€7.31 Analysis of 1393 patientsb
After treatment, standard of care: NFZ/patients €113.61/€7.93 Analysis of 1393 patientsb
After treatment, BSC: NFZ/patients €144.70/€8.03 Analysis of 1393 patientsb
Surgery and care after procedure: NFZ/patients €1,170.06/€10.07 Analysis of 1393 patientsb
Non-medical costs (patients)c/indirect costsd, per cycle
CR state (clinical remission) €12.62/€167.96 [13]
R state (response without CD in remission) €23.28/€349.66 [13]
NR state (non-response) €29.59/€421.94 [13]
Value of CD Treatment After Anti-TNF Therapy 857
2.4 Utilities
The health outcomes were assessed in terms of the quality-
adjusted life years (QALYs). The model was informed with
the state-dependent utilities from a cross-sectional study of
200 adult patients with CD from Poland [13]. The infor-
mation regarding patients with any surgery for CD in a
month preceding participation in the study (five patients)
was used to obtain the utility of the surgery state. The
published sources of utilities (see the ESM, Supplementary
Table 4) were tested in sensitivity analyses.
The size of the study by Holko et al. [13] was insuffi-
cient to assess the impact of age on the utilities. Hence, the
age-dependent utilities of the general population of Poland
[31] were incorporated to adjust the state-dependent utili-
ties for the cohort aging. The biologics differ by route of
administration, but the process utility was not included in
the model. No significant difference in the process utility of
subcutaneous and intravenous biologics has been reported
recently [39].
2.5 Costs
The costs were assessed from the societal perspective. The
healthcare, direct non-medical costs and indirect costs were
included and presented in Euros [€1 = 4.27 Polish zloty
(PLN) = US$1.13 = 0.88 British pounds (GBP); average
in 2017). Older cost data were inflated to 2017 using the
overall consumer price index [40] and converted to Euros
using the average exchange rate in the 2017 [41].
The direct non-medical costs (e.g., special diet, trans-
portation to a medical facility) and indirect costs (absen-
teeism, presenteeism, loss of productivity at unpaid job if
not compensated by caregivers and informal care) in rela-
tion to the health state were calculated using patient-level
data from study by Holko et al. [13]. Currently, vedolizu-
mab and ustekinumab (90 mg) are not available in Poland.
The maximum reimbursement prices of vedolizumab and
ustekinumab in Slovakia [32] (a Central and Eastern
European country with the list prices of those biologics
available) were adjusted for the difference in taxes and
margins between Slovakia and Poland and used in the
model. The average reimbursement costs of infliximab and
adalimumab in Poland in the first half of 2017 were
included [33]. The costs of administration and diagnostic
procedures during biologic treatment were based on med-
ical resources identified in a retrospective analysis of 1393
patients with CD (the description of the cost analysis
among patients identified from a database by Holko et al.
[17] is presented in the ESM). The data were used to obtain
other CD-related healthcare costs, namely, the cost of
immunomodulatory drugs (azathioprine, cyclosporine,
mercaptopurine, methotrexate), aminosalicylates, systemic
glucocorticoids, antibiotics, and all medical services of
hospital and ambulatory care. The cost of adverse events
was not assessed directly, but was included in overall
healthcare costs. However, due to the lack of detailed
information on CD severity among participants, the
healthcare costs were assessed in relation to biologic
treatment, that is, during treatment (12,508 patient-years)
and after biologic treatment among patients exposed to
biologics for more than 100 days (11,771 patient-years).
The healthcare cost of BSC was based on the post-treat-
ment data among patients exposed to biologics for
100 days or less (most likely non-responders; 3843 patient-
years). The cost of the surgery state was based on 1043
procedures (678 patients).
2.6 Cost-Effectiveness Analysis
The primary endpoint was the incremental cost-effective-
ness ratio (ICER) calculated as the ratio of the difference in
total costs and in QALYs between the new strategies with
ustekinumab or vedolizumab and status quo. The ICERs
were compared with the threshold of three times the gross
domestic product per capita in Poland (€31,500 or
PLN134,514) [18].
The ‘‘threshold price’’ informs about the maximal price
of a drug at which using it is still cost-effective with a
given threshold. To enhance generalizability and limit the
Table 1 continued
Value Source
S state (surgery) €22.00/€751.21 [13]
Anti-TNF tumor necrosis factor-a antagonist, BSC best supportive care, CD Crohn’s disease, HR hazard ratio, IRR incidence rate ratio, NFZ
Narodowy Fundusz Zdrowia (Polish National Health Fund), NMA network meta-analyses, OR odds ratio, VAT value added taxaMultiplied by 1.134 to obtain the cost of vial from the NFZ perspectivebA retrospective analysis of 1393 adults with CD who used biologics in Poland (see Electronic Supplementary Material for the details)cSpecial diet, transportation to the medical facility, etcdAbsenteeism, presenteeism among patients at productivity age, loss of productivity at unpaid job (if not compensated by caregivers), and
informal care; among patients aged C 65 years, the values were reduced by 80–90% (see Electronic Supplementary Material, Supplementary
Table 6)
858 P. Holko et al.
impact of assumptions on the prices of ustekinumab and
vedolizumab on the conclusions, the ‘‘threshold prices’’ of
those drugs were presented as a function of the threshold
and price of the biosimilar infliximab [42]. The method of
calculation of the ‘‘threshold price’’ from the formula of
incremental net monetary benefit is presented in Supple-
mentary Table 5 (see the ESM).
Reporting of the study was done in adherence with the
Consolidated Health Economic Evaluation Reporting
Standards [43] and Polish guidelines [18].
2.7 Sensitivity Analyses
One- and multi-way deterministic sensitivity analyses
(DSA) were performed for all parameters. Based on their
results, the extreme scenario analyses were constructed for
each group of parameters. Additionally, the alternative
source or assumption was tested.
The probabilistic sensitivity analysis, based on 1000 sets
of randomly drawn input parameters, was carried out for
calculating the confidence intervals (CIs) around the base-
case results, using a nonparametric approach and to gen-
erate a cost-effectiveness acceptability curve.
All parameters of the model with CI and probability
distribution are presented in Supplementary Table 6 (see
the ESM). The model was available for review.
3 Results
3.1 Model Validation
The model predictions were validated with data from
clinical trials and a study on 1393 patients using anti-TNFs
in Poland (see the ESM, Supplementary Table 7). The
model predicted survival on anti-TNF treatment that was
quite similar to the one observed among 1393 patients
treated with biologics in Poland. However, in the real-
world, more patients discontinued treatment during the
induction phase, but fewer patients discontinued treatment
right after completion of this phase in comparison with
model predictions (Supplementary Figure 2). This resulted
in some differences in the average use of biologics (e.g.,
6.2 of administrations of infliximab in the model vs. 5.5 of
those in the real-world). Around 47.6% of patients starting
infliximab and 44.3% of those starting adalimumab
received retreatment or subsequent-line biologic treatment
during the 2 years from the start of the therapy in the
model. The corresponding values in the real-world were
similar: 48.1 and 39.5%, respectively.
The 12-month remission rate for BSC among responders
(23%) calculated with the model’s inputs was similar to the
results of the placebo arm of the study for ustekinumab
(26%) [23], but higher than the results of the study for
vedolizumab (13%) [25]. Additionally, the model was
validated by the authors via hand searching of the model’s
code and formulas, extreme value testing for all input
parameters, tracking of patients through the model, testing
of the submodules, and implementation of alternative input
data.
3.2 Base-Case Analysis
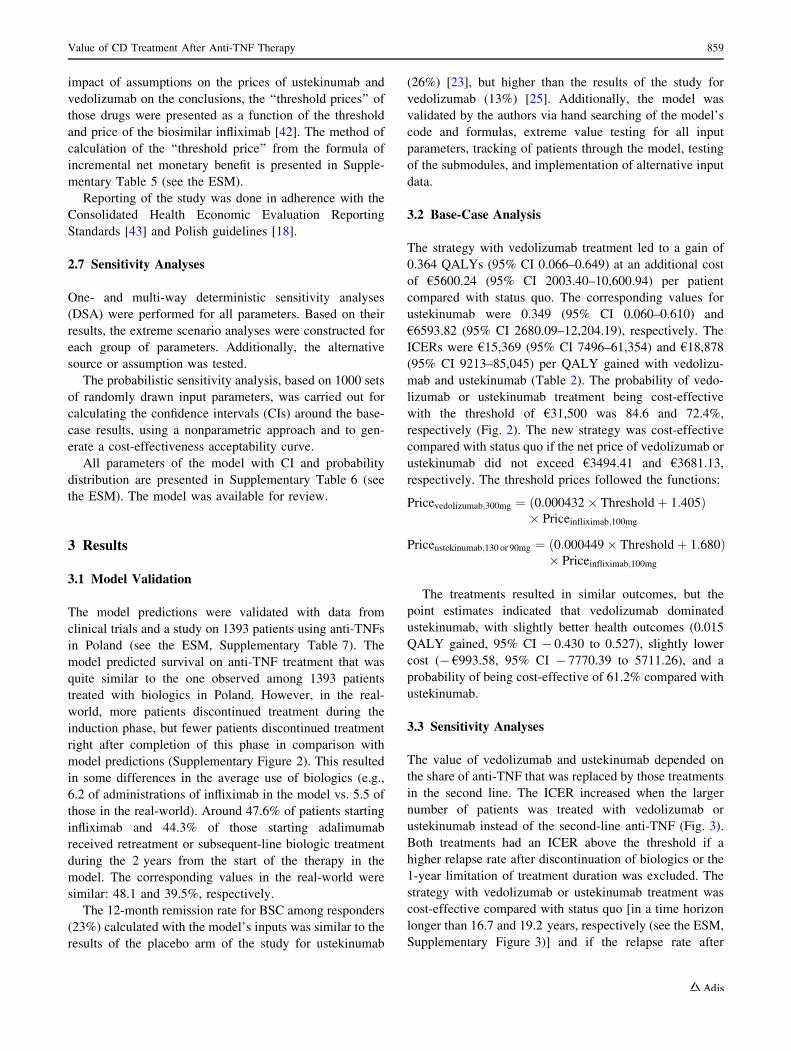
The strategy with vedolizumab treatment led to a gain of
0.364 QALYs (95% CI 0.066–0.649) at an additional cost
of €5600.24 (95% CI 2003.40–10,600.94) per patient
compared with status quo. The corresponding values for
ustekinumab were 0.349 (95% CI 0.060–0.610) and
€6593.82 (95% CI 2680.09–12,204.19), respectively. The
ICERs were €15,369 (95% CI 7496–61,354) and €18,878
(95% CI 9213–85,045) per QALY gained with vedolizu-
mab and ustekinumab (Table 2). The probability of vedo-
lizumab or ustekinumab treatment being cost-effective
with the threshold of €31,500 was 84.6 and 72.4%,
respectively (Fig. 2). The new strategy was cost-effective
compared with status quo if the net price of vedolizumab or
ustekinumab did not exceed €3494.41 and €3681.13,
respectively. The threshold prices followed the functions:
Pricevedolizumab;300mg ¼ 0:000432 � Threshold þ 1:405ð Þ� Priceinfliximab;100mg
Priceustekinumab;130 or 90mg ¼ 0:000449 � Threshold þ 1:680ð Þ� Priceinfliximab;100mg
The treatments resulted in similar outcomes, but the
point estimates indicated that vedolizumab dominated
ustekinumab, with slightly better health outcomes (0.015
QALY gained, 95% CI - 0.430 to 0.527), slightly lower
cost (- €993.58, 95% CI - 7770.39 to 5711.26), and a
probability of being cost-effective of 61.2% compared with
ustekinumab.
3.3 Sensitivity Analyses
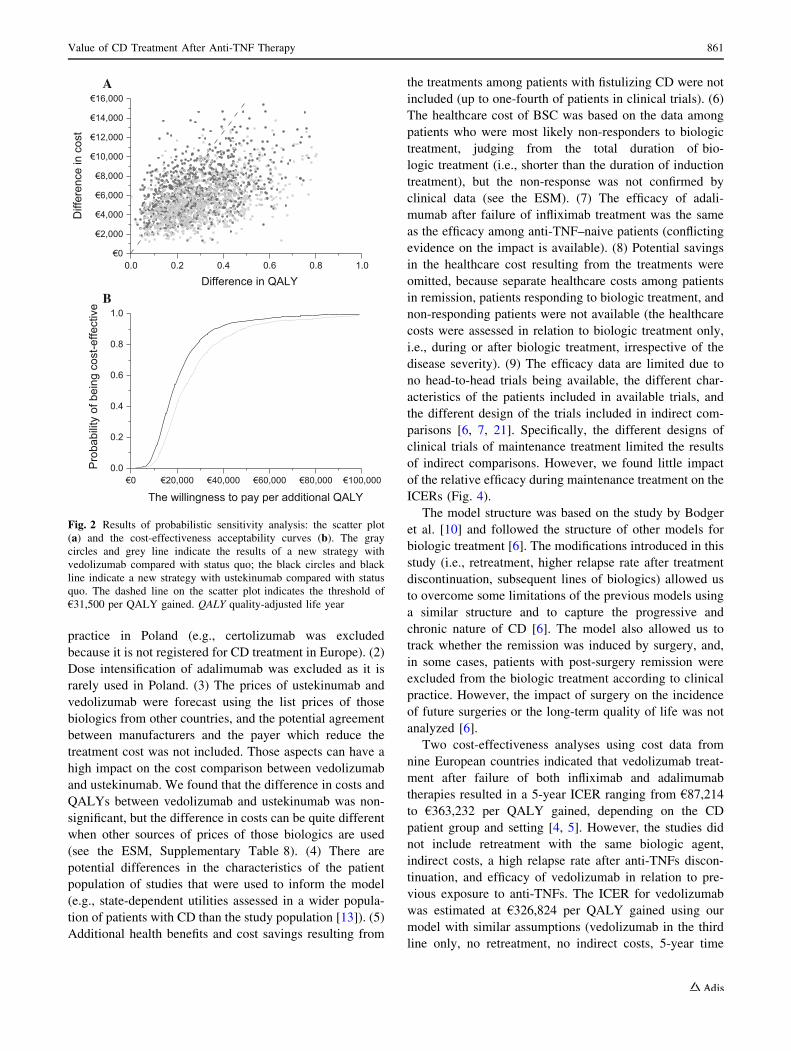
The value of vedolizumab and ustekinumab depended on
the share of anti-TNF that was replaced by those treatments
in the second line. The ICER increased when the larger
number of patients was treated with vedolizumab or
ustekinumab instead of the second-line anti-TNF (Fig. 3).
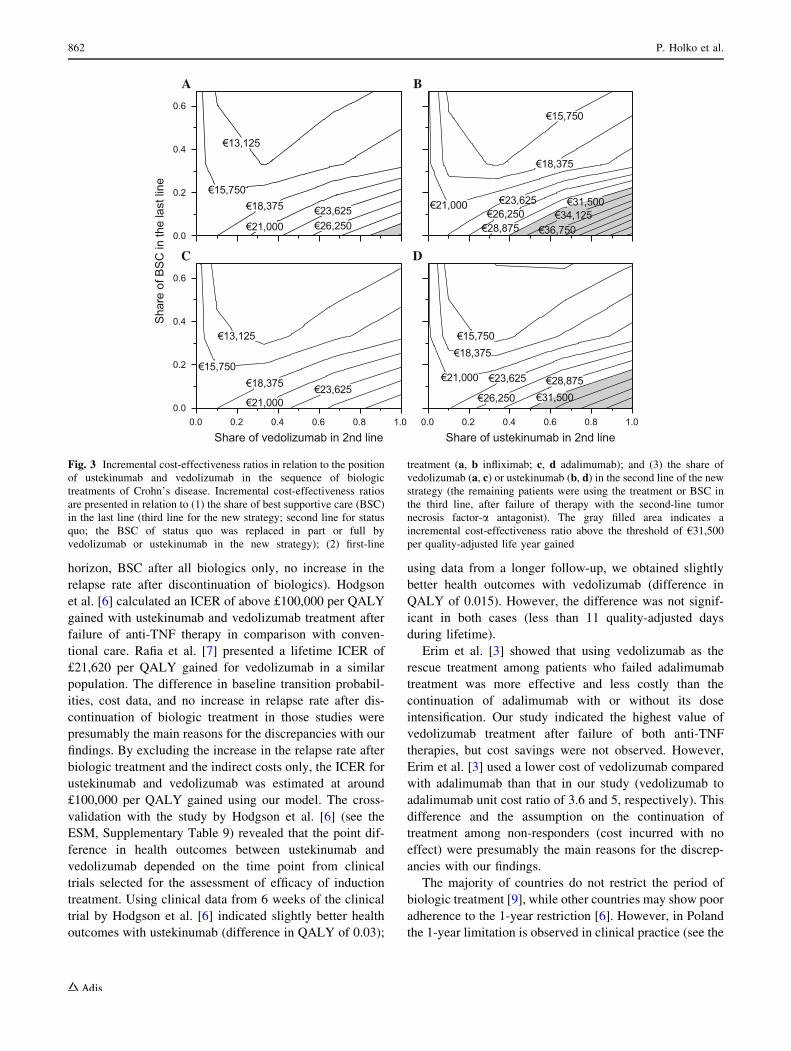
Both treatments had an ICER above the threshold if a
higher relapse rate after discontinuation of biologics or the
1-year limitation of treatment duration was excluded. The
strategy with vedolizumab or ustekinumab treatment was
cost-effective compared with status quo [in a time horizon
longer than 16.7 and 19.2 years, respectively (see the ESM,
Supplementary Figure 3)] and if the relapse rate after
Value of CD Treatment After Anti-TNF Therapy 859

discontinuation of biologics increased by at least 2.6- and
3.7-fold, respectively, compared with the prediction of the
baseline matrix. The exclusion of retreatment, BSC cost,
surgery cost, and change of the prices, healthcare costs,
utilities, indirect costs, or state-dependent mortality rates
resulted in a significant change of ICERs, but did not
change the conclusions (Fig. 4). The DSA of other
parameters did not cause a change of ICERs of more than
± 5%.
4 Discussion
The study suggests that CD treatment with ustekinumab
and vedolizumab after failure of therapy with anti-TNF is
cost-effective. The relapse rate after discontinuation of
biologic treatment and replacement of the second-line anti-
TNF (i.e., treatment of similar effectiveness but less costly)
were influential drivers of the cost-effectiveness. The
conclusion regarding the cost-effectiveness of vedolizumab
was more robust to the changes of its place in the sequence
than that of ustekinumab. This suggests that vedolizumab
should be used before ustekinumab in CD treatment.
However, the data on the efficacy of ustekinumab after
failure of vedolizumab therapy are not available [38].
Therefore, the hypothesis requires further research and was
not tested in our study. The high relapse rate after anti-TNF
discontinuation is well documented. It seems that a higher
relapse rate after elective discontinuation occurs mainly
during the first 6 months, and patients who discontinued
biologic treatment because of failure of therapy with anti-
TNFs have a higher relapse rate than those who discon-
tinued the treatment for other reasons [11, 12]. However,
long-term outcomes among patients who failed therapy
with anti-TNFs are lacking. The available data did not
exceed a period of around 100 months and considered only
relapse rates among patients who failed therapy with anti-
TNFs due to adverse events [12].
The choice of the time horizon highly influenced the
results. However, due to the chronic character of the dis-
ease and long-term effects of biologic treatment, using a
shorter time horizon than a lifetime will likely result in
biased estimates of ICERs [10].
The strengths of the study include patient-level data on
cost and utilities (a more accurate assessment of state-de-
pendent values than using aggregate data) and a positive
validation of the model predictions with real-world data of
1393 patients with CD from Poland. Even though we made
every effort to reflect treatment patterns in clinical practice,
it was necessary to make some assumptions. Those limi-
tations are as follows: (1) Infliximab and adalimumab were
considered as the only anti-TNFs, according to current
Table 2 Results of base-case analysis
Status quo New strategy with
vedolizumab
New strategy with
ustekinumab
Health outcomes
Life years 16.316 16.597 16.584
Life years with CD in remission 8.749 9.514 9.468
QALYs 13.258 13.623 13.608
Costs (economic perspective)
All biologic agents (NFZ); incl. ustekinumab or vedolizumab €14,744.17 €22,210.41; incl. €6784.85 €23,397.90; incl. €7901.22
Administration and diagnostic procedures during biologic treatment
(NFZ)
€3602.24 €4469.20 €4216.21
Healthcare after (i.e., ‘‘standard of care’’) and during biologic
treatment (NFZ)
€15,183.84 €18,645.69 €18,589.90
‘‘Best supportive care’’ (NFZ) €8002.52 €3419.03 €3472.63
All above healthcare costs (NFZ) €41,532.77 €48,744.34 €49,676.64
All healthcare costs (patients) €1415.94 €1430.05 €1429.06
Non-medical direct costs (patients) €3315.96 €3220.34 €3223.66
Indirect costs (society) €45,696.17 €44,166.35 €44,225.30
Total cost from the societal perspective €91,960.84 €97,561.08 €98,554.66
Cost-effectiveness
ICER vs. status quo (per QALY gained) Reference €15,369 €18,878
ICER, ascending (per QALY gained) Reference €15,369 Dominated
CD Crohn’s disease, ICER incremental cost-effectiveness ratio, incl. including, NFZ Narodowy Fundusz Zdrowia (Polish National Health Fund),
QALY quality-adjusted life year
860 P. Holko et al.
practice in Poland (e.g., certolizumab was excluded
because it is not registered for CD treatment in Europe). (2)
Dose intensification of adalimumab was excluded as it is
rarely used in Poland. (3) The prices of ustekinumab and
vedolizumab were forecast using the list prices of those
biologics from other countries, and the potential agreement
between manufacturers and the payer which reduce the
treatment cost was not included. Those aspects can have a
high impact on the cost comparison between vedolizumab
and ustekinumab. We found that the difference in costs and
QALYs between vedolizumab and ustekinumab was non-
significant, but the difference in costs can be quite different
when other sources of prices of those biologics are used
(see the ESM, Supplementary Table 8). (4) There are
potential differences in the characteristics of the patient
population of studies that were used to inform the model
(e.g., state-dependent utilities assessed in a wider popula-
tion of patients with CD than the study population [13]). (5)
Additional health benefits and cost savings resulting from
the treatments among patients with fistulizing CD were not
included (up to one-fourth of patients in clinical trials). (6)
The healthcare cost of BSC was based on the data among
patients who were most likely non-responders to biologic
treatment, judging from the total duration of bio-
logic treatment (i.e., shorter than the duration of induction
treatment), but the non-response was not confirmed by
clinical data (see the ESM). (7) The efficacy of adali-
mumab after failure of infliximab treatment was the same
as the efficacy among anti-TNF–naive patients (conflicting
evidence on the impact is available). (8) Potential savings
in the healthcare cost resulting from the treatments were
omitted, because separate healthcare costs among patients
in remission, patients responding to biologic treatment, and
non-responding patients were not available (the healthcare
costs were assessed in relation to biologic treatment only,
i.e., during or after biologic treatment, irrespective of the
disease severity). (9) The efficacy data are limited due to
no head-to-head trials being available, the different char-
acteristics of the patients included in available trials, and
the different design of the trials included in indirect com-
parisons [6, 7, 21]. Specifically, the different designs of
clinical trials of maintenance treatment limited the results
of indirect comparisons. However, we found little impact
of the relative efficacy during maintenance treatment on the
ICERs (Fig. 4).
The model structure was based on the study by Bodger
et al. [10] and followed the structure of other models for
biologic treatment [6]. The modifications introduced in this
study (i.e., retreatment, higher relapse rate after treatment
discontinuation, subsequent lines of biologics) allowed us
to overcome some limitations of the previous models using
a similar structure and to capture the progressive and
chronic nature of CD [6]. The model also allowed us to
track whether the remission was induced by surgery, and,
in some cases, patients with post-surgery remission were
excluded from the biologic treatment according to clinical
practice. However, the impact of surgery on the incidence
of future surgeries or the long-term quality of life was not
analyzed [6].
Two cost-effectiveness analyses using cost data from
nine European countries indicated that vedolizumab treat-
ment after failure of both infliximab and adalimumab
therapies resulted in a 5-year ICER ranging from €87,214
to €363,232 per QALY gained, depending on the CD
patient group and setting [4, 5]. However, the studies did
not include retreatment with the same biologic agent,
indirect costs, a high relapse rate after anti-TNFs discon-
tinuation, and efficacy of vedolizumab in relation to pre-
vious exposure to anti-TNFs. The ICER for vedolizumab
was estimated at €326,824 per QALY gained using our
model with similar assumptions (vedolizumab in the third
line only, no retreatment, no indirect costs, 5-year time
0.0 0.2 0.4 0.6 0.8 1.0
0.0
0.2
0.4
0.6
0.8
1.0
Diff
eren
ce in
cos
t
Difference in QALY
AP
roba
bilit
y of
bei
ng c
ost-e
ffect
ive
The willingness to pay per additional QALY
B
Fig. 2 Results of probabilistic sensitivity analysis: the scatter plot
(a) and the cost-effectiveness acceptability curves (b). The gray
circles and grey line indicate the results of a new strategy with
vedolizumab compared with status quo; the black circles and black
line indicate a new strategy with ustekinumab compared with status
quo. The dashed line on the scatter plot indicates the threshold of
€31,500 per QALY gained. QALY quality-adjusted life year
Value of CD Treatment After Anti-TNF Therapy 861
horizon, BSC after all biologics only, no increase in the
relapse rate after discontinuation of biologics). Hodgson
et al. [6] calculated an ICER of above £100,000 per QALY
gained with ustekinumab and vedolizumab treatment after
failure of anti-TNF therapy in comparison with conven-
tional care. Rafia et al. [7] presented a lifetime ICER of
£21,620 per QALY gained for vedolizumab in a similar
population. The difference in baseline transition probabil-
ities, cost data, and no increase in relapse rate after dis-
continuation of biologic treatment in those studies were
presumably the main reasons for the discrepancies with our
findings. By excluding the increase in the relapse rate after
biologic treatment and the indirect costs only, the ICER for
ustekinumab and vedolizumab was estimated at around
£100,000 per QALY gained using our model. The cross-
validation with the study by Hodgson et al. [6] (see the
ESM, Supplementary Table 9) revealed that the point dif-
ference in health outcomes between ustekinumab and
vedolizumab depended on the time point from clinical
trials selected for the assessment of efficacy of induction
treatment. Using clinical data from 6 weeks of the clinical
trial by Hodgson et al. [6] indicated slightly better health
outcomes with ustekinumab (difference in QALY of 0.03);
using data from a longer follow-up, we obtained slightly
better health outcomes with vedolizumab (difference in
QALY of 0.015). However, the difference was not signif-
icant in both cases (less than 11 quality-adjusted days
during lifetime).
Erim et al. [3] showed that using vedolizumab as the
rescue treatment among patients who failed adalimumab
treatment was more effective and less costly than the
continuation of adalimumab with or without its dose
intensification. Our study indicated the highest value of
vedolizumab treatment after failure of both anti-TNF
therapies, but cost savings were not observed. However,
Erim et al. [3] used a lower cost of vedolizumab compared
with adalimumab than that in our study (vedolizumab to
adalimumab unit cost ratio of 3.6 and 5, respectively). This
difference and the assumption on the continuation of
treatment among non-responders (cost incurred with no
effect) were presumably the main reasons for the discrep-
ancies with our findings.
The majority of countries do not restrict the period of
biologic treatment [9], while other countries may show poor
adherence to the 1-year restriction [6]. However, in Poland
the 1-year limitation is observed in clinical practice (see the
0.0
0.2
0.4
0.6
Sha
re o
f BS
C in
the
last
line
A B
0.0
0.2
0.4
0.6
Share of vedolizumab in 2nd line
C
0.0 0.2 0.4 0.6 0.8 1.0 0.0 0.2 0.4 0.6 0.8 1.0
Share of ustekinumab in 2nd line
D
Fig. 3 Incremental cost-effectiveness ratios in relation to the position
of ustekinumab and vedolizumab in the sequence of biologic
treatments of Crohn’s disease. Incremental cost-effectiveness ratios
are presented in relation to (1) the share of best supportive care (BSC)
in the last line (third line for the new strategy; second line for status
quo; the BSC of status quo was replaced in part or full by
vedolizumab or ustekinumab in the new strategy); (2) first-line
treatment (a, b infliximab; c, d adalimumab); and (3) the share of
vedolizumab (a, c) or ustekinumab (b, d) in the second line of the new
strategy (the remaining patients were using the treatment or BSC in
the third line, after failure of therapy with the second-line tumor
necrosis factor-a antagonist). The gray filled area indicates a
incremental cost-effectiveness ratio above the threshold of €31,500
per quality-adjusted life year gained
862 P. Holko et al.
ESM, Supplementary Figure 2). Therefore, the results of our
study cannot be completely generalized to all settings.
However, the ‘‘threshold prices’’ as a function of the
threshold and price of a well-known drug used in the similar
indication across markets as a reference were provided.
Nevertheless, our approach to enhance generalizability did
not consider all possible differences between settings. The
results were still not adjusted for the difference in medical
services valuation or treatment patterns. On the other hand,
the study provides implications for the future assessment of
biologics for the treatment of CD in any healthcare system.
First, it revealed that the exclusion of retreatment and
replacement of a second-line anti-TNF improves the ICERs
for vedolizumab and ustekinumab. Hence, any decision
regarding treatments among patients who fail therapy with
anti-TNF should consider other anti-TNF as an alternative
treatment. Secondly, long-term data on the health outcomes
and healthcare cost of BSC is essential to explicitly assess the
economic value of ustekinumab and vedolizumab in the
treatment of patients with CD after anti-TNF therapy failure.
5 Conclusions
CD treatment with ustekinumab or vedolizumab after
failure of anti-TNF therapy appears to be cost-effective at a
threshold of €31,500. The replacement of the second-line
anti-TNF with ustekinumab or vedolizumab and the course
of the disease after discontinuation of biologics are influ-
ential drivers of the cost-effectiveness.
Acknowledgements The authors thank the anonymous reviewers and
the editor, Christopher Carswell for their valuable comments.
Author Contributions PH: the concept and design of the study;
methodology; data management, acquisition, analysis, validation,
visualization, and interpretation; and manuscript drafting. PK: the
concept and design of the study; and validation and interpretation of
data. AP: the concept and design of the study, and project
administration.
Compliance with Ethical Standards
Conflict of Interest: Przemysław Holko, Paweł Kawalec, and
Andrzej Pilc declare no conflict of interest.
Funding and Roles No direct funding was provided for the work
performed. The research was undertaken as part of regular work at the
Institute of Public Health. The research is part of the doctoral dis-
sertation of P.H. The study was initiated by the researchers included
as authors. No other persons had any influence on the work
performed.
Data Availability Statement All input data of the model are pre-
sented in the manuscript or the supplementary file. The model is
available from the corresponding author upon reasonable request.
Open Access This article is distributed under the terms of the
Creative Commons Attribution-NonCommercial 4.0 International
License (http://creativecommons.org/licenses/by-nc/4.0/), which
Effect during maintenance excludedIndirect costs, 95% CIs
Paid work-related indirect cost excludedAbsenteeism included only
Baseline matrix of transition probabilities from Odes et al.Discontinuation due to adverse events (extreme scenarios)
Indirect costs excludedNo discounting
No mild CD among responders without remissionPublished source of utilities (extreme scenarios)
Healthcare costs, NFZ (extreme scenarios)No retreatment
State-dependent mortality (excluded vs. from Odes et al.)No surgery and BSC costs
Price +/- 50%Unlimited treatment duration (no 1-year restriction)
No increase in relapse rate after discontinuationTime horizon: 5 years
ICER (ustekinumab) ICER (vedolizumab)
Fig. 4 Tornado diagram for deterministic sensitivity analyses. The
dashed line indicates the threshold of €31,500 per quality-adjusted life
year gained. BCS best supportive care (intensified standard of care
that included standard treatments and surgery), CD Crohn’s disease,
CI confidence interval, ICER incremental cost-effectiveness ratio,
NFZ Narodowy Fundusz Zdrowia (Polish National Health Fund)
Value of CD Treatment After Anti-TNF Therapy 863
permits any noncommercial use, distribution, and reproduction in any
medium, provided you give appropriate credit to the original
author(s) and the source, provide a link to the Creative Commons
license, and indicate if changes were made.
References
1. de Souza HS, Fiocchi C. Immunopathogenesis of IBD: current
state of the art. Nat Rev Gastroenterol Hepatol. 2016;13:13–27.
2. Chan HC, Ng SC. Emerging biologics in inflammatory bowel
disease. J Gastroenterol. 2017;52(2):141–50.
3. Erim DO, Mahendraratnam N, Okafor PN, Wheeler SB. The
value of vedolizumab as rescue therapy in moderate-severe
Crohn’s disease patients with adalimumab non-response in the
USA. J Crohns Colitis. 2015;9(8):669–75.
4. Rencz F, Gulacsi L, Pentek M, et al. Cost-utility of biological
treatment sequences for luminal Crohn’s disease in Europe.
Expert Rev Pharmacoecon Outcomes Res. 2017;17(6):597–606.
5. Baji P, Gulacsi L, Pentek M, et al. Cost-effectiveness of bio-
logical treatment sequences for fistulising Crohn’s disease across
Europe. United Eur Gastroenterol J. 2018;6(2):310–21.
6. Hodgson R, Walton M, Biswas M, et al. Ustekinumab for treating
moderately to severely active Crohn’s disease after prior therapy:
an evidence review group perspective of a NICE Single Tech-
nology Appraisal. Pharmacoeconomics. 2018;36(4):387–98.
7. Rafia R, Scope A, Harnan S, et al. Vedolizumab for treating
moderately to severely active Crohn’s disease after prior therapy:
an evidence review group perspective of a NICE Single Tech-
nology Appraisal. Pharmacoeconomics. 2016;34(12):1241–53.
8. Mocko P, Kawalec P, Smela-Lipinska B, Pilc A. Effectiveness
and safety of vedolizumab for treatment of Crohn’s disease: a
systematic review and meta-analysis. Arch Med Sci.
2016;12(5):1088–96.
9. Pentek M, Lakatos PL, Oorsprong T, et al. Access to biologicals
in Crohn’s disease in ten European countries. World J Gas-
troenterol. 2017;23(34):6294–305.
10. Bodger K, Kikuchi T, Hughes D. Cost-effectiveness of biological
therapy for Crohn’s disease: Markov cohort analyses incorpo-
rating United Kingdom patient-level cost data. Aliment Phar-
macol Ther. 2009;30(3):265–74.
11. Gisbert JP, Marın AC, Chaparro M. Systematic review: factors
associated with relapse of inflammatory bowel disease after dis-
continuation of anti-TNF therapy. Aliment Pharmacol Ther.
2015;42(4):391–405.
12. Casanova MJ, Chaparro M, Garcıa-Sanchez V, et al. Evolution
after anti-TNF discontinuation in patients with inflammatory
bowel disease: a multicenter long-term follow-up study. Am J
Gastroenterol. 2017;112(1):120–31.
13. Holko P, Kawalec P, Mossakowska M, Pilc A. Health-related
quality of life impairment and indirect cost of Crohn’s disease: a
self-report study in Poland. PLoS One. 2016;11(12):e0168586.
14. Jonsson B Ten. Arguments for a societal perspective in the
economic evaluation of medical innovations. Eur J Health Econ.
2009;10:357–9.
15. Marchetti M, Liberato NL. Biological therapies in Crohn’s dis-
ease: are they cost-effective? A critical appraisal of model-based
analyses. Expert Rev Pharmacoecon Outcomes Res.
2014;14:815–24.
16. European Medicines Agency. Summary of Product Characteris-
tics: Entyvio, Stelara, Remicade, Remsima, Inflectra, Humira.
www.ema.europa.eu. Accessed 19 Dec 2017.
17. Holko P, Kawalec P, Stawowczyk E. Prevalence and drug
treatment practices of inflammatory bowel diseases in Poland in
the years 2012–2014: an analysis of nationwide databases. Eur J
Gastroenterol Hepatol. 2018;30(4):456–64.
18. The Agency for Health Technology Assessment and Tariff Sys-
tem. Health technology assessment guidelines. Version 3.0.
www.aotm.gov.pl. Accessed 19 Dec 2017.
19. Hanauer SB, Feagan BG, Lichtenstein GR, et al. Maintenance
infliximab for Crohn’s disease: the ACCENT I randomised trial.
Lancet. 2002;359(9317):1541–9.
20. Targan SR, Hanauer SB, van Deventer SJ, et al. A short-term
study of chimeric monoclonal antibody cA2 to tumor necrosis
factor alpha for Crohn’s disease. Crohn’s Disease cA2 Study
Group. N Engl J Med. 1997;337(15):1029–35.
21. Hazlewood GS, Rezaie A, Borman M, et al. Comparative
effectiveness of immunosuppressants and biologics for inducing
and maintaining remission in Crohn’s disease: a network meta-
analysis. Gastroenterology. 2015;148(2):344–54.
22. Sands BE, Feagan BG, Rutgeerts P, et al. Effects of vedolizumab
induction therapy for patients with Crohn’s disease in whom
tumor necrosis factor antagonist treatment failed. Gastroenterol-
ogy. 2014;147(3):618–27.
23. Feagan BG, Sandborn WJ, Gasink C, et al. Ustekinumab as
induction and maintenance therapy for Crohn’s disease. N Engl J
Med. 2016;375(20):1946–60.
24. Sandborn WJ, Gasink C, Gao LL, et al. Ustekinumab induction
and maintenance therapy in refractory Crohn’s disease. N Engl J
Med. 2012;367(16):1519–28.
25. Sands BE, Sandborn WJ, Van Assche G, Lukas M, Xu J, James
A, Abhyankar B, Lasch K. Vedolizumab as induction and
maintenance therapy for Crohn’s disease in patients naıve to or
who have failed tumor necrosis factor antagonist therapy.
Inflamm Bowel Dis. 2017;23(1):97–106.
26. Sands BE, Anderson FH, Bernstein CN, et al. Infliximab main-
tenance therapy for fistulizing Crohn’s disease. N Engl J Med.
2004;350(9):876–85.
27. Rutgeerts P, D’Haens G, Targan S, et al. Efficacy and safety of
retreatment with anti-tumor necrosis factor antibody (infliximab)
to maintain remission in Crohn’s disease. Gastroenterology.
1999;117(4):761–9.
28. Present DH, Rutgeerts P, Targan S, et al. Infliximab for the
treatment of fistulas in patients with Crohn’s disease. N Engl J
Med. 1999;340(18):1398–405.
29. Hanauer SB, Sandborn WJ, Rutgeerts P, et al. Human anti-tumor
necrosis factor monoclonal antibody (adalimumab) in Crohn’s
disease: the CLASSIC-I trial. Gastroenterology.
2006;130:323–33.
30. Sandborn WJ, Rutgeerts P, Enns R, et al. Adalimumab induction
therapy for Crohn disease previously treated with infliximab: a
randomized trial. Ann Intern Med. 2007;146:829–38.
31. Golicki D, Niewada M. General population reference values for
3-level EQ-5D (EQ-5D-3L) questionnaire in Poland. Pol Arch
Med Wewn. 2015;125(1–2):18–26.
32. Be Trade, spol. Ltd. LIEKinfo. www.liekinfo.sk. Accessed 28
Oct 2017.
33. Narodowy Fundusz Zdrowia. Announcement from the Depart-
ment of Medicinal Products, 27 September 2017. www.nfz.gov.
pl. Accessed 19 Dec 2017.
34. Silverstein MD, Loftus EV, Sandborn WJ, Tremaine WJ, Feagan
BG, Nietert PJ, Harmsen WS, Zinsmeister AR. Clinical course
and costs of care for Crohn’s disease: Markov model analysis of a
population-based cohort. Gastroenterology. 1999;117(1):49–57.
35. Dretzke J, Edlin R, Round J, et al. A systematic review and
economic evaluation of the use of tumour necrosis factor-alpha
(TNF-a) inhibitors, adalimumab and infliximab, for Crohn’s
disease. Health Technol Assess. 2011;15(6).
36. Central Statistical Office of Poland. Life table, 2016. stat.gov.pl.
Accessed 19 Dec 2017.
864 P. Holko et al.
37. Odes S, Vardi H, Friger M, et al. Clinical and economic outcomes
in a population-based European cohort of 948 ulcerative colitis
and Crohn’s disease patients by Markov analysis. Aliment
Pharmacol Ther. 2010;31(7):735–44.
38. Kawalec P, Mocko P, Malinowska-Lipien I, Brzostek T. Efficacy
and safety of ustekinumab in the induction therapy of TNF-a-
refractory Crohn’s disease patients: a systematic review and
meta-analysis. J Comp Eff Res. 2017;6(7):601–12.
39. Holko P, Kawalec P, Mossakowska M. Quality of life related to
oral, subcutaneous, and intravenous biologic treatment of
inflammatory bowel disease: a time trade-off study. Eur J Gas-
troenterol Hepatol. 2018;30(2):174–80.
40. Central Statistical Office of Poland. Statistical Bulletins. www.-
stat.gov.pl. Accessed 19 Dec 2017.
41. Narodowy Bank Polski (Central Bank of Poland). Weighted average
rates of foreign currencies in PLN. nbp.pl. Accessed Dec 19, 2017.
42. Holko P. Comment on: ‘‘Forecasting pharmaceutical prices for
economic evaluations when there is no market: a review’’.
PharmacoEconomics Open. 2017;1(1):69–70.
43. Husereau D, Drummond M, Petrou S, et al. Consolidated Health
Economic Evaluation Reporting Standards (CHEERS)–explana-
tion and elaboration: a report of the ISPOR Health Economic
Evaluation Publication Guidelines Good Reporting Practices
Task Force. Value Health. 2013;16(2):231–50.
Value of CD Treatment After Anti-TNF Therapy 865


![Title: Clinical effectiveness and safety of vedolizumab ......Ananthakrishnan 2017, Adams 2013, Choi 2017]. Many patients require frequent hospitalizations, enteral nutrition, and](https://img.dokumen.tips/doc/110x75/61315c1b1ecc51586944afbf/title-clinical-effectiveness-and-safety-of-vedolizumab-ananthakrishnan.jpg)