Embed Size (px)
Citation preview

www.TheCIE.com.au
Cost Effectiveness Analysis — 2010 Sydney Metropolitan Water Plan
Prepared for NSW Office of Water
Centre for International Economics Canberra & Sydney
April 2010

www.TheCIE.com.au
The Centre for International Economics is a private economic research agency that
provides professional, independent and timely analysis of international and domestic
events and policies.
TheCIE’s professional staff arrange, undertake and publish commissioned economic
research and analysis for industry, corporations, governments, international agencies
and individuals.
© Centre for International Economics 2010
This work is copyright. Persons wishing to reproduce this material should contact
the Centre for International Economics at one of the following addresses.
Canberra
Centre for International Economics
Ian Potter House, Cnr Marcus Clarke Street & Edinburgh Avenue
Canberra ACT 2601
GPO Box 2203
Canberra ACT Australia 2601
Telephone +61 2 6245 7800
Facsimile +61 2 6245 7888
Email [email protected]
Website www.TheCIE.com.au
Sydney
Centre for International Economics
Suite 2, Level 16, 1 York Street
Sydney NSW 2000
GPO Box 397
Sydney NSW Australia 2001
Telephone +61 2 9250 0800
Facsimile +61 2 9250 0888
Email [email protected]
Website www.TheCIE.com.au
Disclaimer
While TheCIE endeavours to provide reliable analysis and believes the material it
presents is accurate, it will not be liable for any party acting on such information.

FINAL DRAFT — COST EFFECTIVENESS ANALYSIS — 2010 SYDNEY METROPOLITAN WATER PLAN 3
www.TheCIE.com.au
Contents
1 Introduction 6
Overview of the Metropolitan Water Plan 6
This project 7
2 The water supply system and future pressures 9
Existing commitments – the ‘base case’ 9
Future pressures 10
Pressure points 13
3 Additional measures to achieve objectives 15
Overview 15
Desalination plant 16
Shoalhaven transfer scheme 18
Changes to drought water restrictions regime 19
Measures to respond to extreme drought 20
Additional demand management or recycling activities 20
4 The approach 22
The analytical framework 22
Incorporating environmental and social impacts 23
Decision rule 24
The security criterion 25
The reliability criterion 26
Portfolio analysis 26
Portfolio ranking 27
The WATHNET model 28
5 Portfolio impacts and portfolio costs 29
Summary of portfolios analysed 29
Portfolio impacts 31
Cost information of the base case compared with various new portfolios 38
6 Ranking of portfolios 40
Overview of ranking approach 40
Step 1 Excluding portfolios based on security criterion 40
Step 2 Comparing portfolios that meet security criterion 41
7 Environmental and social impacts 43

4 FINAL DRAFT — COST EFFECTIVENESS ANALYSIS — 2010 SYDNEY METROPOLITAN WATER PLAN
www.TheCIE.com.au
Overview of approach to incorporating environmental and social impacts 43
Expert Environmental Panel assessment 44
Expert Social Panel assessment 47
Impact of findings of environmental and social panels on portfolio rankings 49
8 Conclusions 51
APPENDIXES 51
A Existing commitments 51
B Sydney Water’s approach to forecasting future water demand 51
Population forecast 51
Water conservation 51
C The impact of the key infrastructure decisions 51
Impact of upscaling the desalination plant 51
Impact of the Shoalhaven augmentation 51
D Cost elements 51
Overview of the cost items 51
Costs of Shoalhaven Transfer Scheme 51
Costs of desalination facilities 51
Cost of supply shortfalls 51
Groundwater pumping costs 51
Other factors 51
E Cost of Restrictions 51
F Sensitivity analysis 51
References 51
Boxes, charts and tables
2.1 Rainfall and inflows to Sydney’s dams from 1909 to 2009 11
2.2 Future demand forecasts, 2010 to 2050 12
3.1 Options included in the portfolio analysis 16
5.1 Summary of modelling portfolios 30
5.2 Security outcomes – Probability and minimum storage levels 31
5.3 Reliability outcomes - average time in restrictions 31
5.4 Security outcomes – Probability and minimum storage levels 32
5.5 Reliability outcomes - Average time in restrictions 33
5.6 Security outcomes – Pr<10 per cent and minimum storage levels 34
5.7 Reliability outcomes - Average time in restrictions 34
5.8 Security outcomes – Pr<10 per cent and minimum storage levels 35
5.9 Reliability outcomes - Average time in restrictions 36

FINAL DRAFT — COST EFFECTIVENESS ANALYSIS — 2010 SYDNEY METROPOLITAN WATER PLAN 5
www.TheCIE.com.au
5.10 Security outcomes – Pr<10 per cent and minimum storage levels 37
5.11 Reliability outcomes - Average time in restrictions 38
5.12 Probability weighted net present value of alternative portfolios up to 2050 (2009/10 dollars) 39
6.1 Probability weighted NPV of costs to 2050 and security outcomes to 2030 41
6.2 Rankings of portfolios — all scenarios 41
7.1 Criteria and weighting adopted 45
7.2 Assessment of portfolios by Environmental Expert Panel 46
7.3 Community Planning Principles 48
7.4 Summary of ESP findings 49
B.1 Savings from water conservation programs, 2030 and 2050, GL 51
C.1 Probability of storage levels <10 per cent under various desalination scenarios vs. base case 51
E.1 Elements of the cost of water restrictions 51
E.2 Impact of restrictions through demand 51
E.3 Cost of restrictions to consumers 51
E.4 Changes in producer surplus from restrictions 51
F.1 Baseline Portfolio Ranking — 7 per cent discount rate 51
F.2 5 per cent discount rate 51
F.3 10 per cent discount rate 51
F.4 Desalination first stage — per cent of time operating2010-50 51
F.5 Average time in restrictions2010-50 51
F.6 Net Present Value of Costs to 2050 — 20 per reduction in inflows into Warragamba Dam 51
F.7 Portfolio Ranking — reduction in inflows into Warragamba dam 51
F.8 Security outcomes — minimum storage levels up to 2020 51
F.9 Extreme security outcome2010 to 2020 51
F.10 Net Present Value of Costs to 2050 — no costs to consumers associated with level 1 restrictions 51
F.11 Portfolio Ranking — no cost to consumers of level 1 restrictions 51
F.12 Net Present Value of Costs to 2050 — 20 per reduction in the cost of CO2 emissions 51
F.13 Security outcomes — Pr<10% and minimum storage levels 51
F.14 Average time in restrictions 51
F.15 Costs, net present value up to 2050 51

6 FINAL DRAFT — COST EFFECTIVENESS ANALYSIS — 2010 SYDNEY METROPOLITAN WATER PLAN
www.TheCIE.com.au
1 Introduction
Until the summer of 2009-10, greater Sydney’s raw water supply was largely reliant
on its 11 major dams, one of the largest per capita storages in the world,
supplemented by significant water recycling and efficiency programs. In
January 2010, the existing supply system was boosted when Sydney’s desalination
plant began operating.
Rainfall over the catchments for Sydney’s dams is highly variable and the future
impact of climate change on the inflows to these dams is uncertain. Further, with
future population growth, demand is expected to rise. Therefore, even with the
operation of the desalination plant, a detailed and flexible strategy is required to
manage Sydney’s water supply needs in the context of highly variable inflows,
increasing population, and the uncertainties regarding future climatic patterns.
Overview of the Metropolitan Water Plan
The first Metropolitan Water Plan (the Plan) was introduced in 2004. The Plan sets out
the course of action for the NSW Government to ensure a sustainable and secure
water system for the greater Sydney’s people and rivers. A range of water demand
and supply measures was announced in the 2004 Plan to meet this objective. These
measures addressed both growth and security needs in the face of a worsening
drought at the time. The measures were selected for their cost-effectiveness, or
because they offered potential diversification benefits.
Subsequently, the NSW Government reviewed the 2004 Plan and released an
updated plan in 2006. The 2006 Plan’s objective was to devise a set of measures that
reflected the NSW Government's longer-term plan to secure Sydney's water supply,
and responded to the deepening drought. The Plan ensures that through a mix of
measures, Sydney, Illawarra, Shoalhaven, Southern Highlands and the Blue
Mountains will have enough water to meet the region’s growth needs to 2015 and to
secure drought needs to 2015 and beyond. These measures included increased water
recycling and efficiency, and developing the capacity to access deep water in the
water supply storages, deploy desalination and groundwater in a timely manner.
The 2006 Plan incorporates an adaptive management approach, which recommends
regular reviews to take account of new information and emerging technologies.
Specifically, the NSW Government made a commitment to review the Plan every
four years. The next water plan is due in 2010.

FINAL DRAFT — COST EFFECTIVENESS ANALYSIS — 2010 SYDNEY METROPOLITAN WATER PLAN 7
www.TheCIE.com.au
Against this backdrop, the NSW Government is reviewing the 2006 Plan to ensure
that greater Sydney has a secure water supply beyond 2015. The review is being led
by the NSW Office of Water (NOW) in collaboration with key government agencies
and will lead to the release of the updated plan in 2010.
The context for the next Plan is different to the 2006 Plan where the immediate water
security issues were at the forefront of decision making. The development of the 2010
Plan will need to consider options for ensuring Sydney has a secure and reliable
supply of water beyond 2015 that meets the demands of population growth,
addresses possible prolonged droughts, and provides environmental flows for river
health.
This project
The purpose of this project was to analyse the cost associated with a range of
different options and their ability to ensure Sydney’s future water needs are met.
This project involved developing a detailed economic model to incorporate the
different costs, taking account of the detailed hydrological characteristics of the
drinking water catchments for Sydney. The model was used to compare different
packages of existing, new, or modified water supply and demand measures based on
their costs and benefits.
The analysis was undertaken using a framework developed by TheCIE as part of a
separate process undertaken for the former Department of Water and Energy and
completed in February 2009. The framework is explained in detail in TheCIE’s report
‘Review of the 2006 Metropolitan Water Plan — Analytical Framework’.
The costs included in this analysis primarily focus on the financial and economic
costs, although it also includes the social costs of restrictions. Most environmental
and social impacts of the portfolios considered as part of this project were assessed
separately by panels of environmental and social experts (convened by NOW). The
findings of these panels were combined with the cost-effectiveness analysis help
derive a range of possible preferred portfolios.
As part of the project process TheCIE was required to:
� prepare an Excel model to be provided to NOW upon finalising the project. This
will ensure transparency in the assumptions underpinning the analysis and will
allow the model to be used for further analysis if required; and
� prepare a report outlining the analysis undertaken and the conclusions reached
from the analysis.

8 FINAL DRAFT — COST EFFECTIVENESS ANALYSIS — 2010 SYDNEY METROPOLITAN WATER PLAN
www.TheCIE.com.au
Stakeholder consultation
As part of this study, TheCIE has sought input from key stakeholders within
Government and the Metropolitan Water Independent Review Panel (which reports
to the NSW Premier). TheCIE held numerous discussions with these stakeholders
and presented preliminary findings of the analysis along the way.
FINAL DRAFT — COST EFFECTIVENESS ANALYSIS — 2010 SYDNEY METROPOLITAN WATER PLAN 9
www.TheCIE.com.au
2 The water supply system and future pressures
The need for additional investments in the water supply system will depend on the
performance of the existing range of measures under current as well as future
conditions. Additional options may need to be considered where the ‘pressure
points’ become critical. The range of potential options available is discussed in the
next chapter.
This chapter:
� outlines existing Government commitments that make up the base case;
� discusses some key factors likely to impact on the need for new investments and
the points in time where these pressures are likely to emerge; and
� summarises the performance of existing measures in the short, medium and
longer term.
Existing commitments – the ‘base case’
There is a wide range of measures the Government has in place, reflecting past
commitments including those made under the 2006 Plan. These include the
longstanding assets such as the various dams supplying Sydney, and the recently
constructed desalination plant. It also includes water supply sources that have not
previously been triggered such as the borefields. They also include the substantial
water efficiency and recycled water programs and targets that have been committed
into the future.
The existing commitments include environmental flow regimes that are currently in
place at the dams, water transfers, from the Shoalhaven system, and drought water
restrictions.
All drought restrictions were lifted in mid 2009. Permanent water saving measures
(Water Wise Rules) are in place and assumed to be achieving a 3 per cent reduction.
For the purposes of modelling we refer to the current commitments as the ‘base case’,
which reflect the operation of the water supply system under all existing
Government commitments.
10 FINAL DRAFT — COST EFFECTIVENESS ANALYSIS — 2010 SYDNEY METROPOLITAN WATER PLAN
www.TheCIE.com.au
Appendix A provides further details of the existing commitments that are assumed
in the modelling.
Future pressures
The key issues likely to influence the decisions on new investments in the water
supply system include future climatic conditions and expected changes in the
demand for water as population rises. It is the combined effect of both these impacts
that is important – for example, the impact of a drought at higher population levels is
likely to be more severe than if it occurred today.
Uncertain climatic conditions
The nature of the water supply system that has been built for Sydney over the past
100 years reflects the characteristics of the inflow patterns into the main storages.
Sydney and its catchment area are subject to infrequent but severe droughts. Over
the last 120 years, the greater Sydney region has had three severe droughts: in the
1890s, the 1930-40s, and the recent drought. Because of this, Sydney has much larger
water storages than most other cities in the world.
The variable nature of rainfall patterns in Sydney is reflected in the inflows to
Sydney’s dams (chart 2.1). From 1909 to 1948, inflows into dams were relatively low.
However, from 1948 to the early 1990s there were substantially higher inflows into
dams compared with the preceding 50 years. However, even during this time the
rainfall pattern was highly variable with some years experiencing low rainfall similar
to the earlier part of the century. Since the early 1990s, the rainfall pattern appears to
have changed and is following a similar pattern to the early part of last century.

FINAL DRAFT — COST EFFECTIVENESS ANALYSIS — 2010 SYDNEY METROPOLITAN WATER PLAN 11
www.TheCIE.com.au
2.1 Rainfall and inflows to Sydney’s dams from 1909 to 2009
Total Annual Catchment Inflow to SCA's Hawkesbury-Nepean Dams
and Rainfall at Yerranderie
951 GL
2,153 GL
605 GL
789mm 958mm732mm
0
1,000
2,000
3,000
4,000
5,000
6,000
7,000
8,000
9,000
10,000
1909
1912
1915
1918
1921
1924
1927
1930
1933
1936
1939
1942
1945
1948
1951
1954
1957
1960
1963
1966
1969
1972
1975
1978
1981
1984
1987
1990
1993
1996
1999
2002
2005
2008
Inflow (GL)
0
500
1,000
1,500
2,000
2,500
3,000
3,500
4,000
4,500
5,000
Rainfall (mm/year)
Additional water from Shoalhaven Transfers (Total for Period in GL)
563055 Yerranderie (Warragamba catchment)
Total Annual Inflow to Warragamba, Wingecarribee, Nepean, Avon, Cordeaux and Cataract Dams
Average for Specified Periods (1909-48, 1949-90, 1991-2009)
7 Year Moving Average (Inflow)
7 Year Moving Average (Rainfall)
Note: Graph does not include
inflows to Woronora Dam and
Shoalhaven transfersAs at 31 Dec 2009
842 GL
2003-09
141 GL
1994-95
431 GL
1980-84
Data source: Sydney Catchment Authority.
The hydrology of the catchments is also highly variable. While there have been long
periods of low inflows, there have also been numerous significant inflow events that
can fill the storages quickly, even when storages are low. This highlights the
importance of the adaptive management approach. Clearly, there are benefits from
having strategies that can defer a decision to make a large infrastructure investment
by providing more time to capture large inflow events in existing dams.
These uncertainties are inherent in the planning of any water supply system which is
beholden to natural events, and the challenge for policy makers is planning
effectively to achieve a secure supply cost effectively.
For the longer term future, there is significant uncertainty regarding the climatic state
that the drinking water catchments might face. These uncertainties are brought into
greater focus in the face of climate change impacts. While the climate change research
is still emerging, it appears that the future climate is projected to be more volatile.
This and future Plans will need to acknowledge the changing environment and
consider how to take account of such impacts.
This requires an understanding of the range of potential climate events that can
occur. Typically this has involved using hydrology models that simulate a wide
range of possible futures, using historical inflow data and synthetically replicating
other possible future inflow scenarios.
Planning for variable rainfall in the short and the longer term is a continuing theme
of the Plan. Given the uncertainties of climate change it will be important to
understand options that can respond to lower or higher inflows compared with those

12 FINAL DRAFT — COST EFFECTIVENESS ANALYSIS — 2010 SYDNEY METROPOLITAN WATER PLAN
www.TheCIE.com.au
that have been experienced over the past 100 years and to have systems that are
robust to climate change.
Increasing future demand
A key factor likely to place pressure on the existing supply system is the projected
demand for water into the future. Demand projections are influenced by the forecast
population growth over the next 30 to 40 years as well as by changes in the estimated
savings from efficiency and recycling programs.
The projected demand for water over the next 40 years is presented in chart 2.2. The
projections include savings from the suite of efficiency initiatives (including leak-
reduction, residential, non-residential and regulatory initiatives) and water recycling
measures already committed to under the current Plan. The chart presents three
different scenarios of demand forecast based on population growth and demand
savings projections forecast from efficiency programs. Where higher savings from
these programs are assumed, this results in a lower demand projection into the
future. The scenarios are:
� median population projection with assumed low level of savings;
� median population projection with assumed median level of savings; and
� high population projection with assumed low level of savings.
2.2 Future demand forecasts, 2010 to 2050
400,000
450,000
500,000
550,000
600,000
650,000
700,000
750,000
800,000
2010 2015 2020 2025 2030 2035 2040 2045 2050
ML/a
MidPop - LowSav HPop-LSav MPop-Msav
Data source: Sydney Water Corporation.

FINAL DRAFT — COST EFFECTIVENESS ANALYSIS — 2010 SYDNEY METROPOLITAN WATER PLAN 13
www.TheCIE.com.au
Sydney Water’s approach to projecting future demand is presented in Appendix B.
Warragamba environmental flows
The 2006 Metropolitan Water Plan stated that ‘A final regime of environmental flow
releases from Warragamba Dam will not be formally set until 2015, but increases to
interim environmental flows will be considered for the period starting 2009,
provided sufficient water is available’.
The analysis in this report assumed a 95/20 environmental flow regime for
Warragamba Dam to enable planning to cover the period beyond 2018, which is the
time when it is considered these flows, could begin, if approved by the Government.
This regime is based on the recommendations of the Hawkesbury-Nepean River
Management Forum recommendations of 2004.
The introduction of an environmental flow regime of 95/20 would significantly
reduce the amount of water that can be drawn from Warragamba Dam for drinking.
A key issue for this and future Plans is to consider how significantly the proposed
regime influences the water supply availability.
Pressure points
Assuming there are no supply or demand measures introduced beyond existing
commitments, rising demand levels, together with environmental flows at
Warragamba Dam from 2018, will impact on long-term water supply availability.
As demand increases it is expected to place pressure on the existing system in a
number of ways. In particular, it is expected that dam levels will drop more
frequently requiring transfers from the Shoalhaven system, the operation of Stage 1
of the Kurnell desalination plant, and implementing drought water restrictions.
The discussion below provides an overview of some of the key pressure points at
which additional measures may be required. In order to examine the likely pressure
points we used a hydrology model.1
Short term (2010 to 2020)
The modelling undertaken for this project indicates that the existing portfolio of
options will ensure that, if there are five years of low inflow equivalent to the 2001-
2007 drought, the city would not run out of water.2 It will also provide security to
1 The SCA’s WATHNET hydrology model is explained further in chapter 4.
2 It is important to note that the modeling undertaken by the SCA for this report is different to the ‘yield’ modeling that the SCA regularly undertakes.

14 FINAL DRAFT — COST EFFECTIVENESS ANALYSIS — 2010 SYDNEY METROPOLITAN WATER PLAN
www.TheCIE.com.au
2020 for worse droughts than those experienced over the last 100 years. This is based
on the existing portfolio of Government commitments under the Plan, including the
environmental flows from the upper Nepean water storages. For planning purposes,
modelling included the 250 megalitre per day desalination plant triggered when dam
levels drop below 70 per cent of total capacity and ceasing operations when dam
levels return to 80 per cent of total capacity.
Therefore, while supplies are considered secure over the next 10 years, it is important
to monitor storage levels and trends in demand, and to have in place contingency
measures available
Medium term (2020 to 2030)
Key factors to be considered in the medium term are the planned introduction of the
revised environmental flows regime for Warragamba Dam and increasing demand.
Assuming median demand projections, between 2020 and 2030 demand is forecast to
increase by approximately 8 per cent or 50 GL. A 95/20 Warragamba environmental
flow would significantly increase environmental flows from Warragamba Dam.
In the absence of further measures the combined effect of the Warragamba
environmental flows regime with increases in demand for water would reduce the
reliability of the system (ie increase the time spent in drought restrictions) and reduce
the security of the system (ie increase the likelihood that storages will drop to low
levels in an extreme drought).
Longer term pressure points (2030 to 2050)
As discussed, further pressure on the system will occur as population grows,
resulting in an increase demand for water, even with existing and planned measures
to control demand.
Beyond 2030, the security and reliability impacts of increasing demand would be
significant in the absence of additional measures to those identified already. In rare
and extreme droughts there would be an increasing probability that the existing
measures that have been modelled are not sufficient to stop Sydney from running
out of water from the 2030 to 2050 period. The average time in restrictions would also
increase significantly to the point where it would be several times the current setting
of 3 per cent of the time.
FINAL DRAFT — COST EFFECTIVENESS ANALYSIS — 2010 SYDNEY METROPOLITAN WATER PLAN 15
www.TheCIE.com.au
3 Additional measures to achieve objectives
This chapter discusses some of the specific options beyond the current mix of
measures that could be employed to secure greater Sydney’s water supply in the
short to medium term as demand grows.
Overview
The Government has a range of tools to secure Sydney’s water supply and to prepare
for severe droughts that may occur into the future. Key measures available include:
� providing additional investments to increase supply or reduce demand;
� changing the drought restrictions regime which may mean changing the duration,
frequency and severity of restrictions;
� operating existing assets in different ways under different circumstances (ie,
optimising the use of existing assets). For example, the desalination plant and the
Shoalhaven transfer scheme can be operated in alternative ways in three broad
circumstances — with no drought, in anticipation of a drought, and in drought;
and
� developing ‘response’ or ‘readiness’ strategies to deal with rare and extreme
circumstances.
To progress to detailed modelling, the following decision criteria were used to filter
the options:
� capital and operating expenditure are known or can be ascertained at an
acceptable confidence level;
� contribution to long-term supply/demand balance is confidently known and
significant;
� contribution to drought security, alone or in combination with other options, is
known and significant;
� environmental impacts are known or assessable, minimal, or can be acceptably
managed; and
� the option is not inconsistent with current Government’s policy directions.
The resultant measures are outlined in Box 3.1 and described in further detail below.

16 FINAL DRAFT — COST EFFECTIVENESS ANALYSIS — 2010 SYDNEY METROPOLITAN WATER PLAN
www.TheCIE.com.au
3.1 Options included in the portfolio analysis
� upgrading the desalination plant to produce 500 ML per day;
� considering the operating rules for the 250 ML per day desalination plant and
the 500 ML per day plant;
� augmenting the Shoalhaven transfer scheme and changing the pump mark;
� changes to the existing drought water restrictions regime; and
� introducing emergency drought response measures:3
– implementing voluntary community water usage target, achieving
10 per cent savings in addition to those achieved by drought water
restrictions;
– halving all environmental flows from dams in emergency situations; and
– using the agreed minimum operating level (MOL) of –3 metres for
Tallowa Dam.
Desalination plant
The desalination plant at Kurnell has an initial capacity of 250ML of water a day,
which can be scaled to an ultimate capacity of 500ML/day. The plant began
operating in summer 2009/10.
Operating rules for the desalination plant4
Analysis previously undertaken by TheCIE for Sydney Water indicate the most
effective operation of the 250ML per day desalination plant is based on a regime
whereby the plant is ‘turned on’ when dam levels fall below 70 per cent and ‘turned
off’ when dam levels are at 80 per cent or above (a 70/80 regime). An 80/90 and a
40/50 regime were also modelled by TheCIE. However, these were considered to be
less optimal.
� Under the 80/90 rule, there was less airspace available to capture ‘cheap’ rain
water. There was also limited additional reliability and security benefits of
operating the desalination plant at higher levels compared with the 70/80 rule.
3 The emergency drought response measures are not designed to increase the supply of water but to reduce the rate of dam depletion.
4 In the SCA’s WATHNET model the storage trigger levels are based on the eight major dams. It excludes water stored in Tallowa Dam given that only a small proportion of this is available for supplying the Sydney metropolitan area under the current operating arrangements.

FINAL DRAFT — COST EFFECTIVENESS ANALYSIS — 2010 SYDNEY METROPOLITAN WATER PLAN 17
www.TheCIE.com.au
� The 40/50 rule, provided limited benefit in terms of improved reliability and only
slightly better security outcomes – once dams reach these low levels it is often too
late for the plant to make a significant contribution to improving security.
While the 70/80 rule was considered to be optimal (in the CIE’s previous analysis), it
was recognised that as demand increases with population growth, an earlier
operational trigger for the desalination plant is likely to be warranted. As demand
increases, dam levels deplete at a faster rate and the desalination plant would need to
be switched on earlier to contribute to maintaining reliability and security (assuming
all other factors remain constant). This was not assessed in detail in this Review, but
should be considered as a possible component of future reviews.
Further, once the second stage of the desalination plant is built at some point in the
future, this could also warrant a change the trigger rules for the upgraded plant..
That is, all other things being equal, the operation of a 500ML per day plant could
possibly be triggered at lower dam levels (compared to a 250ML per day plant) in
order to have the same reliability and security benefits as the smaller sized plant.
For modelling purposes we have assumed a number of operating rules for the first
and second stage of the desalination plant (see Table 5.1).
Construction trigger for the second stage of the desalination plant
The second stage of the desalination plant can be built at a fixed point in time or can
be triggered based on demand or dam levels. There are limitations of the fixed point
approach.
� It does not depend on whether there is an immediate need for water from the
plant. For example, if dams were at full capacity it may be several years before
water from the desalination plant is required.
� The decision may need to be brought forward anyway in the event that there is a
severe drought prior to the initial construction date.
Triggering construction of the desalination plant based on a dam trigger level -
similar to the approach adopted in the first stage of the plant - offers greater
flexibility in responding to the most current conditions and information. The trigger
level needs to be set such that it is not set too high or low, resulting in increased costs
or decreased security respectively
Trigger points for the second stage of the Kurnell desalination plant should be
reviewed and refined as relevant in future reviews of the Plan to incorporate changes
to the system such as increasing demand.
The trigger needs to consider the tendering, design and construction period for the
expanded plant. For our modelling we have assumed a two year construction period
or 15 per cent drop in total system storage (based on current demand levels),

18 FINAL DRAFT — COST EFFECTIVENESS ANALYSIS — 2010 SYDNEY METROPOLITAN WATER PLAN
www.TheCIE.com.au
although this may change in the future based on new information such as global
desalination technology.5 Further time would need to be added to allow for
tendering and design if these were not completed as part of a readiness strategy.
Shoalhaven transfer scheme
The Shoalhaven transfer scheme was built in the 1970s as an emergency drought
scheme. When operating, water is transferred from Tallowa Dam on the Shoalhaven
River through a series of tunnels, pipelines and canals via Fitzroy Falls Reservoir, to
Wingecarribee Reservoir and on to other dams that supply Sydney and the Illawarra.
The scheme makes an important contribution to the water supply system for greater
Sydney. During the recent drought, water transfers began when storage levels fell to
around 60 per cent in April 2003 and continued until November 2008. During that
time, a total of 831 gigalitres were transferred, representing around 30 per cent of
greater Sydney’s water consumption.
Impacts of current water transfers through the Southern Highlands
The 2006 Metropolitan Water Plan recognised the need to develop and discuss
options for the Shoalhaven scheme that would increase the long-term available water
supply to greater Sydney and mitigate the impacts of using Southern Highlands
rivers as conduits for the transfer of water.
The flow rates for transfers in the Southern Highland river channels are limited to
minimise the impact on river ecology, to reduce erosion, and to minimise localised
flooding. The existing flow rate limits are 600 ML/day between mid-March and mid-
September, 400 ML/day between mid-September and mid-March, and 200 ML/day
for transfers commencing between November and January.
Options to reduce the impact of transfers on Southern Highland rivers while increasing supply from the Shoalhaven
The SCA has options to augment the Shoalhaven system transfer water to allow for
an increase in supply from the Shoalhaven. The options also significantly reduce run-
of-river transfers, and boost security of supply to the Illawarra. There would also be
potential for significant energy recovery through hydro generation.
5 In the SCA’s hydrology modeling the point at which the desalination plant is assumed to commence operation is presented. In our modeling, based on advice from Sydney Water, the trigger point was the decision to construct the plant which is assumed to be two years prior to the operational trigger.
FINAL DRAFT — COST EFFECTIVENESS ANALYSIS — 2010 SYDNEY METROPOLITAN WATER PLAN 19
www.TheCIE.com.au
Further information about options for future modifications to the Shoalhaven scheme
can be found in the report NSW Government (2006) Shoalhaven Water Supply Transfers
and Environmental Flows, Discussion Paper, August (page 46-48).
Raising the pump mark
The Shoalhaven transfers scheme provides greatest benefit to the water supply when
operated at higher dam trigger levels, thus reducing the probability of dams falling
to low levels. Although this costs more as a greater volume of water is required to be
pumped.
Under new operating rules introduced in 2008, transfers from Tallowa Dam begin
when the level of all SCA’s total storage levels fall below 75 per cent. Pumping stops
when the dams rise above 80 per cent full.6 Pumping only occurs in those conditions
if the level of Tallowa Dam is above its minimum operating level of -1 metre. These
rules are embedded in the base case.
Augmenting the Shoalhaven further would allow extra water to meet Sydney’s long-
term potable water supply needs and could be expected to provide longer term
benefits to system security and reliability.
Raising the pump mark means that water transfers can take place in wetter periods
and higher flows. This is considered a more effective way to harvest water and will
generally take water from the Shoalhaven River when the river downstream of
Tallowa Dam is less stressed.
Changes to drought water restrictions regime
In the past, the NSW Government and governments throughout Australia have
relied on water restrictions as a key policy instrument for dealing with drought.
Restrictions have been critical as the water supply for communities reliant on rainfall
dependent dams. Restrictions help ensure that communities can withstand periods of
drought without running out of water, and enable governments to defer the need for
additional investments in water infrastructure.
Water restrictions have been an important part of managing Sydney’s supplies
during drought periods. Mandatory water restrictions were in place in Sydney
between 2003 and July 2009, with voluntary water restrictions in place for
approximately a year before this. With the lifting of drought restrictions, long-term
WaterWise rules were introduced in mid 2009.
Changing the trigger points for water restrictions has a bearing on the reliability and
security of the system. Introducing restrictions early raises the average time in
6 There is currently a three year moratorium of pumping from the Shoalhaven system.

20 FINAL DRAFT — COST EFFECTIVENESS ANALYSIS — 2010 SYDNEY METROPOLITAN WATER PLAN
www.TheCIE.com.au
restrictions, although it is likely to have security benefits as well. Lowering the
trigger level reduces the time in restrictions (and the associated costs) but can reduce
the security of the system. For this study, we have analysed the reliability, security
and cost implications of a range of alternative water restrictions regimes.
Measures to respond to extreme drought
In the very rare event that a drought is so extreme that mandatory drought based
restrictions are not sufficient to slow the depletion of the dams, there are several
measures that can be deployed to further reduce water use and slow the decline.
The key measures considered in this analysis are:
� adopting the Tallowa Dam minimum operating level (MOL) of -3 metres;
� additional water usage targets which are assumed to achieve total savings of
22 per cent (including the other levels of restrictions); and
� halving environmental flows from all of the SCA’s dams.
These measures for use in extreme drought have a number of benefits including the
following:
� They may provide some extra time to allow conditions to return to more normal
levels before committing to large scale infrastructure. While the emergency
measures may have a relatively high cost, if they only apply for a short time this
cost is likely to outweigh the sunk cost associated with large scale infrastructure
that applies for a long period.
� They slow the depletion of storages and provide a buffer in the event there are
unexpected delays in building the next proposed infrastructure option (eg
upgrading the desalination plant).
However, the effectiveness of emergency measures is not as certain as infrastructure
options. It is important therefore, that these measures are further analysed and
appropriate consideration of options is undertaken.
Additional demand management or recycling activities
As part of the 2006 Plan, the Government has made significant commitments to
expanding demand management programs and recycling activities. Those activities
committed into the future have been incorporated into our analysis in the base case.
Given the substantial forward commitment and targets in demand management and
recycling activities, this analysis has not incorporated additional demand
management and recycling activities.

FINAL DRAFT — COST EFFECTIVENESS ANALYSIS — 2010 SYDNEY METROPOLITAN WATER PLAN 21
www.TheCIE.com.au
However, we have also examined (as part of the sensitivity analysis) the impact on
the reliability and security of the water supply system, if additional savings can be
achieved (medium and high savings). This illustrates the potential benefits that could
be achieved if further cost effective demand management or recycling options
become available in the future.
22 FINAL DRAFT — COST EFFECTIVENESS ANALYSIS — 2010 SYDNEY METROPOLITAN WATER PLAN
www.TheCIE.com.au
4 The approach
This chapter discusses the approach for considering the different options discussed
in the previous chapter. The approach is based on the analytical framework
developed by TheCIE that uses a hydrology model for its outputs. The approach
works within certain limitations such as data constraints, and resources required to
undertake modelling of a range of alternative scenarios.
The analytical framework
The approach undertaken for this review was based on the analytical framework
developed by TheCIE in February 2009. The framework maintains and expands on
the least cost portfolio and adaptive management approaches adopted in the 2006
Plan.7 The approach also allows the current portfolio of demand and supply options
to be included in deciding on the optimal portfolio.8 For example, the triggers for
different types of restrictions, the Shoalhaven scheme, environmental flow rules and
the desalination plant are all flexible components of the water system that can be
adjusted to achieve the best outcomes. The preferred portfolio was derived from an
assessment of costs as well as qualitative analysis of environmental and social costs
that cannot yet be assigned a dollar value.
A portfolio is constructed over a time period (such as 20 years). In constructing the
portfolio the approach recognises that decisions made now can have an impact on
the measures required in the future. So, for example, adopting more stringent water
restrictions can result in deferring the need for additional infrastructure in the
future.9
7 In the recommended approach a portfolio is defined more broadly and could include a set or sequence of projects, timing, rules and trigger points. So, for example, two different portfolios could include the same projects but introduced in different years or at different dam levels.
8 Throughout the report we use the term ‘optimal’ portfolio. However, in practice there is not likely to be all the information required to achieve optimality. Therefore, in practice it may only be possible to reach the ‘best’ solution rather than the ‘optimal’ solution.
9 The proposed approach also recognises the interrelationship between existing measures in the system. For example, the use of the desalination plant could result in less reliance on water pumped from the Shoalhaven river. Therefore, the portfolio costs represent a net cost - the increase in costs by operating the desalination plant is partially offset by lower pumping costs associated with the Shoalhaven pumping scheme.
FINAL DRAFT — COST EFFECTIVENESS ANALYSIS — 2010 SYDNEY METROPOLITAN WATER PLAN 23
www.TheCIE.com.au
A central feature of the proposed approach is the need to include risk and
uncertainty into the analysis of alternative portfolios of measures. Risk is a crucial
element of water planning, particularly for Sydney which has highly variable rainfall
patterns and can be subject to extended periods of drought.10 Therefore, decisions
must be taken with incomplete information about future water availability.
The proposed framework also includes a number of other refinements including:
� examining a wider range of costs such as the potential costs of restrictions as well
as including environmental and social considerations. In practice, estimating some
of the costs, such as the cost of restrictions, is an ‘inexact science’ in the absence of
specific studies that seek to measure these impacts;
� frequency and duration of restrictions are assessed as outcomes of the analysis
based on an evaluation of the cost and benefits of the options, rather than being
pre-determined; and
� maintaining a pre-determined level of water security that must always be
achieved. This is consistent with the broad objective of the Plan to ensure that
there is a secure supply of water into the future to meet Sydney’s needs. However,
rather than initially adopt the water security criterion specified in the SCA’s
Licence the assessment was open to the consideration of potential alternative
criterion that might be more cost effective, provide improved security and/or be
simpler to understand and communicate to decision makers and the community.
There is limited current knowledge on the potential impact of climate change on
water availability in the Sydney basin and the impact of prolonged restrictions and
water conservation programs on unrestricted demand. Under the analytical
framework, decision makers will still be required to make a range of judgements in
developing the best strategy to meet the objectives of the Plan. This may require
additional input from the community on, for example, the level of risk that they are
willing to bear. Therefore, the results of the community engagement strategy that has
been undertaken is likely to play an important role in the development of the Plan.
Incorporating environmental and social impacts
Various techniques are available to enable specific ‘dollar’ values to be placed against
the environmental and social costs and benefits of the Plan such as benefit transfer
techniques. However, due to the limited information available to place values on the
environmental and social impacts of the various measures assessed as part of the
Review it was determined that these techniques would not be incorporated into the
10 We use the terms risk and uncertainty interchangeably throughout this report to refer to events about which there is a known or sensibly estimated probability distribution of possible outcomes. However, we recognise that there is a clear distinction between the terms in a technical sense.

24 FINAL DRAFT — COST EFFECTIVENESS ANALYSIS — 2010 SYDNEY METROPOLITAN WATER PLAN
www.TheCIE.com.au
analysis. Data was only available to place reasonable values on the environmental
impacts associated with greenhouse gas emissions and Shoalhaven transfers costs.
In order to capture the broad range of environmental and social impacts associated
with alternative portfolios of measures, the NSW Office of Water established two
separate panels of experts from government agencies combined with some input
from external experts. The two panels were responsible for separately considering
the issues of environmental and social impacts and establishing a methodology that
allowed a ranking of the portfolios. The approach adopted by the two panels was
largely based on qualitative analysis. The approaches also included a methodology
for placing scores on the impacts, although the scoring system differed between the
two groups.
The challenge for this study has been to incorporate the analysis of the two panels
into the cost effectiveness analysis. Our approach to incorporating this information is
discussed further below in discussions on portfolio rankings.
Decision rule
A cost effectiveness analysis typically incorporates a time dimension to take account,
for example, of additional investments in infrastructure that may be required at
different points in time. We have adopted this approach, using a discounted
cashflow analysis, using a real discount rate of 7 per cent, with sensitivity analysis
undertaken on other rates.
When ranking different portfolios the net present value decision rule suggests that
the option with the highest net present value would be preferred, subject to that
option meeting the specified criterion. In this analysis we have assumed a specified
security criterion that portfolios are required to meet.
However, it is also important to take account of the fact that some portfolios may
offer significantly higher levels of security above the security criterion. Therefore, the
ranking of alternative portfolios needs to consider both the net present value of costs
associated with alternative portfolios as well as the level of security offered by that
portfolio. In some instances portfolios may clearly ‘dominate’ other portfolios on
both cost and security grounds. However, in other cases, there may not be a clear
ranking of portfolios.
In addition, the conclusions regarding the preferred portfolios will need to take
account of the findings of the environmental and social panels regarding the
potential impacts of these projects. This additional information is expected to provide
a clearer ranking of portfolios.

FINAL DRAFT — COST EFFECTIVENESS ANALYSIS — 2010 SYDNEY METROPOLITAN WATER PLAN 25
www.TheCIE.com.au
The security criterion
The specification of the security constraint to be used in the analysis of alternative
portfolios is a key factor that can influence the ranking of alternative portfolios. The
primary focus of the analysis is over the immediate to medium term planning period.
Therefore, the security criterion was primarily applied to the period 2010 to 2030.11
For the purposes of this analysis, alternatives were considered to the current security
criterion set in the SCA Operating Licence.12 Alternative levels of security were
considered to test the cost implications of each. Some alternative specification of the
security criterion was also considered. This was intended to ensure that the security
criterion chosen was simple to understand and could be readily communicated to
decision makers and the community.
The PCG considered that using an absolute (as opposed to a probabilistic) criterion
was more intuitive for policy makers and the community to understand. The PCG
considered a security level of 5 per cent was broadly consistent with the security
criterion specified in the SCA’s Operating Licence. 13
In establishing the security criterion it recognised that while an absolute security
criterion is set, this does not guarantee that a security criterion can always be met in
all future situations. Our analysis of the performance of alternative portfolios against
the security criterion is based on the results of the hydrological modelling. It is
possible that there may be future droughts that are worse than that generated by the
hydrological models. In this sense, it is important that policy-makers continue to
monitor situations and continue to enhance their knowledge of alternative measures
that could assist in managing against unexpected events in the future.
It is also important to test the cost of alternative portfolios under slight changes to the
security constraint (once it is established). It is possible that, for example, the cost of
the optimal portfolio can be significantly reduced by adopting a slightly lower
security constraint.
11 Our modeling has incorporated information from the period 2010 to 2050, although the key period of interest is that between 2010 and 2030. It was also recognised that in the longer term, additional measures would be required to meet water security objectives. However, there was uncertainty regarding the nature and cost of these additional measures which warrants a focus on the shorter term planning period.
12 In the SCA’s Operating Licence the security criterion specifies that the level of water in storage should not be allowed to fall below 5 per cent of capacity more than 0.001 per cent of the time, on average.
13 The SCA has advised that adopting a 10 per cent absolute security criterion would result in a more conservative outcome than the security criterion specified in their current Operating Licence.

26 FINAL DRAFT — COST EFFECTIVENESS ANALYSIS — 2010 SYDNEY METROPOLITAN WATER PLAN
www.TheCIE.com.au
The reliability criterion
As noted above, the reliability criterion (ie the average time spent in restrictions) has
not been fixed in this analysis. Rather a cost has been assigned to the time in
restrictions so that this aspect can be considered as part of the cost effectiveness
analysis. Sensitivity testing has also been undertaken on the cost of level 1 water
restrictions being reduced. The SCA’s Reliability Criterion states that restrictions
should not be in place for more than 3 per cent of the time.
Portfolio analysis
For the purposes of this analysis, we interpret a portfolio to comprise a set or
sequence of projects, timing, and rules.
The current infrastructure for providing Sydney’s water forms the portfolio of assets
that ensure that there is sufficient water available to meet the water demand from
consumers. The existing portfolio also includes the existing policy decisions such as
the current water restrictions regime.
A new portfolio could include additional measures such as new infrastructure or
changes to the existing portfolio of measures (including current policies). For
instance, we interpret a new portfolio to be formed if the existing portfolios of
measures are amended slightly (such as through the introduction of a new
restrictions regime).
Portfolios may also differ in terms of the timing of the introduction of new measures.
For example, for the purposes of our analysis we would treat the following to be two
separate portfolios:
� Portfolio 1: The existing portfolio of measures plus additional demand
management programs being introduced from 2010; and
� Portfolio 2: The existing portfolio of measures plus additional demand
management programs being introduced from 2015.
Under the portfolio approach, individual changes to the water system are considered
in the context of the existing portfolio of measures. This recognises the interaction
effects between the different parts of the system.
Assessment of portfolios
The practical assessment of portfolios has to acknowledge the resource constraints
faced in portfolio evaluation. These are:
� limited resources to run the hydrological model WATHNET;
� limited information that causally links water flows to environmental and social
outcomes;
FINAL DRAFT — COST EFFECTIVENESS ANALYSIS — 2010 SYDNEY METROPOLITAN WATER PLAN 27
www.TheCIE.com.au
� limited information on the risk attitudes of the government and community;
� limited information on the future financial constraints on water investments; and
� limited information on the cost of water restrictions.
Once the individual options were selected, TheCIE began analysis of these options in
combination with the range of measures that are currently in place (ie portfolio
analysis). That is, the options are added to the existing measures to form a new
portfolio of measures. Even with the limited range of options considered for further
analysis, these can be combined in different ways such as to generate a large number
of portfolios that need to be analysed.
In order to minimise the number of portfolios to be analysed a two step approach
was adopted:
� testing the security performance of the portfolio which provided a filtering
mechanism to select portfolios to progress to the next level of analysis;14 and
� conducting the ‘full’ analysis on the selected portfolios using the full set of future
inflow scenarios generated by the WATHNET model and considering ensured
both the security and reliability of the water supply system were considered.
Portfolio ranking
We have adopted the following approach:
� Step 1. We have first considered whether a portfolio meets the security criterion.
Portfolios that do not meet the specified security criterion are excluded. Portfolios
that do not meet the security criterion (but only by a small margin) are not
discarded because they may be substantially lower cost compared with portfolios
that may only have marginally better security outcomes.15 Further, these
portfolios could also have environmental and social merits that need to be
considered in the next steps.
� Step 2. For those portfolios that meet the security criterion we compare these
portfolios on cost and security grounds.
� Step 3. We then test whether the ranking of these portfolios changes by
incorporating environmental and social impacts.
14 This involved choosing the most extreme simulated drought scenario (Replicate 1449) of the first 2 000 scenarios generated by the hydrology model and examining the performance of alternative portfolios in this context.
15 There is no information available that will allow us to test the risk preferences of Sydney households and their willingness to pay for additional levels of security.
28 FINAL DRAFT — COST EFFECTIVENESS ANALYSIS — 2010 SYDNEY METROPOLITAN WATER PLAN
www.TheCIE.com.au
The WATHNET model
In order to evaluate how alternative portfolios impact on the existing costs of
operating the system and contribute to reducing the time in restrictions and the
likelihood of low dam levels, we use the results from a complex hydrology model,
the WATHNET model. This model is used by the SCA to optimise the use of its
infrastructure and to calculate the impact on system yield of specific changes to the
water supply system.
The model allows historical inflow data to be replicated by stochastic modelling to
provide simulated inflow sequences (known as Replicates).16 The model was not
designed as an inflow-forecasting tool although it produces results in each month
over the next 50 years. Therefore, the Replicates are scenarios rather than forecasts.
The WATHNET model produced a range of output to assist in examining how the
alternative portfolios impact on the supply system. Key pieces of information
produced by the modelling include:
� the amount of time in restrictions;
� storage levels over time and storage behaviour (ie depletion curves);
� the volume of water pumped from the Shoalhaven scheme in each month – the
pumping from the Shoalhaven system is triggered by overall dam levels;
� the volume of water produced by the desalination plant in each month;
� the volume of water released from dams into the downstream rivers, which
includes environmental releases, spills and other miscellaneous releases; and
� the volume of ‘shortfalls’ at different points in the system to supply needs to be
transferred to meet the demand at that point in time.
The assumptions and inputs underlying the WATHNET model include the physical
infrastructure of the system,17 the operating regime for this infrastructure, the
demand and other release requirements (eg environmental flow releases, riparian
releases) and the hydrologic behaviour of the catchment.
16 In our analysis we initially used 2 000 Replicates and increased this to 10 000 Replicates on a more limited range of portfolios that have been selected to progress to the ‘next step’. The key benefit of the 10 000 Replicates is that it provides further information on the potential ‘extreme’ events that could be faced at different points in time over the next 50 years and how the alternative portfolios perform in the extreme situations.
17 All water recycling initiatives are treated by the model as ‘negative demands’.
FINAL DRAFT — COST EFFECTIVENESS ANALYSIS — 2010 SYDNEY METROPOLITAN WATER PLAN 29
www.TheCIE.com.au
5 Portfolio impacts and portfolio costs
This chapter summarises the physical performance of alternative portfolio options
we have modelled. The portfolio performance is compared against the modelling
results for the base case or existing measures that have been committed by the
Government.18 The reporting of the results has been divided into three broad time
periods (the immediate, medium and longer term). This is important because there
are expected to be significant changes at different points in time (such as the
introduction of the revised Warragamba environmental flow regime, and increase in
demand). Therefore, it is useful to consider how these changes result in different
outcomes compared with the earlier periods.
The second part of this chapter reports the costs (in net present value terms) and
compares how the costs of the portfolios differ. The next chapter combines the cost
information and the physical characteristics to provide an initial portfolio ranking.
Summary of portfolios analysed
For the base case a flow regime for Warragamba Dam of five ML/day is assumed
and 80/20 regimes for all other dams. In all runs presented in the table below we
assume a revised environmental flow regime of 95/20 for Warragamba Dam and
80/20 regimes for the other dams.
For all the runs (except Run 22) we have assumed that the operation of the existing
desalination plant is triggered when dam levels go below 70 per cent of capacity and
switched off when dam levels reach 80 per cent. For Run 22 the existing desalination
plant is assumed to operate at full capacity from 2018 to ‘balance’ the impact of the
revised Warragamba environmental flows regime which is assumed to be introduced
at that point in time.
A description of the emergency measures was provided in chapter 3. Unless
otherwise specified, the trigger levels used were:
� 40 per cent storage levels for triggering changes to the minimum operating level
for Tallowa dam; and
18 In the analysis in this section we use the demand projections that include median population projections and low savings from demand management programs. In the sensitivity analysis section we report on the impact of alternative demand projections.

30 FINAL DRAFT — COST EFFECTIVENESS ANALYSIS — 2010 SYDNEY METROPOLITAN WATER PLAN
www.TheCIE.com.au
� 35 per cent storage levels for triggering water usage targets and halving of
environmental flows in all storages.
5.1 Summary of modelling portfolios
Run Upgrading
Desalination
Upgrade Sh
Transfers
Shoalhaven
Pump Mark
Water
restrictions
Emergency measures
Base case None None 75/80 L1@55%, L2@45%,
L3@40%
No
Base case
with E’Flows
None None 75/80 As above No
Run 13 2018/, 70/80 2018 85/90 As above No
Run 15 30%, 30/80 None 75/80 As above Yesa
Run 17 30%, 30/80 2024 85/90 As above Yesa
Run 18 20%, 70/80 2034 85/90 As above Yesa
Run 19 15% to 2024,
70/80
20% after 2024,
70/80
2034 85/90 As above Yesa
Run 20 15% to 2024,
70/80
20% after 2024,
70/80
None 75/80 As above Yesa
Run 21 15% to 2024,
70/80
20% after 2024, 70/80
2034 85/90 As above Yes, 40% trigger Tallowa
MOL, 35% trigger for halving
eflows. Excluding water usage targets.
Run 22 15% to 2024,
70/80 20% after 2024,
70/80
None 75/80 As above Yesa
Run26 20% to 2030,
70/80
30% after 2030, 70/80
2035 85/90 As above Yes 35% trigger Tallowa
MOL, 25% trigger for halving
eflows and water usage targets.
Run 27 20% to 2030,
70/80
30% after 2030,
70/80
2025 85/90 As above Yes, 35% trigger Tallowa
MOL,. 25% trigger for halving
eflows and water usage
targets.
Run 28 20% to 2030,
70/80
30% after 2030,
70/80
2035 85/90 L1@50%,
L2@40%
Yes, 35% trigger Tallowa
MOL, 25% trigger for halving
eflows and water usage
targets.
Run 29 20% to 2030, 70/80
30% after 2030,
70/80
2035 85/90 L1@60%, L2@50%
Yes, 35% trigger Tallowa MOL, 25% trigger for halving
eflows and water usage
targets.
Run 30 20% to 2030,
70/80
30% after 2030, 70/80
2025 85/90 L1@50%,
L2@40%
Yes, 35% trigger Tallowa
MOL, 25% trigger for halving
eflows and water usage targets.
a ‘Emergency Measures’ include the following: 40 per cent storage levels for triggering changes to the minimum operating level
for Tallowa dam; 35 per cent storage levels for triggering water usage targets and halving of environmental flows in all storages
Note: The trigger for upscaling the desalination plant refers to the assumed point which the plant commences operation. The
trigger to commit to construct has been modelled at 15 per cent higher than this level.

FINAL DRAFT — COST EFFECTIVENESS ANALYSIS — 2010 SYDNEY METROPOLITAN WATER PLAN 31
www.TheCIE.com.au
Portfolio impacts
In this section we report on the changes to the reliability and security of the system.
A wide range of the parameters noted above are incorporated directly into the
modelling of costs.
Additional infrastructure in 2018 (Run 13)
This portfolio (Run 13) takes the base case and includes the revised environmental
flow regime for Warragamba Dam commencing in 2018. We have included both the
Shoalhaven augmentation and the second stage of the desalination plant. In Run 13,
this additional infrastructure is assumed to commence in 2018, at the same time the
new environmental flow regime begins. The second stage of the desalination plant is
assumed to operate according to the same rule (a 70/80 rule) as the existing
desalination plant.
The security and reliability outcomes of this new portfolio are presented in the tables
below. The probability of falling below 10 per cent increases substantially,
particularly from 2030 onward. Likewise, the revised regime also contributes to
lowering the minimum storage levels reached.
5.2 Security outcomes – Probability and minimum storage levels
Up to 2020 2020-30 2030-50
Probability
<10%
Minimum
storage
Probability
<10%
Minimum
storage
Probability
<10%
Minimum
storage
% % % % % %
Base case 0.1 5.5 0.3 2.2 3.3 0.0
Base case – Eflows 95/20 0.1 5.5 0.7 0.0 6.8 0.0
2018 Infrastructure (Run 13) 0.1 5.4 0.1 13.4 1.2 0.0
Source: SCA Wathnet model.
Introducing the additional infrastructure in 2018 significantly lowers the probability
of falling below 10 per cent storage levels and raises the minimum storage level
reached. However, in the longer term, both these measures do not stop the storages
from potentially running out of water in extreme droughts.
5.3 Reliability outcomes - average time in restrictions
Up to 2020 2020-30 2030-50
% % %
Base case 5.0 3.6 6.9
Base case – Eflows 95/20 5.1 5.7 10.7
2018 Infrastructure (Run 13) 4.9 2.8 5.9
Source: SCA Wathnet model.

32 FINAL DRAFT — COST EFFECTIVENESS ANALYSIS — 2010 SYDNEY METROPOLITAN WATER PLAN
www.TheCIE.com.au
Introducing the additional infrastructure in 2018 also has a significant impact on the
time in restrictions. The new infrastructure has the effect of lowering the time in
restrictions from 10.7 per cent back to 5.9 per cent in the final period.
Additional desalination plant combined with emergency measures
Constructing stage 2 of the desalination plant at a fixed point in time does not
provide flexibility to incorporate new information, such as storage levels at that
particular point in time. For example, storages may be at full capacity in 2018 when
the second stage of the plan is assumed to commence. In this situation there is likely
to be significant benefit of delaying the construction of the plant for several years
until dam levels fall. Therefore, for this scenario we have considered triggering the
construction of the desalination plant according to a dam level trigger. In the
scenarios below we assume that the upgraded plant starts operating when dam
levels reach the specified level. This means that a decision would need to be made in
advance (at a 15 per cent to 20 per cent higher dam levels) to ensure the construction
of the plant can be completed and it can start operating at the specified dam level.
To slow the depletion of dams further during the construction of a desalination plant,
we have also incorporated emergency measures that are also triggered at low dam
levels. We have also considered the performance of this portfolio with and without
the upgrade to the Shoalhaven transfer scheme.
5.4 Security outcomes – Probability and minimum storage levels
Up to 2020 2020-30 2030-50
Probability
<10%
Minimum
storage
Probability
<10%
Minimum
storage
Probability
<10%
Minimum
storage
% % % % % %
Base case 0.1 5.5 0.3 2.2 3.3 0.0
Base case – Eflows 95/20 0.1 5.5 0.7 0.0 6.8 0.0
Desal 2 30 per cent
operating, 30/80 rule
Emergency measures (RUN
15)
0.0 18.6 0.0 12.6 0.6 0.3
Desal 2 30 per cent
operating, 30/80 rule
SHP Upgrade 2024 (Run 17)
0.0 18.7 0.0 12.8 0.4 0.3
Desal 2 20 per cent operating
70/80 rule
Emergency measures
SHP Upgrade 2034 (Run 18)
0.0 15.9 0.0 10.0 0.9 0.2
Source: SCA Wathnet model.
Beyond 2020, the base case scenario with or without environmental flows for
Warragamba falls below 5 per cent minimum storage levels and requires
augmentation. Up to 2030, upgrading the desalination plant, even if it commences

FINAL DRAFT — COST EFFECTIVENESS ANALYSIS — 2010 SYDNEY METROPOLITAN WATER PLAN 33
www.TheCIE.com.au
operating when dam levels are at 20 per cent of capacity, can significantly improve
the security outcome of the water supply system, particularly when combined with
the emergency measures that slow the depletion of the dams. In the longer term
beyond 2030, as water demand rises, the security of the system is significantly
reduced even if these measures are in place.
5.5 Reliability outcomes - Average time in restrictions
Up to 2020 2020-30 2030-50
% % %
Base case 5.0 3.6 6.9
Base case – Eflows 95/20 5.1 5.7 10.7
Desal 2 30% operating, 30/80 rule,
Emergency measures (RUN 15) 5.1 5.5 10.1
Desal 2 30% operating, 30/80 rule,
Emergency measures
SHP Upgrade 2024 (RUN 17) 5.1 5.2 8.7
Desal 2 20% operating, 70/80 rule,
Emergency measures
SHP Upgrade 2034 (RUN 18) 5.1 5.6 9.3
Source: SCA Wathnet model.
The additional measures do improve the reliability of the system but not
significantly. Augmenting the Shoalhaven transfer scheme does offer a reliability
benefit, although it doesn’t make a significant contribution to security.
Changing the desalination plant trigger points over time
In this part of the modelling we have tested the impact of lowering the assumed
operating trigger level for the second stage of the desalination plant until demand
increases in future. In these scenarios we have assumed that, up to 2024, the
operation of the second stage of the plant is triggered when dam levels reach
15 per cent. After 2024, as demand is projected to rise, we have assumed that the
second stage needs to start operating when dams reach 20 per cent.
We also test how these new trigger levels perform with the emergency measures, but
also in combination with augmenting the Shoalhaven transfer scheme, and operating
the existing desalination plant at full capacity from 2018 onwards.
34 FINAL DRAFT — COST EFFECTIVENESS ANALYSIS — 2010 SYDNEY METROPOLITAN WATER PLAN
www.TheCIE.com.au
5.6 Security outcomes – Pr<10 per cent and minimum storage levels
Up to 2020 2020-30 2030-50
Probability
<10%
Minimum
storage
Probability
<10%
Minimum
storage
Probability
<10%
Minimum
storage
% % % % % %
Base case 0.1 5.5 0.3 2.2 3.3 0.0
Bas case – Eflows 95/0 0.1 5.5 0.7 0.0 6.8 0.0
Desal 2 15 per cent to 2040
and 20 per cent onwards,
70/80 rule
Emergency measures
(RUN 20)
0.0 12.4 0.0 10.1 0.8 0.3
Desal 2 15 per cent to 2040
and 20 per cent onwards,
70/80 rule
Emergency measures
Desal 1 operating at
100 per cent from 2018 (RUN
22)
0.0 12.4 0.0 11.0 0.5 0.3
Desal 2 15 per cent to 2024
and 20 per cent onwards,
70/80 rule
Emergency measures
SHP Upgrade 2034 (RUN 19)
0.0 12.4 0.1 10.0 0.8 0.2
Source: SCA Wathnet model.
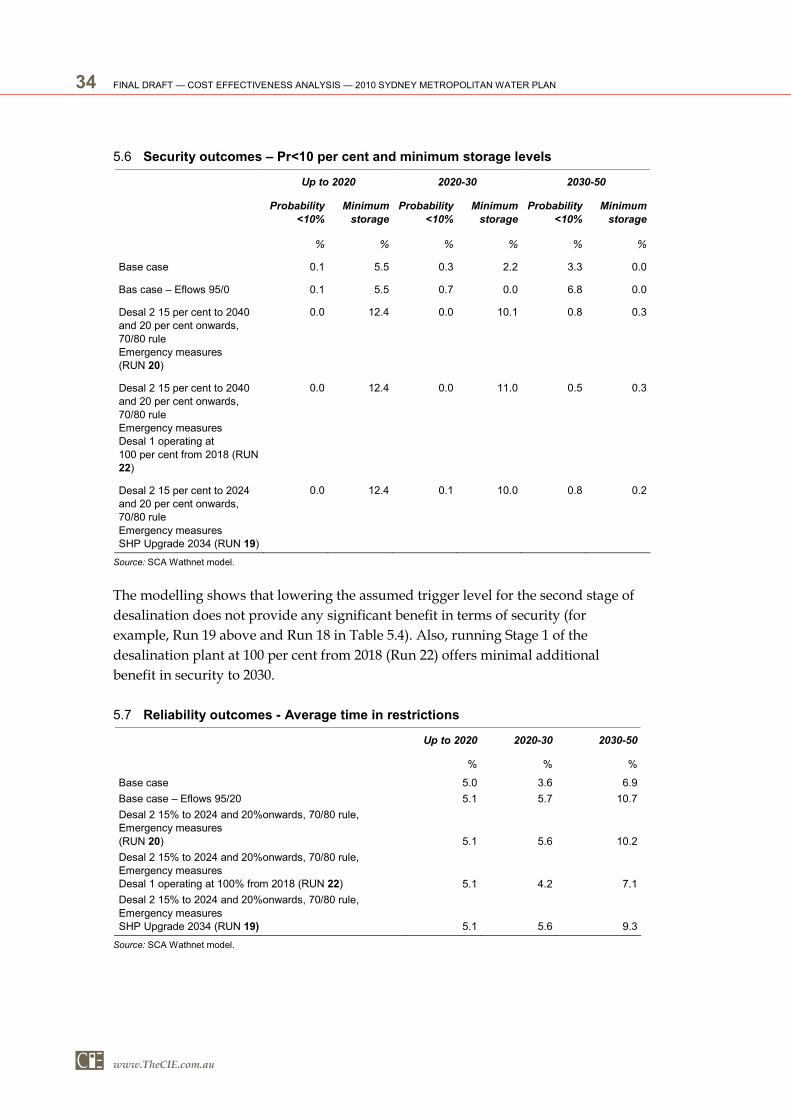
The modelling shows that lowering the assumed trigger level for the second stage of
desalination does not provide any significant benefit in terms of security (for
example, Run 19 above and Run 18 in Table 5.4). Also, running Stage 1 of the
desalination plant at 100 per cent from 2018 (Run 22) offers minimal additional
benefit in security to 2030.
5.7 Reliability outcomes - Average time in restrictions
Up to 2020 2020-30 2030-50
% % %
Base case 5.0 3.6 6.9
Base case – Eflows 95/20 5.1 5.7 10.7
Desal 2 15% to 2024 and 20%onwards, 70/80 rule, Emergency measures
(RUN 20) 5.1 5.6 10.2
Desal 2 15% to 2024 and 20%onwards, 70/80 rule,
Emergency measures Desal 1 operating at 100% from 2018 (RUN 22) 5.1 4.2 7.1
Desal 2 15% to 2024 and 20%onwards, 70/80 rule,
Emergency measures
SHP Upgrade 2034 (RUN 19) 5.1 5.6 9.3
Source: SCA Wathnet model.

FINAL DRAFT — COST EFFECTIVENESS ANALYSIS — 2010 SYDNEY METROPOLITAN WATER PLAN 35
www.TheCIE.com.au
While these measures would induce no change in the average time spent in water
restrictions until 2020, marginal declines would be achieved post 2020, with the
proportional decrease greater post 2030. In particular, the operation of the existing
desalination plant at full capacity from 2018 onwards reduces the average time spent
in restrictions by around 1.5 per cent between 2020 and 2030 and 3.6 per cent
between 2030 and 2050.
Changing triggers for the measures deployed in extreme drought
As noted in the previous sections, the emergency measures can make a significant
contribution to the security of the system. However, these measures may come at a
relatively high cost to the community and environment and, therefore, are for in
extreme situations, more work needs to be done to refine costs and actions.
Further, there is also some uncertainty regarding whether the water usage targets can
achieve the level of savings assumed. Given this, we have considered changes to the
trigger levels for implementing the emergency measures as well as changes to the
trigger levels for commencing the operation of the second stage of the desalination
plant. We have also considered an option without water usage targets.
5.8 Security outcomes – Pr<10 per cent and minimum storage levels
Up to 2020 2020-30 2030-50
Probability
<10%
Minimum
storage
Probability
<10%
Minimum
storage
Probability
<10%
Minimum
storage
% % % % % %
Base case 0.1 5.5 0.3 2.2 3.3 0.0
Bas case – Eflows 95/0 0.1 5.5 0.7 0.0 6.8 0.0
Desal 2 15 per cent to 2040
and 20 per cent onwards,
70/80 rule
Emergency measures, No
Water Usage Targets
SHP Upgrade 2034 (RUN 21)
0.0 10.7 0.1 5.2 2.3 0.2
Desal 2 20 per cent to 2030 and 30 per cent onwards,
70/80 rule
Emergency measures, lower
triggers
SHP Upgrade 2035 (RUN 26)
0.0 14.8 0.1 7.1 0.7 0.1
Desal 2 20 per cent to 2030
and 30 per cent onwards,
70/80 rule
Emergency measures, lower
triggers
SHP Upgrade 2025 (RUN 27)
0.0 14.8 0.1 7.1 0.7 0.1
Source: SCA Wathnet model.

36 FINAL DRAFT — COST EFFECTIVENESS ANALYSIS — 2010 SYDNEY METROPOLITAN WATER PLAN
www.TheCIE.com.au
The removal of water usage targets (Run 21 compared with Run 19) reduces the
modelled minimum storage level reached from 10 per cent to around 5 per cent to
2030, demonstrating the influence that these measures are predicted to have during
an extreme drought period. Even so, Run 21 still just meets the 5 per cent minimum
storage level. The delayed trigger level (Runs 26 and 27 compared with Run 19) also
demonstrates a reduction of about 3 per cent in minimum storage level reached
(from 10 per cent to 7.1 per cent) up to 2030.
These measures increase the average time spent in restrictions up to 2020, but
achieve a reduction in average time spent in restrictions thereafter.
5.9 Reliability outcomes - Average time in restrictions
Up to 2020 2020-30 2030-50
% % %
Base case 5.0 3.6 6.9
Base case – Eflows 95/20 5.1 5.7 10.7
Desal 2 15% to 2024 and 20%onwards, 70/80 rule,
Emergency measures, No Water Usage Targets
SHP Upgrade 2034 (RUN 21) 5.1 5.6 9.3
Desal 2 20% to 2030 and 30%onwards, 70/80 rule,
Emergency measures, lower triggers
SHP Upgrade 2035 (RUN 26) 5.2 5.7 9.3
Desal 2 20% to 2030 and 30%onwards, 70/80 rule,
Emergency measures, lower triggers
SHP Upgrade 2025 (RUN 27) 5.2 5.4 8.8
Source: SCA Wathnet model.
Changing the existing levels of restrictions
As a final step in the scenario analysis, we have considered the performance of the
portfolios described in the previous section under different restrictions regimes. We
have considered two alternative restrictions regimes:
� Option 1: Level 1 restrictions commencing at 50 per cent storage levels and Level 2
at 40 per cent saving 10 per cent and 11 per cent of demand respectively; and
� Option 2: Level 1 restrictions commencing at 60 per cent storage levels and Level 2
at 50 per cent saving 10 per cent and 11 per cent of demand respectively.
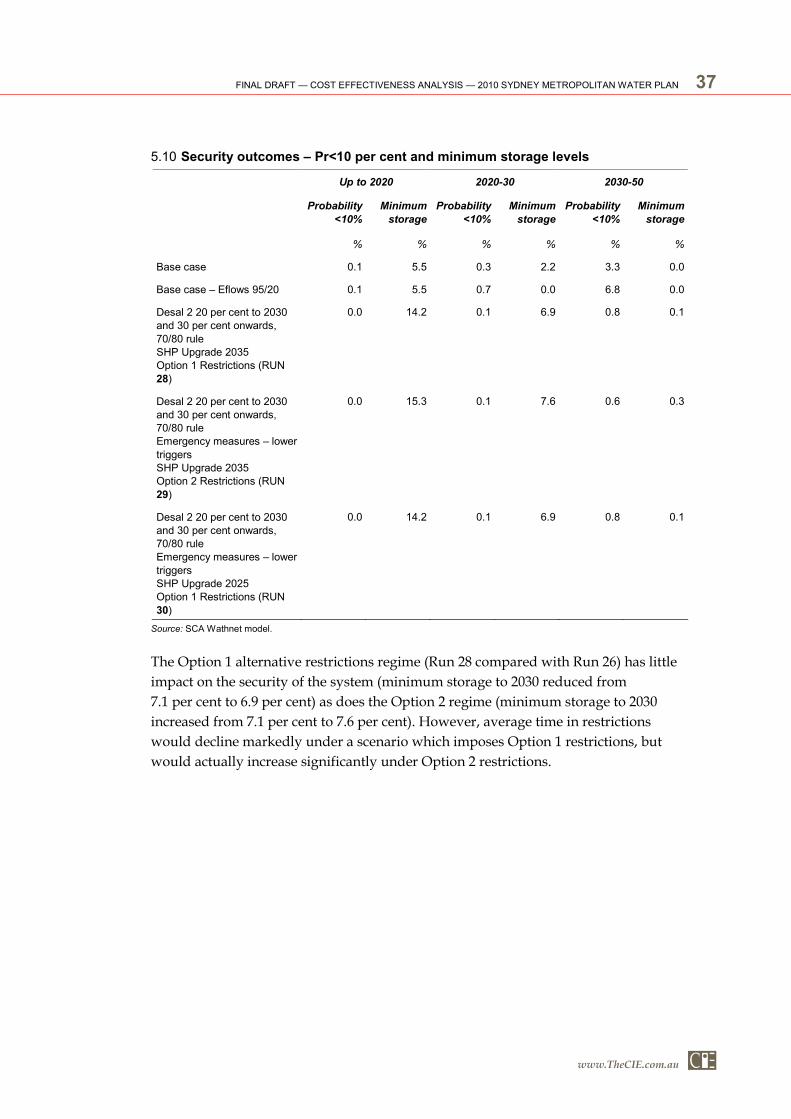
FINAL DRAFT — COST EFFECTIVENESS ANALYSIS — 2010 SYDNEY METROPOLITAN WATER PLAN 37
www.TheCIE.com.au
5.10 Security outcomes – Pr<10 per cent and minimum storage levels
Up to 2020 2020-30 2030-50
Probability
<10%
Minimum
storage
Probability
<10%
Minimum
storage
Probability
<10%
Minimum
storage
% % % % % %
Base case 0.1 5.5 0.3 2.2 3.3 0.0
Base case – Eflows 95/20 0.1 5.5 0.7 0.0 6.8 0.0
Desal 2 20 per cent to 2030
and 30 per cent onwards,
70/80 rule
SHP Upgrade 2035
Option 1 Restrictions (RUN
28)
0.0 14.2 0.1 6.9 0.8 0.1
Desal 2 20 per cent to 2030 and 30 per cent onwards,
70/80 rule
Emergency measures – lower
triggers
SHP Upgrade 2035
Option 2 Restrictions (RUN
29)
0.0 15.3 0.1 7.6 0.6 0.3
Desal 2 20 per cent to 2030 and 30 per cent onwards,
70/80 rule
Emergency measures – lower
triggers
SHP Upgrade 2025
Option 1 Restrictions (RUN
30)
0.0 14.2 0.1 6.9 0.8 0.1
Source: SCA Wathnet model.
The Option 1 alternative restrictions regime (Run 28 compared with Run 26) has little
impact on the security of the system (minimum storage to 2030 reduced from
7.1 per cent to 6.9 per cent) as does the Option 2 regime (minimum storage to 2030
increased from 7.1 per cent to 7.6 per cent). However, average time in restrictions
would decline markedly under a scenario which imposes Option 1 restrictions, but
would actually increase significantly under Option 2 restrictions.
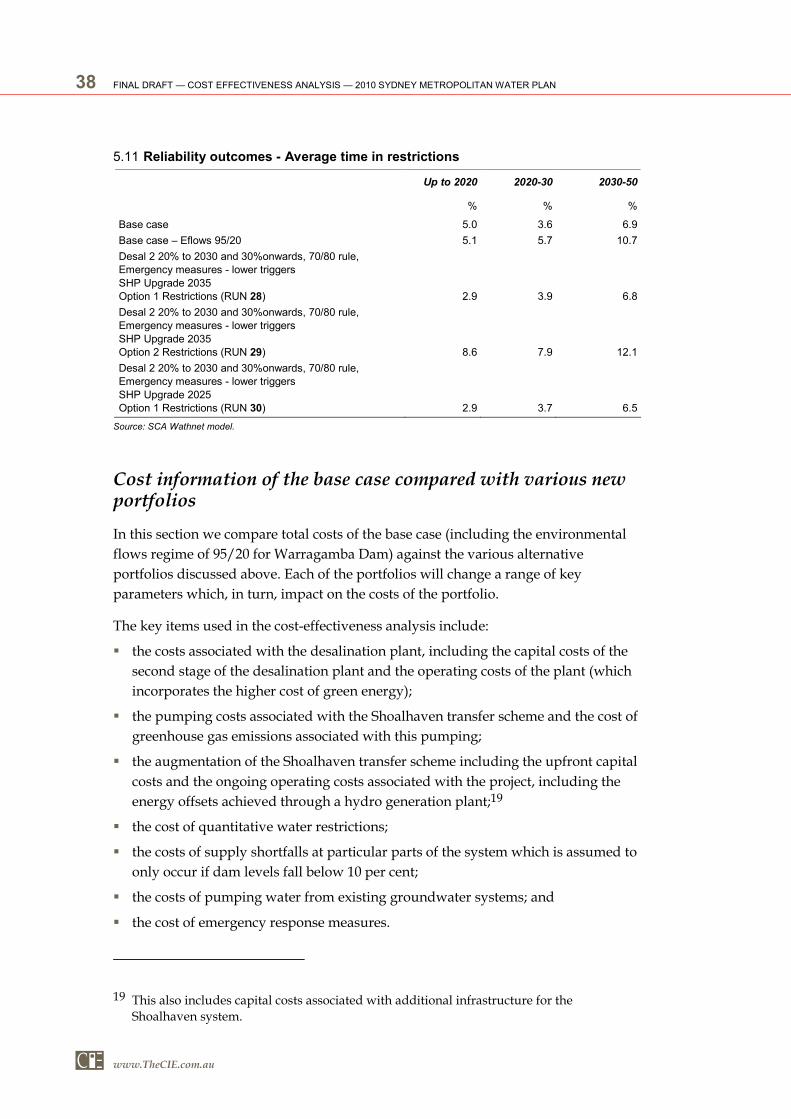
38 FINAL DRAFT — COST EFFECTIVENESS ANALYSIS — 2010 SYDNEY METROPOLITAN WATER PLAN
www.TheCIE.com.au
5.11 Reliability outcomes - Average time in restrictions
Up to 2020 2020-30 2030-50
% % %
Base case 5.0 3.6 6.9
Base case – Eflows 95/20 5.1 5.7 10.7
Desal 2 20% to 2030 and 30%onwards, 70/80 rule,
Emergency measures - lower triggers
SHP Upgrade 2035
Option 1 Restrictions (RUN 28) 2.9 3.9 6.8
Desal 2 20% to 2030 and 30%onwards, 70/80 rule,
Emergency measures - lower triggers
SHP Upgrade 2035
Option 2 Restrictions (RUN 29) 8.6 7.9 12.1
Desal 2 20% to 2030 and 30%onwards, 70/80 rule,
Emergency measures - lower triggers
SHP Upgrade 2025
Option 1 Restrictions (RUN 30) 2.9 3.7 6.5
Source: SCA Wathnet model.
Cost information of the base case compared with various new portfolios
In this section we compare total costs of the base case (including the environmental
flows regime of 95/20 for Warragamba Dam) against the various alternative
portfolios discussed above. Each of the portfolios will change a range of key
parameters which, in turn, impact on the costs of the portfolio.
The key items used in the cost-effectiveness analysis include:
� the costs associated with the desalination plant, including the capital costs of the
second stage of the desalination plant and the operating costs of the plant (which
incorporates the higher cost of green energy);
� the pumping costs associated with the Shoalhaven transfer scheme and the cost of
greenhouse gas emissions associated with this pumping;
� the augmentation of the Shoalhaven transfer scheme including the upfront capital
costs and the ongoing operating costs associated with the project, including the
energy offsets achieved through a hydro generation plant;19
� the cost of quantitative water restrictions;
� the costs of supply shortfalls at particular parts of the system which is assumed to
only occur if dam levels fall below 10 per cent;
� the costs of pumping water from existing groundwater systems; and
� the cost of emergency response measures.
19 This also includes capital costs associated with additional infrastructure for the Shoalhaven system.

FINAL DRAFT — COST EFFECTIVENESS ANALYSIS — 2010 SYDNEY METROPOLITAN WATER PLAN 39
www.TheCIE.com.au
An explanation of how each of these cost elements is calculated is provided in
Appendices E and F. For a large number of these costs, we have relied on cost
information provided by the various NSW water agencies.
Chart 5.12 below presents the total costs of the alternative portfolios. The costs reflect
the probability weighted net present value of the costs at different points in time up
to 2050 using a seven per cent discount rate. 20
It is important to note that the base case portfolio is not strictly comparable to the
other portfolios modelled because it doesn’t include the revised environmental flow
regime. However, we have presented it in the chart below to illustrate the impact on
the portfolio costs of including the revised flow regime.
5.12 Probability weighted net present value of alternative portfolios up to 2050 (2009/10 dollars)
-
200
400
600
800
1,000
1,200
1,400
1,600
1,800
2,000
Base case
Base case (Eflows) R13
R15
R17
R18
R19
R20
R21
R22
R26
R27
R28
R29
R30
million$
-
200
400
600
800
1,000
1,200
1,400
1,600
1,800
2,000
Base case
Base case (Eflows) R13
R15
R17
R18
R19
R20
R21
R22
R26
R27
R28
R29
R30
million$
Data source: The CIE. Calculations.
In the next chapter we compare the alternative portfolios on security and cost
grounds.
20 The term probability weighted NPV is used to indicate that cost predictions are based on the probabilistic outputs of the WATHNET model. For example, the second stage of desalination might be triggered in only several of 2000 replicates modelled within a Run, and so the modelled NPV cost for this component is relatively low due to the low probability of this event occurring.

40 FINAL DRAFT — COST EFFECTIVENESS ANALYSIS — 2010 SYDNEY METROPOLITAN WATER PLAN
www.TheCIE.com.au
6 Ranking of portfolios
The information presented in the previous section illustrates the different
characteristics of each of the portfolios in terms of security, reliability and cost. The
reliability of the water supply system is implicitly incorporated into the cost using
the cost of drought water restrictions. For the cost effectiveness analysis the key
characteristics are, therefore, the cost and security of the portfolios. This chapter
compares the portfolios according to their cost and security characteristics.
Where the impacts have not been explicitly valued and included into the costs, these
characteristics also need to be considered. These primarily relate to the
environmental and social impacts which are the topic of the next chapter.
Overview of ranking approach
As discussed, our approach to ranking the portfolios involves three steps.
The first step is to exclude those portfolios that do not meet the specified security
criterion. A criterion of five per cent of storage levels for the period up to 2030 is
used. It was acknowledged that new measures (in addition to those modelled in this
study) would be required in order to meet the criterion over a longer term period.
There is significant uncertainty regarding these new measures and the associated
costs. Given this, the medium term period up to 2030 was chosen for the ranking of
alternative portfolios.
The second step is to rank those portfolios that have successfully passed the first
hurdle. We retain portfolios that clearly dominate others on cost and security
grounds. However, where there is no clear dominance, we retain these portfolios for
further consideration in the final step.
The final step involved incorporating additional information on environmental and
social impacts to examine how this additional information changes the rankings of
the portfolios selected in step 2.
Step 1 Excluding portfolios based on security criterion
Table 6.1 below details the probability weighted net present value of costs to 2050
and minimum storage levels achieved up to 2030.
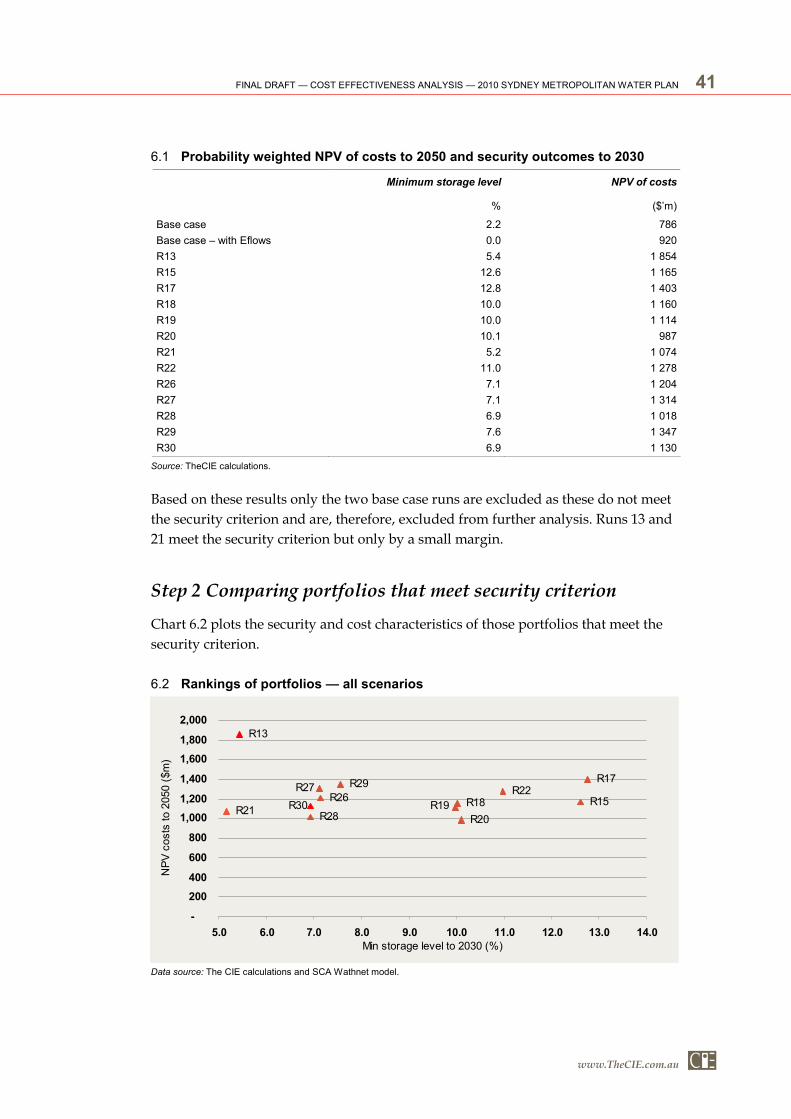
FINAL DRAFT — COST EFFECTIVENESS ANALYSIS — 2010 SYDNEY METROPOLITAN WATER PLAN 41
www.TheCIE.com.au
6.1 Probability weighted NPV of costs to 2050 and security outcomes to 2030
Minimum storage level NPV of costs
% ($’m)
Base case 2.2 786
Base case – with Eflows 0.0 920
R13 5.4 1 854
R15 12.6 1 165
R17 12.8 1 403
R18 10.0 1 160
R19 10.0 1 114
R20 10.1 987
R21 5.2 1 074
R22 11.0 1 278
R26 7.1 1 204
R27 7.1 1 314
R28 6.9 1 018
R29 7.6 1 347
R30 6.9 1 130
Source: TheCIE calculations.
Based on these results only the two base case runs are excluded as these do not meet
the security criterion and are, therefore, excluded from further analysis. Runs 13 and
21 meet the security criterion but only by a small margin.
Step 2 Comparing portfolios that meet security criterion
Chart 6.2 plots the security and cost characteristics of those portfolios that meet the
security criterion.
6.2 Rankings of portfolios — all scenarios
R15
R17
R18
R20
R22R26
R28
R29
R13
R21 R19
R27
R30
-
200
400
600
800
1,000
1,200
1,400
1,600
1,800
2,000
5.0 6.0 7.0 8.0 9.0 10.0 11.0 12.0 13.0 14.0
Min storage level to 2030 (%)
NPV costs to 2050 ($m)
Data source: The CIE calculations and SCA Wathnet model.

42 FINAL DRAFT — COST EFFECTIVENESS ANALYSIS — 2010 SYDNEY METROPOLITAN WATER PLAN
www.TheCIE.com.au
It is apparent from the chart there are a number of clearly dominant portfolios on
cost and security grounds:
� Run 20 have lower cost and better security outcomes than all portfolios to its left
(that is, all portfolios except Run 22, 15 and 17). Run 20, therefore, is consider to
dominate the portfolios to its left in the chart above.
� Run 15 offers greater security and at a lower cost than Run 22. Run 15 also offers
similar security to Run 17, but at a significantly lower cost. Run 15 is, therefore,
preferred to Runs 17 and 22.
This leaves Runs 15 and 20 as preferred portfolios based on security and cost. It is not
possible for us to distinguish between these two portfolios given that there is limited
information of the risk preferences of consumers. With detailed information on risk
preferences it would be possible to analyse whether consumers would be willing to
pay for the additional levels of security offered by Runs 15 compared with Run 20.
It should be noted that Runs 15 and 20 rely on triggering the water usage targets
when dam levels reach 35 per cent. There is significant uncertainty regarding the
potential water savings that could be achieved through these water usage targets.
Therefore, an alternative portfolio such as Run 28 (that does not rely as heavily on
the water usage targets) should also be considered.
Run 28 has similar costs to Run 20 but lower security. However, if the assumed
savings from the water usage targets could not be achieved then Run 20 would
achieve a lower security outcome and higher cost than presented in the chart above.
Given this, we believe that Run 28 should also be considered as part of the set of
dominant portfolios on cost and security grounds.
In the next chapter we consider which portfolios rank highest on environmental and
social characteristics.
FINAL DRAFT — COST EFFECTIVENESS ANALYSIS — 2010 SYDNEY METROPOLITAN WATER PLAN 43
www.TheCIE.com.au
7 Environmental and social impacts
In the analysis presented in previous chapters we have not sought to quantify and
place values on the environmental and social impacts of alternative portfolios.21 The
reason for this approach is that it is largely to the limited information available to
value these impacts. Given this, we have relied on the findings of the panel of experts
that have been formed to evaluate the potential environmental and social impacts of
alternative portfolios.22
It should be noted that given the timing of their assessment, the Expert
Environmental Panel (EEP) was not able to directly consider portfolios modelled
beyond Run 27 (that is Runs 28, 29 and 30 which looked at alternative restrictions
regimes). Similarly, the timing also limited the ability of the Expert Social Panel (ESP)
to consider the social impacts of Run 30. In the situations where the expert panels
had not reviewed the portfolio, the NSW Office of Water has interpreted the
potential environmental and social impacts of these portfolios based on the key
similarities between the assessed and unassessed runs.
This chapter reports some of the key physical changes resulting from each of the
portfolios. It also draws together the conclusions of the social and environmental
panels that have been separately tasked with reporting on the potential
environmental and social impacts of alternative portfolios.
Overview of approach to incorporating environmental and social impacts
In the previous chapter we presented those portfolios that were dominant according
to cost and security outcomes.
Given that the environmental and social panels have relied on qualitative analysis
with different scoring systems (discussed further below), it is difficult to use this
information where there are significant differences between the cost and security
21 The exception to this is the impact associated with the greenhouse gas emissions.
22 It is important to note that the social impacts of water restrictions have already been quantified and incorporated into the costs discussed in the previous chapter. Therefore, care must be taken to ensure that there is no double counting of the social impacts of water restrictions as part of this chapter.

44 FINAL DRAFT — COST EFFECTIVENESS ANALYSIS — 2010 SYDNEY METROPOLITAN WATER PLAN
www.TheCIE.com.au
outcomes of the final portfolios. That is, the information from the environmental and
social panels can inform the likely direction of change (for example, whether a
portfolio has a positive or negative environmental impact). However, it does not
provide information on the order of magnitude of this change.
Given this, we have presented the findings of the environmental and social panels
and compare this against the portfolio rankings based on cost and security outcomes
(presented in the previous chapter). This will allow a more limited range of portfolios
that can be considered by decision makers taking account any further information
that may come to bear such as the community’s willingness to pay for additional
levels of security.
Expert Environmental Panel assessment
In this section we summarise the approach adopted by the EEP and their findings on
preferred portfolios. A detailed description of the approach is provided in the EEP’s
report.
Overview of approach
There are a wide range of environmental impacts that cannot be easily quantified
and included in the portfolio costs associated with each of the options. These include,
for example:
� physical and chemical conditions in aquatic and terrestrial environments;
� high conservation status species and ecological communities listed under
legislation;
� high conservation value habitats and landscapes recognised as National Parks,
protected areas and reserves; and
� long-term ecosystem functioning.
The EEP compared the various portfolios using a multi-criteria analysis comprising
the four criteria listed above. Greenhouse gas impacts of the portfolios were not
considered by the EEP as relevant carbon costs were included in the financial
analysis. The following weightings were given to each of the four criteria as shown in
Table 7.1.

FINAL DRAFT — COST EFFECTIVENESS ANALYSIS — 2010 SYDNEY METROPOLITAN WATER PLAN 45
www.TheCIE.com.au
7.1 Criteria and weighting adopted
Criteria Weighting
Physical and chemical changes due to management actions, principally driven by river flows 22
Ecological status of populations and communities listed under threatened species and environmental protection legislation;
45
Ecological status of habitats and ecosystems with conservation value recognised through land-use classification and zoning
17
Overall, long-term ecosystem functioning, including resilience and stability. 16
Source: Expert Environmental Panel.
Weighted scores were then allocated for each portfolio in seven different areas. The
weightings were not applied based on the size of the areas. Rather, areas were chosen
to reflect where the major environmental impacts or benefits were expected to occur
under the various options.
The EEP used two primary timeframes for comparing environmental performance –
from 2010 to 2020, and from 2020 to 2030.
Performance on these four criteria was scored using a standard risk assessment
approach characterising risk as a combination of likelihood and consequence. In
particular, for consequence, a range of -3 for negative impacts to +3 for positive
benefits was used while the four categories of likelihood employed were (1) Very
likely, (2) Likely (3) Unlikely. Scores were assigned relative to the Base Case.
The key data used in the assessment of the performance of options on the four
criteria were:
� percentage of time Shoalhaven transfers were operating over 2010-2020 and 2020-
2030;
� percentage of time desalination was operating over 2010-2020 and 2020-2030; and
� percentages of time emergency drought measures were in operation over 2010-
2020 and 2020-2030.
Findings
It should be noted that given the timing of their assessment, the EEP was not able to
directly consider portfolios modelled beyond Run 27 (that is Runs 28, 29 and 30
which looked at alternative restrictions regimes). However, the Office of Water has
interpreted the results based on the key similarities between the assessed and
unassessed runs and advised TheCIE of the following:
� Runs 28 and 29 can be considered to have scored the same as Run 26.
� Run 30 can be considered to have scored the same as Run 27.
These runs are shown in the following discussion in brackets to indicate where
results have been extrapolated by the Office of Water. The EEP also considered
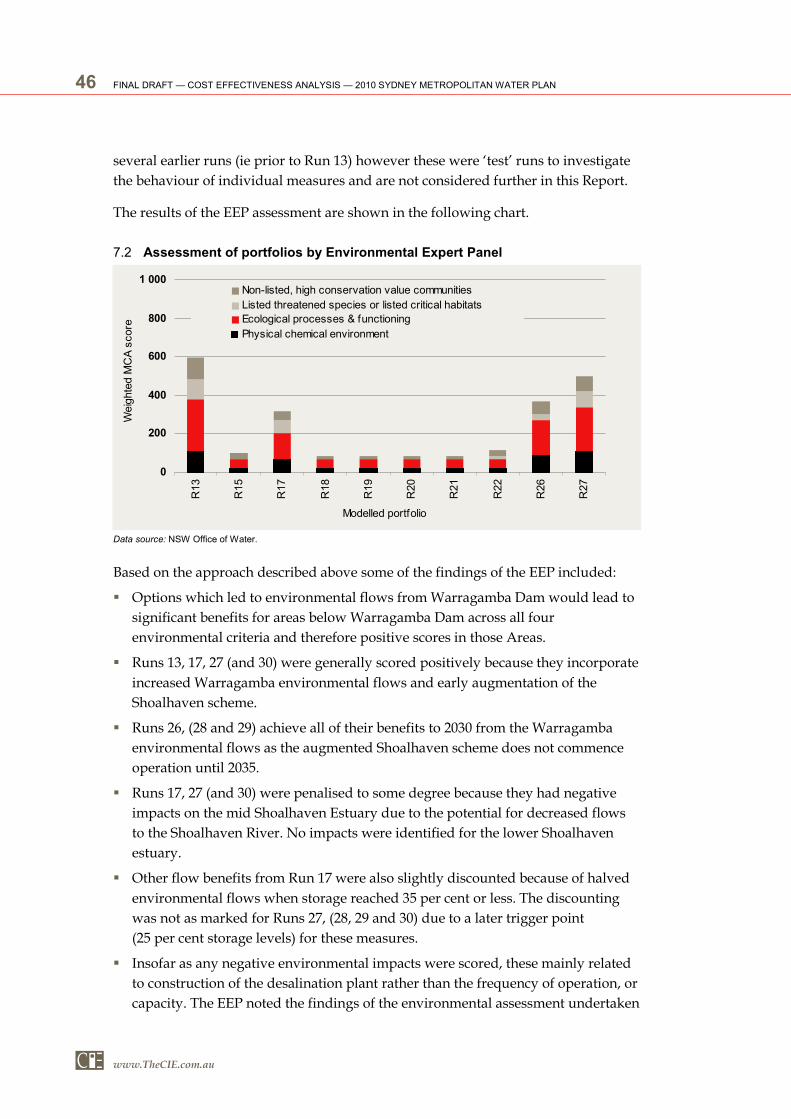
46 FINAL DRAFT — COST EFFECTIVENESS ANALYSIS — 2010 SYDNEY METROPOLITAN WATER PLAN
www.TheCIE.com.au
several earlier runs (ie prior to Run 13) however these were ‘test’ runs to investigate
the behaviour of individual measures and are not considered further in this Report.
The results of the EEP assessment are shown in the following chart.
7.2 Assessment of portfolios by Environmental Expert Panel
0
200
400
600
800
1 000
R13
R15
R17
R18
R19
R20
R21
R22
R26
R27
Modelled portfolio
Weighted MCA score
Non-listed, high conservation value communities
Listed threatened species or listed critical habitats
Ecological processes & functioning
Physical chemical environment
Data source: NSW Office of Water.
Based on the approach described above some of the findings of the EEP included:
� Options which led to environmental flows from Warragamba Dam would lead to
significant benefits for areas below Warragamba Dam across all four
environmental criteria and therefore positive scores in those Areas.
� Runs 13, 17, 27 (and 30) were generally scored positively because they incorporate
increased Warragamba environmental flows and early augmentation of the
Shoalhaven scheme.
� Runs 26, (28 and 29) achieve all of their benefits to 2030 from the Warragamba
environmental flows as the augmented Shoalhaven scheme does not commence
operation until 2035.
� Runs 17, 27 (and 30) were penalised to some degree because they had negative
impacts on the mid Shoalhaven Estuary due to the potential for decreased flows
to the Shoalhaven River. No impacts were identified for the lower Shoalhaven
estuary.
� Other flow benefits from Run 17 were also slightly discounted because of halved
environmental flows when storage reached 35 per cent or less. The discounting
was not as marked for Runs 27, (28, 29 and 30) due to a later trigger point
(25 per cent storage levels) for these measures.
� Insofar as any negative environmental impacts were scored, these mainly related
to construction of the desalination plant rather than the frequency of operation, or
capacity. The EEP noted the findings of the environmental assessment undertaken

FINAL DRAFT — COST EFFECTIVENESS ANALYSIS — 2010 SYDNEY METROPOLITAN WATER PLAN 47
www.TheCIE.com.au
for the planning of the plant, including only very minor localised impacts on fish
larvae and the reef.
In other words, the impact of the various options on environmental flows to key river
systems was a major driver of the scoring on the four criteria. The EEP also
commented that ‘Measures and options that maintained ecological conditions were
preferable to those that resulted in a worsening situation that would have to be
redeemed at a later time. A negative impact, even for a short time, may require a
long recovery period, so measures such as reducing environmental flows during
severe drought contributed to lower scores in the assessments’.
On balance the EEP concluded that Runs 13, 27 (and 30) were regarded as the best
performing portfolios assessed.
Expert Social Panel assessment
An ESP was established to provide a quantitative and qualitative assessment of non-
monetised social considerations.
Overview of approach
The ESP based its assessment on:
� a review of social research literature;
� the findings of Phase 1 and Phase 2 of the community consultation for the Review;
and
� the prior knowledge and experience of the ESP members and, in the case of the
government members, their agencies.
Through the steps listed above, key social values were identified as criteria for
assessing the portfolios under consideration. Workshops were then held where the
ESP grouped the social considerations under key categories and undertook a detailed
ranking exercise to ascribe a weighting to each category and the values attributed to
it. The values aligned under each category were also scored in relation to each other
and the means aggregated and multiplied by the category rating to provide an
overall weighting for each value. Finally, the resulting social values with their
weighted scores were grouped into those values that could be categorised as
‘Community planning principles’ and those that could be categorised as
‘Community’s planning actions’.
However, ultimately only the social values grouped under ‘Community planning
principles’ were used in the ranking assessments made by the ESP. Specifically, the
ESP examined 10 of the options (namely runs 12, 13, 15, 17, 20, 21, 26, 27, 28, and 29)
against the Base Case to produce a ranked order of selected portfolios by scoring
each portfolio against the 13 Community Planning Principles (CPP).

48 FINAL DRAFT — COST EFFECTIVENESS ANALYSIS — 2010 SYDNEY METROPOLITAN WATER PLAN
www.TheCIE.com.au
Run 30 was not available for analysis at the time the ESP met. However, the Office of
Water has interpreted the results based on the key similarities between the assessed
and unassessed runs and advised TheCIE that Run 30 can be interpreted in the
analysis to have scored slightly higher than Run 28 – ie an upper mid ranking against
the other portfolios.
Options were scored -1 against a social value embodied in the CPP list if it was
considered a negative change when compared with the Base Case, 0 where there was
no change and +1 to indicate a positive change based on the social value. The CPP
list is set out below along with the weight attached to each social value in the list.
7.3 Community Planning Principles
Criteria Weight
Provide water that is safe to drink 10.4
Balance human and environmental needs - one not more important than the other 5.9
Ensure a dependable water supply 5.8
Maximise water recycling, especially capturing stormwater 5.2
Restore clean healthy waterways and reduce pollution 5.1
Maximise efficient water use, enforce Water Wise Rules or introduce restrictions if needed 4.8
Ensure the Government and the community jointly take responsibility for water management 4.2
Ensure healthy catchments to support healthy rivers 4.2
Ensure everyone has access to affordable water for basic living needs 4.2
Share water fairly to meet the needs of all sectors of the community 3.6
Invest in planning and research for long-term, innovative solutions 3.4
Ensure Sydney's supply is not at the expense of other regions and catchment communities 3.3
Manage water sources within sustainable limits 3.1
Source: Expert Social Panel.
The ESP noted problems assessing performance on some of the social values on the
CPP list. For instance, several could not be applied to the portfolios under
examination because the portfolios did not specifically address that community
value. Similarly, some social values could not apply because the value was assumed
for the Plan as a whole but not the subject of an individual portfolio, such as ‘Provide
water that is safe to drink’. In addition, some issues of importance to the community
were not captured within the portfolios being considered, such as innovation.
Summary of results from social assessment
The results of the ESP’s assessment are summarised in the table below. The portfolio
ranked highest by the ESP was Run 20. This portfolio ranked highest because water
usage targets were activated five per cent before the desalination upgrade was
triggered and it contains Warragamba environmental flows. Run 15 was equal first.
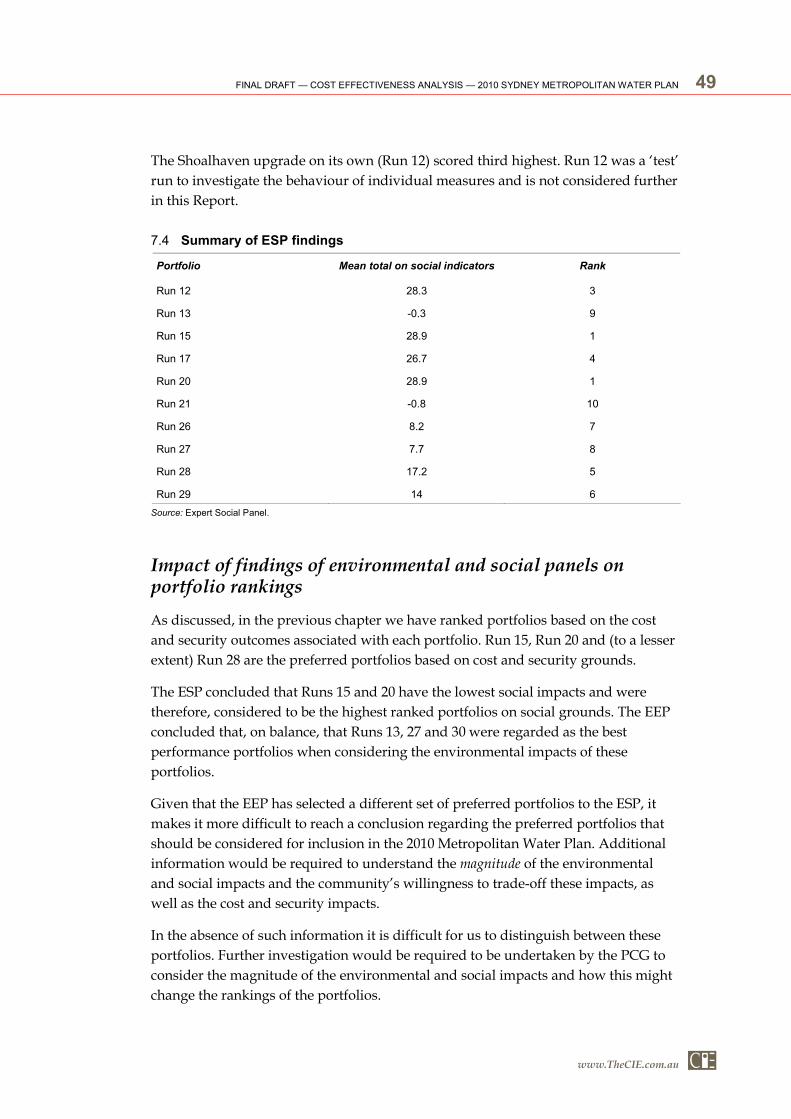
FINAL DRAFT — COST EFFECTIVENESS ANALYSIS — 2010 SYDNEY METROPOLITAN WATER PLAN 49
www.TheCIE.com.au
The Shoalhaven upgrade on its own (Run 12) scored third highest. Run 12 was a ‘test’
run to investigate the behaviour of individual measures and is not considered further
in this Report.
7.4 Summary of ESP findings
Portfolio Mean total on social indicators Rank
Run 12 28.3 3
Run 13 -0.3 9
Run 15 28.9 1
Run 17 26.7 4
Run 20 28.9 1
Run 21 -0.8 10
Run 26 8.2 7
Run 27 7.7 8
Run 28 17.2 5
Run 29 14 6
Source: Expert Social Panel.
Impact of findings of environmental and social panels on portfolio rankings
As discussed, in the previous chapter we have ranked portfolios based on the cost
and security outcomes associated with each portfolio. Run 15, Run 20 and (to a lesser
extent) Run 28 are the preferred portfolios based on cost and security grounds.
The ESP concluded that Runs 15 and 20 have the lowest social impacts and were
therefore, considered to be the highest ranked portfolios on social grounds. The EEP
concluded that, on balance, that Runs 13, 27 and 30 were regarded as the best
performance portfolios when considering the environmental impacts of these
portfolios.
Given that the EEP has selected a different set of preferred portfolios to the ESP, it
makes it more difficult to reach a conclusion regarding the preferred portfolios that
should be considered for inclusion in the 2010 Metropolitan Water Plan. Additional
information would be required to understand the magnitude of the environmental
and social impacts and the community’s willingness to trade-off these impacts, as
well as the cost and security impacts.
In the absence of such information it is difficult for us to distinguish between these
portfolios. Further investigation would be required to be undertaken by the PCG to
consider the magnitude of the environmental and social impacts and how this might
change the rankings of the portfolios.

50 FINAL DRAFT — COST EFFECTIVENESS ANALYSIS — 2010 SYDNEY METROPOLITAN WATER PLAN
www.TheCIE.com.au
Given that the preferred ranking of the portfolios on cost and security grounds is
similar to ESP we believe that this is the most useful starting point. We would
recommend that the following runs be considered for further investigation:
� Runs 15 and 17 are similar portfolios, the only difference being that Run 17
includes the additional investment in upgrading the Shoalhaven transfer scheme
in 2024. Run 17 offers similar security outcomes but cost approximately
$200 million more than Run 15. Run 17 would be preferred to Run 15 if the
environmental and social benefits associated with the Shoalhaven transfer scheme
are greater than the $200 million cost differential.
� Run 20 does not include upgrading the Shoalhaven transfer scheme which is
considered to have both positive environmental and social impacts. Run 18 has
similar cost and security outcomes as Run 20, but also include upgrading the
transfer scheme in 2034. Although this is later in the period, it is possible that Run
18 would be preferred to Run 20, once the environmental and social factors are
incorporated.
� Runs 28 and 30 do not rely as heavily on the water usage targets, as these are
triggered at a lower storage level. The difference between these portfolios is the
earlier commencement of investment to upgrade the Shoalhaven transfer scheme.
If the earlier commencement of this investment results is substantially lower
environmental and social impacts then Run 30 may be preferred to Run 28.
Based on this, there are six portfolios (Runs 15, 17, 18, 20, 28 and 30) that should be
considered for inclusion in the 2010 Metropolitan Water Plan.
These portfolios highlight the tradeoff that exists between the level of security of a
portfolio and social, environment and financial cost of achieving this security. A
more secure portfolio is generally more expensive. Without further information on
the risk preferences of consumers, it is difficult to differentiate between these
portfolios on cost and security alone. Further, without information on the magnitude
of the environmental and social impacts associated with each portfolio and
information on the community’s willingness to tradeoff these factors it is difficult to
draw more firm conclusions regarding the preferred portfolios.
Policy makers may also be able to differentiate between these portfolios by reviewing
the robustness of some of the underlying assumptions in the model. For example, the
security benefits offered by Run 18 relies on the relatively early implementation of
personal water usage targets (at around 35 per cent total system storage) that are
assumed to deliver savings of 22 per cent (when combined with the other levels of
water restrictions) however, these have not been discretely costed. To the extent that
this savings assumption is not achieved it would reduce the security advantages of
this portfolio.
The portfolios also highlight the benefits of the new alternative restrictions regime
commencing at 50 per cent storage levels compared with 55 per cent. This regime has

FINAL DRAFT — COST EFFECTIVENESS ANALYSIS — 2010 SYDNEY METROPOLITAN WATER PLAN 51
www.TheCIE.com.au
been modelled in runs 28 and 30. By keeping the average amount of time the
community is in restrictions to around 3 per cent, significant cost savings can be
achieved with little effect on system security. This can be expected to change beyond
around 2025 when rising demand places increasing pressure on the system.23
23 The reliability criterion in the SCA’s Operating Licence is likely to be considered further as part of the next Licence review.
52 FINAL DRAFT — COST EFFECTIVENESS ANALYSIS — 2010 SYDNEY METROPOLITAN WATER PLAN
www.TheCIE.com.au
8 Conclusions
The modelling result from this project indicates that, under the base case, Sydney’s
water supplies are secure over the next 10 years. The system is expected to meet the
security (minimum storage levels reached) and the reliability criteria (average time in
restrictions) embedded in the SCA’s operating licence. Over this period modelling
has indicated the minimum storage level reached is 5.5 per cent in an extreme
drought. This is based on the existing portfolio of Government commitments under
the Plan, including the planning assumption that the operation of the 250ML per day
desalination plant is triggered when dam levels drop below 70 per cent of total
capacity.
It should be noted that the conclusion is based on the wide range of rainfall/inflow
scenarios modelled by the SCA. This includes worse droughts than that experienced
in the 1940s and the recent drought. Nevertheless, it is possible that worse droughts
than these may occur in the near future which would place greater pressure on water
security. Further, it is possible that demand is greater than projected in this project
which would also place greater pressure on the security of supply.
Therefore, while supplies are considered to be secure over the next 10 years it is still
important to continue to monitor storage levels and trends in demand and to have in
place contingency measures that can be implemented over a relatively short
timeframe such as the second stage of desalination and the response measures for
extreme drought considered in this report.
In the medium term (defined in this study as 2020 to 2030), there is expected to be
greater pressures on the reliability and security of the water supply system due to the
revised environmental flows regime and as demand begins to increase. Additional
measures are likely to be required to meet these medium term pressures, particularly
in light of uncertainties around climate change and its impact on supply and
demand.
In the longer term, the increasing demand due to population growth will place
significant pressure on the water supply system which will decrease the reliability
and security of the system. This could be further exacerbated by climate change
impacts.
There is a range of options currently available to address the short and medium term.
In the longer term, however, a range of new measures will need to be considered.

FINAL DRAFT — COST EFFECTIVENESS ANALYSIS — 2010 SYDNEY METROPOLITAN WATER PLAN 53
www.TheCIE.com.au
This analysis has assessed more than 20 unique portfolios (‘Runs’) to determine the
most appropriate mix of measures to ensure a secure supply of water for Sydney into
the future.
There are group of six preferred portfolios (Runs 15, 17, 18, 20, 28 and 30) that have
emerged from this analysis. Each of these portfolios involve upscaling the
desalination plant (at low dam levels), combined with measures for deployment in
extreme drought. Each of these portfolios has slightly different cost and security
characteristics, as well as offering different environmental and social outcomes.
Runs 15 and 20 do not include additional investment in the Shoalhaven transfer
scheme. If it is considered that the quantum of water secured, the environmental and
social benefits of these projects and longer term water security benefits are
sufficiently large then Runs 17 and 18 may be preferred.
The portfolios with the alternative restrictions regime triggered at 50 per cent total
system storage (Runs 28 and 30) offer lower costs to Run 18 due to the reduced
average time in restrictions. There is also not a significant loss in security by adopting
the lower levels of restrictions. Although the modelling indicates that a change to the
restrictions regime might not be strictly necessary until 2020, the lower costs to the
community are such that it should be considered as part of the 2010 Plan.
Run 18 offers increased security benefits due to the earlier commencement of extreme
drought measures, however Runs 28 and 30 with a later commencement are also
secure. Further work to confirm the likely savings from these measures is needed
along with further assessment of appropriate triggers should storage levels drop to
an identified level, say, below 40 per cent (<2 per cent chance to 2025).
Further investigation by the PCG would be required to assist in filtering these
portfolios further to a single portfolio for inclusion in the 2010 Metropolitan Water
Plan. It should, however, be noted that (consistent with the adaptive management
approach) each of these portfolios discussed above are sufficiently flexible to allow
further refinement of the portfolios over time. They do not lock in major investments
in the water supply system over the next few years but allow new information – such
as cost of water restrictions, impact of climate change, population growth – to be
utilised to improve understanding and develop the most cost effective portfolio over
time.

54 FINAL DRAFT — COST EFFECTIVENESS ANALYSIS — 2010 SYDNEY METROPOLITAN WATER PLAN
www.TheCIE.com.au

Append i x e s


COST EFFECTIVENESS ANALYSIS — 2010 SYDNEY METROPOLITAN WATER PLAN 57
Cabinet-in-confidence www.TheCIE.com.au
A Existing commitments
� Assessment based on inflow hydrology from 1909-2008.
� Desalination module 1 250 ML/d:
– Run continuously from 1 Jan 2010 to 31 December 2011 (noting start time now
around April 2010 – this will not effect hydrology).
– From 2012:
… On when total storage <70 per cent.
… Off when total storage >80 per cent.
� Environmental flows:
– 80/20 environmental flow from all four Upper Nepean dams (including Avon)
and weirs as at 1/1/2010.
– 80/20 environmental flow from Tallowa Dam (commence June 2009, assuming
restrictions are lifted).
– Current Warragamba environmental (33.3ML/d) and riparian (10 ML/d) flows
replaced by Western Sydney Recycling Scheme as at 1/1/2010. Minimum flow
of 5 ML/d to be maintained from Warragamba in the Warragamba River.
� Tallowa Dam operation:
– -1m maximum depletion, -3 maximum depletion in emergency situation.
– Shoalhaven transfer pump mark (once e-flows for Tallowa Dam start).
… On when total storage is <75 per cent.
… Off when total storage is >80 per cent.
… Shoalhaven moratorium for 3 years unless storage is <60 per cent.
� Groundwater borefields: 2 borefields commencing at 40 per cent total storage for
2-3 years.
� Deepwater access.
� Water releases and demand distribution across the water supply network
including:
– Supply to Metropolitan Sydney, Woronora and Illawarra – with spatial
variation of demand based on daily supply to water treatment plants.
– Water restrictions applied to supply during times of drought. This includes an
estimate of these restrictions on the magnitude of demand reduction achieved
during current drought (after the commencement of permanent water
conservation measures).
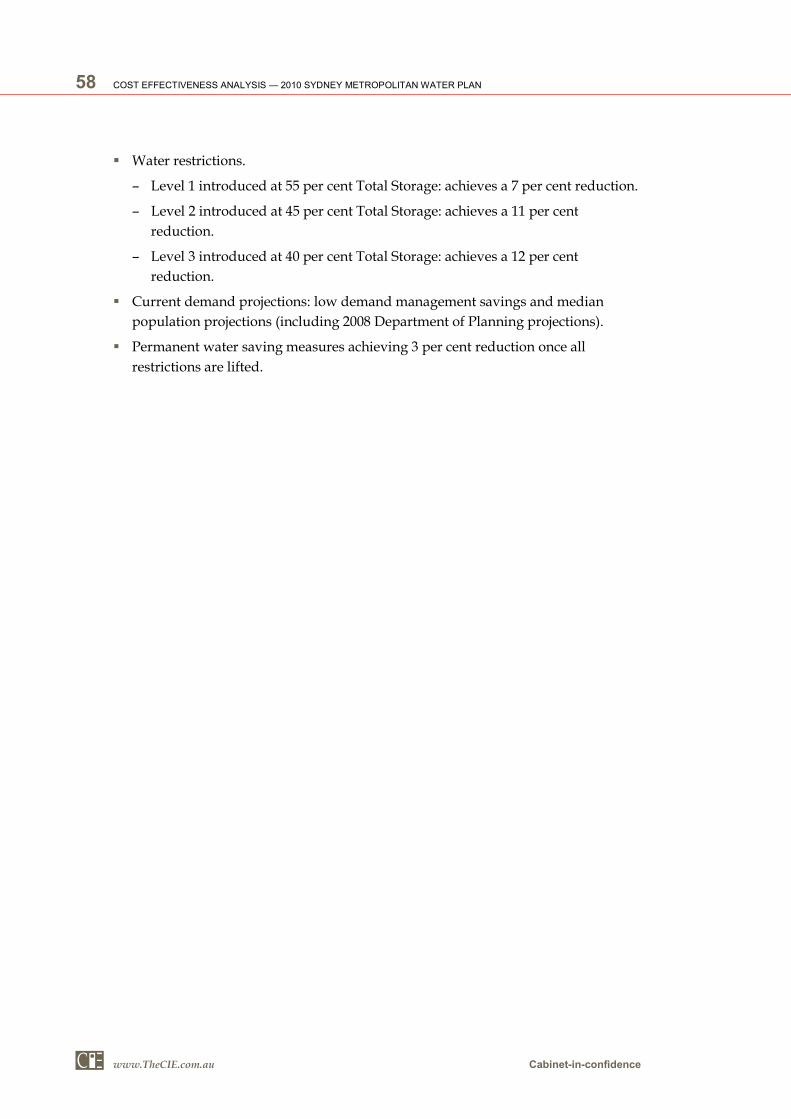
58 COST EFFECTIVENESS ANALYSIS — 2010 SYDNEY METROPOLITAN WATER PLAN
www.TheCIE.com.au Cabinet-in-confidence
� Water restrictions.
– Level 1 introduced at 55 per cent Total Storage: achieves a 7 per cent reduction.
– Level 2 introduced at 45 per cent Total Storage: achieves a 11 per cent
reduction.
– Level 3 introduced at 40 per cent Total Storage: achieves a 12 per cent
reduction.
� Current demand projections: low demand management savings and median
population projections (including 2008 Department of Planning projections).
� Permanent water saving measures achieving 3 per cent reduction once all
restrictions are lifted.

COST EFFECTIVENESS ANALYSIS — 2010 SYDNEY METROPOLITAN WATER PLAN 59
Cabinet-in-confidence www.TheCIE.com.au
B Sydney Water’s approach to forecasting future water demand
Sydney Water’s forecast demand for potable water involves three steps:
1. Forecast potable water demand without water conservation programs (‘Baseline’
demand). Baseline demand in each year is equal to the forecast population
multiplied by an assumed 426 litres per person per day potable water use.
2. Estimate the savings from water conservation (demand management, leakage
reduction and recycling) programs in each year.
3. Deduct forecast savings from water conservation programs from baseline demand
in each year.
Population forecast
Three forecasts of population to 2050 were estimated: low, medium and high.
The medium forecast is based on population forecasts developed by the New South
Wales Department of Planning (DoP), adjusted to Sydney Water’s area of operations.
The last year included in DoP’s forecast is 2036. Growth rates implicit in the
Australian Bureau of Statistics’ (ABS) medium forecast for the Sydney Statistical
Division (SD) are used to extend the DoP forecast to 2050 (ABS, 2008).24
Differences between growth rates in the ABS (2008) high, medium and low forecasts
for the Sydney SD were analysed to develop a high and low forecast. The high and
low scenarios reflect higher and lower assumptions about the main drivers of
population growth, ie fertility, life expectancy at birth, net overseas migration and
net interstate migration.
Under the medium forecast, the population served by Sydney Water grows to about
6.3 million (from about 4.3 million in 2009) in 2050. Under the low and high growth
scenarios it grows to about 6 and 6.8 million, respectively.
24 ABS, 2008. Population Projections, Australia, 2006 to 2101 (cat. no. 3222.0). Australian Bureau of Statistics, www.abs.gov.au.
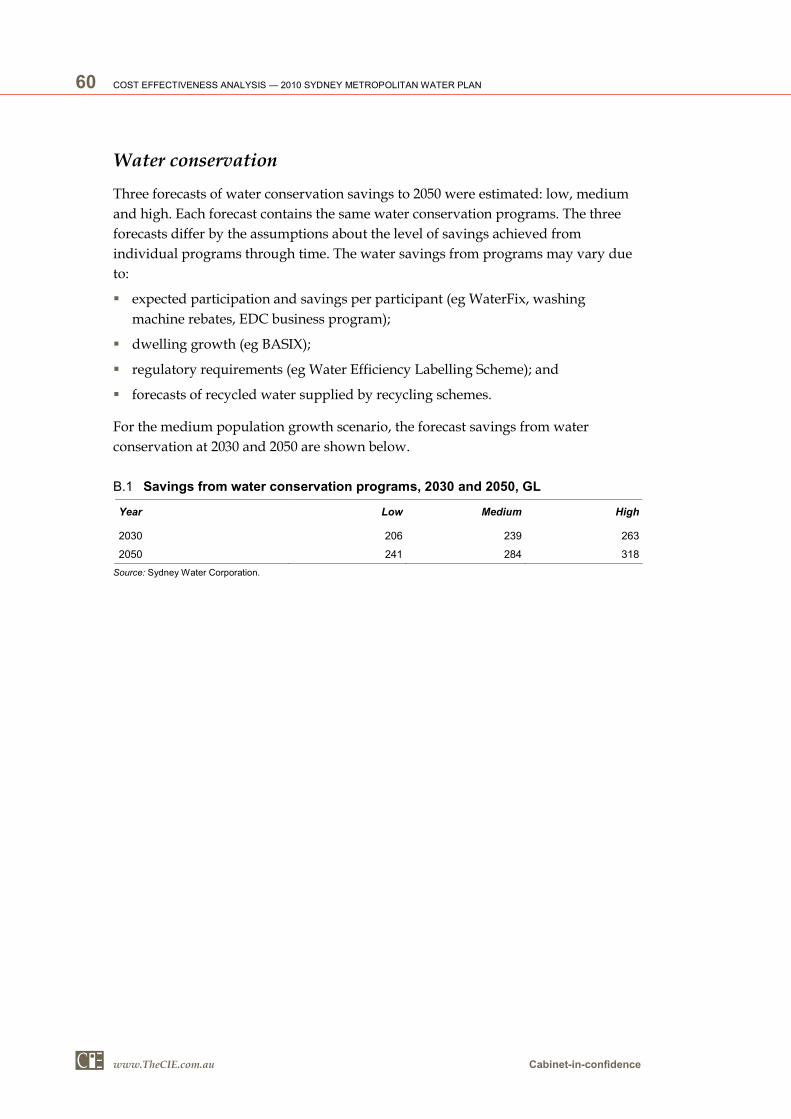
60 COST EFFECTIVENESS ANALYSIS — 2010 SYDNEY METROPOLITAN WATER PLAN
www.TheCIE.com.au Cabinet-in-confidence
Water conservation
Three forecasts of water conservation savings to 2050 were estimated: low, medium
and high. Each forecast contains the same water conservation programs. The three
forecasts differ by the assumptions about the level of savings achieved from
individual programs through time. The water savings from programs may vary due
to:
� expected participation and savings per participant (eg WaterFix, washing
machine rebates, EDC business program);
� dwelling growth (eg BASIX);
� regulatory requirements (eg Water Efficiency Labelling Scheme); and
� forecasts of recycled water supplied by recycling schemes.
For the medium population growth scenario, the forecast savings from water
conservation at 2030 and 2050 are shown below.
B.1 Savings from water conservation programs, 2030 and 2050, GL
Year Low Medium High
2030 206 239 263
2050 241 284 318
Source: Sydney Water Corporation.
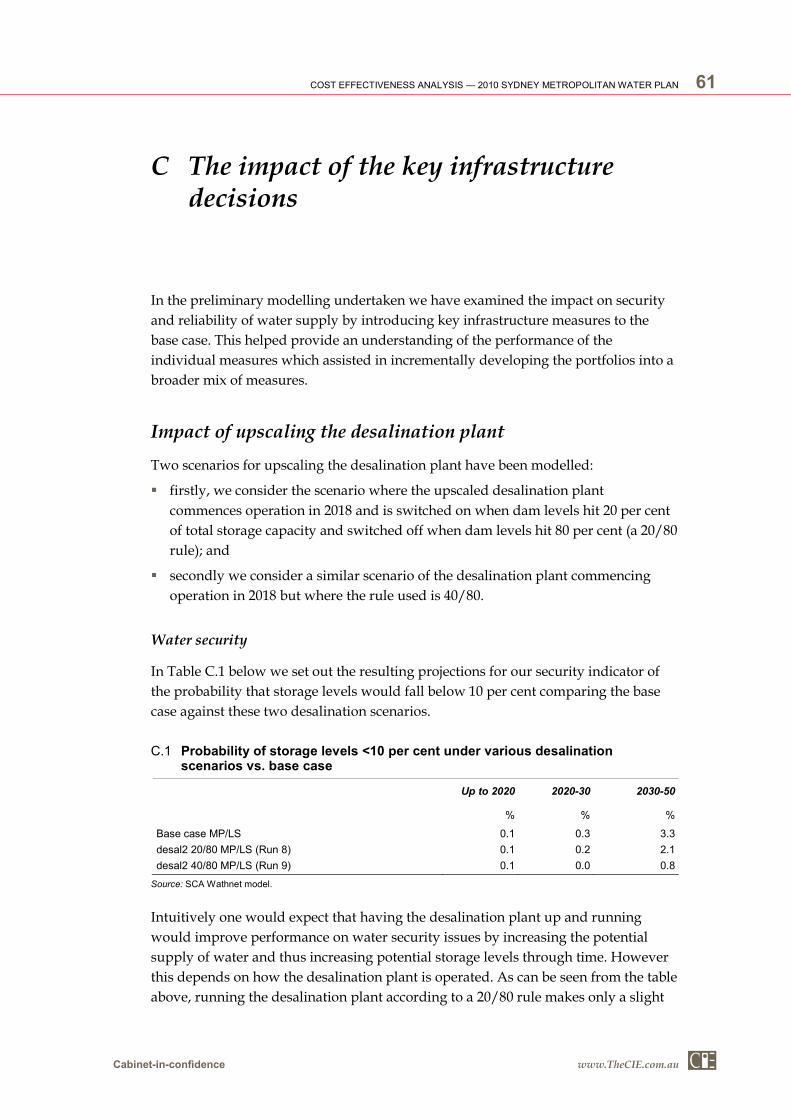
COST EFFECTIVENESS ANALYSIS — 2010 SYDNEY METROPOLITAN WATER PLAN 61
Cabinet-in-confidence www.TheCIE.com.au
C The impact of the key infrastructure decisions
In the preliminary modelling undertaken we have examined the impact on security
and reliability of water supply by introducing key infrastructure measures to the
base case. This helped provide an understanding of the performance of the
individual measures which assisted in incrementally developing the portfolios into a
broader mix of measures.
Impact of upscaling the desalination plant
Two scenarios for upscaling the desalination plant have been modelled:
� firstly, we consider the scenario where the upscaled desalination plant
commences operation in 2018 and is switched on when dam levels hit 20 per cent
of total storage capacity and switched off when dam levels hit 80 per cent (a 20/80
rule); and
� secondly we consider a similar scenario of the desalination plant commencing
operation in 2018 but where the rule used is 40/80.
Water security
In Table C.1 below we set out the resulting projections for our security indicator of
the probability that storage levels would fall below 10 per cent comparing the base
case against these two desalination scenarios.
C.1 Probability of storage levels <10 per cent under various desalination scenarios vs. base case
Up to 2020 2020-30 2030-50
% % %
Base case MP/LS 0.1 0.3 3.3
desal2 20/80 MP/LS (Run 8) 0.1 0.2 2.1
desal2 40/80 MP/LS (Run 9) 0.1 0.0 0.8
Source: SCA Wathnet model.
Intuitively one would expect that having the desalination plant up and running
would improve performance on water security issues by increasing the potential
supply of water and thus increasing potential storage levels through time. However
this depends on how the desalination plant is operated. As can be seen from the table
above, running the desalination plant according to a 20/80 rule makes only a slight
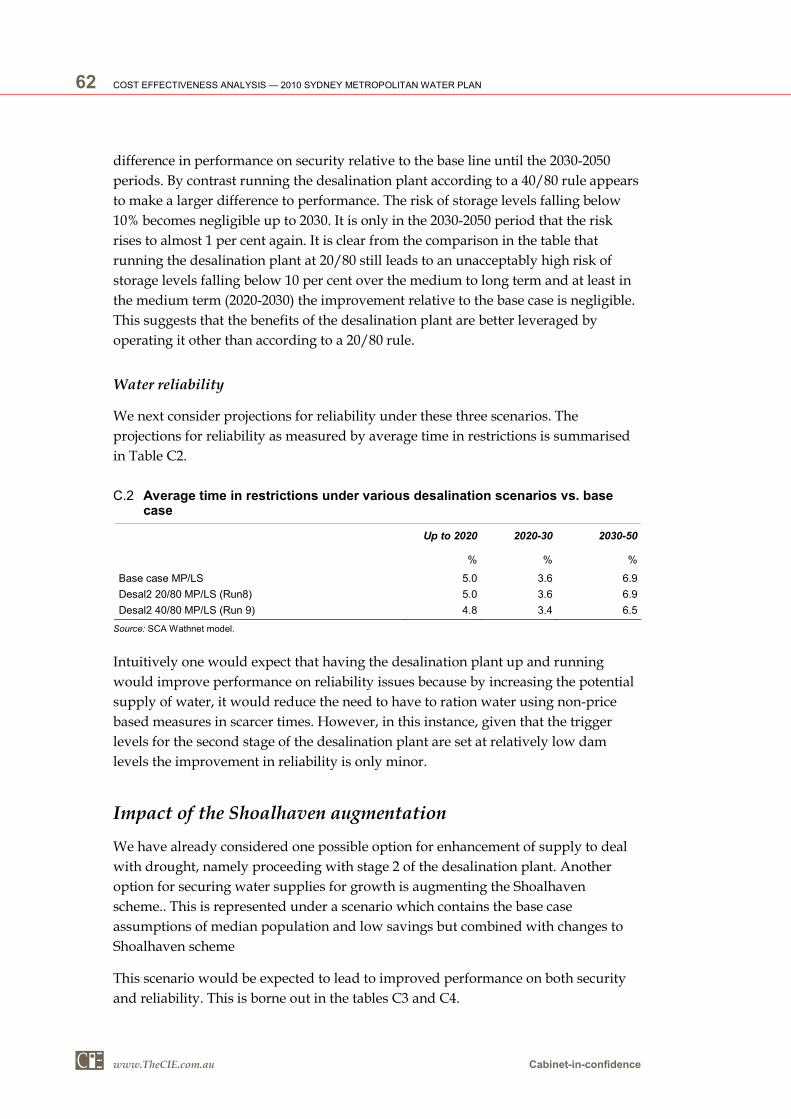
62 COST EFFECTIVENESS ANALYSIS — 2010 SYDNEY METROPOLITAN WATER PLAN
www.TheCIE.com.au Cabinet-in-confidence
difference in performance on security relative to the base line until the 2030-2050
periods. By contrast running the desalination plant according to a 40/80 rule appears
to make a larger difference to performance. The risk of storage levels falling below
10% becomes negligible up to 2030. It is only in the 2030-2050 period that the risk
rises to almost 1 per cent again. It is clear from the comparison in the table that
running the desalination plant at 20/80 still leads to an unacceptably high risk of
storage levels falling below 10 per cent over the medium to long term and at least in
the medium term (2020-2030) the improvement relative to the base case is negligible.
This suggests that the benefits of the desalination plant are better leveraged by
operating it other than according to a 20/80 rule.
Water reliability
We next consider projections for reliability under these three scenarios. The
projections for reliability as measured by average time in restrictions is summarised
in Table C2.
C.2 Average time in restrictions under various desalination scenarios vs. base case
Up to 2020 2020-30 2030-50
% % %
Base case MP/LS 5.0 3.6 6.9
Desal2 20/80 MP/LS (Run8) 5.0 3.6 6.9
Desal2 40/80 MP/LS (Run 9) 4.8 3.4 6.5
Source: SCA Wathnet model.
Intuitively one would expect that having the desalination plant up and running
would improve performance on reliability issues because by increasing the potential
supply of water, it would reduce the need to have to ration water using non-price
based measures in scarcer times. However, in this instance, given that the trigger
levels for the second stage of the desalination plant are set at relatively low dam
levels the improvement in reliability is only minor.
Impact of the Shoalhaven augmentation
We have already considered one possible option for enhancement of supply to deal
with drought, namely proceeding with stage 2 of the desalination plant. Another
option for securing water supplies for growth is augmenting the Shoalhaven
scheme.. This is represented under a scenario which contains the base case
assumptions of median population and low savings but combined with changes to
Shoalhaven scheme
This scenario would be expected to lead to improved performance on both security
and reliability. This is borne out in the tables C3 and C4.

COST EFFECTIVENESS ANALYSIS — 2010 SYDNEY METROPOLITAN WATER PLAN 63
Cabinet-in-confidence www.TheCIE.com.au
Water security
C.3 Probability of storage levels <10 per cent for base case scenario vs. Shoalhaven upgrade
Up to 2020 2020-30 2030-50
% % %
Base Case MP/LS 0.1 0.3 3.3
Shoalhaven MP/LS 2018 (Run 12) 0.1 0.3 3.1
Source: SCA Wathnet model.
Augmenting the Shoalhaven scheme does not generate improvements in water
security until the 2030-2050 period though even in that late period the improvements
are only slight, reducing the risk of low storage by 0.2 per cent.
Water reliability
C.4 Average time in restrictions for base case scenario vs. Shoalhaven upgrade
Up to 2020 2020-30 2030-50
% % %
Base Case MP/LS 5.0 3.6 6.9
Shoalhaven MP/LS 2018 (Run 12) 4.9 3.1 6.0
Source: SCA Wathnet model.
However, more noticeable improvements can be seen immediately for water
reliability. Up to the 2020 period, average time in restrictions is reduced slightly, and
the reductions in time spent in restrictions are even higher over the next two periods,
2020-2030 and 2030-2050. Nonetheless it is worth noting that the risk of low storage
levels is unacceptably high by 2030-2050 as is the average time in restrictions. Thus
these tables again indicate that without a more significant portfolio of upgrades the
outcomes for both performance and reliability will not be sufficient to meet
community expectations.
Proceeding with the Shoalhaven augmentation alone is insufficient to address the
need to ensure appropriate levels of water security and reliability.

64 COST EFFECTIVENESS ANALYSIS — 2010 SYDNEY METROPOLITAN WATER PLAN
www.TheCIE.com.au Cabinet-in-confidence
D Cost elements
The analysis of the cost items has been conducted in the context of the costs related to
a particular portfolio. The cost of an individual portfolio is made up of a range of
individual cost elements which combine to form the portfolio costs. The calculation
typically involves the application of a cost ‘factor’ which is multiplied by the output
from the WATHNET model to calculate the total cost related to that cost element.
The difference in the costs of alternative portfolios largely relates to how the output
from the WATHNET model differs between the different portfolios. The portfolio
costs are discussed in Chapter 5.
Overview of the cost items
The key items used in the cost-effectiveness analysis include the following.
� The pumping costs associated with the Shoalhaven Transfer Scheme and the cost
of greenhouse gas emissions associated with this pumping.
� The augmentation of the Shoalhaven transfer scheme including the upfront
capital costs and the ongoing operating costs associated with the project.25
� The costs associated with the desalination plant, including the capital costs of the
second stage of the desalination plant and the operating costs of the plant.
� The costs of supply shortfalls at particular parts of the system; and
� The cost of quantitative water restrictions. We have calculated the costs of
quantitative water restrictions using economic theory and data undertaken from
recent studies in Sydney and other jurisdictions.
An explanation of how each of these cost elements is calculated is provided below.
The costs of water restrictions, is discussed in the next chapter. For a large number of
these costs, we have relied on cost information provided by the various NSW water
agencies.
All costs are presented in 2009/10 dollars unless specified otherwise.
25 This also includes capital costs associated with an additional pipeline (the ‘Illawarra Spurline’ that also assists in the transfer of water from the Shoalhaven system.

COST EFFECTIVENESS ANALYSIS — 2010 SYDNEY METROPOLITAN WATER PLAN 65
Cabinet-in-confidence www.TheCIE.com.au
Costs of Shoalhaven Transfer Scheme
Pumping costs of Shoalhaven
An important cost item that varies between the alternative portfolios is the costs of
pumping water from the Shoalhaven system to Sydney’s main supply system.
The volume of water that needs to be pumped from the Shoalhaven system varies
according to the underlying hydrology and the range of other alternative sources of
water in place. For example, if the operation of the desalination plant is operated
more frequently this will reduce the need to pump water from the Shoalhaven
system. This is because the desalination plant will enable (on average) higher dam
levels to be maintained, thereby reducing the need to trigger the pumping of water
from the Shoalhaven river.26
The changes in energy costs for the Shoalhaven pumping scheme is therefore
dependent on the volume of water required to be pumped (which varies between the
portfolios). In order to calculate this cost it involves considering the cost per unit of
water pumped and changes in the volume of water pumped. The volume of water
required to be pumped from the Shoalhaven system under alternative portfolios is
assessed under the WATHNET model.
Unit cost of water pumped from the Shoalhaven
The SCA has indicated that the marginal pumping costs for the Shoalhaven system
are $71.75 per ML in 2009/10 dollars.27
The energy used for pumping water from the Shoalhaven has additional
environmental costs, through greenhouse emissions. We base estimates of these costs
on:
� changes in the energy use from Shoalhaven pumping — a combination of the
volume of water extracted from the Shoalhaven (from WATHNET), with an
average energy use of 1.92 MWH per ML of water pumped;28
26 It should be noted that the Shoalhaven pumping scheme will still remain an important source of water into the future, even with the desalination plant operating and other new measures. The desalination plant expands the portfolio of options available to the Government to provide a secure and sustainable water supply system into the future.
27 SCA (2008), Submission to IPART’s review of prices for the Sydney Catchment Authority, September, p. 40.
28 This is based on SCA’s reported volume of extraction from the Shoalhaven of 150,475ML in 2005-06 and 175,115ML in 2006-07 (SCA website). The SCA’s annual report 2006-07 (p. 71) also reports energy use of 294 200MWH in 2005-06 and 331 500MWH in 2006-07.

66 COST EFFECTIVENESS ANALYSIS — 2010 SYDNEY METROPOLITAN WATER PLAN
www.TheCIE.com.au Cabinet-in-confidence
� emissions intensity — an emissions intensity of 0.96 tonnes of CO2 emissions per
MWH, based on the average forecast by IPART for 2012 of between 0.946 to 0.983
tonnes of CO2 emissions per MWH;29 and
� a time series of carbon prices over the next 40 years based on Australian Treasury
modeling. The price in 2010 is approximately $23.60 per tonne of CO2-e, rising to
$40 per tonne by 2030 and $130 per tonne by 2050.30
For those portfolios that include additional investment to upgrade the Shoalhaven
transfer scheme, there is a 30 per cent offset in the total pump energy. This reduces
the direct energy and carbon emissions costs associated with portfolios that include
the Shoalhaven transfer scheme.
The calculation of the costs of carbon emissions is likely to be more contentious given
that there is not a carbon market in place at the moment and the price of carbon is
required to be estimated based on existing modelling. Rather than seek to specify an
exact price of carbon, it is more appropriate to adopt an indicative price that is within
a reasonableness range and, as part of the sensitivity analysis, test the impact of
alternative carbon prices on the ranking of portfolios.
Costs of upgrading the Shoalhaven Transfer Scheme
Upgrading the Shoalhaven Transfer Scheme involves the construction of a tunnel to
Avon Dam. It is intended to replace the existing ‘run of river’ transfers.
The capital costs associated with the project is estimated to be $500 million which is
distributed according to table 5.3 below. The capital costs are assumed to occur in the
7 years prior to the modelled starting date of the scheme. The capital costs include
costs associated with a 140MW hydro facility which will result in 30 per cent
reductions in the total energy costs of pumping water from the Shoalhaven system.
It is important to recognise that to the extent that the timeframe for implementing the
Shoalhaven infrastructure can be significantly reduced into the future, this can
generate significant cost savings.
An annual operating and maintenance cost of $0.5 million is forecast. These ongoing
operating costs are assumed to commence in the first month the scheme starts.
Augmenting the Shoalhaven infrastructure means a greater volume of water can be
pumped from the Shoalhaven system. Drawing a greater volume of water from the
29 BDA and Gillespie Economics (2006) use an emissions intensity factor of 0.835 tonnes per MWH in its study of the Shoalhaven transfer scheme.
30 This is the average price of emissions from Australian Treasury modelling of various emissions trading scenarios in Australia’s low pollution future, Canberra, November, p. xii.

COST EFFECTIVENESS ANALYSIS — 2010 SYDNEY METROPOLITAN WATER PLAN 67
Cabinet-in-confidence www.TheCIE.com.au
Shoalhaven system improves reliability and security but it also results in higher
pumping costs of drawing a greater volume of water from the system.
Costs of desalination facilities
A key cost item that needs to be considered is those costs associated with the
construction and ongoing operation on the desalination plant.
For the purposes of this analysis we treat the capital costs of the first stage of the
desalination plant (the 250ML per day plant) and its associated infrastructure as sunk
costs. This is appropriate as these costs are incurred no matter which operating rule
is chosen for the desalination plant. The sunk costs form part of the fixed costs noted
above.
The cost items that are important for this analysis include the:
� operating costs of the existing desalination plant which vary according to the
different trigger levels; and
� upfront capital and ongoing operating costs related to the second stage of the
desalination plant.
There are also indirect costs of pumping water if the desalination plant is required to
supply water to residents in the western parts of Sydney and the potentially reduced
payments to filtration plant operators for the reduced cost of filtration. These cost
differences have not been incorporated into our analysis, and it is unknown as to
whether they would change the relative ranking of projects particularly in relation to
stage 2 of the desalination plant.
Operating costs of Stage 1
Our primary concern is with changes in operating costs of the plant under different
operating regimes. Due to the confidential nature of the operating costs we have not
separately disclosed these calculations which are embedded into the model. The
main operating expenditure categories include:
� costs paid to the Blue Water Consortium (the operator of the plant) for operation
and maintenance of the desalination plant and associated infrastructure, as
specified in the contract;
� electricity costs — payments for electricity supply and renewable energy credits
(as the plant will use 100 per cent renewable electricity). These payments will vary
significantly depending on the levels of production of the plant and the level of
plant efficiency; and
� other expenditures — this includes all of the operating and maintenance costs
borne by Sydney Desalination Plant Pty Ltd and not the operator. These costs may
include, amongst other things, insurance costs (eg relating to property, business

68 COST EFFECTIVENESS ANALYSIS — 2010 SYDNEY METROPOLITAN WATER PLAN
www.TheCIE.com.au Cabinet-in-confidence
interruption, products and public liability, professional indemnity) and contract
management costs.
The costs that are affected by the extent to which the plant is operated are smaller
and include:
� variable operating costs — these include electricity costs and the costs of the
Renewable Energy Certificates for amounts above a minimum;
� costs of shutdown — these include the costs of shutting down the plant, the
standby costs and the costs of restarting the plant. The magnitude of these costs
depends on the duration of the shutdown period; and
� costs avoided by shutdown — these can include maintenance costs and costs of
replacing membranes that change depending on the amount the plant is operated.
The expected variable costs associated with the plant in the future are dependent on
the future rainfall patterns and storage levels. For example, where storage levels are
high for long periods of time the desalination plant is generally switched off, unless
the trigger for the operation of the plant is at high dam levels.
The current modelling of the desalination plant in the WATHNET model assumes
that the plant is either at full capacity or at zero capacity and that the plant can be
switched on or off without a notification period. In practice, however, a notification
period is required before the plant can be switched on or off. The notification period
may vary depending on how long the plant has been out of operation. This is likely
to make little difference to the result, particularly if short-term climate forecasts can
partially offset the impacts of a notification period.
The total annual cost of operating the plant at full capacity is currently estimated to
be approximately $73 million per annum, which includes some costs which do not
vary according to the volume of water produced.
Cost of Stage 2 of the desalination plant
As noted above, the costs of Stage 2 of the plant relate to the upfront construction
costs and the ongoing operating costs of the plant. Sydney Water has advised that the
operating costs of Stage 2 of the plant are the same as the first stage.
The capital cost of the Stage 2 of the plant is estimated at $900 million (in 2008/09
dollars). The plant is anticipated to be constructed over a two year period with
$500 million incurred in year 1, and $400 million in year 2.
It is important to recognise that to the extent that the timeframe for constructing the
plant can be significantly reduced into the future, this can generate significant cost
savings if the construction of the plant is triggered by dam levels (or some other
measure of the level of water security). To the extent that the construction of the
plant can be delayed until the ‘last minute’ (without significantly compromising

COST EFFECTIVENESS ANALYSIS — 2010 SYDNEY METROPOLITAN WATER PLAN 69
Cabinet-in-confidence www.TheCIE.com.au
security) it offers more time to capture high inflow events. Given the volatility of the
underlying inflow patterns in Sydney it is reasonable to seek to capture these high
inflow events.
Cost of supply shortfalls
It is important to recognise that while the supply system in total may be performing
adequately, there may be pockets in the system where supply cannot be adequately
met.
One example of this is the limited ability of the desalination plant to provide water to
parts of Sydney that are further away from the point in Erskineville at which the
desalinated water meets the trunk supply.
The WATHNET model generates outputs that estimate the shortfall at different
points in the system at different points in time.31 We have assumed that shortfalls
only occur when dam levels fall below 10 per cent dam levels.
The shortfall variable generated by the WATHNET model reports the volume of
restricted demand that cannot be met by the supply system for the particular month.
In the unlikely event of such a shortfall, we have been advised there are means of
making up the supply in these types of water supply zones. Based on past
experiences of the NSW Office of Water of similar incidents, the SCA has estimated
the cost of making up the supply in these pockets would be $25 000 per ML
While we have incorporated these costs into the analysis it is important to recognise
that this is not a situation that the NSW Government is planning to occur. In practice,
a wide range of additional measures is likely to be undertaken to prevent such events
occurring in the future. Nevertheless, it is important to understand these costs which
will assist in future planning to avoid these situations.
Groundwater pumping costs
The costs associated with pumping groundwater have also been included in the
analysis. Groundwater is rarely triggered in the modeling, therefore, the probability
weighted costs are small. The following pumping costs (in 2009/10 dollars) have
been included in the analysis:
31 The WATHNET model assumes that the water from the desalination plant can be supplied to Prospect North, Ryde, Potts Hill (excluding Sutherland), Prospect East and Prospect South. When dam levels drop the model incorporates decisions that allow supply areas to be readjusted

70 COST EFFECTIVENESS ANALYSIS — 2010 SYDNEY METROPOLITAN WATER PLAN
www.TheCIE.com.au Cabinet-in-confidence
� $440.75 per ML for pumping from the Orchard Hill and Warragamba aquifers;
and
� $461.25 per ML for pumping from the Nepean aquifer.32
Other factors
It should be noted that we have not included a number of items in the analysis such
as changes:
� in the operating costs at the major water filtration plants if more water is drawn
from the desalination plant (which is already filtered) rather than from the dams;
� to Sydney Water’s pumping costs if there lower demand due to the imposition of
a more ‘harsh’ water restrictions regime; and
32 Pers correspondence with SCA, 7 December 2009. The aquifers do not directly match those include in the modeling and so we sought separate advice from the SCA to clarify this.

COST EFFECTIVENESS ANALYSIS — 2010 SYDNEY METROPOLITAN WATER PLAN 71
Cabinet-in-confidence www.TheCIE.com.au
E Cost of Restrictions
Restrictions are limits on how and when people can use water. They aim to reduce
the amount of water demanded at existing prices. There are currently three levels of
restrictions applied in the Sydney Metropolitan Area.
Quantitative water restrictions are a key policy instrument for dealing with drought.
The use of quantitative water restrictions has, in the past, ensured that communities
could withstand periods of drought without running out of water. It also enabled
governments to defer the need to undertake additional investments in water
infrastructure. Restrictions could continue to have these benefits in the future.
While the benefits of restrictions are well recognised, there is growing recognition
that restrictions also have costs on the community, although the extent of these costs
is debatable.
This chapter discusses how the costs of water restrictions can be calculated and
incorporated into the cost effectiveness approach.
Elements of the cost of restrictions
The costs of restrictions potentially accrue to a number of different groups within the
community, including consumers (for example, households, businesses and
community groups), governments and water utilities.
Some of the costs of water restrictions include, for example:
� time and inconvenience costs — for example, hand watering of gardens at specific
times;
� investment in high cost water sources — for example, rainwater tanks, domestic
recycling systems;
� flow on effects to businesses as a result of reduced demand for services — for
example, garden centres;
� reduced profitability of water utilities; and
� costs of administering water restrictions — for example, advertising and
compliance costs.33
The key elements of the costs of restrictions t are summarised in table E.1 below.
33 Further discussion on the cost of restrictions can be found in Allen Consulting Group (2007) and ISF and ACIL Tasman (2007).
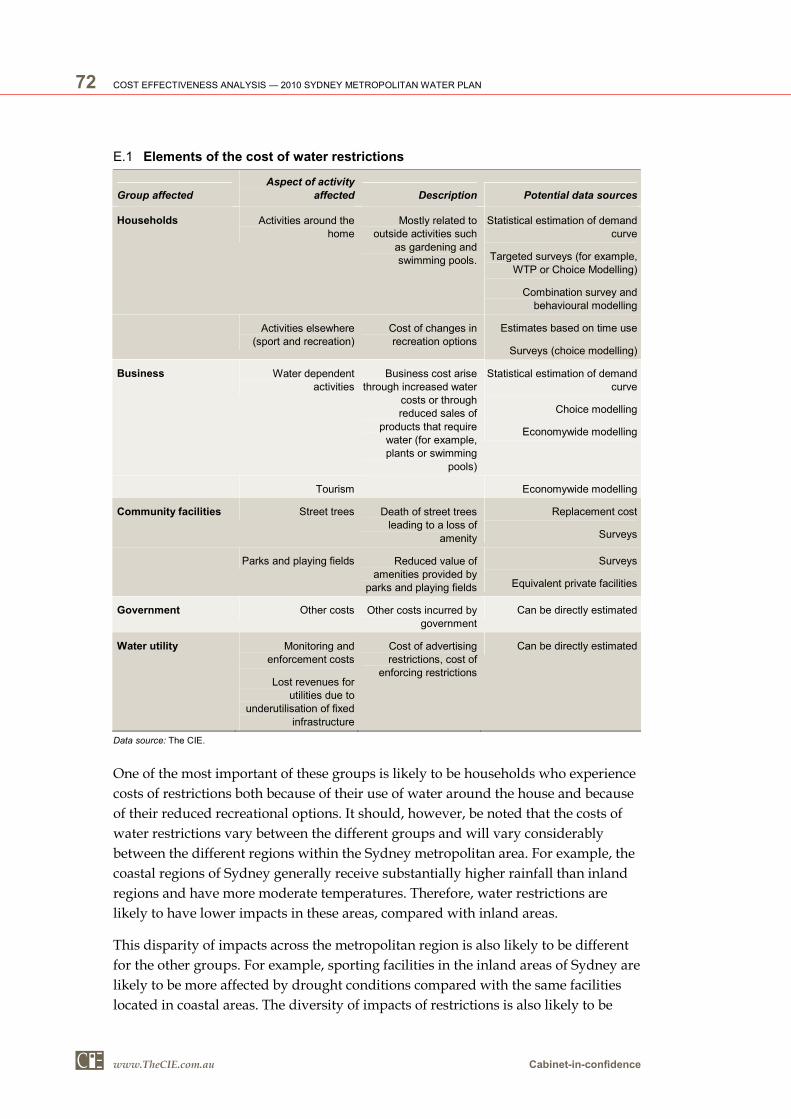
72 COST EFFECTIVENESS ANALYSIS — 2010 SYDNEY METROPOLITAN WATER PLAN
www.TheCIE.com.au Cabinet-in-confidence
E.1 Elements of the cost of water restrictions
Group affected
Aspect of activity
affected Description Potential data sources
Households Activities around the
home
Mostly related to
outside activities such
as gardening and
swimming pools.
Statistical estimation of demand
curve
Targeted surveys (for example,
WTP or Choice Modelling)
Combination survey and
behavioural modelling
Activities elsewhere
(sport and recreation)
Cost of changes in
recreation options
Estimates based on time use
Surveys (choice modelling)
Business Water dependent activities
Business cost arise through increased water
costs or through
reduced sales of
products that require
water (for example,
plants or swimming
pools)
Statistical estimation of demand curve
Choice modelling
Economywide modelling
Tourism Economywide modelling
Community facilities Street trees Death of street trees
leading to a loss of
amenity
Replacement cost
Surveys
Parks and playing fields Reduced value of amenities provided by
parks and playing fields
Surveys
Equivalent private facilities
Government Other costs Other costs incurred by
government
Can be directly estimated
Water utility Monitoring and
enforcement costs
Lost revenues for
utilities due to
underutilisation of fixed
infrastructure
Cost of advertising
restrictions, cost of
enforcing restrictions
Can be directly estimated
Data source: The CIE.
One of the most important of these groups is likely to be households who experience
costs of restrictions both because of their use of water around the house and because
of their reduced recreational options. It should, however, be noted that the costs of
water restrictions vary between the different groups and will vary considerably
between the different regions within the Sydney metropolitan area. For example, the
coastal regions of Sydney generally receive substantially higher rainfall than inland
regions and have more moderate temperatures. Therefore, water restrictions are
likely to have lower impacts in these areas, compared with inland areas.
This disparity of impacts across the metropolitan region is also likely to be different
for the other groups. For example, sporting facilities in the inland areas of Sydney are
likely to be more affected by drought conditions compared with the same facilities
located in coastal areas. The diversity of impacts of restrictions is also likely to be

COST EFFECTIVENESS ANALYSIS — 2010 SYDNEY METROPOLITAN WATER PLAN 73
Cabinet-in-confidence www.TheCIE.com.au
significant for the business sector (which is typically a heterogeneous group)
according to different levels of water use.
The cost of restrictions to consumers
Restrictions reduce the quantity of water consumed by Sydney’s households and
businesses. They do not put a strict quota on water use but rather impact on water
use by affecting how and when water can be used. This involves additional time
costs for water users or less amenity from using water in particular ways.
Lower demand
The cost of restrictions can be considered as reducing the demand for water at a
given price, as set out in Grafton and Ward (2008). In this case, the marginal cost of
water to the user is unchanged with restrictions, but the change in what can be done
with water lowers the demand for water. This is set out in chart E.2.
Restrictions shift demand down for some part of the demand curve. The quantity of
water demanded falls from Q0 to Q1. The loss in utility is represented by the shaded
area. This area approximates the cost of restrictions to consumers and can be
measured if sufficient information is known about the impact of restrictions on the
quantity of water used and the price sensitivity of demand for water. All the water
below point A on the chart is assumed to be indoor usage and quantities above point
A relate to outdoor usage. Given that restrictions only relate to outdoor usage the
slope of the demand curve only changes after point A. If the demand for water is not
very sensitive to price, then restrictions that lower demand by 10 per cent have a
greater cost to consumers.34
34 The approximate method of estimating the cost of restrictions to consumers based
on the loss in utility is:
ε..2
.
P
QSC
∆=
Where C is the cost of restrictions, S is the share of water uses affected by restrictions, ∆Q is the change in quantity of water consumed due to restrictions, P is the variable price of water and ε is the price elasticity of demand.

74 COST EFFECTIVENESS ANALYSIS — 2010 SYDNEY METROPOLITAN WATER PLAN
www.TheCIE.com.au Cabinet-in-confidence
E.2 Impact of restrictions through demand
0
2
4
6
8
1 2 3 4 5 6 7 8 9 10
Quantity
Price $
Demand (no restrictions)
Demand (restrictions)
Price
Welfare loss from restrictions
Q0Q1
A
Q1
BC
Notes: Q0 is the quantity of water consumed under no restrictions. Q1 is the quantity of water consumed under restrictions.
Data source: The CIE.
Evaluating the cost of restrictions
The cost of restrictions will depend on the exact nature of the restrictions imposed
and the characteristics of the population and geographical area on which restrictions
are imposed. The costs are also likely to depend on the need for restrictions, as
people are more likely to accept restrictions when dam levels are low, as they can
internalise the costs of running out of water or finding alternative water options.
Currently, the quantitative information on the cost of restrictions in Sydney is
limited. Restrictions can currently be evaluated through measuring the area in chart
E.3. Alternatively, and preferably, estimates can be gathered from choice modeling or
willingness to pay studies.
Estimates of costs to water consumers
In the absence of additional resources to undertake specific studies to better estimate
the cost of restrictions in Sydney, the costs of restrictions should be measured using
the price elasticity approach, cross-checked with willingness-to-pay estimates from
other jurisdictions, where available.
Both these methods have weaknesses.35 This suggests that portfolios should be
subject to sensitivity testing.
For our main analysis we calculate the cost of restrictions assuming a price elasticity
of -0.17 as estimated by Grafton and Ward (2008) for Sydney. This means that for a
35 ACILTasman and ISF (2007), p. 33; and ACILTasman and ISF (2009).

COST EFFECTIVENESS ANALYSIS — 2010 SYDNEY METROPOLITAN WATER PLAN 75
Cabinet-in-confidence www.TheCIE.com.au
1 per cent increase in price, we expect the quantity of water consumed to fall by
0.17 per cent. This is the most recent study undertaken for consumers in Sydney and
it is an approximate mid-range of the information currently available on price
elasticity of demand (see CIE 2009a). This estimate of the price elasticity of demand is
broadly consistent with recent surveys by Sydney Water and IPART that indicate
that price is not a major issue for consumers.36 This is also consistent with Sydney
Water’s observations that consumers do not change their consumption significantly
to changes in prices.
We use an estimate of 30 per cent of water use (without restrictions) is allocated to
activities that are affected by restrictions, such as outdoor water uses.37 We can then
calculate the shaded figure in chart E.4.
For portfolios modeled that include ‘voluntary water usage targets’, we apply scale
up costs based on the additional costs of moving from level 3 to this new level of
restrictions and the amount of water expected to be saved. This reflects concerns
about relying overly on a price elasticity for large changes in water use.
For commercial and industrial water users, a price elasticity of -0.3 is used. The
number of studies estimating the elasticity of demand for industrial water users is
relatively small compared with households and irrigators. However, there are a
range of studies from overseas that can be used.38 For example, for Canadian
industries the median elasticity is approximately -0.3.39
The estimates of costs of restrictions derived in this way are set out in table E.3,
reported as costs per household. The figures are based on plausible estimates of the
price elasticity of demand, cross-checked against previous studies, as reported in CIE
(2009a).
36 IPART (2007), Residential energy and water use in Sydney, the Blue Mountains and Illawarra,
November, pp. 45-48.
37 Early estimates from Sydney Water’s end-use model suggest that outdoor use for single dwelling residential properties is 38 per cent of total use and 32 per cent for multiple dwelling residential properties.
38 Industrial firms use water for a variety of purposes — for cooling intermediate inputs, producing high pressure steam, moving intermediate inputs, sanitation, and as a direct input. The major issue affecting accurate elasticity estimates for industry as a sector is its heterogenous composition and the uneven distribution of water use across industries. Therefore, there are limitations of using a single elasticity figure. Nevertheless, in the absence of more detailed information we have relied on a single elasticity figure but recognise its potential limitations.
39 CIE (2003), Literature review of the price elasticity of urban water demand, prepared for the Sydney Catchment Authority, p. 21.

76 COST EFFECTIVENESS ANALYSIS — 2010 SYDNEY METROPOLITAN WATER PLAN
www.TheCIE.com.au Cabinet-in-confidence
E.3 Cost of restrictions to consumers
Consumer type Level 1 Level 2 Level 3 Level 4
2009/10 $/
household
2009/10 $/
household
2009/10 $/
household
2009/10 $/
household
Residential 113 178 195 362
Industrial 11 52 57 107
Commercial 33 17 18 28
Total 157 247 270 497
Source: CIE calculations.
Other elements of the cost of restrictions
Producer costs
Restrictions lower the amount of water that has to be supplied. This reduces the costs
for Sydney Water and the SCA, as well as potentially reducing the need for
investments in the future. However, it also reduces revenues from selling water at
the regulated price. The net of these effects is the change in the producer surplus
(chart E.4).
E.4 Changes in producer surplus from restrictions
0
2
4
6
8
0 100 200 300 400 500 600 700
Quantity (GL/year)
Price ($ per kilolitre)….....
Price
Demand (no restrictions)
Demand (restrictions)
Marginal cost
Loss in producer surplus
Data source: TheCIE.
The extent of the cost reductions will depend on the relationship between water use
and costs. This, in turn, will depend on the particular sources of water that are no
longer required under lower water use. The costs of alternative sources of water are
explicitly included in the modelling as set out in chapter 5. Aside from elements
related to different investment options and operating costs of the desalination plant,
modelling is based on $82 per ML filtering cost for Sydney Water and $71.75 per ML
for the Shoalhaven transfers for Sydney Catchment Authority (in 2009/10 dollars).

COST EFFECTIVENESS ANALYSIS — 2010 SYDNEY METROPOLITAN WATER PLAN 77
Cabinet-in-confidence www.TheCIE.com.au
The change in revenue from selling water is calculated at the regulated 2011/12 price
of $1.93 per kL (in 2008/09 dollars).40 No change in price is included through time,
although potentially IPART’s regulated price could respond to the long run marginal
cost of water at the time of each review, which would depend on dam levels. No
changes in price have been incorporated into demand forecasts.
Monitoring and enforcement costs
There are a range of costs incurred by Sydney Water in relation to administering the
restrictions regime. This includes the costs of advertising the restrictions that apply at
a given point in time and the cost of enforcing the restrictions. It is important to
recognise that where infringement notices have been issued that the utility can gain
some additional revenue. Therefore, these additional revenues should be ‘netted off’
the costs. Cost estimates below from Sydney Water have been incorporated into the
modeling. For Level 4 restrictions, administration cost estimates (in 2009/10 dollars)
were increased based on the marginal cost of administration for additional
reductions in water from data provided for Levels 1 to 3.
� Level 1 — $5.5 million per year.
� Level 2 — $7.7 million per year.
� Level 3 — $10.3 million per year.
� Water usage targets — $35.9 million per year.
40 IPART 2008, Review of prices for Sydney Water Corporation’s water, sewerage, stormwater and
other services, Determination and Final Report, June 2008, p 20.

78 COST EFFECTIVENESS ANALYSIS — 2010 SYDNEY METROPOLITAN WATER PLAN
www.TheCIE.com.au Cabinet-in-confidence
F Sensitivity analysis
Risk and uncertainty are key themes that need to be considered in the development
of any water supply strategy. Future rainfall patterns, and their impact on dam
levels, are the most important type of risk in considering water investments.
Variation in rainfall is the major driver of the need for additional investments in
water and hence the cost of providing water to Sydney. There are also aspects of the
analysis where there is some uncertainty regarding the level of detailed information
required.
The appendix tests how the ranking of the alternative portfolios changes with
changes to some of the key input parameters in the analysis.
Varying the discount rate
We have tested alternative discount rates to examine whether this impacts on the
ranking of the projects. The rankings presented in the main part of this report were
based on a 7 per cent discount rate. The ranking of the portfolios based on the
7 per cent discount rate are presented in chart F.1 below.41
F.1 Baseline Portfolio Ranking — 7 per cent discount rate
R15
R17
R18
R20
R22R26
R28
R29
R13
R21 R19
R27
R30
-
200
400
600
800
1,000
1,200
1,400
1,600
1,800
2,000
5.0 6.0 7.0 8.0 9.0 10.0 11.0 12.0 13.0 14.0
Min storage level to 2030 (%)
NPV costs to 2050 ($m)
Data source: TheCIE calculations,
41 It is important to note in the charts presented below we have adjusted the scale on the graphs so as to highlight differences in the relative rankings of the alternative portfolios.
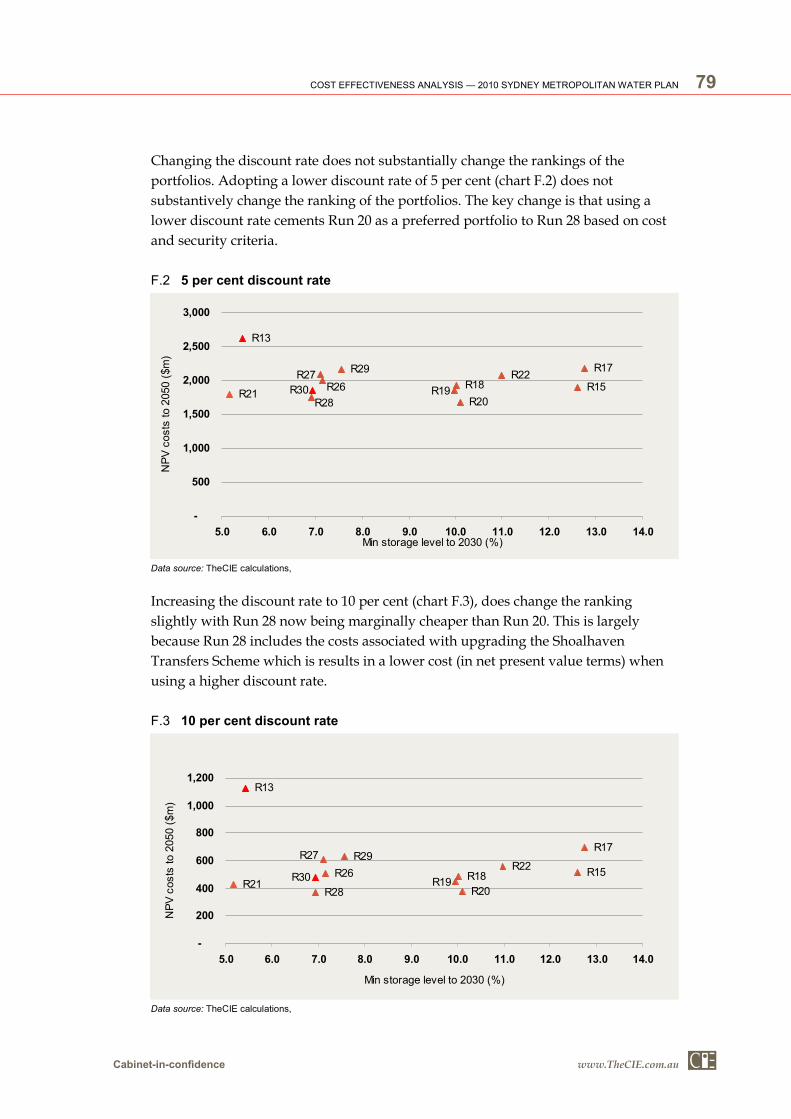
COST EFFECTIVENESS ANALYSIS — 2010 SYDNEY METROPOLITAN WATER PLAN 79
Cabinet-in-confidence www.TheCIE.com.au
Changing the discount rate does not substantially change the rankings of the
portfolios. Adopting a lower discount rate of 5 per cent (chart F.2) does not
substantively change the ranking of the portfolios. The key change is that using a
lower discount rate cements Run 20 as a preferred portfolio to Run 28 based on cost
and security criteria.
F.2 5 per cent discount rate
R15
R17
R18
R20
R22R29
R13
R21 R19R26R27
R28R30
-
500
1,000
1,500
2,000
2,500
3,000
5.0 6.0 7.0 8.0 9.0 10.0 11.0 12.0 13.0 14.0Min storage level to 2030 (%)
NPV costs to 2050 ($m)
Data source: TheCIE calculations,
Increasing the discount rate to 10 per cent (chart F.3), does change the ranking
slightly with Run 28 now being marginally cheaper than Run 20. This is largely
because Run 28 includes the costs associated with upgrading the Shoalhaven
Transfers Scheme which is results in a lower cost (in net present value terms) when
using a higher discount rate.
F.3 10 per cent discount rate
R15
R17
R18
R20
R22R26
R28
R29
R13
R21 R19
R27
R30
-
200
400
600
800
1,000
1,200
5.0 6.0 7.0 8.0 9.0 10.0 11.0 12.0 13.0 14.0
Min storage level to 2030 (%)
NPV costs to 2050 ($m)
Data source: TheCIE calculations,

80 COST EFFECTIVENESS ANALYSIS — 2010 SYDNEY METROPOLITAN WATER PLAN
www.TheCIE.com.au Cabinet-in-confidence
Lower average inflows
Climate risk is a key risk that is likely to impact on the ranking of portfolios. The
SCA’s Wathnet model generates a wide range of potential inflow scenarios that could
occur into the future. The inflows are based on the inflow characteristics that have
occurred in Sydney over the last 100 years. In the analysis presented in the main
body of this report, we have used the ‘average’ climate result of the inflow scenarios
generated. However, it is important to recognise that there is a distribution around
this average.
In order to test these alternatives we have considered how the rankings of the
portfolios changes if the inflows into Warragamba Dam were 20 per cent lower than
currently expected using the SCA’s Wathnet model. This is broadly in line with the
CSIRO’s recent projections that the longer term impact of climate change is expected
to result in 20 per cent lower inflows in Warragamba Dam.42
It should be noted, however, that this sensitivity test is not intended to provide a
sophisticated understanding of the potential climate change impacts. Climate change
is not just about lowering average inflows but also about changing the underlying
characteristics of the inflow patterns. For example, it could result in greater volatility
in inflow patterns or greater duration of drought events. Therefore, the analysis
presented below should not be considered to be a detailed ‘climate change’ analysis
of the potential climate change impacts.
If future inflows into Warragamba dam are 20 per cent lower than the average result
generated by the Wathnet model using the past 100 years of data, then this will
significantly change the costs of each portfolio of options. For example, it will result
in lower dam levels which will increase the frequency of triggering water restrictions
and triggering the operation of the desalination plant.
Table F.4 indicates the proportion of time that the first stage of the desalination plant
is operating using the average inflows generated by the WATHNET model and
where average inflows are 20 per cent lower into the Warragamba Dam. In all the
runs, except for Run 22, lowering the average inflows results in the desalination plant
operating over 6 per cent more time than under the baseline inflow conditions.
42 SCA (2009), Climate Change and its impacts on Sydney’s Water Supply, Technical Report,
October.

COST EFFECTIVENESS ANALYSIS — 2010 SYDNEY METROPOLITAN WATER PLAN 81
Cabinet-in-confidence www.TheCIE.com.au
F.4 Desalination first stage — per cent of time operating 2010-50
Baseline 20 per cent reduction Difference
% % %
Base Case 21.7 27.8 6.1
Base case — with Eflows 31.7 35.8 9.4
R13 22.6 29.2 6.7
R15 27.7 35.1 7.4
R17 25.5 32.6 7.1
R18 26.6 34.0 7.4
R19 26.6 34.0 7.4
R20 28.0 35.4 7.5
R21 26.6 34.0 7.4
R22 87.4 88.2 0.8
R26 26.6 34.0 7.3
R27 25.7 32.9 7.2
R28 26.7 34.1 7.3
R29 26.4 33.5 7.2
R30 25.8 33.0 7.2
Note: In Run 22 the first stage of the desalination plant is assumed to be operating at full capacity from 2018.
Source: TheCIE calculations,
Table F.8 illustrates the impact of the lower inflows on the time in restrictions. It
substantially increases the time spent in restrictions. For example, under Run 15 the
average time in restrictions is anticipated to be 7.6 per cent based on the last
100 years of inflows. However, under the 20 per cent lower inflows scenario the
average time in restrictions is anticipated to rise to 11.1 per cent.
F.5 Average time in restrictions 2010-50
Baseline 20 per cent reduction
Difference
% % %
Base Case 5.5 8.3 2.8
Base Case — with Eflows 10.8 16.4 5.6
R13 4.9 7.5 2.6
R15 7.6 11.1 3.5
R17 6.9 10.2 3.3
R18 7.2 10.8 3.5
R19 7.2 10.7 3.5
R20 7.7 11.3 3.6
R21 7.2 10.8 3.5
R22 5.8 8.9 3.1
R26 7.2 10.7 3.5
R27 7.0 10.3 3.4
R28 5.0 7.7 2.7
R29 10.0 14.2 4.2
R30 4.8 7.4 2.6
Source: TheCIE calculations,

82 COST EFFECTIVENESS ANALYSIS — 2010 SYDNEY METROPOLITAN WATER PLAN
www.TheCIE.com.au Cabinet-in-confidence
The lower average inflows would also impact on a range of other factors such as the
frequency (and volume) of pumping water from the Shoalhaven system and from
groundwater sources.
The cost implications of assuming lower average inflows are presented in table F.6
below. It illustrates that changing this assumption has a significant impact on the
costs of the portfolio. While the costs have increased across all the different
portfolios, the cost increase is relatively higher for a number of the portfolios.
F.6 Net Present Value of Costs to 2050 — 20 per reduction in inflows into Warragamba Dam
NPV Costs
Baseline
NPV Costs
20 per cent reduction
in inflows Difference
$m $m $m
Base Case 786 1 002 216
Base Case — with Eflows 920 1 223 303
R13 1 854 2 075 221
R15 1 165 1 513 348
R17 1 403 1 733 330
R18 1 160 1 488 327
R19 1 114 1 423 309
R20 987 1 303 316
R21 1 074 1 353 278
R22 1 278 1 534 256
R26 1 204 1 547 344
R27 1 314 1 646 332
R28 1 018 1 280 262
R29 1 347 1 698 351
R30 1 130 1 384 253
Source: TheCIE calculations,
Chart F.7 presents the rankings of the portfolios using the cost and security criteria.
The chart indicates a change in the relative costs of some portfolios. Run 30, for
example, is now cheaper than Runs 18 and 19. A key change is that Run 28 is now
marginally lower cost than Run 20. As a result, Run 28 is likely to remain in the
feasible set of preferred portfolios, along with Run 15 and Run 20.

COST EFFECTIVENESS ANALYSIS — 2010 SYDNEY METROPOLITAN WATER PLAN 83
Cabinet-in-confidence www.TheCIE.com.au
F.7 Portfolio Ranking — reduction in inflows into Warragamba dam
R19R20
R26R27
R30R21R15
R17
R18 R22
R28
R29
R13
500
700
900
1,100
1,300
1,500
1,700
1,900
2,100
2,300
2,500
5.0 6.0 7.0 8.0 9.0 10.0 11.0 12.0 13.0 14.0
Min storage level to 2030 (%)
NPV costs to 2050 ($m)
Data source: TheCIE calculations,
Security outcomes under more extreme events
As noted previously, the SCA’s WATHNET model simulates a wide range of
alternative inflow sequences that can occur into the future. In the modelling
presented above, the minimum storage levels reported were based on using 2000
possible alternative inflow sequences that could occur in the future. These inflow
sequences include droughts that are worse than the droughts that have occurred in
recent history, as discussed later in this section.
While the modelling of the 2000 alternative inflow sequences provides information
on extreme outcomes (with droughts more severe than experienced over the last 100
years), it is useful to consider how the portfolios perform under events that lead to
more extreme security outcomes. The more extreme outcomes are a combination of a
number of factors:
� The severity and duration of the drought. There is no precise definition of a
drought and it is important to recognise that droughts can differ according to
their severity and duration. For example, one drought may have the lowest
annual inflow on record for a single year where another drought may have the
lowest average inflow over a five year period.
� The storage level at the point in time when the drought commences. For example,
if dams were full at the start of a drought then the drought would need to be more
severe to generate more extreme security outcomes compared with the impact of a
drought that occurred when dams were at 60 per cent of capacity.
� The demand level at the point which the drought commences and during the
drought period. For example, the drought that occurred over the past seven years
would have more severe impacts on dam storage levels if it occurred 20 years into

84 COST EFFECTIVENESS ANALYSIS — 2010 SYDNEY METROPOLITAN WATER PLAN
www.TheCIE.com.au Cabinet-in-confidence
the future where demand levels is anticipated to be significantly higher
compared.
In order to examine how the portfolios perform under different combinations of
these factors that lead to extreme security outcomes, the SCA has increased the
number of simulations to 10 000 alternative inflow scenarios. The minimum storage
levels generated by these additional simulations are presented in table F.118 **check
ref **below.43
F.8 Security outcomes — minimum storage levels up to 2020
2010 to 2020
%
Base Case 0.0
Base Case — with Eflows 0.0
R15 9.2
R17 9.6
R18 6.0
R19 4.7
R20 4.7
R21 0.1
R22 4.7
R26 2.8
R27 1.1
R28 2.2
R29 3.5
R30 2.2
Source: SCA Wathnet model,
In the table we have focused on the first part of the planning period, 2010 to 2020, to
illustrate the performance of the portfolios under these more extreme outcomes. The
portfolios that provide the greatest security are portfolios 17 and 15. In both these
portfolios the second stage of the desalination plant is assumed to be operating when
dam levels reach 30 per cent.
In chart F.9 we illustrate how storage levels decline using the worst case outcome
generated by the 10 000 replicates modelling. We illustrate this using the two
preferred portfolios (Runs 15 and 20) as well as Run 28. The differences between
these results reflect the different storage trigger levels for the:
� operation of the second stage desalination plant. In Run 15 the second stage of the
plant is assumed to commence when dam levels reach 30 per cent, compared with
20 per cent for Run 28 and 15 per cent for Run 20;
43 It should also be noted that each of these more extreme scenarios has a lower probability of occurring. That is, each of these scenarios is has a probability of 1 in 10 000 chance of occurring.
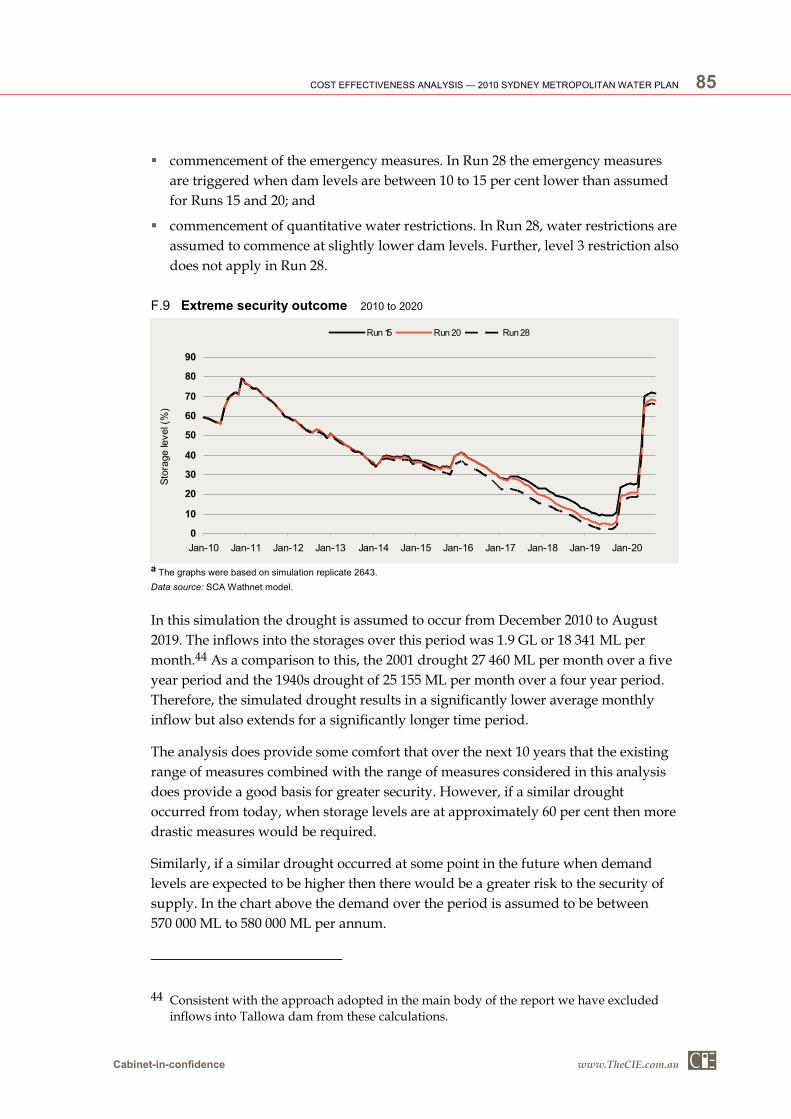
COST EFFECTIVENESS ANALYSIS — 2010 SYDNEY METROPOLITAN WATER PLAN 85
Cabinet-in-confidence www.TheCIE.com.au
� commencement of the emergency measures. In Run 28 the emergency measures
are triggered when dam levels are between 10 to 15 per cent lower than assumed
for Runs 15 and 20; and
� commencement of quantitative water restrictions. In Run 28, water restrictions are
assumed to commence at slightly lower dam levels. Further, level 3 restriction also
does not apply in Run 28.
F.9 Extreme security outcome 2010 to 2020
0
10
20
30
40
50
60
70
80
90
Jan-10 Jan-11 Jan-12 Jan-13 Jan-14 Jan-15 Jan-16 Jan-17 Jan-18 Jan-19 Jan-20
Storage level (%)
Run 15 Run 20 Run 28
a The graphs were based on simulation replicate 2643.
Data source: SCA Wathnet model.
In this simulation the drought is assumed to occur from December 2010 to August
2019. The inflows into the storages over this period was 1.9 GL or 18 341 ML per
month.44 As a comparison to this, the 2001 drought 27 460 ML per month over a five
year period and the 1940s drought of 25 155 ML per month over a four year period.
Therefore, the simulated drought results in a significantly lower average monthly
inflow but also extends for a significantly longer time period.
The analysis does provide some comfort that over the next 10 years that the existing
range of measures combined with the range of measures considered in this analysis
does provide a good basis for greater security. However, if a similar drought
occurred from today, when storage levels are at approximately 60 per cent then more
drastic measures would be required.
Similarly, if a similar drought occurred at some point in the future when demand
levels are expected to be higher then there would be a greater risk to the security of
supply. In the chart above the demand over the period is assumed to be between
570 000 ML to 580 000 ML per annum.
44 Consistent with the approach adopted in the main body of the report we have excluded inflows into Tallowa dam from these calculations.

86 COST EFFECTIVENESS ANALYSIS — 2010 SYDNEY METROPOLITAN WATER PLAN
www.TheCIE.com.au Cabinet-in-confidence
If the ranking of the portfolios was based on the security outcome using the 10 000
inflows simulations, then only two of the portfolios (Runs 15 and 17) would come
close to meeting the working criterion used of 10 per cent storage level. This would
result in greater security, but at a higher cost compared with alternative portfolios.
Cost of restrictions
A key uncertainty in the analysis is the potential cost attached to different levels of
water restrictions. As noted in the report, the cost of the restrictions is not readily
observed. The cost to consumers, therefore, needs to be derived through other pieces
of information such as information on the:
� price elasticity of demand for water;
� assumed level of reduction in consumption under each level of restrictions; and
� proportion of household consumption attributed to outdoor water use.
The cost of restrictions is a relatively large component of the costs. We would
therefore, expect that changes to the underlying cost assumptions attributed to
different levels of quantitative water restrictions would impact on the costs of
restrictions.
For this analysis we have tested how the rankings of the project would change if
there was no cost to consumers attached to the first level of restrictions. The reason
for focusing on the level 1 restrictions is that in recent analysis conducted by Sydney
Water, for example, some of savings from the first level of restrictions has occurred
through reducing indoor usage even though the restrictions are only intended to
impact on outdoor use. Therefore, it is possible that only some proportion of level 1
restriction results in a loss in utility to the consumer – hence we only consider the
impact of applying a lower cost to restrictions.45
The results of assuming that level 1 restrictions, has no cost on consumers are
presented in the table below. As indicated, changing this assumption significantly
changes the total costs associated with each portfolio.
The rankings of the portfolios using cost and security criteria are presented in chart
F.11. If there is no cost to consumers of level 1 water restrictions, then we would
expect a number of outcomes:
� Portfolios that spend relatively more time in level 1 restrictions are not
‘penalised’, if we assume a zero cost to consumers of level 1 restrictions.
45 It is possible to test the potential impact of changing the costs related to each level of restrictions. Level 1 restriction, however, is the largest cost element given that there is a much higher percentage of time spent in Level 1 compared to other levels of restrictions. The expected cost associated with Level 1 restrictions is approximately double that of the water usage targets. Therefore, we have focused our testing on this cost element.

COST EFFECTIVENESS ANALYSIS — 2010 SYDNEY METROPOLITAN WATER PLAN 87
Cabinet-in-confidence www.TheCIE.com.au
� It can change the ranking of the portfolios where there are different dam levels
assumed for triggering water restrictions.
In this instance the difference between Runs 26 and Run 30 is lessened — in Run 30
the trigger point for level 1 restrictions is 5 per cent lower than that assumed in
Run 26.
F.10 Net Present Value of Costs to 2050 — no costs to consumers associated with level 1 restrictions
NPV Costs
Baseline
NPV Costs
Reducing CO2 costs
Difference
$m $m $m
Base Case 786 652 -135
Base Case — with Eflows 920 758 -162
R13 1 854 1 723 -131
R15 1 165 1 002 -163
R17 1 403 1 248 -155
R18 1 160 1 001 -160
R19 1 114 954 -160
R20 987 824 -163
R21 1 074 915 -159
R22 1 278 1 138 -140
R26 1 204 1 046 -158
R27 1 314 1 159 -155
R28 1 018 913 -105
R29 1 347 1 097 -250
R30 1 130 1 028 -102
Source TheCIE calculations.
Run 29 is also now ranked higher than Run 27 — Run 29 has level 1 restrictions
triggered 5 per cent higher than that assumed in Run 27.
Of more significance for this analysis, it does firm-up the ranking of Run 20 as being
preferred to Run 28 (on cost and security grounds). It also highlights that Runs 20
and 15 remain the favoured portfolios.

88 COST EFFECTIVENESS ANALYSIS — 2010 SYDNEY METROPOLITAN WATER PLAN
www.TheCIE.com.au Cabinet-in-confidence
F.11 Portfolio Ranking — no cost to consumers of level 1 restrictions
R17
R20
R22R27R29
R15R18
R19
R26
R28
R30
500
600
700
800
900
1 000
1 100
1 200
1 300
1 400
1 500
5 6 7 8 9 10 11 12 13 14
Min storage level to 2030 (%)
NPV costs to 2050 ($m)
Data source: TheCIE calculations.
Shoalhaven pumping costs
Another sensitivity test that we have conducted is to consider the ranking changes if
the energy costs of the pumping water from the Shoalhaven system and associated
CO2 emissions costs are changed. We test this by increasing and decreasing these
costs by 20 per cent compared with the baseline costs reported in the analysis in the
main body of the report.
The total costs, in net present value terms over the period 2010 to 2050, for the
portfolios are presented in table F.12 below. For the status quo portfolio, the direct
energy costs of pumping water from the Shoalhaven system is approximately
$25 million of the total costs, while the associated CO2 emissions costs is
approximately $31 million. Given the relatively small share of these costs relative to
total costs varying these costs is not expected to significantly change the total costs.
Table F.12 below illustrates this with respect to a 20 per cent reduction in the cost
attributed to CO2 emissions.46 Given the small difference that this makes to total
costs it does not change the ranking of the portfolios. The impact of changing the
direct energy costs is smaller than that with respect to the price of carbon. Given this,
varying the energy costs also does not change the ranking of the portfolios.
46 A 20 per cent increase in CO2 emissions costs has the same magnitude of impact resulting in an increase in the costs compared to the baseline.

COST EFFECTIVENESS ANALYSIS — 2010 SYDNEY METROPOLITAN WATER PLAN 89
Cabinet-in-confidence www.TheCIE.com.au
F.12 Net Present Value of Costs to 2050 — 20 per reduction in the cost of CO2 emissions
NPV Costs
Baseline
NPV Costs
Reducing CO2 costs
Difference
$m $m $m
Base Case 786 780 -6
Base Case — with Eflows 920 912 -8
R13 1 854 1 845 -9
R15 1 165 1 157 -8
R17 1 403 1 394 -9
R18 1 160 1 152 -9
R19 1 114 1 105 -9
R20 987 979 -8
R21 1 074 1 066 -9
R22 1 278 1 271 -7
R26 1 204 1 195 -8
R27 1 314 1 305 -9
R28 1 018 1 009 -9
R29 1 347 1 339 -8
R30 1 130 1 121 -9
Source: TheCIE calculations.
Changing the demand profile
The assumptions regarding the underlying demand for water has a significant
impact on the underlying costs of alternative portfolios. For example, lower demand
will allow dam levels to be maintained at higher levels, thereby, reducing the chance
of triggering the operation of the desalination plant or triggering the implementation
of water restrictions. Similarly, if demand is higher than expected this is likely to
raise the cost of operating the existing assets and bringing forward the need for new
assets.
The modelling presented in the main body of this report assumes a demand level
that is based on a median level of population growth and low savings assumed from
demand management programs. Alternative scenarios that we have considered for
the sensitivity testing include:
� a higher population assumption, while maintaining the assumed low savings
from demand management programs; and
� changes to the level of savings assumed. We have tested the impacts of a median
savings and high savings options.
It should be noted that there has been limited data available to understand the
potential cost implications of adopting the median and high savings options. These
options will include additional costs such as due to an increase in the uptake of
existing programs such as the rainwater tank rebates or installation of low flow
showerheads. Given this, the sensitivity testing of alternative demand assumptions
has been conducted for a limited range of portfolios. We are, therefore, not able to

90 COST EFFECTIVENESS ANALYSIS — 2010 SYDNEY METROPOLITAN WATER PLAN
www.TheCIE.com.au Cabinet-in-confidence
consider the potential impact of the ranking of the portfolios of adopting the different
demand assumptions. However, we can illustrate the potential impacts on a select
group of portfolios.
Base case
Table F.13 presents the security and reliability outcomes under the current portfolio
(without the introduction of a revised environmental flow regime for Warragamba
Dam). It illustrates that the alternative demand scenarios do not result in much
difference in the security outcomes in the period from 2010 to 2020.
However, in the medium term period, 2020 to 2030, being able to achieve a median
level of savings from demand management programs can offer some security
benefits in these extreme drought events (providing a buffer of approximately
4 per cent). In the long term additional measures will be required to provide security
in extreme drought events and being able to achieve a higher level of savings from
demand management programs is not sufficient to counter the increase in demand
generated through higher long term population growth.
F.13 Security outcomes — Pr<10% and minimum storage levels
Up to 2020 2020-30 2030-50
Probability
<10%
Minimum
storage
Probability
<10%
Minimum
storage
Probability
<10%
Minimum
storage
% % % % % %
Base case – MidPop/Low
Savings
0.1 5.5 0.3 2.2 3.3 0.0
Base case – HighPop/Low
Savings
0.1 5.5 0.4 1.3 4.7 0.0
Base case – MidPop/Mid
Savings
0.1 7.8 0.2 6.4 0.8 0.0
Source: SCA Wathnet model.
Table F.14 below illustrates how each of the alternative demand scenarios impacts on
the average time in restrictions. In the period up to 2030 there is not much difference
in the average time in restrictions between the median and high population
assumptions. However, in the longer term there is a more significant divergence
between median and high population assumptions resulting in significantly different
demand outcomes.
The difference between the median population and alternative savings assumptions
does result in significantly alter the time in restrictions from the start of the planning
period. Even in the final planning period, achieving a median level of savings from
demand management programs reduces the average time in restrictions to around
5 per cent of the time.
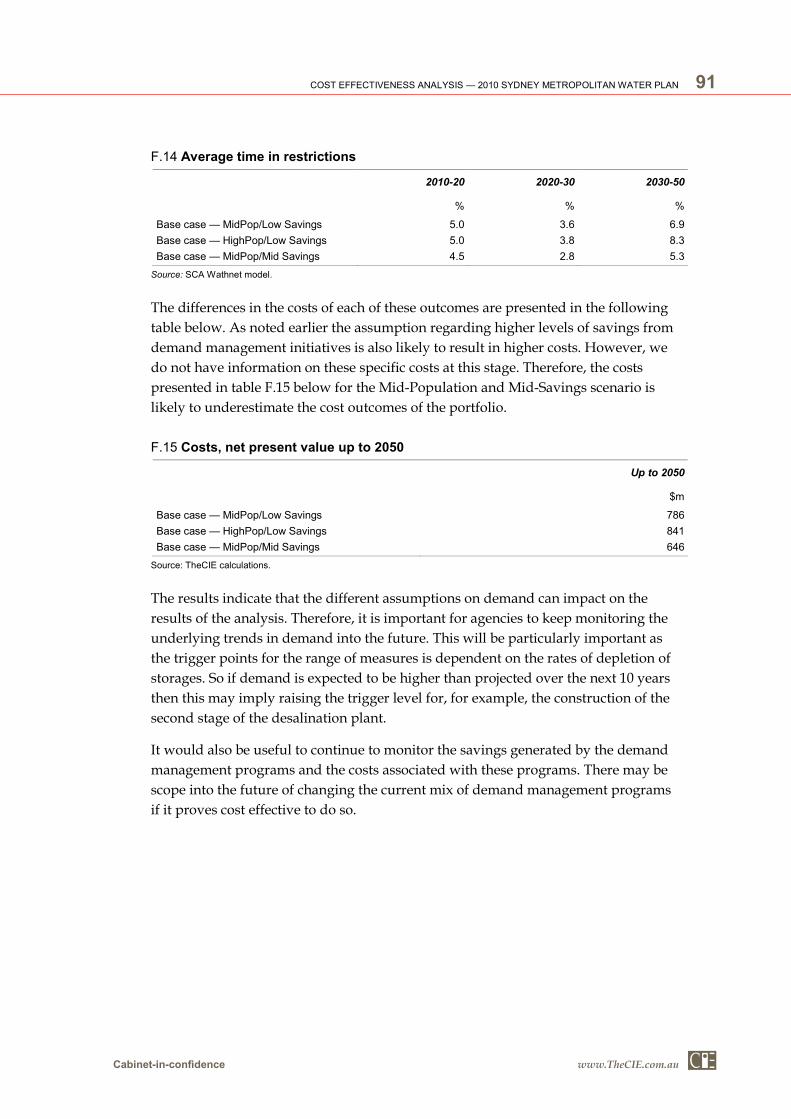
COST EFFECTIVENESS ANALYSIS — 2010 SYDNEY METROPOLITAN WATER PLAN 91
Cabinet-in-confidence www.TheCIE.com.au
F.14 Average time in restrictions
2010-20 2020-30 2030-50
% % %
Base case — MidPop/Low Savings 5.0 3.6 6.9
Base case — HighPop/Low Savings 5.0 3.8 8.3
Base case — MidPop/Mid Savings 4.5 2.8 5.3
Source: SCA Wathnet model.
The differences in the costs of each of these outcomes are presented in the following
table below. As noted earlier the assumption regarding higher levels of savings from
demand management initiatives is also likely to result in higher costs. However, we
do not have information on these specific costs at this stage. Therefore, the costs
presented in table F.15 below for the Mid-Population and Mid-Savings scenario is
likely to underestimate the cost outcomes of the portfolio.
F.15 Costs, net present value up to 2050
Up to 2050
$m
Base case — MidPop/Low Savings 786
Base case — HighPop/Low Savings 841
Base case — MidPop/Mid Savings 646
Source: TheCIE calculations.
The results indicate that the different assumptions on demand can impact on the
results of the analysis. Therefore, it is important for agencies to keep monitoring the
underlying trends in demand into the future. This will be particularly important as
the trigger points for the range of measures is dependent on the rates of depletion of
storages. So if demand is expected to be higher than projected over the next 10 years
then this may imply raising the trigger level for, for example, the construction of the
second stage of the desalination plant.
It would also be useful to continue to monitor the savings generated by the demand
management programs and the costs associated with these programs. There may be
scope into the future of changing the current mix of demand management programs
if it proves cost effective to do so.

92 COST EFFECTIVENESS ANALYSIS — 2010 SYDNEY METROPOLITAN WATER PLAN
www.TheCIE.com.au Cabinet-in-confidence
References
Allen Consulting Group 2007, Saying goodbye to permanent water restrictions in Australia’s cities:
Key priorities for achieving water security, Report to Infrastructure Partnerships Australia,
February.
BDA Group and Gillespie Economics 2004, Cost–benefit analysis of environmental flow regimes for
a sustainable use of Greater Sydney’s water, report prepared for the NSW Department of
Infrastructure, Planning and Natural Resources.
—— 2006, Cost–benefit analysis of the Shoalhaven environmental flows project, report prepared for
the NSW Department of Commerce.
Brennan, D., Tapsuwan, S. and Ingram, G. 2007, ‘The welfare costs of urban water
restrictions’, Australian Journal of Agricultural and Resource Economics, vol. 51.
Centre for International Economics (CIE) 2005, Economic benefit-cost analysis of new water supply
options for the ACT, Report prepared for ACTEW Corporation, April.
DBM Consultants 2007, Economic valuation of water reliability in South-East Queensland using
choice modelling, Report prepared for Queensland Water Infrastructure.
Erlanger, P. and Neal, B. 2005, Framework for Urban Water Resource Planning, Prepared for
Water Service Association of Australia, Occasional Paper no.14, June.
Gordon, J., Chapman, R. and Blamey, R. 2001, Assessing the options for the Canberra water supply:
an application of choice modelling, in Bennett J and Blamey R (eds) The Choice Modelling
Approach to Environmental Valuation, Edward Elgar, Cheltenham, UK.
Grafton, Q. and Ward, M. 2008, ‘Prices versus rationing: Marshallian surplus and mandatory
water restrictions’, The Economic Record, vol. 84, September.
Hensher, D., Shore, N. and Train, K. 2006, ‘Water supply and willingness to pay to avoid
drought restrictions’, The Economic Record, vol. 82, no. 256, March 2006, pp. 56-66.
ISF and AcilTasman 2007, Review of water restrictions, Draft Report prepared for the National
Water Commission, May.
—— and SMEC 2006, Review of the Metropolitan Water Plan: Final Report, Report prepared for
NSW Government, April.
KPMG 2004, Pricing for demand management, Report conducted for WSAA, April.
NSW Government 2007, Metropolitan Water Plan 2007 Progress Report.
—— 2004, Meeting the challenge, Securing Sydney’s water future: The Metropolitan Water Plan
2004, October.
O’Dea, G. and Cooper, J. 2008, Water scarcity: Does it exist and can price help solve the problem,
IPART Working Paper, January.
SCA (2009), Climate Change and its impacts on Sydney’s Water Supply, Technical Report, October.