Embed Size (px)
Citation preview

Corporates
Natural Resources / Chile
Empresas CMPC S.A.
August 25, 2017 1
Empresas CMPC S.A.
Rating Type Rating Outlook Last Rating Action
Local Currency Long-Term IDR BBB Stable Downgrade 17 August 2017
Long-Term IDR BBB Stable Downgrade 17 August 2017
National Equity Rating Primera Clase Nivel 1(chl)
Affirmed 17 August 2017
National Long-Term Rating AA-(chl) Stable Downgrade 17 August 2017
National Short-Term Rating N1+(chl) Affirmed 17 August 2017
Click here for full list of ratings
Financial Summary
(USD Mil.) Dec 2015 Dec 2016 Dec 2017F Dec 2018F
Operating EBITDA (Before Income from Associates) 1,099 966 984 1,181
Operating EBITDA Margin (%) 22.7 19.9 20.3 22.0
FFO Margin (%) 15.2 11.2 14.3 15.6
FFO Adjusted Leverage (x) 4.6 6.0 4.7 3.9
Total Net Debt with Equity Credit/Operating EBITDA (x) 3.3 3.8 3.8 2.9
Source: Fitch.
Fitch Ratings downgraded Empresas CMPC S.A.’s ratings on Aug. 17, 2017, reflecting the company’s weaker than
expected cash flow generation, which has not allowed it to reduce debt in the last few years. Cash generation was
hindered by soft pulp prices, lower sales in the paper division and the strengthening of the Brazilian real, although
pulp sales volume increased. CMPC’s net leverage remains high and is not consistent with Fitch’s prior expectations
of fast deleveraging following two years of operations of the Guaiba II pulp mill. Fitch expects cash generation to be
negatively affected by the unplanned stoppage of Guaiba II during 2017, while more robust cash generation is
expected for 2019 and 2020 due to higher pulp prices. After five years of oversupply from new projects in the market,
which significantly pressured pulp prices, new projects in the pipeline have reduced.
Key Rating Drivers
Leverage Reduction Slower than Expected: CMPC’s net debt/EBITDA was 3.9x in the LTM ended June 30, 2017,
per Fitch’s calculation, and is higher than previously projected. Fitch’s base case projects net leverage to decrease to
about 3.0x by the end of 2018 and below 3.0x onward, which is consistent with the ‘BBB’ category. These
assumptions consider low-cycle price assumptions of net hardwood and softwood pulp prices between USD550 and
USD625 per ton during the next three years. In Fitch’s opinion, CMPC’s financial strategy approved in 2017
demonstrates the company’s commitment to leverage reduction.
Positive FCF in 2017: Fitch projects that CMPC will generate about USD984 billion of adjusted EBITDA in 2017.
Fitch’s projections consider about USD180 million lower EBITDA as it incorporate the loss of pulp sales of about
550,000 tons in 2017 due to the unplanned stoppage of the Guaiba II mill. CMPC generated USD983 million of
EBITDA, and cash flow from operations (CFFO) was USD543 million during the LTM ended June 30, 2017,
compared with USD1.1 billion and USD677 million, respectively, during 2015. Despite higher pulp sales volume,
results were negatively affected by soft pulp prices, lower sales in the paper division and the strengthening of the
Brazilian real. Due to the scaling back of investments, CMPC’s FCF was USD60 million in the LTM ended June 30,
2017. Fitch expects FCF to remain positive from 2017 onward, which will allow CMPC to gradually reduce debt.
Solid Pulp Position: CMPC has a strong position in market pulp, as it is the third-largest market pulp producer
globally, with an annual production capacity of hardwood and softwood pulp of 4.1 million tons. CMPC’s Guaiba II
pulp mill started operations in May 2015 and added 1.3 million tons of additional eucalyptus market pulp production
capacity in Brazil. Pulp and forest division sales generated 64% of the company’s 2016 EBITDA, making the

Corporates
Natural Resources / Chile
Empresas CMPC S.A.
August 25, 2017 2
company more exposed to the cyclical nature of the pulp segment. The company’s cash production costs are among
the world’s lowest for both hardwood and softwood pulp, ensuring long-term competitiveness.
Excellent Regional Tissue Business: CMPC’s credit ratings also reflect its strong business positions within Latin
America. The company is the leading tissue producer in Chile, Peru, Argentina and Uruguay and has a growing
presence in markets such as Brazil and Mexico. CMPC’s strong market position in tissue, which accounted for 25%
of EBITDA during 2016, is the result of the strong brand equity of its products, its low production cost structure, and
strong distribution network. CMPC is also the largest producer of packaging paper, boxboard, corrugated boxes and
multiwall bags in Chile. Its paper and paper products divisions accounted for an additional 11% of EBITDA.
Significant Forestry Investments: A key consideration that supports CMPC’s investment-grade profile is its
ownership of about 1 million hectares of land throughout Chile, Brazil, and Argentina, where the company has
developed about 677,000 hectares of forestry assets. The plantations are valued at USD3.6 billion. The nearly ideal
conditions for growing trees in the region make these plantations extremely efficient by global standards and give the
company a sustainable advantage in terms of cost of fiber and transportation costs between forest and mills.
Fitch does not expect a significant effect on wood supply due to the multiple forest fires in Chile that affected CMPC’s
plantations in the beginning of 2017. The company estimates that about 19,000 hectares of forest was affected (3%
of total plantations), resulting in a loss of approximately USD48 million.
Rating Derivation Relative to Peers
Rating Derivation versus Peers
Peer Comparison CMPC is the leading tissue producer in Latin America and is third-largest market pulp producer globally, after Fibria Celulose S.A. (BBB–/Stable) and Celulosa Arauco y Constitucion S.A. (BBB/Negative). As with other Latin American pulp producers, CMPC’s cash production costs are among the world’s lowest for both hardwood and softwood pulp, ensuring its long-term competitiveness. CMPC and Arauco are rated higher than the Brazilian peers due to their more diversified regional and business profiles, with operations in the more stable tissue and boards segments, respectively. Fibria and Suzano Papel e Celulose S.A. (BB+/Positive) have industrial facilities only in Brazil. Liquidity is historically strong for pulp producers. The deleveraging process for CMPC, Arauco and Klabin S.A. (BB+/Stable) after the startup of their pulp mills is taking longer than expected due to soft pulp prices during 2016. Fibria’s leverage is higher than its peers’, as the company is finalizing investments in a new pulp mill.
Parent-Subsidiary Linkage Inversiones CMPC is a wholly owned subsidiary of CMPC and is incorporated in the Cayman Islands as an exempted limited liability company. All of Inversiones CMPC’s debt is unconditionally guaranteed by CMPC. Its ratings have been linked to those of CMPC through Fitch’s parent and subsidiary rating linkage criteria.
Country Ceiling No Country Ceiling constraint was in effect for these ratings.
Operating Environment No operating environment influence was in effect for these ratings.
Other Factors Not applicable.
Source: Fitch.
Rating Sensitivities
Future Developments That May, Individually or Collectively, Lead to Positive Rating Action
A rating upgrade for CMPC is not likely in the near future.
Future Developments That May, Individually or Collectively, Lead to Negative Rating Action
An expectation that net leverage will remain above 3.0x during 2018, considering pulp prices remain
relatively unchanged;
Any change in the company’s strategy to reduce leverage and improve capital structure;
Deterioration in macroeconomic conditions in the countries in which the company has strong tissue
businesses.

Corporates
Natural Resources / Chile
Empresas CMPC S.A.
August 25, 2017 3
Liquidity and Debt Structure
Strong Liquidity: CMPC has a strong liquidity position. As of June 30, 2017, CMPC had USD1.1 billion of cash and
marketable securities and total debt was USD4.9 billion. CMPC’s liquidity is enhanced by a USD400 million unused
revolving committed credit facility. The company has a manageable debt maturity profile, with USD1.1 billion of debt
falling due in the short term, USD700 million from July 2018 to June 2019 and USD141 million from July 2019 to
June 2020. During 2017, CMPC will also pay about USD150 million as restitution to consumers of amounts unduly
paid in the Chilean tissue market, as agreed to with Chilean authorities. Fitch considered this amount as restricted
cash at the end of June 2017. As of June 30, 2017, total debt is composed of senior notes (71% of total debt), loans
from the Brazilian Development Bank (11%), working capital lines (12%) and others (6%). In April 2017, CMPC
concluded the issuance of a USD500 million green bond due in 2027.
Debt Maturities and Liquidity at June 30, 2017
Debt Maturities (USDm)
Short-Term 1,056
July 2018 to June 2019 700
July 2019 to June 2020 141
July 2020 to June 2021 133
July 2021 to June 2022 629
After 2,235
Total Debt 4,895
Liquidity Analysis (USDm)
Unrestricted Cash 1,110
Committed Banking Facilities 400
Available Undrawn Portion 400
Total Liquidity 1,510
Fitch Forecast 2017 FCF (post dividend) 117
Short-Term Debt 1,056
Liquidity Score [x] 1.5
Source: Fitch.
Corporates
Natural Resources / Chile
Empresas CMPC S.A.
August 25, 2017 4
Key Rating Issues
Solid Pulp Position and Excellent Regional Tissue Business
The Issue CMPC has a strong position in market pulp, as the third-largest market pulp producer globally. CMPC is also the leading tissue producer in Chile, Peru, Argentina and Uruguay and has a growing presence in Brazil and Mexico. The company has market shares of 76% in Chile and 83% in Uruguay and market shares of 44% in Argentina and 54% in Peru, with lower market shares in Brazil, Ecuador, Mexico and Colombia. CMPC is also the largest producer of packaging paper, boxboard, corrugated boxes and multiwall bags in Chile.
Our View CMPC’s cash production costs are among the world’s lowest for both hardwood and softwood pulp, ensuring its long-term competitiveness. CMPC’s strong market position in tissue is the result of the strong brand equity of its products, its low production cost structure and strong distribution network.
Timeline Ongoing Rating Impact: Positive
Leverage Reduction Slower than Expected
The Issue CMPC’s net leverage remains high and is not consistent with Fitch’s prior expectations of fast deleveraging following two years of operations of the Guaiba II pulp mill.
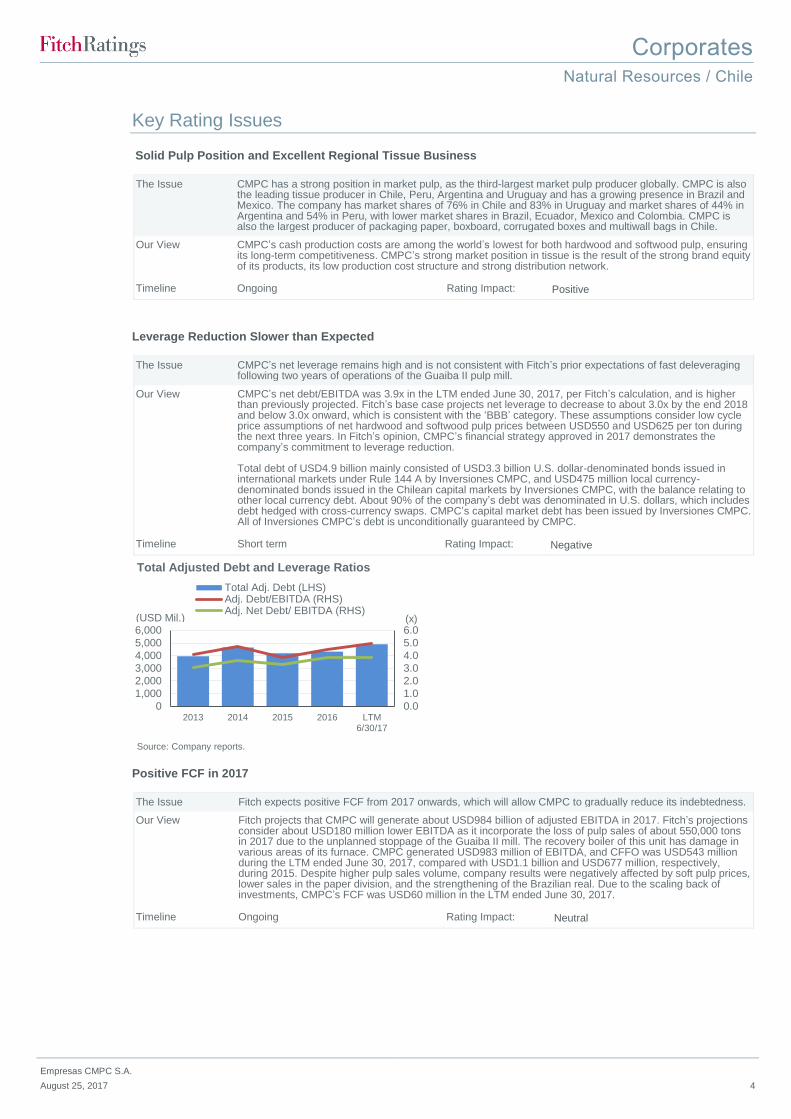
Our View CMPC’s net debt/EBITDA was 3.9x in the LTM ended June 30, 2017, per Fitch’s calculation, and is higher than previously projected. Fitch’s base case projects net leverage to decrease to about 3.0x by the end 2018 and below 3.0x onward, which is consistent with the ‘BBB’ category. These assumptions consider low cycle price assumptions of net hardwood and softwood pulp prices between USD550 and USD625 per ton during the next three years. In Fitch’s opinion, CMPC’s financial strategy approved in 2017 demonstrates the company’s commitment to leverage reduction. Total debt of USD4.9 billion mainly consisted of USD3.3 billion U.S. dollar-denominated bonds issued in international markets under Rule 144 A by Inversiones CMPC, and USD475 million local currency-denominated bonds issued in the Chilean capital markets by Inversiones CMPC, with the balance relating to other local currency debt. About 90% of the company’s debt was denominated in U.S. dollars, which includes debt hedged with cross-currency swaps. CMPC’s capital market debt has been issued by Inversiones CMPC. All of Inversiones CMPC’s debt is unconditionally guaranteed by CMPC.
Timeline Short term Rating Impact: Negative
Positive FCF in 2017
The Issue Fitch expects positive FCF from 2017 onwards, which will allow CMPC to gradually reduce its indebtedness.
Our View Fitch projects that CMPC will generate about USD984 billion of adjusted EBITDA in 2017. Fitch’s projections consider about USD180 million lower EBITDA as it incorporate the loss of pulp sales of about 550,000 tons in 2017 due to the unplanned stoppage of the Guaiba II mill. The recovery boiler of this unit has damage in various areas of its furnace. CMPC generated USD983 million of EBITDA, and CFFO was USD543 million during the LTM ended June 30, 2017, compared with USD1.1 billion and USD677 million, respectively, during 2015. Despite higher pulp sales volume, company results were negatively affected by soft pulp prices, lower sales in the paper division, and the strengthening of the Brazilian real. Due to the scaling back of investments, CMPC’s FCF was USD60 million in the LTM ended June 30, 2017.
Timeline Ongoing Rating Impact: Neutral
0.0
1.0
2.0
3.0
4.0
5.0
6.0
0
1,000
2,000
3,000
4,000
5,000
6,000
2013 2014 2015 2016 LTM6/30/17
Total Adj. Debt (LHS)Adj. Debt/EBITDA (RHS)Adj. Net Debt/ EBITDA (RHS)
Source: Company reports.
(USD Mil.) (x)
Total Adjusted Debt and Leverage Ratios

Corporates
Natural Resources / Chile
Empresas CMPC S.A.
August 25, 2017 5
Pulp and Tissue Are Leading Revenue Generators
The Issue Pulp and forest and tissue divisions accounted for 83% of CMPC’s revenues in 2016.
Our View Pulp and forest and tissue divisions were the company’s leading generators of revenue accounting for 46% and 37%, respectively, in 2016 and in first-half 2017. The market pulp and forest segment is CMPC’s largest EBITDA generator and represented about 64% of EBITDA in 2016 and 69% in first-half 2017. Pulp sales volume increased following the start-up of Guaiba II in May 2015. The company sold 3.188 million tons of market pulp in 2016 and 2.491 million tons in 2015. During first-half 2017, pulp sales volume was 1.540 million tons. CMPC’s pulp production in 2017 will be negatively affected by the unplanned downtime of Guaiba II mill due to the presence of damage in the recovery boiler. The company estimates a loss of production of 550,000 tons, considering the stoppage of operations for 38 days in February 2017 and for 109 days during August to November 2017. About 65% of forest and wood products are exported, mainly to the U.S., while domestic sales are concentrated in Chile. CMPC is the largest producer of tissue products in Latin America. Tissue accounted for 25% of the company’s EBITDA in 2016 and 21% in first-half 2017, mostly in the domestic market. The company sold 645,000 tons of tissue and 5.318 billion units of sanitary products in 2016, up 5% and 3%, respectively, from 2015. In 2017, the Canete mill in Peru started operations with an additional 54,000 tons of operational capacity. CMPC’s paper division accounted for 17% of sales and 11% of EBITDA in 2016, and 17% and 10%, respectively, in first-half 2017. About 40% of paper sales are exported, mainly to Latin America and Europe. Sales include boxboards, paper bags, other paper and the packaging business, including corrugated paper and corrugated boxes.
Timeline Ongoing Rating Impact: Positive
0
5
10
15
20
25
0
1,000
2,000
3,000
4,000
5,000
6,000
2013 2014 2015 2016 LTM 6/30/17
(USD Mil.) Net Revenue EBITDA EBITDA Margin (%)
Source: Company, Fitch.
Financial Performance — Annually
(%)
(2,000)
(1,500)
(1,000)
(500)
0
500
1,000
2013 2014 2015 2016 LTM 6/30/17
(USD Mil.)FFO Cash Flow from Operations Capex Dividends FCF
Source: Company, Fitch.
Cash Flow Performance(As of Dec. 31)

Corporates
Natural Resources / Chile
Empresas CMPC S.A.
August 25, 2017 6
Tissue37%
Pulp35%
Paper17%
Source: Company data, Fitch.
Net Revenues by Segment(2016)
Forest and Wood Products
11% Tissue25%
Paper11%
Source: Company data, Fitch.
Pulp/Forest and Wood Products
64%
EBITDA by Segment(2016)

Corporates
Natural Resources / Chile
Empresas CMPC S.A.
August 25, 2017 7
Trends and Forecasts
Empresas CMPC S.A. ——
Emerging BBB Cat
Median
——
Natural Resources Median ——
Note: Including Fitch expectations Source: Fitch
Definitions
EBITDAR Net Leverage: Total Adjusted Debt with Equity Credit - Readily Available Cash & Equivalents divided by Operating EBITDA + Operating Lease Expense for Capitalised Leased Assets + Recurring Dividends received from Associates and Equity Method Investments - Dividends paid to Minorities (or, alternatively, net income attributable to non-controlling interests). FFO Fixed Charge Cover: FFO + Gross Interest paid minus interest received + Preferred Dividends paid + Operating Lease Expense for Capitalised Leased Assets divided by Gross Interest Paid + Preferred Dividends Paid + Operating Lease Expense for Capitalised Leased Assets. FFO Margin: FFO divided by Revenues. FFO Interest Cover: FFO + Gross Interest paid minus interest received + Preferred Dividends paid divided by Gross Interest Paid + Preferred Dividends Paid.
0.0
0.5
1.0
1.5
2.0
2.5
3.0
3.5
4.0
4.5
2014 2015 2016 2017F 2018F 2019F
EBITDAR Net Leverage (x)
0.0
1.0
2.0
3.0
4.0
5.0
6.0
7.0
2014 2015 2016 2017F 2018F 2019F
FFO Fixed Charge Cover (x)
0.0
5.0
10.0
15.0
20.0
25.0
2014 2015 2016 2017F 2018F 2019F
FFO Margin (%)
0.0
1.0
2.0
3.0
4.0
5.0
6.0
7.0
2014 2015 2016 2017F 2018F 2019F
FFO Interest Cover (x)

Corporates
Natural Resources / Chile
Empresas CMPC S.A.
August 25, 2017 8
Key Assumptions
Fitch’s key assumptions within our rating case for the issuer include:
Pulp sales volume of 2.7 million tons in 2017 and 3.5 million tons in 2018;
Pulp prices between USD550 and USD625 per ton during 2017–2018;
Annual capex around USD500 million in 2017–2019;
CFFO between USD700 million and USD800 million during 2017–2018.
Financial Data
(USDth) Historical Forecast
Dec 2014 Dec 2015 Dec 2016 Dec 2017F Dec 2018F Dec 2019F
SUMMARY INCOME STATEMENT
Gross Revenue 4,837,121 4,841,141 4,865,737 4,834,375 5,362,625 5,628,875
Revenue Growth (%) -2.8 0.1 0.5 -0.6 10.9 5.0
Operating EBITDA (Before Income From Associates)
986,114 1,099,007 966,208 983,687 1,181,057 1,287,537
Operating EBITDA Margin (%) 20.4 22.7 19.9 20.3 22.0 22.9
Operating EBITDAR 986,114 1,099,007 966,208 983,687 1,181,057 1,287,537
Operating EBITDAR Margin (%)
20.4 22.7 19.9 20.3 22.0 22.9
Operating EBIT 345,464 410,739 186,747 543,629 737,891 841,426
Operating EBIT Margin (%) 7.1 8.5 3.8 11.2 13.8 14.9
Gross Interest Expense -189,521 -187,032 -209,430 -221,770 -208,421 -188,664
Pretax Income (Including Associate Income/Loss)
372,542 413,869 -35,578 313,859 541,470 664,762
SUMMARY BALANCE SHEET
Readily Available Cash and Equivalents
1,097,026 561,369 595,843 422,022 659,724 532,517
Total Debt With Equity Credit 4,643,633 4,194,493 4,315,034 4,187,562 4,042,674 3,711,092
Total Adjusted Debt with Equity Credit
4,643,633 4,194,493 4,315,034 4,187,562 4,042,674 3,711,092
Net Debt 3,546,607 3,633,124 3,719,191 3,765,540 3,382,950 3,178,575
SUMMARY CASH FLOW STATEMENT
Operating EBITDA 986,114 1,099,007 966,208 983,687 1,181,057 1,287,537
Cash Interest Paid -168,611 -178,752 -185,981 -221,770 -208,421 -188,664
Cash Tax -73,767 -117,121 -174,707 -84,742 -146,197 -179,486
Dividends Received Less Dividends Paid to Minorities (Inflow/(Out)flow)
0 0 0 0 0 0
Other Items Before FFO -115,886 -79,015 -71,400 0 0 0
Funds Flow From Operations 647,818 734,535 543,391 689,175 838,439 931,388
Change in Working Capital 64,589 -57,429 -42,693 39,211 -67,266 -81,430
Cash Flow From Operations (Fitch Defined)
712,407 677,106 500,698 728,386 771,172 849,957
Total Non-Operating/Non-Recurring Cash Flow
0 0 0

Corporates
Natural Resources / Chile
Empresas CMPC S.A.
August 25, 2017 9
Capex -1,573,549 -805,050 -525,378
Capital Intensity (Capex/Revenue)
32.5 16.6 10.8
Common Dividends -57,283 -30,014 -36,322
Net Acquisitions and Divestitures
871 5,744 894
Other Investing and Financing Cash Flow Items
-31,177 -128,034 67,701 -163,000 230,000 0
Net Debt Proceeds 872,216 -306,422 77,894 -127,472 -144,888 -331,582
Net Equity Proceeds 246,292 0 0 0 0 0
Total Change in Cash 169,777 -586,670 85,487 -173,821 237,702 -127,208
DETAIL CASH FLOW STATEMENT
FFO Margin (%) 13.4 15.2 11.2 14.3 15.6 16.5
Calculations for Forecast Publication
Capex, Dividends, Acquisitions and Other Items Before FCF
-1,629,961 -829,320 -560,806 -611,735 -618,582 -645,583
FCF After Acquisitions and Divestitures
-917,554 -152,214 -60,108 116,651 152,590 204,374
FCF Margin (After Net Acquisitions) (%)
-19.0 -3.1 -1.2 2.4 2.8 3.6
COVERAGE RATIOS
FFO Interest Coverage (x) 4.7 5.1 3.9 4.1 5.0 5.9
FFO Fixed-Charge Coverage (x)
4.7 5.1 3.9 4.1 5.0 5.9
Operating EBITDAR/Interest Paid + Rents (x)
5.8 6.1 5.2 4.4 5.7 6.8
Operating EBITDA/Interest Paid (x)
5.8 6.1 5.2 4.4 5.7 6.8
LEVERAGE RATIOS
Total Adjusted Debt/Operating EBITDAR (x)
4.7 3.8 4.5 4.3 3.4 2.9
Total Adjusted Net Debt/Operating EBITDAR (x)
3.6 3.3 3.8 3.8 2.9 2.5
Total Debt with Equity Credit/Operating EBITDA (x)
4.7 3.8 4.5 4.3 3.4 2.9
FFO-Adjusted Leverage (x) 5.8 4.6 6.0 4.7 3.9 3.3
FFO-Adjusted Net Leverage (x) 4.5 4.0 5.2 4.2 3.3 2.9
The forecast presented is based on the agency’s internally produced, conservative rating case forecast. It does not represent the forecast of the rated issuer. The forecast set out above is only one component used by Fitch to assign a rating or determine a rating outlook, and the information in the forecast reflects material but not exhaustive elements of Fitch’s rating assumptions for the issuer’s financial performance. As such, it cannot be used to establish a rating, and it should not be relied on for that purpose. Fitch’s forecasts are constructed using a proprietary internal forecasting tool, which employs Fitch’s own assumptions on operating and financial performance that may not reflect the assumptions that you would make. Fitch’s own definitions of financial terms such as EBITDA, debt or free cash flow may differ from your own such definitions. Fitch may be granted access, from time to time, to confidential information on certain elements of the issuer’s forward planning. Certain elements of such information may be omitted from this forecast, even where they are included in Fitch’s own internal deliberations, where Fitch, at its sole discretion, considers the data may be potentially sensitive in a commercial, legal or regulatory context. The forecast (as with the entirety of this report) is produced strictly subject to the disclaimers set out at the end of this report. Fitch may update the forecast in future reports but assumes no responsibility to do so.

Corporates
Natural Resources / Chile
Empresas CMPC S.A.
August 25, 2017 10
Rating Navigator
Corporates Ratings NavigatorGeneric
aaa AAA Stable
aa+ AA+ Stable
aa AA Stable
aa- AA- Stable
a+ A+ Stable
a A Stable
a- A- Stable
bbb+ BBB+ Stable
bbb BBB Stable
bbb- BBB- Stable
bb+ BB+ Stable
bb BB Stable
bb- BB- Stable
b+ B+ Stable
b B Stable
b- B- Stable
ccc CCC Stable
cc CC Stable
c C Stable
d or rd D or RD Stable
Issuer Default
Rating
Factor
Levels
Sector Risk
Profile
Operating
EnvironmentFinancial
Flexibility
Financial
StructureProfitabilityDiversification
Company's
Market PositionSector Trend
Sector
Competitive
Intensity
Management
and Corporate
Governance
Business Profile Financial Profile
Empresas CMPC S.A.

Corporates
Natural Resources / Chile
Empresas CMPC S.A.
August 25, 2017 11
Operating Environment Management and Corporate Governance
a- bbb aa- a
bbb+ bbb a+ a
a a aa
b- a- bbb
ccc bbb+
Sector Competitive Intensity Sector Trend
bbb+ bbb a+ bbb
bbb bb a bbb
bbb- bbb a- aa
bb+ bbb+
bb bbb
Company's Market Position Diversification
a a bbb bbb
a- bbb bbb- bb
bbb+ bbb bb+
bbb bb
bbb- bb-
Profitability Financial Structure
bbb bbb bbb bbb
bbb- b bbb- bbb
bb+ bb bb+ ccc
bb bbb bb bbb
bb- bbb bb-
Financial Flexibility
a a
a- bbb
bbb+ bbb
bbb bbb
bbb- bbbNavigator Version: RN 1.39.48.0
FFO Margin
Operating Efficiency
12%
Financial Transparency
Group Structure
Financial Sponsor
Attitude (LBO only)
Relative Power in Value Chain Balanced relative bargaining power with suppliers and customers.
Industry Structure
Barriers to Entry/Exit
Market Share
Return on invested capital in line with industry average.
Competitive Advantage
Top-three player in most markets or leader in a well defined and protected niche.
1%
7%
How to Read This Page: The left column shows the three-notch band assessment for the overall Factor, illustrated by a bar.
The right column breaks down the Factor into Sub-Factors, with a description appropriate for each Sub-Factor and its
corresponding category.
EBITDAR/(Gross Interest +
Rents)
FX Exposure
FFO Fixed Charge Cover
Liquidity
Financial Discipline
EBITDAR Margin
Volatility of Profitability
FCF Margin
EBIT Margin
Product/End-MarketSome competitive advantages with reasonably good sustainability.
Long-Term Growth
Potential
Governance Structure
Management Strategy
Financial Access
Economic Environment
Systemic Governance
Coherent strategy and good track record in implementation.
Systemic governance (eg rule of law, corruption; government effectiveness) of
the issuer’s country of incorporation consistent with ‘a’.
Average combination of issuer specific funding characteristics and of the
strength of the relevant local financial market.
Average combination of countries where economic value is created and where
assets are located.
Focus on a couple of business lines/end markets.
Some geographical diversification but imbalance between growth and mature
markets.
Funding Structure (LBO
only)
Lease Adjusted Gross
Debt/EBITDAR
Net Debt/(CFO - Capex)
3.0x
8.0x+
3.0x
3.5x
Lease Adjusted FFO Net
Leverage
Lease Adjusted FFO
Gross Leverage
4.5x
Some exposure of profitability to FX movements and/or debt/cash-flow match.
Effective hedging in place.
4x
One year liquidity ratio above 1.25x. Well-spread maturity schedule of debt but
funding may be less diversified.
Clear commitment to maintain a conservative policy with only modest deviations
allowed.
20%
Volatility of profits in line with industry average.
Geographic
Diversification
Threat of Substitutes
n.a.
Good quality reporting without significant failing. Consistent with the average of
listed companies in major exchanges.
Transparent group structure.
Experienced board exercising effective check and balances. Ownership can be
concentrated among several shareholders.
No substitute. Product is a must have for customers.
Demand volatility in line with economic cycles.
Mature industry. Traditional markets may be under some pressure but
opportunities arise in new markets.
Some barriers to entry but incumbents do not benefit from particularly strong
positions that new entrants cannot replicate.
Larger number of competitors with some track record of price discipline in
downturns.
Volatility of Demand

Corporates
Natural Resources / Chile
Empresas CMPC S.A.
August 25, 2017 12
Simplified Group Structure Diagram
Simplified Organizational Structure — Empresas CMPC S.A.
(As of June 30, 2017)
IDR – Issuer Default Rating.
Source: CMPC.
Empresas CMPC S.A.
IDR — BBB/Stable
Inversiones CMPC
IDR — BBB/Stable
Forestal Mininco
CMPC Celulosa CMPC Papeles CMPC Tissue
(100.00%)
CMPC Maderas
Servicios
Compartidos CMPC
Papeles CordilleraCartulinas CMPC
Chimolsa EDIPAC
Envases Impresos
Roble Alto
Forsac Argentina
Sorepa
Forsac Chile
Papelera del Plata
Bosques del Plata
Protisa Peru
Ipusa
Dypers Andina
Absormex
Melhoramentos
Protisa Ecuador
Forsac Peru
Forsac Mexico
Rio Grandense
Chile
Argentina
Peru
Uruguay
Colombia
Mexico
Brazil
Matte Group Chilean and Foreign Investors Chilean Pension Funds
(56.00%) (10.00%)(34.00%)
Ecuador
(51.90%) (100.00%) (100.00%) (100.00%)
(100.00%) (100.00%)
(100.00%)
(100.00%) (100.00%)
(100.00%) (50.00%)
(100.00%)
(100.00%)
(100.00%)
(100.00%)
(50.00%)
(99.90%)
(100.00%)
(100.00%)
(100.00%)
(100.00%)
(99.62%)
(100.00%)
(100.00%)
(100.00%)
(100.00%)
(48.10%)

Corporates
Natural Resources / Chile
Empresas CMPC S.A.
August 25, 2017 13
Peer Financial Summary
Company Date Rating Operating EBITDA (Before
Income From Associates)
(USDm)
Readily Available
Cash (USDm)
Total Adjusted
Debt With Equity Credit
(USDm)
Cash Flow from
Operations (USDm)
Total Adjusted Net
Debt/Operating EBITDAR (x)
Empresas CMPC S.A. 2016 BBB+ 966 596 4,315 501 3.8
2015 BBB+ 1,099 561 4,194 677 3.3
2014 BBB+ 986 1,097 4,644 712 3.6
Celulosa Arauco y Constitucion S.A.
2016 BBB 1,027 592 4,614 732 3.9
2015 BBB 1,276 500 4,533 860 3.1
2014 BBB 1,265 971 5,196 997 3.3
Masisa S.A. 2016 B+ 119 64 731 52 5.6
2015 B+ 157 110 817 34 4.5
2014 BB 194 114 768 18 3.4
Fibria Celulose S.A. 2016 BBB- 1,146 1,442 5,513 1,197 3.6
2015 BBB- 1,381 655 3,722 1,004 2.2
2014 BBB- 1,040 450 3,598 877 3.0
Suzano Papel e Celulose S.A.
2016 BB+ 1,136 1,134 4,618 958 3.1
2015 BB 1,144 627 4,150 663 3.1
2014 BB 916 1,388 5,619 383 4.6
Klabin S.A. 2016 BBB- 687 1,984 5,804 241 5.6
2015 BBB- 493 1,437 4,713 373 6.6
2014 BBB- 632 2,163 4,272 679 3.3
Eldorado Brasil Celulose S.A.
2016 B+ 391 370 2,794 206 6.2
2015 386 353 2,411 197 5.3
2014 223 39 2,848 88 12.6
Source: Fitch.

Corporates
Natural Resources / Chile
Empresas CMPC S.A.
August 25, 2017 14
Reconciliation of Key Financial Metrics
Reconciliation of Key Financial Metrics for Empresas CMPC S.A.
(USD Thousand, Last Twelve Months) 30 jun 2017
Income Statement Summary
Operating EBITDA 982.898
+ Recurring Dividends Paid to Non-controlling Interest 0
+ Recurring Dividends Received from Associates 0
+ Additional Analyst Adjustment for Recurring I/S Minorities and Associates 0
= Operating EBITDA After Associates and Minorities (k) 982.898
+ Operating Lease Expense Treated as Capitalised (h) 0
= Operating EBITDAR after Associates and Minorities (j) 982.898
Debt & Cash Summary
Total Debt w ith Equity Credit (l) 4.894.915
+ Lease-Equivalent Debt 0
+ Other Off-Balance-Sheet Debt 0
= Total Adjusted Debt w ith Equity Credit (a) 4.894.915
Readily Available Cash [Fitch-Defined] 1.109.726
+ Readily Available Marketable Securities [Fitch-Defined] 0
= Readily Available Cash & Equivalents (o) 1.109.726
Total Adjusted Net Debt (b) 3.785.189
Cash-Flow Summary
Preferred Dividends (Paid) (f) 0
Interest Received 10.955
+ Interest (Paid) (d) -190.288
= Net Finance Charge (e) -179.333
Funds From Operations [FFO] ( c) 600.761
+ Change in Working Capital [Fitch-Defined] -57.644
= Cash Flow from Operations [CFO] (n) 543.117
Capital Expenditures (m) -478.508
Multiple applied to Capitalised Leases 0,0
Gross Leverage
Total Adjusted Debt / Op. EBITDAR* [x] (a/j) 5,0
FFO Adjusted Gross Leverage [x] (a/(c-e+h-f)) 6,3
Total Adjusted Debt/(FFO - Net Finance Charge + Capitalised Leases - Pref. Div. Paid)
Total Debt With Equity Credit / Op. EBITDA* [x] (l/k) 5,0
Net Leverage
Total Adjusted Net Debt / Op. EBITDAR* [x] (b/j) 3,9
FFO Adjusted Net Leverage [x] (b/(c-e+h-f)) 4,9
Total Adjusted Net Debt/(FFO - Net Finance Charge + Capitalised Leases - Pref. Div. Paid)
Total Net Debt / (CFO - Capex) [x] ((l-o)/(n+m)) 58,6
Coverage
Op. EBITDAR / (Interest Paid + Lease Expense)* [x] (j/-d+h) 5,2
Op. EBITDA / Interest Paid* [x] (k/(-d)) 5,2
FFO Fixed Charge Cover [x] ((c-e+h-f)/(-d+h-f)) 4,1
(FFO - Net Finance Charge + Capit. Leases - Pref. Div Paid) / (Gross Int. Paid + Capit. Leases - Pref. Div. Paid)
FFO Gross Interest Coverage [x] ((c-e-f)/(-d-f)) 4,1
(FFO - Net Finance Charge - Pref. Div Paid) / (Gross Int. Paid - Pref. Div. Paid)
* EBITDA/R after Dividends to Associates and M inorities
Source: Fitch based on company reports

Corporates
Natural Resources / Chile
Empresas CMPC S.A.
August 25, 2017 15
Fitch Adjustment Reconciliation
Reported
Values
Sum of Fitch
Adjustments
- CORP -
Factoring Adjusted Values
31 dez 16
Income Statement Summary
Revenue 4.865.737 0 4.865.737
Operating EBITDAR 966.208 0 966.208
Operating EBITDAR after Associates and Minorities 966.208 0 966.208
Operating Lease Expense 0 0 0
Operating EBITDA 966.208 0 966.208
Operating EBITDA after Associates and Minorities 966.208 0 966.208
Operating EBIT 186.747 0 186.747
Debt & Cash Summary
Total Debt With Equity Credit 4.272.034 43.000 43.000 4.315.034
Total Adjusted Debt With Equity Credit 4.272.034 43.000 43.000 4.315.034
Lease-Equivalent Debt 0 0 0
Other Off-Balance Sheet Debt 0 0 0
Readily Available Cash & Equivalents 595.843 0 595.843
Not Readily Available Cash & Equivalents 0 0 0
Cash-Flow Summary
Preferred Dividends (Paid) 0 0 0
Interest Received 9.271 0 9.271
Interest (Paid) -185.981 0 -185.981
Funds From Operations [FFO] 543.391 0 543.391
Change in Working Capital [Fitch-Defined] 307 -43.000 -43.000 -42.693
Cash Flow from Operations [CFO] 543.698 -43.000 -43.000 500.698
Non-Operating/Non-Recurring Cash Flow 0 0 0
Capital (Expenditures) -525.378 0 -525.378
Common Dividends (Paid) -36.322 0 -36.322
Free Cash Flow [FCF] -18.002 -43.000 -43.000 -61.002
Gross Leverage
Total Adjusted Debt / Op. EBITDAR* [x] 4,4 4,5
FFO Adjusted Leverage [x] 5,9 6,0
Total Debt With Equity Credit / Op. EBITDA* [x] 4,4 4,5
Net Leverage
Total Adjusted Net Debt / Op. EBITDAR* [x] 3,8 3,8
FFO Adjusted Net Leverage [x] 5,1 5,2
Total Net Debt / (CFO - Capex) [x] 200,7 -150,7
Coverage
Op. EBITDAR / (Interest Paid + Lease Expense)* [x] 5,2 5,2
Op. EBITDA / Interest Paid* [x] 5,2 5,2
FFO Fixed Charge Coverage [x] 3,9 3,9
FFO Interest Coverage [x] 3,9 3,9
*EBITDA/R after Dividends to Associates and Minorities

Corporates
Natural Resources / Chile
Empresas CMPC S.A.
August 25, 2017 16
FX Screener
About 50% of CMPC’s revenues are denominated in U.S. dollars and 25% in Chilean pesos and Brazilian reals, while
40% of costs are denominated in U.S. dollars and 45% in Chilean pesos and Brazilian reals. The depreciation of local
currencies has a positive effect on the company’s margins. About 90% of CMPC’s debt is denominated in U.S.
dollars, which includes debt hedged with cross-currency swaps.
Full List of Ratings
Rating Outlook Last Rating Action
Empresas CMPC S.A.
Local Currency Long-Term IDR BBB Stable Downgrade 17 August 2017
Long-Term IDR BBB Stable Downgrade 17 August 2017
National Equity Rating Primera Clase Nivel 1(chl)
Affirmed 17 August 2017
National Long-Term Rating AA-(chl) Stable Downgrade 17 August 2017
National Short-Term Rating N1+(chl) Affirmed 17 August 2017
Inversiones CMPC
Long-Term IDR BBB Stable Downgrade 17 August 2017
National Long-Term Rating AA-(chl) Stable Downgrade 17 August 2017
National Short-Term Rating N1+(chl) Affirmed 17 August 2017
Senior Unsecured Long-Term Notes BBB Downgrade 17 August 2017
Senior Unsecured Long-Term Debt Denominated in Chilean Pesos
AA-(chl) Downgrade 17 August 2017
Commercial Paper Denominated in Chilean Pesos AA-(chl) Downgrade 17 August 2017
2.504.616
1.570.270
934.346
950.582
854.489
96.093
3.454.842
3.454.842
2.504.616
2.456.064
48.552
105.620255.237
0383.871 234.255
0%
10%
20%
30%
40%
50%
60%
70%
80%
90%
100%
Revenue* Costs* EBITDA Total debt* Total cash* Net debt*
Reported currency (ST) Reported currency (LT)
Foreign currency (ST) Foreign currency (LT)
Fitch FX Screener
Source: Fitch
(Empresas CMPC S.A. — BBB/Stable, LTM jun-17, USDth)
*Post hedge, absolute figures displayed are Fitch’s analytical estimates, based on publicly available information

Corporates
Natural Resources / Chile
Empresas CMPC S.A.
August 25, 2017 17
Related Research & Criteria
Corporate Rating Criteria (August 2017)
National Scale Ratings Criteria (March 2017)
Parent and Subsidiary Rating Linkage (August 2016)
Analysts
Fernanda Rezende
+55 21 4503-2619
Rodolfo Schmauk
+56 2 2499-3341

Corporates
Natural Resources / Chile
Empresas CMPC S.A.
August 25, 2017 18
The ratings above were solicited and assigned or maintained at the request of the rated entity/issuer or a related third
party. Any exceptions follow below.
ALL FITCH CREDIT RATINGS ARE SUBJECT TO CERTAIN LIMITATIONS AND DISCLAIMERS. PLEASE READ THESE LIMITATIONS
AND DISCLAIMERS BY FOLLOWING THIS LINK: HTTPS://FITCHRATINGS.COM/UNDERSTANDINGCREDITRATINGS. IN
ADDITION, RATING DEFINITIONS AND THE TERMS OF USE OF SUCH RATINGS ARE AVAILABLE ON THE AGENCY’S PUBLIC WEB
SITE AT WWW.FITCHRATINGS.COM. PUBLISHED RATINGS, CRITERIA, AND METHODOLOGIES ARE AVAILABLE FROM THIS SITE
AT ALL TIMES. FITCH’S CODE OF CONDUCT, CONFIDENTIALITY, CONFLICTS OF INTEREST, AFFILIATE FIREWALL, COMPLIANCE,
AND OTHER RELEVANT POLICIES AND PROCEDURES ARE ALSO AVAILABLE FROM THE CODE OF CONDUCT SECTION OF THIS
SITE. FITCH MAY HAVE PROVIDED ANOTHER PERMISSIBLE SERVICE TO THE RATED ENTITY OR ITS RELATED THIRD PARTIES.
DETAILS OF THIS SERVICE FOR RATINGS FOR WHICH THE LEAD ANALYST IS BASED IN AN EU-REGISTERED ENTITY CAN BE
FOUND ON THE ENTITY SUMMARY PAGE FOR THIS ISSUER ON THE FITCH WEBSITE.
Copyright © 2017 by Fitch, Inc., Fitch Ratings Ltd. and its subsidiaries. 33 Whitehall Street, New York, NY 10004. Telephone: 1-800-753-4824, (212) 908-0500. Fax: (212) 480-4435. Reproduction or retransmission in whole or in part is prohibited except by permission. All rights reserved. In issuing and maintaining its ratings and in making other reports (including forecast information), Fitch relies on factual information it receives from issuers and underwriters and from other sources Fitch believes to be credible. Fitch
conducts a reasonable investigation of the factual information relied upon by it in accordance with its ratings methodology, and obtains reasonable verification of that information from independent sources, to the extent such sources are available for a given security or in a given jurisdiction. The manner of Fitch’s factual investigation and the scope of the third-party verification it obtains will vary depending on the nature of the rated security and its issuer, the requirements and practices in the jurisdiction in which the rated
security is offered and sold and/or the issuer is located, the availability and nature of relevant public information, access to the management of the issuer and its advisers, the availability of pre-existing third-party verifications such as audit reports, agreed-upon procedures letters, appraisals, actuarial reports, engineering reports, legal opinions and other reports provided by third parties, the availability of independent and competent third-party verification sources with respect to the particular security or in the particular
jurisdiction of the issuer, and a variety of other factors. Users of Fitch’s ratings and reports should understand that neither an enhanced factual investigation nor any third-party verification can ensure that all of the information Fitch relies on in connection with a rating or a report will be accurate and complete. Ultimately, the issuer and its advisers are responsible for the accuracy of the information they provide to Fitch and to the market in offering documents and other reports. In issuing its ratings and its reports, Fitch must
rely on the work of experts, including independent auditors with respect to financial statements and attorneys with respect to legal and tax matters. Further, ratings and forecasts of financial and other information are inherently forward-looking and embody assumptions and predictions about future events that by their nature cannot be verified as facts. As a result, despite any verification of current facts, ratings and forecasts can be affected by future events or conditions that were not anticipated at the time a rating or
forecast was issued or affirmed. The information in this report is provided “as is” without any representation or warranty of any kind. A Fitch rating is an opinion as to the creditworthiness of a security. This
opinion is based on established criteria and methodologies that Fitch is continuously evaluating and updating. Therefore, ratings are the collective work product of Fitch and no individual, or group of individuals, is solely responsible for a rating. The rating does not address the risk of loss due to risks other than credit risk, unless such risk is specifically mentioned. Fitch is not engaged in the offer or sale of any security. All Fitch reports have shared authorship. Individuals identified in a Fitch report were involved in, but are not
solely responsible for, the opinions stated therein. The individuals are named for contact purposes only. A report providing a Fitch rating is neither a prospectus nor a substitute for the information assembled, verified and presented to investors by the issuer and its agents in connection with the sale of the securities. Ratings may be changed or withdrawn at anytime for any reason in the sole discretion of Fitch. Fitch does not provide investment advice of any sort. Ratings are not a recommendation to buy, sell, or hold
any security. Ratings do not comment on the adequacy of market price, the suitability of any security for a particular investor, or the tax-exempt nature or taxability of payments made in respect to any security. Fitch receives fees from issuers, insurers, guarantors, other obligors, and underwriters for rating securities. Such fees generally vary from US$1,000 to US$750,000 (or the applicable currency equivalent) per issue. In certain cases, Fitch will rate all or a number of issues issued by a particular issuer, or insured or
guaranteed by a particular insurer or guarantor, for a single annual fee. Such fees are expected to vary from US$10,000 to US$1,500,000 (or the applicable currency equivalent). The assignment, publication, or dissemination of a rating by Fitch shall not constitute a consent by Fitch to use its name as an expert in connection with any registration statement filed under the United States securities laws, the Financial Services and Markets Act 2000 of the United Kingdom, or the securities laws of any particular
jurisdiction. Due to the relative efficiency of electronic publishing and distribution, Fitch research may be available to electronic subscribers up to three days earlier than to print subscribers.
For Australia, New Zealand, Taiwan and South Korea only: Fitch Australia Pty Ltd holds an Australian financial services license (AFS license no. 337123) which authorizes it to provide credit ratings to wholesale clients only. Credit ratings information published by Fitch is not intended to be used by persons who are retail clients within the meaning of the Corporations Act 2001.