Embed Size (px)
Citation preview

Corporate Investor Presentation
Full Cycle Oilfield Consumable Chemical Solutions
April 2016
Forward-looking Information and Statements
Certain statements in this presentation may constitute forward-looking information or forward-looking statements (collectively referred to as “forward-looking information”) which involves
known and unknown risks, uncertainties and other factors which may cause the actual results, performance or achievements of CES, or industry results, to be materially different from
any future results, performance or achievements expressed or implied by such forward-looking information. When used in this presentation, such information uses such words as “may”,
“would”, “could”, “will”, “intend”, “expect”, “believe”, “plan”, “anticipate”, “estimate”, and other similar terminology. This information reflects CES’ current expectations regarding future
events and operating performance and speaks only as of the date of the presentation. Forward-looking information involves significant risks and uncertainties, should not be read as a
guarantee of future performance or results, and will not necessarily be an accurate indication of whether or not such results will be achieved. A number of factors could cause actual
results to differ materially from the results discussed in the forward-looking information, including, but not limited to, the factors discussed below. The management of CES believes the
material factors, expectations and assumptions reflected in the forward-looking information and statements are reasonable but no assurance can be given that these factors,
expectations and assumptions will prove to be correct. The forward-looking information and statements contained in this document speak only as of the date of the document, and CES
assumes no obligation to publicly update or revise them to reflect new events or circumstances, except as may be required pursuant to applicable securities laws or regulations. The
material assumptions in making forward-looking statements include, but are not limited to, the factors discussed below. The management of CES believes the material factors,
expectations and assumptions reflected in the forward-looking information and statements are reasonable but no assurance can be given that these factors, expectations and
assumptions will prove to be correct.
In particular, this presentation may contain forward-looking information pertaining to the following: future estimates as to dividend levels; the potential means of funding dividends; the
intention to make future dividend payments; the seasonality of CES’ business and anticipated reduction in exposure to the effects of spring break-up in the WCSB; the duration of spring
break-up; the certainty and predictability of future cash flows and earnings; the sufficiency of liquidity and capital resources to meet long-term payment obligations; the long-term capital
investments required for CES to execute on its business plan; the amount of CES’ non-acquisition related capital expenditures, including maintenance capital and discretionary
expansion capital; the expected timing for completion of expansions at JACAM facilities; the anticipated timing for completion of the laboratories in Midland and Houston Texas;
management’s opinion of the impact of any potential litigation or disputes; potential outcomes of the CRA’s intent to challenge the Canadian tax consequences of the Conversion; the
application of critical accounting estimates and judgements; the collectability of accounts receivable; CES’ ability to increase or maintain its market share, including expectations that
PureChem, Sialco and JACAM will increase market-share in the oilfield consumable chemical market; supply and demand for CES’ products and services, including expectations for
growth in CES’ production and speciality chemical sales and expected growth in the consumable chemicals market; industry activity levels; commodity prices; treatment under
governmental regulatory and taxation regimes; expectations regarding expansion of services in Canada and the United States; development of new technologies; expectations
regarding CES’ growth opportunities in Canada and the United States; the effect of acquisitions on the Company; expectations regarding the performance or expansion of CES’
operations; expectations regarding demand for CES’ services and technology; investments in research and development and technology advancements; access to debt and capital
markets; and competitive conditions.
CES’ actual results could differ materially from those anticipated in the forward-looking information as a result of the following factors: general economic conditions in Canada, the United
States, and internationally; geopolitical risk; fluctuations in demand for consumable fluids and chemical oilfield services, and the recent downturn in oilfield activity; a decline in activity in
the WCSB, the Permian and other basins in which the Company operates; volatility in market prices for oil, natural gas, and natural gas liquids and the effect of this volatility on the
demand for oilfield services generally; the recent declines in prices for oil, and pricing differentials between world pricing and pricing in North America; competition, and pricing pressures
from customers in the current commodity environment; currency risk as a result of recent fluctuations in value of the U.S. dollar; liabilities and risks, including environmental liabilities and
risks inherent in oil and natural gas operations; sourcing, pricing and availability of raw materials, consumables, component parts, equipment, suppliers, facilities, and skilled
management, technical and field personnel; the collectability of accounts receivable, particularly in the current low oil and natural gas price environment; ability to integrate technological
advances and match advances of competitors; availability of capital; uncertainties in weather and temperature affecting the duration of the oilfield service periods and the activities that
can be completed; the ability to successfully integrate and achieve synergies from the Company’s acquisitions; changes in legislation and the regulatory environment, including
uncertainties with respect to programs to reduce greenhouse gas and other emissions and regulations restricting the use of hydraulic fracturing; reassessment and audit risk associated
with the Conversion and other tax filing matters; changes to the fiscal regimes applicable to entities operating in the WCSB and the US; access to capital and the liquidity of debt
markets; fluctuations in foreign exchange and interest rates, and the other factors considered under “Risk Factors” in CES’ Annual Information Form for the year ended December 31,
2014 and “Risks and Uncertainties” in the September 30, 2015 management’s discussion and analysis.
.
page 2
page 3
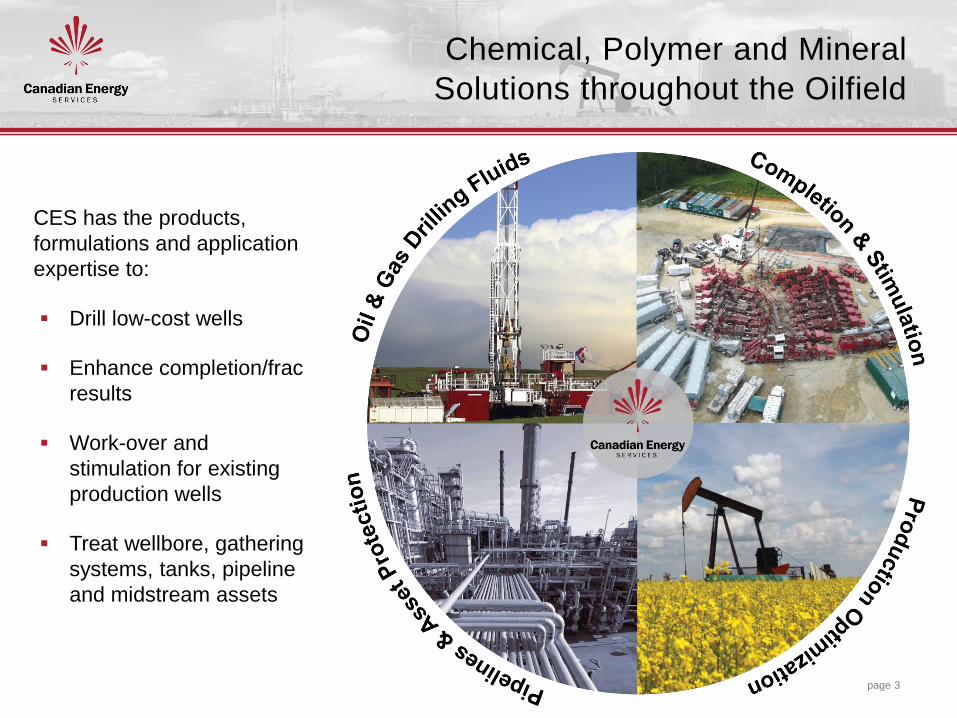
CES has the products,
formulations and application
expertise to:
Drill low-cost wells
Enhance completion/frac
results
Work-over and
stimulation for existing
production wells
Treat wellbore, gathering
systems, tanks, pipeline
and midstream assets
Chemical, Polymer and Mineral
Solutions throughout the Oilfield
page 4
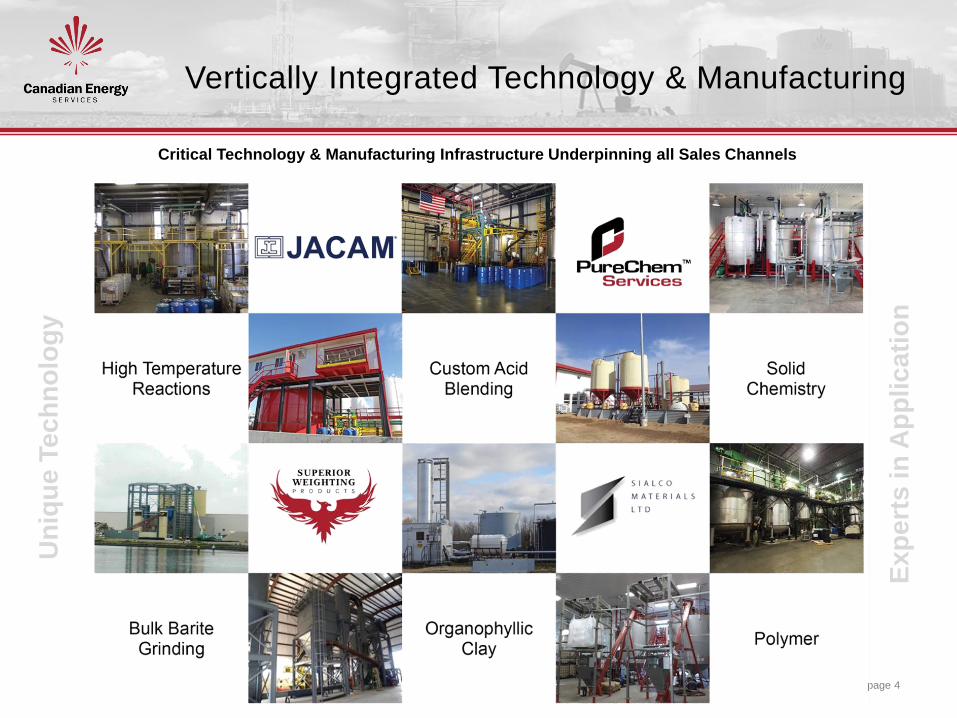
Critical Technology & Manufacturing Infrastructure Underpinning all Sales Channels
Vertically Integrated Technology & Manufacturing U
niq
ue
Te
ch
no
log
y
Ex
pe
rts
in
Ap
pli
ca
tio
n
2001 2006 2008 2010 2011 2012 2013 2014 2015
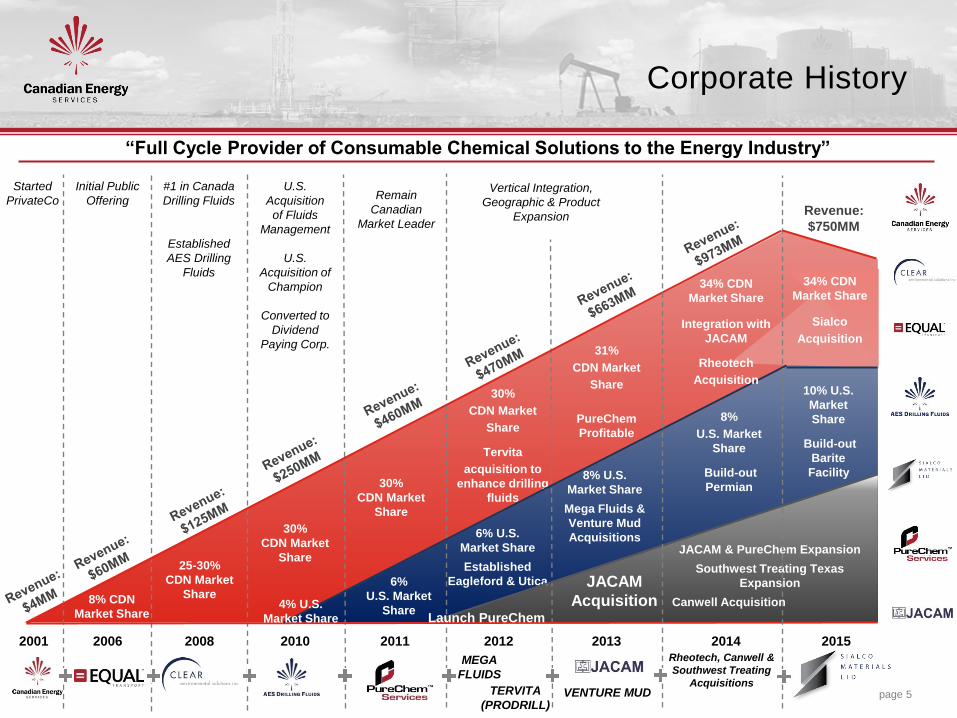
Corporate History
page 5
“Full Cycle Provider of Consumable Chemical Solutions to the Energy Industry”
Started
PrivateCo
Initial Public
Offering
#1 in Canada
Drilling Fluids
Established
AES Drilling
Fluids
U.S.
Acquisition
of Fluids
Management
U.S.
Acquisition of
Champion
Converted to
Dividend
Paying Corp.
Remain
Canadian
Market Leader
TERVITA
(PRODRILL)
25-30%
CDN Market
Share
30%
CDN Market
Share
30%
CDN Market
Share
Vertical Integration,
Geographic & Product
Expansion
30%
CDN Market
Share
Tervita
acquisition to
enhance drilling
fluids
31%
CDN Market
Share
PureChem
Profitable
VENTURE MUD
6%
U.S. Market
Share
6% U.S.
Market Share
Established
Eagleford & Utica
8% U.S.
Market Share
Mega Fluids &
Venture Mud
Acquisitions
JACAM
Acquisition 8% CDN
Market Share
MEGA
FLUIDS
4% U.S.
Market Share
Launch PureChem
JACAM & PureChem Expansion
Southwest Treating Texas
Expansion
Canwell Acquisition
Rheotech, Canwell &
Southwest Treating
Acquisitions
34% CDN
Market Share
Sialco
Acquisition
8%
U.S. Market
Share
Build-out
Permian
34% CDN
Market Share
Integration with
JACAM
Rheotech
Acquisition
Revenue:
$750MM
10% U.S.
Market
Share
Build-out
Barite
Facility
page 6
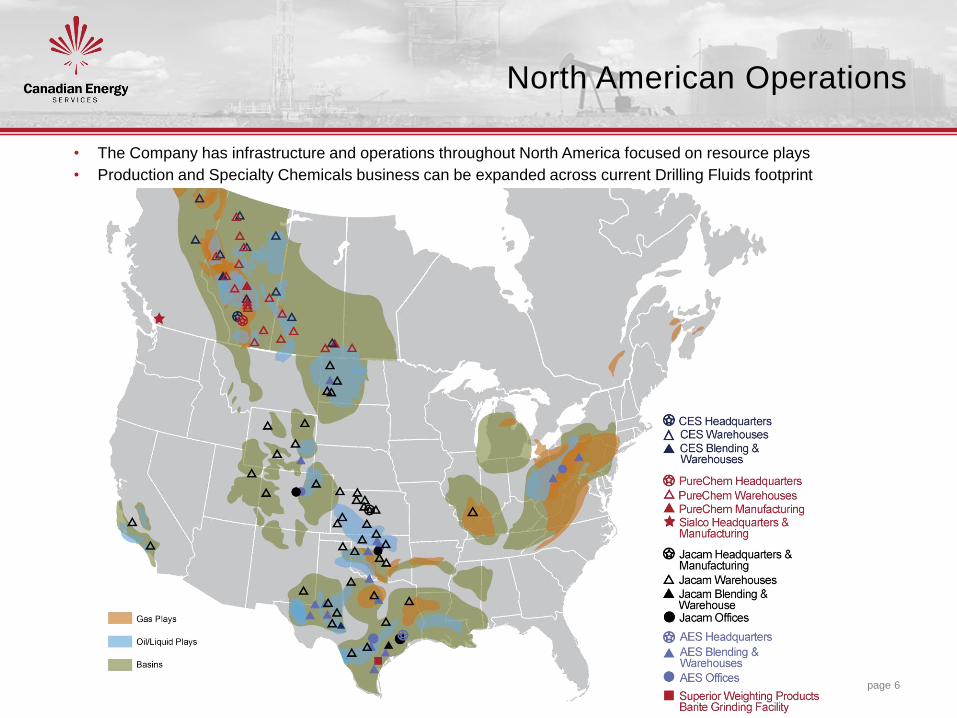
• The Company has infrastructure and operations throughout North America focused on resource plays
• Production and Specialty Chemicals business can be expanded across current Drilling Fluids footprint
North American Operations
Global Drilling and Completion Fluids Market Size
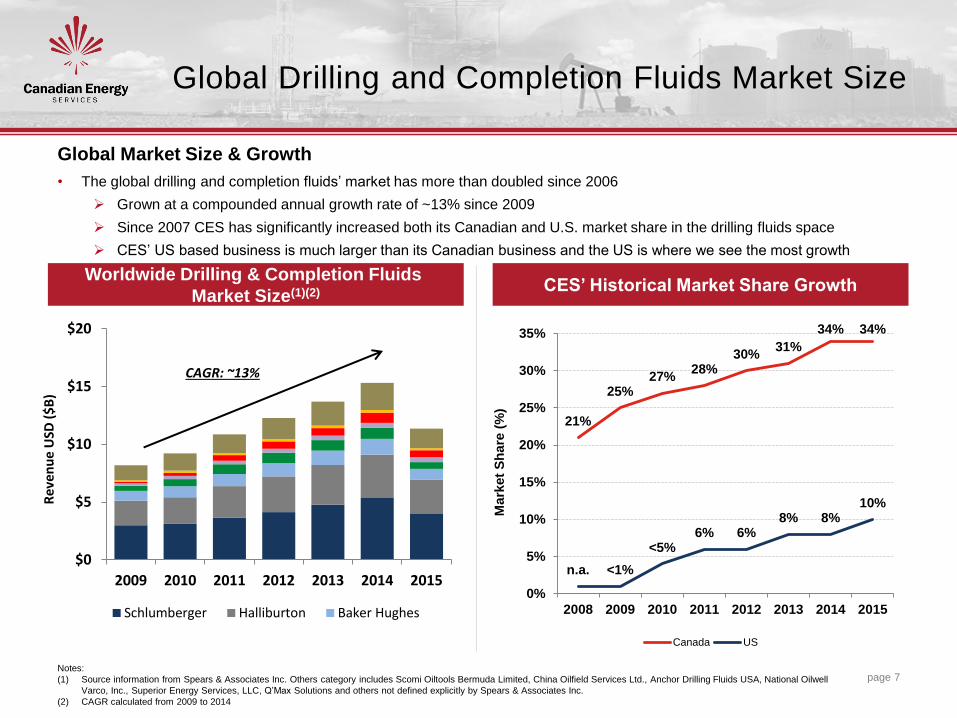
Global Market Size & Growth
• The global drilling and completion fluids’ market has more than doubled since 2006
Grown at a compounded annual growth rate of ~13% since 2009
Since 2007 CES has significantly increased both its Canadian and U.S. market share in the drilling fluids space
CES’ US based business is much larger than its Canadian business and the US is where we see the most growth
page 7
Worldwide Drilling & Completion Fluids
Market Size(1)(2)
Notes:
(1) Source information from Spears & Associates Inc. Others category includes Scomi Oiltools Bermuda Limited, China Oilfield Services Ltd., Anchor Drilling Fluids USA, National Oilwell
Varco, Inc., Superior Energy Services, LLC, Q’Max Solutions and others not defined explicitly by Spears & Associates Inc.
(2) CAGR calculated from 2009 to 2014
CES’ Historical Market Share Growth
CAGR: ~13%
$0
$5
$10
$15
$20
2009 2010 2011 2012 2013 2014 2015
Schlumberger Halliburton Baker Hughes
Re
ven
ue
USD
($
B)
21%
25% 27%
28% 30%
31%
34% 34%
n.a. <1%
<5% 6% 6%
8% 8% 10%
0%
5%
10%
15%
20%
25%
30%
35%
2008 2009 2010 2011 2012 2013 2014 2015
Mark
et
Sh
are
(%
)
Canada US
Drilling Fluids Macro Environment
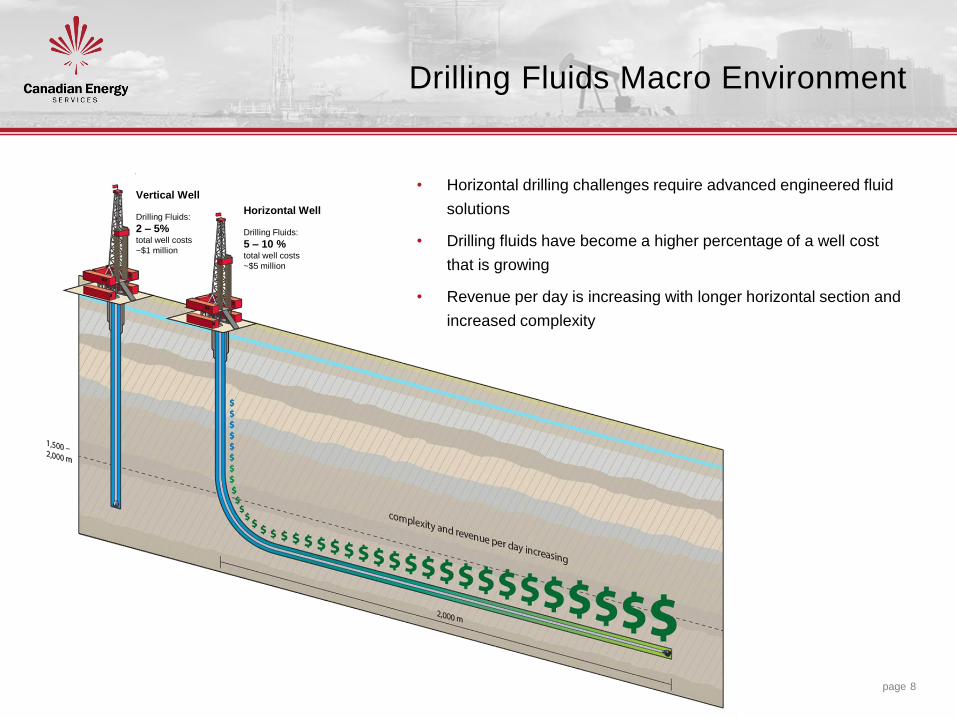
• Horizontal drilling challenges require advanced engineered fluid
solutions
• Drilling fluids have become a higher percentage of a well cost
that is growing
• Revenue per day is increasing with longer horizontal section and
increased complexity
Horizontal Well
Drilling Fluids:
5 – 10 % total well costs
~$5 million
Vertical Well
Drilling Fluids:
2 – 5% total well costs
~$1 million
page 8
Global Production and Specialty Chemicals Market
Size
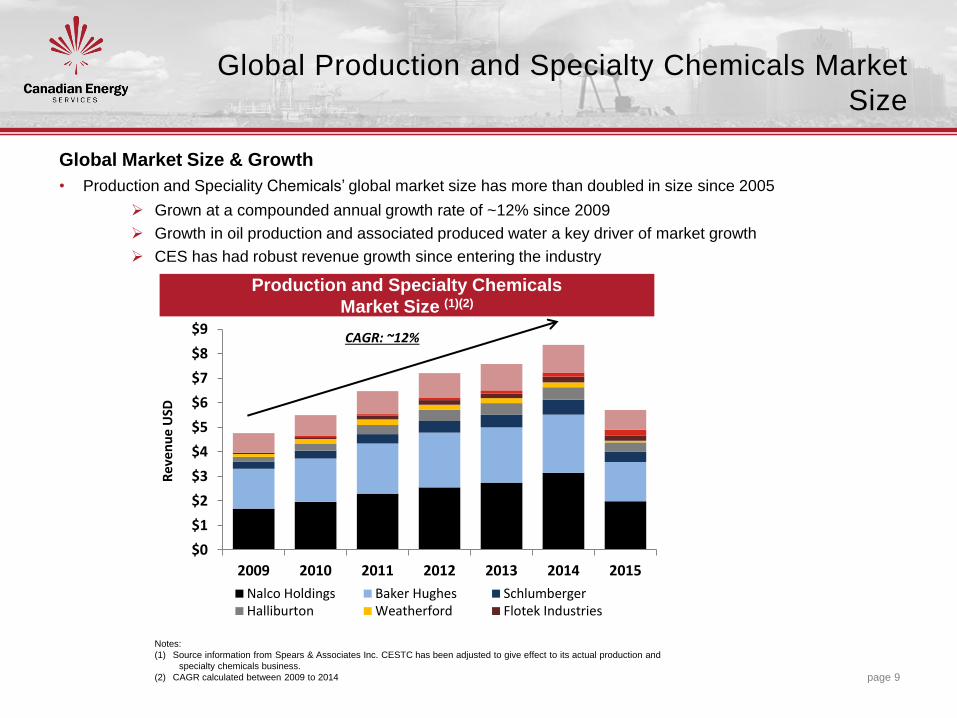
Global Market Size & Growth
• Production and Speciality Chemicals’ global market size has more than doubled in size since 2005
Grown at a compounded annual growth rate of ~12% since 2009
Growth in oil production and associated produced water a key driver of market growth
CES has had robust revenue growth since entering the industry
page 9
Production and Specialty Chemicals
Market Size (1)(2)
CAGR: ~12%
Notes:
(1) Source information from Spears & Associates Inc. CESTC has been adjusted to give effect to its actual production and
specialty chemicals business.
(2) CAGR calculated between 2009 to 2014
$0
$1
$2
$3
$4
$5
$6
$7
$8
$9
2009 2010 2011 2012 2013 2014 2015
Nalco Holdings Baker Hughes SchlumbergerHalliburton Weatherford Flotek Industries
Re
ven
ue
USD
North American Production and Specialty Chemicals
page 10
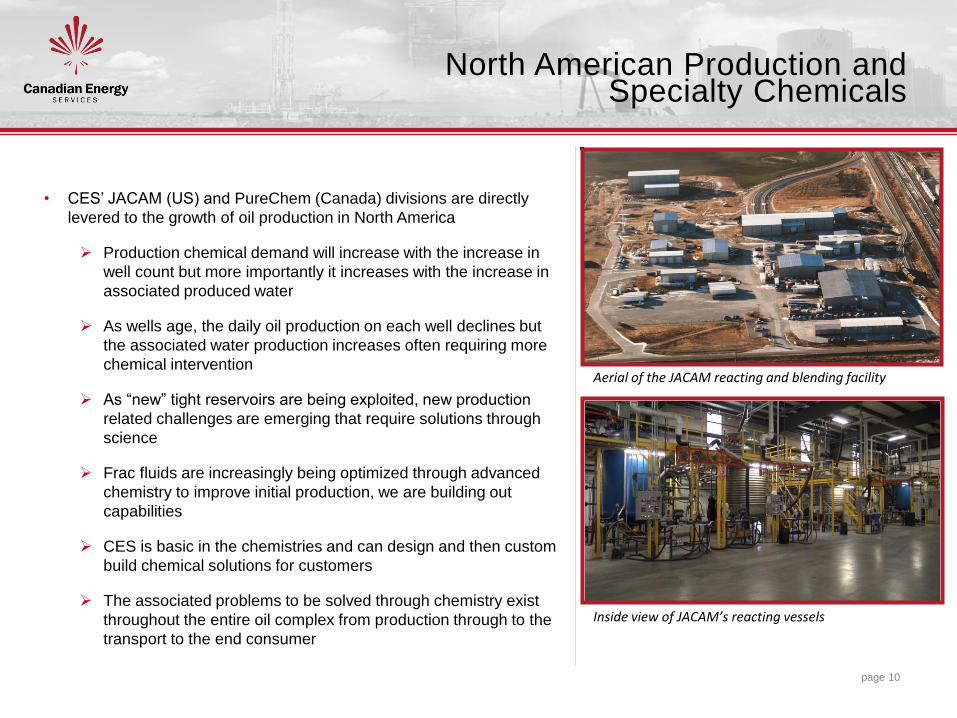
• CES’ JACAM (US) and PureChem (Canada) divisions are directly
levered to the growth of oil production in North America
Production chemical demand will increase with the increase in
well count but more importantly it increases with the increase in
associated produced water
As wells age, the daily oil production on each well declines but
the associated water production increases often requiring more
chemical intervention
As “new” tight reservoirs are being exploited, new production
related challenges are emerging that require solutions through
science
Frac fluids are increasingly being optimized through advanced
chemistry to improve initial production, we are building out
capabilities
CES is basic in the chemistries and can design and then custom
build chemical solutions for customers
The associated problems to be solved through chemistry exist
throughout the entire oil complex from production through to the
transport to the end consumer
Aerial of the JACAM reacting and blending facility
Inside view of JACAM’s reacting vessels
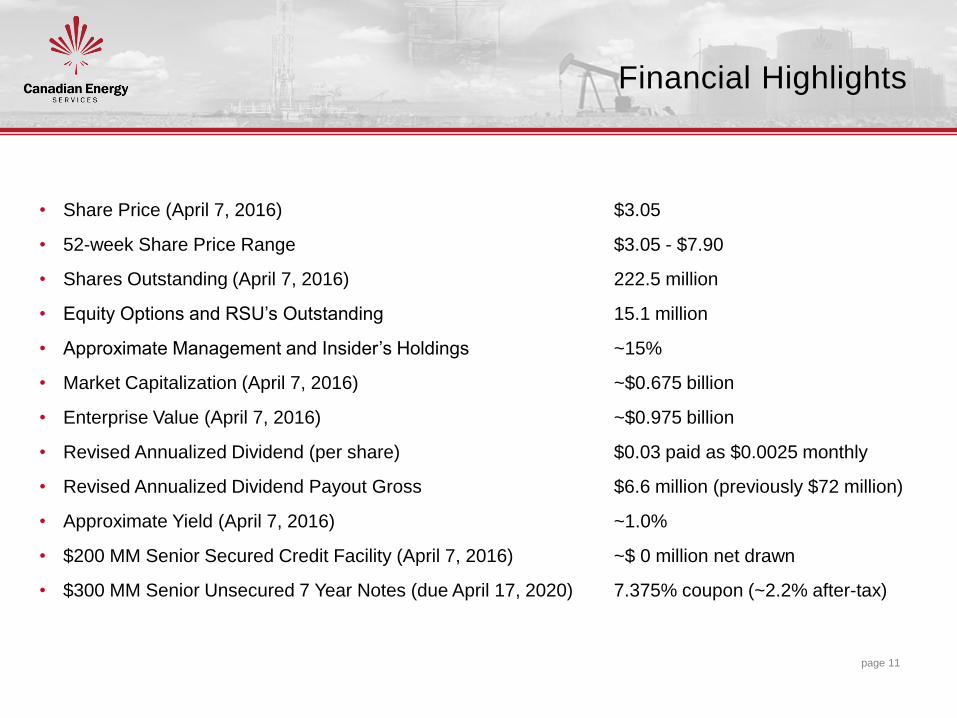
Financial Highlights
page 11
• Share Price (April 7, 2016) $3.05
• 52-week Share Price Range $3.05 - $7.90
• Shares Outstanding (April 7, 2016) 222.5 million
• Equity Options and RSU’s Outstanding 15.1 million
• Approximate Management and Insider’s Holdings ~15%
• Market Capitalization (April 7, 2016) ~$0.675 billion
• Enterprise Value (April 7, 2016) ~$0.975 billion
• Revised Annualized Dividend (per share) $0.03 paid as $0.0025 monthly
• Revised Annualized Dividend Payout Gross $6.6 million (previously $72 million)
• Approximate Yield (April 7, 2016) ~1.0%
• $200 MM Senior Secured Credit Facility (April 7, 2016) ~$ 0 million net drawn
• $300 MM Senior Unsecured 7 Year Notes (due April 17, 2020) 7.375% coupon (~2.2% after-tax)
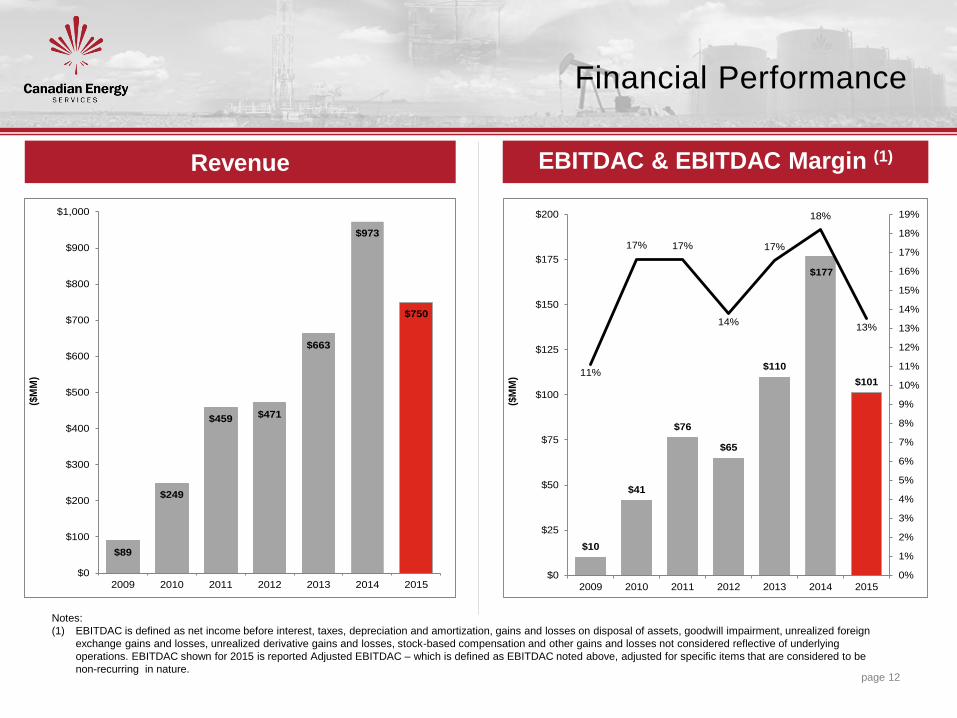
Financial Performance
page 12
Revenue EBITDAC & EBITDAC Margin (1)
Notes:
(1) EBITDAC is defined as net income before interest, taxes, depreciation and amortization, gains and losses on disposal of assets, goodwill impairment, unrealized foreign
exchange gains and losses, unrealized derivative gains and losses, stock-based compensation and other gains and losses not considered reflective of underlying
operations. EBITDAC shown for 2015 is reported Adjusted EBITDAC – which is defined as EBITDAC noted above, adjusted for specific items that are considered to be
non-recurring in nature.
$10
$41
$76
$65
$110
$177
$10111%
17% 17%
14%
17%
18%
13%
0%
1%
2%
3%
4%
5%
6%
7%
8%
9%
10%
11%
12%
13%
14%
15%
16%
17%
18%
19%
$0
$25
$50
$75
$100
$125
$150
$175
$200
2009 2010 2011 2012 2013 2014 2015
($M
M)
$89
$249
$459 $471
$663
$973
$750
$0
$100
$200
$300
$400
$500
$600
$700
$800
$900
$1,000
2009 2010 2011 2012 2013 2014 2015
($M
M)
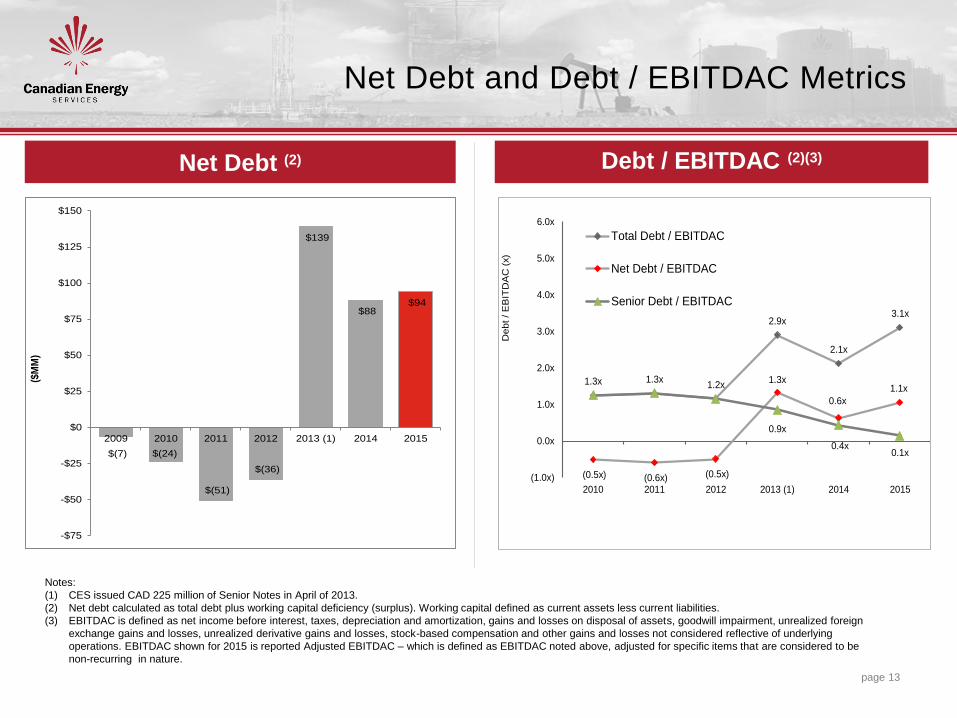
Net Debt and Debt / EBITDAC Metrics
page 13
Net Debt (2) Debt / EBITDAC (2)(3)
Notes:
(1) CES issued CAD 225 million of Senior Notes in April of 2013.
(2) Net debt calculated as total debt plus working capital deficiency (surplus). Working capital defined as current assets less current liabilities.
(3) EBITDAC is defined as net income before interest, taxes, depreciation and amortization, gains and losses on disposal of assets, goodwill impairment, unrealized foreign
exchange gains and losses, unrealized derivative gains and losses, stock-based compensation and other gains and losses not considered reflective of underlying
operations. EBITDAC shown for 2015 is reported Adjusted EBITDAC – which is defined as EBITDAC noted above, adjusted for specific items that are considered to be
non-recurring in nature.
1.3x 1.3x 1.2x
2.9x
2.1x
3.1x
(0.5x) (0.6x) (0.5x)
1.3x
0.6x
1.1x
0.9x
0.4x 0.1x
(1.0x)
0.0x
1.0x
2.0x
3.0x
4.0x
5.0x
6.0x
2010 2011 2012 2013 (1) 2014 2015
Debt / E
BIT
DA
C (
x).
..
Total Debt / EBITDAC
Net Debt / EBITDAC
Senior Debt / EBITDAC
$(7) $(24)
$(51)
$(36)
$139
$88 $94
-$75
-$50
-$25
$0
$25
$50
$75
$100
$125
$150
2009 2010 2011 2012 2013 (1) 2014 2015
($M
M)
page 14
CES is focused on being a leading provider of technically advanced consumable chemical solutions throughout the life-cycle of the oilfield
• CES is a market leader in the Canadian drilling fluids space and expanding position in
the US
• CES’ production and specialty chemicals businesses (PureChem & JACAM) are
expanding sales of consumable chemicals into all facets of the energy industry
• We have a strong balance sheet with debt termed out until 2020 and a low capex business model
• Our vertically integrated business model is positioned to weather current downturn and then capitalize on favorable industry conditions as they return
• Experienced, aligned management team (Management and Insiders hold ~ 15% of common stock)
• We pay a monthly dividend of $0.0025 which is annualized at $0.03/year. CES will protect the balance sheet and be prudent with its dividend
• CES’ competitive advantage is combining our oilfield knowledge and service company culture with vertically integrated manufacturing capabilities
Conclusion
Our Divisions