Embed Size (px)
Citation preview
No. 2016-9
Corporate governance, employment laws,
and corporate performance in Japan:
An international perspective
Yasuhiro Arikawa
Kotaro Inoue Takuji Saito
November, 2016 Rev February,2017 Tokyo Institute of Technology
2-12-1 Ookayama, Meguro-ku, Tokyo 152-8552, JAPAN http://educ.titech.ac.jp/iee/
Department of Industrial Engineering and Economics
WWWooorrrkkkiiinnnggg PPPaaapppeeerrr
1
Corporate governance, employment laws, and corporate performance in Japan: A cross-country analysis1
Yasuhiro Arikawa
Waseda University Kotaro Inoue2
Tokyo Institute of Technology Takuji Saito Keio University
Abstract
A number of cross-country analyses have demonstrated in recent years that the difference in the corporate governance and employment system by country leads to the difference in the shareholder structure, corporate valuation, investment behavior, and so on. This study examines whether the sustained low profitability and market valuation of Japanese firms can be explained by the corporate governance structure and the employment system using cross-country analysis. We find that the structure of the board of directors dominated by insiders and the employment system which hinders flexible employment adjustments have the significant explanation power over the poor performance of Japanese firms. JEL Classification: G34, G38, O57 Keyword: Corporate Governance, Labor Law, Japan
1 This work was supported by JSPS KAKENHI Grant No.15H03375. 2 Corresponding author: Kotaro Inoue is professor of the School of Engineering, Tokyo Institute of Technology. email: inoue.k.aq@++m.titech.ac.jp delete ++ to send mail.
2
1. Introduction Low profitability and market value of Japanese firms persisted over a long period of
time has been a major issue in Japan (Cabinet Office, 2015). As shown in detail in this paper, the profitability and the market valuation of Japanese firms are significantly low among major industrialized countries. Japanese government undertook measures to strengthen Japanese firm’s competitiveness, and one of the pillars was a promotion of mid- to long-term investment by further strengthening corporate governance. As a specific measure for strengthening corporate governance, they introduced the stewardship code and corporate governance code in 2015 and recommended listed firms to introduce two or more outside directors. Another pillar was the employment system reform, such as introducing a financial settlement system for dismissing employees.
Employment system, which is an element that determines employee’s bargaining power against the firm, is closely related to the corporate governance structure. Many practitioners have pointed out that one of the reasons for low profitability by Japanese firms is that they cannot give up low-profit businesses in earlier stages to focus on the areas where they have the comparative advantage.3 The value creation by withdrawing from unprofitable businesses cannot be done without organizational downsizing and restructuring. It implies that the problem lies with the weak corporate governance and inflexible labor market which keep Japanese firms from the implementation of necessary restructuring. In other words, the corporate governance structure and employment system should be important causes of the poor performance of Japanese firms.
A number of international comparative studies have demonstrated in recent years that the difference in the country-level and firm-level corporate governance leads to the difference in the firm valuation. The country-level governance includes laws for investor and creditor protections, and the institution that enforce the laws. Many studies have also explored the relationship between the country-level governance and the extent of financial market development. For example, La Porta et al. (1998, 2002) created an index for the level of minority shareholder protection by law and demonstrate that the shareholder values are higher and there are more publicly traded firms in countries where this index is high.
As for the firm-level governance, many studies use governance attributes adopted by firms, and evaluate the impact of firm–level governance on the valuation of firms in a 3 “Mezameru Shihon: ROE, Amerika no Senaka Tōku (Awakened Capitals: ROE, Lagging Behind the United
States).” The Nikkei Morning Edition, August, 16, 2014.
3
cross-section of countries (Durnev and Kim 2005;Aggarwal et al 2009,Chhaochharia and Laeven 2009; Bruno and Classens 2010). For example, Durnev and Kim (2005) shows that the firm-level governance have a significant relation with firm value in a cross-section setting.
In addition to the differences in corporate governance, recent studies reveals that the difference in the legal systems related to labor protection also affects corporate performance and corporate behaviors (Botero et al. 2004; Caballero et al. 2013; Simintzi, et al. 2014; John et al. 2015). Caballero et al. (2013) show that the speed of employment adjustment after an economic shock is relatively faster among countries with less labor protection. They report that the speed of employment adjustment declines when the labor market regulation is tightened. They also show that such reduction in adjustment speed results in a lower productivity.
The cross-country analyses about the relation between corporate governance, labor protection and firm performances help us understand why the firm’s performance differs country by country. In this paper, we investigate whether the relative poor performance of Japanese firms can be explained by the difference of country-level governance, firm-level governance, and the labor protection. Many Japanese firms uphold distinct insider governance in which the majority of the board members are promoted from within the firms. The employment style is also strongly characterized by the nature of the lifetime employment system, and the mobility of managers and workers in the market is relatively low. Therefore, we examine whether the relatively low profitability of Japanese firms can be explained by the Japanese-style corporate governance and employment system with such distinct characteristics. Unlike previous cross-country analyses, we examine both the corporate governance effect and labor protection effect on firm’s behavior simultaneously. In contrast, past work examines generally either corporate governance or labor protection.
We use a sample of 1,548 firms with sales of US$ 3 million or more in 27 countries and create a panel data that covers seven years from 2006 to 2012 in this paper. We show that the outside director ratio and Hiring and Firing Practice Index—an indicator for the ease of employment adjustment created based on the results of the World Economic Forum Survey—particularly have significant effects on corporate financial performance of both all the sample firms. This result suggests that the cause of the so-called “lost 20 years” and the low-profit, low-growth Japanese firms lies with the delayed liquidation of unprofitable businesses, the insider-centric corporate governance, and the inflexible employment system. This paper is organized as follows: Section 2 present literature review. Section 3
4
introduces our hypotheses. Section 4 describes the sample and data, and Section 5 presents the empirical results. Section 6 presents robustness tests by employing propensity score matching tests. Section 7 summarizes our findings and presents implications. 2. Literature
Our study focuses on differences of both corporate governance system and employment mechanism by countries as factors which influence corporate performance of respective countries. One of the important topics of recent corporate governance literature is the effect of the different rules of minority shareholder protection by countries. Many studies have explored the relationship between the level of legal protection of minority shareholders and the extent of financial market development. For example, La Porta et al.(1998) and La Porta et al. (2002) created an index for the level of minority shareholder protection (Anti-Director Rights Index, hereinafter “ADRI”) and demonstrate that the shareholder values are higher and there are more publicly traded firms in countries where this index is high.
In addition to such country-level factors, firm-level differences of corporate governance structure are potentially important factors. Since Japanese firms are characterized by the board of directors dominated by insiders in terms of corporate governance (Hoshi and Kashyap, 2001), the outside director ratio is the variable of our interest. Outside directors are expected to play the disciplining function by monitoring the management team and demanding management replacement when necessary (Weisbach (1988), Byrd and Hickman (1992), Hermalin and Weisbach (1998), Saito et al.(2016)), while urging the management team to execute necessary investments based on their insider information. Empirically, Dahya et al(2008) and Aggarwal et al(2009) show the significant effects of board independence on the firm value. Dahya et al(2008) find that board independence is positively related to firm value in countries with poor investors protection. Aggarwal et al.(2009) also shows that a firm whose board is not controlled by more than 50% independent outside directors is worth less.
In terms of shareholder structure, institutional investors are expected to have an effect to urge appropriate investment to maximize the shareholder value in addition to monitoring the management of the firm (Ferrira and Matos, 2008; Aggarwala et al. 2011). In cases that institutional investors have strong negotiation power collectively, they can potentially play disciplinary role for managers. The disciplinary role of institutional investors is important since hostile takeover is quite rare in Japan. Bertrand and Mullainathan (2003) show that firms increase employee wages and stop to tear
5
down old facilities and to introduce new facilities in the states where legal systems are in place to make hostile takeover difficult because the threat of hostile takeover is reduced. They also show that the productivity and profitability also deteriorate after the introduction of a kind of legislation that weakens the governance of the stock market. Although threats of hostile takeover play limited role in Japan, institutional investors are expected play the similar role. However, whether institutional investors as a whole play the role of monitoring individual corporate management is questionable. Funds like passive funds would not be interested in improving the management of individual firms which are merely part of their diversified investments. Ferrira and Matos (2008) report that while foreign investors of all institutional investors have a positive effect on corporate performance and stock prices, such a positive effect cannot be confirmed with domestic institutional investors. Hiraki and Ito (2009) note specifically about Japan by saying that institutional investors affiliated with a corporate group in Japan tend to make excessive investments to poorly-performing firms in the same group. Therefore, whether institutional investors have the expected effect or not is an interesting question to be examined.
In addition to the differences in corporate governance structure by countries, recent studies reveals that the difference in the legal systems related to labor protection affects corporate performance and corporate behaviors. Botero et al. (2004) use data from 85 countries to demonstrate that although stricter regulations to protect employees positively affect employee salary, the unemployment rate among young people would increase. It implies that while the legal protection for employment works to the advantage of existing employees, it could potentially reduce employment itself. Caballero et al. (2013) use data from 60 countries and analyze the relationship between the strength of labor protection regulations and the speed of employment adjustment and productivity in firms in each country. They then demonstrate that the speed of employment adjustment after an economic shock is relatively faster among countries with looser regulations. Specifically, they show that the speed of employment adjustment to respond to the economic shock declines by about one third when the regulation is tightened from the 20 percentile level to the 80 percentile level. They also report that such reduction in adjustment speed results in a reduction of productivity by about 0.85% among sample firms. Slower employment adjustment implies that the firm is cautious about expanding employment even under strong economy.
Meanwhile, Simintzi et al. (2014) use firm-level data in 21 countries over the period of 1985 to 2007 and analyze the effect that the changes in employee protection regulations have on the financial strategies of the firm. They then demonstrate that firms
6
lower the debt ratio by about 10% on average when the employee protection regulation is tightened. They explain that the debt ratio declines this way because the increased level of employee protection leads to increased cost for restructuring, raising the default cost as a result. In addition, employee protection regulations affect the investment behavior of firms. John et al. (2015) examine how the level of legal protection for workers is related to the announcement effect on the stock market at the time of acquisition. When there is a conflict of interest between workers and shareholders, strong labor rights are highly likely to make it difficult for the firm to choose an M&A partner desirable to the shareholders or to restructure to reduce the number of employees after an M&A is completed. Therefore, we can presume that the stock price would decline more in response to the M&A announcement for a firm faced with a situation where workers’ rights are relatively stronger. In fact, John et al. (2015) use the difference in the level of workers’ protection by state in the US and show that when a firm located in a state with strong labor rights announced an acquisition, their cumulative abnormal returns (CARs) decline by about 0.5% on average compared the cases of acquisition announcements by firms located in states with weaker labor rights. Among other things, they also show that firms in the labor-intensive industries are more likely to suffer a larger decline in their CARs. It means that investment projects with a positive net present value (NPV) might not be selected under a situation where making employment adjustments are difficult due to the employment system. At that point, the employment system could have a negative impact not only on the current profitability, but also on the future growth. Inflexibility of employment adjustment is potentially important aspects to evaluate firm performance of Japanese firms since life-time employment arrangements are distinct character of Japanese firms.
3. Hypothesis
As described above, it has been shown that the level of shareholder protection and the
employee protection under the employment system have the opposite effect on the profitability and risk-taking behavior of firms. Meanwhile, Japan has developed distinctive corporate governance and employment forms. There, insiders rule the board of directors based on the lifetime employment and that, in turn, is monitored primarily by their main bank and group firms, rather than the stock market. It is quite possible that these have actually become the culprits for the low profitability and low firm value of Japanese firm. In this study, we focus on the corporate governance structure and the employment system that makes it difficult for firms to place human resources in a
7
flexible manner as the plausible cause of low profitability and market valuation of Japanese firms in the world.
As country-level corporate governance variable, we consider the degree of effectiveness of the shareholder protection system. Strengthening the legal protection for minority shareholders has a positive effect on the corporate value of firms in that country (La Porta et al. 2002). Based on this discussion, this study uses legal protection for minority shareholders in each country as an explanatory variable.4 Specifically, we use the revised ADRI (La Porta et al. 2008), which is the revised version of the Anti-director Rights Index (hereinafter “ADRI” or the shareholder protection index) proposed by La Porta et al. (1998). The ADRI represents the power balance between minority shareholders and the board of directors based on the legal system in each country; a higher score implies that the minority shareholder protection is extensive and the negotiation power of minority shareholders is strong. Since stronger minority shareholder protection is predicted to mitigate agency problem of managers, we hypothesize that higher ADRI is associated with higher profitability and market valuation of the firms in the country. Japan is scored 4.5, which is higher than average score of sample countries (=3.71).
Firms obtain funds through loans and bonds in addition to stocks. While the creditors monitor the management of the firms they lend to, the effect depends on how much bargaining power the creditor has. As an indexation of this bargaining power of creditor, we use the Creditor Rights Index created by Djankov et al. (2007). Since Japan has been historically characterized as bank-centered economy, this variable potentially mitigates poor performance of Japanese firms through effective monitoring by the lender banks. We hypothesize that higher Creditor Right Index is associated with higher profitability and market valuation of the firms in the country. Japan is scored 2, which is a slightly higher than average score of sample countries (=1.79).
As a firm-level variable, we focus on the factors which are distinct characters of Japanese firms. The board of directors of Japanese firms are essentially dominated by insiders (former employees). Then, the variable of interest regarding the domination by insiders is the outside director ratio. Outside directors are expected to play the disciplining function by monitoring the management team and demanding management replacement when necessary (Byrd and Hickman (1992), Saito et al. (2016)), while urging the management team to execute necessary investments based on their insider information. For example, Hitachi Ltd., Japanese largest electric manufacturer, introduced more than half of outside directors in the board for the first time in 2012,
4 La Porta et al. (2002) reported this result based on a sample of 536 firms in 27 countries.
8
including two non-Japanese outside directors. Takashi Kawamura, Chairman of Hitachi at the time, declared that this reform of the board has significant impacts on the management by bringing sense of tension into the board room5. In addition, the board of directors which are primarily dominated by insiders almost always nominate insider as the CEO of the firms. Under this CEO selection mechanism, it would be difficult for CEOs of Japanese firms to conduct aggressive restructurings which are deemed to draw strong criticism from insiders such as division managers and employees. Since the outsider director ratio in Japan is significantly lower than other developed countries, parties such as international institutional investors have been showing concerns for the function of the board of directors. Therefore, this study hypothesizes that the low outsider director ratio is a main cause of the relatively low profitability and market valuation of Japanese firms.
In terms of shareholder structure, we expect the institutional investors to urge appropriate investment to maximize the shareholder value in addition to monitoring the management of the firm (Ferrira and Matos (2008), Aggarwala et al. (2011)). Thus we examine whether the higher institutional ownership has a positive effect on profitability and market valuation of the firms. We also use the percent of shares held by management to test whether the insider ownership ratio have a positive effect on profitability and market valuation of the firms.6
Another distinct characteristic of Japanese firms which potentially have significant effects on corporate financial performance is the lifetime employment system. Although the lifetime employment is not legal requirement in Japan, it has been widely adopted especially among large firms. Since employees also assume this practice as their given right, Japanese firms face the inflexible employment adjustment. This limits labor mobility in the market, and it is highly likely that the difficulty with employment adjustment is limiting opportunities to withdraw from unprofitable businesses and restructure through M&A. It also restricts aggressive business expansion and risk-taking for growing firms. Thus, we examine whether the inflexibility of employment adjustment is causing the low profitability and market valuation of Japanese firms.
As for the employment system, we first use Employment Laws (hereinafter, “employee protection index”) based on Botero, et al. (2004).7 This employee protection
5Management Investor Forum of the Ministry of Economy, Industry, Trade of Japan. http://www.meti.go.jp/policy/economy/keiei_innovation/kigyoukaikei/pdf/20150610_mif_news.pdf. 6The average ratio of shares held by management insider is around 5%. 7 The Employment Law index, which is an index of employment protection, has a strong, positive correlation with the collective relations law index which indicates the extent to which the activities of labor union is protected by the legal system in each country. These two indices are in accordance with each other in that they strengthen the bargaining power of employees and make it difficult to dismiss employees.
9
index is an indicator to show to what extent employees are protected from being dismissed by the firm. When this index is high, it indicates that the level of protection is high.8 Thus, we hypothesize that lower Employment Laws is associated with lower profitability and market valuation of the firms in the country.
On the other hand, it is highly possible that whether the employment adjustment can be done flexibly or not is affected not only by the legal system, but also by other factors such as social tolerance and customs related to employee dismissal. To incorporate this perspective to our analyses, we also use an index that measures the flexibility with employment adjustment based on a survey research. The Executive Opinion Survey by the World Economic Forum, which is a survey conducted among management executives in 144 countries around the world, indexes managers’ perception in business practice. 9 Especially, we use the Hiring and Firing Practices index in the survey (hereinafter “flexibility with employment adjustment”), which asks managers how flexibly a firm can hire new personnel and fire excess workers. When this index is high, it implies that the managers feel they can flexibly make employment adjustment. In our study we use the 2014 Survey (fielded in 2013) which is based on the responses from management executives at more than 13,000 firms around the world. The data for Japan is constructed from responses from 179 firms to the survey with the cooperation of the Japan Association of Corporate Executives. Thus, we investigate whether the higher Hiring and Firing Practices Index score is associated with higher profitability and market valuation of the firms in the country.
4. Sample and summary statistics
We use Datastream, a financial database provided by Thomson Reuter to collect the information on firm’s financial information and board of directors. The information on shareholder structure is collected from Capital IQ. The sample of this study includes firms with the sales of more than 3 billion US dollars in FY2012. We exclude firms in financial and utility sectors since they are heavily regulated. Following the sample selection procedures of La Port et al. (1998), we exclude countries that do not have at least 10 firms to make comparison of firm performances under various corporate governance and employment system. As a result, 1,548 firms in 27 countries are included in the sample. We create a panel data of sample firms from 2006 to 2012 (10,830 firm-years), and the sample includes 298 Japanese firms and 470 US firms.
8 It should be noted scoring labor laws is extremely difficult. The OECD also publishes their indicator for employment protection based on the legislation in each country. However, even though the labor laws in Japan have not changed much in the past 10 years, the employment protection indicator has been fluctuating widely. 9 This is a part of the Global Competitiveness Index (GCI) published by the Forum.
10
Table 1 appears around here
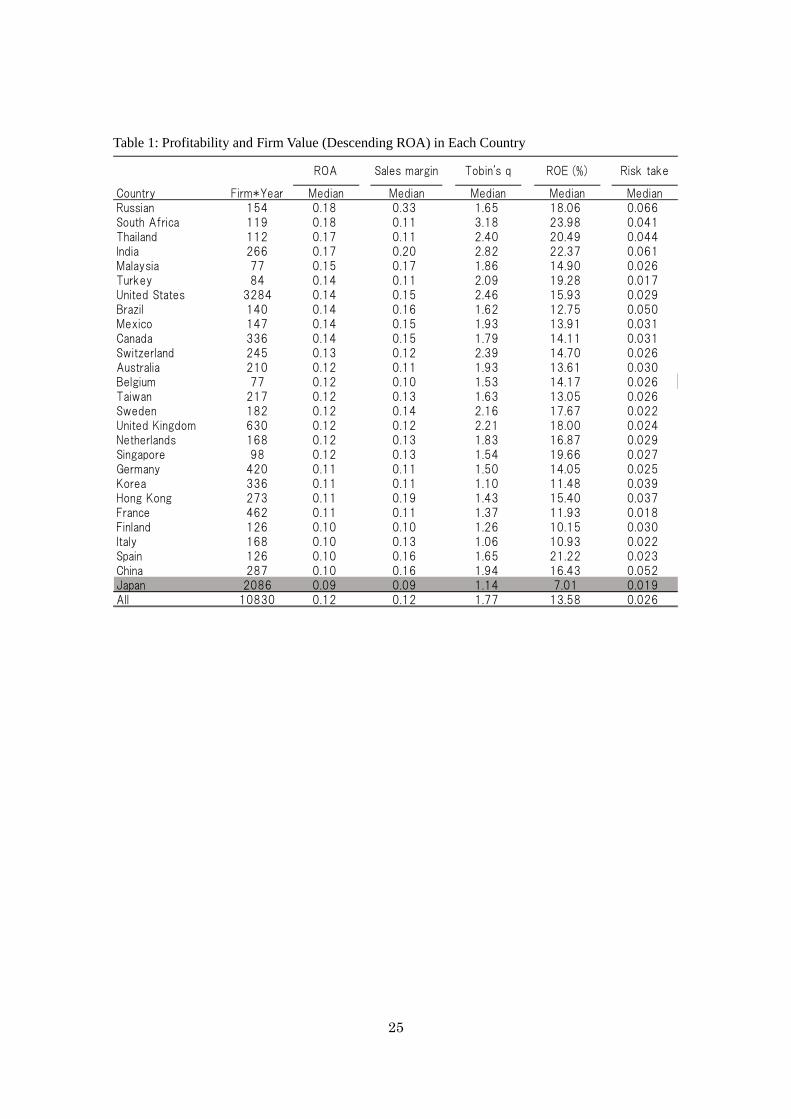
Table 1 shows the distribution of the number of firms, profitability (ROA, sales
margin, ROE), and firm value (Tobin’s q). By using EBITDA in the numerator of ROA and sales margin, we exclude the bias from different corporate tax rate by country. In our sample, the largest number of firms comes from the United States, and the proportion of US firms in the sample is 30%, which is followed by Japan’s 19%. About half of the sample is accounted by US and Japanese firms, while other countries account for the rest of the sample. Since the sample is not concentrated to small number of countries, our sample is balanced enough for us to evaluate the performance of Japanese firms from the perspective of cross-country comparison.
Japan is ranked at the bottom of the 27 countries in all profitability indicators, including ROA (EBITDA / Assets), sales margin (EBITDA / Sales), and ROE (current income / shareholders’ equity). Furthermore, Japan is among the bottom-ranked group in terms of Tobin’s q (market capitalization + book value of total liability / book value of total assets). Besides Japan, countries such as South Korea, Italy, and France are found in the group of countries with low level of profitability and firm value. We find the US in the group of countries with high profitability and market valuation along with several emerging countries such as India and South Africa. Thus, it is not the case that the indicators are low in Japan, South Korea, Italy, and France because these countries are in developed countries. Considering that the risk-free interest rate in Japan is the lowest in the world, we also cannot attribute the low market value of Japanese firms to the cost of capital.
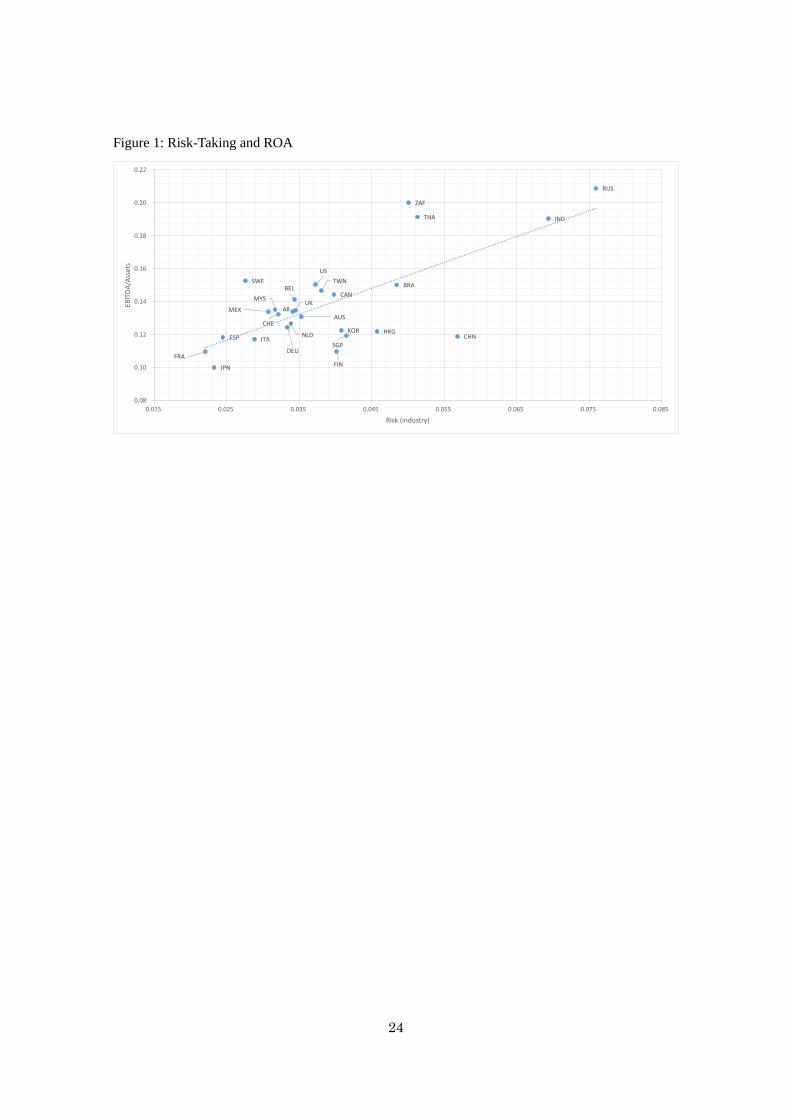
Figure 1 appears around here
The low profitability of Japanese firms could be due to the lack of risk-taking
behavior. The far right column of Table 1 is an indicator for corporate risk-taking behavior (hereinafter “risk taking.”) based on John et al. (2008).10 This indicator is obtained by calculating the standard deviation of the individual firm’s variance from the industry median ROA over the period of seven years from FY 2006 to 2012. Looking at this risk-taking, Japanese firms are at the lowest level again. Figure 1 shows the relationship of this risk-taking and ROA, and the correlation between profitability and
10 “Risk taking” in John et al. (2008) is not an indicator for transferring wealth to shareholders from creditors via asset substitution which increases the risk.
11
risk-taking is 0.42. This means that the proper risk-taking is required to increase profitability. In Figure 1, we find Japanese firms in the lower part of the upward regression line, indicating that the profitability of Japanese firms is not even at the level to compensate the lowest level of risk-taking in the sample. Based on John et al. (2008), this could suggest that the profitability of Japanese firms is relatively lower because the lack of risk-taking. This is also consistent with the fact Japan’s Tobin’s q is at the lowest level by international standards since it can be regarded as an variable of reflecting the growth opportunity of the firm.
Table 2 appears around here
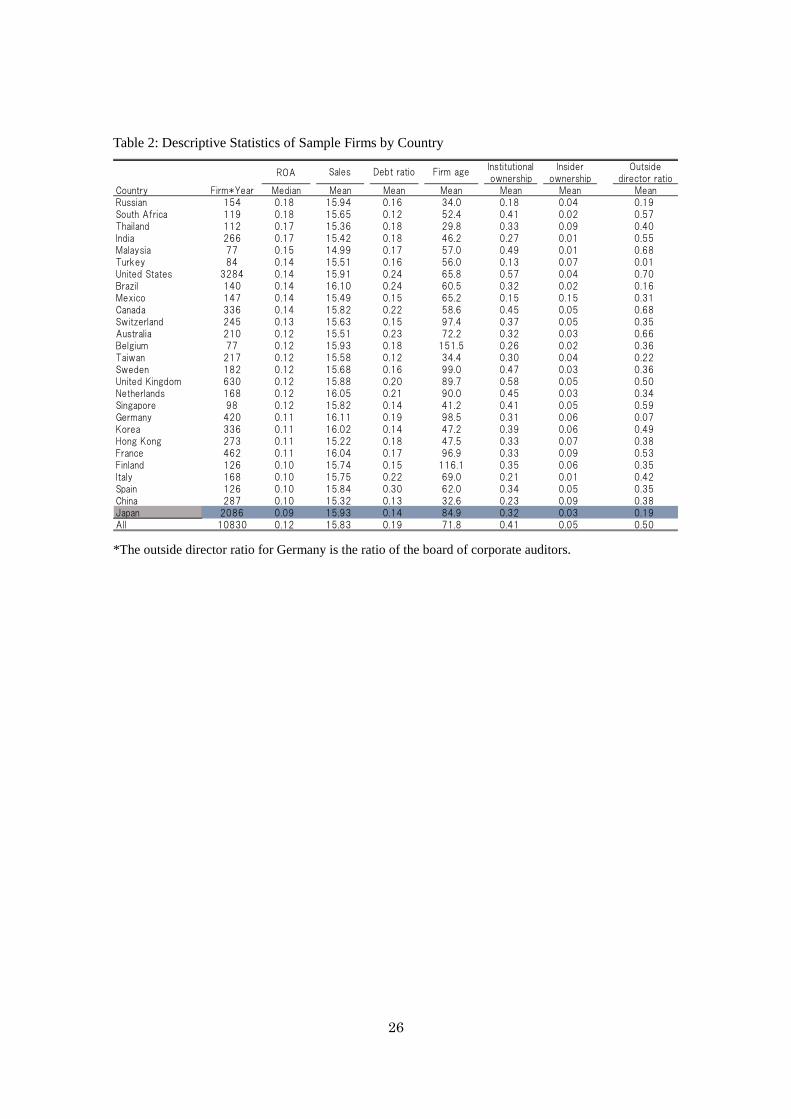
Table 2 shows the descriptive statistics of sample firms by country. The countries are
sorted in descending order by the median ROA and, Japan is ranked at the bottom. Looking at the log of sales, we find that the difference in the averages between Japanese firms and overall sample or the US sample is small. The debt ratio of Japanese firms is slightly lower than the overall average as well as the US average. It has been said that Japanese firms obtain funds mainly through borrowing by depending on their main bank. However, as far as the relatively large firms included in the sample are concerned, the dependency on borrowing among Japanese firms is lower than US firms. This might be because Japanese firms restrain from investing after the banking crisis in the early 2000s. As for the age of firm, the average among the Japanese firms is 85 years since the establishment, which is longer than the overall average of 72 years and the US average of 66 years. This means the percentage of matured firms is relatively higher among the Japanese firms. Since each of these variables could affect firm’s profitability, stock price, and the level of risk-taking, we control the effects of these variables when we do regression analysis to examine the drivers of firm performance.
Looking at the corporate governance-related variables of interest in this study, the percentage of shares held by institutional investors is relatively low in Japan. The average among the Japanese firms is 32%, while the overall average is 41% and the US and UK averages are 57% and 58%, respectively. In contrast, the averages for countries like France and Germany are similar to that of Japanese firms. This is probably because the variable shows the dispersion of shareholder structure. Looking at the insider ownership, the figure for Japan is 3%, which is lower than the overall average of 5%. While the rate in the US is 4%, which is also lower than the overall average, it is relatively high in the UK, Germany, and France at 5%, 6%, and 9%, respectively.
Regarding the structure of the board of directors, the outside director ratio in Japan is
12
notably low. The average among Japanese firms is 19%, which is much lower compared with the overall average of 50% and the US average of 70%.11
Table 3 appears around here
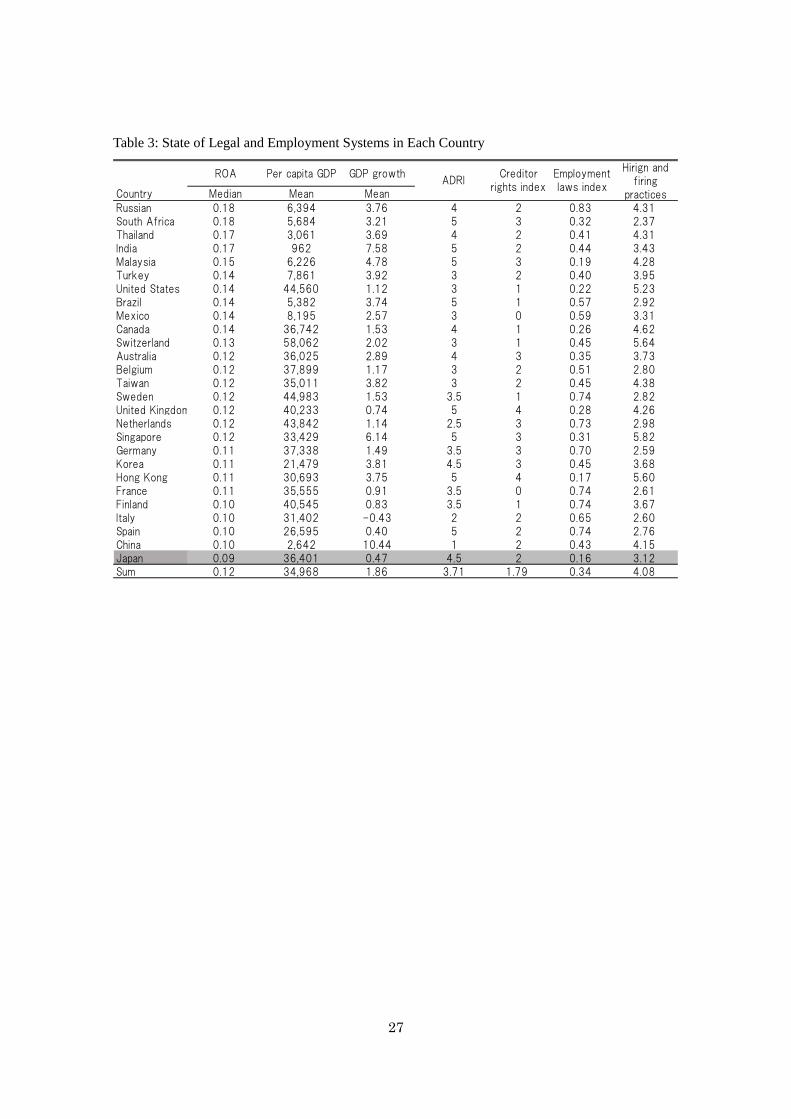
We direct our attention to the variables related to legal systems related to corporate governance and employee protection. Table 3 shows the index scores of corporate governance and employment system for each country in addition to GDP growth rate. First, let us examine the ADRI which represents the level of shareholder protection. As previously mentioned, the ADRI shows the power balance between the minority shareholders and the board of directors based on the legal system of each country; a higher score implies that minority shareholders are well-protected and shareholders have a strong influence. The score of Japan is 4.5, which is relatively high compared to the overall average of 3.7 and the US average of 3.0. This implies that the right of minority shareholders is highly protected in Japan, while there is a view that the cross-shareholdings among firms has been common in Japan to suppress this highly protected minority shareholder rights. Therefore, a high ADRI might not suggest that disciplining the management of Japanese firms by the shareholders is working.
The Creditor Rights Index based on Djankov et al. (2007) shows the level of creditor protection for each country. Here, the higher number of the index suggests the higher level of creditor protection. Japan’s score is 2, and not so different from the overall average of about 1.8.
As indices related to the employee protection, we first use the Employment Laws (employee protection index) developed by Botero et al. (2004). The employee protection index is an index to show how well employees are protected from being dismissed by the firm. This index is used because our study particularly focuses on the possibility that the difficulty with employment adjustment in Japan causes the corporate profits to decline. When this index increases, it indicates that the level of protection become stronger. Japan’s score is 0.16, which is lower than the overall average of 0.34 or the US average of 0.22. Therefore, we cannot say in a relative term that the hurdle for 11It should be noted, however, this is the number prior to the introduction of corporate governance code in 2015 in
Japan. Since the corporate governance code requires listed firms to have two outside directors. The percentage of
firms on the First Section of the Tokyo Stock Exchange (TSE) that have two or more outside directors has gone up to
48% (an increase of 27% compared to the previous year) in 2015. That said, the outside director ratio is still 22% and
there is no significant increase even when we look at the figure for FY 2015.
13
dismissing employees under the Japanese legal system is high. As another measure to capture how flexibly managers can actually implement
employment adjustment, we use the Hiring and Firing Practices index (the measure of flexibility with employment adjustment) by the World Economic Forum. When this index is high, it means that the managers in a given country have responded by saying employment adjustment is easy. It needs to be noted that the scale is opposite to the employment protection index. The score for Japan is 3.12 and lower than the overall average of 4.08 and the US average of 5.23. It suggests that managers in Japan strongly feel it is difficult to make employment adjustments. For example, when a dismissal objectively lacks a rational reason and cannot be recognized as socially acceptable action under the Labor Contract Act in Japan, it is considered an abuse of rights and the dismissal is voided; therefore, they cannot dismiss employees by paying a severance. Restructuring without providing a severance payment is legally allowed when there is a rational reason and it is socially acceptable; however, in reality, the criteria like “reasonable reason” and “socially-acceptable” are determined in a strict manner by the court. This is probably the reason why managers perceive restructuring extremely difficult in practice.
Table 4 appears around here
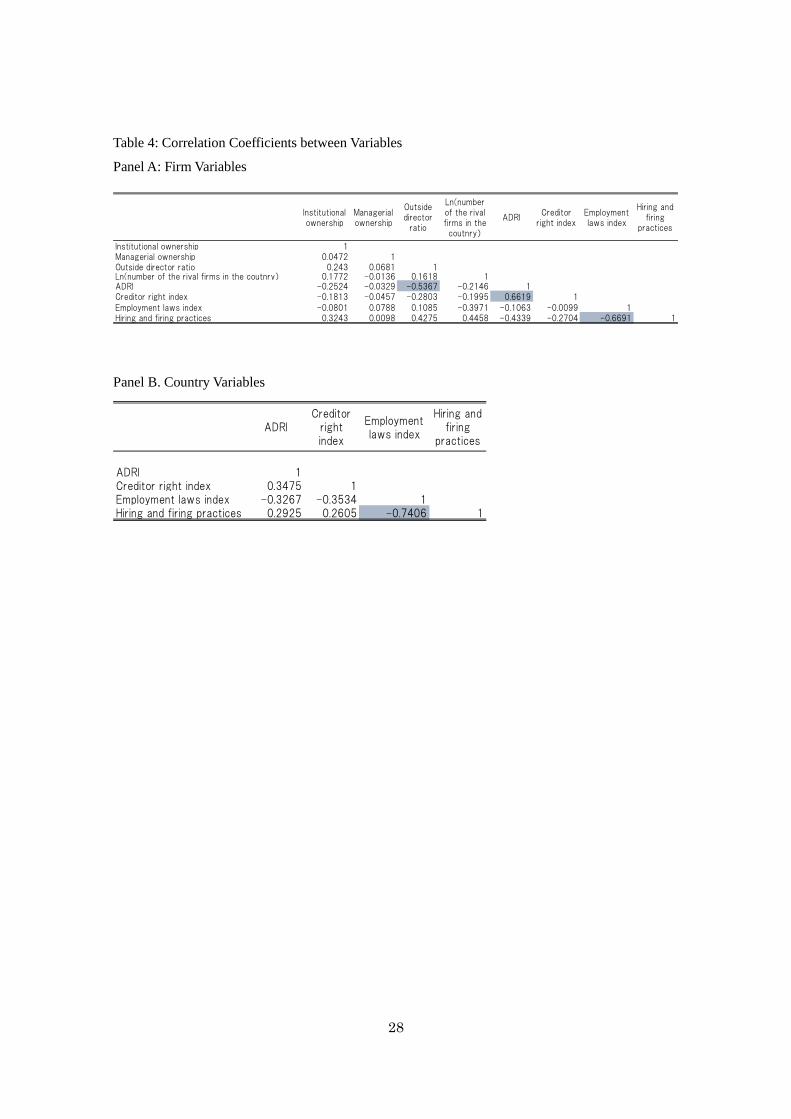
The correlation coefficients between the variables used as explanatory variables are
shown in Table 4. The figures for the correlation matrix are the ones in FY 2006 which is the first fiscal year of the analysis. The correlation coefficients that are 0.5 or more and particularly high are marked in the table.
As shown in Panel A, variables that show a correlation of more than 50% include the outside director ratio and ADRI, ADRI and the creditor protection index, and the employee protection index and the Hiring and Firing Practices index. It is natural that a high correlation coefficient is observed for the latter two combinations of variables because each of them is closely related. On the other hand, the high negative correlation coefficient between ADRI and the outside director ratio is surprising considering the fact that one of the key roles of outside directors is to protect minority shareholders. This result could be partially because the outside director ratio is relatively low as described earlier while ADRI is high in Japan which account for the 19% of total sample. In the analysis, we use ADRI and the outside director ratio separately to examine their explanatory power for the low profitability of Japanese firms.
The correlation coefficient between the employee protection index by Botero et al.
14
(2004) and the Hiring and Firing Practices index based on the survey research by the World Economic Forum is also high. This indicates that the perception of managers about the flexibility of labor market is strongly correlated with the legal protection level of employee in the country. In other words, the employment adjustment flexibility index based on the survey research is a variable that reflects the legal system in each country.
5. Regression Analysis on the Cause of the Low Performance of Japanese Firms
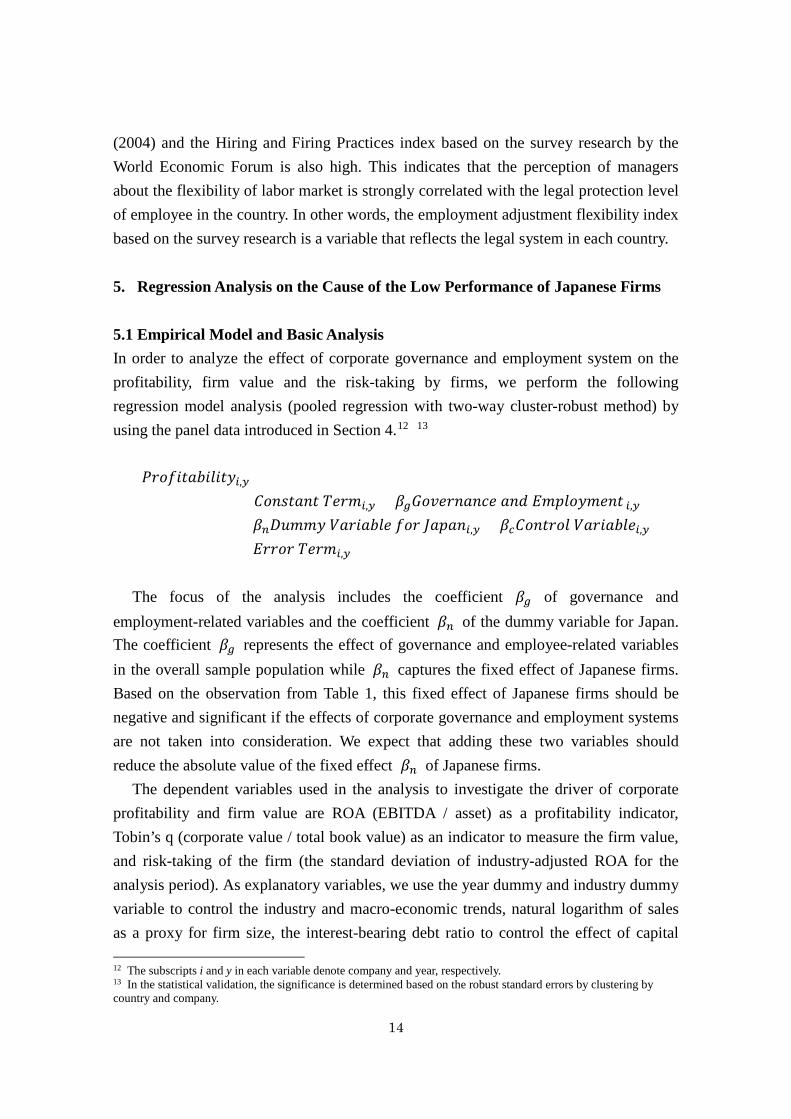
5.1 Empirical Model and Basic Analysis In order to analyze the effect of corporate governance and employment system on the profitability, firm value and the risk-taking by firms, we perform the following regression model analysis (pooled regression with two-way cluster-robust method) by using the panel data introduced in Section 4.12 13
𝑃𝑃𝑃𝑃𝑃𝑃𝑃𝑃𝑃𝑃𝑃𝑃𝑃𝑃𝑃𝑃𝑃𝑃𝑃𝑃𝑃𝑃𝑃𝑃𝑃𝑃𝑖𝑖,𝑦𝑦= 𝐶𝐶𝑃𝑃𝐶𝐶𝐶𝐶𝑃𝑃𝑃𝑃𝐶𝐶𝑃𝑃 𝑇𝑇𝑇𝑇𝑃𝑃𝑇𝑇𝑖𝑖,𝑦𝑦 + 𝛽𝛽𝑔𝑔𝐺𝐺𝑃𝑃𝐺𝐺𝑇𝑇𝑃𝑃𝐶𝐶𝑃𝑃𝐶𝐶𝐺𝐺𝑇𝑇 𝑃𝑃𝐶𝐶𝑎𝑎 𝐸𝐸𝑇𝑇𝐸𝐸𝑃𝑃𝑃𝑃𝑃𝑃𝑇𝑇𝑇𝑇𝐶𝐶𝑃𝑃 𝑖𝑖,𝑦𝑦
+ 𝛽𝛽𝑛𝑛𝐷𝐷𝐷𝐷𝑇𝑇𝑇𝑇𝑃𝑃 𝑉𝑉𝑃𝑃𝑃𝑃𝑃𝑃𝑃𝑃𝑃𝑃𝑃𝑃𝑇𝑇 𝑃𝑃𝑃𝑃𝑃𝑃 𝐽𝐽𝑃𝑃𝐸𝐸𝑃𝑃𝐶𝐶𝑖𝑖,𝑦𝑦 + 𝛽𝛽𝑐𝑐𝐶𝐶𝑃𝑃𝐶𝐶𝑃𝑃𝑃𝑃𝑃𝑃𝑃𝑃 𝑉𝑉𝑃𝑃𝑃𝑃𝑃𝑃𝑃𝑃𝑃𝑃𝑃𝑃𝑇𝑇𝑖𝑖,𝑦𝑦+ 𝐸𝐸𝑃𝑃𝑃𝑃𝑃𝑃𝑃𝑃 𝑇𝑇𝑇𝑇𝑃𝑃𝑇𝑇𝑖𝑖,𝑦𝑦
The focus of the analysis includes the coefficient 𝛽𝛽𝑔𝑔 of governance and
employment-related variables and the coefficient 𝛽𝛽𝑛𝑛 of the dummy variable for Japan. The coefficient 𝛽𝛽𝑔𝑔 represents the effect of governance and employee-related variables in the overall sample population while 𝛽𝛽𝑛𝑛 captures the fixed effect of Japanese firms. Based on the observation from Table 1, this fixed effect of Japanese firms should be negative and significant if the effects of corporate governance and employment systems are not taken into consideration. We expect that adding these two variables should reduce the absolute value of the fixed effect 𝛽𝛽𝑛𝑛 of Japanese firms.
The dependent variables used in the analysis to investigate the driver of corporate profitability and firm value are ROA (EBITDA / asset) as a profitability indicator, Tobin’s q (corporate value / total book value) as an indicator to measure the firm value, and risk-taking of the firm (the standard deviation of industry-adjusted ROA for the analysis period). As explanatory variables, we use the year dummy and industry dummy variable to control the industry and macro-economic trends, natural logarithm of sales as a proxy for firm size, the interest-bearing debt ratio to control the effect of capital 12 The subscripts i and y in each variable denote company and year, respectively. 13 In the statistical validation, the significance is determined based on the robust standard errors by clustering by country and company.
15
structure, and firm’s years in business to control the lifecycle of the firm. As control variables for the business environment in each country where firms are located, the per capita GDP and GDP growth rate (in the past three years) are also used. Since the GDP growth rate is nominal basis, it also controls the effect of inflation rate in each country.
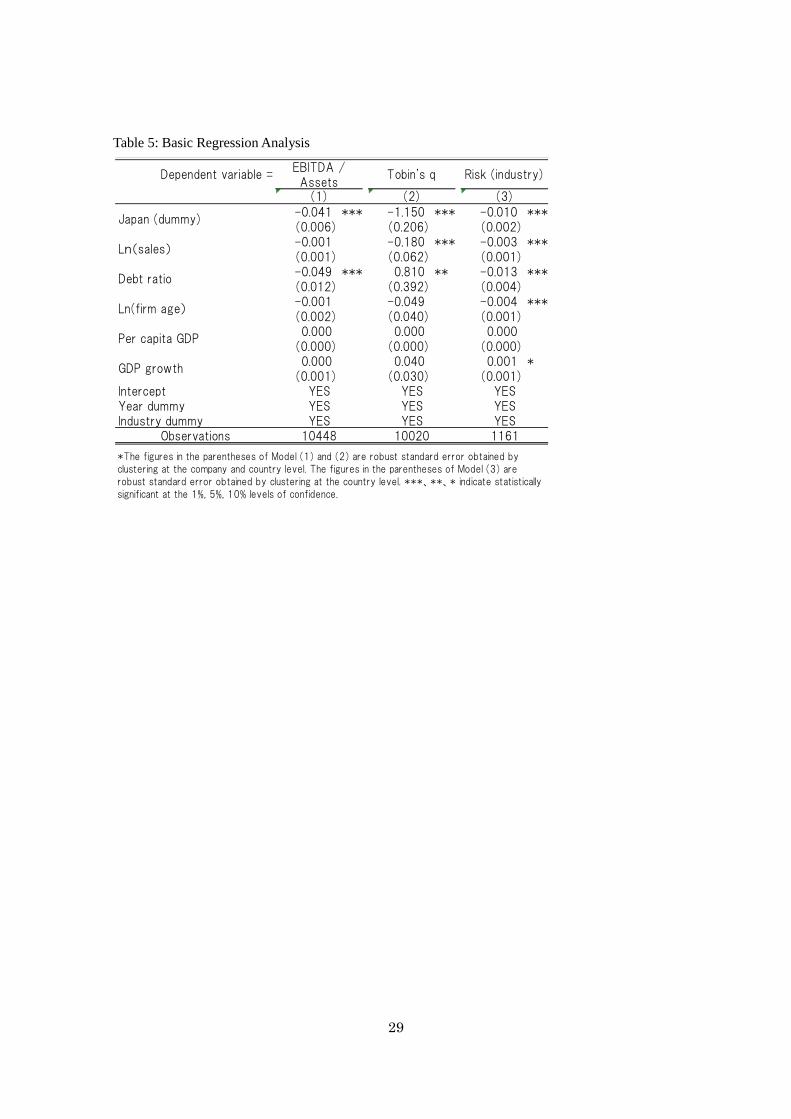
Table 5 summarizes the result. The coefficient of the dummy for Japan is negative and significant in each of the models that used profitability, firm value, and risk-taking as the dependent variable. The ROA and Tobin’s q of Japanese firms are lower by 4.1% and 1.15, respectively, compared to other countries even after taking the firm-specific characteristics, industry, and the macro environment in their country into account.
Table 5 appears around here
5.2 Corporate Performance and Corporate Governance We examine whether the negative coefficient of the dummy for Japan would be
reduced when a corporate governance-related variable is added to the explanatory variables of the model in Table 5.
As variables for shareholder structure, we use institutional ownership and insider ownership. Firms with a high institutional ownership rate can expect the disciplining effect on the management through institutional investors exercising the voting rights (exercising the voice option) and selling the shares (the Wall Street rule) upon management actions that go against the shareholder interests; however, excessive demand for increased shareholder return poses a concern that it would make the management to focus on the short-term results and lose the long-term growth potential.
As for the structure of the board members, we use the outside director ratio.14 We expect firms with a high outside director ratio to manage business effectively because the management team is monitored internally by the board of directors to suppress the agency program of the management. As a note, the corporate governance code introduced in Japan in 2015 states that one of the objectives in introducing outside directors is for the outside directors to have a function to guarantee and promote firm’s appropriate risk-taking action. Meanwhile, in countries such as the United States, it has been pointed out that the agency problem generally emerges as excessive investment; therefore, outside directors could suppress risk-taking.
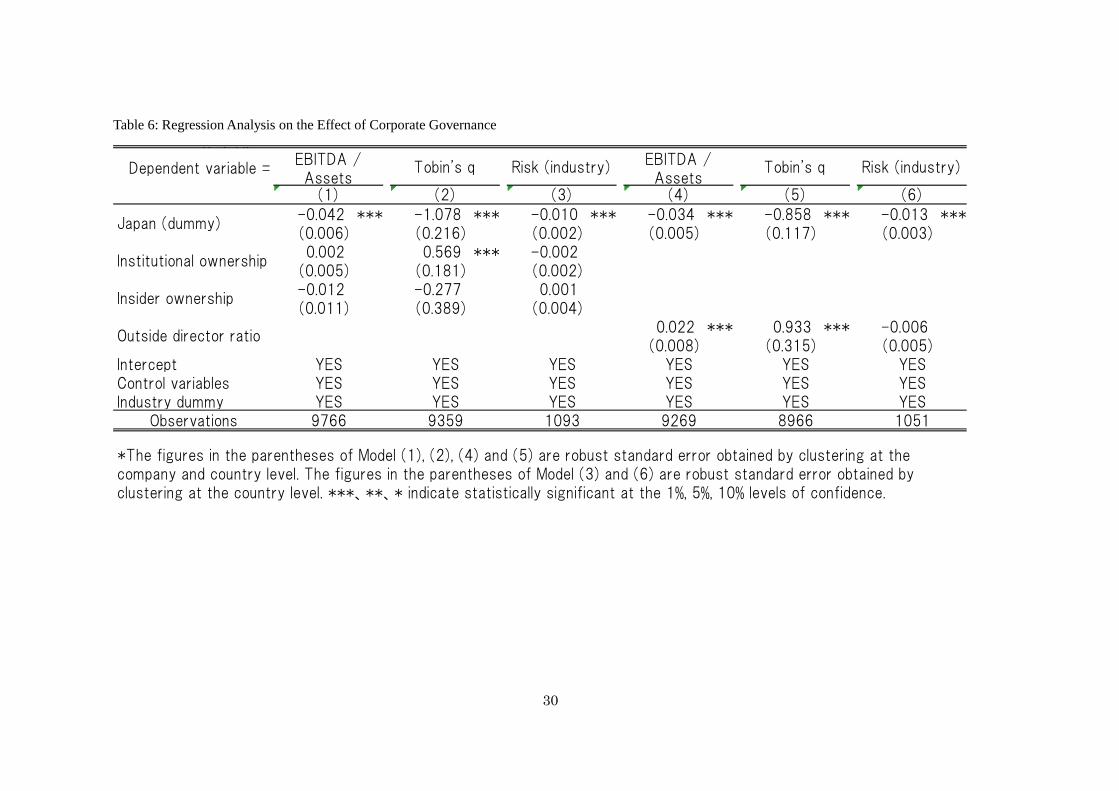
Table 6 appears around here 14 Since the institutional ownership ratio and the outside director ratio are correlated positively, we use these two variables separately in the analysis. That said, the correlation coefficient between these two variables in this study’s sample is 0.24, which cannot be considered very high.
16
Table 6 shows the results of the regression analysis. Institutional ownership and
insider ownership are used as variables for the shareholder structure, while the outside director ratio is used for the board structure.
In terms of shareholder structure, the result shows that institutional ownership has a positive and significant effect on Tobin’s q. This result is consistent with Ferrira and Matos (2008) who conduct a cross-country analysis like ours and report that institutional investors have a positive impact on the value and performance of firms. While this result suggests the disciplinary effect of institutional investors, it could also be interpreted that institutional investors choose to invest in the stocks of firms that are priced high and expected to grow. However, we find no significant effects from the institutional investors to ROA and risk-taking. In addition, the coefficient of the dummy for Japan does not change much in this model compared to the one in Table 5, remaining negative and significant. The reason for this weak impact of institutional ownership could be because the share held by domestic institutional investors is included as part of the institutional investors. Ferrira and Matos show no positive effect from domestic institutional investors, and it is well known that domestic institutional investors in Japan play a marginal role in terms of corporate governance.
The outside director ratio has a significant positive effect on the ROA and Tobin’s q, indicating that the higher the outside director ratio is, the higher the profitability and firm value. When the outside director ratio increases by 29%, which is equivalent to its one standard deviation, the ROA and Tobin’s q increases by 0.6% and 0.26, respectively. Applying it to the case of Japan, it is the same as the outside director ratio being increased from the sample’s average of 19% to 48%. In addition, when the outside director ratio is added to the variables, the absolute coefficient of the dummy for Japan decreased from 4.1% to 3.4% for the ROA and from 1.15 to 0.86 for Tobin’s q compared to the model on Table 5. This effect is almost consistent with the aforementioned overall effect of the outside director ratio; therefore we could say that the difference in the outside director ratio partially explains the difference in performance between Japan and other countries. Table 2 shows that the outside director ratio in Japan is at the lowest level by international standards. Increasing this ratio up to the average level among other countries and strengthening the disciplining by the board of directors could improve the profitability and firm value of sample firms.
Meanwhile, the outside director ratio has a negative effect on risk-taking albeit not statistically significant. This could be interpreted that the effect on risk-taking is offset by the effect of outside directors suppressing the tendency of management’s excess
17
investment in countries such as the United States where the agency problem tends emerges as an excessive investment problem.
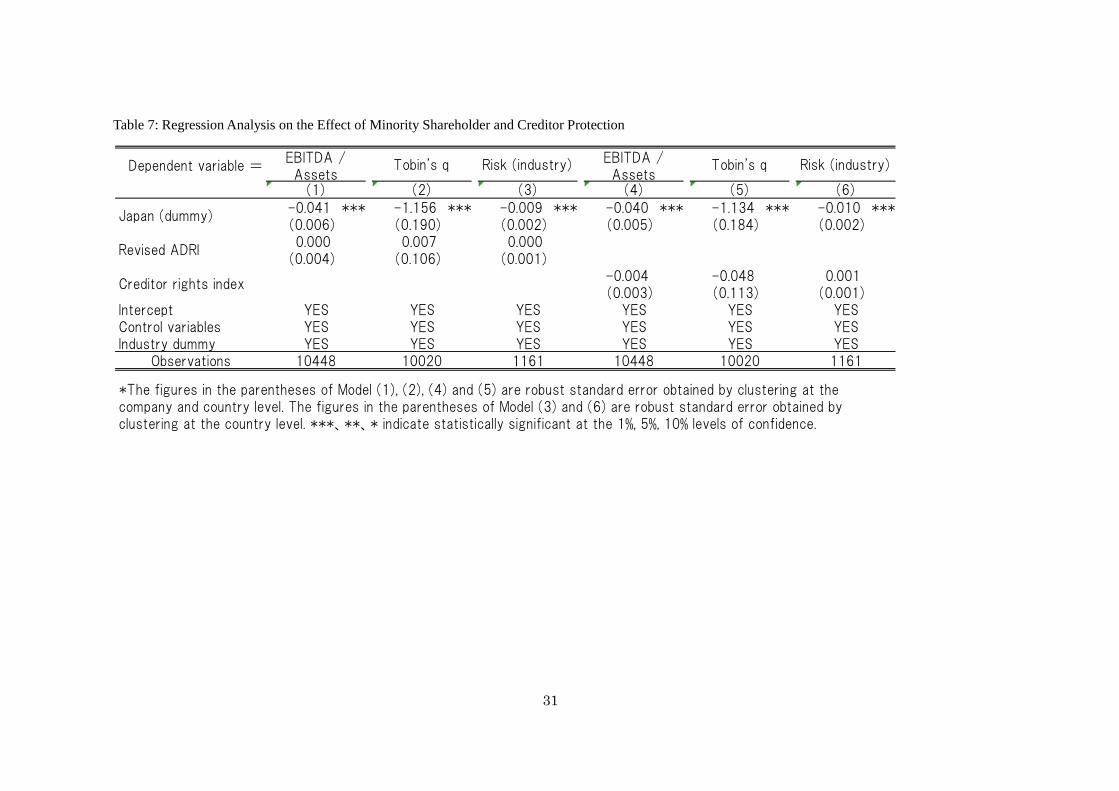
So far, we have shown the results of the analysis that uses firm-level corporate governance variables. It is undeniable that these firm-specific variables could already be affected by the legal systems at the country-level to begin with. Then, we use the Revised ADRI based on Djankov, et al. (2008) as an indexed legal system variable directly related to corporate governance. As an index for this bargaining power of creditor, we use the Creditor Rights Index (Djankov, et al.(2007)) along with the ADRI to examine their effects on the profitability and firm values.
Table 7 appears around here
The results are shown in Table 7.While the coefficient of the ADRI is positive in all models, we find no statistically significant results. In addition, we also find no notable change in the coefficient of the dummy for Japan in all models compared to the models in Table 5. Based on this result, it doesn’t seem that the minority shareholder protection by legal system are a culprit for the low profitability and low firm value of Japanese firms The Creditor Rights Index also does not show any significant effects on the profitability and firm value, and the coefficient of the dummy for Japan in this model also does not show any notable changes from Table 5.
The analyses up to this point show that, in terms of corporate governance, the outside director ratio has a high explanatory power for the low profitability and low market value of Japanese firms.
5.3 Corporate Performance and Employment Adjustment
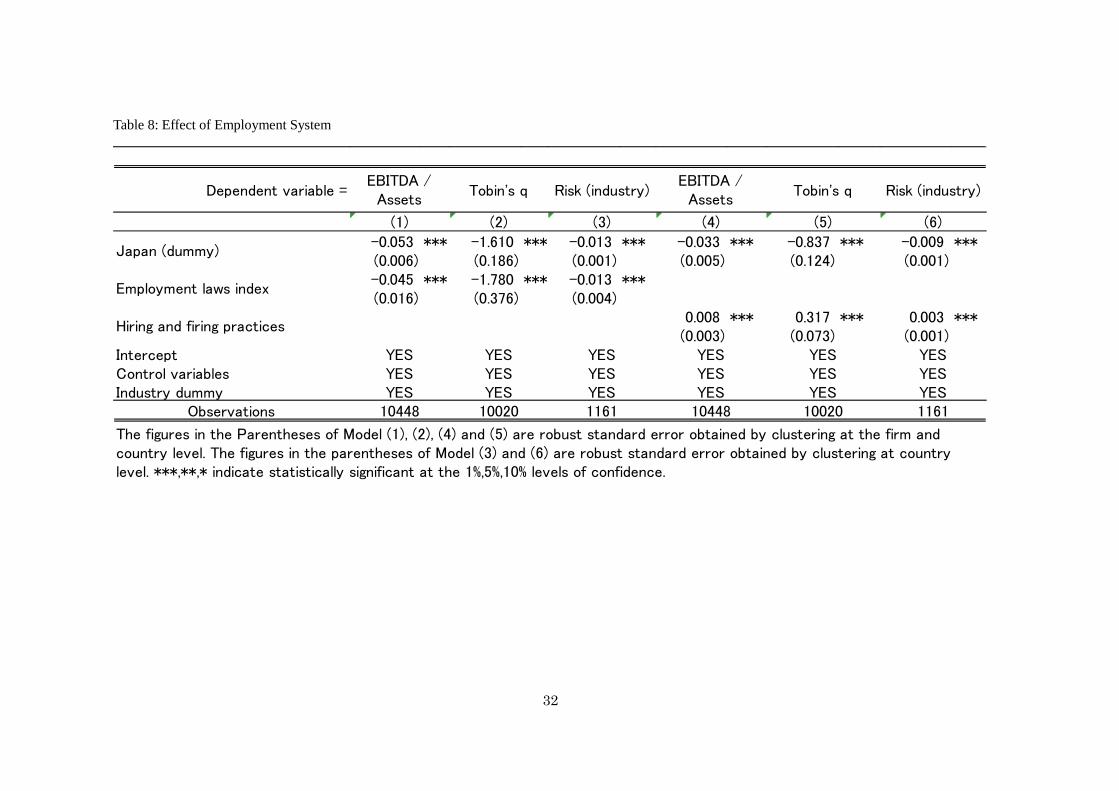
Next, we examine the effect of employment protection. There is a concern that the efficiency improvement by organizational restructuring and industry reorganization are limited in countries where dismissing excess employees is difficult due to the labor law. As for the level of employee protection under the labor law in each country against situations such as dismissal, we use the Employment Laws Index (employment protection index) by Botero, et al. (2004). This index score increases as the employee protection increases. As an alternative index for the legal employee protection, we use the Hiring and Firing Practices index based on the Executive Opinion Survey by the World Economic Forum. A higher score means that the managers perceive employment adjustment can be implemented flexibly. Since these two variables are highly correlated as shown in Table 4, we examine the effect of these variables separately.
18
Table 8 appears around here
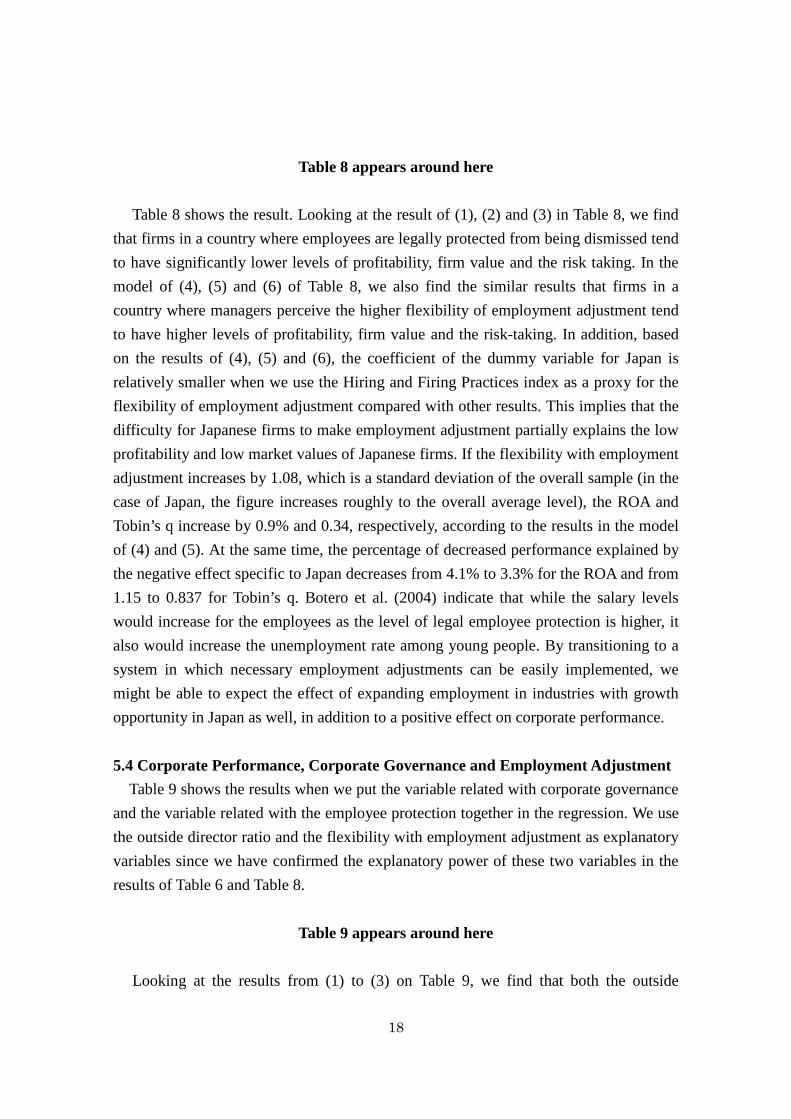
Table 8 shows the result. Looking at the result of (1), (2) and (3) in Table 8, we find
that firms in a country where employees are legally protected from being dismissed tend to have significantly lower levels of profitability, firm value and the risk taking. In the model of (4), (5) and (6) of Table 8, we also find the similar results that firms in a country where managers perceive the higher flexibility of employment adjustment tend to have higher levels of profitability, firm value and the risk-taking. In addition, based on the results of (4), (5) and (6), the coefficient of the dummy variable for Japan is relatively smaller when we use the Hiring and Firing Practices index as a proxy for the flexibility of employment adjustment compared with other results. This implies that the difficulty for Japanese firms to make employment adjustment partially explains the low profitability and low market values of Japanese firms. If the flexibility with employment adjustment increases by 1.08, which is a standard deviation of the overall sample (in the case of Japan, the figure increases roughly to the overall average level), the ROA and Tobin’s q increase by 0.9% and 0.34, respectively, according to the results in the model of (4) and (5). At the same time, the percentage of decreased performance explained by the negative effect specific to Japan decreases from 4.1% to 3.3% for the ROA and from 1.15 to 0.837 for Tobin’s q. Botero et al. (2004) indicate that while the salary levels would increase for the employees as the level of legal employee protection is higher, it also would increase the unemployment rate among young people. By transitioning to a system in which necessary employment adjustments can be easily implemented, we might be able to expect the effect of expanding employment in industries with growth opportunity in Japan as well, in addition to a positive effect on corporate performance.
5.4 Corporate Performance, Corporate Governance and Employment Adjustment
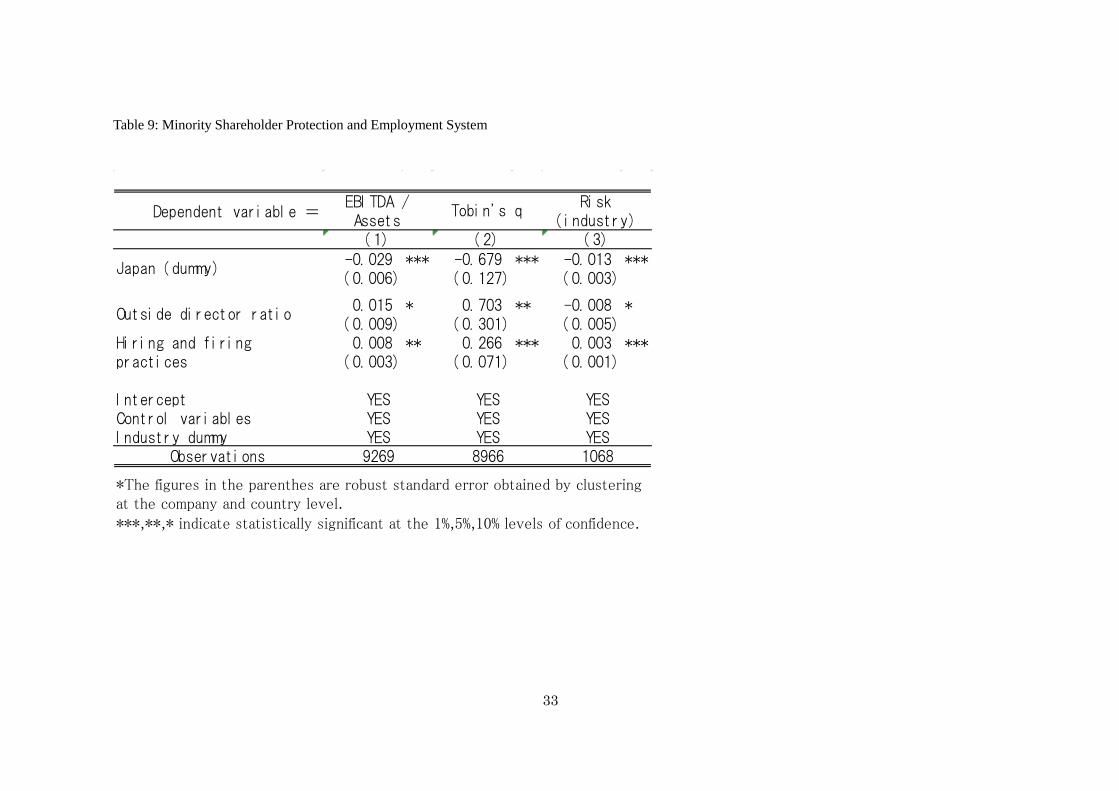
Table 9 shows the results when we put the variable related with corporate governance and the variable related with the employee protection together in the regression. We use the outside director ratio and the flexibility with employment adjustment as explanatory variables since we have confirmed the explanatory power of these two variables in the results of Table 6 and Table 8.
Table 9 appears around here
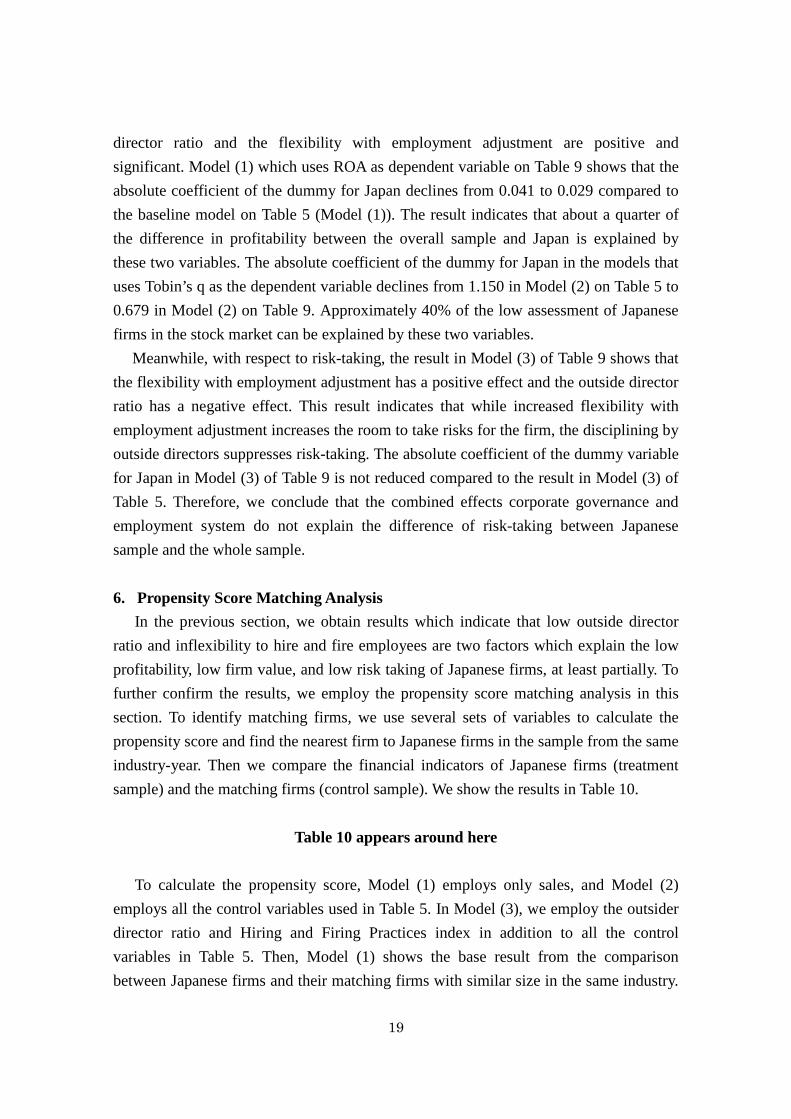
Looking at the results from (1) to (3) on Table 9, we find that both the outside
19
director ratio and the flexibility with employment adjustment are positive and significant. Model (1) which uses ROA as dependent variable on Table 9 shows that the absolute coefficient of the dummy for Japan declines from 0.041 to 0.029 compared to the baseline model on Table 5 (Model (1)). The result indicates that about a quarter of the difference in profitability between the overall sample and Japan is explained by these two variables. The absolute coefficient of the dummy for Japan in the models that uses Tobin’s q as the dependent variable declines from 1.150 in Model (2) on Table 5 to 0.679 in Model (2) on Table 9. Approximately 40% of the low assessment of Japanese firms in the stock market can be explained by these two variables.
Meanwhile, with respect to risk-taking, the result in Model (3) of Table 9 shows that the flexibility with employment adjustment has a positive effect and the outside director ratio has a negative effect. This result indicates that while increased flexibility with employment adjustment increases the room to take risks for the firm, the disciplining by outside directors suppresses risk-taking. The absolute coefficient of the dummy variable for Japan in Model (3) of Table 9 is not reduced compared to the result in Model (3) of Table 5. Therefore, we conclude that the combined effects corporate governance and employment system do not explain the difference of risk-taking between Japanese sample and the whole sample. 6. Propensity Score Matching Analysis
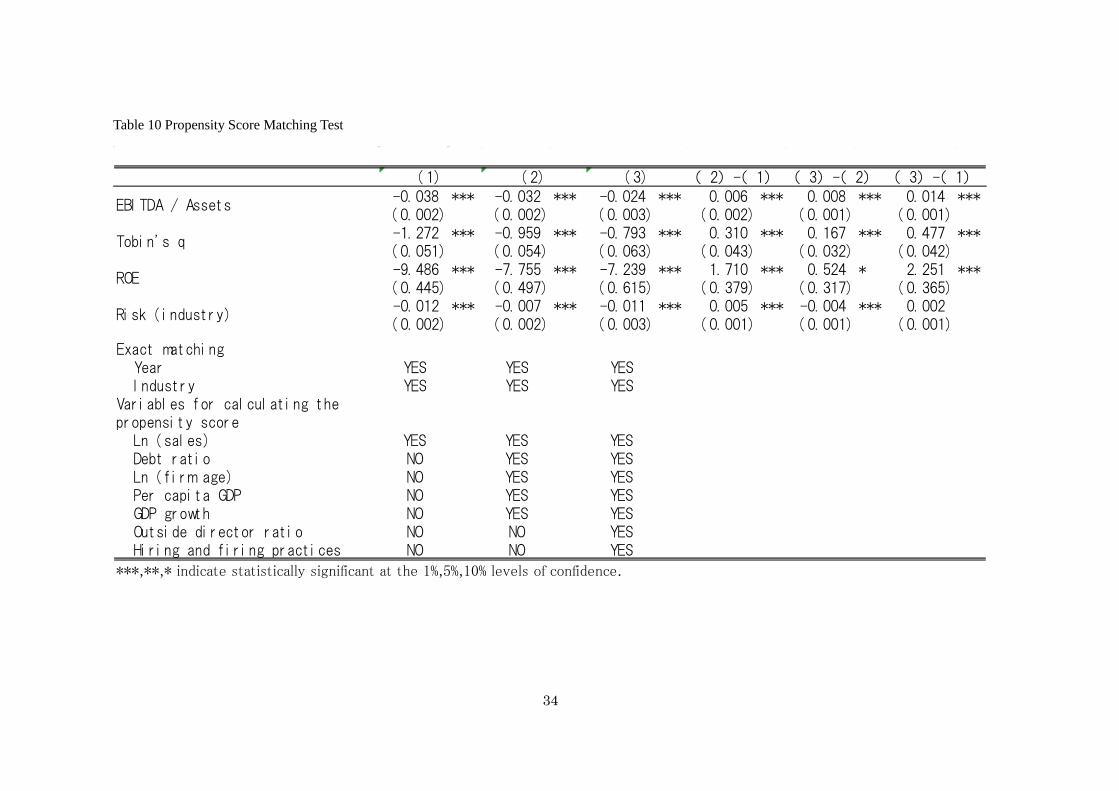
In the previous section, we obtain results which indicate that low outside director ratio and inflexibility to hire and fire employees are two factors which explain the low profitability, low firm value, and low risk taking of Japanese firms, at least partially. To further confirm the results, we employ the propensity score matching analysis in this section. To identify matching firms, we use several sets of variables to calculate the propensity score and find the nearest firm to Japanese firms in the sample from the same industry-year. Then we compare the financial indicators of Japanese firms (treatment sample) and the matching firms (control sample). We show the results in Table 10.
Table 10 appears around here
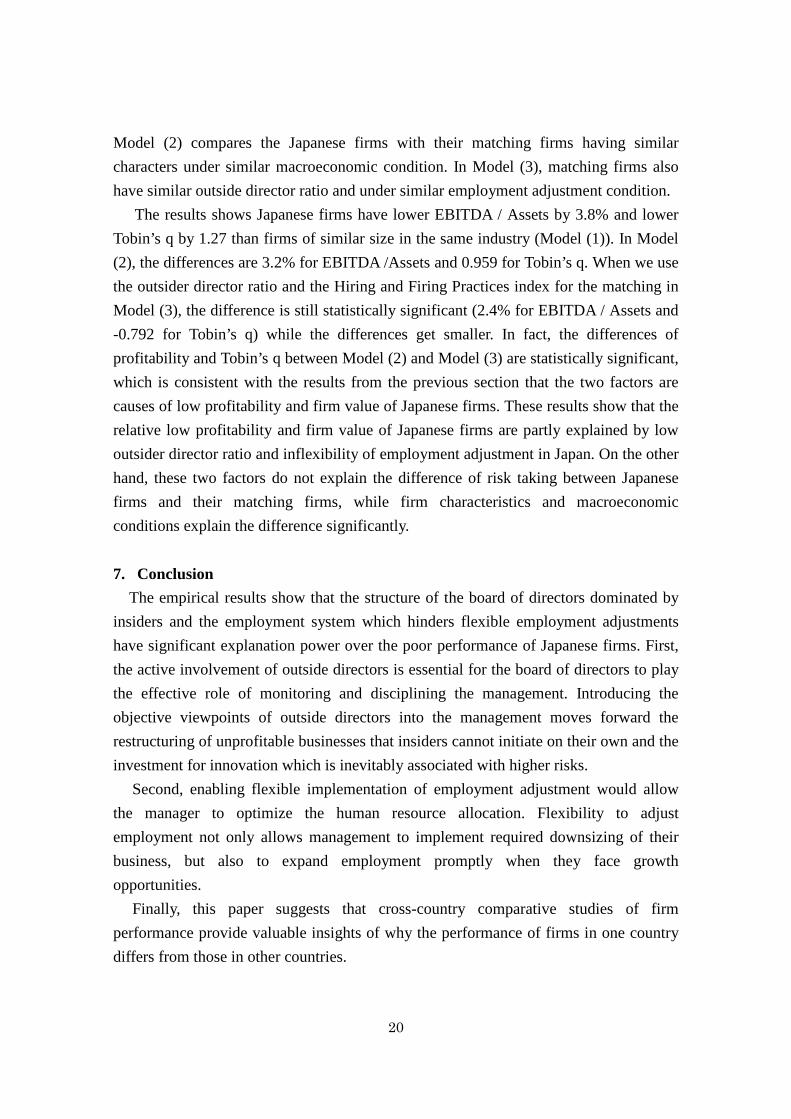
To calculate the propensity score, Model (1) employs only sales, and Model (2)
employs all the control variables used in Table 5. In Model (3), we employ the outsider director ratio and Hiring and Firing Practices index in addition to all the control variables in Table 5. Then, Model (1) shows the base result from the comparison between Japanese firms and their matching firms with similar size in the same industry.
20
Model (2) compares the Japanese firms with their matching firms having similar characters under similar macroeconomic condition. In Model (3), matching firms also have similar outside director ratio and under similar employment adjustment condition.
The results shows Japanese firms have lower EBITDA / Assets by 3.8% and lower Tobin’s q by 1.27 than firms of similar size in the same industry (Model (1)). In Model (2), the differences are 3.2% for EBITDA /Assets and 0.959 for Tobin’s q. When we use the outsider director ratio and the Hiring and Firing Practices index for the matching in Model (3), the difference is still statistically significant (2.4% for EBITDA / Assets and -0.792 for Tobin’s q) while the differences get smaller. In fact, the differences of profitability and Tobin’s q between Model (2) and Model (3) are statistically significant, which is consistent with the results from the previous section that the two factors are causes of low profitability and firm value of Japanese firms. These results show that the relative low profitability and firm value of Japanese firms are partly explained by low outsider director ratio and inflexibility of employment adjustment in Japan. On the other hand, these two factors do not explain the difference of risk taking between Japanese firms and their matching firms, while firm characteristics and macroeconomic conditions explain the difference significantly.
7. Conclusion
The empirical results show that the structure of the board of directors dominated by insiders and the employment system which hinders flexible employment adjustments have significant explanation power over the poor performance of Japanese firms. First, the active involvement of outside directors is essential for the board of directors to play the effective role of monitoring and disciplining the management. Introducing the objective viewpoints of outside directors into the management moves forward the restructuring of unprofitable businesses that insiders cannot initiate on their own and the investment for innovation which is inevitably associated with higher risks.
Second, enabling flexible implementation of employment adjustment would allow the manager to optimize the human resource allocation. Flexibility to adjust employment not only allows management to implement required downsizing of their business, but also to expand employment promptly when they face growth opportunities.
Finally, this paper suggests that cross-country comparative studies of firm performance provide valuable insights of why the performance of firms in one country differs from those in other countries.
21
Reference Aggarwal, R., Erel, I., Stulz, R, and R. Willaimson. 2009. Difference in Governance Practices between U.S. and Foreign Firms: Measurement, Causes, and Consequences. Review of Financial Studies 22: 3131-3169. Aggarwal, R., Erel, I., Ferreira, M., and P. Matos. 2011. Does Governance Travel Around the World? Evidence from Institutional Investors. Journal of Financial Economics 100: 154-182. Bertrand,M. and S. Mullainathan. 2003. Enjoining the Quiet Life? Corporate Governance and Managerial Preferences. Journal of Political Economy 111: 1043-1075. Botero,J.,C.,Djankov, S., La Porta,R., F.Lopez-de-Silianes, and A.Shleifer. 2004. The Regulation of Labor. The Quarterly Journal of Economics 119:1339-1382. Bruno,. V., and S.Claessens. 2010. Corporate Governance and Regulation: Can There Be Too Much of Good Thing? Journal of Financial Intermediation 19: 461-482. Byrd, J.W. and K.A. Hickman. 1992. Do Outside Directors Monitor Managers? Evidence from Tender Offer Bids. Journal of Financial Economics 32: 195-221. Caballero,R., Cowan,K., Engel,E.M.R.A. and A. Micco. 2013. Effective Labor Regulation and Microeconomic Flexibility. Journal of Development Economics 101: 92-104. Cabinet Office of Japan, 2015. Annual Report on the Japanese Economy and Public Finance 2015. Chhaochharia,V.,and L.Laeven.2009.Corporate Governance Norms and Practices. Journal of Financial Intermediation 18:405-431. Dahya,J., Dimitrov,O. and J.J.McConell. 2008. Dominant Shareholders, Corporate Boards, and Corporate Value: A Cross-Country Analysis. Journal of Financial Economics 87: 73-100.
22
Djankov, S., La Porta, R., F, Lopez-de-Silanes, and A. Shleifer. 2008. The Law and Economics of Self-Dealing. Journal of Financial Economics 88: 430–465. Djankov, S, McLiesh,C. and Andrei Shleifer. 2007. Private Credit in 129 Countries. Journal of Financial Economics 12 (2): 77-99. Durnev,A. and E.Kim. 2005. To Steal or Not to steal: Firm Attributes, Legal Environment and Valuation. Journal of Finance 60:1461-93. Ferreira, M. A. and P. Matos. 2008. The Colors of Investors’ Money: The Role of Institutional Investors Around the World. Journal of Financial Economics 88, 499–533 Hermalin, B.E. and M.S. Weisbach. 1998. Endogenously Chosen Board of Directors and Their Monitoring of the CEO. American Economic Review 88: 96-118. Hiraki, T. and A. Ito. 2009. Investor Biases in Japan: Another Pathology of Keiretsu. Pacific-Basin Finance Journal 17(1): 100-124. Hoshi, T. and A. Kashyap. 2001. Corporate Financing and Governance in Japan, MIT Press, MA, US. John, K. Knyazeva, A., and D. Knyazeva. 2015.Employee Rights and Acquisitions. Journal of Financial Economics 118: 49-69. John, K., Litov, L. and B.Yeung. 2008. Corporate Governance and Risk Taking. Journal of Finance 63(4): 1679-1728. La Porta, R., F. Lopez-de-Silanes, A. Shleifer and R.Vishny. 1998. Law and Finance. Journal of Political Economy 106: 1113-1155. La Porta, R., F. Lopez-de-Silanes, and A. Shleifer. 2002. Investor Protection and Corporate Valuation. Journal of Finance 57: 1147-1170. La Porta, R., F. Lopez-de-Silanes, and A. Shleifer. 2008. The Economic Consequences of Legal Origins. Journal of Economic Literature 46: 285-332.
23
Saito, T., Miyajima, H., and R.Ogawa. 2016. Transformation of Corporate Governance System and Replacement of Management. RIETI Discussion Paper Series 16-J-039 Simintzi, E., Vig, V., and P. Volpin. 2014. Labor Protection and Leverage. Review of Financial Studies 28: 561-591. Weisbach, M.S. 1988. Outside Directors and CEO Turnover. Journal of Financial Economics 20: 431-460.
24
Figure 1: Risk-Taking and ROA
AUS
BEL BRACAN
CHN
TWN
FINFRA
DEU
HKG
IND
ITA
JPN
KOR
MYS
MEX
NLD
RUS
SGP
ZAF
ESP
SWE
CHE
THA
UK
US
All
0.08
0.10
0.12
0.14
0.16
0.18
0.20
0.22
0.015 0.025 0.035 0.045 0.055 0.065 0.075 0.085
EBIT
DA/A
sset
s
Risk (industry)
25
Table 1: Profitability and Firm Value (Descending ROA) in Each Country
ROA Sales margin Tobin's q ROE (%) Risk take
Country Firm*Year Median Median Median Median MedianRussian 154 0.18 0.33 1.65 18.06 0.066South Africa 119 0.18 0.11 3.18 23.98 0.041Thailand 112 0.17 0.11 2.40 20.49 0.044India 266 0.17 0.20 2.82 22.37 0.061Malaysia 77 0.15 0.17 1.86 14.90 0.026Turkey 84 0.14 0.11 2.09 19.28 0.017United States 3284 0.14 0.15 2.46 15.93 0.029Brazil 140 0.14 0.16 1.62 12.75 0.050Mexico 147 0.14 0.15 1.93 13.91 0.031Canada 336 0.14 0.15 1.79 14.11 0.031Switzerland 245 0.13 0.12 2.39 14.70 0.026Australia 210 0.12 0.11 1.93 13.61 0.030Belgium 77 0.12 0.10 1.53 14.17 0.026Taiwan 217 0.12 0.13 1.63 13.05 0.026Sweden 182 0.12 0.14 2.16 17.67 0.022United Kingdom 630 0.12 0.12 2.21 18.00 0.024Netherlands 168 0.12 0.13 1.83 16.87 0.029Singapore 98 0.12 0.13 1.54 19.66 0.027Germany 420 0.11 0.11 1.50 14.05 0.025Korea 336 0.11 0.11 1.10 11.48 0.039Hong Kong 273 0.11 0.19 1.43 15.40 0.037France 462 0.11 0.11 1.37 11.93 0.018Finland 126 0.10 0.10 1.26 10.15 0.030Italy 168 0.10 0.13 1.06 10.93 0.022Spain 126 0.10 0.16 1.65 21.22 0.023China 287 0.10 0.16 1.94 16.43 0.052Japan 2086 0.09 0.09 1.14 7.01 0.019All 10830 0.12 0.12 1.77 13.58 0.026
26
Table 2: Descriptive Statistics of Sample Firms by Country
*The outside director ratio for Germany is the ratio of the board of corporate auditors.
ROA
Country Firm*Year Median Mean Mean Mean Mean Mean MeanRussian 154 0.18 15.94 0.16 34.0 0.18 0.04 0.19South Africa 119 0.18 15.65 0.12 52.4 0.41 0.02 0.57Thailand 112 0.17 15.36 0.18 29.8 0.33 0.09 0.40India 266 0.17 15.42 0.18 46.2 0.27 0.01 0.55Malaysia 77 0.15 14.99 0.17 57.0 0.49 0.01 0.68Turkey 84 0.14 15.51 0.16 56.0 0.13 0.07 0.01United States 3284 0.14 15.91 0.24 65.8 0.57 0.04 0.70Brazil 140 0.14 16.10 0.24 60.5 0.32 0.02 0.16Mexico 147 0.14 15.49 0.15 65.2 0.15 0.15 0.31Canada 336 0.14 15.82 0.22 58.6 0.45 0.05 0.68Switzerland 245 0.13 15.63 0.15 97.4 0.37 0.05 0.35Australia 210 0.12 15.51 0.23 72.2 0.32 0.03 0.66Belgium 77 0.12 15.93 0.18 151.5 0.26 0.02 0.36Taiwan 217 0.12 15.58 0.12 34.4 0.30 0.04 0.22Sweden 182 0.12 15.68 0.16 99.0 0.47 0.03 0.36United Kingdom 630 0.12 15.88 0.20 89.7 0.58 0.05 0.50Netherlands 168 0.12 16.05 0.21 90.0 0.45 0.03 0.34Singapore 98 0.12 15.82 0.14 41.2 0.41 0.05 0.59Germany 420 0.11 16.11 0.19 98.5 0.31 0.06 0.07Korea 336 0.11 16.02 0.14 47.2 0.39 0.06 0.49Hong Kong 273 0.11 15.22 0.18 47.5 0.33 0.07 0.38France 462 0.11 16.04 0.17 96.9 0.33 0.09 0.53Finland 126 0.10 15.74 0.15 116.1 0.35 0.06 0.35Italy 168 0.10 15.75 0.22 69.0 0.21 0.01 0.42Spain 126 0.10 15.84 0.30 62.0 0.34 0.05 0.35China 287 0.10 15.32 0.13 32.6 0.23 0.09 0.38Japan 2086 0.09 15.93 0.14 84.9 0.32 0.03 0.19All 10830 0.12 15.83 0.19 71.8 0.41 0.05 0.50
Debt ratio Firm ageInstitutionalownership
Insiderownership
Outsidedirector ratio
Sales
27
Table 3: State of Legal and Employment Systems in Each Country
ROA
Country Median Mean Mean
Russian 0.18 6,394 3.76 4 2 0.83 4.31South Africa 0.18 5,684 3.21 5 3 0.32 2.37Thailand 0.17 3,061 3.69 4 2 0.41 4.31India 0.17 962 7.58 5 2 0.44 3.43Malaysia 0.15 6,226 4.78 5 3 0.19 4.28Turkey 0.14 7,861 3.92 3 2 0.40 3.95United States 0.14 44,560 1.12 3 1 0.22 5.23Brazil 0.14 5,382 3.74 5 1 0.57 2.92Mexico 0.14 8,195 2.57 3 0 0.59 3.31Canada 0.14 36,742 1.53 4 1 0.26 4.62Switzerland 0.13 58,062 2.02 3 1 0.45 5.64Australia 0.12 36,025 2.89 4 3 0.35 3.73Belgium 0.12 37,899 1.17 3 2 0.51 2.80Taiwan 0.12 35,011 3.82 3 2 0.45 4.38Sweden 0.12 44,983 1.53 3.5 1 0.74 2.82United Kingdom 0.12 40,233 0.74 5 4 0.28 4.26Netherlands 0.12 43,842 1.14 2.5 3 0.73 2.98Singapore 0.12 33,429 6.14 5 3 0.31 5.82Germany 0.11 37,338 1.49 3.5 3 0.70 2.59Korea 0.11 21,479 3.81 4.5 3 0.45 3.68Hong Kong 0.11 30,693 3.75 5 4 0.17 5.60France 0.11 35,555 0.91 3.5 0 0.74 2.61Finland 0.10 40,545 0.83 3.5 1 0.74 3.67Italy 0.10 31,402 -0.43 2 2 0.65 2.60Spain 0.10 26,595 0.40 5 2 0.74 2.76China 0.10 2,642 10.44 1 2 0.43 4.15Japan 0.09 36,401 0.47 4.5 2 0.16 3.12Sum 0.12 34,968 1.86 3.71 1.79 0.34 4.08
Employmentlaws index
Hirign andfiring
practices
Creditorrights index
Per capita GDP GDP growthADRI
28
Table 4: Correlation Coefficients between Variables
Panel A: Firm Variables
Panel B. Country Variables
Institutionalownership
Managerialownership
Outsidedirector
ratio
Ln(numberof the rivalfirms in thecoutnry)
ADRICreditor
right indexEmploymentlaws index
Hiring andfiring
practices
Institutional ownership 1Managerial ownership 0.0472 1Outside director ratio 0.243 0.0681 1Ln(number of the rival firms in the coutnry) 0.1772 -0.0136 0.1618 1ADRI -0.2524 -0.0329 -0.5367 -0.2146 1Creditor right index -0.1813 -0.0457 -0.2803 -0.1995 0.6619 1
Employment laws index -0.0801 0.0788 0.1085 -0.3971 -0.1063 -0.0099 1Hiring and firing practices 0.3243 0.0098 0.4275 0.4458 -0.4339 -0.2704 -0.6691 1
ADRICreditor
rightindex
Employmentlaws index
Hiring andfiring
practices
ADRI 1Creditor right index 0.3475 1Employment laws index -0.3267 -0.3534 1Hiring and firing practices 0.2925 0.2605 -0.7406 1
29
Table 5: Basic Regression Analysis
Dependent variable =
-0.041 *** -1.150 *** -0.010 ***(0.006) (0.206) (0.002)-0.001 -0.180 *** -0.003 ***(0.001) (0.062) (0.001)-0.049 *** 0.810 ** -0.013 ***(0.012) (0.392) (0.004)-0.001 -0.049 -0.004 ***(0.002) (0.040) (0.001)0.000 0.000 0.000
(0.000) (0.000) (0.000)0.000 0.040 0.001 *
(0.001) (0.030) (0.001)InterceptYear dummyIndustry dummy
Observations 1161
*The figures in the parentheses of Model (1) and (2) are robust standard error obtained byclustering at the company and country level. The figures in the parentheses of Model (3) arerobust standard error obtained by clustering at the country level. ***、**、* indicate statisticallysignificant at the 1%, 5%, 10% levels of confidence.
YES YES10448 10020YES
YES YES YESYES YES YES
GDP growth
Per capita GDP
Risk (industry)
(1) (2) (3)
Japan (dummy)
Ln(sales)
Debt ratio
Ln(firm age)
EBITDA /Assets
Tobin's q
30
Table 6: Regression Analysis on the Effect of Corporate Governance
サンプル=
Dependent variable =
-0.042 *** -1.078 *** -0.010 *** -0.034 *** -0.858 *** -0.013 ***(0.006) (0.216) (0.002) (0.005) (0.117) (0.003)0.002 0.569 *** -0.002
(0.005) (0.181) (0.002)-0.012 -0.277 0.001(0.011) (0.389) (0.004)
0.022 *** 0.933 *** -0.006(0.008) (0.315) (0.005)
InterceptControl variablesIndustry dummy
Observations
*The figures in the parentheses of Model (1), (2), (4) and (5) are robust standard error obtained by clustering at thecompany and country level. The figures in the parentheses of Model (3) and (6) are robust standard error obtained byclustering at the country level. ***、**、* indicate statistically significant at the 1%, 5%, 10% levels of confidence.
YES1051
(3) (4)
YES
YESYESYES
Risk (industry)
(6)
YESYES
9766 9359 9269 8966YES
YESYESYES1093
YESYES YESYES YES
Institutional ownership
Insider ownership
Outside director ratio
Tobin's q
(1) (2)
Japan (dummy)
EBITDA /Assets
Tobin's q EBITDA /Assets
Risk (industry)
YESYES
(5)
31
Table 7: Regression Analysis on the Effect of Minority Shareholder and Creditor Protection
Dependent variable =
-0.041 *** -1.156 *** -0.009 *** -0.040 *** -1.134 *** -0.010 ***(0.006) (0.190) (0.002) (0.005) (0.184) (0.002)0.000 0.007 0.000
(0.004) (0.106) (0.001)-0.004 -0.048 0.001(0.003) (0.113) (0.001)
InterceptControl variablesIndustry dummy
Observations
*The figures in the parentheses of Model (1), (2), (4) and (5) are robust standard error obtained by clustering at thecompany and country level. The figures in the parentheses of Model (3) and (6) are robust standard error obtained byclustering at the country level. ***、**、* indicate statistically significant at the 1%, 5%, 10% levels of confidence.
(3) (4)
Risk (industry)
(6)
YESYESYES116110448 10020 10448 10020
Risk (industry)
YESYESYES1161
EBITDA /Assets
Tobin's q EBITDA /Assets
Tobin's q
(1) (2)
Japan (dummy)
Revised ADRI
Creditor rights index
YES YES YES YESYES YES YES YESYES YES YES YES
(5)
32
Table 8: Effect of Employment System
Dependent variable =
-0.053 *** -1.610 *** -0.013 *** -0.033 *** -0.837 *** -0.009 ***(0.006) (0.186) (0.001) (0.005) (0.124) (0.001)-0.045 *** -1.780 *** -0.013 ***(0.016) (0.376) (0.004)
0.008 *** 0.317 *** 0.003 ***(0.003) (0.073) (0.001)
InterceptControl variablesIndustry dummy
Observations 1161
The figures in the Parentheses of Model (1), (2), (4) and (5) are robust standard error obtained by clustering at the firm andcountry level. The figures in the parentheses of Model (3) and (6) are robust standard error obtained by clustering at countrylevel. ***,**,* indicate statistically significant at the 1%,5%,10% levels of confidence.
10448 10020YES YES YES
10448 10020 1161
YESYES YES YES
YES YESYES
YES YES YESYES YES
Hiring and firing practices
YES YES YES
(6)
Japan (dummy)
Employment laws index
(4) (5)(1) (2) (3)
EBITDA /Assets
Tobin's q Risk (industry)EBITDA /
AssetsTobin's q Risk (industry)
33
Table 9: Minority Shareholder Protection and Employment System
Dependent var i abl e =
-0. 029 *** -0. 679 *** -0. 013 ***(0. 006) ( 0. 127) ( 0. 003)
0. 015 * 0. 703 ** -0. 008 *(0. 009) ( 0. 301) ( 0. 005)0. 008 ** 0. 266 *** 0. 003 ***
(0. 003) ( 0. 071) ( 0. 001)
I nt er ceptCont r ol var i abl esI ndust r y dummy
Observat i ons
***,**,* indicate statistically significant at the 1%,5%,10% levels of confidence.
*The figures in the parenthes are robust standard error obtained by clusteringat the company and country level.
EBI TDA /Assets
Tobi n' s qRi sk
( i ndust r y)( 3)
Japan ( dummy)
Outsi de di r ector r at i o
( 1) ( 2)
YES YESYES YES
Hi r i ng and f i r i ngpr act i ces
YES
10689269 8966
YESYES YES YES
34
Table 10 Propensity Score Matching Test
-0. 038 *** -0. 032 *** -0. 024 *** 0. 006 *** 0. 008 *** 0. 014 ***(0. 002) ( 0. 002) ( 0. 003) ( 0. 002) ( 0. 001) ( 0. 001)-1. 272 *** -0. 959 *** -0. 793 *** 0. 310 *** 0. 167 *** 0. 477 ***(0. 051) ( 0. 054) ( 0. 063) ( 0. 043) ( 0. 032) ( 0. 042)-9. 486 *** -7. 755 *** -7. 239 *** 1. 710 *** 0. 524 * 2. 251 ***(0. 445) ( 0. 497) ( 0. 615) ( 0. 379) ( 0. 317) ( 0. 365)-0. 012 *** -0. 007 *** -0. 011 *** 0. 005 *** -0. 004 *** 0. 002(0. 002) ( 0. 002) ( 0. 003) ( 0. 001) ( 0. 001) ( 0. 001)
Exact matchi ngYear YES YES YESI ndust r y YES YES YES
Var i abl es for cal cul at i ng t hepr opensi t y scor e
Ln ( sal es) YES YES YESDebt r at i o NO YES YESLn ( f i rm age) NO YES YESPer capi t a GDP NO YES YESGDP growth NO YES YESOutsi de di r ector r at i o NO NO YESHi r i ng and f i r i ng pr act i ces NO NO YES
***,**,* indicate statistically significant at the 1%,5%,10% levels of confidence.
EBI TDA / Assets
Tobi n' s q
ROE
Ri sk ( i ndust r y)
( 1) ( 2) ( 3) ( 2) -( 1) ( 3) -( 2) ( 3) -( 1)