Embed Size (px)
Citation preview

Nano
ma
Core-Shell Nanostructures: Modeling, Fabrication, Properties, and Applications
Guest Editors: Weihong Qi, Linbao Luo, Hai-Sheng Qian, Gang Ouyang, Karuna Kar Nanda, and Sherine O. Obare
Journal of Nanomaterials

Core-Shell Nanostructures: Modeling,Fabrication, Properties, and Applications
Journal of Nanomaterials
Core-Shell Nanostructures: Modeling,Fabrication, Properties, and Applications
Guest Editors: Weihong Qi, Linbao Luo, Hai-Sheng Qian,Gang Ouyang, Karuna Kar Nanda, and Sherine O. Obare

Copyright © 2012 Hindawi Publishing Corporation. All rights reserved.
This is a special issue published in “Journal of Nanomaterials.” All articles are open access articles distributed under the Creative Com-mons Attribution License, which permits unrestricted use, distribution, and reproduction in any medium, provided the original workis properly cited.

Editorial Board
Katerina Aifantis, GreeceNageh K. Allam, USAMargarida Amaral, PortugalXuedong Bai, ChinaL. Balan, FranceEnrico Bergamaschi, ItalyTheodorian Borca-Tasciuc, USAC. Jeffrey Brinker, USAChristian Brosseau, FranceXuebo Cao, ChinaShafiul Chowdhury, USAKwang-Leong Choy, UKCui ChunXiang, ChinaMiguel A. Correa-Duarte, SpainShadi A. Dayeh, USAAli Eftekhari, USAClaude Estournes, FranceAlan Fuchs, USALian Gao, ChinaRussell E. Gorga, USAHongchen Chen Gu, ChinaMustafa O. Guler, TurkeyJohn Zhanhu Guo, USASmrati Gupta, GermanyMichael Harris, USAZhongkui Hong, USAMichael Z. Hu, USADavid Hui, USAY.-K. Jeong, Republic of KoreaSheng-Rui Jian, TaiwanWanqin Jin, ChinaRakesh K. Joshi, IndiaZhenhui Kang, China
Fathallah Karimzadeh, IranDo Kyung Kim, Republic of KoreaKin Tak Lau, AustraliaBurtrand Lee, USABenxia Li, ChinaJun Li, SingaporeShijun Liao, ChinaGong Ru Lin, TaiwanJ.-Y. Liu, USAJun Liu, USATianxi Liu, ChinaSongwei Lu, USADaniel Lu, ChinaJue Lu, USAEd Ma, USAGaurav Mago, USASantanu K. Maiti, IsraelSanjay R. Mathur, GermanyA. McCormick, USAVikas Mittal, UAEWeihai Ni, GermanySherine Obare, USAEdward Andrew Payzant, USAKui-Qing Peng, ChinaAnukorn Phuruangrat, ThailandUgur Serincan, TurkeyHuaiyu Shao, JapanDonglu Shi, USASuprakas Sinha Ray, South AfricaVladimir Sivakov, GermanyMarinella Striccoli, ItalyBohua Sun, South AfricaSaikat Talapatra, USA
Nairong Tao, ChinaTitipun Thongtem, ThailandSomchai Thongtem, ThailandValeri P. Tolstoy, RussiaTsung-Yen Tsai, TaiwanTakuya Tsuzuki, AustraliaRaquel Verdejo, SpainMat U. Wahit, MalaysiaShiren Wang, USAYong Wang, USARuibing Wang, CanadaCheng Wang, ChinaZhenbo Wang, ChinaJinquan Wei, ChinaChing Ping Wong, USAXingcai Wu, ChinaGuodong Xia, Hong KongZhi Li Xiao, USAPing Xiao, UKShuangxi Xing, ChinaYangchuan Xing, USAN. Xu, ChinaDoron Yadlovker, IsraelYing-Kui Yang, ChinaKhaled Youssef, USAKui Yu, CanadaWilliam W. Yu, USAHaibo Zeng, ChinaTianyou Zhai, JapanRenyun Zhang, SwedenYanbao Zhao, ChinaLianxi Zheng, SingaporeChunyi Zhi, Japan

Contents
Core-Shell Nanostructures: Modeling, Fabrication, Properties, and Applications, Weihong Qi,Linbao Luo, Hai-Sheng Qian, Gang Ouyang, Karuna Kar Nanda, and Sherine O. ObareVolume 2012, Article ID 526923, 2 pages
Preparation, Properties, and Self-Assembly Behavior of PTFE-Based Core-Shell Nanospheres,Katia Sparnacci, Diego Antonioli, Simone Deregibus, Michele Laus, Giampaolo Zuccheri, Luca Boarino,Natascia De Leo, and Davide ComorettoVolume 2012, Article ID 980541, 15 pages
Preparation of a Novel Nanocomposite of Polyaniline Core Decorated with Anatase-TiO2 Nanoparticlesin Ionic Liquid/Water Microemulsion, Yanni Guo, Deliang He, Sanbao Xia, Xin Xie, Xiang Gao,and Quan ZhangVolume 2012, Article ID 202794, 7 pages
Core-Shell Structure of a Silicon Nanorod/Carbon Nanotube Field Emission Cathode, Bohr-Ran Huang,Ying-Kan Yang, Tzu-Ching Lin, and Wen-Luh YangVolume 2012, Article ID 369763, 6 pages
Freestanding Ge/GeO2 Core-Shell Nanocrystals with Varying Sizes and Shell Thicknesses:Microstructure and Photoluminescence Studies, P. K. Giri and Soumen DharaVolume 2012, Article ID 905178, 5 pages
Synchrotron X-Ray Absorption Spectroscopy Study of Self-Assembled Nanoparticles Synthesized fromFe(acac)3 and Pt(acac)2, K. Chokprasombat, C. Sirisathitkul, P. Harding, S. Chandarak, and R. YimnirunVolume 2012, Article ID 758429, 4 pages
In Situ Synthesis of Poly(methyl methacrylate)/SiO2 Hybrid Nanocomposites via “Grafting Onto”Strategy Based on UV Irradiation in the Presence of Iron Aqueous Solution, Hong Zhang, Chao Li,Jinshan Guo, Limin Zang, and Jiahe LuoVolume 2012, Article ID 217412, 9 pages
Reinforcement of Natural Rubber with Core-Shell Structure Silica-Poly(Methyl Methacrylate)Nanoparticles, Qinghuang Wang, Yongyue Luo, Chunfang Feng, Zhifeng Yi, Quanfang Qiu, L. X. Kong,and Zheng PengVolume 2012, Article ID 782986, 9 pages
Improvement in Comprehensive Properties of Poly(Methyl Methacrylate)-Based Gel Polymer Electrolyteby a Core-Shell Poly(Methyl Methacrylate)-Grafted Ordered Mesoporous Silica, Lixin Xu, Feng Xu,Feng Chen, Jintao Yang, and Mingqiang ZhongVolume 2012, Article ID 457967, 10 pages
Comparative Study of the Photocatalytic Activity of Semiconductor Nanostructures and Their HybridMetal Nanocomposites on the Photodegradation of Malathion,Dina Mamdouh Fouad and Mona Bakr MohamedVolume 2012, Article ID 524123, 8 pages
Hindawi Publishing CorporationJournal of NanomaterialsVolume 2012, Article ID 526923, 2 pagesdoi:10.1155/2012/526923
Editorial
Core-Shell Nanostructures: Modeling, Fabrication,Properties, and Applications
Weihong Qi,1 Linbao Luo,2 Hai-Sheng Qian,3 Gang Ouyang,4
Karuna Kar Nanda,5 and Sherine O. Obare6
1 School of Materials Science and Engineering, Central South University, Changsha, Hunan 410083, China2 School of Electronic Science and Applied Physics, Hefei University of Technology, Hefei, Anhui 230009, China3 College of Chemistry and Life Sciences, Zhejiang Normal University, Jinhua, Zhejiang 321004, China4 Key Laboratory of Low-Dimensional Quantum Structures and Quantum Control of the Ministry of Education, Department of Physics,Hunan Normal University, Hunan Changsha 410081, China
5 Materials Research Centre, Indian Institute of Science, Bangalore 560012, India6 Department of Chemistry, Western Michigan University, Kalamazoo, MI 49008, USA
Correspondence should be addressed to Weihong Qi, [email protected]
Received 4 December 2011; Accepted 4 December 2011
Copyright © 2012 Weihong Qi et al. This is an open access article distributed under the Creative Commons Attribution License,which permits unrestricted use, distribution, and reproduction in any medium, provided the original work is properly cited.
Core-shell nanostructures, a family of nanomaterials, haveattracted increasing research interest due to their uniquestructural features that consist of an inner core and an exter-nal shell of different chemical compositions. These structuralfeatures allow the possibility of combining distinctive prop-erties of varied materials. Comparatively, core-shell nanos-tructures have exhibited improved physical and chemicalproperties relative to their single-component counterparts.The inherent emergent chemical and physical properties ofcore-shell nanostructures are of great importance to a poten-tially broader range of applications including electronics,magnetism, optics, and catalysis. So far a large number ofcore-shell nanostructures have been successfully fabricatedusing approaches ranging from laser ablation and high-temperature evaporation to carbothermal reduction andhydrothermal methods. Structural characterization of thesenanostructures and determination of their unique propertiesfor various applications have been well documented. Thisspecial issue is devoted to describing a number of uniqueproperties and applications of core-shell nanostructures byintroducing a few research papers in this field.
The paper describes a simple emulsifier-free seedemulsion polymerization technique for the synthesis ofperfluoropolyether-based core-shell nanoparticles. The shellconsists of relatively high Tg polystyrene and polymethyl-methacrylate that have a high glass transition temperature(Tg) as well as polyacrylic copolymers that have a low Tg.
The paper deals with the fabrication of polyaniline- (PANI-)TiO2 core-shell nanostructures that were prepared via a novelionic liquid/water microemulsion method in the presence ofanatase TiO2 nanoparticles. The paper reports the prepa-ration of poly (methyl methacrylate)/SiO2 (PMMA/SiO2)hybrid composites using a “grafting onto” strategy, withassistance of UV light irradiation in an iron aqueoussolution. The functionalization of PMMA was achieved byanchoring 3-(methacryloxy) propyl trimethoxysilane ontothe nanosilica surface, followed by grafting PMMA onto thenanosilica layer with FeCl3 as a photoinitiator. The paperpresents a synthesis procedure of free standing Ge/GeO2
core-shell nanocrystals with tunable sizes and shell thickness.High-resolution transmission electron microscope imagesreveal the presence of strain in the nanocrystals and latticedistortion/dislocations in the Ge core near the interface ofGe core and GeO2 shell.
The paper of this special issue presents the preparation ofsilica-poly (methyl methacrylate) nanoparticles. Comparedwith pure natural rubber, the thermal resistance and tensileproperties of such nanostructures are significantly improved.The paper is on the synchrotron X-ray absorption analysisof Fe2O3-Pt core-shell nanoparticles, obtained from thecoreduction of iron acetylacetonate and platinum acetylacet-onate. The paper reports the synthesis of a core-shell PMMA-grafted-ordered mesoporous silica by surface-initiated atomtransfer radical polymerization of methyl methacrylate from
2 Journal of Nanomaterials
the exterior surface of ordered mesoporous silica particle. Itwas found that the as-prepared OMS(ordered mesoporoussilica)-g-PMMA exhibited improved properties includingionic conductivity, thermal stability, and mechanical prop-erties.
The papersexplore the potential application of core-shell nanostructures. paper proposes a new solution-basedmethod for the synthesis of metal-hybrid nanocompos-ites including TiO2, Au/TiO2, ZnO, and Au/ZnO. Thesesemiconductor-metal hybrid composites serve as a bettercatalytic system for photodegradation of malathion, oneof the most commonly used pesticides in developingcountries. paper reports on silicon nanorods/carbon nan-otubes (SiNRs/CNTs) for field emission cathodes. Thesenovel nanostructures demonstrated improved field emissionproperties including a lower turn-on electric field, a lowerthreshold electric field, and a higher enhancement factor ß,suggesting that such core-shell structures have good potentialfor field emission applications.
Weihong QiLinbao Luo
Hai-Sheng QianGang Ouyang
Karuna Kar NandaSherine O. Obare
Hindawi Publishing CorporationJournal of NanomaterialsVolume 2012, Article ID 980541, 15 pagesdoi:10.1155/2012/980541
Research Article
Preparation, Properties, and Self-Assembly Behavior ofPTFE-Based Core-Shell Nanospheres
Katia Sparnacci,1 Diego Antonioli,1 Simone Deregibus,1 Michele Laus,1
Giampaolo Zuccheri,2 Luca Boarino,3 Natascia De Leo,3 and Davide Comoretto4
1 Dipartimento di Scienze dell’ Ambiente e della Vita, Universita del Piemonte Orientale “A. Avogadro”, INSTM,UdR Alessandria, Via G. Bellini 25 g, 15100 Alessandria, Italy
2 Dipartimento di Biochimica “G. Moruzzi”, Universita di Bologna, INSTM, CNRNANO-S3, Via Irnerio 48, 40126 Bologna, Italy3 NanoFacility Piemonte, Electromagnetism Division, Istituto Nazionale di Ricerca MetrologicaStrada delle Cacce 91, 10135 Torino, Italy
4 Dipartimento di Chimica e Chimica Industriale, Universita degli Studi di Genova, Via Dodecaneso 31, 16146 Genova, Italy
Correspondence should be addressed to Michele Laus, [email protected]
Received 2 August 2011; Revised 17 October 2011; Accepted 24 October 2011
Academic Editor: Hai-Sheng Qian
Copyright © 2012 Katia Sparnacci et al. This is an open access article distributed under the Creative Commons AttributionLicense, which permits unrestricted use, distribution, and reproduction in any medium, provided the original work is properlycited.
Nanosized PTFE-based core-shell particles can be prepared by emulsifier-free seed emulsion polymerization technique startingfrom spherical or rod-like PTFE seeds of different size. The shell can be constituted by the relatively high Tg polystyrene andpolymethylmethacrylate as well as by low Tg polyacrylic copolymers. Peculiar thermal behavior of the PTFE component is observeddue to the high degree of PTFE compartmentalization. A very precise control over the particle size can be exerted by properlyadjusting the ratio between the monomers and the PTFE seed. In addition, the particle size distribution self-sharpens as the ratiomonomer/PTFE increases. Samples with uniformity ratios suited to build 2D and 3D colloidal crystals are easily prepared. Inparticular, 2D colloidal crystal of spheres leads to very small 2D nanostructuration, useful for the preparation of masks with acombination of nanosphere lithography and reactive ion etching. 3D colloidal crystals were also obtained featuring excellent opalquality, which is a direct consequence of the monodispersity of colloids used for their growth.
1. Introduction
A milestone in the tetrafluoroethylene (TFE) polymerizationis represented by the development of the homo- andcopolymerization microemulsion technology, on industrialscale, based on the use of perfluoropolyethers (PFPE)in oil/water microemulsion. A great deal of interest wasfocused on the resulting polytetrafluoroethylene (PTFE)nano- and microparticle latexes [1, 2]. PTFE aqueousdispersions featuring particle size as small as 10 nm can beproduced, with particle concentration number as high as1018–1019(particles/liter). Moreover, by varying the amountand structure of PFPE as well as the quantity and nature ofthe comonomers, PTFE nanoparticles can be designed withhighly differentiated architectures, including size, shape, andchemical composition.
Many interesting applications were disclosed for thesePTFE nanoparticles including components in PTFE bimodalmixtures, ultralow-K dielectric materials, nanofillers for flu-oroelastomers and fire-retardant additives with the reportedpurpose to inhibiting the dripping of molten particles fromthe burning polymer [3–6].
However, the compatibility and adhesion characteristicsof PTFE and the various polymeric matrices are inadequatethus resulting in low dispersion degrees within the matrixand poor mechanical coupling among the various blendcomponents. Moreover, the resulting compositions exhibita pearl scent opaque appearance that prevents their use inapplications where transparency is required. Finally, the poordispersion of PTFE material adversely affects the efficiency inreducing the heat release.
2 Journal of Nanomaterials
To enhance wettability and compatibility, several PTFEsurface modification strategies were developed based oneither high power chemical and reactive processing proce-dures [7, 8] or high energy treatments [9, 10]. Reactiveextrusion of electron-beam irradiated PTFE and polyamideswas demonstrated [11–13] to be effective in the preparationof well-dispersed compounds due to the occurrence oftransamidation reactions accompanied by the breakdown ofthe PTFE agglomerates. However, consistent degradation ofthe basic PTFE structure upon irradiation is unavoidable.
An alternative and promising nondestructive approachto produce compounds with a perfect dispersion of PTFEparticles is based on the preparation of core-shell particlesin which the core is constituted by PTFE and the shellby a conventional polymer. In the early studies, severalcomposite particles consisting of PTFE core and crosslinkedpolybutadiene shell were described by Okaniwa [14] whereasthe preparation of one sample only of core-shell particlesin which the core is made up of PTFE and the shell ofcrosslinked PS was reported by Othegraven [15]. Morerecently, extensive studies were reported for core-shellnanoparticle systems composed of PTFE core and polyacrylicshell [16, 17] with various compositions.
Two-stage seeded emulsion polymerization is the generalmethod [18, 19] to prepare latex particles featuring a core-shell morphology. The first stage, the core preparation, canbe carried out either separately or in situ and the polymeriza-tion process of the second stage is a seeded process in whichthe second monomer is added continuously or batchwise tothe reaction vessel. In most cases, some miscibility betweenthe core polymer and the shell-forming monomer produces apartial swelling thus ultimately leading to an intermixing dif-fuse region. However, in the present case, the shell-formingmonomer is always insoluble in the PTFE and the polymer-ization occurs exclusively in the shell region of the latex.
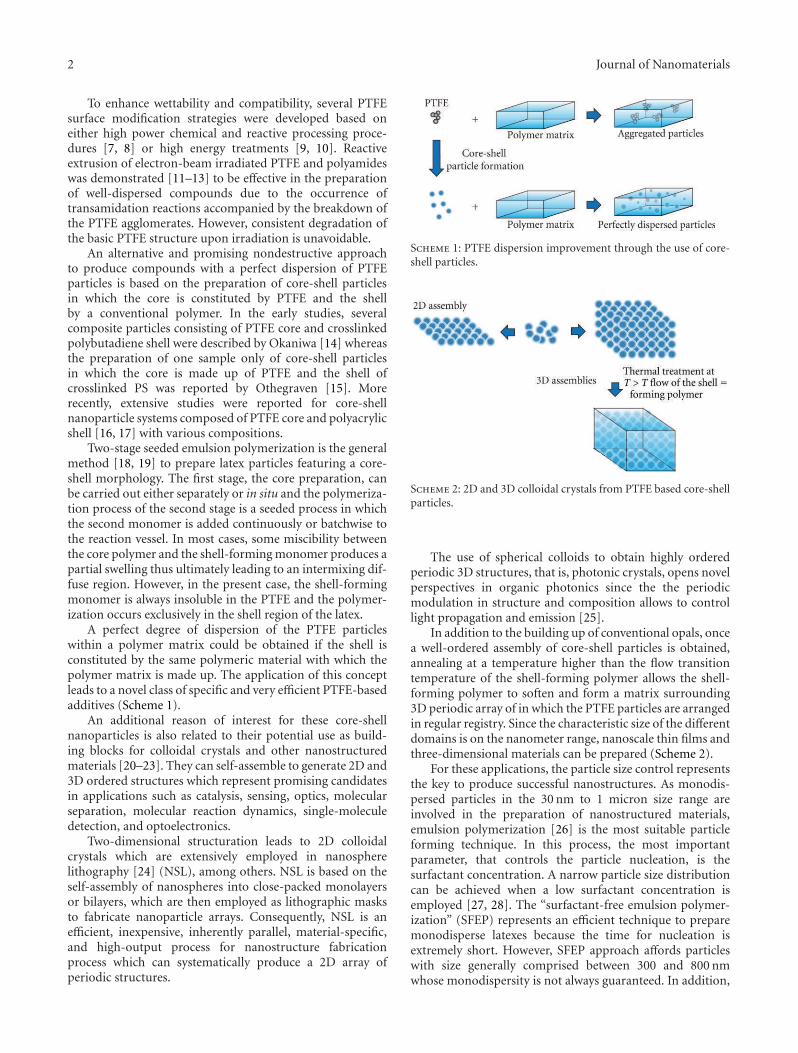
A perfect degree of dispersion of the PTFE particleswithin a polymer matrix could be obtained if the shell isconstituted by the same polymeric material with which thepolymer matrix is made up. The application of this conceptleads to a novel class of specific and very efficient PTFE-basedadditives (Scheme 1).
An additional reason of interest for these core-shellnanoparticles is also related to their potential use as build-ing blocks for colloidal crystals and other nanostructuredmaterials [20–23]. They can self-assemble to generate 2D and3D ordered structures which represent promising candidatesin applications such as catalysis, sensing, optics, molecularseparation, molecular reaction dynamics, single-moleculedetection, and optoelectronics.
Two-dimensional structuration leads to 2D colloidalcrystals which are extensively employed in nanospherelithography [24] (NSL), among others. NSL is based on theself-assembly of nanospheres into close-packed monolayersor bilayers, which are then employed as lithographic masksto fabricate nanoparticle arrays. Consequently, NSL is anefficient, inexpensive, inherently parallel, material-specific,and high-output process for nanostructure fabricationprocess which can systematically produce a 2D array ofperiodic structures.
Scheme 1: PTFE dispersion improvement through the use of core-shell particles.
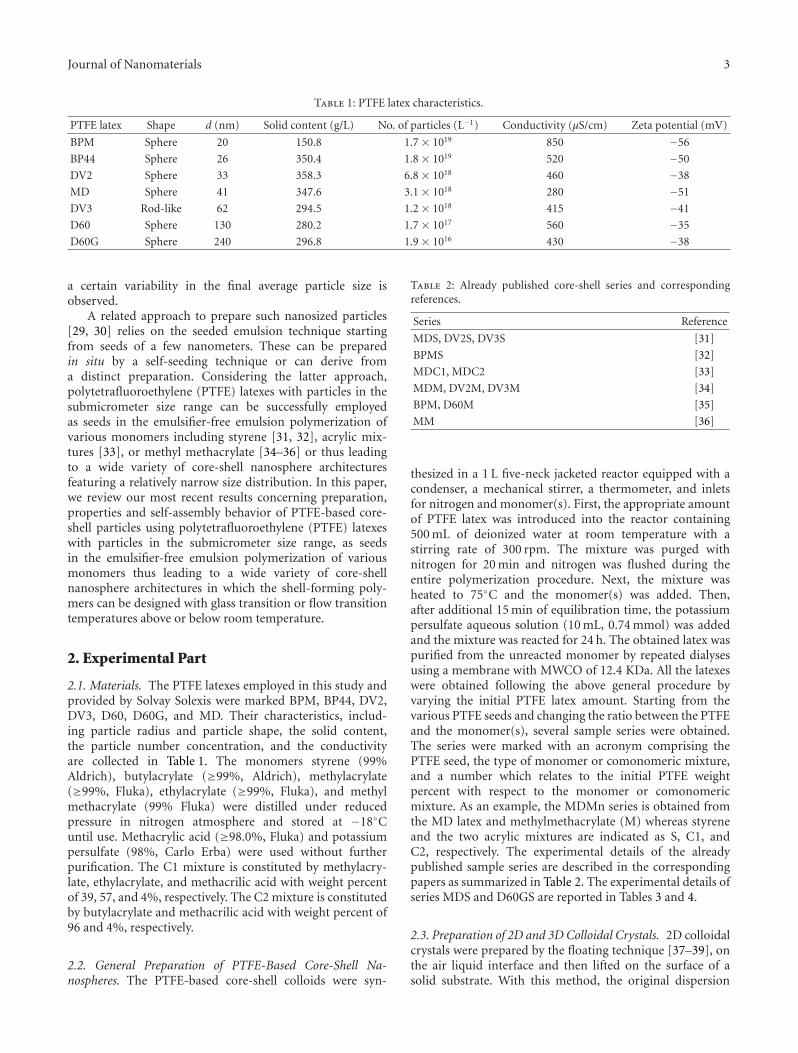
Scheme 2: 2D and 3D colloidal crystals from PTFE based core-shellparticles.
The use of spherical colloids to obtain highly orderedperiodic 3D structures, that is, photonic crystals, opens novelperspectives in organic photonics since the the periodicmodulation in structure and composition allows to controllight propagation and emission [25].
In addition to the building up of conventional opals, oncea well-ordered assembly of core-shell particles is obtained,annealing at a temperature higher than the flow transitiontemperature of the shell-forming polymer allows the shell-forming polymer to soften and form a matrix surrounding3D periodic array of in which the PTFE particles are arrangedin regular registry. Since the characteristic size of the differentdomains is on the nanometer range, nanoscale thin films andthree-dimensional materials can be prepared (Scheme 2).
For these applications, the particle size control representsthe key to produce successful nanostructures. As monodis-persed particles in the 30 nm to 1 micron size range areinvolved in the preparation of nanostructured materials,emulsion polymerization [26] is the most suitable particleforming technique. In this process, the most importantparameter, that controls the particle nucleation, is thesurfactant concentration. A narrow particle size distributioncan be achieved when a low surfactant concentration isemployed [27, 28]. The “surfactant-free emulsion polymer-ization” (SFEP) represents an efficient technique to preparemonodisperse latexes because the time for nucleation isextremely short. However, SFEP approach affords particleswith size generally comprised between 300 and 800 nmwhose monodispersity is not always guaranteed. In addition,
Journal of Nanomaterials 3
Table 1: PTFE latex characteristics.
PTFE latex Shape d (nm) Solid content (g/L) No. of particles (L−1) Conductivity (μS/cm) Zeta potential (mV)
BPM Sphere 20 150.8 1.7 × 10¹⁹ 850 −56
BP44 Sphere 26 350.4 1.8 × 10¹⁹ 520 −50
DV2 Sphere 33 358.3 6.8 × 10¹⁸ 460 −38
MD Sphere 41 347.6 3.1 × 10¹⁸ 280 −51
DV3 Rod-like 62 294.5 1.2 × 10¹⁸ 415 −41
D60 Sphere 130 280.2 1.7 × 10¹⁷ 560 −35
D60G Sphere 240 296.8 1.9 × 10¹⁶ 430 −38
a certain variability in the final average particle size isobserved.
A related approach to prepare such nanosized particles[29, 30] relies on the seeded emulsion technique startingfrom seeds of a few nanometers. These can be preparedin situ by a self-seeding technique or can derive froma distinct preparation. Considering the latter approach,polytetrafluoroethylene (PTFE) latexes with particles in thesubmicrometer size range can be successfully employedas seeds in the emulsifier-free emulsion polymerization ofvarious monomers including styrene [31, 32], acrylic mix-tures [33], or methyl methacrylate [34–36] or thus leadingto a wide variety of core-shell nanosphere architecturesfeaturing a relatively narrow size distribution. In this paper,we review our most recent results concerning preparation,properties and self-assembly behavior of PTFE-based core-shell particles using polytetrafluoroethylene (PTFE) latexeswith particles in the submicrometer size range, as seedsin the emulsifier-free emulsion polymerization of variousmonomers thus leading to a wide variety of core-shellnanosphere architectures in which the shell-forming poly-mers can be designed with glass transition or flow transitiontemperatures above or below room temperature.
2. Experimental Part
2.1. Materials. The PTFE latexes employed in this study andprovided by Solvay Solexis were marked BPM, BP44, DV2,DV3, D60, D60G, and MD. Their characteristics, includ-ing particle radius and particle shape, the solid content,the particle number concentration, and the conductivityare collected in Table 1. The monomers styrene (99%Aldrich), butylacrylate (≥99%, Aldrich), methylacrylate(≥99%, Fluka), ethylacrylate (≥99%, Fluka), and methylmethacrylate (99% Fluka) were distilled under reducedpressure in nitrogen atmosphere and stored at −18◦Cuntil use. Methacrylic acid (≥98.0%, Fluka) and potassiumpersulfate (98%, Carlo Erba) were used without furtherpurification. The C1 mixture is constituted by methylacry-late, ethylacrylate, and methacrilic acid with weight percentof 39, 57, and 4%, respectively. The C2 mixture is constitutedby butylacrylate and methacrilic acid with weight percent of96 and 4%, respectively.
2.2. General Preparation of PTFE-Based Core-Shell Na-nospheres. The PTFE-based core-shell colloids were syn-
Table 2: Already published core-shell series and correspondingreferences.
Series Reference
MDS, DV2S, DV3S [31]
BPMS [32]
MDC1, MDC2 [33]
MDM, DV2M, DV3M [34]
BPM, D60M [35]
MM [36]
thesized in a 1 L five-neck jacketed reactor equipped with acondenser, a mechanical stirrer, a thermometer, and inletsfor nitrogen and monomer(s). First, the appropriate amountof PTFE latex was introduced into the reactor containing500 mL of deionized water at room temperature with astirring rate of 300 rpm. The mixture was purged withnitrogen for 20 min and nitrogen was flushed during theentire polymerization procedure. Next, the mixture washeated to 75◦C and the monomer(s) was added. Then,after additional 15 min of equilibration time, the potassiumpersulfate aqueous solution (10 mL, 0.74 mmol) was addedand the mixture was reacted for 24 h. The obtained latex waspurified from the unreacted monomer by repeated dialysesusing a membrane with MWCO of 12.4 KDa. All the latexeswere obtained following the above general procedure byvarying the initial PTFE latex amount. Starting from thevarious PTFE seeds and changing the ratio between the PTFEand the monomer(s), several sample series were obtained.The series were marked with an acronym comprising thePTFE seed, the type of monomer or comonomeric mixture,and a number which relates to the initial PTFE weightpercent with respect to the monomer or comonomericmixture. As an example, the MDMn series is obtained fromthe MD latex and methylmethacrylate (M) whereas styreneand the two acrylic mixtures are indicated as S, C1, andC2, respectively. The experimental details of the alreadypublished sample series are described in the correspondingpapers as summarized in Table 2. The experimental details ofseries MDS and D60GS are reported in Tables 3 and 4.
2.3. Preparation of 2D and 3D Colloidal Crystals. 2D colloidalcrystals were prepared by the floating technique [37–39], onthe air liquid interface and then lifted on the surface of asolid substrate. With this method, the original dispersion
4 Journal of Nanomaterials
Table 3: Synthesis details, yield, and solid content of the various samples.
Sample Volume of water (mL) Volume of Styrene (mL) Volume of PTFE latex (mL) Yield (%) Solid content (g/mL)
MDS1 500.0 70.0 0.46 89.6 0.1078
MDS2 500.0 70.0 0.92 98.4 0.1104
MDS3 500.0 70.0 1.85 100.0 0.1140
MDS4 500.0 70.0 5.67 100.0 0.1210
MDS5∗ 500.0 70.0 10.00 76.4 0.1121
MDS6 500.0 70.0 18.10 100.0 0.1241
MDS7∗ 500.0 70.0 19.90 77.0 0.1128
MDS8∗ 500.0 70.0 39.90 83.0 0.0650
MDS9∗ 500.0 70.0 59.40 81.7 0.1247
D60GS1 500.0 70.0 30.65 85.3 0.1106
D60GS2 500.0 70.0 50.30 83.6 0.1087∗
Published in [31].
Table 4: Sample composition derived from TGA and DSC, glass transition temperature, diameter estimated, PCS Size, SEM size, anduniformity ratio of the various samples.
Sample % PTFE Theorical (W/W) % PTFE (TGA) % PTFE (DSC) d estimated (nm) d PCS (nm) d SEM (nm) Uniformity Ratio U
MDS1 0.25 0.21 0.11 383 417 380 1.003
MDS2 0.50 0.47 0.33 304 309 301 1.004
MDS3 1.00 0.85 0.67 241 245 237 1.005
MDS4 3.00 2.91 2.08 167 166 163 1.007
MDS5∗ 5.20 5.20 4.30 138 139 133 1.012
MDS6 9.00 8.70 7.67 114 115 111 1.028
MDS7∗ 9.80 6.70 7.9 111 113 107 1.030
MDS8∗ 17.90 19.4 16.8 89 92 84 1.050
MDS9∗ 24.50 22.7 22.7 80 89 75 1.100
D60GS1 12.5 12.0 12.4 596 604 593 1.004
D60GS2 19.0 18.0 19.3 511 525 500 1.004∗
Published in [31].
(eventually diluted to reach typical concentrations rangingfrom 5 to 10% in water) is mixed with ethanol (1 : 1 V/V).This gives an accurate control of the floating level of themonolayers on the water surface thus allowing the formationof large 2D crystals screening the surface charge on the sphereby water molecules. The final addition of a surfactant inthe water further compacts the 2D crystalline islands. Inthis phase, parameters like sphere surface charge, ethanolcontent, and dispersion method are rather critical in theformation of large crystal assemblies. Silicon substrates havebeen used to lift the floating crystals.
3D colloidal crystals were grown by using the verticaldeposition technique [40] starting from core-shell latexesproperly diluted with deionized water. Growth occurredon glass substrates at 45 ± 1◦C inside a BF53 Binderincubator. Opals were composed of flat domains with the[111] direction of the face-centered cubic lattice of spheresperpendicular to the substrate. In the best samples, domainsizes are 50–100 microns. However, defects inside thesedomains, in particular stacking faults, cannot be excluded.Opals are marked with the prefix O before the name of thesample employed to build up the corresponding opal.
2.4. Characterization. Scanning electron microscope (SEM)analysis was performed using an Inspect F SEM-FEG (FieldEmission Gun) from FEI company, with a beam diameter of3 nm. The SEM micrographs were elaborated by the ScionImage processing program. Photon correlation spectroscopy(PCS) analysis at 25◦C was performed with a MalvernZetasizer 3000 HS at a fixed scattering angle of 90◦, using a10 mV He-Ne laser and PCS software for Windows (version1.34, Malvern, UK). Each value is the average of fivemeasurements. The instrument was checked with a standardpolystyrene latex with a diameter of 200 nm. Electrophoreticmobility was measured with a Malvern Zetasizer 3000 HS.Each value is the average of five measurements.
SFM analysis was performed with Tapping-Mode AtomicForce Microscopy in air on a Multimode Nanoscope IIIainstrument (Veeco, S. Barbara, CA, USA) operated inconstant amplitude mode. A multilayer of nanoparticle isobtained by drop casting and aliquot of water suspensionon a disc of freshly cleaved muscovite mica (ElectronMicroscopy Sciences, Hatfield, PA, USA) and the solvent isallowed to slowly evaporate. Images are then subjected toflattening using the microscope constructor software.
Journal of Nanomaterials 5
500 nm 0 nm 60 nm
(a)
0 nm 40 nm1 μm
(b)
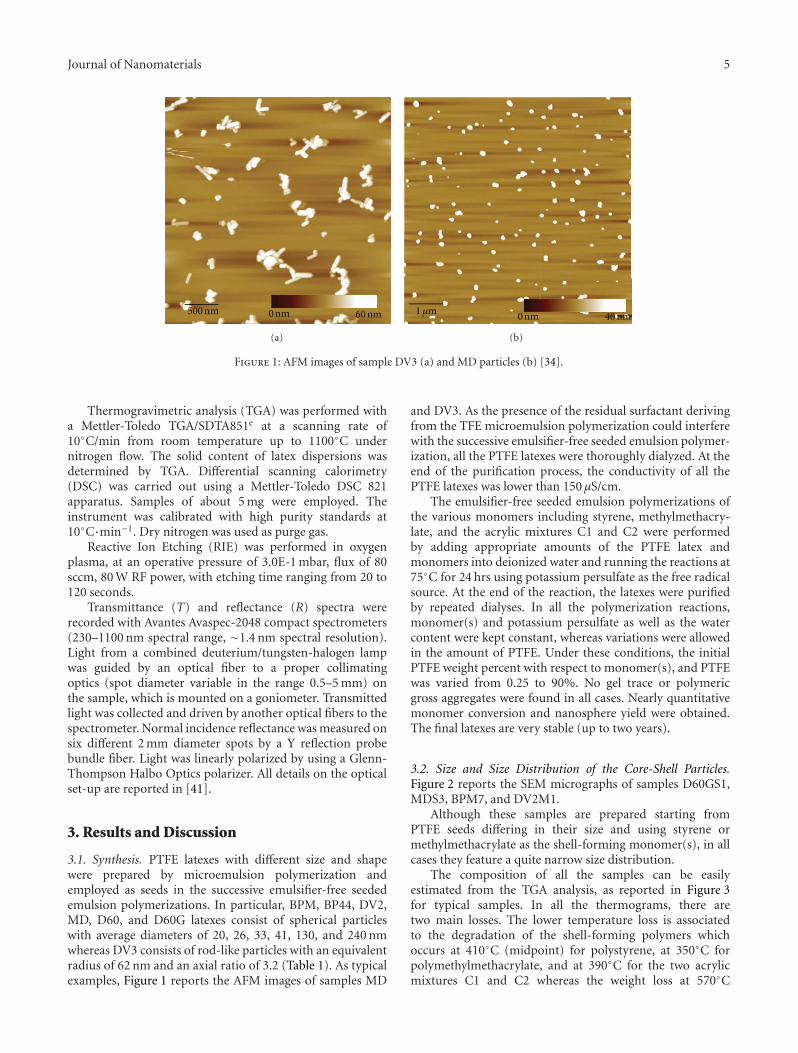
Figure 1: AFM images of sample DV3 (a) and MD particles (b) [34].
Thermogravimetric analysis (TGA) was performed witha Mettler-Toledo TGA/SDTA851e at a scanning rate of10◦C/min from room temperature up to 1100◦C undernitrogen flow. The solid content of latex dispersions wasdetermined by TGA. Differential scanning calorimetry(DSC) was carried out using a Mettler-Toledo DSC 821apparatus. Samples of about 5 mg were employed. Theinstrument was calibrated with high purity standards at10◦C·min−1. Dry nitrogen was used as purge gas.
Reactive Ion Etching (RIE) was performed in oxygenplasma, at an operative pressure of 3.0E-1 mbar, flux of 80sccm, 80 W RF power, with etching time ranging from 20 to120 seconds.
Transmittance (T) and reflectance (R) spectra wererecorded with Avantes Avaspec-2048 compact spectrometers(230–1100 nm spectral range, ∼1.4 nm spectral resolution).Light from a combined deuterium/tungsten-halogen lampwas guided by an optical fiber to a proper collimatingoptics (spot diameter variable in the range 0.5–5 mm) onthe sample, which is mounted on a goniometer. Transmittedlight was collected and driven by another optical fibers to thespectrometer. Normal incidence reflectance was measured onsix different 2 mm diameter spots by a Y reflection probebundle fiber. Light was linearly polarized by using a Glenn-Thompson Halbo Optics polarizer. All details on the opticalset-up are reported in [41].
3. Results and Discussion
3.1. Synthesis. PTFE latexes with different size and shapewere prepared by microemulsion polymerization andemployed as seeds in the successive emulsifier-free seededemulsion polymerizations. In particular, BPM, BP44, DV2,MD, D60, and D60G latexes consist of spherical particleswith average diameters of 20, 26, 33, 41, 130, and 240 nmwhereas DV3 consists of rod-like particles with an equivalentradius of 62 nm and an axial ratio of 3.2 (Table 1). As typicalexamples, Figure 1 reports the AFM images of samples MD
and DV3. As the presence of the residual surfactant derivingfrom the TFE microemulsion polymerization could interferewith the successive emulsifier-free seeded emulsion polymer-ization, all the PTFE latexes were thoroughly dialyzed. At theend of the purification process, the conductivity of all thePTFE latexes was lower than 150 μS/cm.
The emulsifier-free seeded emulsion polymerizations ofthe various monomers including styrene, methylmethacry-late, and the acrylic mixtures C1 and C2 were performedby adding appropriate amounts of the PTFE latex andmonomers into deionized water and running the reactions at75◦C for 24 hrs using potassium persulfate as the free radicalsource. At the end of the reaction, the latexes were purifiedby repeated dialyses. In all the polymerization reactions,monomer(s) and potassium persulfate as well as the watercontent were kept constant, whereas variations were allowedin the amount of PTFE. Under these conditions, the initialPTFE weight percent with respect to monomer(s), and PTFEwas varied from 0.25 to 90%. No gel trace or polymericgross aggregates were found in all cases. Nearly quantitativemonomer conversion and nanosphere yield were obtained.The final latexes are very stable (up to two years).
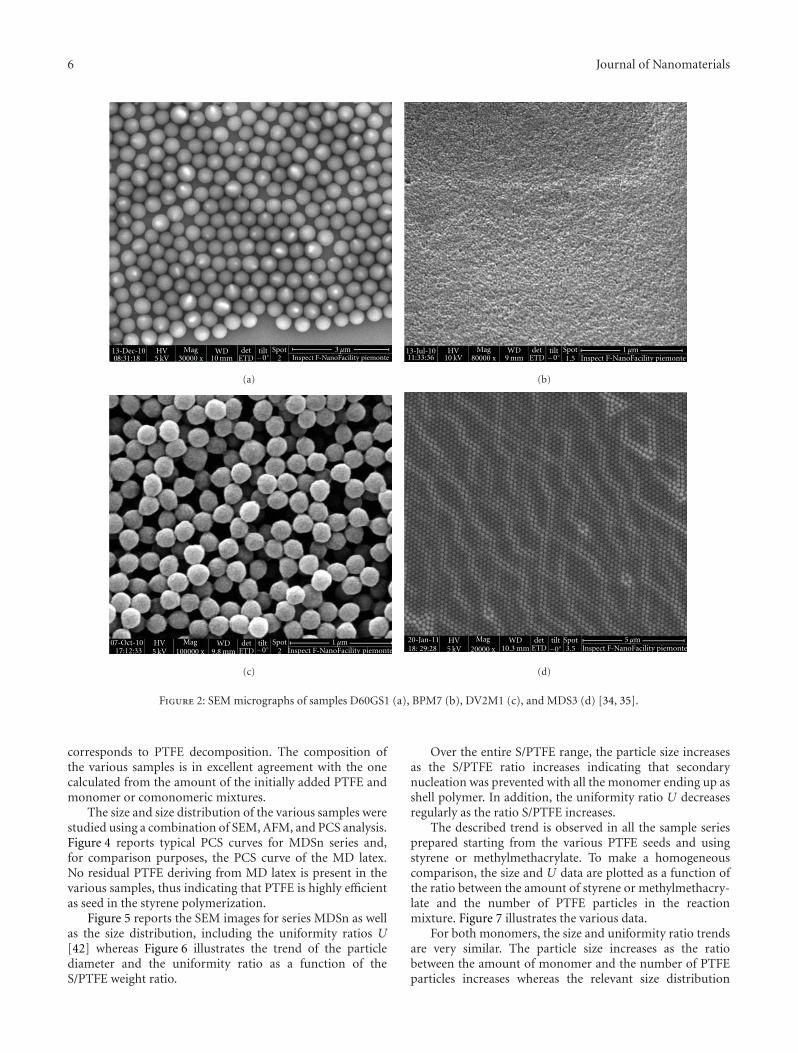
3.2. Size and Size Distribution of the Core-Shell Particles.Figure 2 reports the SEM micrographs of samples D60GS1,MDS3, BPM7, and DV2M1.
Although these samples are prepared starting fromPTFE seeds differing in their size and using styrene ormethylmethacrylate as the shell-forming monomer(s), in allcases they feature a quite narrow size distribution.
The composition of all the samples can be easilyestimated from the TGA analysis, as reported in Figure 3for typical samples. In all the thermograms, there aretwo main losses. The lower temperature loss is associatedto the degradation of the shell-forming polymers whichoccurs at 410◦C (midpoint) for polystyrene, at 350◦C forpolymethylmethacrylate, and at 390◦C for the two acrylicmixtures C1 and C2 whereas the weight loss at 570◦C
6 Journal of Nanomaterials
13-Dec-1008:31:18
HV5 kV
Mag30000 x
WD10 mm
Spot2
3 μmdetETD
tilt−0◦ Inspect F-NanoFacility piemonte
(a)
13-Jul-1011:33:36
HV10 kV
Mag80000 x
WD9 mm
Spot1.5
1 μmdetETD
tilt−0◦ Inspect F-NanoFacility piemonte
(b)
7-Oct-10017:12:33
HV5 kV
Mag100000 x
WD9.8 mm
Spot2
detETD
tilt−0◦
1 μmInspect F-NanoFacility piemonte
(c)
20-Jan-1118: 29:28
HV5 kV
Mag20000 x
WD10.3 mm
Spot3.5
5 μmdetETD Inspect F-NanoFacility piemonte
tilt−0◦
(d)
Figure 2: SEM micrographs of samples D60GS1 (a), BPM7 (b), DV2M1 (c), and MDS3 (d) [34, 35].
corresponds to PTFE decomposition. The composition ofthe various samples is in excellent agreement with the onecalculated from the amount of the initially added PTFE andmonomer or comonomeric mixtures.
The size and size distribution of the various samples werestudied using a combination of SEM, AFM, and PCS analysis.Figure 4 reports typical PCS curves for MDSn series and,for comparison purposes, the PCS curve of the MD latex.No residual PTFE deriving from MD latex is present in thevarious samples, thus indicating that PTFE is highly efficientas seed in the styrene polymerization.
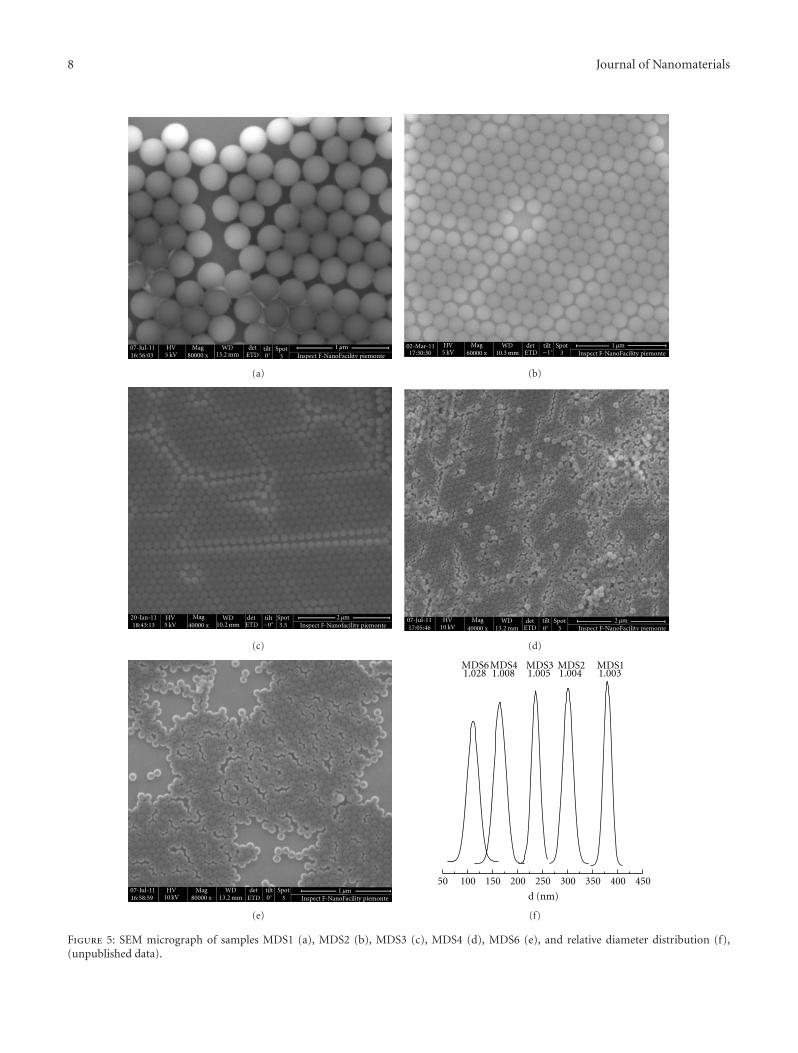
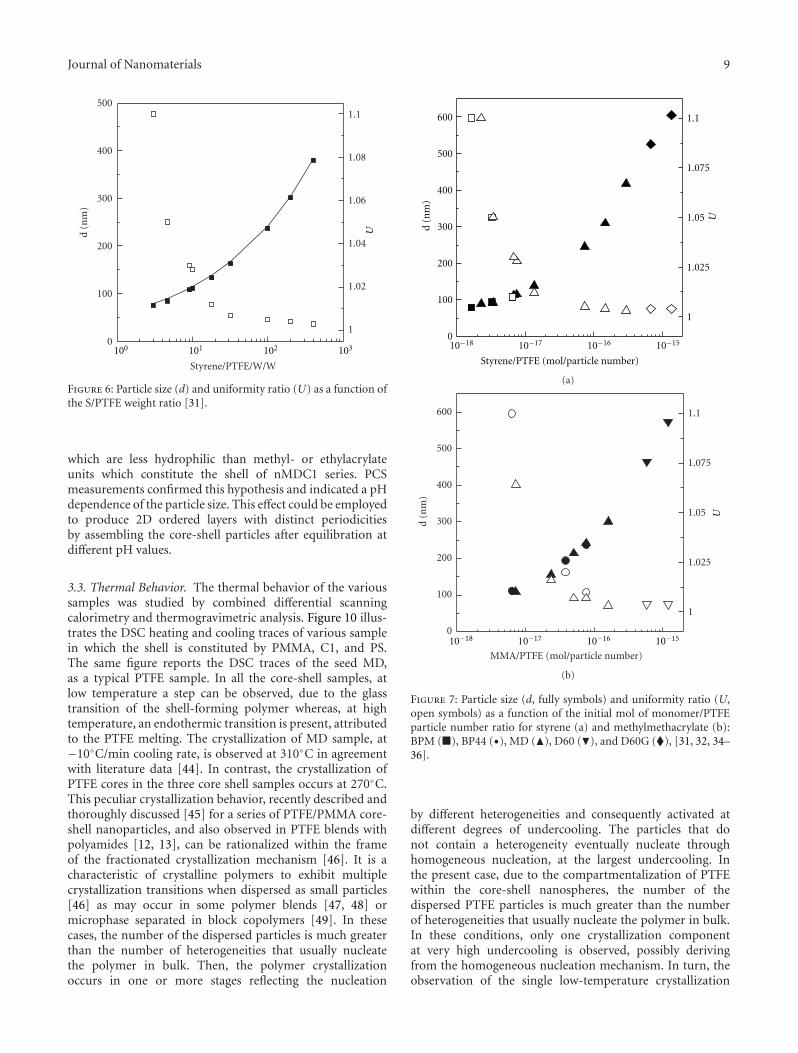
Figure 5 reports the SEM images for series MDSn as wellas the size distribution, including the uniformity ratios U[42] whereas Figure 6 illustrates the trend of the particlediameter and the uniformity ratio as a function of theS/PTFE weight ratio.
Over the entire S/PTFE range, the particle size increasesas the S/PTFE ratio increases indicating that secondarynucleation was prevented with all the monomer ending up asshell polymer. In addition, the uniformity ratio U decreasesregularly as the ratio S/PTFE increases.
The described trend is observed in all the sample seriesprepared starting from the various PTFE seeds and usingstyrene or methylmethacrylate. To make a homogeneouscomparison, the size and U data are plotted as a function ofthe ratio between the amount of styrene or methylmethacry-late and the number of PTFE particles in the reactionmixture. Figure 7 illustrates the various data.
For both monomers, the size and uniformity ratio trendsare very similar. The particle size increases as the ratiobetween the amount of monomer and the number of PTFEparticles increases whereas the relevant size distribution
Journal of Nanomaterials 7
200 400 600 8000
20
40
60
80
100
Wei
ght
(%)
(a)
(b)(e)
(c)
(d)
B
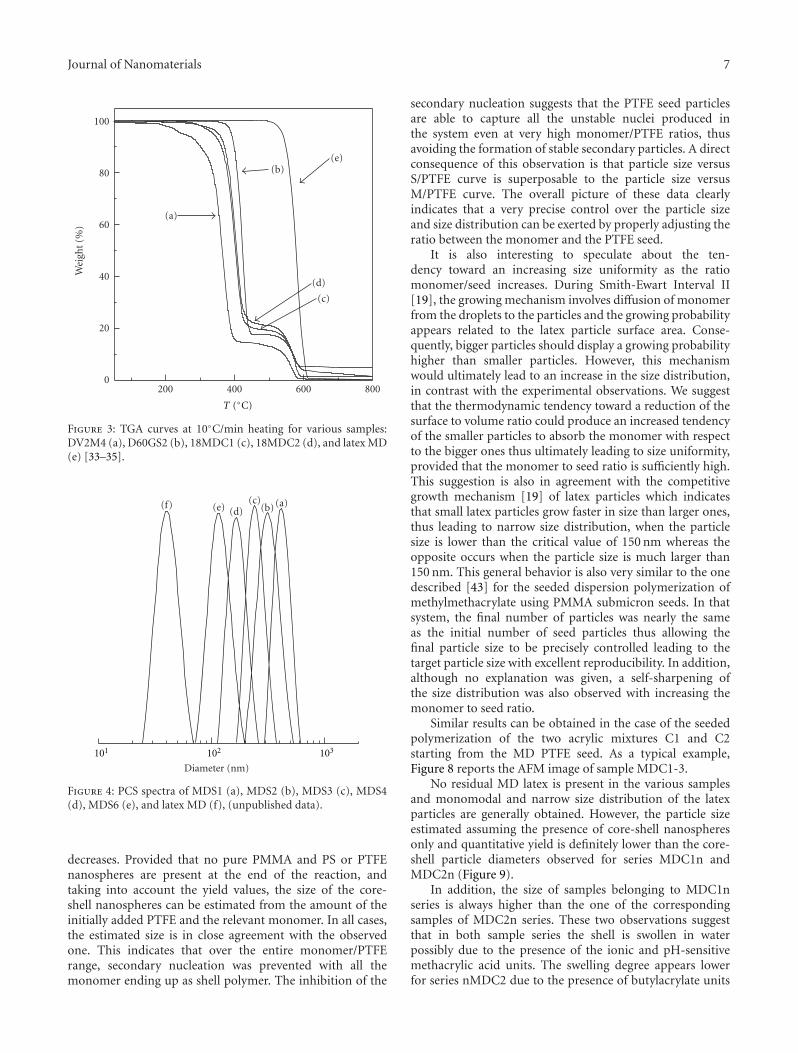
T (◦C)
Figure 3: TGA curves at 10◦C/min heating for various samples:DV2M4 (a), D60GS2 (b), 18MDC1 (c), 18MDC2 (d), and latex MD(e) [33–35].
(b)(f) (e) (d)(c) (a)
Diameter (nm)
101 102 103
Figure 4: PCS spectra of MDS1 (a), MDS2 (b), MDS3 (c), MDS4(d), MDS6 (e), and latex MD (f), (unpublished data).
decreases. Provided that no pure PMMA and PS or PTFEnanospheres are present at the end of the reaction, andtaking into account the yield values, the size of the core-shell nanospheres can be estimated from the amount of theinitially added PTFE and the relevant monomer. In all cases,the estimated size is in close agreement with the observedone. This indicates that over the entire monomer/PTFErange, secondary nucleation was prevented with all themonomer ending up as shell polymer. The inhibition of the
secondary nucleation suggests that the PTFE seed particlesare able to capture all the unstable nuclei produced inthe system even at very high monomer/PTFE ratios, thusavoiding the formation of stable secondary particles. A directconsequence of this observation is that particle size versusS/PTFE curve is superposable to the particle size versusM/PTFE curve. The overall picture of these data clearlyindicates that a very precise control over the particle sizeand size distribution can be exerted by properly adjusting theratio between the monomer and the PTFE seed.
It is also interesting to speculate about the ten-dency toward an increasing size uniformity as the ratiomonomer/seed increases. During Smith-Ewart Interval II[19], the growing mechanism involves diffusion of monomerfrom the droplets to the particles and the growing probabilityappears related to the latex particle surface area. Conse-quently, bigger particles should display a growing probabilityhigher than smaller particles. However, this mechanismwould ultimately lead to an increase in the size distribution,in contrast with the experimental observations. We suggestthat the thermodynamic tendency toward a reduction of thesurface to volume ratio could produce an increased tendencyof the smaller particles to absorb the monomer with respectto the bigger ones thus ultimately leading to size uniformity,provided that the monomer to seed ratio is sufficiently high.This suggestion is also in agreement with the competitivegrowth mechanism [19] of latex particles which indicatesthat small latex particles grow faster in size than larger ones,thus leading to narrow size distribution, when the particlesize is lower than the critical value of 150 nm whereas theopposite occurs when the particle size is much larger than150 nm. This general behavior is also very similar to the onedescribed [43] for the seeded dispersion polymerization ofmethylmethacrylate using PMMA submicron seeds. In thatsystem, the final number of particles was nearly the sameas the initial number of seed particles thus allowing thefinal particle size to be precisely controlled leading to thetarget particle size with excellent reproducibility. In addition,although no explanation was given, a self-sharpening ofthe size distribution was also observed with increasing themonomer to seed ratio.
Similar results can be obtained in the case of the seededpolymerization of the two acrylic mixtures C1 and C2starting from the MD PTFE seed. As a typical example,Figure 8 reports the AFM image of sample MDC1-3.
No residual MD latex is present in the various samplesand monomodal and narrow size distribution of the latexparticles are generally obtained. However, the particle sizeestimated assuming the presence of core-shell nanospheresonly and quantitative yield is definitely lower than the core-shell particle diameters observed for series MDC1n andMDC2n (Figure 9).
In addition, the size of samples belonging to MDC1nseries is always higher than the one of the correspondingsamples of MDC2n series. These two observations suggestthat in both sample series the shell is swollen in waterpossibly due to the presence of the ionic and pH-sensitivemethacrylic acid units. The swelling degree appears lowerfor series nMDC2 due to the presence of butylacrylate units
8 Journal of Nanomaterials
HV5 kV
Mag80000 x
WD13.2 mm
Spot3
1 μm16:56: 37-Jul-110
0 Inspect F-NanoFacility piemontetilt0◦
detETD
(a)
17:30:302-Mar-110 HV
5 kVMag
60000 xWD
10.3 mmSpot
31 μmtilt
−1◦det
ETD Inspect F-NanoFacility piemonte
(b)
20-Jan-1118:43:13
HV5 kV
Mag40000 x
WD10.2 mm
detETD
Spot3.5
2 μmInspect F-Nanofacility piemonte
tilt−0◦
(c)
7-Jul-1117: 5:460
0HV
10 kVMag
40000 xWD
13.2 mmSpot
32 μm
Inspect F-NanoFacility piemontetilt0◦
detETD
(d)
HV10 kV
Mag80000 x
WD13.2 mm
Spot3
1 μmInspect F-NanoFacility piemonte
07-Jul-1116:58:59
detETD
tilt0◦
(e)
50 100 150 200 250 300 350 400 450
MDS41.008
MDS61.028
MDS31.005
MDS21.004
d (nm)
MDS11.003
(f)
Figure 5: SEM micrograph of samples MDS1 (a), MDS2 (b), MDS3 (c), MDS4 (d), MDS6 (e), and relative diameter distribution (f),(unpublished data).
Journal of Nanomaterials 9
0
100
200
300
400
500
Styrene/PTFE/W/W
d (n
m)
1
1.02
1.04
1.06
1.08
1.1
U
101 102 103100
Figure 6: Particle size (d) and uniformity ratio (U) as a function ofthe S/PTFE weight ratio [31].
which are less hydrophilic than methyl- or ethylacrylateunits which constitute the shell of nMDC1 series. PCSmeasurements confirmed this hypothesis and indicated a pHdependence of the particle size. This effect could be employedto produce 2D ordered layers with distinct periodicitiesby assembling the core-shell particles after equilibration atdifferent pH values.
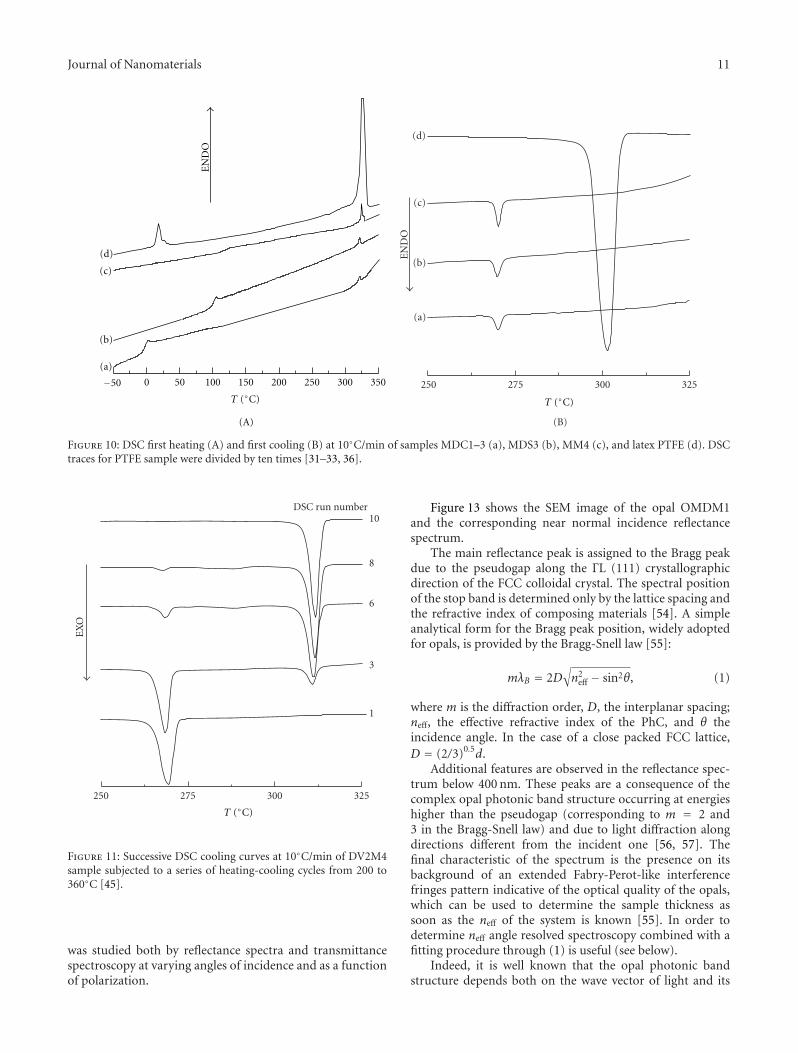
3.3. Thermal Behavior. The thermal behavior of the varioussamples was studied by combined differential scanningcalorimetry and thermogravimetric analysis. Figure 10 illus-trates the DSC heating and cooling traces of various samplein which the shell is constituted by PMMA, C1, and PS.The same figure reports the DSC traces of the seed MD,as a typical PTFE sample. In all the core-shell samples, atlow temperature a step can be observed, due to the glasstransition of the shell-forming polymer whereas, at hightemperature, an endothermic transition is present, attributedto the PTFE melting. The crystallization of MD sample, at−10◦C/min cooling rate, is observed at 310◦C in agreementwith literature data [44]. In contrast, the crystallization ofPTFE cores in the three core shell samples occurs at 270◦C.This peculiar crystallization behavior, recently described andthoroughly discussed [45] for a series of PTFE/PMMA core-shell nanoparticles, and also observed in PTFE blends withpolyamides [12, 13], can be rationalized within the frameof the fractionated crystallization mechanism [46]. It is acharacteristic of crystalline polymers to exhibit multiplecrystallization transitions when dispersed as small particles[46] as may occur in some polymer blends [47, 48] ormicrophase separated in block copolymers [49]. In thesecases, the number of the dispersed particles is much greaterthan the number of heterogeneities that usually nucleatethe polymer in bulk. Then, the polymer crystallizationoccurs in one or more stages reflecting the nucleation
0
100
200
300
400
500
600
Styrene/PTFE (mol/particle number)
1
1.025
1.05
1.075
1.1
U
10−18 10−17 10−16 10−15
d (n
m)
(a)
0
100
200
300
400
500
600
MMA/PTFE (mol/particle number)
1
1.025
1.05
1.075
1.1
U
10−18 10−17 10−16 10−15
d (n
m)
(b)
Figure 7: Particle size (d, fully symbols) and uniformity ratio (U,open symbols) as a function of the initial mol of monomer/PTFEparticle number ratio for styrene (a) and methylmethacrylate (b):BPM (�), BP44 (•), MD (�), D60 (�), and D60G (�), [31, 32, 34–36].
by different heterogeneities and consequently activated atdifferent degrees of undercooling. The particles that donot contain a heterogeneity eventually nucleate throughhomogeneous nucleation, at the largest undercooling. Inthe present case, due to the compartmentalization of PTFEwithin the core-shell nanospheres, the number of thedispersed PTFE particles is much greater than the numberof heterogeneities that usually nucleate the polymer in bulk.In these conditions, only one crystallization componentat very high undercooling is observed, possibly derivingfrom the homogeneous nucleation mechanism. In turn, theobservation of the single low-temperature crystallization

10 Journal of Nanomaterials
2 μm 0 nm 50 nm
Figure 8: AFM image and 2D Fourier spectrum (inset) for theMDC1-3 specimen. Tapping-mode AFM image obtained froma film of core-shell nanoparticles that has been obtained fromsolvent evaporation on a drop-casted spread on a freshly cleavedmuscovite mica disc. Heights are coded in shades according tothe reported colour bar. The 2D Fourier transform of the centralportion of the image (in the inset) shows the six intensity peaksdenoting periodicity and hexagonal compact structure of the filmwith a periodicity of approximately 300 nm (correspondent to themeasured average interparticle distance) [33].
exotherm can be viewed as a proof for the occurrence of aperfect dispersion of the PTFE seeds.
It should be observed that the melting of PTFE occurs ata temperature at which the shell forming polymers undergothermal degradation. In fact, Figure 11 reports a series ofsuccessive DSC heating and cooling curves for sample. In thefirst cooling curve only the crystallization at 270◦C can beobserved whereas in the successive cooling traces the PTFEcrystallization is structured into two components but it isapparent that the relative intensities of the peaks is differentfrom the previous cooling curve. In particular, the intensityof the crystallization peak at 310◦C increases whereas theopposite occurs for the crystallization component at 270◦C.
This phenomenology is related to the parallel thermaldecomposition of the PMMA shell which occurs throughthe well-known mechanism of random chain scission andfollowed by depropagation [50–52]. The unzipping and lossof the MMA allow the PTFE seeds to coalesce (Scheme 3).
The resulting increase in the PTFE domain size increasesin turn the crystallization propensity of PTFE as demon-strated by the appearance and progressive growth of thePTFE crystallization component at 310◦C.
3.4. 2D and 3D Colloidal Crystals. Several experiments wereperformed to obtain ordered 2D and 3D colloidal crystals.In particular, 2D colloidal crystal of spheres was formed bythe floating technique [37–39], on the air liquid interfaceand then lifted on the surface of a solid substrate. Orderedmonolayer samples of BPMS-3 underwent Reactive IonEtching (RIE), a physical-chemical dry etching techniquewidely used in silicon technology to remove material in
0
100
200
300
400
500
d (n
m)
Monomer(s)/PTFE/W/W
101 102100
Figure 9: Trend of particle diameter as a function of initially PTFEadded using MD latex as seed and different acrylic mixtures forshell: methyl methacrylate (� and continuous line), acrylic mixtureC1 (• and dashed line), and acrylic mixture C2 (� and dotted line)[33, 34, 36].
decompositionShell polymer
decompositionShell polymer
Scheme 3: Decomposition of PMMA and PTFE seeds coalesce for asample subjected to DSC heating-cooling cycles.
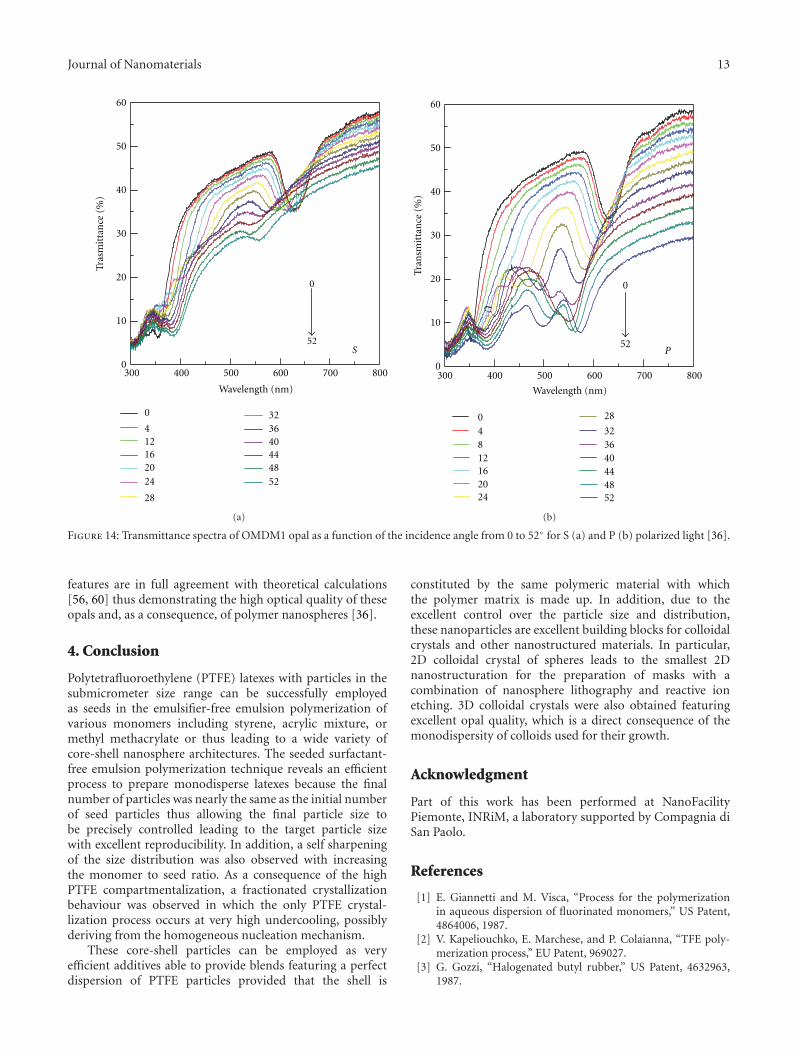
excess during microfabrication processes. The RIE wasperformed in oxygen plasma, at an operative pressure of3.0E-1 mbar, flux of 80 sccm, 80 W RF power, at differentetching time ranging from 20 to 120 seconds, as illustratedfor a typical preparation in Figure 12.
Once subjected to RIE treatment, the nanospheres startreducing in size but the 2D structuring is not lost possiblybecause of the ionic anchoring of the negatively chargedparticles to the silicon surface. As the RIE time increases,the particle size decreases but the 2D ordering does notappear substantially perturbed. As the final particle size after80 s RIE time is about 35 nm. This value represents thesmallest 2D nanostructuration obtained by RIE [53] for thepreparation of masks with a combination of nanospherelithography and reactive ion etching.
3D colloidal crystals were prepared starting from variousMDMn latexes. The corresponding opals, named OMDMn,were composed of flat domains with the [111] directionof the face-centered cubic lattice of spheres perpendicularto the glass substrate. The evolution of the stop band
Journal of Nanomaterials 11
0 50 100 150 200 250 300 350
(d)
(c)
(b)
EN
DO
(a)
−50
T (◦C)
(A)
250 275 300 325
(d)
(c)
(b)
EN
DO
(a)
T (◦C)
(B)
Figure 10: DSC first heating (A) and first cooling (B) at 10◦C/min of samples MDC1–3 (a), MDS3 (b), MM4 (c), and latex PTFE (d). DSCtraces for PTFE sample were divided by ten times [31–33, 36].
250 275 300 325
10
8
6
3
1
EX
O
DSC run number
T (◦C)
Figure 11: Successive DSC cooling curves at 10◦C/min of DV2M4sample subjected to a series of heating-cooling cycles from 200 to360◦C [45].
was studied both by reflectance spectra and transmittancespectroscopy at varying angles of incidence and as a functionof polarization.
Figure 13 shows the SEM image of the opal OMDM1and the corresponding near normal incidence reflectancespectrum.
The main reflectance peak is assigned to the Bragg peakdue to the pseudogap along the ΓL (111) crystallographicdirection of the FCC colloidal crystal. The spectral positionof the stop band is determined only by the lattice spacing andthe refractive index of composing materials [54]. A simpleanalytical form for the Bragg peak position, widely adoptedfor opals, is provided by the Bragg-Snell law [55]:
mλB = 2D√n2
eff − sin2θ, (1)
where m is the diffraction order, D, the interplanar spacing;neff, the effective refractive index of the PhC, and θ theincidence angle. In the case of a close packed FCC lattice,D = (2/3)0.5d.
Additional features are observed in the reflectance spec-trum below 400 nm. These peaks are a consequence of thecomplex opal photonic band structure occurring at energieshigher than the pseudogap (corresponding to m = 2 and3 in the Bragg-Snell law) and due to light diffraction alongdirections different from the incident one [56, 57]. Thefinal characteristic of the spectrum is the presence on itsbackground of an extended Fabry-Perot-like interferencefringes pattern indicative of the optical quality of the opals,which can be used to determine the sample thickness assoon as the neff of the system is known [55]. In order todetermine neff angle resolved spectroscopy combined with afitting procedure through (1) is useful (see below).
Indeed, it is well known that the opal photonic bandstructure depends both on the wave vector of light and its
12 Journal of Nanomaterials
HV5 kV
Mag60000 x
WD10.3 mm
Spot2
1 μmdetETD Inspect F-NanoFacility piemonte
18-Feb-1017:00:29
tilt−0◦
(a)
HV5 kV
Mag100000 x
WD7.9 mm
Spot2
detETD Inspect F-NanoFacility piemonte
1 μm23-Feb-1009:13:30
tilt−0◦
(b)
Figure 12: SEM micrographs of sample BPMS-3 after different RIE times: 0 s (a), 80 s (b) [32].
1 μm2 kV
ENISEI SEM WD 4.5 mmx 10,000
29-Oct-10
MM1
(a)
300 400 500 600 700 800 900 10000
10
20
30
40
50
Wavelength (nm)
OMDM1R
eflec
tan
ce (
a.u
.)
(b)
Figure 13: SEM micrograph (a) and reflectance spectrum of opal OMDM1 sample (b) [36].
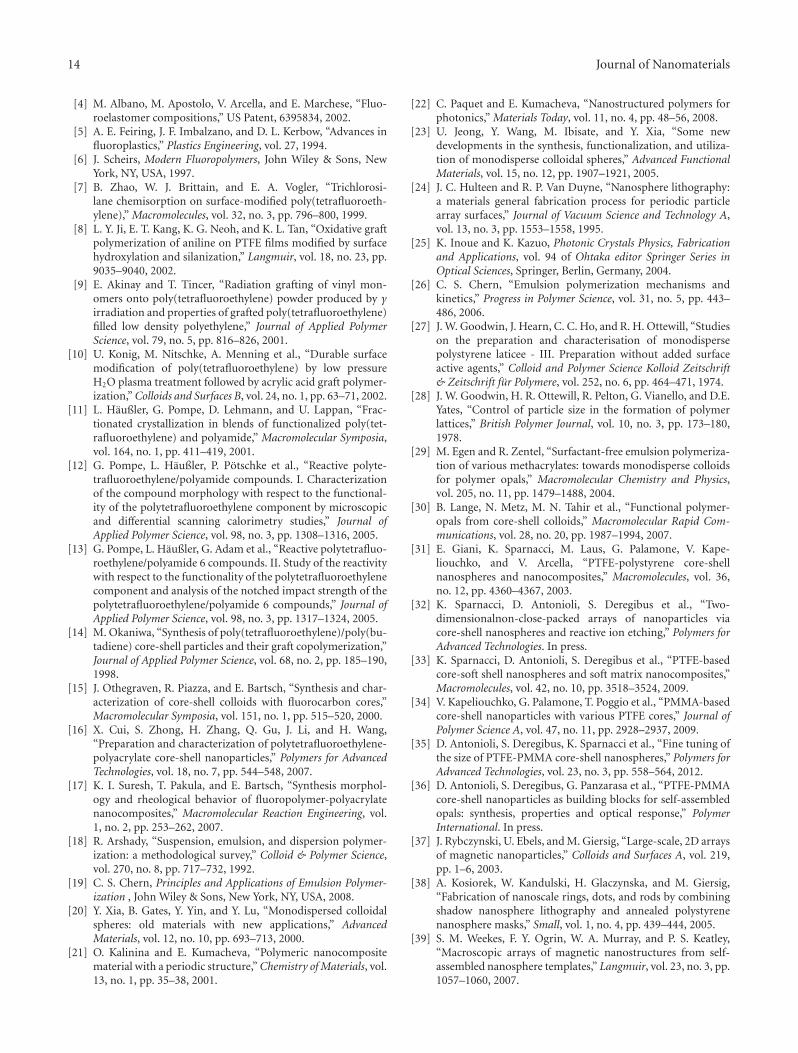
polarization [56, 58, 59]. All these properties are also stronglydependent on the opal quality, which is a direct consequenceof the monodispersity of colloids used for their growth. Inorder to probe the quality of the opals, a characterizationof the opal by incidence-angle-dependent transmittancespectroscopy for both P (parallel to plane of incidence) andS (perpendicular to the plane of incidence) polarizationwas performed. The advantage of the angular-dependentmeasurements is to clearly show the dispersive and polarizedoptical properties of the opals. In order to show theseeffects, in Figure 14 the transmittance spectra recorded atdifferent incidence angles (from 0 to 54◦) are reported forthe OMDM1 opal for S (a) and P (b) polarization and withvertical orientation of the sample (vertical means that thedirection of meniscus displacement during the growth isvertical with respect to the lab floor).
The stop band at θ = 0◦ is observed as a minimumat about 625 nm, which shifts towards lower wavelengthsupon increasing θ. Upon fitting these data with (1) and byassuming that the interplanar spacing is determined only bythe sphere diameter, a value of neff = 1.32 is obtained [36].
At about 350 nm, an additional structure having anopposite dispersion is instead observed, merging at about 40◦
with that of the main stop band and then crossing it. Addi-tional structures, almost dispersiveless, are also observedbelow 400 nm. These complicate dispersive structures arestrongly dependent on light polarization (more evident forP polarization) but are not characteristic of the nanospherematerial since already observed for both polystyrene [56]and silica opals [60]. Finally, we notice that the full width athalf maximum (FWHM) of the stop band becomes slightlyanisotropic upon increasing the incidence angle. All these
Journal of Nanomaterials 13
300 400 500 600 700 8000
10
20
30
40
50
60
52
Wavelength (nm)
0
412162024
28
323640444852
S
0
Tras
mit
tan
ce (
%)
(a)
300 400 500 600 700 8000
10
20
30
40
50
60
P
Tran
smit
tan
ce (
%)
Wavelength (nm)
04812162024
28
323640444852
52
0
U
(b)
Figure 14: Transmittance spectra of OMDM1 opal as a function of the incidence angle from 0 to 52◦ for S (a) and P (b) polarized light [36].
features are in full agreement with theoretical calculations[56, 60] thus demonstrating the high optical quality of theseopals and, as a consequence, of polymer nanospheres [36].
4. Conclusion
Polytetrafluoroethylene (PTFE) latexes with particles in thesubmicrometer size range can be successfully employedas seeds in the emulsifier-free emulsion polymerization ofvarious monomers including styrene, acrylic mixture, ormethyl methacrylate or thus leading to a wide variety ofcore-shell nanosphere architectures. The seeded surfactant-free emulsion polymerization technique reveals an efficientprocess to prepare monodisperse latexes because the finalnumber of particles was nearly the same as the initial numberof seed particles thus allowing the final particle size tobe precisely controlled leading to the target particle sizewith excellent reproducibility. In addition, a self sharpeningof the size distribution was also observed with increasingthe monomer to seed ratio. As a consequence of the highPTFE compartmentalization, a fractionated crystallizationbehaviour was observed in which the only PTFE crystal-lization process occurs at very high undercooling, possiblyderiving from the homogeneous nucleation mechanism.
These core-shell particles can be employed as veryefficient additives able to provide blends featuring a perfectdispersion of PTFE particles provided that the shell is
constituted by the same polymeric material with whichthe polymer matrix is made up. In addition, due to theexcellent control over the particle size and distribution,these nanoparticles are excellent building blocks for colloidalcrystals and other nanostructured materials. In particular,2D colloidal crystal of spheres leads to the smallest 2Dnanostructuration for the preparation of masks with acombination of nanosphere lithography and reactive ionetching. 3D colloidal crystals were also obtained featuringexcellent opal quality, which is a direct consequence of themonodispersity of colloids used for their growth.
Acknowledgment
Part of this work has been performed at NanoFacilityPiemonte, INRiM, a laboratory supported by Compagnia diSan Paolo.
References
[1] E. Giannetti and M. Visca, “Process for the polymerizationin aqueous dispersion of fluorinated monomers,” US Patent,4864006, 1987.
[2] V. Kapeliouchko, E. Marchese, and P. Colaianna, “TFE poly-merization process,” EU Patent, 969027.
[3] G. Gozzi, “Halogenated butyl rubber,” US Patent, 4632963,1987.
14 Journal of Nanomaterials
[4] M. Albano, M. Apostolo, V. Arcella, and E. Marchese, “Fluo-roelastomer compositions,” US Patent, 6395834, 2002.
[5] A. E. Feiring, J. F. Imbalzano, and D. L. Kerbow, “Advances influoroplastics,” Plastics Engineering, vol. 27, 1994.
[6] J. Scheirs, Modern Fluoropolymers, John Wiley & Sons, NewYork, NY, USA, 1997.
[7] B. Zhao, W. J. Brittain, and E. A. Vogler, “Trichlorosi-lane chemisorption on surface-modified poly(tetrafluoroeth-ylene),” Macromolecules, vol. 32, no. 3, pp. 796–800, 1999.
[8] L. Y. Ji, E. T. Kang, K. G. Neoh, and K. L. Tan, “Oxidative graftpolymerization of aniline on PTFE films modified by surfacehydroxylation and silanization,” Langmuir, vol. 18, no. 23, pp.9035–9040, 2002.
[9] E. Akinay and T. Tincer, “Radiation grafting of vinyl mon-omers onto poly(tetrafluoroethylene) powder produced by γirradiation and properties of grafted poly(tetrafluoroethylene)filled low density polyethylene,” Journal of Applied PolymerScience, vol. 79, no. 5, pp. 816–826, 2001.
[10] U. Konig, M. Nitschke, A. Menning et al., “Durable surfacemodification of poly(tetrafluoroethylene) by low pressureH2O plasma treatment followed by acrylic acid graft polymer-ization,” Colloids and Surfaces B, vol. 24, no. 1, pp. 63–71, 2002.
[11] L. Haußler, G. Pompe, D. Lehmann, and U. Lappan, “Frac-tionated crystallization in blends of functionalized poly(tet-rafluoroethylene) and polyamide,” Macromolecular Symposia,vol. 164, no. 1, pp. 411–419, 2001.
[12] G. Pompe, L. Haußler, P. Potschke et al., “Reactive polyte-trafluoroethylene/polyamide compounds. I. Characterizationof the compound morphology with respect to the functional-ity of the polytetrafluoroethylene component by microscopicand differential scanning calorimetry studies,” Journal ofApplied Polymer Science, vol. 98, no. 3, pp. 1308–1316, 2005.
[13] G. Pompe, L. Haußler, G. Adam et al., “Reactive polytetrafluo-roethylene/polyamide 6 compounds. II. Study of the reactivitywith respect to the functionality of the polytetrafluoroethylenecomponent and analysis of the notched impact strength of thepolytetrafluoroethylene/polyamide 6 compounds,” Journal ofApplied Polymer Science, vol. 98, no. 3, pp. 1317–1324, 2005.
[14] M. Okaniwa, “Synthesis of poly(tetrafluoroethylene)/poly(bu-tadiene) core-shell particles and their graft copolymerization,”Journal of Applied Polymer Science, vol. 68, no. 2, pp. 185–190,1998.
[15] J. Othegraven, R. Piazza, and E. Bartsch, “Synthesis and char-acterization of core-shell colloids with fluorocarbon cores,”Macromolecular Symposia, vol. 151, no. 1, pp. 515–520, 2000.
[16] X. Cui, S. Zhong, H. Zhang, Q. Gu, J. Li, and H. Wang,“Preparation and characterization of polytetrafluoroethylene-polyacrylate core-shell nanoparticles,” Polymers for AdvancedTechnologies, vol. 18, no. 7, pp. 544–548, 2007.
[17] K. I. Suresh, T. Pakula, and E. Bartsch, “Synthesis morphol-ogy and rheological behavior of fluoropolymer-polyacrylatenanocomposites,” Macromolecular Reaction Engineering, vol.1, no. 2, pp. 253–262, 2007.
[18] R. Arshady, “Suspension, emulsion, and dispersion polymer-ization: a methodological survey,” Colloid & Polymer Science,vol. 270, no. 8, pp. 717–732, 1992.
[19] C. S. Chern, Principles and Applications of Emulsion Polymer-ization , John Wiley & Sons, New York, NY, USA, 2008.
[20] Y. Xia, B. Gates, Y. Yin, and Y. Lu, “Monodispersed colloidalspheres: old materials with new applications,” AdvancedMaterials, vol. 12, no. 10, pp. 693–713, 2000.
[21] O. Kalinina and E. Kumacheva, “Polymeric nanocompositematerial with a periodic structure,” Chemistry of Materials, vol.13, no. 1, pp. 35–38, 2001.
[22] C. Paquet and E. Kumacheva, “Nanostructured polymers forphotonics,” Materials Today, vol. 11, no. 4, pp. 48–56, 2008.
[23] U. Jeong, Y. Wang, M. Ibisate, and Y. Xia, “Some newdevelopments in the synthesis, functionalization, and utiliza-tion of monodisperse colloidal spheres,” Advanced FunctionalMaterials, vol. 15, no. 12, pp. 1907–1921, 2005.
[24] J. C. Hulteen and R. P. Van Duyne, “Nanosphere lithography:a materials general fabrication process for periodic particlearray surfaces,” Journal of Vacuum Science and Technology A,vol. 13, no. 3, pp. 1553–1558, 1995.
[25] K. Inoue and K. Kazuo, Photonic Crystals Physics, Fabricationand Applications, vol. 94 of Ohtaka editor Springer Series inOptical Sciences, Springer, Berlin, Germany, 2004.
[26] C. S. Chern, “Emulsion polymerization mechanisms andkinetics,” Progress in Polymer Science, vol. 31, no. 5, pp. 443–486, 2006.
[27] J. W. Goodwin, J. Hearn, C. C. Ho, and R. H. Ottewill, “Studieson the preparation and characterisation of monodispersepolystyrene laticee - III. Preparation without added surfaceactive agents,” Colloid and Polymer Science Kolloid Zeitschrift& Zeitschrift fur Polymere, vol. 252, no. 6, pp. 464–471, 1974.
[28] J. W. Goodwin, H. R. Ottewill, R. Pelton, G. Vianello, and D.E.Yates, “Control of particle size in the formation of polymerlattices,” British Polymer Journal, vol. 10, no. 3, pp. 173–180,1978.
[29] M. Egen and R. Zentel, “Surfactant-free emulsion polymeriza-tion of various methacrylates: towards monodisperse colloidsfor polymer opals,” Macromolecular Chemistry and Physics,vol. 205, no. 11, pp. 1479–1488, 2004.
[30] B. Lange, N. Metz, M. N. Tahir et al., “Functional polymer-opals from core-shell colloids,” Macromolecular Rapid Com-munications, vol. 28, no. 20, pp. 1987–1994, 2007.
[31] E. Giani, K. Sparnacci, M. Laus, G. Palamone, V. Kape-liouchko, and V. Arcella, “PTFE-polystyrene core-shellnanospheres and nanocomposites,” Macromolecules, vol. 36,no. 12, pp. 4360–4367, 2003.
[32] K. Sparnacci, D. Antonioli, S. Deregibus et al., “Two-dimensionalnon-close-packed arrays of nanoparticles viacore-shell nanospheres and reactive ion etching,” Polymers forAdvanced Technologies. In press.
[33] K. Sparnacci, D. Antonioli, S. Deregibus et al., “PTFE-basedcore-soft shell nanospheres and soft matrix nanocomposites,”Macromolecules, vol. 42, no. 10, pp. 3518–3524, 2009.
[34] V. Kapeliouchko, G. Palamone, T. Poggio et al., “PMMA-basedcore-shell nanoparticles with various PTFE cores,” Journal ofPolymer Science A, vol. 47, no. 11, pp. 2928–2937, 2009.
[35] D. Antonioli, S. Deregibus, K. Sparnacci et al., “Fine tuning ofthe size of PTFE-PMMA core-shell nanospheres,” Polymers forAdvanced Technologies, vol. 23, no. 3, pp. 558–564, 2012.
[36] D. Antonioli, S. Deregibus, G. Panzarasa et al., “PTFE-PMMAcore-shell nanoparticles as building blocks for self-assembledopals: synthesis, properties and optical response,” PolymerInternational. In press.
[37] J. Rybczynski, U. Ebels, and M. Giersig, “Large-scale, 2D arraysof magnetic nanoparticles,” Colloids and Surfaces A, vol. 219,pp. 1–6, 2003.
[38] A. Kosiorek, W. Kandulski, H. Glaczynska, and M. Giersig,“Fabrication of nanoscale rings, dots, and rods by combiningshadow nanosphere lithography and annealed polystyrenenanosphere masks,” Small, vol. 1, no. 4, pp. 439–444, 2005.
[39] S. M. Weekes, F. Y. Ogrin, W. A. Murray, and P. S. Keatley,“Macroscopic arrays of magnetic nanostructures from self-assembled nanosphere templates,” Langmuir, vol. 23, no. 3, pp.1057–1060, 2007.
Journal of Nanomaterials 15
[40] P. Jiang, J. F. Bertone, and V. L. Colvin, “A lost-wax approachto monodisperse colloids and their crystals,” Science, vol. 291,no. 5503, pp. 453–457, 2001.
[41] L. Berti, M. Cucini, F. Di Stasio et al., “Spectroscopic inves-tigation of artificial opals infiltrated with a heteroaromaticquadrupolar dye,” Journal of Physical Chemistry C, vol. 114,no. 6, pp. 2403–2413, 2010.
[42] S. M. Heard, F. Grieser, C. G. Barraclough, and J. V. Sanders,“The characterization of ag sols by electron microscopy,optical absorption, and electrophoresis,” Journal of ColloidAnd Interface Science, vol. 93, no. 2, pp. 545–555, 1983.
[43] S. Jiang, E. D. Sudol, V. L. Dimonie, and M. S. El-Aasser,“Seeding as a means of controlling particle size in dispersionpolymerization,” Journal of Applied Polymer Science, vol. 108,no. 6, pp. 4096–4107, 2008.
[44] X. Q. Wang, D. R. Chen, J. C. Han, and S. Y. Du, “Crystal-lization behavior of polytetrafluoroethylene (PTFE),” Journalof Applied Polymer Science, vol. 83, no. 5, pp. 990–996, 2002.
[45] M. Laus, K. Sparnacci, D. Antonioli et al., “On the multiplecrystallization behavior of PTFE in PMMA/PTFE nanocom-posites from core-shell nanoparticles,” Journal of PolymerScience B, vol. 48, no. 5, pp. 548–554, 2010.
[46] J. A. Koutsky, A. G. Walton, and E. Baer, “Nucleation ofpolymer droplets,” Journal of Applied Physics, vol. 38, no. 4,pp. 1832–1839, 1967.
[47] V. Everaert, G. Groeninckx, and L. Aerts, “Fractionatedcrystallization in immiscible POM/(PS/PPE) blends part 1:effect of blend phase morphology and physical state of theamorphous matrix phase,” Polymer, vol. 41, no. 4, pp. 1409–1428, 2000.
[48] V. Balsamo and L. M. Gouveia, “Interplay of fractionatedcrystallization and morphology in polypropylene/polyte-(ε-caprolactone) blends,” Journal of Polymer Science B, vol. 45, no.11, pp. 1365–1379, 2007.
[49] H. L. Chen, J. C. Wu, T. L. Lin, and J. S. Lin, “Crystallizationkinetics in microphase-separated poly(ethylene oxide)-block-poly(1, 4-butadiene),” Macromolecules, vol. 34, no. 20, pp.6936–6944, 2001.
[50] J. Pavlinec, M. Lazar, and K. Csomorova, “Thermal degrada-tion of multilayer methacrylate-acrylate particle-bead poly-mer powders and melts,” Polymer Degradation and Stability,vol. 55, no. 1, pp. 65–71, 1997.
[51] B. J. Holland and J. N. Hay, “The kinetics and mechanisms ofthe thermal degradation of poly(methyl methacrylate) studiedby thermal analysis-Fourier transform infrared spectroscopy,”Polymer, vol. 42, no. 11, pp. 4825–4835, 2001.
[52] D. Antonioli, M. Laus, K. Sparnacci et al., “Thermal and DMAcharacterization of PTFE-PMMA nanocomposites from core-shell nanoparticles,” Macromolecular Symposia, vol. 296, no. 1,pp. 197–202, 2010.
[53] Y. J. Zhang, W. Li, and K. J. Chen, “Application of two-dimensional polystyrene arrays in the fabrication of orderedsilicon pillars,” Journal of Alloys and Compounds, vol. 450, no.1-2, pp. 512–516, 2008.
[54] J. D. Joannopulos, R. D. Meade, and J. N. Win, PhotonicCrystals: Molding the Flow of the Light, Princeton UniversityPress, Princeton, NJ, USA, 1995.
[55] V. Morandi, F. Marabelli, V. Amendola, M. Meneghetti, andD. Comoretto, “Colloidal photonic crystals doped with goldnanoparticles: spectroscopy and optical switching properties,”Advanced Functional Materials, vol. 17, no. 15, pp. 2779–2786,2007.
[56] E. Pavarini, L. C. Andreani, C. Soci, M. Galli, F. Marabelli, andD. Comoretto, “Band structure and optical properties of opal
photonic crystals,” Physical Review B, vol. 72, no. 4, pp. 1–10,2005.
[57] L. C. Andreani, A. Balestreri, J. F. Galisteo-Lopez et al.,“Optical response with three-fold symmetry axis on orientedmicrodomains of opal photonic crystals,” Physical Review B,vol. 78, no. 20, pp. 205304–205311, 2008.
[58] J. F. Galisteo-Lopez, F. Lopez-Tejeira, S. Rubio, C. Lopez, andJ. Sanchez-Dehesa, “Experimental evidence of polarizationdependence in the optical response of opal-based photoniccrystals,” Applied Physics Letters, vol. 82, no. 23, pp. 4068–4070,2003.
[59] F. Lopez-Tejeira, T. Ochiai, K. Sakoda, and J. Sanchez-Dehesa, “Symmetry characterization of eigenstates in opal-based photonic crystals,” Physical Review B, vol. 65, no. 19, pp.195110–195118, 2002.
[60] D. Comoretto, D. Cavallo, G. Dellepiane et al., “Optical studiesof artificial opals as 3D photonic crystals,” Material ResearchSociety Symposium Proceeding, vol. 708, no. 1, pp. 1–6, 2002.
Hindawi Publishing CorporationJournal of NanomaterialsVolume 2012, Article ID 202794, 7 pagesdoi:10.1155/2012/202794
Research Article
Preparation of a Novel Nanocomposite ofPolyaniline Core Decorated with Anatase-TiO2 Nanoparticles inIonic Liquid/Water Microemulsion
Yanni Guo,1, 2 Deliang He,1 Sanbao Xia,1 Xin Xie,1 Xiang Gao,1 and Quan Zhang3
1 College of Chemistry and Chemical Engineering, Hunan University, Changsha 410082, China2 Department of Petrochemical Engineering, Hunan Petrochemical Vocational Technology College, Yueyang 414012, China3 College of Civil Engineering, Hunan University, Changsha 410082, China
Correspondence should be addressed to Deliang He, [email protected]
Received 6 June 2011; Accepted 6 September 2011
Academic Editor: Sherine Obare
Copyright © 2012 Yanni Guo et al. This is an open access article distributed under the Creative Commons Attribution License,which permits unrestricted use, distribution, and reproduction in any medium, provided the original work is properly cited.
Polyaniline core decorated with TiO2 (PANI-TiO2) nanocomposite particles was successfully synthesized in ionic liquid/water(IL/water) microemulsion in the presence of anatase TiO2 nanoparticles. The TiO2 nanoparticles had been dispersed beforehandin OP-10 and n-butanol to weaken the strong particles agglomeration of TiO2. The PANI-TiO2 nanocomposites were characterizedby fourier transform infrared spectroscopy (FTIR), ultraviolet visible spectroscopy (UV-Vis), scanning electron microscopy(SEM), and transmission electron microscope (TEM), and their electrochemical behavior was estimated by the electrochemicalworkstation. SEM micrographs showed that the nanocomposites exhibited spherical morphology with particle sizes about 70 nm.The TEM result showed that the PANI-TiO2 nanocomposites had a novel structure and that nanocrystalline TiO2 deposited ontothe surface of PANI, which was different from the reported structure of TiO2-PANI nanocomposites. Both FTIR and UV-Visspectra indicate that polyaniline and nano-TiO2 particles are not simply blended or mixed up. A possible reaction mechanism forthis nanocomposite preparation is suggested and analyzed.
1. Introduction
Organic-inorganic nanocomposites for synergetic behaviorand a wide range of potential use have triggered great interestand concern of the related academic organizations and re-searchers over the past decade [1–4]. Specifically, core-shellstructures nanocomposites of organic conjugated polymersand inorganic nanocrystals have attracted great attention dueto a large number of potential applications such as photonics,photoelectronics, and catalysis [5]. Among the conductingpolymers, conducting polyaniline (PANI) is often used asan organic part to prepare nanocomposites because of itslow cost, easy preparation, controllable unique propertiesby oxidation and protonation state, excellent environmentalstability, and potential application in electronic devices [6].A number of different metal oxide particles have so far beenencapsulated into the shell of polyaniline giving rise to ahost of nanocomposites. Du et al. [7] reported an Ag-PANI
core-shell structure via one-pot redox reaction in ethanol at250◦C. The obtained Ag-PANI core-shell particles are with alarge Ag core of the size of about 200 nm and relative thinpolyaniline shell of the thickness of about 50 nm. Lei [8]successfully prepared Au-polyaniline nanocomposites withcore-shell structure on ITO conducting electrode based on4-aminothiolphenol-capped Au nanoparticles via electro-chemical synthesis, and the Au nanoparticle with a meandiameter of ca. 250 nm is the core of the nanocomposite andthe polyaniline is the shell wrap of the Au nanoparticle. TheCeO2-polyaniline (CeO2-PANI) core-shell nanocompositesprepared via chemical oxidation of aniline by CeO2 werereported by Chuang and Yang [9]. Jing et al. [10] successfullysynthesized Ag-polyaniline core-shell nanocomposites via insitu chemical oxidation polymerization of aniline based onmercaptocarboxylic-acid-capped Ag nanoparticle colloid. Yuet al. [11] prepared carbon nanotube-polyaniline core-shellnanowires by in situ inverse microemulsion. Nanocompos-
2 Journal of Nanomaterials
ites of “egg-like” cores and shell ranging in diameter from 40to 80 nm and 60 to 120 nm, respectively, have been preparedsuccessfully using hexadecyl trimethyl ammoniumbromide(CTAB) microemulsion by Asim et al. [12]. Nanosized ti-tania, because of its unique physicochemical properties [13–16], is frequently combined with polyaniline. Zhang et al.[17] synthesized PANI-TiO2 composite microspheres withan average diameter 2.5–3.5 μm by a template-free method inthe presence of salicylic acid as dopant. The PANI-TiO2 com-posites are typical core-shell structure, PANI-coated crys-talline TiO2. A polyaniline-nano-TiO2 composite [18] wasprepared by polyaniline for the surface modification of nano-TiO2 particles, forming a core-shell structure.
There are many researches on the core/shell-metaloxide/polyaniline structures, but the structures of polyani-line core decorated with metal oxide are seldom investigated.As is known, the octahedrite-type TiO2 has better chemicalproperties and photon characteristics, due to its good ab-sorbability and lower electron/holes recombining rate [19].The ultraviolet excitation (wavelength <380 nm) can over-come the energy gap of pristine titanium dioxide for phot-ocatalysts for electrons to jump to conduction band to formthe electron-hole pair. The formed holes and electrons canoxidize and reduce the H2O, OH−, or O2 adsorbed on thesurface of TiO2 to living free radicals, which can deterioratethe organic materials or undesired pollutants that adsorbedon the surface of TiO2 catalyst resulting in generating non-poisonous CO2, H2O, and some inorganic products.However, for TiO2 core-PANI shell composites, becauseof package action of polyaniline, photon absorption ofTiO2 nanoparticles is blocked and the living free radicalsgenerated from holes and electrons are hard to trans-fer onto the surface of polyaniline to oxidize organicmaterials; moreover, the living free radicals may reactto the polyaniline in course of transfer. Thus, in fact,the photoelectric capabilities of TiO2 are bated afterbeing enwrapped by polyaniline. Hereby, polyaniline coredecorated with TiO2 (PANI-TiO2) nanocomposite par-ticles makes it possible to develop the properties ofTiO2.
Ionic liquids (ILs) are organic salts with low meltingpoints [20] and have a stable liquid range temperature ofover 300◦C. Typical ILs have unusual properties includingnonvolatility, nonflammability, wide electrochemical win-dows, higher ionic conductivity, and excellent thermal andchemical stability. More recently, synthesis of PANI has beenadvocated by electrochemical [21] and interfacial [22] poly-merization in ILs. All of the PANIs exhibit excellent physicaland chemical properties. Another potential advantage of syn-thesis in ILs is their unique solvent capabilities, which canavoid organic solvent volatilizing.
Microemulsions are thermodynamically stable disper-sions of two or more immiscible liquids that are stabilizedby an adsorbed surfactant film at the liquid-liquid interface.They are an effective method to prepare nanoparticles, na-nowires, and nanorods [23]. Furthermore, it has been dem-onstrated that ILs could substitute water or conventional or-ganic solvents to form novel microemulsion systems in thepresence of surfactant, and these novel microemulsions
incorporate the advantages of ILs and microemulsion [24–26]. Our research group has successfully prepared PANInanoparticles in IL/water emulsion systems [27, 28].
In the present study, a polyaniline core decorated withTiO2 (PANI-TiO2) nanocomposite was prepared in a micro-emulsion comprised of deionized water as the continuousaqueous phase and an oil solution including aniline andhydrophobic IL 1-butyl-3-methylimidazolium hexafluoro-phosphate ([bmim]PF6) as the dispersed phase in the pres-ence of anatase TiO2 nanoparticles. The TiO2 nanoparti-cles were dispersed beforehand in OP-10 and n-butanol.The nanocomposites were characterized by fourier trans-form infrared spectroscopy (FTIR), ultraviolet visible spec-troscopy (UV-Vis), scanning electron microscopy (SEM),and transmission electron microscope (TEM). Moreover, thepossible reaction mechanism for the preparation of PANT-TiO2 nanocomposite is investigated here.
2. Experimental
2.1. Materials. IL 1-butyl-3-methylimidazolium hexafluoro-phosphate ([bmim]PF6) was prepared as described in theliterature [29]. Nanocrystalline TiO2 (anatase <10 nm) wassynthesized based on a sol-gel technique as described inthe previous procedure [30]. Aniline, n-butanol, ammoniumpersulfate (APS), nitric acid, and other chemicals were ana-lytical grade (Sinopharm Chemical Reagent Co., Ltd)and were used as received. The emulsifier nonylphenolethoxylates (OP-10) was obtained from 3W Industry Co.,Ltd. All aqueous solutions were prepared with deionizedwater.
2.2. Synthesis of Polyaniline Core Decorated with TiO2 (PANI-TiO2) Nanocomposite. The polyaniline core decorated withTiO2 (PANI-TiO2) composites was synthesized in micro-emulsion system via in situ chemical oxidative polymeriza-tion in the presence of TiO2 nanoparticles, and the pro-cedure was as follows: Firstly, hydrophobic IL [bmim]PF6
(2 mL)/aniline (1 mL) mixture was added into the OP-10(13 mL)/n-butanol (3 mL)/HNO3 (87 mL (0.115 mol·L−1))solution; after the mixture was stirred for 1 h under magneticstirring, a dispersion of TiO2 nanoparticles (TiO2: aniline =25 wt%) in a mixed solution of 3 mL OP-10 and 2 mL n-butanol was in one time introduced into the mixture; afteranother 1 h of magnetic stirring, a transparent oil-in-watermicroemulsion was obtained. Then, the polymerization wasinitiated by adding 6 mL of 3 mol·L−1 APS aqueous solu-tion into the above microemulsion droplet within 30 minunder magnetic stirring. The polymerization was allowed toproceed for 4 h under stirring. Finally, the obtained sap-green polyaniline core decorated with TiO2 (PANI-TiO2)nanocomposite powder was filtrated and rinsed with acetoneand water repeatedly and then dried in vacuum at 55◦Cfor 24 h. For comparison, polyaniline nanoparticles werealso prepared under the same condition, but without TiO2
nanoparticles added.
All the experimental procedures proceeded at roomtemperature except the drying of samples.
Journal of Nanomaterials 3
2.3. Characterization. The morphology of nanocompositeswas examined by a JSM-6700F scanning electron micro-scope (SEM) and a JEM-3010 high-resolution transmissionelectron microscope (TEM). Fourier transform infrared(FT-IR) spectra were recorded on a Perkin Elmer Fouriertransform infrared spectrometer. The ultraviolet visible (UV-vis) absorption spectra were recorded on a LabTech UV-240 spectrophotometer. Cyclic voltammetric studies of PANIand nanocomposites were performed by using an Iviumstatelectrochemical working station (Ivium Technologies BV).A one-compartment cell was used with a platinum meshas counter electrode and a saturated calomel electrode(SCE) as reference electrode. The electrolyte was com-posed of 1 mM·L−1 K3Fe(CN)6, 1 mM·L−1 K4Fe(CN)6 and0.2 mol·L−1 NaCl. The scan speed was 0.1 V·s−1, and thepotential range was from −200 mV to 600 mV. A certainvolume of PANI or nanocomposite ethanol solution wasadded dropwise by an injector to the surface of graphitedisk (0.7 cm2). After having been dried in air at roomtemperature, the PANI/graphite or nanocomposite/graphiteelectrode was used as the working electrode.
3. Results and Discussion
3.1. A Possible Reaction Mechanism for PANI-TiO2 Nanocom-posite. Figure 1 shows a supposed model describing a pol-yaniline core decorated with TiO2 (PANI-TiO2) nanocom-posite formation via microemulsion polymerization. Thereare plenty of surface hydroxyl groups on the surface ofTiO2 nanoparticles, which are produced from the adsorbedwater molecules on the surface of TiO2 nanoparticles.The hydrogen bonding interactions between the surfacehydroxyl groups and the ether groups in OP-10 or thehydroxyl groups in n-butanol make it possible to weaken thestrong particles agglomeration of TiO2 and thus to form adispersion of TiO2 nanoparticles. When the above dispersionis added into the (IL+An)/water microemulsion, under thetraction of lipophilic groups of OP-10 and n-butanol, thedispersed TiO2 nanoparticles adsorb onto the surface ofthe microemulsion micelles to form core-shell-type nanomi-celles. Afterwards, the polymerization is initiated by APS,during which some chemical bonds generate between TiO2
and polyaniline chain which are stronger than the hydrogenbonds between the surface of TiO2 and hydrophilic groupsof OP-10 or n-butanol. After the polymerization ends, OP-10, n-butanol and IL can be washed down; finally, thepolyaniline core decorated with TiO2 nanocomposite areprepared.
3.2. FTIR and UV-Vis Spectra of PANI-TiO2 Nanocomposites.The FTIR spectra of anatase TiO2 nanoparticles, PANI,and PANI-TiO2 nanocomposite are shown in Figure 2,respectively. From Figure 2(a), the broad peak from 400 to700 cm−1 is the characteristic band of TiO2. The characteris-tic bands of PANI (Figure 2(b)) are assigned as follows: theband at 3413 cm−1 is attributable to N–H stretching mode;C=N and C=C stretching modes for the quinoid and ben-zenoid rings occur at 1585 cm−1 and 1504 cm−1; the bands atabout 1288 cm−1 and 1244 cm−1 have been attributed to C–
N stretching mode for the benzenoid ring, while the bandat 1101 cm−1 is assigned to an in-plane bending vibrationof C–H (mode of N=Q=N, Q=N+H=B and B–N+H–B),which is formed during protonation [31]. It is evident thatthe FTIR spectrum of the PANI-TiO2 composite shown inFigure 2(c) contains contributions from both anatase TiO2
and PANI. However, some bands of PANI have shifteddue to interactions with anatase TiO2 nanoparticles. Forexample, the bands at 1585 cm−1, 1504 cm−1, and 1288 cm−1,corresponding to the stretching mode of C=N, C=C, and C–N, all shift to lower wavenumbers, and N–H stretching bandat 3413 cm−1 shifts to higher wavenumber. Similarly, theband at 1101 cm−1 also shifts to 1120 cm−1. These changessuggest that C=N, C=C and C–N bands become weaker inPANI-TiO2 nanocomposite, while the N–H band becomesstronger. This is probably because of the action of hydrogenbonding between the surfaces of anatase TiO2 nanoparticlesand the N–H groups in PANI macromolecules. The resultsconfirm that there is strong interaction between the PANIand nanocrystalline TiO2, and the presence of anatase TiO2
nanoparticles prompts the doping of PANI.
The UV-Vis absorption spectra of anatase TiO2, PANIand the PANI-TiO2 composite are shown in Figure 3. Clearly,the resulting PANI-TiO2 composite can strongly absorb notonly the near ultraviolet light but also the visible light,whereas the TiO2 can absorb light with wavelengths below250 nm only. As shown in Figure 3, we can clearly observethe characteristic bands of polyaniline at 366–373 nm and535 nm, which are attributed to π-π∗ transition of benzenoidring, polaron-π∗, respectively [32]. Specifially, the absorp-tion peaks of the PANI-TiO2 nanocomposite at characteristicpeaks of PANI become stronger; moreover, the characteristicabsorption peak at 535 nm becomes unconspicuous becauseof being covered by a new absorption peak at 680 nm invisible region. This result further proves that it is not a simplemixing action between the PANI and nanocrystalline TiO2,and the resulting PANI-TiO2 nanocomposite could have apotential use as photocatalysis material.
3.3. Electrochemical Characteristics of PANI-TiO2 Nanocom-posite. The electrochemical characteristics of different sam-ples were also investigated in relevant electrolyte. Cyclicvoltammograms (CVs) of PANI and PANI-TiO2 nanocom-posite are shown in Figure 4. The reversible CV curves areobserved obviously, which is related to the electrochemicalprobe of Fe(CN)6
4−/Fe(CN)63−. Although both shapes seem
to be similar to each other, the oxidation and reductionpeak current density (3.13 mA·cm−2, −3.45 mA·cm−2) ofthe PANI-TiO2 nanocomposite are higher than those of thePANI (2.30 mA·cm−2, −2.70 mA·cm−2). The better electro-chemical catalytic activity of the PANI-TiO2 nanocompositeshould be attributed to its special structure. When TiO2
nanoparticles are mixed into the RTIL/water microemulsionunder stirring, they assemble at the RTIL/water interface.Moreover, nano-TiO2 exhibits electropositive properties inthe acidic medium. They can attract a lot of anions,namely, nitrate ions, to assemble at the interface of themicroemulsion. The anions are doped into the PANI chains
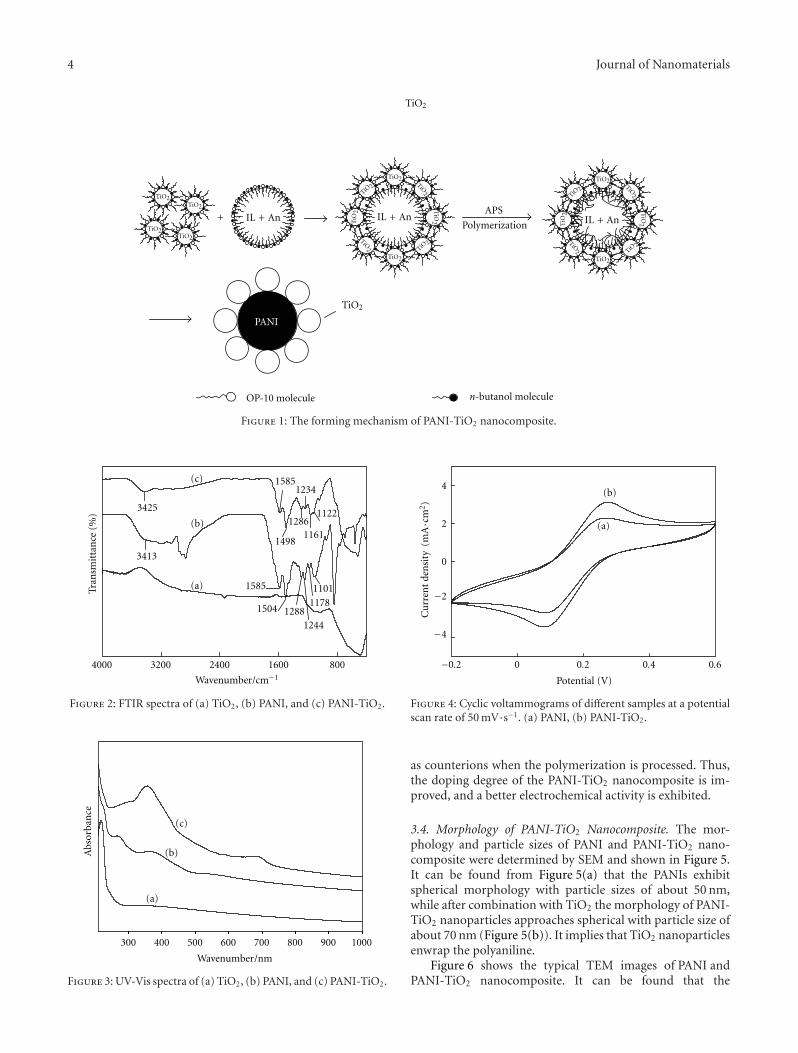
4 Journal of Nanomaterials
TiO2
TiO2
TiO2TiO2
TiO2TiO2
TiO2
TiO2 TiO
2
TiO
2 TiO
2
TiO2 TiO
2
TiO2
TiO2
TiO2 TiO
2
TiO
2 TiO
2
TiO2 TiO
2
IL ++ An IL + An IL + An
PANI
TiO2
Polymerization
APS
OP-10 molecule n-butanol molecule
Figure 1: The forming mechanism of PANI-TiO2 nanocomposite.
4000 3200 2400 1600 800
Tran
smit
tan
ce(%
)
342
3413
1585
1504 12881244
1178
1101
14981161
11221286
1234
15
5
85
Wavenumber/cm−1
(a)
(b)
(c)
Figure 2: FTIR spectra of (a) TiO2, (b) PANI, and (c) PANI-TiO2.
(a)
(b)
(c)
300 400 500 600 700 800 900 1000
Abs
orba
nce
Wavenumber/nm
Figure 3: UV-Vis spectra of (a) TiO2, (b) PANI, and (c) PANI-TiO2.
−0.2 0 0.2 0.4 0.6
4
2
0
−2
−4
(a)
(b)
()
Potential V( )
Cu
rren
tde
nsi
tym
A·cm
2
Figure 4: Cyclic voltammograms of different samples at a potentialscan rate of 50 mV·s−1. (a) PANI, (b) PANI-TiO2.
as counterions when the polymerization is processed. Thus,the doping degree of the PANI-TiO2 nanocomposite is im-proved, and a better electrochemical activity is exhibited.
3.4. Morphology of PANI-TiO2 Nanocomposite. The mor-phology and particle sizes of PANI and PANI-TiO2 nano-composite were determined by SEM and shown in Figure 5.It can be found from Figure 5(a) that the PANIs exhibitspherical morphology with particle sizes of about 50 nm,while after combination with TiO2 the morphology of PANI-TiO2 nanoparticles approaches spherical with particle size ofabout 70 nm (Figure 5(b)). It implies that TiO2 nanoparticlesenwrap the polyaniline.
Figure 6 shows the typical TEM images of PANI andPANI-TiO2 nanocomposite. It can be found that the
Journal of Nanomaterials 5
None SEI 5 kV ×60,000 100 nm WD 7.4 mm
(a)
None SEI 5 kV ×50,000 100 nm WD 8.5 mm
(b)
Figure 5: SEM images of (a) PANI and (b) PANI-TiO2.
100 nm
(a)
100 nm
20 30 40 50 60 70 80
300
250
200
150
100
50
0
2θ (deg)
Inte
nsi
ty(C
PS)
(b)
Figure 6: TEM images of (a) PANI and (b) PANI-TiO2 (The insets are the selected area electron diffraction patterns and the X-ray diffractionpattern of TiO2.)
polyaniline is amorphous in Figure 6(a), which has greatdifference from Figure 6(b). Figure 6(b) gives the TEM imageof the polyaniline core decorated with anatase TiO2 shellnanocomposite. One can find that the polyaniline with amean diameter of about 50 nm is the core of the nano-composite and the TiO2 nanoparticles deposit onto thesurface of the polyaniline, which is different from the re-ported structure of TiO2-PANI nanoparticles that TiO2 iswrapped by polyaniline. The diffraction pattern from theedge of particles of PANI-TiO2 composite in Figure 6(b)suggests that the TiO2 nanoparticles deposited on the surfaceof polyaniline are typical anatase phase, and this agreeswell with the X-ray diffraction result of the separate TiO2
nanoparticle sample.
4. Conclusion
Polyaniline core decorated with TiO2 (PANI-TiO2) nano-composite has been successfully prepared in IL/watermicroemulsion in the presence of nanocrystalline TiO2 par-ticles. TiO2 nanoparticles dispersed on the (IL + An)/waterinterface could deposit uniformly onto the surface of PANI.It is confirmed that the diameter of the resulted PANI-TiO2
nanoparticles is about 70 nm, and the interactions betweentwo components are strong. FTIR and UV-Vis spect-ra indicate that polyaniline and nano-TiO2 particles arenot simply blended or mixed up, while the strong inter-actions which exist at the interface of polyaniline macro-molecules and nano-TiO2 particles need further investi-gations in the future. CV curves show that the PANI-
6 Journal of Nanomaterials
TiO2 nanocomposite has better electrochemical catalytic act-ivity than PANI.
Therefore, it can be expected that PANI-TiO2 nanocom-posite should be useful in photocatalysis and electrical andelectrochemical fields. Furthermore, this method is simpleand environmentally friendly and has a great potential forthe commercialization of the technology.
Acknowledgment
This work is financially supported by the Hunan Provin-cial Natural Science Foundation of China (no. 11JJ3015,11JJ1009).
References
[1] L. Shi, X. Wang, L. Lu, X. Yang, and X. Wu, “Preparation ofTiO2/polyaniline nanocomposite from a lyotropic liquid crys-talline solution,” Synthetic Metals, vol. 159, no. 23-24, pp.2525–2529, 2009.
[2] J. Liu, E. N. Kadnikova, Y. Liu, M. D. McGehee, and J. M. J.Frechet, “Polythiophene containing thermally removable sol-ubilizing groups enhances the interface and the performanceof polymer-titania hybrid solar cells,” Journal of the AmericanChemical Society, vol. 126, no. 31, pp. 9486–9487, 2004.
[3] N. Sakai, G. K. Prasad, Y. Ebina, K. Takada, and T. Sas-aki, “Layer-by-layer assembled TiO2 nanoparticle/PEDOT-PSS composite films for switching of electric conductivity inresponse to ultraviolet and visible light,” Chemistry of Mate-rials, vol. 18, no. 16, pp. 3596–3598, 2006.
[4] D. Chowdhury, A. Paul, and A. Chattopadhyay, “Photocat-alytic polypyrrole-TiO2-nanoparticles composite thin filmgenerated at the air-water interface,” Langmuir, vol. 21, no. 9,pp. 4123–4128, 2005.
[5] S. Sun, C. B. Murray, D. Weller, L. Folks, and A. Moser,“Monodisperse FePt nanoparticles and ferromagnetic FePtnanocrystal superlattices,” Science, vol. 287, no. 5460, pp.1989–1992, 2000.
[6] J. Huang, S. Virji, B. H. Weiller, and R. B. Kaner, “Polyanilinenanofibers: facile synthesis and chemical sensors,” Journal ofthe American Chemical Society, vol. 125, no. 2, pp. 314–315,2003.
[7] J. Du, Z. Liu, B. Han, Z. Li, J. Zhang, and Y. Huang, “One-pot synthesis of the macroporous polyaniline microspheresand Ag/polyaniline core-shell particles,” Microporous andMesoporous Materials, vol. 84, no. 1–3, pp. 254–260, 2005.
[8] T. Lei, “Preparation of novel core-shell nanoparticles byelectrochemical synthesis,” Transactions of Nonferrous MetalsSociety of China, vol. 17, no. 6, pp. 1343–1346, 2007.
[9] F. Y. Chuang and S. M. Yang, “Cerium dioxide/polyanilinecore-shell nanocomposites,” Journal of Colloid and InterfaceScience, vol. 320, no. 1, pp. 194–201, 2008.
[10] S. Y. Jing, S. X. Xing, L. X. Yu, and Y. Wu, “Synthesis andcharacterization of Ag/polyaniline core–shell nanocompositesbased on silver nanoparticles colloid,” Materials Letters, vol.61, no. 13, pp. 2794–2797, 2007.
[11] Y. Yu, B. Che, Z. Si, L. Li, W. Chen, and G. Xue, “Carbonnanotube/polyaniline core-shell nanowires prepared by in situinverse microemulsion,” Synthetic Metals, vol. 150, no. 3, pp.271–277, 2005.
[12] N. Asim, S. Radiman, and M. A. B. Yarmo, “Preparation andcharacterization of core-shell polyaniline/V2O5 nanocompos-
ite via microemulsion method,” Materials Letters, vol. 62, no.6-7, pp. 1044–1047, 2008.
[13] Z. Yanqing, S. Erwei, C. Zhizhan, L. Wenjun, and H. Xingfang,“Influence of solution concentration on the hydrothermalpreparation of titania crystallites,” Journal of Materials Chem-istry, vol. 11, no. 5, pp. 1547–1551, 2001.
[14] M. Ferroni, V. Guidi, G. Martinelli, G. Faglia, P. Nelli, and G.Sberveglieri, “Characterization of a nanosized TiO2 gas sen-sor,” Nanostructured Materials, vol. 7, no. 7, pp. 709–718, 1996.
[15] D. M. Blake, J. Webb, C. Turchi, and K. Magrini, “Kineticand mechanistic overview of TiO2-photocatalyzed oxidationreactions in aqueous solution,” Solar Energy Materials, vol. 24,no. 1–4, pp. 584–593, 1991.
[16] J. Karch, R. Birringer, and H. Gleiter, “Ceramics ductile at lowtemperature,” Nature, vol. 330, no. 6148, pp. 556–558, 1987.
[17] L. Zhang, M. Wan, and Y. Wei, “Polyaniline/TiO2 micros-pheres prepared by a template-free method,” Synthetic Metals,vol. 151, no. 1, pp. 1–5, 2005.
[18] X. W. Li, G. H. Wang, X. X. Li, and D. M. Lu, “Surface prop-erties of polyaniline/nano-TiO2 composites,” Applied SurfaceScience, vol. 229, no. 1, pp. 395–401, 2004.
[19] B. Xia, H. Huang, and Y. Xie, “Heat treatment on TiO2 nano-particles prepared by vapor-phase hydrolysis,” Materials Sci-ence and Engineering B, vol. 57, no. 2, pp. 150–154, 1999.
[20] K. R. Seddon, A. Stark, and M. J. Torres, “Influence of chloride,water, and organic solvents on the physical properties of ionicliquids,” Pure and Applied Chemistry, vol. 72, no. 12, pp. 2275–2287, 2000.
[21] P. C. Innis, J. Mazurkiewicz, T. Nguyen, G. G. Wallace, and D.MacFarlane, “Enhanced electrochemical stability of polyani-line in ionic liquids,” Current Applied Physics, vol. 4, no. 2–4,pp. 389–393, 2004.
[22] H. Gao, T. Jiang, B. Han et al., “Aqueous/ionic liquid interfa-cial polymerization for preparing polyaniline nanoparticles,”Polymer, vol. 45, no. 9, pp. 3017–3019, 2004.
[23] Y. Xing, M. Li, S. A. Davis, and S. Mann, “Synthesis and char-acterization of cerium phosphate nanowires in microemulsionreaction media,” Journal of Physical Chemistry B, vol. 110, no.3, pp. 1111–1113, 2006.
[24] Y. Gao, S. Han, B. Han et al., “TX-100/water/1-butyl-3-meth-ylimidazolium hexafluorophosphate microemulsions,” Lang-muir, vol. 21, no. 13, pp. 5681–5684, 2005.
[25] N. Li, Y. Gao, L. Zheng, J. Zhang, L. Yu, and X. Li, “Studies onthe micropolarities of bmimBF4/TX-100/toluene ionic liquidmicroemulsions and their behaviors characterized by UV-visible spectroscopy,” Langmuir, vol. 23, no. 3, pp. 1091–1097,2007.
[26] C. Fu, H. Zhou, W. Peng, J. Chen, and Y. Kuang, “Comparisonof electrodeposition of silver in ionic liquid microemulsions,”Electrochemistry Communications, vol. 10, no. 5, pp. 806–809,2008.
[27] Z. Zhou, D. He, X. Li, X. Li, L. Zhang, and G. Li, “Themicro-emulsion synthesis of polyaniline in ionic liquid/watersystem,” Acta Polymerica Sinica, no. 8, pp. 757–760, 2007.
[28] Z. Zhou, D. He, X. Li, S. Wang, and G. Li, “Preparationand properties of polyaniline codoped with ionic liquid anddodecyl benzene sulfonic acid or hydrochloric acid,” PolymerScience, Series B, vol. 50, no. 7, pp. 209–214, 2008.
[29] J. F. Zhong, D. L. He, Z. Zhou, and Y. B. Xu, “Electrochemicaloxidation behavior of hydroxypivalaldehyde in the ionicliquids,” Chinese Chemical Letters, vol. 19, no. 3, pp. 319–323,2008.
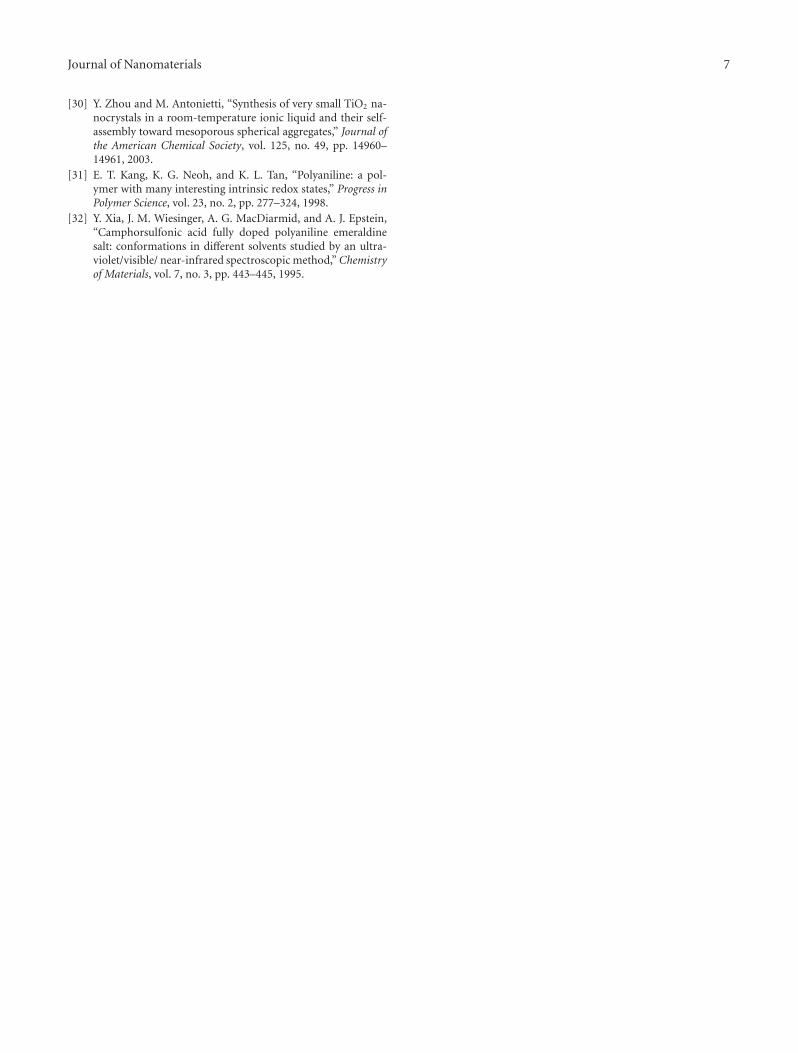
Journal of Nanomaterials 7
[30] Y. Zhou and M. Antonietti, “Synthesis of very small TiO2 na-nocrystals in a room-temperature ionic liquid and their self-assembly toward mesoporous spherical aggregates,” Journal ofthe American Chemical Society, vol. 125, no. 49, pp. 14960–14961, 2003.
[31] E. T. Kang, K. G. Neoh, and K. L. Tan, “Polyaniline: a pol-ymer with many interesting intrinsic redox states,” Progress inPolymer Science, vol. 23, no. 2, pp. 277–324, 1998.
[32] Y. Xia, J. M. Wiesinger, A. G. MacDiarmid, and A. J. Epstein,“Camphorsulfonic acid fully doped polyaniline emeraldinesalt: conformations in different solvents studied by an ultra-violet/visible/ near-infrared spectroscopic method,” Chemistryof Materials, vol. 7, no. 3, pp. 443–445, 1995.
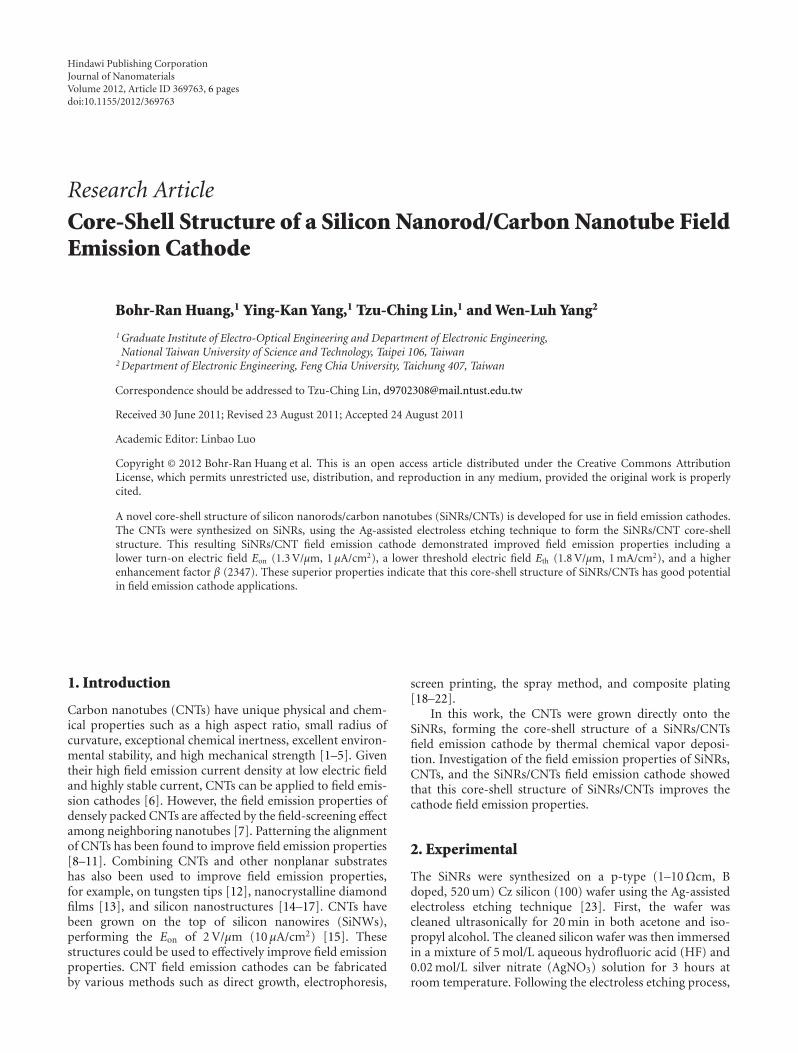
Hindawi Publishing CorporationJournal of NanomaterialsVolume 2012, Article ID 369763, 6 pagesdoi:10.1155/2012/369763
Research Article
Core-Shell Structure of a Silicon Nanorod/Carbon Nanotube FieldEmission Cathode
Bohr-Ran Huang,1 Ying-Kan Yang,1 Tzu-Ching Lin,1 and Wen-Luh Yang2
1 Graduate Institute of Electro-Optical Engineering and Department of Electronic Engineering,National Taiwan University of Science and Technology, Taipei 106, Taiwan
2 Department of Electronic Engineering, Feng Chia University, Taichung 407, Taiwan
Correspondence should be addressed to Tzu-Ching Lin, [email protected]
Received 30 June 2011; Revised 23 August 2011; Accepted 24 August 2011
Academic Editor: Linbao Luo
Copyright © 2012 Bohr-Ran Huang et al. This is an open access article distributed under the Creative Commons AttributionLicense, which permits unrestricted use, distribution, and reproduction in any medium, provided the original work is properlycited.
A novel core-shell structure of silicon nanorods/carbon nanotubes (SiNRs/CNTs) is developed for use in field emission cathodes.The CNTs were synthesized on SiNRs, using the Ag-assisted electroless etching technique to form the SiNRs/CNT core-shellstructure. This resulting SiNRs/CNT field emission cathode demonstrated improved field emission properties including alower turn-on electric field Eon (1.3 V/μm, 1 μA/cm2), a lower threshold electric field Eth (1.8 V/μm, 1 mA/cm2), and a higherenhancement factor β (2347). These superior properties indicate that this core-shell structure of SiNRs/CNTs has good potentialin field emission cathode applications.
1. Introduction
Carbon nanotubes (CNTs) have unique physical and chem-ical properties such as a high aspect ratio, small radius ofcurvature, exceptional chemical inertness, excellent environ-mental stability, and high mechanical strength [1–5]. Giventheir high field emission current density at low electric fieldand highly stable current, CNTs can be applied to field emis-sion cathodes [6]. However, the field emission properties ofdensely packed CNTs are affected by the field-screening effectamong neighboring nanotubes [7]. Patterning the alignmentof CNTs has been found to improve field emission properties[8–11]. Combining CNTs and other nonplanar substrateshas also been used to improve field emission properties,for example, on tungsten tips [12], nanocrystalline diamondfilms [13], and silicon nanostructures [14–17]. CNTs havebeen grown on the top of silicon nanowires (SiNWs),performing the Eon of 2 V/μm (10 μA/cm2) [15]. Thesestructures could be used to effectively improve field emissionproperties. CNT field emission cathodes can be fabricatedby various methods such as direct growth, electrophoresis,
screen printing, the spray method, and composite plating[18–22].
In this work, the CNTs were grown directly onto theSiNRs, forming the core-shell structure of a SiNRs/CNTsfield emission cathode by thermal chemical vapor deposi-tion. Investigation of the field emission properties of SiNRs,CNTs, and the SiNRs/CNTs field emission cathode showedthat this core-shell structure of SiNRs/CNTs improves thecathode field emission properties.
2. Experimental
The SiNRs were synthesized on a p-type (1–10Ωcm, Bdoped, 520 um) Cz silicon (100) wafer using the Ag-assistedelectroless etching technique [23]. First, the wafer wascleaned ultrasonically for 20 min in both acetone and iso-propyl alcohol. The cleaned silicon wafer was then immersedin a mixture of 5 mol/L aqueous hydrofluoric acid (HF) and0.02 mol/L silver nitrate (AgNO3) solution for 3 hours atroom temperature. Following the electroless etching process,
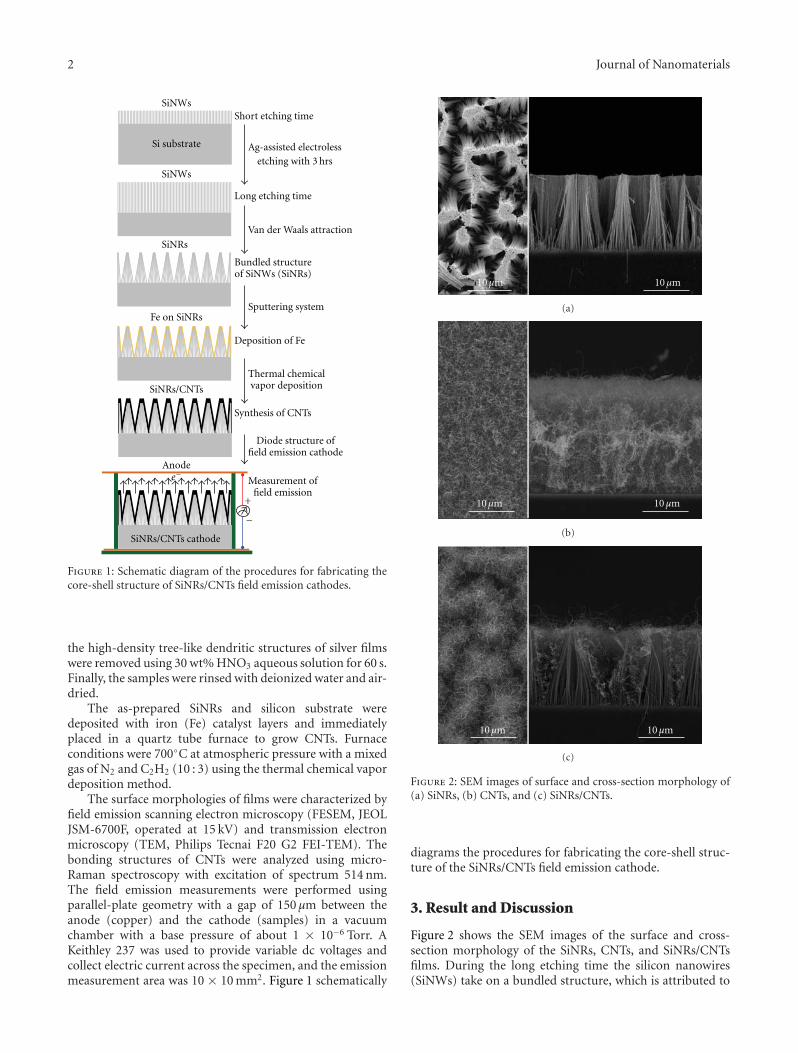
2 Journal of Nanomaterials
SiNWs
SiNWs
Si substrate
Short etching time
Ag-assisted electrolessetching with 3 hrs
Long etching time
Bundled structureof SiNWs (SiNRs)
Sputtering system
Deposition of Fe
Thermal chemicalvapor deposition
Synthesis of CNTs
Diode structure offield emission cathode
Measurement offield emission
Fe on SiNRs
SiNRs/CNTs
SiNRs
SiNRs/CNTs cathode
Anodee−
−+
Van der Waals attraction
Figure 1: Schematic diagram of the procedures for fabricating thecore-shell structure of SiNRs/CNTs field emission cathodes.
the high-density tree-like dendritic structures of silver filmswere removed using 30 wt% HNO3 aqueous solution for 60 s.Finally, the samples were rinsed with deionized water and air-dried.
The as-prepared SiNRs and silicon substrate weredeposited with iron (Fe) catalyst layers and immediatelyplaced in a quartz tube furnace to grow CNTs. Furnaceconditions were 700◦C at atmospheric pressure with a mixedgas of N2 and C2H2 (10 : 3) using the thermal chemical vapordeposition method.
The surface morphologies of films were characterized byfield emission scanning electron microscopy (FESEM, JEOLJSM-6700F, operated at 15 kV) and transmission electronmicroscopy (TEM, Philips Tecnai F20 G2 FEI-TEM). Thebonding structures of CNTs were analyzed using micro-Raman spectroscopy with excitation of spectrum 514 nm.The field emission measurements were performed usingparallel-plate geometry with a gap of 150 μm between theanode (copper) and the cathode (samples) in a vacuumchamber with a base pressure of about 1 × 10⁻⁶ Torr. AKeithley 237 was used to provide variable dc voltages andcollect electric current across the specimen, and the emissionmeasurement area was 10 × 10 mm2. Figure 1 schematically
10μm10μm
(a)
10μm10μm
(b)
10μm10μm
(c)
Figure 2: SEM images of surface and cross-section morphology of(a) SiNRs, (b) CNTs, and (c) SiNRs/CNTs.
diagrams the procedures for fabricating the core-shell struc-ture of the SiNRs/CNTs field emission cathode.
3. Result and Discussion
Figure 2 shows the SEM images of the surface and cross-section morphology of the SiNRs, CNTs, and SiNRs/CNTsfilms. During the long etching time the silicon nanowires(SiNWs) take on a bundled structure, which is attributed to
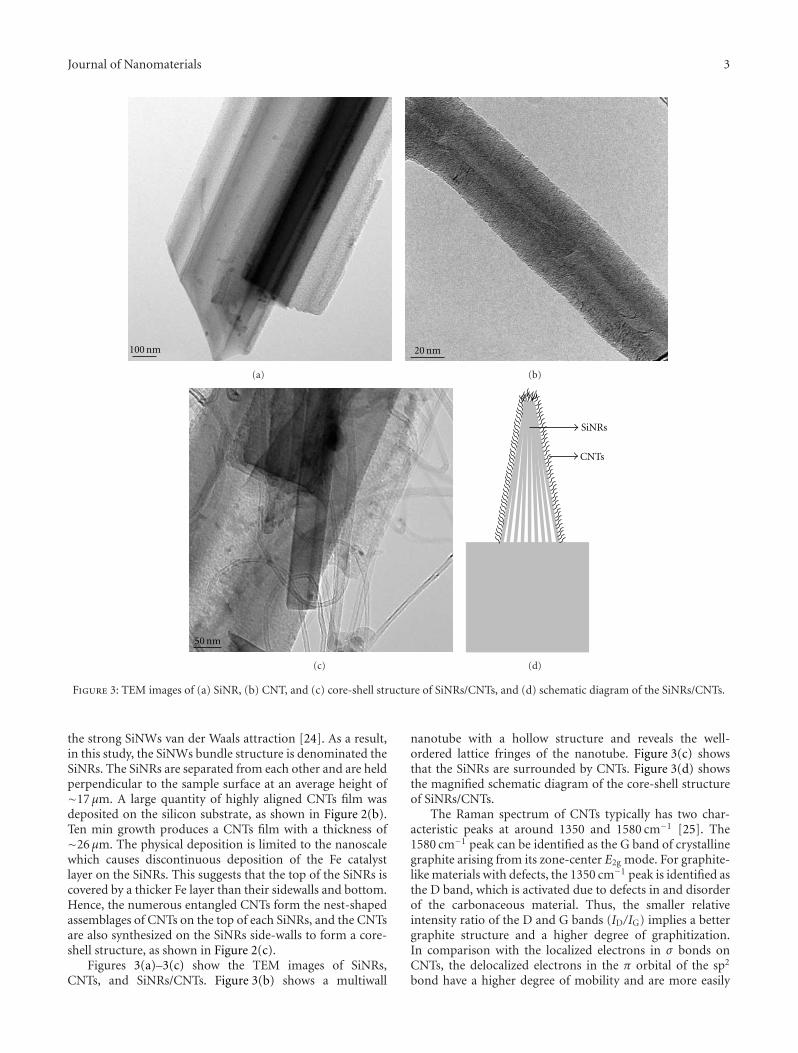
Journal of Nanomaterials 3
100 nm
(a)
20 nm
(b)
50 nm
(c)
SiNRs
CNTs
(d)
Figure 3: TEM images of (a) SiNR, (b) CNT, and (c) core-shell structure of SiNRs/CNTs, and (d) schematic diagram of the SiNRs/CNTs.
the strong SiNWs van der Waals attraction [24]. As a result,in this study, the SiNWs bundle structure is denominated theSiNRs. The SiNRs are separated from each other and are heldperpendicular to the sample surface at an average height of∼17 μm. A large quantity of highly aligned CNTs film wasdeposited on the silicon substrate, as shown in Figure 2(b).Ten min growth produces a CNTs film with a thickness of∼26 μm. The physical deposition is limited to the nanoscalewhich causes discontinuous deposition of the Fe catalystlayer on the SiNRs. This suggests that the top of the SiNRs iscovered by a thicker Fe layer than their sidewalls and bottom.Hence, the numerous entangled CNTs form the nest-shapedassemblages of CNTs on the top of each SiNRs, and the CNTsare also synthesized on the SiNRs side-walls to form a core-shell structure, as shown in Figure 2(c).
Figures 3(a)–3(c) show the TEM images of SiNRs,CNTs, and SiNRs/CNTs. Figure 3(b) shows a multiwall
nanotube with a hollow structure and reveals the well-ordered lattice fringes of the nanotube. Figure 3(c) showsthat the SiNRs are surrounded by CNTs. Figure 3(d) showsthe magnified schematic diagram of the core-shell structureof SiNRs/CNTs.
The Raman spectrum of CNTs typically has two char-acteristic peaks at around 1350 and 1580 cm−1 [25]. The1580 cm−1 peak can be identified as the G band of crystallinegraphite arising from its zone-center E2g mode. For graphite-like materials with defects, the 1350 cm−1 peak is identified asthe D band, which is activated due to defects in and disorderof the carbonaceous material. Thus, the smaller relativeintensity ratio of the D and G bands (ID/IG) implies a bettergraphite structure and a higher degree of graphitization.In comparison with the localized electrons in σ bonds onCNTs, the delocalized electrons in the π orbital of the sp2
bond have a higher degree of mobility and are more easily
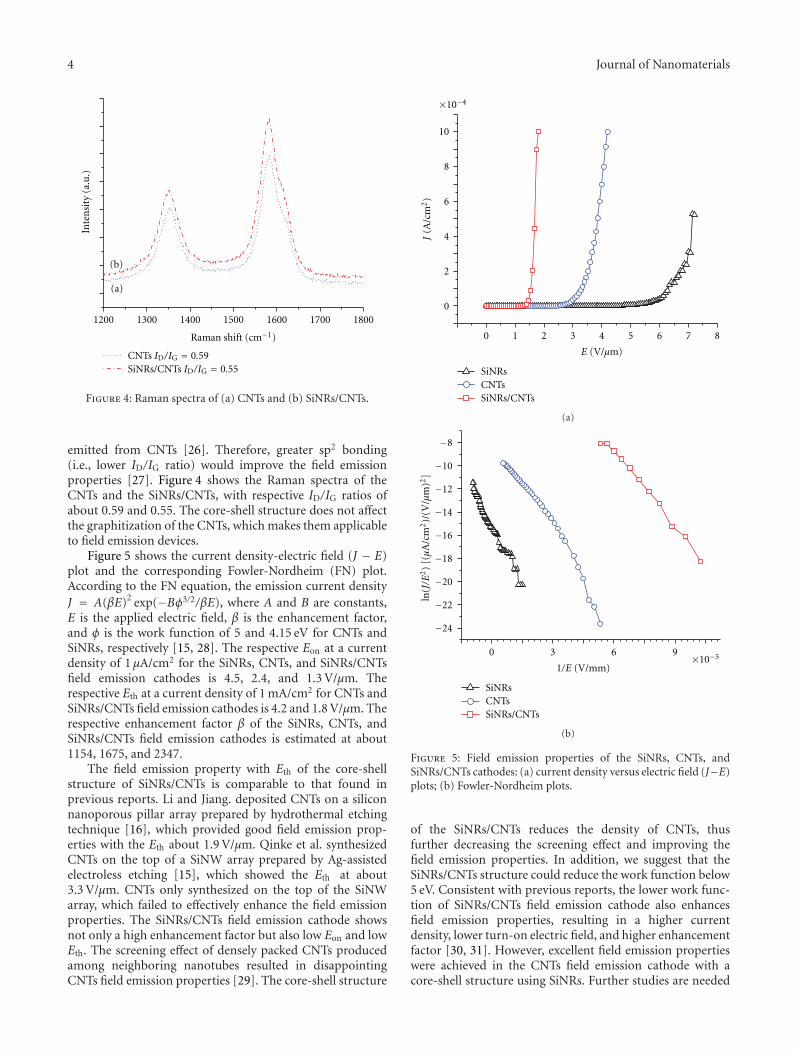
4 Journal of Nanomaterials
1200 1300 1400 1500 1600 1700 1800
Inte
nsi
ty(a
.u.)
(b)
(a)
Raman shift (cm−1)
CNTs ID/IG = 0.59SiNRs/CNTs ID/IG = 0.55
Figure 4: Raman spectra of (a) CNTs and (b) SiNRs/CNTs.
emitted from CNTs [26]. Therefore, greater sp2 bonding(i.e., lower ID/IG ratio) would improve the field emissionproperties [27]. Figure 4 shows the Raman spectra of theCNTs and the SiNRs/CNTs, with respective ID/IG ratios ofabout 0.59 and 0.55. The core-shell structure does not affectthe graphitization of the CNTs, which makes them applicableto field emission devices.
Figure 5 shows the current density-electric field (J − E)plot and the corresponding Fowler-Nordheim (FN) plot.According to the FN equation, the emission current densityJ = A(βE)2 exp(−Bφ3/2/βE), where A and B are constants,E is the applied electric field, β is the enhancement factor,and φ is the work function of 5 and 4.15 eV for CNTs andSiNRs, respectively [15, 28]. The respective Eon at a currentdensity of 1 μA/cm2 for the SiNRs, CNTs, and SiNRs/CNTsfield emission cathodes is 4.5, 2.4, and 1.3 V/μm. Therespective Eth at a current density of 1 mA/cm2 for CNTs andSiNRs/CNTs field emission cathodes is 4.2 and 1.8 V/μm. Therespective enhancement factor β of the SiNRs, CNTs, andSiNRs/CNTs field emission cathodes is estimated at about1154, 1675, and 2347.
The field emission property with Eth of the core-shellstructure of SiNRs/CNTs is comparable to that found inprevious reports. Li and Jiang. deposited CNTs on a siliconnanoporous pillar array prepared by hydrothermal etchingtechnique [16], which provided good field emission prop-erties with the Eth about 1.9 V/μm. Qinke et al. synthesizedCNTs on the top of a SiNW array prepared by Ag-assistedelectroless etching [15], which showed the Eth at about3.3 V/μm. CNTs only synthesized on the top of the SiNWarray, which failed to effectively enhance the field emissionproperties. The SiNRs/CNTs field emission cathode showsnot only a high enhancement factor but also low Eon and lowEth. The screening effect of densely packed CNTs producedamong neighboring nanotubes resulted in disappointingCNTs field emission properties [29]. The core-shell structure
0 1 2 3 4 5 6 7 8
0
2
4
6
8
10
J(A
/cm
2)
E (V/μm)
SiNRs
×10−4
CNTsSiNRs/CNTs
(a)
SiNRs
×10−50 3 6 9
−24
−22
−20
−18
−16
−14
−12
−10
−8
ln(J/E
2)
[(μ
A/c
m2)/
(V/μ
m)2
]
1/E (V/mm)
CNTsSiNRs/CNTs
(b)
Figure 5: Field emission properties of the SiNRs, CNTs, andSiNRs/CNTs cathodes: (a) current density versus electric field (J−E)plots; (b) Fowler-Nordheim plots.
of the SiNRs/CNTs reduces the density of CNTs, thusfurther decreasing the screening effect and improving thefield emission properties. In addition, we suggest that theSiNRs/CNTs structure could reduce the work function below5 eV. Consistent with previous reports, the lower work func-tion of SiNRs/CNTs field emission cathode also enhancesfield emission properties, resulting in a higher currentdensity, lower turn-on electric field, and higher enhancementfactor [30, 31]. However, excellent field emission propertieswere achieved in the CNTs field emission cathode with acore-shell structure using SiNRs. Further studies are needed
Journal of Nanomaterials 5
to determine the optimum SiNRs diameter and CNTs filmthickness for the core-shell structure of SiNRs/CNTs cathodeto promote field emission properties.
4. Conclusion
We developed a novel core-shell structure of SiNRs/CNTs forfield emission cathodes, effectively improving field emissionproperties including an Eon of 1.3 V/μm, Eth of 1.8 V/μm,and β of 2347. These improvements were attributed tothe SiNRs/CNTs core-shell structure reducing the screeningeffect and work function. These results indicate that thecore-shell structure of SiNRs/CNTs might be suitable forimproved cathode of field emission displays.
Acknowledgment
This work was supported by the National Science Council ofTaiwan under Grant no. 99-2221-E-011-065.
References
[1] S. Iijima, “Helical microtubules of graphitic carbon,” Nature,vol. 354, no. 6348, pp. 56–58, 1991.
[2] B. I. Yakobson, C. J. Brabec, and J. Bernholc, “Nanomechanicsof carbon tubes: instabilities beyond linear response,” PhysicalReview Letters, vol. 76, no. 14, pp. 2511–2514, 1996.
[3] K. H. An, S. Y. Jeong, H. R. Hwang, and Y. H. Lee, “Enhancedsensitivity of a gas sensor incorporating single-walled carbonnanotube-polypyrrole nanocomposites,” Advanced Materials,vol. 16, no. 12, pp. 1005–1009, 2004.
[4] H. Usui, H. Matsui, N. Tanabe, and S. Yanagida, “Improveddye-sensitized solar cells using ionic nanocomposite gelelectrolytes,” Journal of Photochemistry and Photobiology A,vol. 164, no. 1-3, pp. 97–101, 2004.
[5] W. A. De Heer, A. Chatelain, and D. Ugarte, “A carbonnanotube field-emission electron source,” Science, vol. 270, no.5239, pp. 1179–1180, 1995.
[6] Y. Liu and S. Fan, “Field emission properties of carbonnanotubes grown on silicon nanowire arrays,” Solid StateCommunications, vol. 133, no. 2, pp. 131–134, 2005.
[7] L. Nilsson, O. Groening, C. Emmenegger et al., “Scanningfield emission from patterned carbon nanotube films,” AppliedPhysics Letters, vol. 76, no. 15, pp. 2071–2073, 2000.
[8] H. J. Jeong, S. C. Lim, K. S. Kim, and Y. H. Lee, “Edge effecton the field emission properties from vertically aligned carbonnanotube arrays,” Carbon, vol. 42, no. 14, pp. 3036–3039,2004.
[9] J. S. Suh, K. S. Jeong, J. S. Lee, and I. Han, “Study of the field-screening effect of highly ordered carbon nanotube arrays,”Applied Physics Letters, vol. 80, no. 13, p. 2392, 2002.
[10] R. C. Smith and S. R. P. Silva, “Maximizing the electron fieldemission performance of carbon nanotube arrays,” AppliedPhysics Letters, vol. 94, no. 13, Article ID 133104, 3 pages, 2009.
[11] S. H. Jo, Y. Tu, Z. P. Huang, D. L. Carnahan, D. Z. Wang, andZ. F. Ren, “Effect of length and spacing of vertically alignedcarbon nanotubes on field emission properties,” AppliedPhysics Letters, vol. 82, no. 20, pp. 3520–3522, 2003.
[12] P. N. Hong, B. H. Thang, N. T. Hong, S. Lee, and P. N. Minh,“Electron field emission characteristics of carbon nanotube on
tungsten tip,” Journal of Physics: Conference Series, vol. 187, no.1, 5 pages, 2009.
[13] K. J. Liao, W. L. Wang, C. Z. Cai, J. W. Lu, and C. G.Hu, “Investigation on field electron emission from carbonnanotubes on nanocrystalline diamond films,” Journal ofMetastable and Nanocrystalline Materials, vol. 23, pp. 35–38,2005.
[14] K. Matsumoto, S. Kinosita, Y. Gotoh, T. Uchiyama, S. Manalis,and C. Quate, “Ultralow biased field emitter using single-wallcarbon nanotube directly grown onto silicon tip by thermalchemical vapor deposition,” Applied Physics Letters, vol. 78, no.4, pp. 539–540, 2001.
[15] S. Qinke, J. Wei, K. Wang et al., “Fabrication and field emissionproperties of multi-walled carbon nanotube/silicon nanowirearray,” Journal of Physics and Chemistry of Solids, vol. 71, no. 4,pp. 708–711, 2010.
[16] X. J. Li and W. F. Jiang, “Enhanced field emission from a nestarray of multi-walled carbon nanotubes grown on a siliconnanoporous pillar array,” Nanotechnology, vol. 18, no. 6, 5pages, 2007.
[17] J. Li, W. Lei, X. Zhang, B. Wang, and L. Ba, “Field emissionof vertically-aligned carbon nanotube arrays grown on poroussilicon substrate,” Solid-State Electronics, vol. 48, no. 12, pp.2147–2151, 2004.
[18] Z. W. Pan, S. S. Xie, B. H. Chang, L. F. Sun, W. Y. Zhou, and G.Wang, “Direct growth of aligned open carbon nanotubes bychemical vapor deposition,” Chemical Physics Letters, vol. 299,no. 1, pp. 97–102, 1999.
[19] A. R. Boccaccini, J. Cho, J. A. Roether, B. J. C. Thomas, E.Jane Minay, and M. S. P. Shaffer, “Electrophoretic depositionof carbon nanotubes,” Carbon, vol. 44, no. 15, pp. 3149–3160,2006.
[20] Y. S. Shi, C. C. Zhu, W. Qikun, and L. Xin, “Large area screen-printing cathode of CNT for FED,” Diamond and RelatedMaterials, vol. 12, no. 9, pp. 1449–1452, 2003.
[21] Y. D. Lee, K. S. Lee, Y. H. Lee, and B. K. Ju, “Field emissionproperties of carbon nanotube film using a spray method,”Applied Surface Science, vol. 254, no. 2, pp. 513–516, 2007.
[22] B. R. Huang, T. C. Lin, Y. K. Yang, and S. D. Tzeng, “Thestability of the CNT/Ni field emission cathode fabricatedby the composite plating method,” Diamond and RelatedMaterials, vol. 19, no. 2-3, pp. 158–161, 2010.
[23] T. Qiu and P. K. Chu, “Self-selective electroless plating: anapproach for fabrication of functional 1D nanomaterials,”Materials Science and Engineering R, vol. 61, no. 1-6, pp. 59–77, 2008.
[24] K. Zhu, T. B. Vinzant, N. R. Neale, and A. J. Frank, “Removingstructural disorder from oriented TiO2 nanotube arrays:reducing the dimensionality of transport and recombinationin dye-sensitized solar cells,” Nano Letters, vol. 7, no. 12, pp.3739–3746, 2007.
[25] M. S. Dresselhaus, G. Dresselhaus, and P. H. Avouris, CarbonNanotubes: Synthesis, Properties and Applications, vol. 80 ofSpringer Series in Topics in Applied Physics, Springer, Berlin,Germany, 2001.
[26] S. Han and J. Ihm, “Role of the localized states in field emissionof carbon nanotubes,” Physical Review B, vol. 61, no. 15, pp.9986–9989, 2000.
[27] K. F. Chen, K. C. Chen, Y. C. Jiang et al., “Field emission imageuniformity improvement by laser treating carbon nanotubepowders,” Applied Physics Letters, vol. 88, no. 19, Article ID193127, 3 pages, 2006.
6 Journal of Nanomaterials
[28] F. Zhao, D. D. Zhao, S. L. Wu, G. A. Cheng, and R. T.Zheng, “Fabrication and electron field emission of siliconnanowires synthesized by chemical etching,” Journal of theKorean Physical Society, vol. 55, no. 6, pp. 2681–2684, 2009.
[29] L. Nilsson, O. Groening, C. Emmenegger et al., “Scanningfield emission from patterned carbon nanotube films,” AppliedPhysics Letters, vol. 76, no. 15, pp. 2071–2073, 2000.
[30] Z. S. Hu, F. Y. Hung, S. J. Chang et al., “Nanostructuralcharacteristics of oxide-cap GaN nanotips by iodine-galliumions etching,” Journal of Alloys and Compounds, vol. 509, no. 5,pp. 2360–2363, 2011.
[31] Y. F. Tzeng, Y. C. Lee, C. Y. Lee, H. T. Chiu, and I. N.Lin, “Electron field emission properties on UNCD coated Si-nanowires,” Diamond and Related Materials, vol. 17, no. 4-5,pp. 753–757, 2008.
Hindawi Publishing CorporationJournal of NanomaterialsVolume 2012, Article ID 905178, 5 pagesdoi:10.1155/2012/905178
Research Article
Freestanding Ge/GeO2 Core-Shell Nanocrystals withVarying Sizes and Shell Thicknesses: Microstructure andPhotoluminescence Studies
P. K. Giri1, 2 and Soumen Dhara1
1 Department of Physics, Indian Institute of Technology Guwahati, Guwahati 781039, India2 Centre for Nanotechnology, Indian Institute of Technology Guwahati, Guwahati 781039, India
Correspondence should be addressed to P. K. Giri, pravat [email protected]
Received 31 May 2011; Accepted 30 June 2011
Academic Editor: Linbao Luo
Copyright © 2012 P. K. Giri and S. Dhara. This is an open access article distributed under the Creative Commons AttributionLicense, which permits unrestricted use, distribution, and reproduction in any medium, provided the original work is properlycited.
Freestanding Ge/GeO2 core-shell nanocrystals (NCs) with varying sizes and shell thicknesses were synthesized by a ball millingmethod. The core-shell NCs consist of single crystalline Ge core and crystalline GeO2 shell. With increasing milling time, sizes ofthe NCs decrease while GeO2 shell layer thicknesses increase. After 30 hours of milling, size of the core-shell NCs goes down to11 nm. Analysis of high-resolution transmission electron microscope images revealed the presence of strain in the NCs and latticedistortion/dislocations in the Ge core near the interface of Ge core and GeO2 shell. This induced a strong phonon localizationeffect as evident from Raman studies and leads to enhanced radiative recombination, resulting in intense photoluminescence.Strong photoluminescence peaks in the visible and UV region were observed from all the samples and are attributed to Ge/GeO2
interface defect states. Optical Raman scattering studies confirm the formation of strained Ge/GeO2 core-shell NCs with varyingthicknesses.
1. Introduction
Nanocrystals (NCs) of indirect-gap semiconductors like Siand Ge are widely studied as they open new possibilitiesfor applications as a building block in the optoelectronicsand microelectronics [1–3]. As the exciton Bohr radius ofGe (24.3 nm) [4] is much larger than Si (4.9 nm) [5], thequantum confinement effect and hence the enhancement ofbandgap are more prominent in Ge NCs. The optical prop-erties, for example, photoluminescence (PL) in the UV-Visregion from of the isolated Ge NCs or Ge NCs embedded inSiO2 matrix or Ge/GeO2 core-shell NCs have been reportedearlier [2, 6–10]. It is found that light emission is moreprominent in the case of Ge/GeO2 core-shell NCs. The lightemission mechanism has been explained on the basis ofradiative recombination via Ge quantum confined or due tointerface defects at the nanocrystal/matrix or in the matrixitself. The role of interface in both passivating nonradiativestates and in the formation of radiative states is also reported
to be quite significant. Now it is generally accepted that bothlocalized defect states at the interface and quantum confine-ment of excitons due to size reduction have combined contri-butions toward UV-Vis PL from Ge NCs/GeO2 core-shellsystem. It is difficult to isolate the relative contributions ofinterfacial defects and size, as the interfacial defect-relat-ed PL itself depends on size [11, 12]. In most of the stud-ies the Ge or Ge/GeO2 NCs were synthesized by high temper-ature annealing. Such high temperature processing is notcompatible for the fabrication of electronic devices andalso it can degrade the device performance. Recently, Tsaiet al. [13] synthesized Ge NCs embedded in GeOx filmat low temperature without postannealing by using CO2
laser-assisted chemical vapour deposition technique andstudied its microstructure and light emission property. Herewe synthesized isolated freestanding Ge/GeO2 core-shellNCs with varying shell thicknesses by employing simplemechanical ball milling. Microstructure was analysed by X-ray diffraction (XRD) and transmission electron microscope
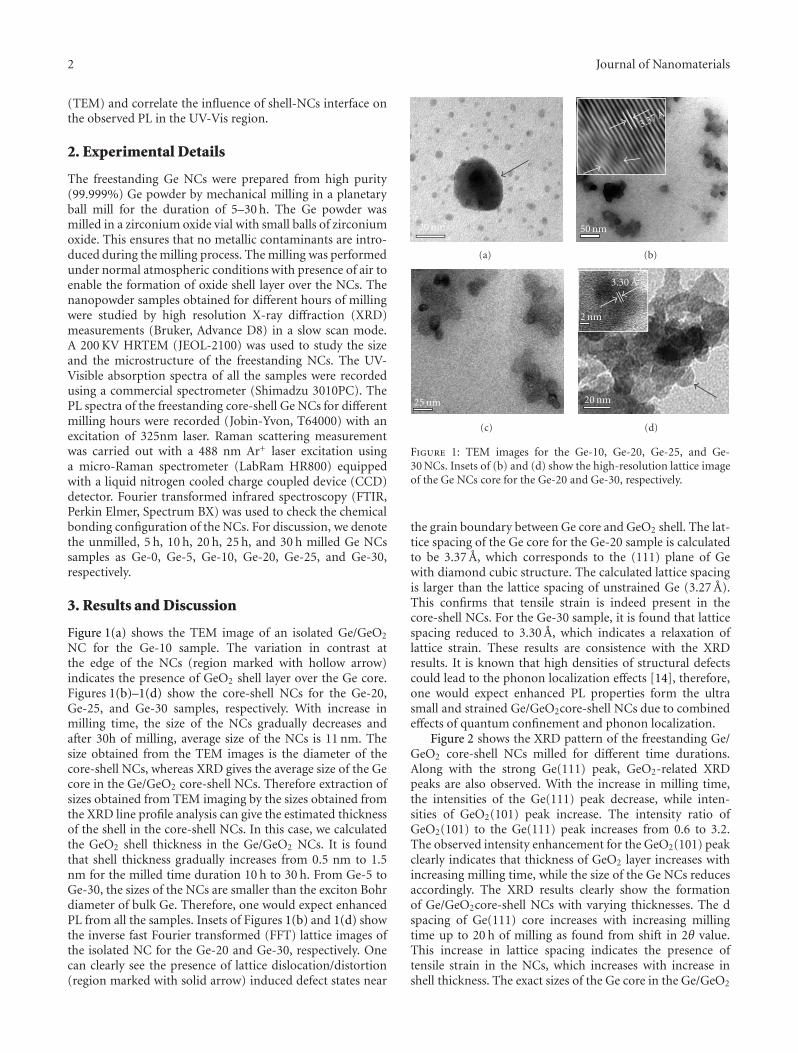
2 Journal of Nanomaterials
(TEM) and correlate the influence of shell-NCs interface onthe observed PL in the UV-Vis region.
2. Experimental Details
The freestanding Ge NCs were prepared from high purity(99.999%) Ge powder by mechanical milling in a planetaryball mill for the duration of 5–30 h. The Ge powder wasmilled in a zirconium oxide vial with small balls of zirconiumoxide. This ensures that no metallic contaminants are intro-duced during the milling process. The milling was performedunder normal atmospheric conditions with presence of air toenable the formation of oxide shell layer over the NCs. Thenanopowder samples obtained for different hours of millingwere studied by high resolution X-ray diffraction (XRD)measurements (Bruker, Advance D8) in a slow scan mode.A 200 KV HRTEM (JEOL-2100) was used to study the sizeand the microstructure of the freestanding NCs. The UV-Visible absorption spectra of all the samples were recordedusing a commercial spectrometer (Shimadzu 3010PC). ThePL spectra of the freestanding core-shell Ge NCs for differentmilling hours were recorded (Jobin-Yvon, T64000) with anexcitation of 325nm laser. Raman scattering measurementwas carried out with a 488 nm Ar+ laser excitation usinga micro-Raman spectrometer (LabRam HR800) equippedwith a liquid nitrogen cooled charge coupled device (CCD)detector. Fourier transformed infrared spectroscopy (FTIR,Perkin Elmer, Spectrum BX) was used to check the chemicalbonding configuration of the NCs. For discussion, we denotethe unmilled, 5 h, 10 h, 20 h, 25 h, and 30 h milled Ge NCssamples as Ge-0, Ge-5, Ge-10, Ge-20, Ge-25, and Ge-30,respectively.
3. Results and Discussion
Figure 1(a) shows the TEM image of an isolated Ge/GeO2
NC for the Ge-10 sample. The variation in contrast atthe edge of the NCs (region marked with hollow arrow)indicates the presence of GeO2 shell layer over the Ge core.Figures 1(b)–1(d) show the core-shell NCs for the Ge-20,Ge-25, and Ge-30 samples, respectively. With increase inmilling time, the size of the NCs gradually decreases andafter 30h of milling, average size of the NCs is 11 nm. Thesize obtained from the TEM images is the diameter of thecore-shell NCs, whereas XRD gives the average size of the Gecore in the Ge/GeO2 core-shell NCs. Therefore extraction ofsizes obtained from TEM imaging by the sizes obtained fromthe XRD line profile analysis can give the estimated thicknessof the shell in the core-shell NCs. In this case, we calculatedthe GeO2 shell thickness in the Ge/GeO2 NCs. It is foundthat shell thickness gradually increases from 0.5 nm to 1.5nm for the milled time duration 10 h to 30 h. From Ge-5 toGe-30, the sizes of the NCs are smaller than the exciton Bohrdiameter of bulk Ge. Therefore, one would expect enhancedPL from all the samples. Insets of Figures 1(b) and 1(d) showthe inverse fast Fourier transformed (FFT) lattice images ofthe isolated NC for the Ge-20 and Ge-30, respectively. Onecan clearly see the presence of lattice dislocation/distortion(region marked with solid arrow) induced defect states near
20 nm
(a)
50 nm
3.37A
(b)
25 nm
(c)
2 nm
20 nm
3.30 A
(d)
Figure 1: TEM images for the Ge-10, Ge-20, Ge-25, and Ge-30 NCs. Insets of (b) and (d) show the high-resolution lattice imageof the Ge NCs core for the Ge-20 and Ge-30, respectively.
the grain boundary between Ge core and GeO2 shell. The lat-tice spacing of the Ge core for the Ge-20 sample is calculatedto be 3.37 A, which corresponds to the (111) plane of Gewith diamond cubic structure. The calculated lattice spacingis larger than the lattice spacing of unstrained Ge (3.27 A).This confirms that tensile strain is indeed present in thecore-shell NCs. For the Ge-30 sample, it is found that latticespacing reduced to 3.30 A, which indicates a relaxation oflattice strain. These results are consistence with the XRDresults. It is known that high densities of structural defectscould lead to the phonon localization effects [14], therefore,one would expect enhanced PL properties form the ultrasmall and strained Ge/GeO2core-shell NCs due to combinedeffects of quantum confinement and phonon localization.
Figure 2 shows the XRD pattern of the freestanding Ge/GeO2 core-shell NCs milled for different time durations.Along with the strong Ge(111) peak, GeO2-related XRDpeaks are also observed. With the increase in milling time,the intensities of the Ge(111) peak decrease, while inten-sities of GeO2(101) peak increase. The intensity ratio ofGeO2(101) to the Ge(111) peak increases from 0.6 to 3.2.The observed intensity enhancement for the GeO2(101) peakclearly indicates that thickness of GeO2 layer increases withincreasing milling time, while the size of the Ge NCs reducesaccordingly. The XRD results clearly show the formationof Ge/GeO2core-shell NCs with varying thicknesses. The dspacing of Ge(111) core increases with increasing millingtime up to 20 h of milling as found from shift in 2θ value.This increase in lattice spacing indicates the presence oftensile strain in the NCs, which increases with increase inshell thickness. The exact sizes of the Ge core in the Ge/GeO2
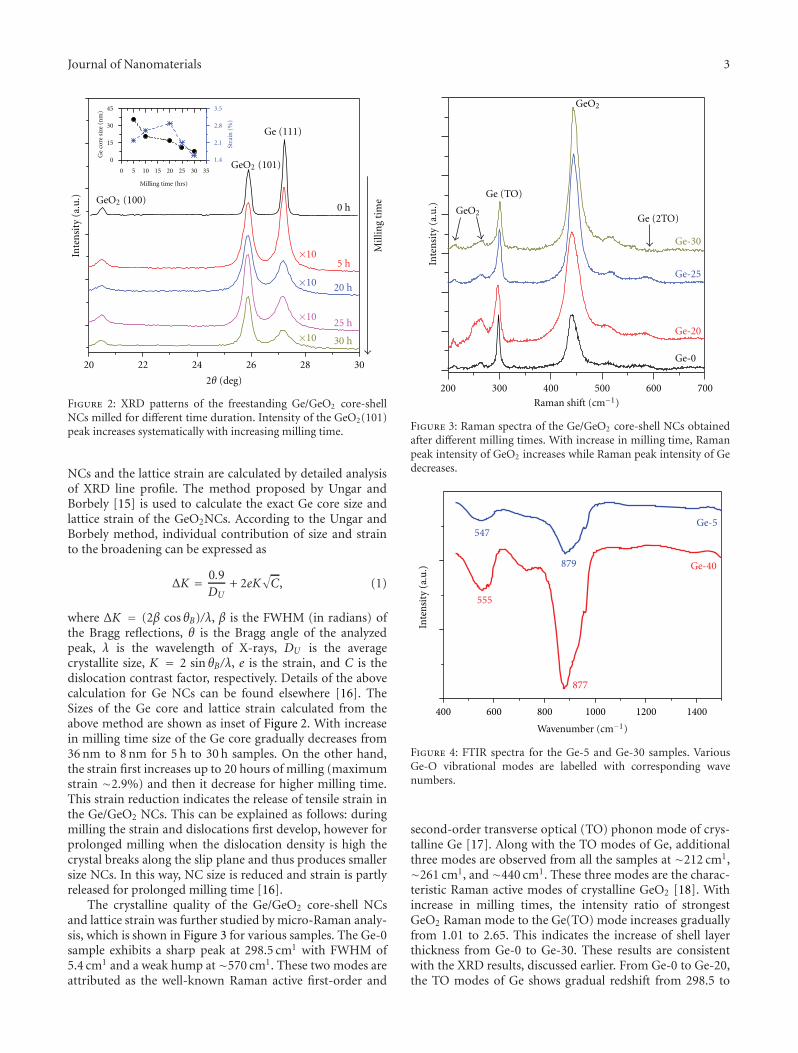
Journal of Nanomaterials 3
Mill
ing
tim
e
0 h
5 h
20 h
25 h
30 h
GeO2 (101)
GeO2 (100)
Ge (111)
2θ (deg)
20 22 24 26 28 30
Inte
nsi
ty(a
.u.)
0
15
30
45
Milling time (hrs)
Ge
core
size
(nm
)
1.4
2.1
2.8
3.5
Stra
in(%
)
0 5 10 15 20 25 30 35
×10
×10
×10
×10
Figure 2: XRD patterns of the freestanding Ge/GeO2 core-shellNCs milled for different time duration. Intensity of the GeO2(101)peak increases systematically with increasing milling time.
NCs and the lattice strain are calculated by detailed analysisof XRD line profile. The method proposed by Ungar andBorbely [15] is used to calculate the exact Ge core size andlattice strain of the GeO2NCs. According to the Ungar andBorbely method, individual contribution of size and strainto the broadening can be expressed as
ΔK = 0.9DU
+ 2eK√C, (1)
where ΔK = (2β cos θB)/λ, β is the FWHM (in radians) ofthe Bragg reflections, θ is the Bragg angle of the analyzedpeak, λ is the wavelength of X-rays, DU is the averagecrystallite size, K = 2 sin θB/λ, e is the strain, and C is thedislocation contrast factor, respectively. Details of the abovecalculation for Ge NCs can be found elsewhere [16]. TheSizes of the Ge core and lattice strain calculated from theabove method are shown as inset of Figure 2. With increasein milling time size of the Ge core gradually decreases from36 nm to 8 nm for 5 h to 30 h samples. On the other hand,the strain first increases up to 20 hours of milling (maximumstrain ∼2.9%) and then it decrease for higher milling time.This strain reduction indicates the release of tensile strain inthe Ge/GeO2 NCs. This can be explained as follows: duringmilling the strain and dislocations first develop, however forprolonged milling when the dislocation density is high thecrystal breaks along the slip plane and thus produces smallersize NCs. In this way, NC size is reduced and strain is partlyreleased for prolonged milling time [16].
The crystalline quality of the Ge/GeO2 core-shell NCsand lattice strain was further studied by micro-Raman analy-sis, which is shown in Figure 3 for various samples. The Ge-0sample exhibits a sharp peak at 298.5 cm1 with FWHM of5.4 cm1 and a weak hump at∼570 cm1. These two modes areattributed as the well-known Raman active first-order and
Ge (2TO)
Ge (TO)
Ge-30
Ge-25
Ge-20
Ge-0
Raman shift (cm−1)
200 300 400 500 600 700
GeO2
GeO2
Inte
nsi
ty(a
.u.)
Figure 3: Raman spectra of the Ge/GeO2 core-shell NCs obtainedafter different milling times. With increase in milling time, Ramanpeak intensity of GeO2 increases while Raman peak intensity of Gedecreases.
Intensity
(a.u.)
555
547
879
877
Ge-5
Ge-40
600 800 1000 1200 1400400Wavenumber (cm−1)
Figure 4: FTIR spectra for the Ge-5 and Ge-30 samples. VariousGe-O vibrational modes are labelled with corresponding wavenumbers.
second-order transverse optical (TO) phonon mode of crys-talline Ge [17]. Along with the TO modes of Ge, additionalthree modes are observed from all the samples at ∼212 cm1,∼261 cm1, and ∼440 cm1. These three modes are the charac-teristic Raman active modes of crystalline GeO2 [18]. Withincrease in milling times, the intensity ratio of strongestGeO2 Raman mode to the Ge(TO) mode increases graduallyfrom 1.01 to 2.65. This indicates the increase of shell layerthickness from Ge-0 to Ge-30. These results are consistentwith the XRD results, discussed earlier. From Ge-0 to Ge-20,the TO modes of Ge shows gradual redshift from 298.5 to
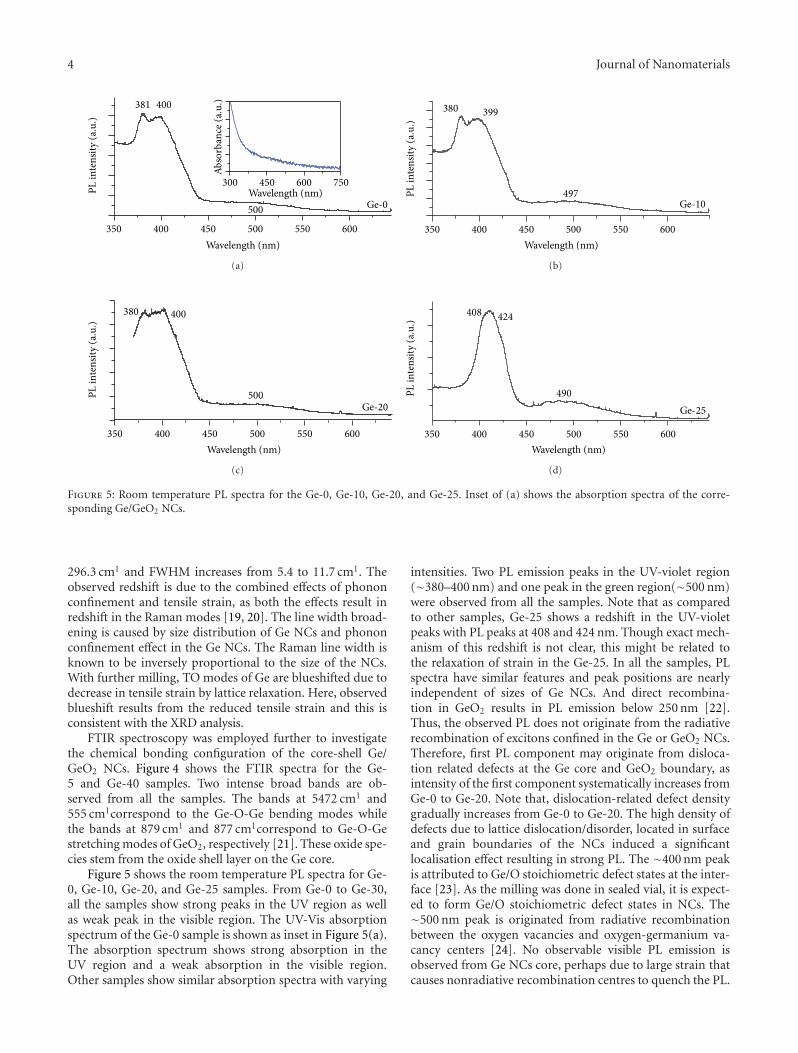
4 Journal of Nanomaterials
Ge-0500
400381
Wavelength (nm)
Absorbance
(a.u.)
300 450 600 750
PLintensity
(a.u.)
Wavelength (nm)350 400 450 500 550 600
(a)
380 399
Ge-10497PL
intensity
(a.u.)
Wavelength (nm)350 400 450 500 550 600
(b)
380 400
Ge-20500PL
intensity
(a.u.)
Wavelength (nm)350 400 450 500 550 600
(c)
408 424
PLintensity
(a.u.)
Ge-25490
Wavelength (nm)350 400 450 500 550 600
(d)
Figure 5: Room temperature PL spectra for the Ge-0, Ge-10, Ge-20, and Ge-25. Inset of (a) shows the absorption spectra of the corre-sponding Ge/GeO2 NCs.
296.3 cm1 and FWHM increases from 5.4 to 11.7 cm1. Theobserved redshift is due to the combined effects of phononconfinement and tensile strain, as both the effects result inredshift in the Raman modes [19, 20]. The line width broad-ening is caused by size distribution of Ge NCs and phononconfinement effect in the Ge NCs. The Raman line width isknown to be inversely proportional to the size of the NCs.With further milling, TO modes of Ge are blueshifted due todecrease in tensile strain by lattice relaxation. Here, observedblueshift results from the reduced tensile strain and this isconsistent with the XRD analysis.
FTIR spectroscopy was employed further to investigatethe chemical bonding configuration of the core-shell Ge/GeO2 NCs. Figure 4 shows the FTIR spectra for the Ge-5 and Ge-40 samples. Two intense broad bands are ob-served from all the samples. The bands at 5472 cm1 and555 cm1correspond to the Ge-O-Ge bending modes whilethe bands at 879 cm1 and 877 cm1correspond to Ge-O-Gestretching modes of GeO2, respectively [21]. These oxide spe-cies stem from the oxide shell layer on the Ge core.
Figure 5 shows the room temperature PL spectra for Ge-0, Ge-10, Ge-20, and Ge-25 samples. From Ge-0 to Ge-30,all the samples show strong peaks in the UV region as wellas weak peak in the visible region. The UV-Vis absorptionspectrum of the Ge-0 sample is shown as inset in Figure 5(a).The absorption spectrum shows strong absorption in theUV region and a weak absorption in the visible region.Other samples show similar absorption spectra with varying
intensities. Two PL emission peaks in the UV-violet region(∼380–400 nm) and one peak in the green region(∼500 nm)were observed from all the samples. Note that as comparedto other samples, Ge-25 shows a redshift in the UV-violetpeaks with PL peaks at 408 and 424 nm. Though exact mech-anism of this redshift is not clear, this might be related tothe relaxation of strain in the Ge-25. In all the samples, PLspectra have similar features and peak positions are nearlyindependent of sizes of Ge NCs. And direct recombina-tion in GeO2 results in PL emission below 250 nm [22].Thus, the observed PL does not originate from the radiativerecombination of excitons confined in the Ge or GeO2 NCs.Therefore, first PL component may originate from disloca-tion related defects at the Ge core and GeO2 boundary, asintensity of the first component systematically increases fromGe-0 to Ge-20. Note that, dislocation-related defect densitygradually increases from Ge-0 to Ge-20. The high density ofdefects due to lattice dislocation/disorder, located in surfaceand grain boundaries of the NCs induced a significantlocalisation effect resulting in strong PL. The ∼400 nm peakis attributed to Ge/O stoichiometric defect states at the inter-face [23]. As the milling was done in sealed vial, it is expect-ed to form Ge/O stoichiometric defect states in NCs. The∼500 nm peak is originated from radiative recombinationbetween the oxygen vacancies and oxygen-germanium va-cancy centers [24]. No observable visible PL emission isobserved from Ge NCs core, perhaps due to large strain thatcauses nonradiative recombination centres to quench the PL.
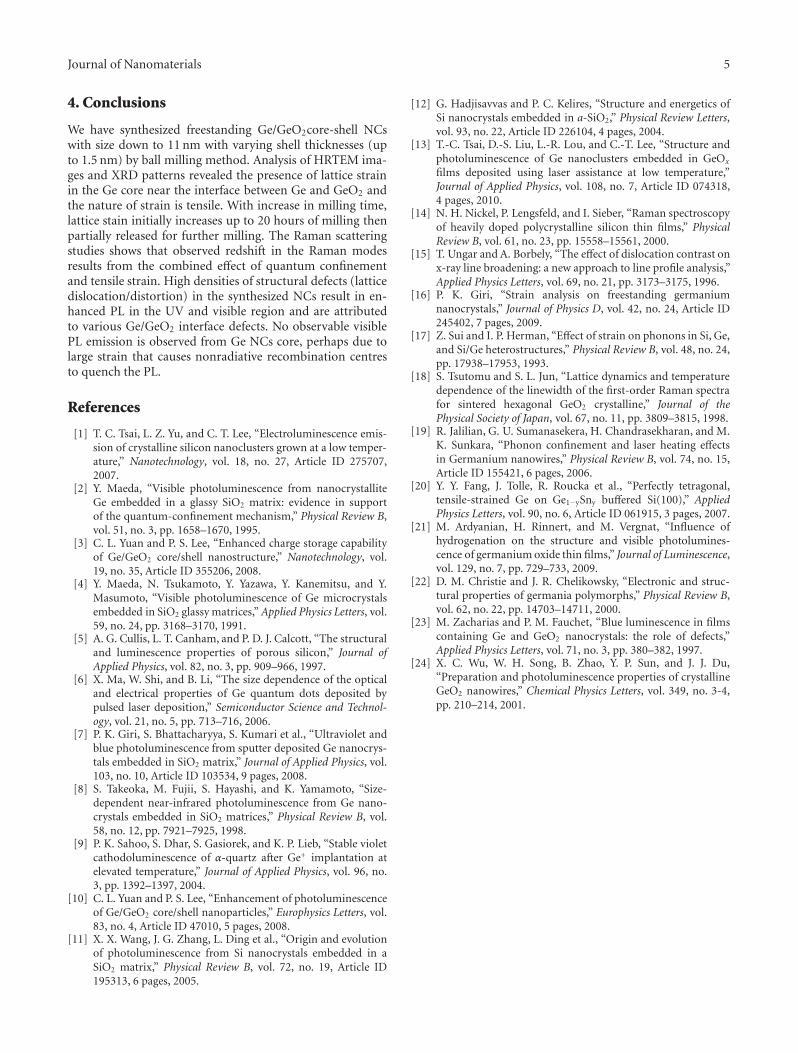
Journal of Nanomaterials 5
4. Conclusions
We have synthesized freestanding Ge/GeO2core-shell NCswith size down to 11 nm with varying shell thicknesses (upto 1.5 nm) by ball milling method. Analysis of HRTEM ima-ges and XRD patterns revealed the presence of lattice strainin the Ge core near the interface between Ge and GeO2 andthe nature of strain is tensile. With increase in milling time,lattice stain initially increases up to 20 hours of milling thenpartially released for further milling. The Raman scatteringstudies shows that observed redshift in the Raman modesresults from the combined effect of quantum confinementand tensile strain. High densities of structural defects (latticedislocation/distortion) in the synthesized NCs result in en-hanced PL in the UV and visible region and are attributedto various Ge/GeO2 interface defects. No observable visiblePL emission is observed from Ge NCs core, perhaps due tolarge strain that causes nonradiative recombination centresto quench the PL.
References
[1] T. C. Tsai, L. Z. Yu, and C. T. Lee, “Electroluminescence emis-sion of crystalline silicon nanoclusters grown at a low temper-ature,” Nanotechnology, vol. 18, no. 27, Article ID 275707,2007.
[2] Y. Maeda, “Visible photoluminescence from nanocrystalliteGe embedded in a glassy SiO2 matrix: evidence in supportof the quantum-confinement mechanism,” Physical Review B,vol. 51, no. 3, pp. 1658–1670, 1995.
[3] C. L. Yuan and P. S. Lee, “Enhanced charge storage capabilityof Ge/GeO2 core/shell nanostructure,” Nanotechnology, vol.19, no. 35, Article ID 355206, 2008.
[4] Y. Maeda, N. Tsukamoto, Y. Yazawa, Y. Kanemitsu, and Y.Masumoto, “Visible photoluminescence of Ge microcrystalsembedded in SiO2 glassy matrices,” Applied Physics Letters, vol.59, no. 24, pp. 3168–3170, 1991.
[5] A. G. Cullis, L. T. Canham, and P. D. J. Calcott, “The structuraland luminescence properties of porous silicon,” Journal ofApplied Physics, vol. 82, no. 3, pp. 909–966, 1997.
[6] X. Ma, W. Shi, and B. Li, “The size dependence of the opticaland electrical properties of Ge quantum dots deposited bypulsed laser deposition,” Semiconductor Science and Technol-ogy, vol. 21, no. 5, pp. 713–716, 2006.
[7] P. K. Giri, S. Bhattacharyya, S. Kumari et al., “Ultraviolet andblue photoluminescence from sputter deposited Ge nanocrys-tals embedded in SiO2 matrix,” Journal of Applied Physics, vol.103, no. 10, Article ID 103534, 9 pages, 2008.
[8] S. Takeoka, M. Fujii, S. Hayashi, and K. Yamamoto, “Size-dependent near-infrared photoluminescence from Ge nano-crystals embedded in SiO2 matrices,” Physical Review B, vol.58, no. 12, pp. 7921–7925, 1998.
[9] P. K. Sahoo, S. Dhar, S. Gasiorek, and K. P. Lieb, “Stable violetcathodoluminescence of α-quartz after Ge+ implantation atelevated temperature,” Journal of Applied Physics, vol. 96, no.3, pp. 1392–1397, 2004.
[10] C. L. Yuan and P. S. Lee, “Enhancement of photoluminescenceof Ge/GeO2 core/shell nanoparticles,” Europhysics Letters, vol.83, no. 4, Article ID 47010, 5 pages, 2008.
[11] X. X. Wang, J. G. Zhang, L. Ding et al., “Origin and evolutionof photoluminescence from Si nanocrystals embedded in aSiO2 matrix,” Physical Review B, vol. 72, no. 19, Article ID195313, 6 pages, 2005.
[12] G. Hadjisavvas and P. C. Kelires, “Structure and energetics ofSi nanocrystals embedded in a-SiO2,” Physical Review Letters,vol. 93, no. 22, Article ID 226104, 4 pages, 2004.
[13] T.-C. Tsai, D.-S. Liu, L.-R. Lou, and C.-T. Lee, “Structure andphotoluminescence of Ge nanoclusters embedded in GeOx
films deposited using laser assistance at low temperature,”Journal of Applied Physics, vol. 108, no. 7, Article ID 074318,4 pages, 2010.
[14] N. H. Nickel, P. Lengsfeld, and I. Sieber, “Raman spectroscopyof heavily doped polycrystalline silicon thin films,” PhysicalReview B, vol. 61, no. 23, pp. 15558–15561, 2000.
[15] T. Ungar and A. Borbely, “The effect of dislocation contrast onx-ray line broadening: a new approach to line profile analysis,”Applied Physics Letters, vol. 69, no. 21, pp. 3173–3175, 1996.
[16] P. K. Giri, “Strain analysis on freestanding germaniumnanocrystals,” Journal of Physics D, vol. 42, no. 24, Article ID245402, 7 pages, 2009.
[17] Z. Sui and I. P. Herman, “Effect of strain on phonons in Si, Ge,and Si/Ge heterostructures,” Physical Review B, vol. 48, no. 24,pp. 17938–17953, 1993.
[18] S. Tsutomu and S. L. Jun, “Lattice dynamics and temperaturedependence of the linewidth of the first-order Raman spectrafor sintered hexagonal GeO2 crystalline,” Journal of thePhysical Society of Japan, vol. 67, no. 11, pp. 3809–3815, 1998.
[19] R. Jalilian, G. U. Sumanasekera, H. Chandrasekharan, and M.K. Sunkara, “Phonon confinement and laser heating effectsin Germanium nanowires,” Physical Review B, vol. 74, no. 15,Article ID 155421, 6 pages, 2006.
[20] Y. Y. Fang, J. Tolle, R. Roucka et al., “Perfectly tetragonal,tensile-strained Ge on Ge1−ySny buffered Si(100),” AppliedPhysics Letters, vol. 90, no. 6, Article ID 061915, 3 pages, 2007.
[21] M. Ardyanian, H. Rinnert, and M. Vergnat, “Influence ofhydrogenation on the structure and visible photolumines-cence of germanium oxide thin films,” Journal of Luminescence,vol. 129, no. 7, pp. 729–733, 2009.
[22] D. M. Christie and J. R. Chelikowsky, “Electronic and struc-tural properties of germania polymorphs,” Physical Review B,vol. 62, no. 22, pp. 14703–14711, 2000.
[23] M. Zacharias and P. M. Fauchet, “Blue luminescence in filmscontaining Ge and GeO2 nanocrystals: the role of defects,”Applied Physics Letters, vol. 71, no. 3, pp. 380–382, 1997.
[24] X. C. Wu, W. H. Song, B. Zhao, Y. P. Sun, and J. J. Du,“Preparation and photoluminescence properties of crystallineGeO2 nanowires,” Chemical Physics Letters, vol. 349, no. 3-4,pp. 210–214, 2001.
Hindawi Publishing CorporationJournal of NanomaterialsVolume 2012, Article ID 758429, 4 pagesdoi:10.1155/2012/758429
Research Article
Synchrotron X-Ray Absorption SpectroscopyStudy of Self-Assembled NanoparticlesSynthesized from Fe(acac)3 and Pt(acac)2
K. Chokprasombat,1 C. Sirisathitkul,1 P. Harding,1 S. Chandarak,2 and R. Yimnirun3
1 Molecular Technology Research Unit, School of Science, Walailak University, Nakhon Si Thammarat 80161, Thailand2 School of Ceramic Engineering, Institute of Engineering, Suranaree University of Technology,Nakhon Ratchasima 30000, Thailand
3 School of Physics, Institute of Science, Suranaree University of Technology and Synchrotron Light Research Institute(Public Organization), Nakhon Ratchasima 30000, Thailand
Correspondence should be addressed to C. Sirisathitkul, [email protected]
Received 30 May 2011; Accepted 1 July 2011
Academic Editor: Linbao Luo
Copyright © 2012 K. Chokprasombat et al. This is an open access article distributed under the Creative Commons AttributionLicense, which permits unrestricted use, distribution, and reproduction in any medium, provided the original work is properlycited.
The synchrotron X-ray absorption technique was used to complement electron microscopy in the investigation of nanoparticlessynthesized from the coreduction of iron acetylacetonate, Fe(acac)3 and platinum acetylacetonate, Pt(acac)2. A much higher Ptcomposition than Fe leads to an extended X-ray absorption fine structure (EXAFS) spectrum for the sample that differs from thatof fcc FePt nanoparticles. Most importantly, X-ray absorption near-edge structure (XANES) spectra clearly indicate the existenceof α-Fe2O3 and Pt metal. Since these monodisperse nanoparticles have a diameter of around 4 nm and tend to self-assemble intohexagonal arrangements, they can be modeled as Pt-rich cores with an α-Fe2O3 shell stabilized by organic surfactants.
1. Introduction
Iron-platinum (FePt) nanoparticles are a prime candidate forthe next generation of ultrahigh density recording materials[1]. Whereas other magnetic materials become hysteresis-free superparamagnetic particles when their sizes are below10 nm, FePt nanoparticles of these sizes still exhibit ferro-magnetism which is a requirement for nonvolatile recording[2]. To obtain substantial magnetic anisotropy for recordingapplications, not only the size but also the composition andlocal structure have to be controlled. It has been shownthat as-synthesized FePt exhibits a chemically disordered fccphase and is superparamagnetic but can be transformed intothe ferromagnetic fct structure after heat treatment. In thisfct arrangement, Fe and Pt atoms are in alternate planes witha balanced atomic ratio [3].
The synthesis of FePt nanoparticles conventionally usesthe thermal decomposition of iron pentacarbonyl, Fe(CO)5
[3]. Since this starting material is very toxic, the coreduction
of iron acetylacetonate, Fe(acac)3 and platinum acetylaceto-nate, Pt(acac)2 has been studied as a green alternative [4–7].Metal acetylacetonates are universally regarded as versatileand nontoxic precursors in the synthesis of transitionmetal oxide nanoparticles [8]. However, the control of thecomposition and local structure of the FePt product fromthese starting materials still remain the subject of study.Commonly, the phase is identified by X-ray diffraction(XRD). The local composition can be obtained by energy dis-persive spectroscopy (EDS) whereas the global compositionis averaged by inductively coupled plasma-optical emissionspectroscopy (ICP-OES).
In the case of the nanoparticles synthesized from the re-action between Fe(acac)3 and Pt(acac)2 and stabilized byorganic surfactants, several possible core-shell structuresmay be obtained. The configuration gets more complicatedwhen the ratio between Fe and Pt is highly unbalanced ora significant amount of oxygen is present. As a result, theconclusion about the local structure cannot be reached solely
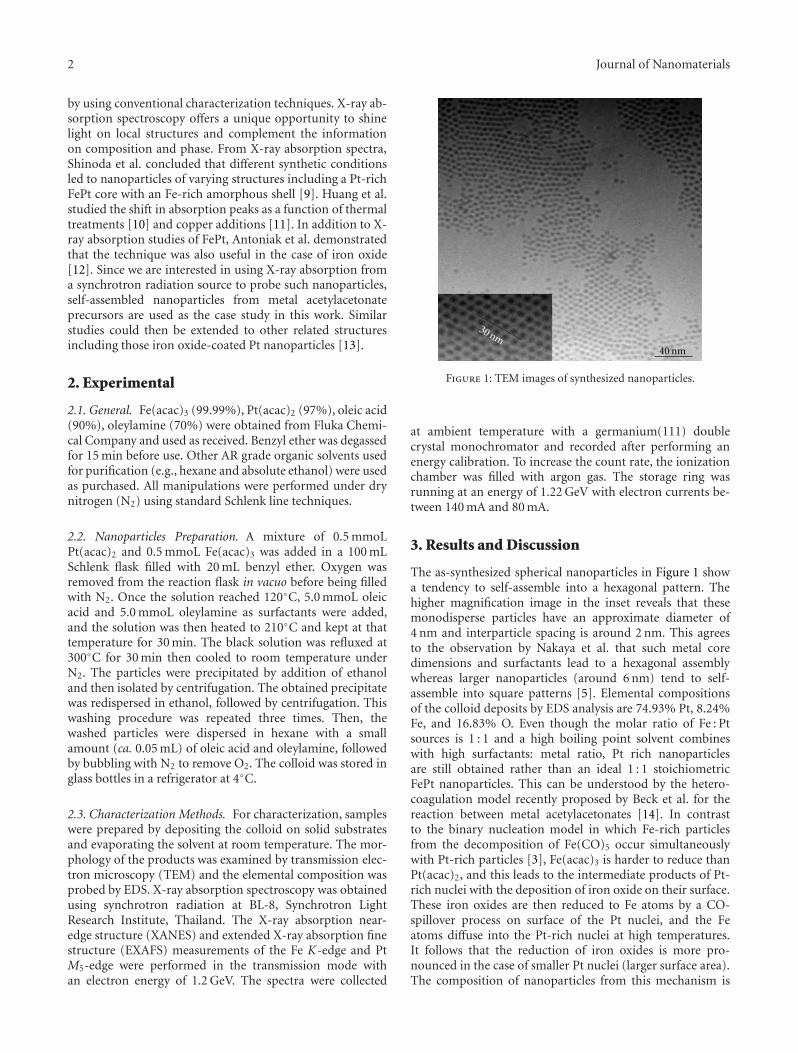
2 Journal of Nanomaterials
by using conventional characterization techniques. X-ray ab-sorption spectroscopy offers a unique opportunity to shinelight on local structures and complement the informationon composition and phase. From X-ray absorption spectra,Shinoda et al. concluded that different synthetic conditionsled to nanoparticles of varying structures including a Pt-richFePt core with an Fe-rich amorphous shell [9]. Huang et al.studied the shift in absorption peaks as a function of thermaltreatments [10] and copper additions [11]. In addition to X-ray absorption studies of FePt, Antoniak et al. demonstratedthat the technique was also useful in the case of iron oxide[12]. Since we are interested in using X-ray absorption froma synchrotron radiation source to probe such nanoparticles,self-assembled nanoparticles from metal acetylacetonateprecursors are used as the case study in this work. Similarstudies could then be extended to other related structuresincluding those iron oxide-coated Pt nanoparticles [13].
2. Experimental
2.1. General. Fe(acac)3 (99.99%), Pt(acac)2 (97%), oleic acid(90%), oleylamine (70%) were obtained from Fluka Chemi-cal Company and used as received. Benzyl ether was degassedfor 15 min before use. Other AR grade organic solvents usedfor purification (e.g., hexane and absolute ethanol) were usedas purchased. All manipulations were performed under drynitrogen (N2) using standard Schlenk line techniques.
2.2. Nanoparticles Preparation. A mixture of 0.5 mmoLPt(acac)2 and 0.5 mmoL Fe(acac)3 was added in a 100 mLSchlenk flask filled with 20 mL benzyl ether. Oxygen wasremoved from the reaction flask in vacuo before being filledwith N2. Once the solution reached 120◦C, 5.0 mmoL oleicacid and 5.0 mmoL oleylamine as surfactants were added,and the solution was then heated to 210◦C and kept at thattemperature for 30 min. The black solution was refluxed at300◦C for 30 min then cooled to room temperature underN2. The particles were precipitated by addition of ethanoland then isolated by centrifugation. The obtained precipitatewas redispersed in ethanol, followed by centrifugation. Thiswashing procedure was repeated three times. Then, thewashed particles were dispersed in hexane with a smallamount (ca. 0.05 mL) of oleic acid and oleylamine, followedby bubbling with N2 to remove O2. The colloid was stored inglass bottles in a refrigerator at 4◦C.
2.3. Characterization Methods. For characterization, sampleswere prepared by depositing the colloid on solid substratesand evaporating the solvent at room temperature. The mor-phology of the products was examined by transmission elec-tron microscopy (TEM) and the elemental composition wasprobed by EDS. X-ray absorption spectroscopy was obtainedusing synchrotron radiation at BL-8, Synchrotron LightResearch Institute, Thailand. The X-ray absorption near-edge structure (XANES) and extended X-ray absorption finestructure (EXAFS) measurements of the Fe K-edge and PtM5-edge were performed in the transmission mode withan electron energy of 1.2 GeV. The spectra were collected
40 nm
30 nm
Figure 1: TEM images of synthesized nanoparticles.
at ambient temperature with a germanium(111) doublecrystal monochromator and recorded after performing anenergy calibration. To increase the count rate, the ionizationchamber was filled with argon gas. The storage ring wasrunning at an energy of 1.22 GeV with electron currents be-tween 140 mA and 80 mA.
3. Results and Discussion
The as-synthesized spherical nanoparticles in Figure 1 showa tendency to self-assemble into a hexagonal pattern. Thehigher magnification image in the inset reveals that thesemonodisperse particles have an approximate diameter of4 nm and interparticle spacing is around 2 nm. This agreesto the observation by Nakaya et al. that such metal coredimensions and surfactants lead to a hexagonal assemblywhereas larger nanoparticles (around 6 nm) tend to self-assemble into square patterns [5]. Elemental compositionsof the colloid deposits by EDS analysis are 74.93% Pt, 8.24%Fe, and 16.83% O. Even though the molar ratio of Fe : Ptsources is 1 : 1 and a high boiling point solvent combineswith high surfactants: metal ratio, Pt rich nanoparticlesare still obtained rather than an ideal 1 : 1 stoichiometricFePt nanoparticles. This can be understood by the hetero-coagulation model recently proposed by Beck et al. for thereaction between metal acetylacetonates [14]. In contrastto the binary nucleation model in which Fe-rich particlesfrom the decomposition of Fe(CO)5 occur simultaneouslywith Pt-rich particles [3], Fe(acac)3 is harder to reduce thanPt(acac)2, and this leads to the intermediate products of Pt-rich nuclei with the deposition of iron oxide on their surface.These iron oxides are then reduced to Fe atoms by a CO-spillover process on surface of the Pt nuclei, and the Featoms diffuse into the Pt-rich nuclei at high temperatures.It follows that the reduction of iron oxides is more pro-nounced in the case of smaller Pt nuclei (larger surface area).The composition of nanoparticles from this mechanism is
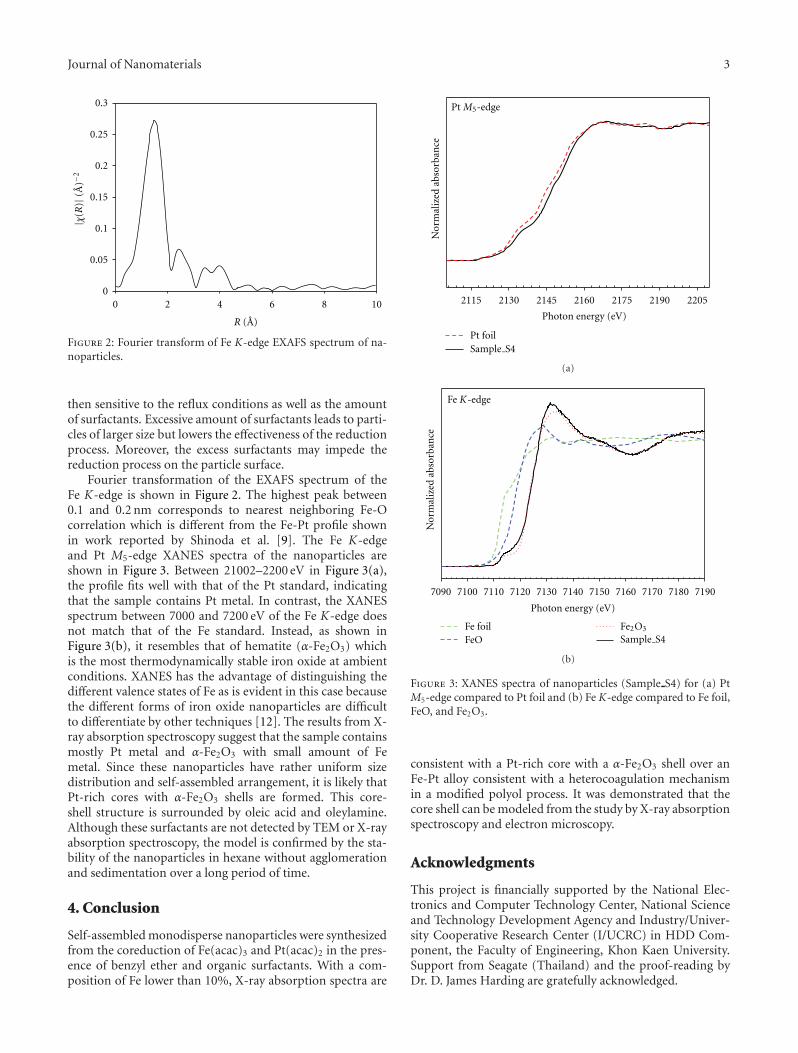
Journal of Nanomaterials 3
0 2 4 6 8 100
0.05
0.1
0.15
0.2
0.25
0.3
|χ(R
)|(A
)−2
R (A)
Figure 2: Fourier transform of Fe K-edge EXAFS spectrum of na-noparticles.
then sensitive to the reflux conditions as well as the amountof surfactants. Excessive amount of surfactants leads to parti-cles of larger size but lowers the effectiveness of the reductionprocess. Moreover, the excess surfactants may impede thereduction process on the particle surface.
Fourier transformation of the EXAFS spectrum of theFe K-edge is shown in Figure 2. The highest peak between0.1 and 0.2 nm corresponds to nearest neighboring Fe-Ocorrelation which is different from the Fe-Pt profile shownin work reported by Shinoda et al. [9]. The Fe K-edgeand Pt M5-edge XANES spectra of the nanoparticles areshown in Figure 3. Between 21002–2200 eV in Figure 3(a),the profile fits well with that of the Pt standard, indicatingthat the sample contains Pt metal. In contrast, the XANESspectrum between 7000 and 7200 eV of the Fe K-edge doesnot match that of the Fe standard. Instead, as shown inFigure 3(b), it resembles that of hematite (α-Fe2O3) whichis the most thermodynamically stable iron oxide at ambientconditions. XANES has the advantage of distinguishing thedifferent valence states of Fe as is evident in this case becausethe different forms of iron oxide nanoparticles are difficultto differentiate by other techniques [12]. The results from X-ray absorption spectroscopy suggest that the sample containsmostly Pt metal and α-Fe2O3 with small amount of Femetal. Since these nanoparticles have rather uniform sizedistribution and self-assembled arrangement, it is likely thatPt-rich cores with α-Fe2O3 shells are formed. This core-shell structure is surrounded by oleic acid and oleylamine.Although these surfactants are not detected by TEM or X-rayabsorption spectroscopy, the model is confirmed by the sta-bility of the nanoparticles in hexane without agglomerationand sedimentation over a long period of time.
4. Conclusion
Self-assembled monodisperse nanoparticles were synthesizedfrom the coreduction of Fe(acac)3 and Pt(acac)2 in the pres-ence of benzyl ether and organic surfactants. With a com-position of Fe lower than 10%, X-ray absorption spectra are
Photon energy (eV)
2115 2130 2145 2160 2175 2190 2205
Nor
mal
ized
abso
rban
ce
Pt foilSample S4
Pt M5-edge
(a)
Photon energy (eV)
7090 7100 7110 7120 7130 7140 7150 7160 7170 7180 7190
Nor
mal
ized
abso
rban
ce
Fe foilFeO
Fe2O3
Sample S4
Fe K-edge
(b)
Figure 3: XANES spectra of nanoparticles (Sample S4) for (a) PtM5-edge compared to Pt foil and (b) Fe K-edge compared to Fe foil,FeO, and Fe2O3.
consistent with a Pt-rich core with a α-Fe2O3 shell over anFe-Pt alloy consistent with a heterocoagulation mechanismin a modified polyol process. It was demonstrated that thecore shell can be modeled from the study by X-ray absorptionspectroscopy and electron microscopy.
Acknowledgments
This project is financially supported by the National Elec-tronics and Computer Technology Center, National Scienceand Technology Development Agency and Industry/Univer-sity Cooperative Research Center (I/UCRC) in HDD Com-ponent, the Faculty of Engineering, Khon Kaen University.Support from Seagate (Thailand) and the proof-reading byDr. D. James Harding are gratefully acknowledged.
4 Journal of Nanomaterials
References
[1] B. D. Terris and T. Thomson, “Nanofabricated and self-assembled magnetic structures as data storage media,” Journalof Physics D, vol. 38, no. 12, pp. R199–R222, 2005.
[2] H. W. Zhang, Y. Liu, and S. H. Sun, “Synthesis and assemblyof magnetic nanoparticles for information and energy storageapplications,” Frontiers of Physics in China, vol. 5, no. 4, pp.347–356, 2010.
[3] S. Sun, “Recent advances in chemical synthesis, self-assembly,and applications of FePt nanoparticles,” Advanced Materials,vol. 18, no. 4, pp. 393–403, 2006.
[4] V. Nandwana, K. E. Elkins, and J. P. Liu, “Magnetic hardeningin ultrafine FePt nanoparticle assembled films,” Nanotechnol-ogy, vol. 16, no. 12, pp. 2823–2826, 2005.
[5] M. Nakaya, M. Kanehara, and T. Teranishi, “One-pot synthesisof large FePt nanoparticles from metal salts and their thermalstability,” Langmuir, vol. 22, no. 8, pp. 3485–3487, 2006.
[6] C. Liu, X. Wu, T. Klemmer et al., “Polyol process synthesisof monodispersed FePt nanoparticles,” Journal of PhysicalChemistry B, vol. 108, no. 20, pp. 6121–6123, 2004.
[7] K. E. Elkins, T. S. Vedantam, J. P. Liu et al., “Ultrafine FePt na-noparticles prepared by the chemical reduction method,”Nano Letters, vol. 3, no. 12, pp. 1647–1649, 2003.
[8] A. L. Willis, Z. Y. Chen, J. Q. He, Y. M. Zhu, N. J. Turro, andS. O’Brien, “Metal acetylacetonates as general precursors forthe synthesis of early transition metal oxide nanomaterials,”Journal of Nanomaterials, vol. 2011, Article ID 525967, 5 pages,2011.
[9] K. Shinoda, K. Sato, B. Jeyadevan, K. Tohji, and S. Suzuki,“Local structural studies of directly synthesized L10 FePt na-noparticles by using XRD, XAS and ASAXS,” Journal ofMagnetism and Magnetic Materials, vol. 310, no. 2, pp. 2387–2389, 2007.
[10] T. W. Huang, Y. H. Huang, T. H. Tu, and C. H. Lee, “X-raydiffraction and absorption spectroscopy studies of the struc-ture of self-assembled FePt nanoparticles during annealing,”Journal of Magnetism and Magnetic Materials, vol. 282, no. SI,pp. 127–130, 2004.
[11] T. W. Huang, T. H. Tu, Y. H. Huang, C. H. Lee, and C. M. Lin,“X-ray scattering and absorption spectroscopy study of theorder-disorder transition of (FePt)1−xCux nanoparticles,” IEEETransactions on Magnetics, vol. 41, no. 2, pp. 941–943, 2005.
[12] C. Antoniak, A. Warland, M. Darbandi et al., “X-ray absorp-tion measurements on nanoparticle systems: self-assembledarrays and dispersions,” Journal of Physics D, vol. 43, no. 47,Article ID 474007, 8 pages, 2010.
[13] H. He and C. Gao, “Synthesis of Fe3O3/Pt nanoparticles dec-orated carbon nanotubes and their use as magnetically recy-clable catalysts,” Journal of Nanomaterials, vol. 2011, Article ID193510, 10 pages, 2011.
[14] W. Beck Jr., C. G. S. Souza, T. L. Silva, M. Jafelicci Jr., and L. C.Varanda, “Formation mechanism via a heterocoagulation ap-proach of FePt nanoparticles using the modified polyol proc-ess,” Journal of Physical Chemistry C, vol. 115, no. 21, pp.10475–10482, 2011.
Hindawi Publishing CorporationJournal of NanomaterialsVolume 2012, Article ID 217412, 9 pagesdoi:10.1155/2012/217412
Research Article
In Situ Synthesis of Poly(methyl methacrylate)/SiO2 HybridNanocomposites via “Grafting Onto” Strategy Based onUV Irradiation in the Presence of Iron Aqueous Solution
Hong Zhang, Chao Li, Jinshan Guo, Limin Zang, and Jiahe Luo
Institute of Polymer Science and Engineering, College of Chemistry and Chemical Engineering, Lanzhou University,222 Tianshui South Road, Gansu 730000, China
Correspondence should be addressed to Jinshan Guo, [email protected]
Received 11 March 2011; Revised 6 May 2011; Accepted 1 June 2011
Academic Editor: Hai-Sheng Qian
Copyright © 2012 Hong Zhang et al. This is an open access article distributed under the Creative Commons Attribution License,which permits unrestricted use, distribution, and reproduction in any medium, provided the original work is properly cited.
Poly(methyl methacrylate)/SiO2 (PMMA/SiO2) hybrid composites were prepared via “grafting onto” strategy based on UV ir-radiation in the presence of iron aqueous solution. Two steps were used to graft polymethyl methacrylate (PMMA) onto the surfaceof nanosilica, anchoring 3-(methacryloxy) propyl trimethoxysilane (MPTS) onto the surface of nanosilica to modify it with doublebonds, and then grafting PMMA onto the surface of nanosilica with FeCl3 as photoinitiator. The products were characterizedby FT-IR, TGA, TEM, DLS, and XPS. The results showed that it is easy to graft PMMA onto the surface of nanosilica underUV irradiation, and the hybrid particles are monodisperse and have core-shell structure with nanosilica as the core and PMMAlayers as the shell. Furthermore, the products initiated by FeCl3have higher monomer conversion, percent grafting, and bettermonodispersion compared with the products initiated by traditional photoinitiator such as 2-hydroxy-4-(2-hydroxyethoxy)-2-methyl-propiophenone (Irgacure 2959).
1. Introduction
Recently, the polymer/inorganic nanocomposites havegained great attention [1–5] because of their potentialapplications in many surface-based technologies such ascomposite materials, biomaterials, adhesion and wetting,molecular recognition, microfluidics, chemical sensing, andorganic synthesis [6–12]. What is more is that the polymer/inorganic nanocomposites have excellent properties, suchas mechanical properties, thermal stability, and flameretardance, gas barrier properties, and biodegradation andabrasion resistance [13–16]. The polymer/inorganic hybridmaterials are generally prepared by surface modificationof the inorganic particles. At present, there are many ap-proaches for modifying solid surfaces with polymers,including physisorption, covalent attachment, and elec-trostatic adsorption [17]. Physisorption is relatively an easyway, but it suffers from solvolytic and thermal instabilitiesdue to the absence of stable covalent bonds on the surface[18]. There are three approaches to covalently graft
polymer chains on the surface of inorganic particles:(1) the “grafting to” method [19, 20], where the end-func-tionalized polymers react with an appropriate surface; (2) the“grafting from” method [21, 22], where polymer chains aregrown from initiator-terminated self-assembled monolayer;(3) the “grafting onto” method [23], where surface copoly-merization is through a covalently linked monomer.
UV light has also become a useful tool for initiating poly-merization due to its significant advantages [24, 25], and thismethod has been applied to emulsion polymerization [26,27]. The polymerization can be easily varied by controllingthe emulsifier concentration and the initiator concentration.Furthermore, it could accomplish high efficiency of thepolymerization process in a short time even using a smallpercentage of photoinitiation. In contrast to thermally basedapplications which usually require elevated temperatures,photopolymerization can also be performed at room tem-perature and below. This is a striking advantage for bothclassical polymerization of monofunctional monomers andmodern curing applications. Low-molecular-weight organic
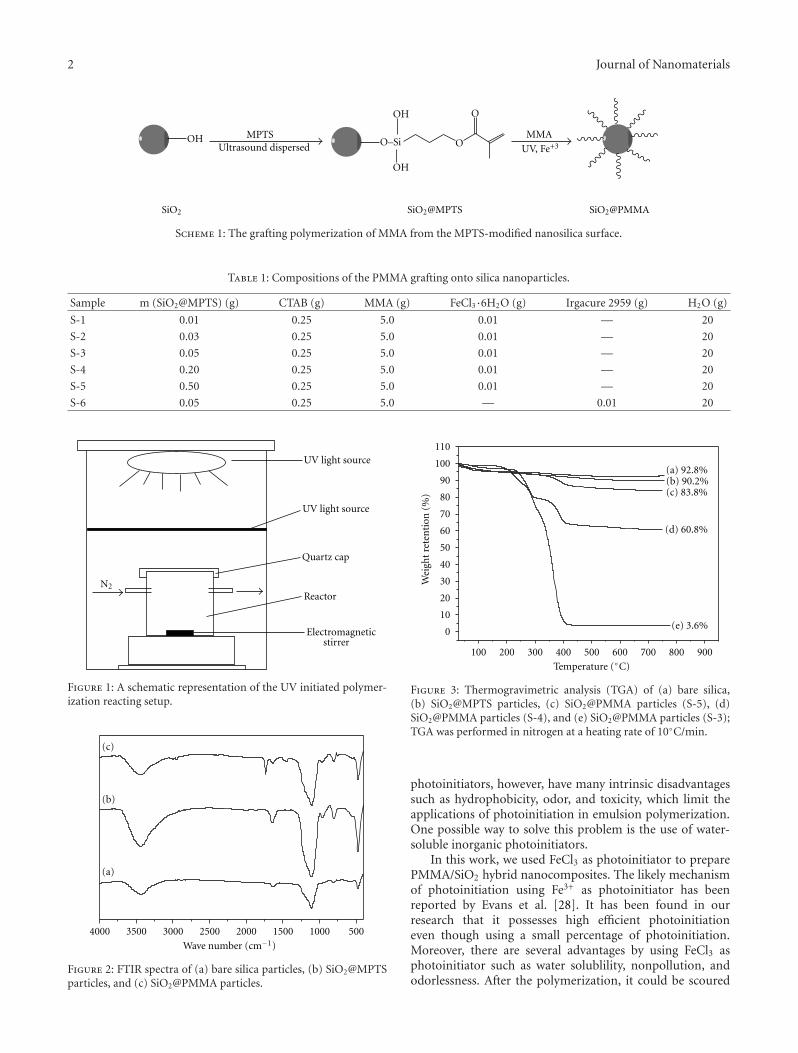
2 Journal of Nanomaterials
O–SiOH MPTSUltrasound dispersed O
OH
OH
O
MMA
UV, Fe+3
SiO2@MPTS SiO2@PMMASiO2
Scheme 1: The grafting polymerization of MMA from the MPTS-modified nanosilica surface.
Table 1: Compositions of the PMMA grafting onto silica nanoparticles.
Sample m (SiO2@MPTS) (g) CTAB (g) MMA (g) FeCl3·6H2O (g) Irgacure 2959 (g) H2O (g)
S-1 0.01 0.25 5.0 0.01 — 20
S-2 0.03 0.25 5.0 0.01 — 20
S-3 0.05 0.25 5.0 0.01 — 20
S-4 0.20 0.25 5.0 0.01 — 20
S-5 0.50 0.25 5.0 0.01 — 20
S-6 0.05 0.25 5.0 — 0.01 20
UV light source
N2
Quartz cap
Reactor
Electromagneticstirrer
UV light source
Figure 1: A schematic representation of the UV initiated polymer-ization reacting setup.
4000 3500 3000 2500 2000 1500 1000 500
(a)
(b)
(c)
Wave number (cm−1)
Figure 2: FTIR spectra of (a) bare silica particles, (b) SiO2@MPTSparticles, and (c) SiO2@PMMA particles.
0
10
20
30
40
50
60
70
80
90
100
110
Wei
ght
rete
nti
on(%
)
100 200 300 400 500 600 700 800 900
(a) 92.8%(b) 90.2%(c) 83.8%
(d) 60.8%
(e) 3.6%
Temperature (◦C)
Figure 3: Thermogravimetric analysis (TGA) of (a) bare silica,(b) SiO2@MPTS particles, (c) SiO2@PMMA particles (S-5), (d)SiO2@PMMA particles (S-4), and (e) SiO2@PMMA particles (S-3);TGA was performed in nitrogen at a heating rate of 10◦C/min.
photoinitiators, however, have many intrinsic disadvantagessuch as hydrophobicity, odor, and toxicity, which limit theapplications of photoinitiation in emulsion polymerization.One possible way to solve this problem is the use of water-soluble inorganic photoinitiators.
In this work, we used FeCl3 as photoinitiator to preparePMMA/SiO2 hybrid nanocomposites. The likely mechanismof photoinitiation using Fe3+ as photoinitiator has beenreported by Evans et al. [28]. It has been found in ourresearch that it possesses high efficient photoinitiationeven though using a small percentage of photoinitiation.Moreover, there are several advantages by using FeCl3 asphotoinitiator such as water solublility, nonpollution, andodorlessness. After the polymerization, it could be scoured
Journal of Nanomaterials 3
50 nm
(a)
50 nm
(b)
50 nm
(c)
50 nm
(d)
50 nm
(e)
50 nm
(f)
Figure 4: TEM images of (a) bare silica particles, (b) SiO2@PMMA particles (S-1), (c) SiO2@PMMA particles (S-2), (d) SiO2@PMMAparticles (S-3), (e) SiO2@PMMA particles (S-4), and (f) SiO2@PMMA particles (S-5) cast from dilute deionized water.
4 Journal of Nanomaterials
Table 2: Comparison of UV-initiated polymerization initiated by FeCl3 and Irgacure 2959.
Sample Particle size (nm) PDI Reaction time (min) Conversion (%)a Grafting (%)b
S-3 32 0.289 10 95.4 98.0
S-6 27 0.352 10 75.7 85.8aConversion values determined using gravimetric analysis.
bPolymer grafting (%) is calculated from (2).
Inte
nsi
ty
Side (d/nm)
1 10 100 1000
(a)
Inte
nsi
ty
Side (d/nm)
1 10 100 1000
(b)
Figure 5: DLS images of (a) bare silica particles and (b) SiO2@PMMA particles (S-3).
off easily. Compared to the traditional photoinitiation initi-ated by Irgacure 2959, the products initiated by FeCl3 havehigher monomer conversion, percent grafting, and bettermonodispersion. Considering the above factors, herein,we describe an effective strategy to prepare PMMA/SiO2
hybrid composites via “grafting onto” strategy based onUV irradiation in the presence of iron aqueous solution.Nanosilica particles have been surface modified by 3-(methacryloxy) propyl trimethoxysilane (MPTS) to possessdouble bonds, so that methyl methacrylate (MMA) canbeen grafting onto SiO2 with nanosilica as the core andPMMA as the shell. FeCl3 was used for the photoinitiator
Binding energy (eV)
Rel
ativ
ein
ten
sity
(cps
)
O1s
C1s
Si2sSi2p
1000 800 600 400 200 0
(a)
Binding energy (eV)
Rel
ativ
ein
ten
sity
(cps
)
O1sC1s
1000 800 600 400 200 0
(b)
Figure 6: XPS wide scan for (a) SiO2@MPTS particles and (b) SiO2
@PMMA particles (S-3).
under UV irradiation in this process. Scheme 1 shows theoverall synthesis route. The products were characterized byFT-IR, TGA, TEM, XPS, and DLS. In addition, differentproportions of SiO2 were added to discuss the best conditionof preparing PMMA/SiO2 particles with better monodisperseand uniform morphology.
2. Experimental Section
2.1. Materials. The silica having mean particle size of 20 nmwas kindly supplied by Aladdin Chemical Reagent Co.,Ltd. 3-(methacryloxy) propyl trimethoxysilane (MPTS)
Journal of Nanomaterials 5
290 285 280 275
(1) C1s
(b)
(a)
Rel
ativ
ein
ten
sity
(cps
)
Binding energy (eV)
(2) O1s
540 535 530 525 520
(b)
(a)
Rel
ativ
ein
ten
sity
(cps
)
Binding energy (eV)
(3) Si2p
105 100 95 90
(b)
(a)
Rel
ativ
ein
ten
sity
(cps
)
Binding energy (eV)
Figure 7: XPS analysis of C1s (1), O1s (2), and Si2p (3) spectra for(a) SiO2@MPTS particles and (b) SiO2@PMMA particles.
was acquired from Aldrich Chemical Co., Ltd. Hex-aaquo iron(III) chloride, FeCl3·6H2O (Across Organ-ics, 99%), was used as received. MMA (Fluka, 99%)was distilled to an ice bath under reduced pressure inthe presence of hydroquinone, washed twice with 5%NaOH in water, and dried over CaCl2. Cetyetrimethy-lammonium bromide (CTAB) was purchased from Sigma-Aldrich Chemical Co. (St. Louis, Mo). 2-hydroxy-4-(2-hydroxyethoxy)-2-methyl-propiophenone (Irgacure 2959)was acquired from Sigma-Aldrich Co. All chemicals wereof analytical grade and used without further purification.Doubly deionized water was used through all the pro-cesses.
2.2. Characterization. The FTIR measurements (Impact 400,Nicolet, Waltham, Mass) were carried out with the KBrpellet method. Thermogravimetric analysis (TGA) resultswere obtained with a TA Instrument 2050 thermogravimetricanalyzer at a heating rate of 10◦C/min from 25 to 800◦Cunder a nitrogen atmosphere. The microstructure of thesehybrid nanocomposites was imaged using Hitachi H-600equipment, and TEM samples of nanoparticles were pre-pared by casting one drop of a dilute colloid solution ontoa carbon-coated copper grid. X-ray photoelectron spectra(XPS) were performed on a PHI-5702 instrument usingMgKα radiation with pass energy of 29.35 eV. The productparticle size and its distribution were determined by dynamiclight scattering (DLS) using a Malvern Zetasizer NanoZSapparatus with a laser of 660 nm wavelength at 25◦C. Beforethe analysis, the latexes were diluted with deionized water tominimize the particle-particle interactions.
2.3. Synthesis
2.3.1. Surface Modification of Silica Particles. Into a 250 mLdried round-bottom flask, 3.0 g nanosilica was ultrasounddispersed in 100 mL ethanol for 30 min, then 2.5 g MPTSwas added and ultrasound dispersed for 2 h. The productwas washed by centrifugations/redispersions three times inethanol and dried in vacuum at room temperature for 24 h.The grafting density of grafted vinyl group was determinedby TGA and was calculated by [29]
Grafting density(mol/m2)
= (W60−730/(100−W60−730))× 100−Wsilica
MSspec × 100× 106,
(1)
where W60−730 is the weight loss from 60 to 730◦C corre-sponding to the decomposition of the MPTS, M (g/mol) isthe molar mass of the degradable part of the grafted molecule(205 g/mol), Sspec (m2/g) and Wsilica are the specific surfacearea and the weight loss of silica determined before grafting,respectively.
2.3.2. Photopolymerization of PMMA on [email protected]/SiO2 hybrid nanoparticles were synthesized throughsurface-grafted photopolymerization using a high-pressureHg lamp as the UV light source. The compositions ofemulsion are listed in Table 1. A pre-emulsification of SiO2-g-MPTS, MMA, CTAB, FeCl3·6H2O (or Irgacure 2959), andwater was carried out for 30 min in a flask with stirring ata speed of 400 rpm. The polymerization was conducted for10 min in a reactor with a quartz cap as shown in Figure 1.The UV source used was a 1000 W high-pressure mercurylamp, and the light intensity was 20 mW/cm2. Duringthe UV irradiation, stirring and a nitrogen purge weremaintained at ambient temperature. Hybrid particles wereisolated via centrifugation at 4000 rpm. Then the particleswere dispersed into 10 mL of tetrahydrofuran (THF) toremove PMMA absorbed on the particles. The solvent (THF)was replaced every eight hours. Particles were purified bycentrifugation/redispersion for three times and then dried at
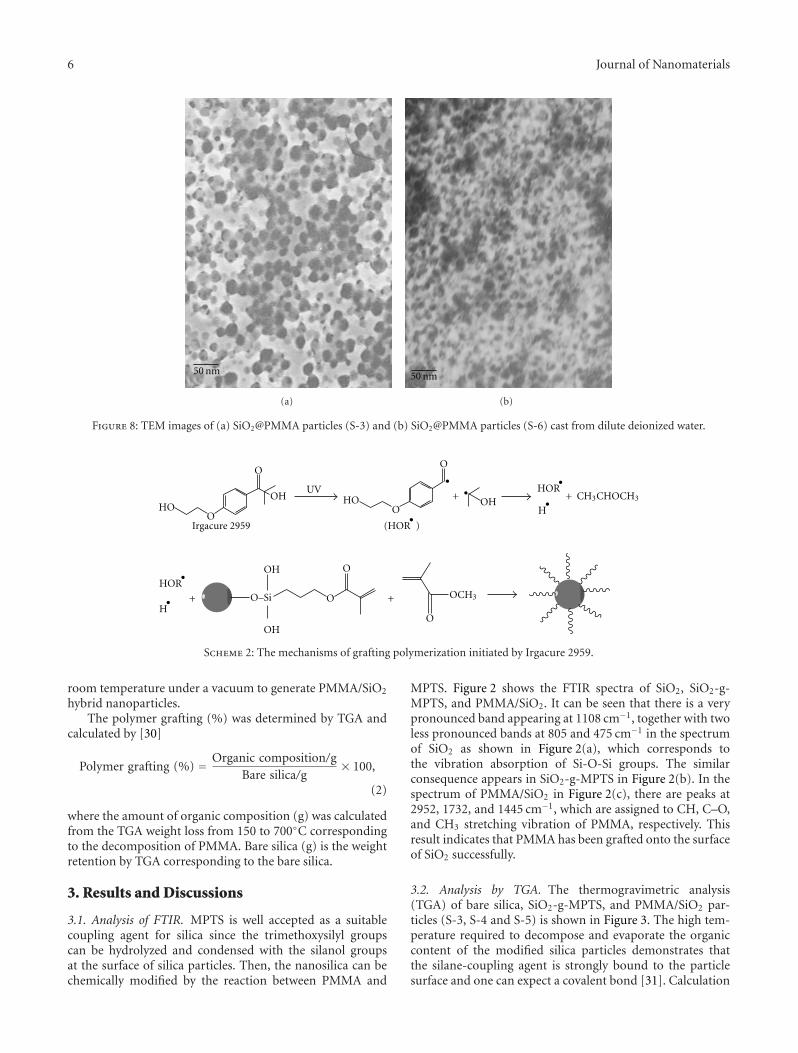
6 Journal of Nanomaterials
50 nm
(a)
50 nm
(b)
Figure 8: TEM images of (a) SiO2@PMMA particles (S-3) and (b) SiO2@PMMA particles (S-6) cast from dilute deionized water.
O
OHO +
(HOR•
)
CH3CHOCH3
•HOR• +
O
H
OCH3
••
HOR
+ +H
•
•
OH
O
OHO
UVOH
O–Si O
OH
OH
O
Irgacure 2959
Scheme 2: The mechanisms of grafting polymerization initiated by Irgacure 2959.
room temperature under a vacuum to generate PMMA/SiO2
hybrid nanoparticles.The polymer grafting (%) was determined by TGA and
calculated by [30]
Polymer grafting (%) = Organic composition/gBare silica/g
× 100,
(2)
where the amount of organic composition (g) was calculatedfrom the TGA weight loss from 150 to 700◦C correspondingto the decomposition of PMMA. Bare silica (g) is the weightretention by TGA corresponding to the bare silica.
3. Results and Discussions
3.1. Analysis of FTIR. MPTS is well accepted as a suitablecoupling agent for silica since the trimethoxysilyl groupscan be hydrolyzed and condensed with the silanol groupsat the surface of silica particles. Then, the nanosilica can bechemically modified by the reaction between PMMA and
MPTS. Figure 2 shows the FTIR spectra of SiO2, SiO2-g-MPTS, and PMMA/SiO2. It can be seen that there is a verypronounced band appearing at 1108 cm−1, together with twoless pronounced bands at 805 and 475 cm−1 in the spectrumof SiO2 as shown in Figure 2(a), which corresponds tothe vibration absorption of Si-O-Si groups. The similarconsequence appears in SiO2-g-MPTS in Figure 2(b). In thespectrum of PMMA/SiO2 in Figure 2(c), there are peaks at2952, 1732, and 1445 cm−1, which are assigned to CH, C–O,and CH3 stretching vibration of PMMA, respectively. Thisresult indicates that PMMA has been grafted onto the surfaceof SiO2 successfully.
3.2. Analysis by TGA. The thermogravimetric analysis(TGA) of bare silica, SiO2-g-MPTS, and PMMA/SiO2 par-ticles (S-3, S-4 and S-5) is shown in Figure 3. The high tem-perature required to decompose and evaporate the organiccontent of the modified silica particles demonstrates thatthe silane-coupling agent is strongly bound to the particlesurface and one can expect a covalent bond [31]. Calculation
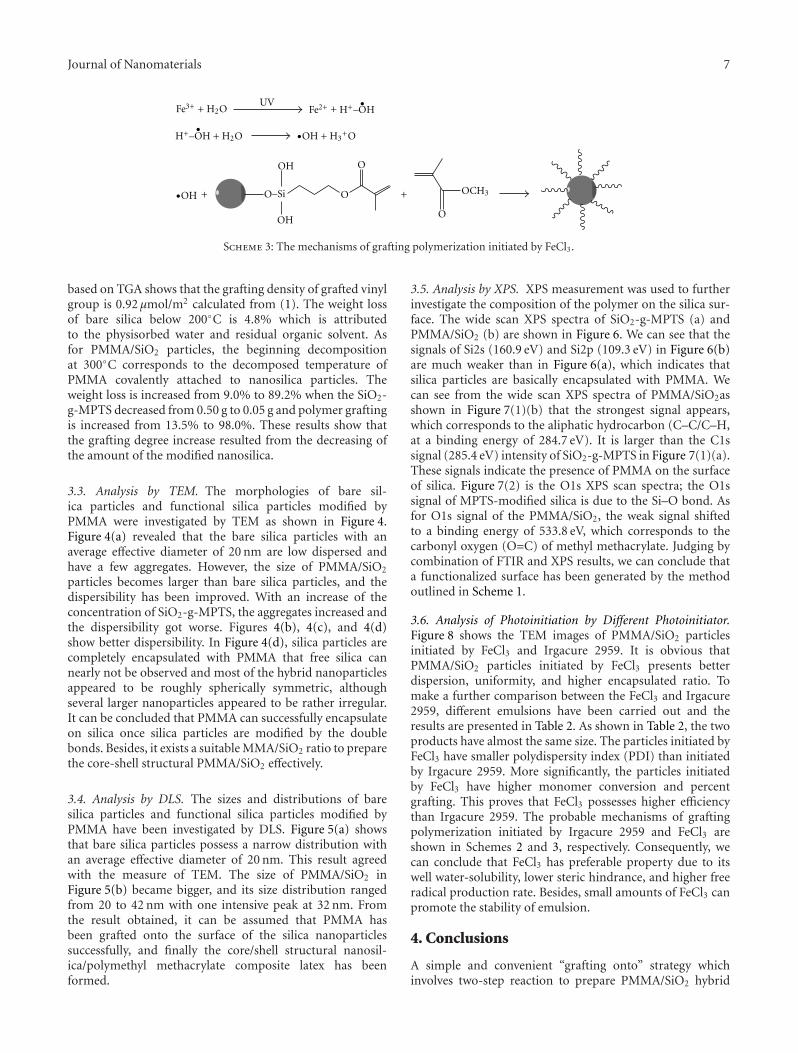
Journal of Nanomaterials 7
O
OCH3+ +
•UV
H+–OH + H2O •OH + H3+O
•OH
•Fe3+ + H2O Fe2+ + H+–OH
O–Si O
OH
OH
O
Scheme 3: The mechanisms of grafting polymerization initiated by FeCl3.
based on TGA shows that the grafting density of grafted vinylgroup is 0.92 μmol/m2 calculated from (1). The weight lossof bare silica below 200◦C is 4.8% which is attributedto the physisorbed water and residual organic solvent. Asfor PMMA/SiO2 particles, the beginning decompositionat 300◦C corresponds to the decomposed temperature ofPMMA covalently attached to nanosilica particles. Theweight loss is increased from 9.0% to 89.2% when the SiO2-g-MPTS decreased from 0.50 g to 0.05 g and polymer graftingis increased from 13.5% to 98.0%. These results show thatthe grafting degree increase resulted from the decreasing ofthe amount of the modified nanosilica.
3.3. Analysis by TEM. The morphologies of bare sil-ica particles and functional silica particles modified byPMMA were investigated by TEM as shown in Figure 4.Figure 4(a) revealed that the bare silica particles with anaverage effective diameter of 20 nm are low dispersed andhave a few aggregates. However, the size of PMMA/SiO2
particles becomes larger than bare silica particles, and thedispersibility has been improved. With an increase of theconcentration of SiO2-g-MPTS, the aggregates increased andthe dispersibility got worse. Figures 4(b), 4(c), and 4(d)show better dispersibility. In Figure 4(d), silica particles arecompletely encapsulated with PMMA that free silica cannearly not be observed and most of the hybrid nanoparticlesappeared to be roughly spherically symmetric, althoughseveral larger nanoparticles appeared to be rather irregular.It can be concluded that PMMA can successfully encapsulateon silica once silica particles are modified by the doublebonds. Besides, it exists a suitable MMA/SiO2 ratio to preparethe core-shell structural PMMA/SiO2 effectively.
3.4. Analysis by DLS. The sizes and distributions of baresilica particles and functional silica particles modified byPMMA have been investigated by DLS. Figure 5(a) showsthat bare silica particles possess a narrow distribution withan average effective diameter of 20 nm. This result agreedwith the measure of TEM. The size of PMMA/SiO2 inFigure 5(b) became bigger, and its size distribution rangedfrom 20 to 42 nm with one intensive peak at 32 nm. Fromthe result obtained, it can be assumed that PMMA hasbeen grafted onto the surface of the silica nanoparticlessuccessfully, and finally the core/shell structural nanosil-ica/polymethyl methacrylate composite latex has beenformed.
3.5. Analysis by XPS. XPS measurement was used to furtherinvestigate the composition of the polymer on the silica sur-face. The wide scan XPS spectra of SiO2-g-MPTS (a) andPMMA/SiO2 (b) are shown in Figure 6. We can see that thesignals of Si2s (160.9 eV) and Si2p (109.3 eV) in Figure 6(b)are much weaker than in Figure 6(a), which indicates thatsilica particles are basically encapsulated with PMMA. Wecan see from the wide scan XPS spectra of PMMA/SiO2asshown in Figure 7(1)(b) that the strongest signal appears,which corresponds to the aliphatic hydrocarbon (C–C/C–H,at a binding energy of 284.7 eV). It is larger than the C1ssignal (285.4 eV) intensity of SiO2-g-MPTS in Figure 7(1)(a).These signals indicate the presence of PMMA on the surfaceof silica. Figure 7(2) is the O1s XPS scan spectra; the O1ssignal of MPTS-modified silica is due to the Si–O bond. Asfor O1s signal of the PMMA/SiO2, the weak signal shiftedto a binding energy of 533.8 eV, which corresponds to thecarbonyl oxygen (O=C) of methyl methacrylate. Judging bycombination of FTIR and XPS results, we can conclude thata functionalized surface has been generated by the methodoutlined in Scheme 1.
3.6. Analysis of Photoinitiation by Different Photoinitiator.Figure 8 shows the TEM images of PMMA/SiO2 particlesinitiated by FeCl3 and Irgacure 2959. It is obvious thatPMMA/SiO2 particles initiated by FeCl3 presents betterdispersion, uniformity, and higher encapsulated ratio. Tomake a further comparison between the FeCl3 and Irgacure2959, different emulsions have been carried out and theresults are presented in Table 2. As shown in Table 2, the twoproducts have almost the same size. The particles initiated byFeCl3 have smaller polydispersity index (PDI) than initiatedby Irgacure 2959. More significantly, the particles initiatedby FeCl3 have higher monomer conversion and percentgrafting. This proves that FeCl3 possesses higher efficiencythan Irgacure 2959. The probable mechanisms of graftingpolymerization initiated by Irgacure 2959 and FeCl3 areshown in Schemes 2 and 3, respectively. Consequently, wecan conclude that FeCl3 has preferable property due to itswell water-solubility, lower steric hindrance, and higher freeradical production rate. Besides, small amounts of FeCl3 canpromote the stability of emulsion.
4. Conclusions
A simple and convenient “grafting onto” strategy whichinvolves two-step reaction to prepare PMMA/SiO2 hybrid
8 Journal of Nanomaterials
composites by UV irradiation is reported. Well-definedhybrid particles have been obtained via emulsion poly-merization. The grafting density of the polymer can beadjusted in a wide range by simply controlling the intro-duction and the conversion of the double bonds on thesilica surface. Especially, a small amount of FeCl3 can initiatethe polymerization in 10 min. It is highly efficient for thefunctionalization of nanosilica. Compared to the traditionalphotoinitiation initiated by Irgacure 2959, the productsinitiated by FeCl3 have higher monomer conversion, percentgrafting, and better monodispersion.
References
[1] S. T. Milner, “Polymer brushes,” Science, vol. 251, no. 4996, pp.905–914, 1991.
[2] L. P. Wang, Y. P. Wang, R. M. Wang, and S. C. Zhang, “Prepa-ration of polymer brushes on palygorskite surfaces via RAFTpolymerization,” Reactive and Functional Polymers, vol. 68, no.2, pp. 643–648, 2008.
[3] A. M. Granville, S. G. Boyes, B. Akgun, M. D. Foster, and W.J. Brittain, “Thermo-responsive behavior of semi-fluorinatedpolymer brushes on flat substrates,” Macromolecules, vol. 38,no. 8, pp. 3263–3270, 2005.
[4] Q. Zhou, X. Fan, C. Xia, J. Mays, and R. Advincula, “Livinganionic surface initiated polymerization (SIP) of styrene claysurfaces,” Chemistry of Materials, vol. 13, no. 8, pp. 2465–2467,2001.
[5] X. Fan, C. Xia, T. Fulghum, M. K. Park, J. Locklin, and R. C.Advincula, “Polymer brushes grafted from clay nanoparticlesadsorbed on a planar substrate by free radical surface-initiatedpolymerization,” Langmuir, vol. 19, no. 3, pp. 916–923,2003.
[6] D. A. Rider, J. I. L. Chen, J. C. Eloi et al., “Controlling themorphologies of organometallic block copolymers in the 3-dimensional spatial confinement of colloidal and inverse col-loidal crystals,” Macromolecules, vol. 41, no. 6, pp. 2250–2259,2008.
[7] W. Norde and D. Gags, “Interaction of bovine serum albuminand human blood plasma with PEO-tethered surfaces: influ-ence of PEO chain length, grafting density, and temperature,”Langmuir, vol. 20, no. 10, pp. 4162–4167, 2004.
[8] J. Lahiri, L. Isaacs, B. Grzybowski, J. D. Carbeck, and G. M.Whitesides, “Biospecifıc binding of carbonic anhydrase tomixed SAMs presenting benzenesulfonamide ligands: a modelsystem for studying lateral steric effects,” Langmuir, vol. 15, no.21, pp. 7186–7198, 1999.
[9] A. Hucknall, S. Rangarajan, and A. Chilkoti, “In pursuit ofzero: polymer brushes that resist the adsorption of proteins,”Advanced Materials, vol. 21, no. 23, pp. 2441–2446, 2009.
[10] D. E. Kataoka and S. M. Troian, “Patterning liquid flow on themicroscopic scale,” Nature, vol. 402, no. 6763, pp. 794–797,1999.
[11] B. Zhao and W. J. Brittain, “Polymer brushes: surface-immo-bilized macromolecules,” Progress in Polymer Science, vol. 25,no. 5, pp. 677–710, 2000.
[12] J. W. Park and E. L. Thomas, “A surface-reactive rod-coil diblock copolymer: nano- and micropatterned polymerbrushes,” Journal of the American Chemical Society, vol. 124,no. 4, pp. 514–515, 2002.
[13] F. Gong, M. Feng, C. Zhao, S. Zhang, and M. Yang, “Thermalproperties of poly(vinyl chloride)/montmorillonite nanocom-posites,” Polymer Degradation and Stability, vol. 84, no. 2, pp.289–294, 2004.
[14] H. Zheng, Y. Zhang, Z. Peng, and Y. Zhang, “Influence of claymodification on the structure and mechanical properties ofEPDM/montmorillonite nanocomposites,” Polymer Testing,vol. 23, no. 2, pp. 217–223, 2004.
[15] J. Y. Lee and H. K. Lee, “Characterization of organobentoniteused for polymer nanocomposites,” Materials Chemistry andPhysics, vol. 85, no. 2-3, pp. 410–415, 2004.
[16] F. Gong, M. Feng, C. Zhao, S. Zhang, and M. Yang, “Particleconfiguration and mechanical properties of poly(vinyl chlo-ride)/montmorillonite nanocomposites via in situ suspensionpolymerization,” Polymer Testing, vol. 23, no. 7, pp. 847–853,2004.
[17] D. C. Tully, A. R. Trimble, J. M. J. Frechet, K. Wilder, and C.F. Quate, “Synthesis and preparation of ionically bound den-drimer monolayers and application toward scanning probelithography,” Chemistry of Materials, vol. 11, no. 10, pp. 2892–2898, 1999.
[18] B. Zhao and W. J. Brittain, “Synthesis of polystyrene brusheson silicate substrates via carbocationic polymerization fromself-assembled monolayers,” Macromolecules, vol. 33, no. 2, pp.342–348, 2000.
[19] Y. Tran and P. Auroy, “Synthesis of poly(styrene sulfonate)brushes,” Journal of the American Chemical Society, vol. 123,no. 16, pp. 3644–3654, 2001.
[20] P. Mansky, Y. Liu, E. Huang, T. P. Russell, and C. Hawker,“Controlling polymer-surface interactions with random co-polymer brushes,” Science, vol. 275, no. 5305, pp. 1458–1460,1997.
[21] O. Prucker and J. Ruhe, “Synthesis of poly(styrene) mono-layers attached to high surface area silica gels through self-assembled monolayers of azo initiators,” Macromolecules, vol.31, no. 3, pp. 592–601, 1998.
[22] O. Prucker and J. Ruhe, “Mechanism of radical chain polymer-izations initiated by azo compounds covalently bound to thesurface of spherical particles,” Macromolecules, vol. 31, no. 3,pp. 602–613, 1998.
[23] E. Bourgeat-Lami and J. Lang, “Encapsulation of inorganicparticles by dispersion polymerization in polar media 1. Silicananoparticles encapsulated by polystyrene,” Journal of Colloidand Interface Science, vol. 197, no. 2, pp. 293–308, 1998.
[24] P. L. Kuo, N. J. Turro, C. M. Tseng, M. S. El-Aasser, and J.W. Vanderhoff, “Photoinitiated polymerization of styrene inmicroemulsions,” Macromolecules, vol. 20, no. 6, pp. 1216–1221, 1987.
[25] S. Atik and J. K. Thomas, “Photoinduced reactions in poly-merized microemulsions,” Journal of the American ChemicalSociety, vol. 105, no. 14, pp. 4515–4519, 1983.
[26] N. J. Turro, M. F. Chow, C. J. Chung, and C. H. Tung, “Mag-netic field and magnetic isotope effects on photoinducedemulsion polymerization,” Journal of the American ChemicalSociety, vol. 105, no. 6, pp. 1572–1577, 1983.
[27] N. J. Turro and K. S. Arora, “Magnetic effects on photoinducedemulsion polymerization. Effects of lanthanide ion addition,”Macromolecules, vol. 19, no. 1, pp. 42–46, 1986.
[28] M. G. Evans, M. Santappa, and N. Uri, “Photoinitiated freeradical polymerizationof vinyl compounds in aqueous solu-tion,” Journal of Polymer Science, vol. 7, no. 23, pp. 243–260,1951.

Journal of Nanomaterials 9
[29] H. Zhang, J. Wang, L. Li, Y. Song, M. Zhao, and X. Jian,“Synthesis of liquid polysilisiquioxane resins and properties ofcured films,” Thin Solid Films, vol. 517, no. 2, pp. 857–862,2008.
[30] Z. X. Guo and J. Yu, “Grafting of dendritic polyethers ontonanometre silica surface,” Journal of Materials Chemistry, vol.12, no. 3, pp. 468–472, 2002.
[31] A. Hartwig, M. Sebald, and M. Kleemeier, “Cross-linking ofcationically polymerised epoxides by nanoparticles,” Polymer,vol. 46, no. 7, pp. 2029–2039, 2005.
Hindawi Publishing CorporationJournal of NanomaterialsVolume 2012, Article ID 782986, 9 pagesdoi:10.1155/2012/782986
Research Article
Reinforcement of Natural Rubber with Core-Shell StructureSilica-Poly(Methyl Methacrylate) Nanoparticles
Qinghuang Wang,1 Yongyue Luo,2 Chunfang Feng,2, 3 Zhifeng Yi,2, 3
Quanfang Qiu,2 L. X. Kong,3 and Zheng Peng2
1 State Engineering and Technology Research Center for Key Tropical Crops, Haikou 571101, China2 Chinese Agricultural Ministry Key Laboratory of Tropical Crop Product Processing, Agricultural Product Processing Research Institute,Chinese Academy of Tropical Agricultural Sciences, Zhanjiang 524001, China
3 Centre for Material and Fiber Innovation, Institute for Technology Research Innovation, Deakin University, Geelong,VIC 3217, Australia
Correspondence should be addressed to L. X. Kong, [email protected] and Zheng Peng, [email protected]
Received 18 March 2011; Revised 10 June 2011; Accepted 18 June 2011
Academic Editor: Aruna Ar Nanda
Copyright © 2012 Qinghuang Wang et al. This is an open access article distributed under the Creative Commons AttributionLicense, which permits unrestricted use, distribution, and reproduction in any medium, provided the original work is properlycited.
A highly performing natural rubber/silica (NR/SiO2) nanocomposite with a SiO2 loading of 2 wt% was prepared by combiningsimilar dissolve mutually theory with latex compounding techniques. Before polymerization, double bonds were introduced ontothe surface of the SiO2 particles with the silane-coupling agent. The core-shell structure silica-poly(methyl methacrylate), SiO2-PMMA, nanoparticles were formed by grafting polymerization of MMA on the surface of the modified SiO2 particles via in situemulsion, and then NR/SiO2 nanocomposite was prepared by blending SiO2-PMMA and PMMA-modified NR (NR-PMMA). TheFourier transform infrared spectroscopy results show that PMMA has been successfully introduced onto the surface of SiO2, whichcan be well dispersed in NR matrix and present good interfacial adhesion with NR phase. Compared with those of pure NR, thethermal resistance and tensile properties of NR/SiO2 nanocomposite are significantly improved.
1. Introduction
Recently, considerable efforts have been expended on thepreparation of organic/inorganic nanocomposite materials[1, 2]. Inorganic nanoparticles possess small particle size,high surface area, as well as the quantum and surface effect,which make it possible for nanocomposites to performmore excellent physical and mechanical properties than con-ventional composites [3, 4]. Multifarious nanoscale fillers,including calcium carbonate [5], montmorillonite [6], car-bon black [7], and aluminum oxide [8], have been reportedin academic journals. Among them, nanosilica (SiO2), animportant member of inorganic nanofiller in compositespreparation, is widely used in the field of organic/inorganichybrid composites. Zhu et al. [9] prepared well-dispersedsilica-poly(methyl methacrylate) (SiO2-PMMA) nanoparti-cles by a suspension-dispersion-polymerization technique in
an aqueous system. Subsequently, SiO2-PMMA nanoparti-cles were induced into PVC matrix, and results showed thatthe heat resistance, elongation at break, and tensile strengthof PVC/SiO2 composites were significantly improved. Also,Peng et al. prepared natural rubber/silica nanocomposites(NR/SiO2) [10] and natural rubber/multiwalled carbon nan-otubes composite [11] combining self-assembly and latex-compounding techniques. Obtained nanocomposites wereperfectly strengthened, with increased thermal resistance andmechanical properties.
But on the other hand, as nanoscaled particles, nanosilicatend to the lowest energy state of bulk aggregation in polymermatrix because of large surface area and high surface energy,which in turn leads to structure flaws in the polymer matrixand interfere with the property of the whole product [12, 13].In order to enhance interfacial adhesion between nanosilicaand NR matrix and improve the dispersion of nanoparticles
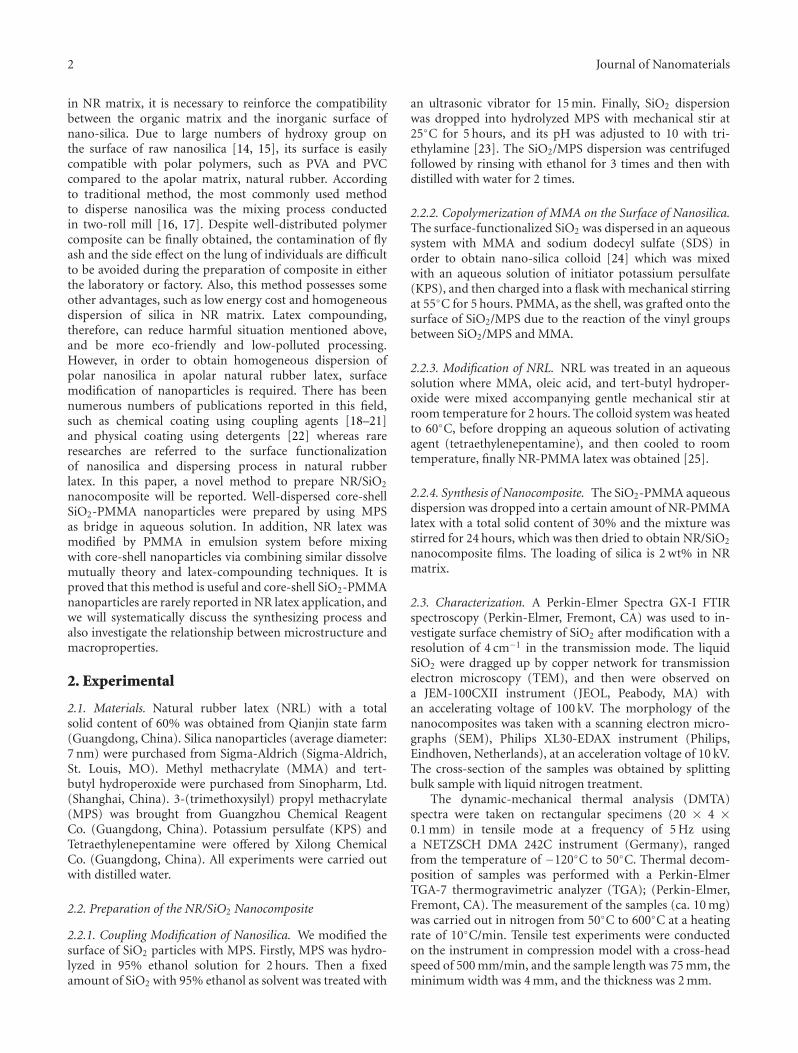
2 Journal of Nanomaterials
in NR matrix, it is necessary to reinforce the compatibilitybetween the organic matrix and the inorganic surface ofnano-silica. Due to large numbers of hydroxy group onthe surface of raw nanosilica [14, 15], its surface is easilycompatible with polar polymers, such as PVA and PVCcompared to the apolar matrix, natural rubber. Accordingto traditional method, the most commonly used methodto disperse nanosilica was the mixing process conductedin two-roll mill [16, 17]. Despite well-distributed polymercomposite can be finally obtained, the contamination of flyash and the side effect on the lung of individuals are difficultto be avoided during the preparation of composite in eitherthe laboratory or factory. Also, this method possesses someother advantages, such as low energy cost and homogeneousdispersion of silica in NR matrix. Latex compounding,therefore, can reduce harmful situation mentioned above,and be more eco-friendly and low-polluted processing.However, in order to obtain homogeneous dispersion ofpolar nanosilica in apolar natural rubber latex, surfacemodification of nanoparticles is required. There has beennumerous numbers of publications reported in this field,such as chemical coating using coupling agents [18–21]and physical coating using detergents [22] whereas rareresearches are referred to the surface functionalizationof nanosilica and dispersing process in natural rubberlatex. In this paper, a novel method to prepare NR/SiO2
nanocomposite will be reported. Well-dispersed core-shellSiO2-PMMA nanoparticles were prepared by using MPSas bridge in aqueous solution. In addition, NR latex wasmodified by PMMA in emulsion system before mixingwith core-shell nanoparticles via combining similar dissolvemutually theory and latex-compounding techniques. It isproved that this method is useful and core-shell SiO2-PMMAnanoparticles are rarely reported in NR latex application, andwe will systematically discuss the synthesizing process andalso investigate the relationship between microstructure andmacroproperties.
2. Experimental
2.1. Materials. Natural rubber latex (NRL) with a totalsolid content of 60% was obtained from Qianjin state farm(Guangdong, China). Silica nanoparticles (average diameter:7 nm) were purchased from Sigma-Aldrich (Sigma-Aldrich,St. Louis, MO). Methyl methacrylate (MMA) and tert-butyl hydroperoxide were purchased from Sinopharm, Ltd.(Shanghai, China). 3-(trimethoxysilyl) propyl methacrylate(MPS) was brought from Guangzhou Chemical ReagentCo. (Guangdong, China). Potassium persulfate (KPS) andTetraethylenepentamine were offered by Xilong ChemicalCo. (Guangdong, China). All experiments were carried outwith distilled water.
2.2. Preparation of the NR/SiO2 Nanocomposite
2.2.1. Coupling Modification of Nanosilica. We modified thesurface of SiO2 particles with MPS. Firstly, MPS was hydro-lyzed in 95% ethanol solution for 2 hours. Then a fixedamount of SiO2 with 95% ethanol as solvent was treated with
an ultrasonic vibrator for 15 min. Finally, SiO2 dispersionwas dropped into hydrolyzed MPS with mechanical stir at25◦C for 5 hours, and its pH was adjusted to 10 with tri-ethylamine [23]. The SiO2/MPS dispersion was centrifugedfollowed by rinsing with ethanol for 3 times and then withdistilled with water for 2 times.
2.2.2. Copolymerization of MMA on the Surface of Nanosilica.The surface-functionalized SiO2 was dispersed in an aqueoussystem with MMA and sodium dodecyl sulfate (SDS) inorder to obtain nano-silica colloid [24] which was mixedwith an aqueous solution of initiator potassium persulfate(KPS), and then charged into a flask with mechanical stirringat 55◦C for 5 hours. PMMA, as the shell, was grafted onto thesurface of SiO2/MPS due to the reaction of the vinyl groupsbetween SiO2/MPS and MMA.
2.2.3. Modification of NRL. NRL was treated in an aqueoussolution where MMA, oleic acid, and tert-butyl hydroper-oxide were mixed accompanying gentle mechanical stir atroom temperature for 2 hours. The colloid system was heatedto 60◦C, before dropping an aqueous solution of activatingagent (tetraethylenepentamine), and then cooled to roomtemperature, finally NR-PMMA latex was obtained [25].
2.2.4. Synthesis of Nanocomposite. The SiO2-PMMA aqueousdispersion was dropped into a certain amount of NR-PMMAlatex with a total solid content of 30% and the mixture wasstirred for 24 hours, which was then dried to obtain NR/SiO2
nanocomposite films. The loading of silica is 2 wt% in NRmatrix.
2.3. Characterization. A Perkin-Elmer Spectra GX-I FTIRspectroscopy (Perkin-Elmer, Fremont, CA) was used to in-vestigate surface chemistry of SiO2 after modification with aresolution of 4 cm−1 in the transmission mode. The liquidSiO2 were dragged up by copper network for transmissionelectron microscopy (TEM), and then were observed ona JEM-100CXII instrument (JEOL, Peabody, MA) withan accelerating voltage of 100 kV. The morphology of thenanocomposites was taken with a scanning electron micro-graphs (SEM), Philips XL30-EDAX instrument (Philips,Eindhoven, Netherlands), at an acceleration voltage of 10 kV.The cross-section of the samples was obtained by splittingbulk sample with liquid nitrogen treatment.
The dynamic-mechanical thermal analysis (DMTA)spectra were taken on rectangular specimens (20 × 4 ×0.1 mm) in tensile mode at a frequency of 5 Hz usinga NETZSCH DMA 242C instrument (Germany), rangedfrom the temperature of −120◦C to 50◦C. Thermal decom-position of samples was performed with a Perkin-ElmerTGA-7 thermogravimetric analyzer (TGA); (Perkin-Elmer,Fremont, CA). The measurement of the samples (ca. 10 mg)was carried out in nitrogen from 50◦C to 600◦C at a heatingrate of 10◦C/min. Tensile test experiments were conductedon the instrument in compression model with a cross-headspeed of 500 mm/min, and the sample length was 75 mm, theminimum width was 4 mm, and the thickness was 2 mm.
Journal of Nanomaterials 3
3. Results and Discussion
3.1. Mechanism of Preparing NR/SiO2 Nanocomposite Process.Figure 1 describes the scheme of the manufacturing processof NR/SiO2 nanocomposite. There are three main steps inthis process. The first step is to form core-shell SiO2-PMMAnanoparticles. The silane-coupling agent MPS are hydrolyzedto form silanol groups which condense with hydroxyl groupson the surface of silica to form a covalent bond. Becauseof the grafted MPS, unsaturated double bond (C=C) isintroduced onto the surface of silica nanoparticles [26].When the silane-coupling agent grafted on the surface ofSiO2 counters an unsaturated functional group in MMA,the copolymerization between SiO2/MPS and the copolymerPMMA will take place if there is an appropriate initiator.Eventually the core-shell SiO2-PMMA nanoparticles aresuccessfully obtained.
The second process is to prepare NR-PMMA latex. Themodification mechanism is as follows [27].
(1) The initiators decompose to generate free radical:
R R (1)
(2) MMA monomers are initiated to polymerize by freeradical R•.
C C
C
O
C
O
C RCH2 CH2 CH2
CH3CH3
OCH3OCH3 OCH3
CH3
C
O
PMMAMMA
(2)
(3) PMMA chain growth process is accompanied with theradical transferring to NR macromolecule.
CH2CH2 CH2
CH3 CH3
PMMAPMMA C CH C CH CH+ +α
n n(3)
(4) The combination of two radicals terminates the entirereaction.
C CH CH
C C O
C C
C
O
C C
C
O
C
O
C CH CH+n
n
CH2CH2
CH2
CH2
CH2CH2
CH3
CH3
H3C
H3CCH3CH3
OCH3
OCH3
OCH3
OCH3
(4)
The last stage is to blend core-shell SiO2-PMMA nano-particles and NR-PMMA via similar dissolve mutuallytheory. Compared with the other techniques [28, 29], theabove-mentioned process is more convenient and effective inpreparing NR/SiO2 nanocomposite.
3.2. Characterization of Core-Shell
SiO2-PMMA Nanoparticles
3.2.1. FTIR Study. After the formation of core-shell SiO2-PMMA nanoparticles, either chemical reaction or physicaladsorption would be characterized in the FTIR spectra.Therefore, before the measurement of FTIR, all the SiO2
nanoparticles modified with MMA have been extracted inacetone solution for 72 hours in order to eliminate un-grafted PMMA.
Figure 2 displays the infrared spectra of the eluateand pure acetone solution. It can be seen that the peakat 1730 cm−1 (Figure 2(A)) is assigned to C=O stretchingvibration of PMMA while after 72 hours extracting, thispeak disappears and only C=O stretching vibration ofacetone at 1715 cm−1 could be seen (Figure 2(B)). It can beproved that after 72 hours extracting, there is no redundantPMMA absorbed physically on SiO2-PMMA nanoparticles.Subsequently, rinsed solid SiO2-PMMA and unmodifiedSiO2 were measured through FTIR. It can be seen from
4 Journal of Nanomaterials
MMA
MMA
MMA
MMA
MMAMMA
MMA
MMA
MMA
MMA MMA
MMA
MMA
MMA MMA
MMA
MMA
MMA
MMA
MMA MMA
MMA
MMA
MMA
MMA
MMA
MMA
MMA
MMAMMA
MMA
MMA MMA
MMA
MMA
MMA
MMA
MMA
O
OH
OH
OH
HO
O
O
O
O
O(MPS)
R
R
R
R R KPS
R
SDS
R R
SiO2SiO2
SiO2
SiO2
SiO2
Dry
Nanocomposite
Blending
Tetraethylenepentamine
+
NRL particles
Oleic acid
Tert-butyl hydroperoxideCH2
CH2
CH2
CH3
CH3
CH3
CH3
CH3
CH2 CH2 CH2C
C C
C C
C Si (OCH3)3
Figure 1: Manufacturing process of NR/SiO2 nanocomposite.
Figure 3 that the adsorption peak at 1697 cm−1 assigned tothe C=O functional groups (Figure 3(B)) does not appear inFigure 3(A), which indicates that MPS has been successfullygrafted on the surface of SiO2 [30] and SiO2 and MPS arelinked with covalent bonds. Therefore, it is possible for MMAto graft onto the modified SiO2 nanoparticles. As can beseen from Figure 3(C) that the absorption peak at 1730 cm−1
assigned to the vibration absorption of C=O is obvious,accompanying with one less pronounced peak at 2975 cm−1
corresponding to CH3 groups of PMMA. All the resultsobtained from FTIR spectra confirm that PMMA successfully
grafted onto the SiO2 modified by MPS through chemicalbonds rather than simply physical adsorption.
3.2.2. TEM Observation. It is obvious that unmodified SiO2
nanoparticles are aggregated together and the diameterranges from 10 nm to 30 nm (Figure 4(a)) whilst becauseof the introduction of PMMA, nanoparticles (SiO2/MMA= 1 : 0.3) indicate well-dispersed morphology (Figure 4(b)).However, after being grafted by PMMA, dispersibility ofSiO2 is improved (Figure 4(b)). It can be also seen fromFigure 4(b) that single nanoparticle with a diameter around
Journal of Nanomaterials 5
4000 3000 2000 1500 1000 400
(cm−1)
1730 cm−1
1715 cm−1
1715 cm−1
(A)
(B)
(C)T(%
)
Figure 2: Infrared spectra of SiO2-PMMA soxhlet extraction solu-tion. (A) The first eluate; (B) the second eluate; (C) pure acetonesolution.
4000 3000 2000 1500 1000 400
(cm−1)
1730 cm−12975 cm−1
1697 cm−1
(A)
(B)
(C)
T(%
)
Figure 3: Infrared spectra of nanosilica, (A) unmodified SiO2; (B)SiO2-MPS; (C) SiO2-PMMA.
40–60 nm can be clearly observed, which is 30 nm thickerthan unmodified SiO2 particles. This illuminates that thecore, SiO2 nanoparticles, is successfully coated by the shell,PMMA, and the thickness of PMMA shell is about 25–35 nm. It can also be observed in the SEM images (Figure 5)where the core-shell SiO2-PMMA nanoparticles are evenlydispersed throughout NR matrix. However, when the ratioof SiO2/MMA reaches to 1 : 3, the sphere morphology isout of order (Figure 4(c)) due to the increasing prevalenceof PMMA homopolymerization, and PMMA will physicallybe absorbed on the surface of nanosilica. Meanwhile, theaggregation of nano-SiO2 deteriorates, and the diameterof the SiO2 clusters becomes much bigger compared withFigure 4(b). Therefore, from the results above the suitableSiO2/MMA ratio is 1 : 0.3, which is proved to be the propergrafting rate through large amounts of experimental work.
3.3. Characterization of NR/SiO2 Nanocomposites
3.3.1. SEM Observation. In recent work, NR/SiO2 nanocom-posite was prepared with a constant mixture rate (NR/SiO2 =98/2). Because SiO2 has been surface-functioned with MPSand MMA, the compatibility is improved between SiO2
nanoparticles and NR matrix, and, moreover, SiO2-PMMAnanoparticles with an average size ranged from 60 nm to
100 nm are uniformly dispersed in the matrix as indi-vidual spherical core-shell structure (Figure 5(c)). Whereasunmodified SiO2 in NR matrix (Figures 5(a) and 5(b))aggregate significantly and the size of the SiO2 clustersreaches to more than 200 nm. These results illustrate thatthe excellent compatibility between the SiO2-PMMA andNR-PMMA enhances the interaction between SiO2 and NR,and thus improves the adhesion and morphological structureof NR/SiO2 nanocomposites. The preparation method ofpolymer/SiO2 composites has been widely reported, suchas melt compounding [31] and other physical blending[32], however, the process presented in this paper possessessignificant advantages, for instance, the compatibility withNR is excellent and the size of SiO2 is approximately 80 nm.
3.3.2. Dynamic Thermal Mechanical Analysis. Dynamic ther-mal mechanical analysis (DTMA) can characterize thereaction between polymer molecular chains and inorganicparticles and the transformation from glass state to vis-coelastic state. It can be seen from Figure 6 that peaks ofcurves move to the direction of high temperature withthe enhancement of compatibility which can be seen fromSEM images (Figure 5). The glass-transition temperature(Tg) can be calculated from the peak of tand-T curve.Tg of NR-PMMA/SiO2-PMMA is obviously higher thanthat of the others (Figure 6), which reaches to −48◦C. Itcould be attributed to the well-dispersed core-shell SiO2-PMMA nanoparticles in NR-PMMA matrix. PMMA play animportant role in the molecular interaction between SiO2
and NR chains, declining the thermal motion of the NRmolecule [33]. Therefore, the adapting temperature rangeof rubber products has been expanded with the loading of2 wt% core-shell SiO2-PMMA nanoparticles.
In addition, NR-PMMA composite filled with core-shellSiO2-PMMA nanoparticles has a higher storage modulusthan the others at the temperature ranged from −100◦Cto −50◦C (Figure 7). When the temperature is below Tg ,the core-shell SiO2-PMMA nanocomposites possess a highstorage modulus, which is caused by introducing rigidnanosilica particles [34]. The increasing storage modulusattributes to the friction between the core-shell SiO2-PMMA nanoparticles and the NR-PMMA molecules whenthe nanosilica particles are thoroughly dispersed in the NRmatrix.
3.3.3. The Thermal Gravimetric Analysis. All samples aremeasured in nitrogen environment, which means nooxygenolysis of polymer molecules and that it well provesthe effect of the bridge molecule, PMMA. Adding SiO2-PMMA nanoparticles can enhance the thermal stabilityof composites. The main thermal decomposition of NRmatrix is at about 360◦C (Figure 8) where C–C chain bondsruptured and hydrogen transferred [35]. The degradationcurve of NR-PMMA/SiO2-PMMA is slightly shifted to ahigher temperature, compared with the other samples, dueto the intertwining between one PMMA chain on the surfaceof nanosilica and another PMMA chain grafted on NRmolecules.

6 Journal of Nanomaterials
250 nm
(a)
250 nm
(b)
250 nm
(c)
Figure 4: TEM micrographs of SiO2 nanoparticles in water. (a) Unmodified SiO2; (b) SiO2-PMMA(SiO2: MMA = 1 : 0.3); (c) SiO2-PMMA(SiO2: MMA = 1 : 3).
1μm
(a)
1μm
(b)
1μm
(c)
Figure 5: SEM micrographs of nanocomposites. (a) NR/SiO2; (b) NR-PMMA/SiO2; (c) NR-PMMA/SiO2-PMMA.
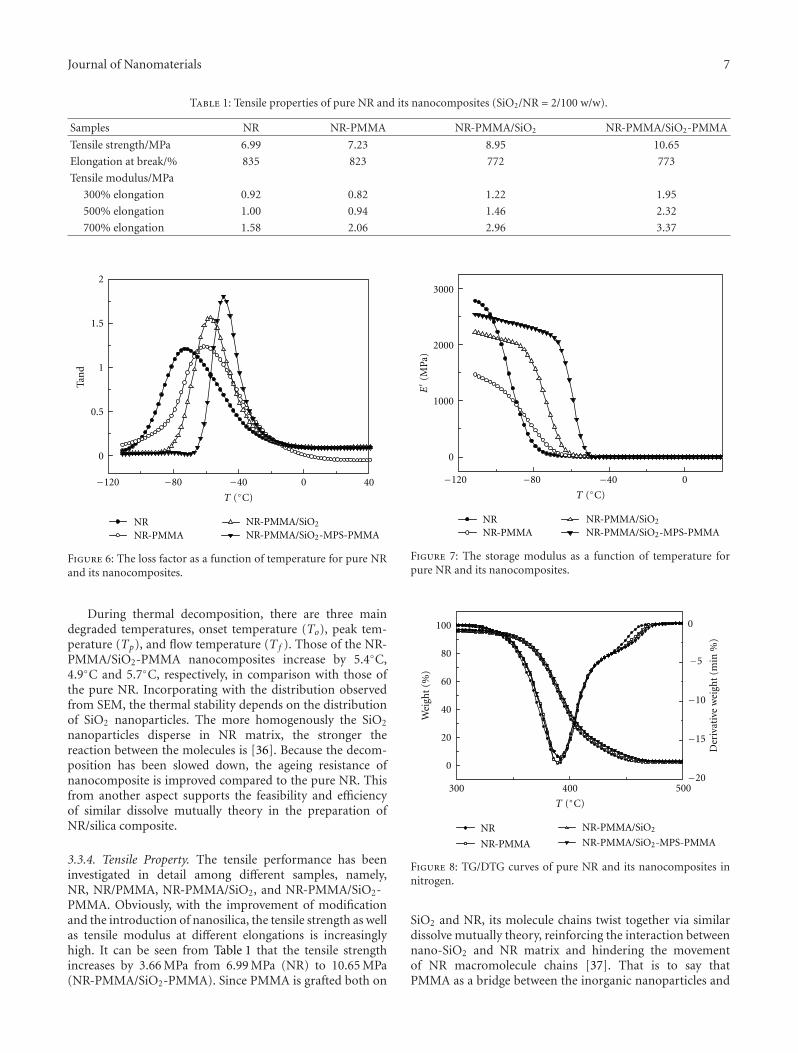
Journal of Nanomaterials 7
Table 1: Tensile properties of pure NR and its nanocomposites (SiO2/NR = 2/100 w/w).
Samples NR NR-PMMA NR-PMMA/SiO2 NR-PMMA/SiO2-PMMA
Tensile strength/MPa 6.99 7.23 8.95 10.65
Elongation at break/% 835 823 772 773
Tensile modulus/MPa
300% elongation 0.92 0.82 1.22 1.95
500% elongation 1.00 0.94 1.46 2.32
700% elongation 1.58 2.06 2.96 3.37
−120 −80 −40 0 40
0
0.5
1
1.5
2
Tan
d
T (◦C)
NRNR-PMMA
NR-PMMA/SiO2
NR-PMMA/SiO2-MPS-PMMA
Figure 6: The loss factor as a function of temperature for pure NRand its nanocomposites.
During thermal decomposition, there are three maindegraded temperatures, onset temperature (To), peak tem-perature (Tp), and flow temperature (T f ). Those of the NR-PMMA/SiO2-PMMA nanocomposites increase by 5.4◦C,4.9◦C and 5.7◦C, respectively, in comparison with those ofthe pure NR. Incorporating with the distribution observedfrom SEM, the thermal stability depends on the distributionof SiO2 nanoparticles. The more homogenously the SiO2
nanoparticles disperse in NR matrix, the stronger thereaction between the molecules is [36]. Because the decom-position has been slowed down, the ageing resistance ofnanocomposite is improved compared to the pure NR. Thisfrom another aspect supports the feasibility and efficiencyof similar dissolve mutually theory in the preparation ofNR/silica composite.
3.3.4. Tensile Property. The tensile performance has beeninvestigated in detail among different samples, namely,NR, NR/PMMA, NR-PMMA/SiO2, and NR-PMMA/SiO2-PMMA. Obviously, with the improvement of modificationand the introduction of nanosilica, the tensile strength as wellas tensile modulus at different elongations is increasinglyhigh. It can be seen from Table 1 that the tensile strengthincreases by 3.66 MPa from 6.99 MPa (NR) to 10.65 MPa(NR-PMMA/SiO2-PMMA). Since PMMA is grafted both on
−120 −80 −40 0
0
1000
2000
3000
E′ (
MPa
)
T (◦C)
NRNR-PMMA
NR-PMMA/SiO2
NR-PMMA/SiO2-MPS-PMMA
Figure 7: The storage modulus as a function of temperature forpure NR and its nanocomposites.
300 400 500
0
20
40
60
80
100
−20
−15
−10
−5
0
T (◦C)
NR
NR-PMMA
NR-PMMA/SiO2
NR-PMMA/SiO2-MPS-PMMA
Wei
ght
(%)
Der
ivat
ive
wei
ght
(min
%)
Figure 8: TG/DTG curves of pure NR and its nanocomposites innitrogen.
SiO2 and NR, its molecule chains twist together via similardissolve mutually theory, reinforcing the interaction betweennano-SiO2 and NR matrix and hindering the movementof NR macromolecule chains [37]. That is to say thatPMMA as a bridge between the inorganic nanoparticles and
8 Journal of Nanomaterials
polymer matrix improve the mutual compatibility which inturn results in excellent mechanical property. In addition,comparing the tensile strength between NR-PMMA andNR-PMMA/SiO2, nanosilica without grafting PMMA on itssurface can also reinforce the tensile property, from 7.23 to8.95 MPa.
4. Conclusion
A novel methodology, similar dissolve mutually theory, isintroduced to prepare NR/SiO2 nanocomposite in this paper.The core-shell SiO2-PMMA particles ranged from 60 nm to100 nm are well dispersed in latex at a suitable SiO2/MMAratio of 1 : 0.3, and the thickness of PMMA shell is about 25–35 nm. Moreover, the dispersion of core-shell SiO2-PMMAnanoparticles has been improved by grafting PMMA onboth nano-SiO2 and NR molecule chains. Based on theexcellent dispersion of SiO2-PMMA nanopaticles, Tg andthermal ageing resistances of nanocomposite are consider-ably enhanced. Meanwhile, the tensile strength increases by3.66 MPa compared with the pure NR. The recent research ismerely focusing on 2 wt% loading of nanosilica, and furtherwork will be extended into different addition of nanosilica.
Acknowledgments
The financial support from the Natural Science Foundationof China (Contract Grant no. 50763006), Ministry of Scienceand Technology R & D research institutes special fund (Con-tract Grant no. 2008EG134285) and 973 Program specialfund (Contract Grant no. 2010CB635109) are gratefullyacknowledged.
References
[1] L. Qi and S. J. Dong, “Organic/inorganic nanocompositepolymer electrolyte,” Chinese Chemical Letters, vol. 18, no. 2,pp. 185–188, 2007.
[2] W. E. Mahmoud, “A novel photodiode made of hybridorganic/inorganic nanocomposite,” Journal of Physics D, vol.42, no. 15, Article ID 155502, 2009.
[3] J. P. Salvetat, S. Bhattacharyya, and R. B. Pipes, “Progress onmechanics of carbon nanotubes and derived materials,”Journal of Nanoscience and Nanotechnology, vol. 6, no. 7, pp.1857–1882, 2006.
[4] Y. Xie, C. A. S. Hill, Z. Xiao, H. Militz, and C. Mai, “Silanecoupling agents used for natural fiber/polymer composites:a review,” Composites Part A, vol. 41, no. 7, pp. 806–819, 2010.
[5] I. Kemal, A. Whittle, R. Burford, T. Vodenitcharova, andM. Hoffman, “Toughening of unmodified polyvinylchloridethrough the addition of nanoparticulate calcium carbonate,”Polymer, vol. 50, no. 16, pp. 4066–4079, 2009.
[6] S. Habibi, A. Rashidi, S. Bazgir, A. A. Katbab, and M. Mon-tazer, “Preparation and flame retardancy of poly(ethyleneterephthalate)/ montmorillonite nanocomposites,” Asian Jour-nal of Chemistry, vol. 21, no. 6, pp. 4881–4888, 2009.
[7] C. Nakason, W. Pechurai, K. Sahakaro, and A. Kaesaman,“Rheological, thermal, and curing properties of naturalrubber-g-poly(methyl methacrylate),” Journal of Applied Poly-mer Science, vol. 99, no. 4, pp. 1600–1614, 2006.
[8] K. Balani, S. P. Harimkar, A. Keshri, Y. Chen, N. B. Dahotre,and A. Agarwal, “Multiscale wear of plasma-sprayed carbon-nanotube-reinforced aluminum oxide nanocomposite coat-ing,” Acta Materialia, vol. 56, no. 20, pp. 5984–5994, 2008.
[9] A. Zhu, Z. Shi, A. Cai, F. Zhao, and T. Liao, “Synthesis of core-shell PMMA-SiO2 nanoparticles with suspension-dispersion-polymerization in an aqueous system and its effect onmechanical properties of PVC composites,” Polymer Testing,vol. 27, no. 5, pp. 540–547, 2008.
[10] Z. Peng, L. X. Kong, S. D. Li, Y. Chen, and M. F. Huang, “Self-assembled natural rubber/silica nanocomposites: its prepara-tion and characterization,” Composites Science and Technology,vol. 67, no. 15-16, pp. 3130–3139, 2007.
[11] Z. Peng, C. Feng, Y. Luo, Y. Li, and L. X. Kong, “Self-assemblednatural rubber/multi-walled carbon nanotube compositesusing latex compounding techniques,” Carbon, vol. 48, no. 15,pp. 4497–4503, 2010.
[12] C. Charitidis and S. Logothetidis, “Nanoscale effects onthe nanomechanical properties of multifunctional materials,”Computational Materials Science, vol. 33, no. 1–3, pp. 296–302,2005.
[13] J. Oberdisse, “Aggregation of colloidal nanoparticles in poly-mer matrices,” Soft Matter, vol. 2, no. 1, pp. 29–36, 2006.
[14] Z. Y. Shen, L. Y. Li, Y. Li, and C. C. Wang, “Fabrication ofhydroxyl group modified monodispersed hybrid silica par-ticles and the h-SiO2/TiO2 core/shell microspheres as highperformance photocatalyst for dye degradation,” Journal ofColloid and Interface Science, vol. 354, no. 1, pp. 196–201, 2011.
[15] W. Xueqin, Z. Chunxi, J. Jing, S. Ningfang, and X. Hongjie,“Radiation-induced attenuation effect in hydroxyl-rich pure-silica-core photonic crystal fiber,” Optik. In press.
[16] S. Prasertsri and N. Rattanasom, “Mechanical and dampingproperties of silica/natural rubber composites prepared fromlatex system,” Polymer Testing, vol. 30, no. 5, pp. 515–526,2011.
[17] L. N. Carli, C. R. Roncato, A. Zanchet et al., “Characterizationof natural rubber nanocomposites filled with organoclay asa substitute for silica obtained by the conventional two-rollmill method,” Applied Clay Science, vol. 52, no. 1-2, pp. 56–61,2011.
[18] J. P. Matinlinna, L. V. J. Lassila, and P. K. Vallittu, “The effectof five silane coupling agents on the bond strength of a lutingcement to a silica-coated titanium,” Dental Materials, vol. 23,no. 9, pp. 1173–1180, 2007.
[19] C. Cherkouk, L. Rebohle, W. Skorupa, T. Strache, H. Reuther,and M. Helm, “Spraying spin coating silanization at roomtemperature of a SiO2 surface for silicon-based integrated lightemitters,” Journal of Colloid and Interface Science, vol. 337, no.2, pp. 375–380, 2009.
[20] X. K. Ma, N. H. Lee, H. J. Oh et al., “Surface modification andcharacterization of highly dispersed silica nanoparticles by acationic surfactant,” Colloids and Surfaces A, vol. 358, no. 1–3,pp. 172–176, 2010.
[21] A. M. Kartal and C. Erkey, “Surface modification of silicaaerogels by hexamethyldisilazane-carbon dioxide mixturesand their phase behavior,” The Journal of Supercritical Fluids,vol. 53, no. 1–3, pp. 115–120, 2010.
[22] F. Ebihara and S. Watano, “Development of a novel granulardetergent by inorganic solution binder,” Journal of ChemicalEngineering of Japan, vol. 35, no. 12, pp. 1263–1269, 2002.
[23] H. Yan, G. Tian, K. Sun, and Y. Zhang, “Effect of silane cou-pling agent on the polymer-filler interaction and mechanicalproperties of silica-filled NR,” Journal of Polymer Science, PartB, vol. 43, no. 5, pp. 573–584, 2005.
Journal of Nanomaterials 9
[24] N. Sombatsompop, E. Wimolmala, and T. Markpin, “Fly-ashparticles and precipitated silica as fillers in rubbers. II. Effectsof silica content and Si69-treatment in natural rubber/styrene-butadiene rubber vulcanizates,” Journal of Applied PolymerScience, vol. 104, no. 5, pp. 3396–3405, 2007.
[25] S. Ostad-Movahed, K. A. Yasin, A. Ansarifar, M. Song, andS. Hameed, “Comparing effects of silanized silica nanofilleron the crosslinking and mechanical properties of naturalrubber and synthetic polyisoprene,” Journal of Applied PolymerScience, vol. 109, no. 2, pp. 869–881, 2008.
[26] L. Bokobza and J. P. Chauvin, “Reinforcement of naturalrubber: use of in situ generated silicas and nanofibres ofsepiolite,” Polymer, vol. 46, no. 12, pp. 4144–4151, 2005.
[27] L. Bokobza and O. Rapoport, “Silica and carbon black rein-forcement of natural rubber,” Macromolecular Symposia, vol.194, no. 1, pp. 125–134, 2003.
[28] S. Varghese and J. Karger-Kocsis, “Natural rubber-basednanocomposites by latex compounding with layered silicates,”Polymer, vol. 44, no. 17, pp. 4921–4927, 2003.
[29] R. Magaraphan, W. Thaijaroen, and R. Lim-Ochakun, “Struc-ture and properties of natural rubber and modified montmo-rillonite nanocomposites,” Rubber Chemistry and Technology,vol. 76, no. 2, pp. 406–418, 2003.
[30] R. Y. Hong, H. P. Fu, Y. J. Zhang et al., “Surface-modified silicananoparticles for reinforcement of PMMA,” Journal of AppliedPolymer Science, vol. 105, no. 4, pp. 2176–2184, 2007.
[31] M. Tanahashi, M. Hirose, Y. Watanabe, J. C. Lee, and K.Takeda, “Silica/perfluoropolymer nanocomposites fabricatedby direct melt-compounding: a novel method without surfacemodification on nano-silica,” Journal of Nanoscience andNanotechnology, vol. 7, no. 7, pp. 2433–2442, 2007.
[32] J. J. Chen, C. F. Zhu, H. T. Deng, Z. N. Qin, and Y. Q.Bai, “Preparation and characterization of the waterbornepolyurethane modified with nanosilica,” Journal of PolymerResearch, vol. 16, no. 4, pp. 375–380, 2009.
[33] Z. Peng, L. X. Kong, and S. D. Li, “Dynamic mechanicalanalysis of polyvinylalcohol/silica nanocomposite,” SyntheticMetals, vol. 152, no. 1–3, pp. 25–28, 2005.
[34] G. Sui, W. H. Zhong, X. P. Yang, Y. H. Yu, and S. H. Zhao,“Preparation and properties of natural rubber compositesreinforced with pretreated carbon nanotubes,” Polymers forAdvanced Technologies, vol. 19, no. 11, pp. 1543–1549, 2008.
[35] Z. Peng and L. X. Kong, “A thermal degradation mechanismof polyvinyl alcohol/silica nanocomposites,” Polymer Degrada-tion and Stability, vol. 92, no. 6, pp. 1061–1071, 2007.
[36] R. Y. Hong, J. Z. Qian, and J. X. Cao, “Synthesis and char-acterization of PMMA grafted ZnO nanoparticles,” PowderTechnology, vol. 163, no. 3, pp. 160–168, 2006.
[37] R. Hong, T. Pan, and H. Fu, “On the silica/PMMA nanocom-posites,” Advanced Fibers and Polymer Materials, vol. 10, pp.19–27, 2005.
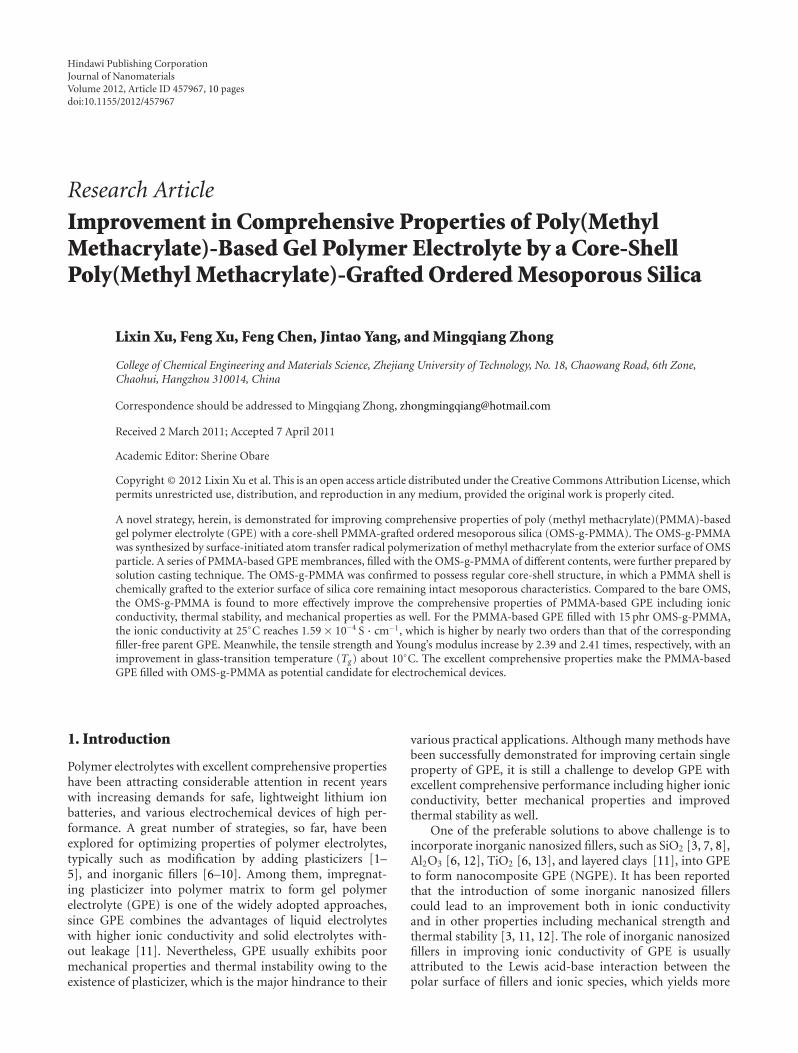
Hindawi Publishing CorporationJournal of NanomaterialsVolume 2012, Article ID 457967, 10 pagesdoi:10.1155/2012/457967
Research Article
Improvement in Comprehensive Properties of Poly(MethylMethacrylate)-Based Gel Polymer Electrolyte by a Core-ShellPoly(Methyl Methacrylate)-Grafted Ordered Mesoporous Silica
Lixin Xu, Feng Xu, Feng Chen, Jintao Yang, and Mingqiang Zhong
College of Chemical Engineering and Materials Science, Zhejiang University of Technology, No. 18, Chaowang Road, 6th Zone,Chaohui, Hangzhou 310014, China
Correspondence should be addressed to Mingqiang Zhong, [email protected]
Received 2 March 2011; Accepted 7 April 2011
Academic Editor: Sherine Obare
Copyright © 2012 Lixin Xu et al. This is an open access article distributed under the Creative Commons Attribution License, whichpermits unrestricted use, distribution, and reproduction in any medium, provided the original work is properly cited.
A novel strategy, herein, is demonstrated for improving comprehensive properties of poly (methyl methacrylate)(PMMA)-basedgel polymer electrolyte (GPE) with a core-shell PMMA-grafted ordered mesoporous silica (OMS-g-PMMA). The OMS-g-PMMAwas synthesized by surface-initiated atom transfer radical polymerization of methyl methacrylate from the exterior surface of OMSparticle. A series of PMMA-based GPE membrances, filled with the OMS-g-PMMA of different contents, were further prepared bysolution casting technique. The OMS-g-PMMA was confirmed to possess regular core-shell structure, in which a PMMA shell ischemically grafted to the exterior surface of silica core remaining intact mesoporous characteristics. Compared to the bare OMS,the OMS-g-PMMA is found to more effectively improve the comprehensive properties of PMMA-based GPE including ionicconductivity, thermal stability, and mechanical properties as well. For the PMMA-based GPE filled with 15 phr OMS-g-PMMA,the ionic conductivity at 25◦C reaches 1.59 × 10⁻⁴ S · cm−1, which is higher by nearly two orders than that of the correspondingfiller-free parent GPE. Meanwhile, the tensile strength and Young’s modulus increase by 2.39 and 2.41 times, respectively, with animprovement in glass-transition temperature (Tg) about 10◦C. The excellent comprehensive properties make the PMMA-basedGPE filled with OMS-g-PMMA as potential candidate for electrochemical devices.
1. Introduction
Polymer electrolytes with excellent comprehensive propertieshave been attracting considerable attention in recent yearswith increasing demands for safe, lightweight lithium ionbatteries, and various electrochemical devices of high per-formance. A great number of strategies, so far, have beenexplored for optimizing properties of polymer electrolytes,typically such as modification by adding plasticizers [1–5], and inorganic fillers [6–10]. Among them, impregnat-ing plasticizer into polymer matrix to form gel polymerelectrolyte (GPE) is one of the widely adopted approaches,since GPE combines the advantages of liquid electrolyteswith higher ionic conductivity and solid electrolytes with-out leakage [11]. Nevertheless, GPE usually exhibits poormechanical properties and thermal instability owing to theexistence of plasticizer, which is the major hindrance to their
various practical applications. Although many methods havebeen successfully demonstrated for improving certain singleproperty of GPE, it is still a challenge to develop GPE withexcellent comprehensive performance including higher ionicconductivity, better mechanical properties and improvedthermal stability as well.
One of the preferable solutions to above challenge is toincorporate inorganic nanosized fillers, such as SiO2 [3, 7, 8],Al2O3 [6, 12], TiO2 [6, 13], and layered clays [11], into GPEto form nanocomposite GPE (NGPE). It has been reportedthat the introduction of some inorganic nanosized fillerscould lead to an improvement both in ionic conductivityand in other properties including mechanical strength andthermal stability [3, 11, 12]. The role of inorganic nanosizedfillers in improving ionic conductivity of GPE is usuallyattributed to the Lewis acid-base interaction between thepolar surface of fillers and ionic species, which yields more
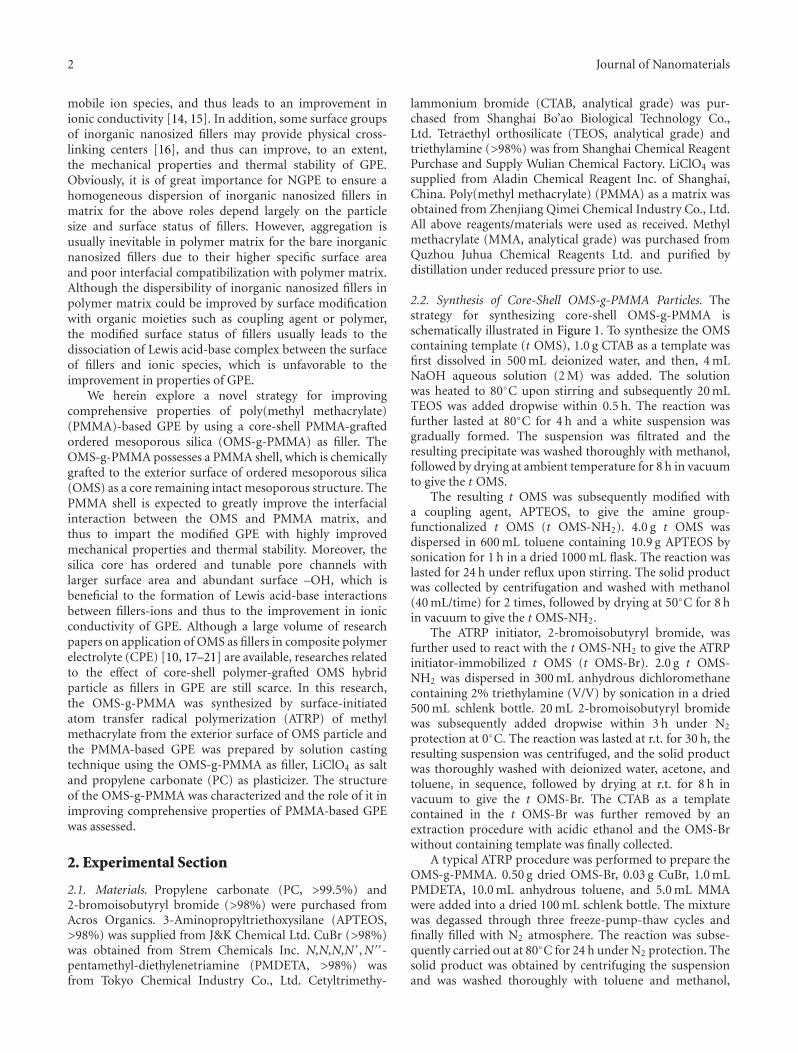
2 Journal of Nanomaterials
mobile ion species, and thus leads to an improvement inionic conductivity [14, 15]. In addition, some surface groupsof inorganic nanosized fillers may provide physical cross-linking centers [16], and thus can improve, to an extent,the mechanical properties and thermal stability of GPE.Obviously, it is of great importance for NGPE to ensure ahomogeneous dispersion of inorganic nanosized fillers inmatrix for the above roles depend largely on the particlesize and surface status of fillers. However, aggregation isusually inevitable in polymer matrix for the bare inorganicnanosized fillers due to their higher specific surface areaand poor interfacial compatibilization with polymer matrix.Although the dispersibility of inorganic nanosized fillers inpolymer matrix could be improved by surface modificationwith organic moieties such as coupling agent or polymer,the modified surface status of fillers usually leads to thedissociation of Lewis acid-base complex between the surfaceof fillers and ionic species, which is unfavorable to theimprovement in properties of GPE.
We herein explore a novel strategy for improvingcomprehensive properties of poly(methyl methacrylate)(PMMA)-based GPE by using a core-shell PMMA-graftedordered mesoporous silica (OMS-g-PMMA) as filler. TheOMS-g-PMMA possesses a PMMA shell, which is chemicallygrafted to the exterior surface of ordered mesoporous silica(OMS) as a core remaining intact mesoporous structure. ThePMMA shell is expected to greatly improve the interfacialinteraction between the OMS and PMMA matrix, andthus to impart the modified GPE with highly improvedmechanical properties and thermal stability. Moreover, thesilica core has ordered and tunable pore channels withlarger surface area and abundant surface –OH, which isbeneficial to the formation of Lewis acid-base interactionsbetween fillers-ions and thus to the improvement in ionicconductivity of GPE. Although a large volume of researchpapers on application of OMS as fillers in composite polymerelectrolyte (CPE) [10, 17–21] are available, researches relatedto the effect of core-shell polymer-grafted OMS hybridparticle as fillers in GPE are still scarce. In this research,the OMS-g-PMMA was synthesized by surface-initiatedatom transfer radical polymerization (ATRP) of methylmethacrylate from the exterior surface of OMS particle andthe PMMA-based GPE was prepared by solution castingtechnique using the OMS-g-PMMA as filler, LiClO4 as saltand propylene carbonate (PC) as plasticizer. The structureof the OMS-g-PMMA was characterized and the role of it inimproving comprehensive properties of PMMA-based GPEwas assessed.
2. Experimental Section
2.1. Materials. Propylene carbonate (PC, >99.5%) and2-bromoisobutyryl bromide (>98%) were purchased fromAcros Organics. 3-Aminopropyltriethoxysilane (APTEOS,>98%) was supplied from J&K Chemical Ltd. CuBr (>98%)was obtained from Strem Chemicals Inc. N,N,N,N ′,N ′′-pentamethyl-diethylenetriamine (PMDETA, >98%) wasfrom Tokyo Chemical Industry Co., Ltd. Cetyltrimethy-
lammonium bromide (CTAB, analytical grade) was pur-chased from Shanghai Bo’ao Biological Technology Co.,Ltd. Tetraethyl orthosilicate (TEOS, analytical grade) andtriethylamine (>98%) was from Shanghai Chemical ReagentPurchase and Supply Wulian Chemical Factory. LiClO4 wassupplied from Aladin Chemical Reagent Inc. of Shanghai,China. Poly(methyl methacrylate) (PMMA) as a matrix wasobtained from Zhenjiang Qimei Chemical Industry Co., Ltd.All above reagents/materials were used as received. Methylmethacrylate (MMA, analytical grade) was purchased fromQuzhou Juhua Chemical Reagents Ltd. and purified bydistillation under reduced pressure prior to use.
2.2. Synthesis of Core-Shell OMS-g-PMMA Particles. Thestrategy for synthesizing core-shell OMS-g-PMMA isschematically illustrated in Figure 1. To synthesize the OMScontaining template (t OMS), 1.0 g CTAB as a template wasfirst dissolved in 500 mL deionized water, and then, 4 mLNaOH aqueous solution (2 M) was added. The solutionwas heated to 80◦C upon stirring and subsequently 20 mLTEOS was added dropwise within 0.5 h. The reaction wasfurther lasted at 80◦C for 4 h and a white suspension wasgradually formed. The suspension was filtrated and theresulting precipitate was washed thoroughly with methanol,followed by drying at ambient temperature for 8 h in vacuumto give the t OMS.
The resulting t OMS was subsequently modified witha coupling agent, APTEOS, to give the amine group-functionalized t OMS (t OMS-NH2). 4.0 g t OMS wasdispersed in 600 mL toluene containing 10.9 g APTEOS bysonication for 1 h in a dried 1000 mL flask. The reaction waslasted for 24 h under reflux upon stirring. The solid productwas collected by centrifugation and washed with methanol(40 mL/time) for 2 times, followed by drying at 50◦C for 8 hin vacuum to give the t OMS-NH2.
The ATRP initiator, 2-bromoisobutyryl bromide, wasfurther used to react with the t OMS-NH2 to give the ATRPinitiator-immobilized t OMS (t OMS-Br). 2.0 g t OMS-NH2 was dispersed in 300 mL anhydrous dichloromethanecontaining 2% triethylamine (V/V) by sonication in a dried500 mL schlenk bottle. 20 mL 2-bromoisobutyryl bromidewas subsequently added dropwise within 3 h under N2
protection at 0◦C. The reaction was lasted at r.t. for 30 h, theresulting suspension was centrifuged, and the solid productwas thoroughly washed with deionized water, acetone, andtoluene, in sequence, followed by drying at r.t. for 8 h invacuum to give the t OMS-Br. The CTAB as a templatecontained in the t OMS-Br was further removed by anextraction procedure with acidic ethanol and the OMS-Brwithout containing template was finally collected.
A typical ATRP procedure was performed to prepare theOMS-g-PMMA. 0.50 g dried OMS-Br, 0.03 g CuBr, 1.0 mLPMDETA, 10.0 mL anhydrous toluene, and 5.0 mL MMAwere added into a dried 100 mL schlenk bottle. The mixturewas degassed through three freeze-pump-thaw cycles andfinally filled with N2 atmosphere. The reaction was subse-quently carried out at 80◦C for 24 h under N2 protection. Thesolid product was obtained by centrifuging the suspensionand was washed thoroughly with toluene and methanol,
Journal of Nanomaterials 3
APTEOS
ATRP initiator2-bromoisobutyryl
bromide
PMMA/PC/LiClO4
in THFsolution casting
ATRP/MMA
Remove CTABtemplate
ATRP initiator immobilizedOMS (OMS-Br)
PMMA-grafted OMS(OMS-g-PMMA)
PMMA/PC/LiClO4/OMS-g-PMMAgel polymer electrolyte membrane
PMMA chain
OH
OH
OH
HO
OH
OH
HO
HO
Br
Br
Br
Br
Br
Br
Br
Br
Br
Br
Br
Br
Br
Br
Br
Br
NH2
NH2
NH2
NH2
NH2
H2N
H2N
H2N
Ordered mesoporous silicacontaining CTAB template
(t OMS)
Amine-group functionalizedt OMS (t OMS-NH2)
ATRP initiator groupimmobilized
t OMS (t OMS-Br)
ClO4− Li+
Figure 1: The schematic illustration for the synthesis of OMS-g-PMMA and preparation of PMMA/PC/LiClO4/OMS-g-PMMA gel polymerelectrolyte membrane.
respectively. The resulting powder was finally dried at 40◦Cfor 24 h in vacuum, giving the OMS-g-PMMA.
2.3. Preparation of the PMMA-Based GPE Filled with theOMS-g-PMMA. The PMMA-based GPE filled with theOMS-g-PMMA was prepared by a solution casting tech-nique. In a typical procedure, the synthesized OMS-g-PMMA (5∼20 mg) was first dispersed in 20 mL THF con-taining 30 mg PC and 50 mg LiClO4 by sonication for 1 h,and then, the solvent was removed in vacuo to give a powder-like mixture, OMS-g-PMMA/PC/LiClO4 (marked as I). Thematrix, PMMA, was further dissolved in THF to form a 30wt % solution (marked as II). A series of PMMA-based GPEfilled with the OMS-g-PMMA of different loading concen-trations, PMMA/PC/LiClO4/OMS-g-PMMA (100/30/50/x,w/w/w/w, x changes from 0 to 20), were finally obtained bymixing I and II under sonication and subsequent drying atroom temperature for 48 h in a PTFE mould. The x, herein,represents the actual weight of OMS in the OMS-g-PMMA,which can be calculated based on thermogravimetric analysis(TGA). For comparison, a series of PMMA-based GPEfilled with the bare OMS, PMMA/PC/LiClO4/bare OMS(100/30/50/x, w/w/w/w, x changes from 0 to 20), were alsoprepared through the similar procedure mentioned as above.For all the prepared GPE membranes, the average thicknessis controlled at ∼0.20 cm.
2.4. Characterization. Fourier transform infrared spectro-scopy (FTIR) spectra were recorded on a Nicolet 6700 FTIRspectrometer. All samples were prepared as pellets usingspectroscopic grade KBr in a presser. TGA was performedon a SDT Q600 thermogravimetry analyzer. Measurementswere carried out under N2 protection from 25◦C to 800◦C ata heating rate of 20◦C/min. High-resolution transmittanceelectron microscopy (HRTEM) analysis was performed on a300 kV JEM-100 CX II transmittance electron microscope.TEM samples were prepared by dispersing little sample inethanol and subsequent depositing onto copper grids. Small-angle X-ray diffraction (SAXRD) analysis was carried outusing an XD-98 diffractometer with Cu irradiation (36 kV,30 mA) at ambient temperature. The scanning rate is2.0◦/min for all samples with a step size of 0.02◦. Differentialscanning calorimetry (DSC) curves were obtained on a DSCQ100 instrument equipped with a refrigerated coolingsystem (RCS) under N2 atmosphere. Samples were heatedfrom 40◦C to 200◦C at 50◦C/min and then cooled to 40◦Cat 20◦C/min to eliminate heating history. Then, the datawas recorded on the second heating from 40◦C to 200◦Cat 20◦C/min. For all samples, the glass transfer temperature(Tg) was read as the middle of the change in heat capacity.The mechanical properties of PMMA-based GPE were testedon a CMT 5104 universal materials mechanics tester atambient temperature. The crosshead speed was controlled at15 mm/min. The test samples were designed as rectangular
4 Journal of Nanomaterials
pieces with a dimension of 2.5 cm (length) × 1.1 cm (width)× 0.1∼0.3 cm (thickness). The ionic conductivity of PMMA-based GPE was determined by alternating current (AC)impedance analysis on a CHI 650B electrochemical work-station. The measurements were carried out using an elec-trochemical cell consisting of polymer electrolyte membranesandwiched between two stainless steel electrodes in a fre-quency range of 10 Hz to 0.1 MHz over a temperature rangeof 298∼353 K at a relative constant humidity. The ionicconductivity was calculated by
σ = 1Rb× d
S, (1)
where d is the thickness of electrolyte membrane; S is thecontact area between electrode and electrolyte membrane;Rb is the bulk impedance of electrolyte membrane. In thisresearch, the Rb was fitted through a Zplot software accord-ing to the equivalent circuit of impedance data.
3. Results and Discussion
3.1. Structure Characterization of the OMS-g-PMMA. Asschematically illustrated in Figure 1, the core-shell PMMA-grafted OMS hybrid particle was synthesized by surface-initiated ATRP based on a literature method [22]. The OMSremaining template (t OMS) was first synthesized by sol-gelmethod and then modified with a coupling agent, APTEOS,to give the amine group-functionalized t OMS (t OMS-NH2). The ATRP initiator, 2-bromoisobutyryl bromide, wasfurther chemically immobilized onto the exterior surface ofOMS by reacting with the amine group from the t OMS-NH2and the ATRP initiator-immobilized OMS (OMS-Br)was obtained by removing the template contained in the tOMS-Br through an extraction procedure. The core-shellPMMA-grafted OMS was thus expected to be obtained byusing the resulting OMS-Br as substrate for subsequentsurface-initiated ATRP of MMA. The structure of the syn-thesized OMS-g-PMMA was characterized by FTIR, TGA,HRTEM, and SAXRD analysis, respectively.
Figures 2(a)–2(c) illustrates and compares the FTIR spec-tra of the bare OMS, OMS-Br, and OMS-g-PMMA sample.The peaks at 1087 cm−1, 1637 cm−1 and 3400 cm−1 can beclearly observed for all the spectra. Among them, the peak at1087 cm−1 originates from the Si-O stretching vibration inthe bulk silica and the peaks at 1637 cm−1 and 3400 cm−1
are usually attributed to the adsorbed water on the surface ofsilica particles. In the spectrum (Figure 2(b)) of the ATRPinitiator-functionalized OMS, OMS-Br, two weak peaks at2854 cm−1 and 2928 cm−1, characteristic of alky C-H stretch-ing vibration modes, are found, while they are absent inthat (Figure 2(a)) of the bare OMS, indicating that the ATRPinitiator, 2-bromoisobutyryl bromide, has been covalentlyimmobilized onto the OMS particles. The stronger peakat 1735 cm−1 in the spectrum (Figure 2(c)) of the purifiedOMS-g-PMMA should be assigned to the C=O stretchingvibration associated with the ester group from the graftedPMMA. In addition, two peaks at 2946 cm−1 and 2850 cm−1,characteristic of alky C-H stretching vibration, are also found
a
b
c29282854
2946
2850
1735
1637 958 796
465
1087
400900140019002400290034003900
Wavenumber (cm−1)
Tran
smit
tan
ce(%
)
Figure 2: Fourier transform infrared (FTIR) spectra of the bareOMS (a), OMS-Br, (b) and OMS-g-PMMA (c).
a
b
c
89.71%
69.53%
40.5%
8007006005004003002001000
Temperature (◦C)
20
30
40
50
60
70
80
90
100
110
Wei
ght
(%)
Figure 3: Thermogravimetry analysis (TGA) curves of the bareOMS (a), OMS-Br, (b) and OMS-g-PMMA (c).
in above spectrum, corresponding to the added alky groupsfrom the grafted PMMA. These indicate that PMMA chainshave been chemically bonded to the surface of OMS particles.
The TGA curves for the above three samples are shownin Figures 3(a)–3(c). A mass loss at 700◦C about 10.29% isfound for the bare OMS, which might be due to the loss ofassociated water and remaining CTAB template. Comparedto the bare OMS, the mass loss at 700◦C for the OMS-Brincreases from 10.29% to 30.47%, due to the introductionof chemically bonded coupling agent and ATRP initiatorgroups. The mass loss at 700◦C further increases to 59.50%for the OMS-g-PMMA, indicating that PMMA chains havebeen covalently grafted to the surface of OMS particles.Taking the mass loss at 700◦C as reference, the graftingratio of PMMA in the OMS-g-PMMA could be calculatedto be 0.99 g PMMA/g OMS by assuming that all the organicmoieties were lost at 700◦C.
The morphology of the bare OMS and OMS-g-PMMAparticles was characterized by using HRTEM technique.
Journal of Nanomaterials 5
100 nm
(a)
50 nm
(b)
100 nm
(c)
50 nm
20 nm
(d)
Figure 4: High-resolution transmittance electron microscopy (HRTEM) images of the bare OMS ((a), (b)) and OMS-g-PMMA ((c), (d)).
Figures 4(a) and 4(b) shows the HRTEM images of thebare OMS. It can be observed that the bare OMS particlesexhibit a roughly spherical shape with an average diameterabout 100 nm (Figure 4(a)). In addition, the hexagonallypacked dots and parallel stripes are obvious for the bareOMS as shown in Figure 4(b), indicating a typical MCM-41type mesoporous channel structure. The average pore sizeof the bare OMS is about 3∼4 nm (Figure 4(b)), which iscomparable to that (3.5 nm) determined by N2 adsorptiontesting. Figures 4(c) and 4(d) shows the HRTEM imagesfor the OMS-g-PMMA. A smooth PMMA shell aroundthe exterior surface of OMS particle, as a core, could beclearly found with an average shell thickness about 20 nm(Figure 4(d)). Moreover, it is also clear that the orderedmesoporous structure of the OMS core is still intact aftersurface modification by surface-initiated ATRP of MMA.
Figures 5(a) and 5(b) shows the small-angle X-ray dif-fraction patterns of the bare OMS and OMS-g-PMMA. TheXRD pattern for the bare OMS (Figure 5(a)) exhibits anintense peak at 2θ = 2.148◦, which is usually associated withthe (100) diffraction when a hexagonal cell is assumed [23].
In addition, two weak peaks, in the region of 2θ = 3.5∼4.5◦,is also found in the above pattern, which can be indexedas the (110) and (200) diffractions. These confirm thatthe synthesized OMS has a typical MCM-41 type orderedmesoporous channel structure. As shown in Figure 5(b), theXRD pattern for the OMS-g-PMMA is similar to that of thebare OMS, indicating a remaining intact hexagonal array ofthe pores in the OMS core after the surface-initiated ATRP ofMMA.
3.2. Ionic Conductivity Properties. To examine the effect ofthe resulting core-shell OMS-g-PMMA on improving theionic conductivity of PMMA-based GPE, two types of GPEincluding PMMA/PC/LiClO4/OMS-g-PMMA and PMMA/PC/LiClO4/bare OMS were prepared, respectively, with dif-ferent filler-loading contents by a solution casting technique.The ionic conductivity of the resulting GPE was subsequent-ly determined and compared by AC impendence analy-sis method. Figure 6 shows the impendence plots forthe GPE, PMMA/PC/LiClO4/OMS-g-PMMA (100/30/50/15,
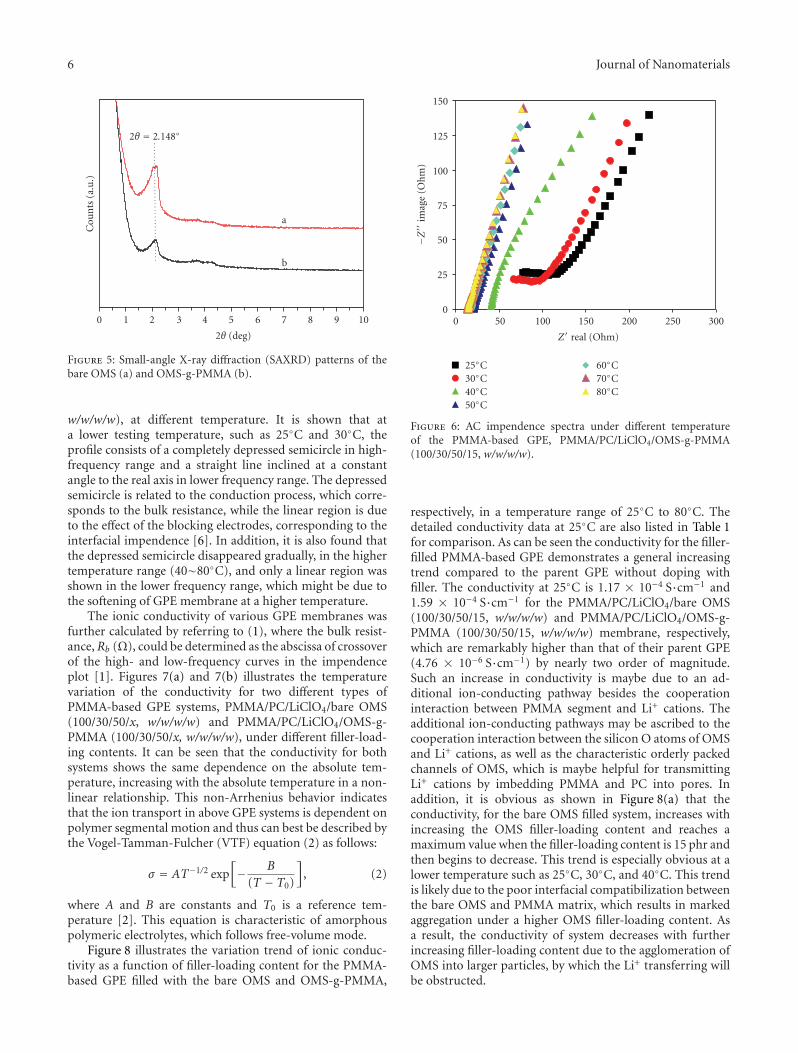
6 Journal of Nanomaterials
109876543210
2θ (deg)
Cou
nts
(a.u
.)
a
b
2θ = 2.148◦
Figure 5: Small-angle X-ray diffraction (SAXRD) patterns of thebare OMS (a) and OMS-g-PMMA (b).
w/w/w/w), at different temperature. It is shown that ata lower testing temperature, such as 25◦C and 30◦C, theprofile consists of a completely depressed semicircle in high-frequency range and a straight line inclined at a constantangle to the real axis in lower frequency range. The depressedsemicircle is related to the conduction process, which corre-sponds to the bulk resistance, while the linear region is dueto the effect of the blocking electrodes, corresponding to theinterfacial impendence [6]. In addition, it is also found thatthe depressed semicircle disappeared gradually, in the highertemperature range (40∼80◦C), and only a linear region wasshown in the lower frequency range, which might be due tothe softening of GPE membrane at a higher temperature.
The ionic conductivity of various GPE membranes wasfurther calculated by referring to (1), where the bulk resist-ance,Rb (Ω), could be determined as the abscissa of crossoverof the high- and low-frequency curves in the impendenceplot [1]. Figures 7(a) and 7(b) illustrates the temperaturevariation of the conductivity for two different types ofPMMA-based GPE systems, PMMA/PC/LiClO4/bare OMS(100/30/50/x, w/w/w/w) and PMMA/PC/LiClO4/OMS-g-PMMA (100/30/50/x, w/w/w/w), under different filler-load-ing contents. It can be seen that the conductivity for bothsystems shows the same dependence on the absolute tem-perature, increasing with the absolute temperature in a non-linear relationship. This non-Arrhenius behavior indicatesthat the ion transport in above GPE systems is dependent onpolymer segmental motion and thus can best be described bythe Vogel-Tamman-Fulcher (VTF) equation (2) as follows:
σ = AT−1/2 exp[− B
(T − T0)
], (2)
where A and B are constants and T0 is a reference tem-perature [2]. This equation is characteristic of amorphouspolymeric electrolytes, which follows free-volume mode.
Figure 8 illustrates the variation trend of ionic conduc-tivity as a function of filler-loading content for the PMMA-based GPE filled with the bare OMS and OMS-g-PMMA,
300250200150100500
Z′ real (Ohm)
0
25
50
75
100
125
150
−Z′′
imag
e(O
hm
)
25◦C30◦C40◦C50◦C
60◦C70◦C80◦C
Figure 6: AC impendence spectra under different temperatureof the PMMA-based GPE, PMMA/PC/LiClO4/OMS-g-PMMA(100/30/50/15, w/w/w/w).
respectively, in a temperature range of 25◦C to 80◦C. Thedetailed conductivity data at 25◦C are also listed in Table 1for comparison. As can be seen the conductivity for the filler-filled PMMA-based GPE demonstrates a general increasingtrend compared to the parent GPE without doping withfiller. The conductivity at 25◦C is 1.17 × 10⁻⁴ S·cm−1 and1.59 × 10−4 S·cm−1 for the PMMA/PC/LiClO4/bare OMS(100/30/50/15, w/w/w/w) and PMMA/PC/LiClO4/OMS-g-PMMA (100/30/50/15, w/w/w/w) membrane, respectively,which are remarkably higher than that of their parent GPE(4.76 × 10⁻⁶ S·cm−1) by nearly two order of magnitude.Such an increase in conductivity is maybe due to an ad-ditional ion-conducting pathway besides the cooperationinteraction between PMMA segment and Li+ cations. Theadditional ion-conducting pathways may be ascribed to thecooperation interaction between the silicon O atoms of OMSand Li+ cations, as well as the characteristic orderly packedchannels of OMS, which is maybe helpful for transmittingLi+ cations by imbedding PMMA and PC into pores. Inaddition, it is obvious as shown in Figure 8(a) that theconductivity, for the bare OMS filled system, increases withincreasing the OMS filler-loading content and reaches amaximum value when the filler-loading content is 15 phr andthen begins to decrease. This trend is especially obvious at alower temperature such as 25◦C, 30◦C, and 40◦C. This trendis likely due to the poor interfacial compatibilization betweenthe bare OMS and PMMA matrix, which results in markedaggregation under a higher OMS filler-loading content. Asa result, the conductivity of system decreases with furtherincreasing filler-loading content due to the agglomeration ofOMS into larger particles, by which the Li+ transferring willbe obstructed.
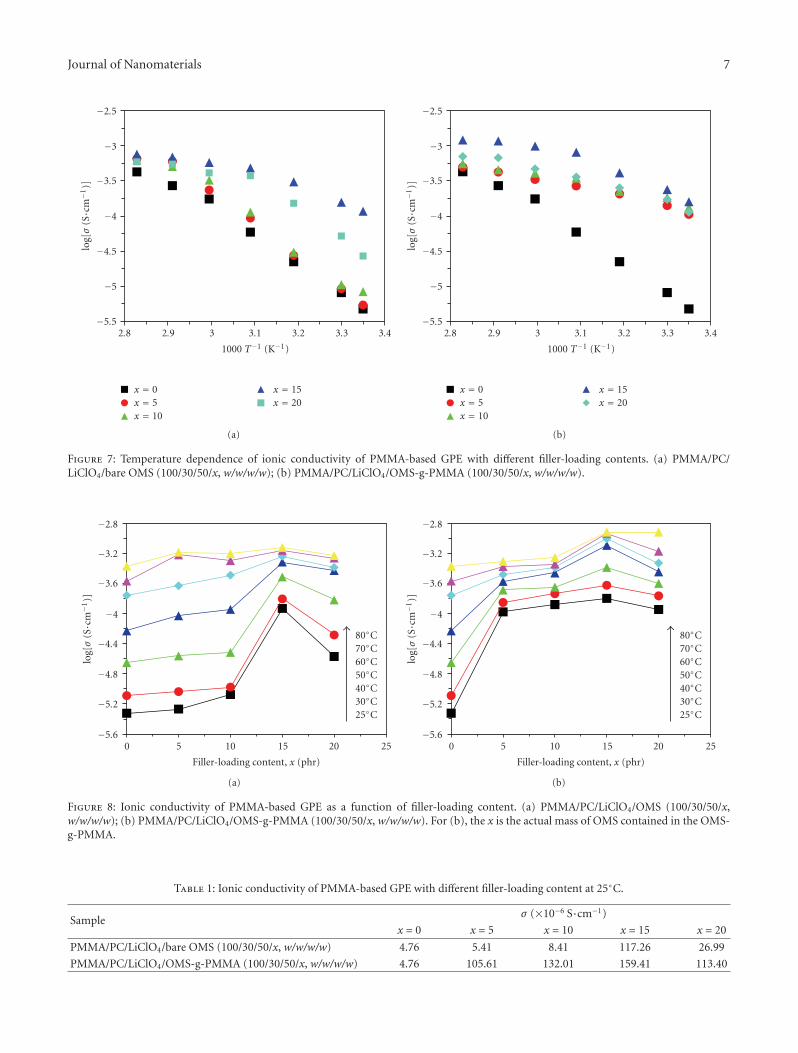
Journal of Nanomaterials 7
3.43.33.23.132.92.8
1000 T−1 (K−1)
−5.5
−5
−4.5
−4
−3.5
−3
−2.5
log[σ
(S·cm
−1)]
x = 0x = 5x = 10
x = 15x = 20
(a)
3.43.33.23.132.92.8
1000 T−1 (K−1)
−5.5
−5
−4.5
−4
−3.5
−3
−2.5
log[σ
(S·cm
−1)]
x = 0x = 5x = 10
x = 15x = 20
(b)
Figure 7: Temperature dependence of ionic conductivity of PMMA-based GPE with different filler-loading contents. (a) PMMA/PC/LiClO4/bare OMS (100/30/50/x, w/w/w/w); (b) PMMA/PC/LiClO4/OMS-g-PMMA (100/30/50/x, w/w/w/w).
2520151050
Filler-loading content, x (phr)
−5.6
−5.2
−4.8
−4.4
−4
−3.6
−3.2
−2.8
log[σ
(S·cm
−1)]
25◦C30◦C40◦C50◦C60◦C70◦C80◦C
(a)
2520151050
Filler-loading content, x (phr)
−5.6
−5.2
−4.8
−4.4
−4
−3.6
−3.2
−2.8
log[σ
(S·cm
−1)]
25◦C30◦C40◦C50◦C60◦C70◦C80◦C
(b)
Figure 8: Ionic conductivity of PMMA-based GPE as a function of filler-loading content. (a) PMMA/PC/LiClO4/OMS (100/30/50/x,w/w/w/w); (b) PMMA/PC/LiClO4/OMS-g-PMMA (100/30/50/x, w/w/w/w). For (b), the x is the actual mass of OMS contained in the OMS-g-PMMA.
Table 1: Ionic conductivity of PMMA-based GPE with different filler-loading content at 25◦C.
Sampleσ (×10−6 S·cm−1)
x = 0 x = 5 x = 10 x = 15 x = 20
PMMA/PC/LiClO4/bare OMS (100/30/50/x, w/w/w/w) 4.76 5.41 8.41 117.26 26.99
PMMA/PC/LiClO4/OMS-g-PMMA (100/30/50/x, w/w/w/w) 4.76 105.61 132.01 159.41 113.40
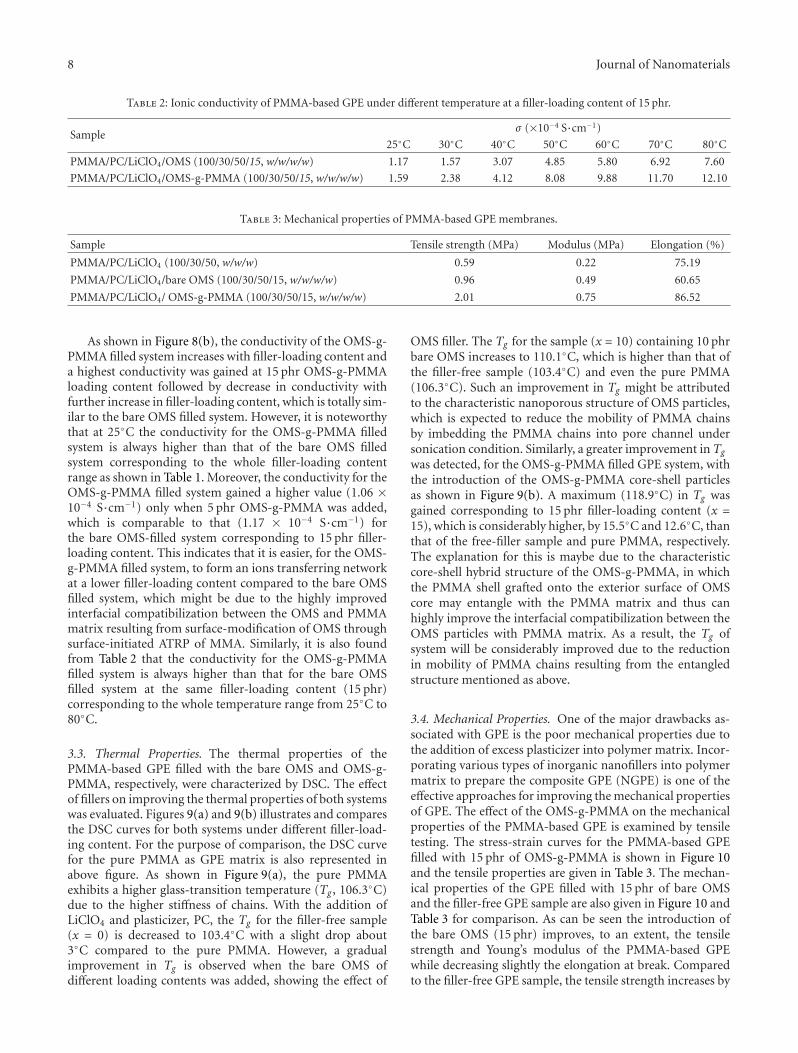
8 Journal of Nanomaterials
Table 2: Ionic conductivity of PMMA-based GPE under different temperature at a filler-loading content of 15 phr.
Sampleσ (×10−4 S·cm−1)
25◦C 30◦C 40◦C 50◦C 60◦C 70◦C 80◦C
PMMA/PC/LiClO4/OMS (100/30/50/15, w/w/w/w) 1.17 1.57 3.07 4.85 5.80 6.92 7.60
PMMA/PC/LiClO4/OMS-g-PMMA (100/30/50/15, w/w/w/w) 1.59 2.38 4.12 8.08 9.88 11.70 12.10
Table 3: Mechanical properties of PMMA-based GPE membranes.
Sample Tensile strength (MPa) Modulus (MPa) Elongation (%)
PMMA/PC/LiClO4 (100/30/50, w/w/w) 0.59 0.22 75.19
PMMA/PC/LiClO4/bare OMS (100/30/50/15, w/w/w/w) 0.96 0.49 60.65
PMMA/PC/LiClO4/ OMS-g-PMMA (100/30/50/15, w/w/w/w) 2.01 0.75 86.52
As shown in Figure 8(b), the conductivity of the OMS-g-PMMA filled system increases with filler-loading content anda highest conductivity was gained at 15 phr OMS-g-PMMAloading content followed by decrease in conductivity withfurther increase in filler-loading content, which is totally sim-ilar to the bare OMS filled system. However, it is noteworthythat at 25◦C the conductivity for the OMS-g-PMMA filledsystem is always higher than that of the bare OMS filledsystem corresponding to the whole filler-loading contentrange as shown in Table 1. Moreover, the conductivity for theOMS-g-PMMA filled system gained a higher value (1.06 ×10⁻⁴ S·cm−1) only when 5 phr OMS-g-PMMA was added,which is comparable to that (1.17 × 10⁻⁴ S·cm−1) forthe bare OMS-filled system corresponding to 15 phr filler-loading content. This indicates that it is easier, for the OMS-g-PMMA filled system, to form an ions transferring networkat a lower filler-loading content compared to the bare OMSfilled system, which might be due to the highly improvedinterfacial compatibilization between the OMS and PMMAmatrix resulting from surface-modification of OMS throughsurface-initiated ATRP of MMA. Similarly, it is also foundfrom Table 2 that the conductivity for the OMS-g-PMMAfilled system is always higher than that for the bare OMSfilled system at the same filler-loading content (15 phr)corresponding to the whole temperature range from 25◦C to80◦C.
3.3. Thermal Properties. The thermal properties of thePMMA-based GPE filled with the bare OMS and OMS-g-PMMA, respectively, were characterized by DSC. The effectof fillers on improving the thermal properties of both systemswas evaluated. Figures 9(a) and 9(b) illustrates and comparesthe DSC curves for both systems under different filler-load-ing content. For the purpose of comparison, the DSC curvefor the pure PMMA as GPE matrix is also represented inabove figure. As shown in Figure 9(a), the pure PMMAexhibits a higher glass-transition temperature (Tg , 106.3◦C)due to the higher stiffness of chains. With the addition ofLiClO4 and plasticizer, PC, the Tg for the filler-free sample(x = 0) is decreased to 103.4◦C with a slight drop about3◦C compared to the pure PMMA. However, a gradualimprovement in Tg is observed when the bare OMS ofdifferent loading contents was added, showing the effect of
OMS filler. The Tg for the sample (x = 10) containing 10 phrbare OMS increases to 110.1◦C, which is higher than that ofthe filler-free sample (103.4◦C) and even the pure PMMA(106.3◦C). Such an improvement in Tg might be attributedto the characteristic nanoporous structure of OMS particles,which is expected to reduce the mobility of PMMA chainsby imbedding the PMMA chains into pore channel undersonication condition. Similarly, a greater improvement in Tg
was detected, for the OMS-g-PMMA filled GPE system, withthe introduction of the OMS-g-PMMA core-shell particlesas shown in Figure 9(b). A maximum (118.9◦C) in Tg wasgained corresponding to 15 phr filler-loading content (x =15), which is considerably higher, by 15.5◦C and 12.6◦C, thanthat of the free-filler sample and pure PMMA, respectively.The explanation for this is maybe due to the characteristiccore-shell hybrid structure of the OMS-g-PMMA, in whichthe PMMA shell grafted onto the exterior surface of OMScore may entangle with the PMMA matrix and thus canhighly improve the interfacial compatibilization between theOMS particles with PMMA matrix. As a result, the Tg ofsystem will be considerably improved due to the reductionin mobility of PMMA chains resulting from the entangledstructure mentioned as above.
3.4. Mechanical Properties. One of the major drawbacks as-sociated with GPE is the poor mechanical properties due tothe addition of excess plasticizer into polymer matrix. Incor-porating various types of inorganic nanofillers into polymermatrix to prepare the composite GPE (NGPE) is one of theeffective approaches for improving the mechanical propertiesof GPE. The effect of the OMS-g-PMMA on the mechanicalproperties of the PMMA-based GPE is examined by tensiletesting. The stress-strain curves for the PMMA-based GPEfilled with 15 phr of OMS-g-PMMA is shown in Figure 10and the tensile properties are given in Table 3. The mechan-ical properties of the GPE filled with 15 phr of bare OMSand the filler-free GPE sample are also given in Figure 10 andTable 3 for comparison. As can be seen the introduction ofthe bare OMS (15 phr) improves, to an extent, the tensilestrength and Young’s modulus of the PMMA-based GPEwhile decreasing slightly the elongation at break. Comparedto the filler-free GPE sample, the tensile strength increases by
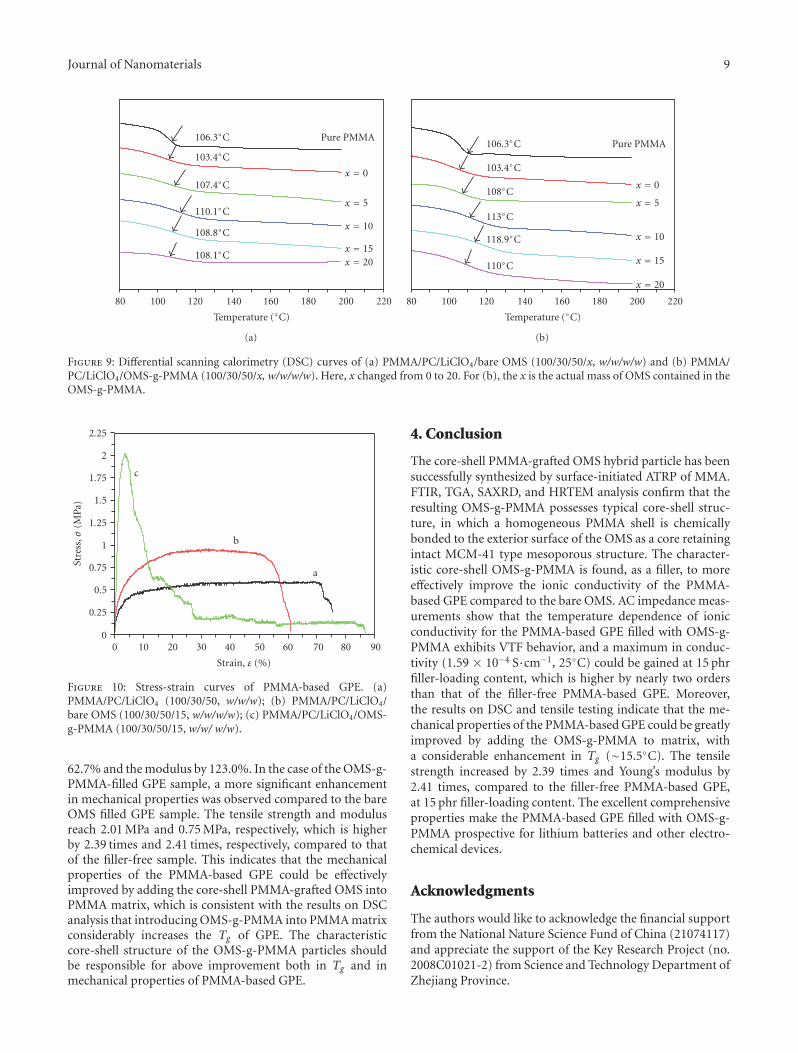
Journal of Nanomaterials 9
22020018016014012010080
Temperature (◦C)
106.3◦C
103.4◦C
107.4◦C
110.1◦C
108.8◦C
108.1◦C
Pure PMMA
x = 0
x = 5
x = 10
x = 15x = 20
(a)
22020018016014012010080
Temperature (◦C)
106.3◦C
103.4◦C
108◦C
113◦C
118.9◦C
110◦C
Pure PMMA
x = 0
x = 5
x = 10
x = 15
x = 20
(b)
Figure 9: Differential scanning calorimetry (DSC) curves of (a) PMMA/PC/LiClO4/bare OMS (100/30/50/x, w/w/w/w) and (b) PMMA/PC/LiClO4/OMS-g-PMMA (100/30/50/x, w/w/w/w). Here, x changed from 0 to 20. For (b), the x is the actual mass of OMS contained in theOMS-g-PMMA.
9080706050403020100
Strain, ε (%)
0
0.25
0.5
0.75
1
1.25
1.5
1.75
2
2.25
Stre
ss,σ
(MPa
)
a
b
c
Figure 10: Stress-strain curves of PMMA-based GPE. (a)PMMA/PC/LiClO4 (100/30/50, w/w/w); (b) PMMA/PC/LiClO4/bare OMS (100/30/50/15, w/w/w/w); (c) PMMA/PC/LiClO4/OMS-g-PMMA (100/30/50/15, w/w/ w/w).
62.7% and the modulus by 123.0%. In the case of the OMS-g-PMMA-filled GPE sample, a more significant enhancementin mechanical properties was observed compared to the bareOMS filled GPE sample. The tensile strength and modulusreach 2.01 MPa and 0.75 MPa, respectively, which is higherby 2.39 times and 2.41 times, respectively, compared to thatof the filler-free sample. This indicates that the mechanicalproperties of the PMMA-based GPE could be effectivelyimproved by adding the core-shell PMMA-grafted OMS intoPMMA matrix, which is consistent with the results on DSCanalysis that introducing OMS-g-PMMA into PMMA matrixconsiderably increases the Tg of GPE. The characteristiccore-shell structure of the OMS-g-PMMA particles shouldbe responsible for above improvement both in Tg and inmechanical properties of PMMA-based GPE.
4. Conclusion
The core-shell PMMA-grafted OMS hybrid particle has beensuccessfully synthesized by surface-initiated ATRP of MMA.FTIR, TGA, SAXRD, and HRTEM analysis confirm that theresulting OMS-g-PMMA possesses typical core-shell struc-ture, in which a homogeneous PMMA shell is chemicallybonded to the exterior surface of the OMS as a core retainingintact MCM-41 type mesoporous structure. The character-istic core-shell OMS-g-PMMA is found, as a filler, to moreeffectively improve the ionic conductivity of the PMMA-based GPE compared to the bare OMS. AC impedance meas-urements show that the temperature dependence of ionicconductivity for the PMMA-based GPE filled with OMS-g-PMMA exhibits VTF behavior, and a maximum in conduc-tivity (1.59 × 10⁻⁴ S·cm−1, 25◦C) could be gained at 15 phrfiller-loading content, which is higher by nearly two ordersthan that of the filler-free PMMA-based GPE. Moreover,the results on DSC and tensile testing indicate that the me-chanical properties of the PMMA-based GPE could be greatlyimproved by adding the OMS-g-PMMA to matrix, witha considerable enhancement in Tg (∼15.5◦C). The tensilestrength increased by 2.39 times and Young’s modulus by2.41 times, compared to the filler-free PMMA-based GPE,at 15 phr filler-loading content. The excellent comprehensiveproperties make the PMMA-based GPE filled with OMS-g-PMMA prospective for lithium batteries and other electro-chemical devices.
Acknowledgments
The authors would like to acknowledge the financial supportfrom the National Nature Science Fund of China (21074117)and appreciate the support of the Key Research Project (no.2008C01021-2) from Science and Technology Department ofZhejiang Province.
10 Journal of Nanomaterials
References
[1] Y. Wang, X. Ma, Q. Zhang, and N. Tian, “Synthesis andproperties of gel polymer electrolyte membranes based onnovel comb-like methyl methacrylate copolymers,” Journal ofMembrane Science, vol. 349, no. 1-2, pp. 279–286, 2010.
[2] S. Rajendran, V. S. Bama, and M. R. Prabhu, “Effect oflithium salt concentration in PVAc/PMMA-based gel polymerelectrolytes,” Ionics, vol. 16, no. 1, pp. 27–32, 2010.
[3] Y. Liao, M. Rao, W. Li, C. Tan, J. Yi, and L. Chen, “Improve-ment in ionic conductivity of self-supported P(MMA-AN-VAc) gel electrolyte by fumed silica for lithium ion batteries,”Electrochimica Acta, vol. 54, no. 26, pp. 6396–6402, 2009.
[4] Q. Xiao, Z. Li, D. Gao, T. He, and H. Zhang, “Preparation andelectrochemical performance of gel polymer electrolytes witha novel star network,” Journal of Applied Electrochemistry, vol.39, no. 2, pp. 247–251, 2009.
[5] L. Othman, K. W. Chew, and Z. Osman, “Impedance spec-troscopy studies of poly (methyl methacrylate)-lithium saltspolymer electrolyte systems,” Ionics, vol. 13, no. 5, pp. 337–342, 2007.
[6] D. Shanmukaraj, G. X. Wang, R. Murugan, and H. K.Liu, “Ionic conductivity and electrochemical stability ofpoly(methylmethacrylate)-poly(ethylene oxide) blend-ceramic fillers composites,” Journal of Physics and Chemistryof Solids, vol. 69, no. 1, pp. 243–248, 2008.
[7] J. P. Sharma and S. S. Sekhon, “Nanodispersed polymer gelelectrolytes: conductivity modification with the addition ofPMMA and fumed silica,” Solid State Ionics, vol. 178, no. 5-6,pp. 439–445, 2007.
[8] S. Ahmad, S. Ahmad, and S. A. Agnihotry, “Nanocompositeelectrolytes with fumed silica in poly(methyl methacrylate):thermal, rheological and conductivity studies,” Journal ofPower Sources, vol. 140, no. 1, pp. 151–156, 2005.
[9] Y. X. Jiang, Z. F. Chen, Q. C. Zhuang et al., “A novelcomposite microporous polymer electrolyte prepared withmolecule sieves for Li-ion batteries,” Journal of Power Sources,vol. 160, no. 2, pp. 1320–1328, 2006.
[10] J. Xi, X. Qiu, M. Cui, X. Tang, W. Zhu, and L. Chen, “Enhancedelectrochemical properties of PEO-based composite polymerelectrolyte with shape-selective molecular sieves,” Journal ofPower Sources, vol. 156, no. 2, pp. 581–588, 2006.
[11] F. Chen, X. Ma, X. Qu, and H. Yan, “Structure and propertiesof an organic rectorite/poly(methyl methacrylate) nanocom-posite gel polymer electrolyte by in situ synthesis,” Journal ofApplied Polymer Science, vol. 114, no. 5, pp. 2632–2638, 2009.
[12] O. Krejza, J. Velicka, M. Sedlarıkova, and J. Vondrak, “Thepresence of nanostructured Al2O3 in PMMA-based gel elec-trolytes,” Journal of Power Sources, vol. 178, no. 2, pp. 774–778,2008.
[13] S. Ahmad, T. K. Saxena, S. Ahmad, and S. A.Agnihotry, “The effect of nanosized TiO2 addition onpoly(methylmethacrylate) based polymer electrolytes,”Journal of Power Sources, vol. 159, no. 1, pp. 205–209, 2006.
[14] S. H. Chung, L. Persi, F. Croce, S. G. Greenbaum, B. Scrosati,and E. Plichta, “Enhancement of ion transport in polymerelectrolytes by addition of nanoscale inorganic oxides,” Journalof Power Sources, vol. 97-98, pp. 644–648, 2001.
[15] F. Croce, L. L. Persi, B. Scrosati, F. Serraino-Fiory, E. Plichta,and M. A. Hendrickson, “Role of the ceramic fillers inenhancing the transport properties of composite polymerelectrolytes,” Electrochimica Acta, vol. 46, no. 16, pp. 2457–2461, 2001.
[16] M. J. Reddy and P. P. Chu, “7Li NMR spectroscopy andion conduction mechanism in mesoporous silica (SBA-15)composite poly(ethylene oxide) electrolyte,” Journal of PowerSources, vol. 135, no. 1-2, pp. 1–8, 2004.
[17] S. Kim, E. J. Hwang, and S. J. Park, “An experimental study onthe effect of mesoporous silica addition on ion conductivityof poly(ethylene oxide) electrolytes,” Current Applied Physics,vol. 8, no. 6, pp. 729–731, 2008.
[18] J. Xi, S. Miao, and X. Tang, “Selective transporting of lithiumion by shape selective molecular sieves ZSM-5 in PEO-basedcomposite polymer electrolyte,” Macromolecules, vol. 37, no.23, pp. 8592–8598, 2004.
[19] Ch. V. Subba Reddy, G. P. Wu, C. X. Zhao, Q. Y. Zhu, W. Chen,and R. R. Kalluru, “Characterization of SBA-15 doped (PEO +LiClO) polymer electrolytes for electrochemical applications,”Journal of Non-Crystalline Solids, vol. 353, no. 4, pp. 440–445,2007.
[20] J. Xi, X. Qiu, X. Ma et al., “Composite polymer electrolytedoped with mesoporous silica SBA-15 for lithium polymerbattery,” Solid State Ionics, vol. 176, no. 13-14, pp. 1249–1260,2005.
[21] X. L. Wang, A. Mei, M. Li, Y. Lin, and C. W. Nan,“Effect of silane-functionalized mesoporous silica SBA-15 onperformance of PEO-based composite polymer electrolytes,”Solid State Ionics, vol. 177, no. 15-16, pp. 1287–1291, 2006.
[22] Y. Yang, X. Yan, Y. Cui et al., “Preparation of polymer-coatedmesoporous silica nanoparticles used for cellular imaging by a“graft-from” method,” Journal of Materials Chemistry, vol. 18,no. 47, pp. 5731–5737, 2008.
[23] C. F. Cheng, H. H. Cheng, PO. W. Cheng, and Y. J. Lee, “Effectof reactive channel functional groups and nanoporosity ofnanoscale mesoporous silica on properties of polyimidecomposite,” Macromolecules, vol. 39, no. 22, pp. 7583–7590,2006.
Hindawi Publishing CorporationJournal of NanomaterialsVolume 2012, Article ID 524123, 8 pagesdoi:10.1155/2012/524123
Research Article
Comparative Study of the Photocatalytic Activity ofSemiconductor Nanostructures and Their Hybrid MetalNanocomposites on the Photodegradation of Malathion
Dina Mamdouh Fouad1 and Mona Bakr Mohamed2, 3
1 Chemistry Department, Faculty of Science, Assiut University, Assiut 71516, Egypt2 National Institute of Laser Enhanced Science, Cairo University, Giza, Egypt3 NanoTech Egypt for Photoelectronic, Dreamland, October City, Egypt
Correspondence should be addressed to Dina Mamdouh Fouad, [email protected]
Received 3 March 2011; Accepted 31 March 2011
Academic Editor: Linbao Luo
Copyright © 2012 D. M. Fouad and M. B. Mohamed. This is an open access article distributed under the Creative CommonsAttribution License, which permits unrestricted use, distribution, and reproduction in any medium, provided the original work isproperly cited.
This work is devoted to synthesize different semiconductor nanoparticles and their metal-hybrid nanocomposites such as TiO2 ,Au/TiO2, ZnO, and Au/ZnO. The morphology and crystal structure of the prepared nanomaterials are characterized by the TEMand XRD, respectively. These materials are used as catalysts for the photodegradation of Malathion which is one of the mostcommonly used pesticides in the developing countries. The degradation of 10 ppm Malathion under ultraviolet (UV) and visiblelight in the presence of the different synthesized nanocomposites was analyzed with high-performance liquid chromatography(HPLC) and UV-Visible Spectra. A comprehensive study is carried out for the catalytic efficiency of the prepared nanoparticles.Different factors influencing the catalytic photodegradation are investigated, as different light source, surface coverage, and natureof the organic contaminants. The results indicate that hybrid nanocomposite of the semiconductor-metal hybrid serves as a bettercatalytic system compared with semiconductor nanoparticles themselves.
1. Introduction
Malathion, an organophosphorous pesticide with abroadrange of target pests, has been widely used in agriculture.Malathion is suspected to cause child leukemia, anemia, andkidney failure and is widely used in developing countries[1, 2]; it can persist in the human body for at least twogenerations [3, 4]. However, due to its chemical stability andhigh toxicity, Malathion resists to biodegrade [5]. Therefore,it was important to explore a new methodology for reducingthe contamination of water with Malathion. Photocatalysisis considered to be one of the most potential pollutionremediation technologies in recent decades [6, 7]. In recentyears, semiconductor photocatalysis has become more andmore attractive and important since it has a great potentialto contribute to such environmental problems. One of themost important aspects of environmental photocatalysis isthe selection of the semiconductor material. Semiconductor
photocatalyst generates electron and hole pair (e−-h+) uponirradiation of light energy that could be utilized in initiatingoxidation and reduction reactions of the pesticide, respec-tively. Guillard et al. [8] reported that the number of photonsstriking the photocatalyst actually controls the rate of thereaction which is an indication that the reaction takes placeonly on the adsorbed phase of the semiconductor particle.Surface morphology, namely, the particle size and shape isa very important parameter influencing the performanceof photocatalyst in photocatalytic oxidation [9]. TiO2 isone of the most commonly studied photocatalyst for it iseasily available, relatively inexpensive, and chemically stable[10, 11]. However, TiO2 is incompetent due to the wideband gap, it can only be triggered by near UV radiation,the photo generated electron and hole pairs are liable torecombination, leading to low quantum yields [12, 13].ZnO has received much attention in the degradation ofenvironmental pollutants since it has almost the same band
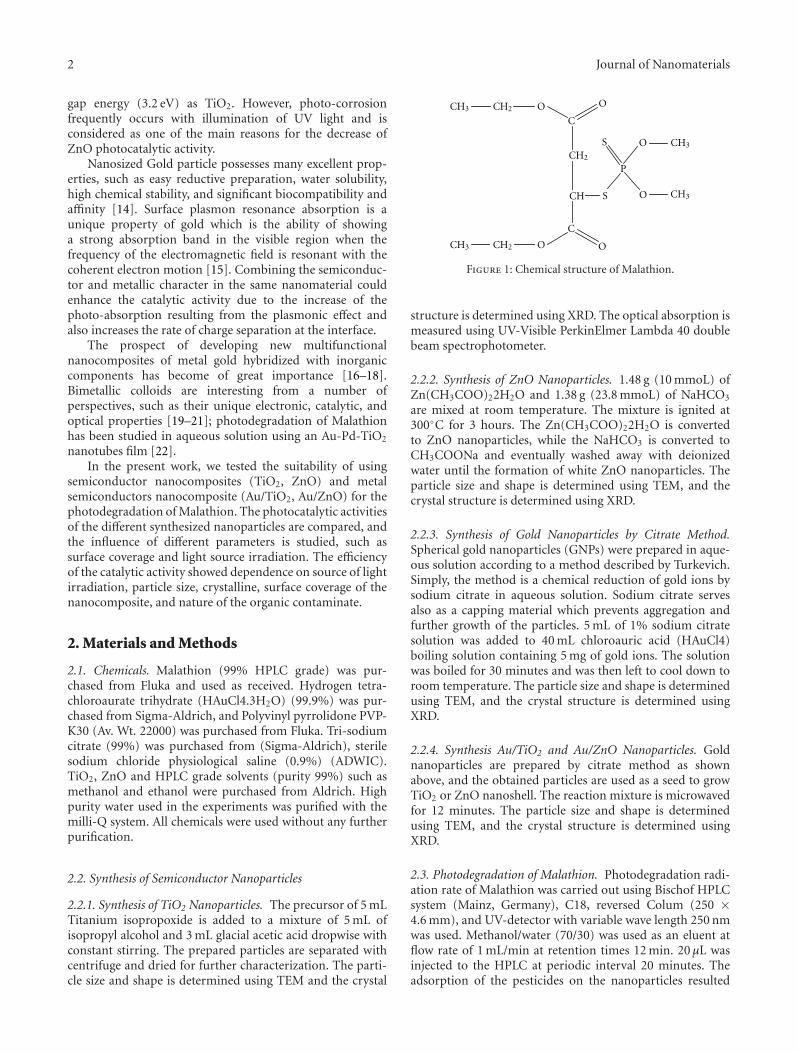
2 Journal of Nanomaterials
gap energy (3.2 eV) as TiO2. However, photo-corrosionfrequently occurs with illumination of UV light and isconsidered as one of the main reasons for the decrease ofZnO photocatalytic activity.
Nanosized Gold particle possesses many excellent prop-erties, such as easy reductive preparation, water solubility,high chemical stability, and significant biocompatibility andaffinity [14]. Surface plasmon resonance absorption is aunique property of gold which is the ability of showinga strong absorption band in the visible region when thefrequency of the electromagnetic field is resonant with thecoherent electron motion [15]. Combining the semiconduc-tor and metallic character in the same nanomaterial couldenhance the catalytic activity due to the increase of thephoto-absorption resulting from the plasmonic effect andalso increases the rate of charge separation at the interface.
The prospect of developing new multifunctionalnanocomposites of metal gold hybridized with inorganiccomponents has become of great importance [16–18].Bimetallic colloids are interesting from a number ofperspectives, such as their unique electronic, catalytic, andoptical properties [19–21]; photodegradation of Malathionhas been studied in aqueous solution using an Au-Pd-TiO2
nanotubes film [22].In the present work, we tested the suitability of using
semiconductor nanocomposites (TiO2, ZnO) and metalsemiconductors nanocomposite (Au/TiO2, Au/ZnO) for thephotodegradation of Malathion. The photocatalytic activitiesof the different synthesized nanoparticles are compared, andthe influence of different parameters is studied, such assurface coverage and light source irradiation. The efficiencyof the catalytic activity showed dependence on source of lightirradiation, particle size, crystalline, surface coverage of thenanocomposite, and nature of the organic contaminate.
2. Materials and Methods
2.1. Chemicals. Malathion (99% HPLC grade) was pur-chased from Fluka and used as received. Hydrogen tetra-chloroaurate trihydrate (HAuCl4.3H2O) (99.9%) was pur-chased from Sigma-Aldrich, and Polyvinyl pyrrolidone PVP-K30 (Av. Wt. 22000) was purchased from Fluka. Tri-sodiumcitrate (99%) was purchased from (Sigma-Aldrich), sterilesodium chloride physiological saline (0.9%) (ADWIC).TiO2, ZnO and HPLC grade solvents (purity 99%) such asmethanol and ethanol were purchased from Aldrich. Highpurity water used in the experiments was purified with themilli-Q system. All chemicals were used without any furtherpurification.
2.2. Synthesis of Semiconductor Nanoparticles
2.2.1. Synthesis of TiO2 Nanoparticles. The precursor of 5 mLTitanium isopropoxide is added to a mixture of 5 mL ofisopropyl alcohol and 3 mL glacial acetic acid dropwise withconstant stirring. The prepared particles are separated withcentrifuge and dried for further characterization. The parti-cle size and shape is determined using TEM and the crystal
CH3
CH3
CH3
CH2
CH2
CH
S
S
P
O
CH3 CH2 O
O
O
O
O
C
C
Figure 1: Chemical structure of Malathion.
structure is determined using XRD. The optical absorption ismeasured using UV-Visible PerkinElmer Lambda 40 doublebeam spectrophotometer.
2.2.2. Synthesis of ZnO Nanoparticles. 1.48 g (10 mmoL) ofZn(CH3COO)22H2O and 1.38 g (23.8 mmoL) of NaHCO3
are mixed at room temperature. The mixture is ignited at300◦C for 3 hours. The Zn(CH3COO)22H2O is convertedto ZnO nanoparticles, while the NaHCO3 is converted toCH3COONa and eventually washed away with deionizedwater until the formation of white ZnO nanoparticles. Theparticle size and shape is determined using TEM, and thecrystal structure is determined using XRD.
2.2.3. Synthesis of Gold Nanoparticles by Citrate Method.Spherical gold nanoparticles (GNPs) were prepared in aque-ous solution according to a method described by Turkevich.Simply, the method is a chemical reduction of gold ions bysodium citrate in aqueous solution. Sodium citrate servesalso as a capping material which prevents aggregation andfurther growth of the particles. 5 mL of 1% sodium citratesolution was added to 40 mL chloroauric acid (HAuCl4)boiling solution containing 5 mg of gold ions. The solutionwas boiled for 30 minutes and was then left to cool down toroom temperature. The particle size and shape is determinedusing TEM, and the crystal structure is determined usingXRD.
2.2.4. Synthesis Au/TiO2 and Au/ZnO Nanoparticles. Goldnanoparticles are prepared by citrate method as shownabove, and the obtained particles are used as a seed to growTiO2 or ZnO nanoshell. The reaction mixture is microwavedfor 12 minutes. The particle size and shape is determinedusing TEM, and the crystal structure is determined usingXRD.
2.3. Photodegradation of Malathion. Photodegradation radi-ation rate of Malathion was carried out using Bischof HPLCsystem (Mainz, Germany), C18, reversed Colum (250 ×4.6 mm), and UV-detector with variable wave length 250 nmwas used. Methanol/water (70/30) was used as an eluent atflow rate of 1 mL/min at retention times 12 min. 20 μL wasinjected to the HPLC at periodic interval 20 minutes. Theadsorption of the pesticides on the nanoparticles resulted
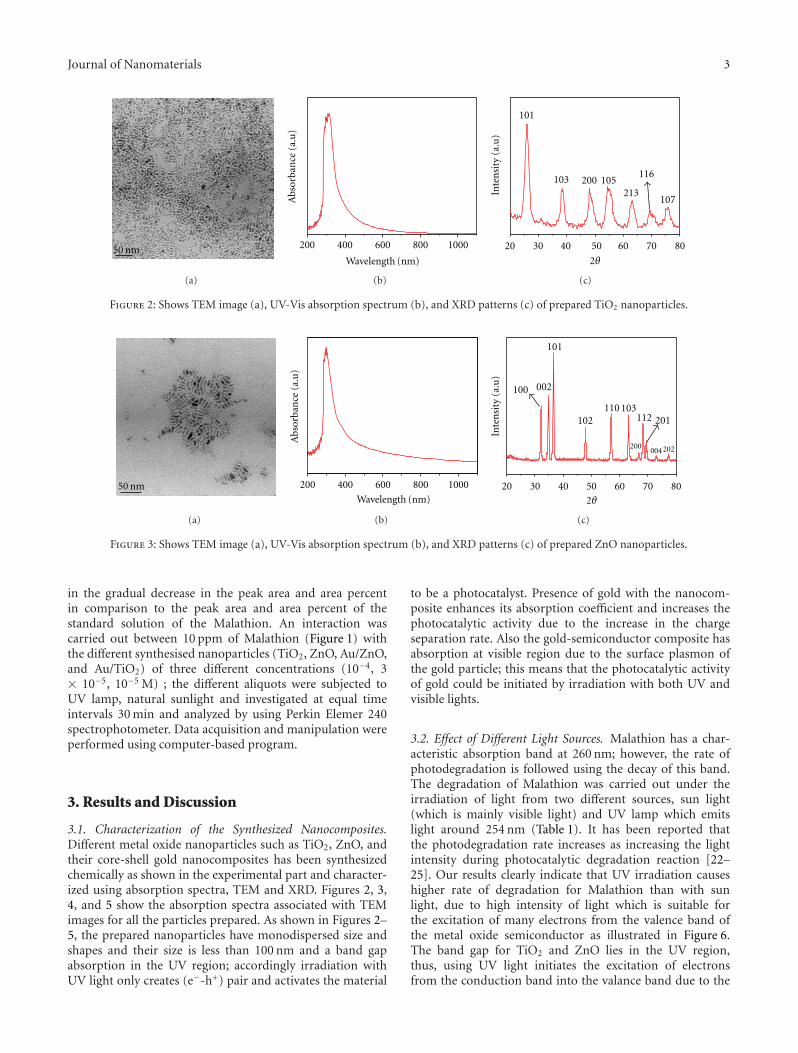
Journal of Nanomaterials 3
50 nm
(a)
200 400 600 800 1000
Abs
orba
nce
(a.u
)
Wavelength (nm)
(b)
2θ
20 30 40 50 60 70 80
Inte
nsi
ty(a
.u)
101
103 200 105213
116
107
(c)
Figure 2: Shows TEM image (a), UV-Vis absorption spectrum (b), and XRD patterns (c) of prepared TiO2 nanoparticles.
50 nm
(a)
200 400 600 800 1000
Abs
orba
nce
(a.u
)
Wavelength (nm)
(b)
2θ
20 30 40 50 60 70 80In
ten
sity
(a.u
)
100 002
101
102110 103
112 201
200004 202
(c)
Figure 3: Shows TEM image (a), UV-Vis absorption spectrum (b), and XRD patterns (c) of prepared ZnO nanoparticles.
in the gradual decrease in the peak area and area percentin comparison to the peak area and area percent of thestandard solution of the Malathion. An interaction wascarried out between 10 ppm of Malathion (Figure 1) withthe different synthesised nanoparticles (TiO2, ZnO, Au/ZnO,and Au/TiO2) of three different concentrations (10−4, 3× 10⁻⁵, 10−5 M) ; the different aliquots were subjected toUV lamp, natural sunlight and investigated at equal timeintervals 30 min and analyzed by using Perkin Elemer 240spectrophotometer. Data acquisition and manipulation wereperformed using computer-based program.
3. Results and Discussion
3.1. Characterization of the Synthesized Nanocomposites.Different metal oxide nanoparticles such as TiO2, ZnO, andtheir core-shell gold nanocomposites has been synthesizedchemically as shown in the experimental part and character-ized using absorption spectra, TEM and XRD. Figures 2, 3,4, and 5 show the absorption spectra associated with TEMimages for all the particles prepared. As shown in Figures 2–5, the prepared nanoparticles have monodispersed size andshapes and their size is less than 100 nm and a band gapabsorption in the UV region; accordingly irradiation withUV light only creates (e−-h+) pair and activates the material
to be a photocatalyst. Presence of gold with the nanocom-posite enhances its absorption coefficient and increases thephotocatalytic activity due to the increase in the chargeseparation rate. Also the gold-semiconductor composite hasabsorption at visible region due to the surface plasmon ofthe gold particle; this means that the photocatalytic activityof gold could be initiated by irradiation with both UV andvisible lights.
3.2. Effect of Different Light Sources. Malathion has a char-acteristic absorption band at 260 nm; however, the rate ofphotodegradation is followed using the decay of this band.The degradation of Malathion was carried out under theirradiation of light from two different sources, sun light(which is mainly visible light) and UV lamp which emitslight around 254 nm (Table 1). It has been reported thatthe photodegradation rate increases as increasing the lightintensity during photocatalytic degradation reaction [22–25]. Our results clearly indicate that UV irradiation causeshigher rate of degradation for Malathion than with sunlight, due to high intensity of light which is suitable forthe excitation of many electrons from the valence band ofthe metal oxide semiconductor as illustrated in Figure 6.The band gap for TiO2 and ZnO lies in the UV region,thus, using UV light initiates the excitation of electronsfrom the conduction band into the valance band due to the
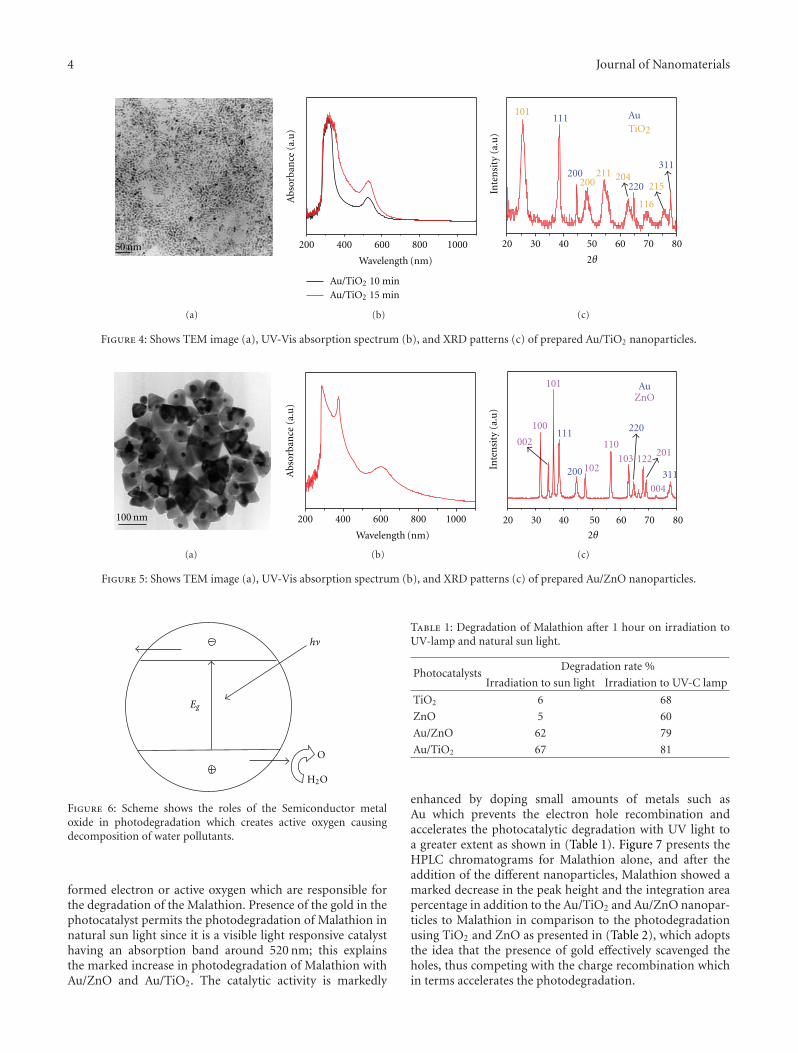
4 Journal of Nanomaterials
50 nm
(a)
200 400 600 800 1000
Abs
orba
nce
(a.u
)
Wavelength (nm)
Au/TiO2 10 minAu/TiO2 15 min
(b)
2θ
20 30 40 50 60 70 80
Inte
nsi
ty(a
.u)
101
200
116
111
200 220
311211 204
215
AuTiO2
(c)
Figure 4: Shows TEM image (a), UV-Vis absorption spectrum (b), and XRD patterns (c) of prepared Au/TiO2 nanoparticles.
100 nm
(a)
200 400 600 800 1000
Abs
orba
nce
(a.u
)
Wavelength (nm)
(b)
2θ
20 30 40 50 60 70 80
Inte
nsi
ty(a
.u)
111
200
220
311
100
002
101
102
110
103 122201
004
AuZnO
(c)
Figure 5: Shows TEM image (a), UV-Vis absorption spectrum (b), and XRD patterns (c) of prepared Au/ZnO nanoparticles.
O
H2O
Eg
hA
Figure 6: Scheme shows the roles of the Semiconductor metaloxide in photodegradation which creates active oxygen causingdecomposition of water pollutants.
formed electron or active oxygen which are responsible forthe degradation of the Malathion. Presence of the gold in thephotocatalyst permits the photodegradation of Malathion innatural sun light since it is a visible light responsive catalysthaving an absorption band around 520 nm; this explainsthe marked increase in photodegradation of Malathion withAu/ZnO and Au/TiO2. The catalytic activity is markedly
Table 1: Degradation of Malathion after 1 hour on irradiation toUV-lamp and natural sun light.
PhotocatalystsDegradation rate %
Irradiation to sun light Irradiation to UV-C lamp
TiO2 6 68
ZnO 5 60
Au/ZnO 62 79
Au/TiO2 67 81
enhanced by doping small amounts of metals such asAu which prevents the electron hole recombination andaccelerates the photocatalytic degradation with UV light toa greater extent as shown in (Table 1). Figure 7 presents theHPLC chromatograms for Malathion alone, and after theaddition of the different nanoparticles, Malathion showed amarked decrease in the peak height and the integration areapercentage in addition to the Au/TiO2 and Au/ZnO nanopar-ticles to Malathion in comparison to the photodegradationusing TiO2 and ZnO as presented in (Table 2), which adoptsthe idea that the presence of gold effectively scavenged theholes, thus competing with the charge recombination whichin terms accelerates the photodegradation.
Journal of Nanomaterials 5
2 4 6 8 10 12 14 16
(min)
319 mV
ch1
(a)
2 4 6 8 10 12 14 16
(min)
18
319 mV
ch1
(b)
2 4 6 8 10 12 14 16
(min)
319 mV
ch1
(c)
Figure 7: Shows HPLC chromatogram for Malathion (a), Malathion + Au/ZnO (b), and Malathion Au/TiO2 (c).
0 60 120
30
60
90
Time (min)
10−4
3× 10⁻⁵
10−5
A/A
0(%
)
Figure 8: Shows the effect of different concentrations of TiO2 nanoparticle on the degradation of Malathion.
Table 2: HPLC integration area for Malathion on irradiation to UV.
PhotocatalystIntegration area (%)
At once After an hour
TiO2 83 40
Au/TiO2 75 19
Au/ZnO 85 27
3.3. Effect of the Nature of Photocatalyst. A direct correlationexists between the removal of the organic pollutant and thesurface coverage of TiO2 photocatalyst [26]. Heterogeneousphotocatalytic reactions are known to show a proportionalincrease in the photodegradation with catalyst loading[27]. Generally, in any given photocatalytic application,the optimum catalyst concentration must be determined,in order to avoid the excess catalyst and ensure the totalabsorption of the efficient photons [28]. This is becausethe scattering of an unfavorable light and reduction of
light penetration into the solution is observed with excessphotocatalyst loading [29]. During photocatalytic oxidationprocess, the concentration of organic substrate over time isdependent upon photonic efficiency [30]. At high-substrateconcentrations, however, the photonic efficiency diminishesand the titanium dioxide surface becomes saturated leadingto catalyst deactivation [31]. Different concentrations ofthe nanoparticles were investigated to select the optimalconcentration for efficient photodegradation. As presentedin Figure 8, it is concluded that 10−4 M is the optimumconcentration for efficient degradation of Malathion usingthe different nanoparticles; about 69% was achieved in 1hour using TiO2; at lower concentrations (3 × 10⁻⁵, 10−4)free radical production rate is limited which suppresses therate of the degradation reaction to (10–20%). The same trendwas obtained for the prepared nanoparticles as presented inFigures 9-10; an increase of the degradation percentage wasobserved on using Au/ZnO and Au/TiO2 and also a reductionof the radiation rate time, which is due to the presence of
6 Journal of Nanomaterials
200 3000
1
2
3
Wavelength
0 min30 min
60 min90 min
Abs
orba
nce
(a.u
)
Figure 9: Shows time-dependent degradation of Malathion usingTiO2 in UV lamp.
200 220 240 260 280 300 320 340 360 380 4000
1
2
3
Wavelength (nm)
0 min30 min
60 min120 min
Abs
orba
nce
(a.u
)
Figure 10: Shows time-dependent degradation of Malathion usingAu/ZnO in UV lamp.
the gold which prevents the electron hole recombination andaccelerates the photodegradation.
3.4. Effect of the Nature of the Contaminant. Organicmolecules which adhere effectively to the surface of the pho-tocatalyst are more susceptible to direct oxidation [32]. Thusthe photocatalytic degradation of aromatics depends on thesubstituent group. It is reported that nitro-phenol is muchstronger adsorbing substrate than phenol and thereforedegrades faster [33]. In the degradation of chloroaromatics,Bhatkhande et al. [34] pointed out that monochlorinatedphenol degrades faster than di- or tri-chlorinated member.In general, molecules with electron withdrawing groups suchas nitrobenzene and benzoic acid were found to adsorbsignificantly in the dark compared to those with electron
300 6000
2
Wavelength (nm)
0 min
Abs
orba
nce
(a.u
)
10 min20 min30 min
(a)
0 min10 min20 min30 min
120 min
3
300 6000
Wavelength (nm)
Abs
orba
nce
(a.u
)
(b)
Figure 11: Shows time-dependent photodegradation of cholrida-zon in UV lamp after addition of 10−4 TiO2/Au (a) and ZnO/Au(b).
donating groups [35]. During photocatalytic oxidation pro-cess, the concentration of organic substrate over time isdependent upon photonic efficiency [36]. At high-substrateconcentrations, however, the photonic efficiency diminishesand the titanium dioxide surface becomes saturated leadingto catalyst deactivation [37]. In the present work, we com-pared the degradation of two different pesticides as a modelfor aliphatic (Malathion) and chloroaromatic (chloridazone)by subjecting them to the same concentration of differentcategories of nanoparticle Au/TiO2 and Au/ZnO and forsame period of time, about 1 hour. As indicated in Figure 11,it is clearly shown that the degradation of chloridazoneis faster in comparison to Malathion; a similar trend ofdegradation was obtained for the both types of nanoparticlessince after irradiation to UV lamp for 30 min the degradation
Journal of Nanomaterials 7
of Malathion was about 30%, while in case of chloridazoneit was about 50%; this could be explained in terms ofthe presence of aromatic rings as well as the number andnature of substituent on the ring (like electron donating orelectron withdrawing groups) which are known to affect theadsorption and consequently the degradation rate [38].
4. Conclusion
The ability to synthesize multicomponent nanocompositesis important to improve the electronic, optical, and mag-netic functionality. According to our study, gold hybridsemiconductor-noble metal nanocrystals not only combinethe unique properties of the metal and semiconductorsbut also generate collective new phenomena based onthe intraparticles interaction between the metal and thesemiconductor at their interface. The presence of metal-semiconductor interface promotes effective charge separa-tion carrier transfers which subsequently enhance photo-catalytic effect. Photodegradation of 10 ppm Malathion wasenhanced in the presence of gold-semiconductor nanoparti-cle; other factors also influenced the degradation rate such asdifferent light sources and nature of the catalyst.
References
[1] J. L. Adgate, D. B. Barr, C. A. Clayton et al., “Measurement ofchildren’s exposure to pesticides: analysis of urinary metabo-lite levels in a probability-based sample,” EnvironmentalHealth Perspectives, vol. 109, no. 6, pp. 583–590, 2001.
[2] D. Zeljezic and V. Garaj-Vrhovac, “Evaluation of geneticdamage in workers employed in pesticide production utilizingthe comet assay,” Chemosphere, vol. 46, pp. 295–303, 2002.
[3] T. Vial, B. Nicolas, and J. Descotes, “Clinical immunotoxicityof pesticides,” Journal of Toxicology and Environmental Health,vol. 48, no. 3, pp. 215–229, 1996.
[4] A. S. Nair, C. Subramaniam, M. J. Rosemary et al.,“Nanoparticles-chemistry, new synthetic approaches, gasphase clustering and novel applications,” Pramana Journal ofPhysics, vol. 65, no. 4, pp. 631–640, 2005.
[5] B. Kumari, A. Guha, M. G. Pathak, T. C. Bora, and M. K.Roy, “Experimental biofilm and Its application in malathiondegradation,” Folia Microbiologica, vol. 43, no. 1, pp. 27–30,1998.
[6] I. Oller, W. Gernjak, M. I. Maldonado, L. A. Perez-Estrada,J. A. Sanchez-Perez, and S. Malato, “Solar photocatalyticdegradation of some hazardous water-soluble pesticides atpilot-plant scale,” Journal of Hazardous Materials, vol. 138, no.3, pp. 507–517, 2006.
[7] A. Corma and H. Garcia, “Zeolite-based photocatalysts,”Chemical Communications, vol. 10, no. 13, pp. 1443–1459,2004.
[8] C. Guillard, H. Lachheb, A. Houas, M. Ksibi, E. Elaloui, and J.M. Herrmann, “Influence of chemical structure of dyes, of phand of inorganic salts on their photocatalytic degradation byTiO2 comparison of the efficiency of powder and supportedTiO2,” Journal of Photochemistry and Photobiology A, vol. 158,no. 1, pp. 27–36, 2003.
[9] K. Kogo, H. Yoneyama, and H. Tamura, “Photocatalyticoxidation of cyanide on platinized TiO2,” Journal of PhysicalChemistry, vol. 84, no. 13, pp. 1705–1710, 1980.
[10] J. Zhao and X. Yang, “Photocatalytic oxidation for indoor airpurification: a literature review,” Building and Environment,vol. 38, no. 5, pp. 645–654, 2003.
[11] F. Zang, J. Zhao, T. Shen et al., “TiO2-assisted photodegradation of dye pollutants. II. Adsorption and degradationkinetics of eosin in TiO2 dispersions under visible lightirradiation,” Applied Catalysis B, vol. 5, pp. 147–156, 1998.
[12] G. Rothenberger, J. Moser, M. Gratzel, N. Serpone, andD. K. Sharma, “Charge carrier trapping and recombinationdynamics in small semiconductor particles,” Journal of theAmerican Chemical Society, vol. 107, no. 26, pp. 8054–8059,1985.
[13] H. Tributsch, N. Serpone, and E. Pelizzeti, Photocatalysis:Fundamentals and Applications, Wiley, New York, NY, USA,1989.
[14] M. C. Daniel and D. Astruc, “Gold aanoparticles: assembly,supramolecular chemistry, quantum-size-related properties,and applications toward biology, catalysis, and nanotechnol-ogy,” Chemical Reviews, vol. 104, no. 1, pp. 293–346, 2004.
[15] C. F. Bohren and D. R. Huffman, Absorption and Scattering ofLight by Small Particles, Wiley, New York, NY, USA, 1983.
[16] J. L. Lyon, D. A. Fleming, M. B. Stone, P. Schiffer, and M. E.Williams, “Synthesis of Fe oxide core/Au shell nanoparticlesby iterative hydroxylamine seeding,” Nano Letters, vol. 4, no.4, pp. 719–723, 2004.
[17] S. J. Cho, J. C. Idrobo, J. Olamit, K. Liu, N. D. Browning, and S.M. Kauzlarich, “Growth mechanisms and oxidation resistanceof gold-coated iron nanoparticles,” Chemistry of Materials, vol.17, no. 12, pp. 3181–3186, 2005.
[18] D. Caruntu, B. L. Cushing, G. Caruntu, and C. J. O’Connor,“Attachment of gold nanograins onto colloidal magnetitenanocrystals,” Chemistry of Materials, vol. 17, no. 13, pp. 3398–3402, 2005.
[19] Y. H. Chen and U. Nickel, “Superadditive catalysis of homoge-neous redox reactions with mixed silver-gold colloids,” Journalof the Chemical Society, Faraday Transactions, vol. 89, no. 14,pp. 2479–2485, 1993.
[20] N. Aihara, K. Torigoe, and K. Esumi, “Preparation andcharacterization of gold and silver nanoparticles in layeredlaponite suspensions,” Langmuir, vol. 14, no. 17, pp. 4945–4949, 1998.
[21] M. Michaelis, A. Henglein, and P. Mulvaney, “CompositePd-Ag particles in aqueous solution,” Journal of PhysicalChemistry, vol. 98, no. 24, pp. 6212–6215, 1994.
[22] M. Muneer, M. Qamar, and D. Bahnemann, “Heterogeneousphotocatalysed reaction of two selected pesticide derivativestrichlopyr and daminozid in aqueous suspension of titaniumdioxide,” Journal of Environmental Management, vol. 80, pp.99–106, 2006.
[23] C. Karunakaran and S. Senthilvelan, “Photocatalysis withZrO2: oxidation of aniline,” Journal of Molecular Catalysis A:Chemical, vol. 233, no. 1-2, pp. 1–8, 2005.
[24] M. Stylidi, D. I. Kondarides, and X. E. Verykios, “Visiblelight-induced photocatalytic degradation of acid orange 7in aqueous TiO2 suspensions TiO2 suspensions,” AppliedCatalysis B, vol. 47, no. 3, pp. 189–201, 2004.
[25] K. Wilke and H. D. Breuer, “The influence of transitionmetal doping on the physical and photocatalytic properties oftitania,” Journal of Photochemistry and Photobiology A, vol. 121,no. 1, pp. 49–53, 1999.
[26] J. Arana, J. L. Martınez Nieto, J. A. H. Melian et al., “Photo-catalytic degradation of formaldehyde containing wastewaterfrom veterinarian laboratories,” Chemosphere, vol. 55, no. 6,pp. 893–904, 2004.
8 Journal of Nanomaterials
[27] A. J. Maira, K. L. Yeung, J. Soria et al., “Gas-phase photo-oxidation of toluene using nanometer-size TiO2 catalysts,”Applied Catalysis B, vol. 29, no. 4, pp. 327–336, 2001.
[28] J. Krysa, M. Keppert, J. Jirkovsky, V. Stengl, and J. Subrt,“The effect of thermal treatment on the properties of TiO2
photocatalyst,” Materials Chemistry and Physics, vol. 86, no. 2-3, pp. 333–339, 2004.
[29] M. Saquib and M. Muneer, “TiO2-mediated photocatalyticdegradation of a triphenylmethane dye (gentian violet), inaqueous suspensions,” Dyes and Pigments, vol. 56, no. 1, pp.37–49, 2003.
[30] G. Palmisano, M. Addamo, V. Augugliaro et al., “Selectivityof hydroxyl radical in the partial oxidation of aromaticcompounds in heterogeneous photocatalysis,” Catalysis Today,vol. 122, no. 1-2, pp. 118–127, 2007.
[31] D. A. Friesen, L. Morello, J. V. Headley, and C. H. Langford,“Factors influencing relative efficiency in photo-oxidations oforganic molecules by Cs3PWO and TiO2 colloidal photocata-lysts,” Journal of Photochemistry and Photobiology A, vol. 133,no. 3, pp. 213–220, 2000.
[32] N. Serpone, “Relative photonic efficiencies and quantumyields in heterogeneous photocatalysis,” Journal of Photochem-istry and Photobiology A, vol. 104, no. 1-3, pp. 1–12, 1997.
[33] U. I. Gaya and A. H. Abdullah, “Heterogeneous photocatalyticdegradation of organic contaminants over titanium dioxide:a review of fundamentals, progress and problems,” Journal ofPhotochemistry and Photobiology C: Photochemistry Reviews,vol. 9, no. 1, pp. 1–12, 2008.
[34] D. S. Bhatkhande, S. P. Kamble, S. B. Sawant, and V. G.Pangarkar, “Photocatalytic and photochemical degradationof nitrobenzene using artificial ultraviolet light,” ChemicalEngineering Journal, vol. 102, no. 3, pp. 283–290, 2004.
[35] M. Hugul, E. Ercag, and R. Apak, “Kinetic studies on UV-photodegradation of some chlorophenols using TiO2 catalyst,”Journal of Environmental Science and Health A, vol. 37, no. 3,pp. 365–383, 2002.
[36] G. Palmisano, M. Addamo, V. Augugliaro et al., “Selectivityof hydroxyl radical in the partial oxidation of aromaticcompounds in heterogeneous photocatalysis,” Catalysis Today,vol. 122, no. 1-2, pp. 118–127, 2007.
[37] D. A. Friesen, L. Morello, J. V. Headley, and C. H. Langford,“Factors influencing relative efficiency in photo-oxidations oforganic molecules by Cs3PWO and TiO2 colloidal photocata-lysts,” Journal of Photochemistry and Photobiology A, vol. 133,no. 3, pp. 213–220, 2000.
[38] P. V. Kamat, R. Huehn, and R. Nicolaescu, “A “sense andshoot” approach for photocatalytic degradation of organiccontaminants in water,” Journal of Physical Chemistry B, vol.96, no. 4, pp. 788–794, 2007.