Embed Size (px)
Citation preview
Completion Report
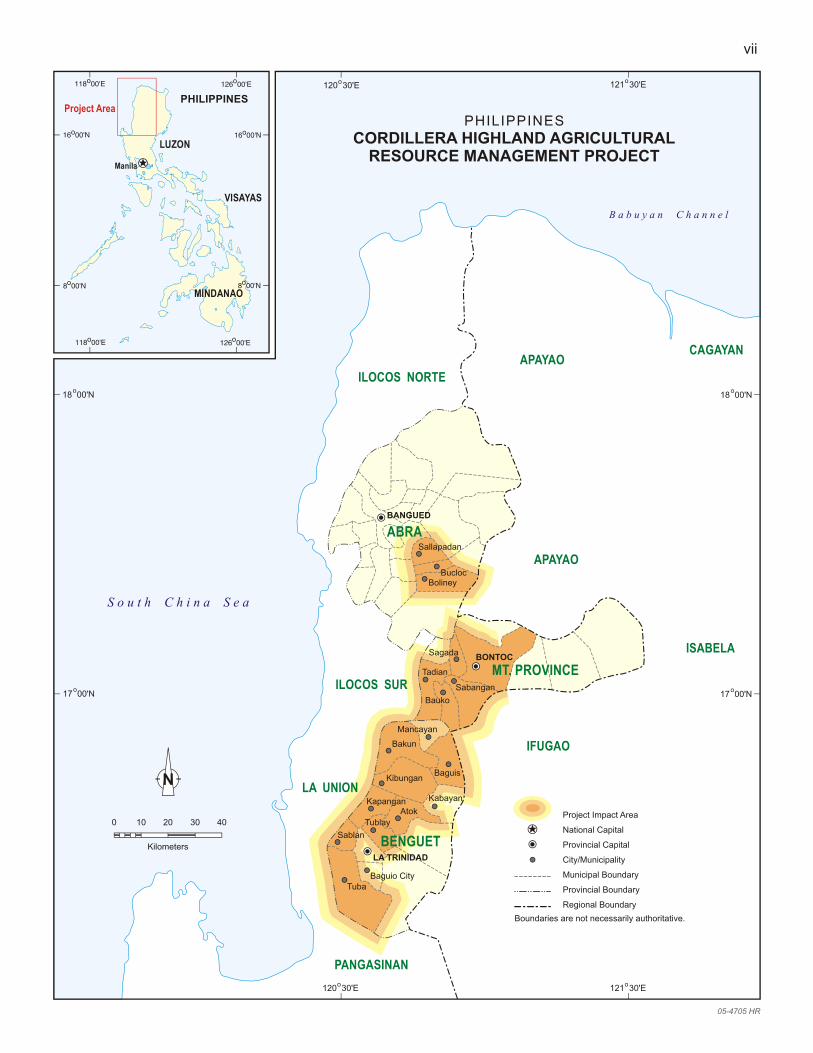
Project Number: 26517 Loan Numbers: 1421/1422-PHI(SF) May 2006
Philippines: Cordillera Highland Agricultural Resource Management Project
CURRENCY EQUIVALENTS
Currency Unit – peso (P)
At Appraisal At Project Completion (31 October 1995) (9 December 2005)
P1.00 = $0.0385 $0.01875 $1.00 = P26.00 P54.12
ABBREVIATIONS
ADB – Asian Development Bank ASS – agricultural support services ADF – Asian Development Fund BME – benefit monitoring and evaluation BNRMP – Barangay Natural Resource Management Plan CADT – certificate of ancestral domain title CAR – Cordillera Administrative Region CHARM – Cordillera Highland Agricultural Resource Management Project CIS – communal irrigation system DA – Department of Agriculture DA-CAR – Department of Agriculture-Cordillera Administrative Region DAR – Department of Agrarian Reform DENR – Department of Environment and Natural Resources DWS – domestic water supply system EIRR – economic internal rate of return FIES – Family Income and Expenditures Survey FMR – farm-to-market road HADP – Highland Agricultural Development Project ICC – indigenous cultural community IFAD – International Fund for Agricultural Development IPM – integrated pest management LGU – local government unit NCIP – National Commission on Indigenous Peoples NGO – nongovernment organization NIA National Irrigation Administration OCR – ordinary capital resources O&M – operation and maintenance PEO – Provincial Engineering Office PMO – project management office PSO – project support office RISC – Regional Interagency Steering Committee SSCG – Small Savings and Credit Group
GLOSSARY
barangay – The lowest local government administrative unit lapat – Forest management practice by the indigenous people
NOTES
(i) The fiscal year (FY) of the Government ends on 31 December.
(ii) In this report, "$" refers to US dollars. Vice President C. Lawrence Greenwood, Jr., Operations Group 2 Director General R. M. Nag, Southeast Asia Department (SERD) Director U. Malik, Agriculture, Environment and Natural Resources Division,
SERD Team leader T. Miyazato, Senior Water Resources Specialist, CWRD (formerly with
SERD) Team member E. Tayao-Castro, Assistant Project Analyst, SERD
CONTENTS
Page
BASIC DATA i
MAP vii
I. PROJECT DESCRIPTION 1 II. EVALUATION OF DESIGN AND IMPLEMENTATION 2
A. Relevance of Design and Formulation 2 B. Project Outputs 4 C. Project Costs 6 D. Disbursements 6 E. Project Schedule 6 F. Implementation Arrangements 6 G. Conditions and Covenants 7 H. Consultant Recruitment and Procurement 7 I. Performance of Consultants, Contractors, and Suppliers 8 J. Performance of the Borrower and the Executing Agency 8 K. Performance of the Asian Development Bank 8
III. EVALUATION OF PERFORMANCE 9 A. Relevance 9 B. Effectiveness in Achieving the Outcome 9 C. Efficiency in Achieving Outcomes and Outputs 10 D. Preliminary Assessment of Sustainability 11 E. Impact 12
IV. OVERALL ASSESSMENT AND RECOMMENDATIONS 13 A. Overall Assessment 13 B. Lessons 13 C. Recommendations 14
APPENDIXES 1. Project Framework 16 2. Summary of Training Programs 28 3. Organization Chart 29 4. Actual Annual Project Cost 32 5. Project Implementation Schedule 35 6. Status of Compliance with Loan Covenants 38 7. Staffing Schedule of Consultants 42 8. List of Equipment 44 9. Economic Analysis 48
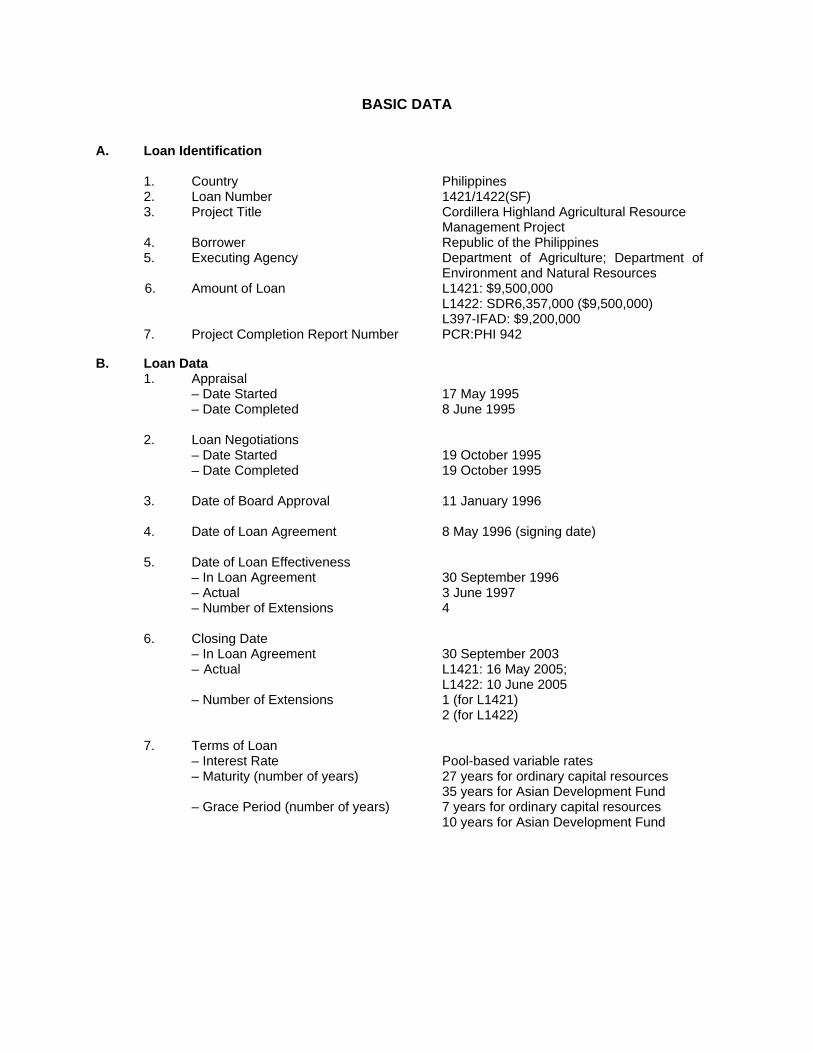
BASIC DATA A. Loan Identification 1. Country 2. Loan Number 3. Project Title 4. Borrower 5. Executing Agency
6. Amount of Loan 7. Project Completion Report Number
Philippines 1421/1422(SF) Cordillera Highland Agricultural Resource Management Project Republic of the Philippines Department of Agriculture; Department of Environment and Natural Resources L1421: $9,500,000 L1422: SDR6,357,000 ($9,500,000) L397-IFAD: $9,200,000 PCR:PHI 942
B. Loan Data 1. Appraisal – Date Started – Date Completed 2. Loan Negotiations – Date Started – Date Completed 3. Date of Board Approval 4. Date of Loan Agreement 5. Date of Loan Effectiveness – In Loan Agreement – Actual – Number of Extensions 6. Closing Date – In Loan Agreement
– Actual
– Number of Extensions 7. Terms of Loan – Interest Rate – Maturity (number of years) – Grace Period (number of years)
17 May 1995 8 June 1995 19 October 1995 19 October 1995 11 January 1996 8 May 1996 (signing date) 30 September 1996 3 June 1997 4 30 September 2003 L1421: 16 May 2005; L1422: 10 June 2005 1 (for L1421) 2 (for L1422) Pool-based variable rates 27 years for ordinary capital resources 35 years for Asian Development Fund 7 years for ordinary capital resources 10 years for Asian Development Fund
ii
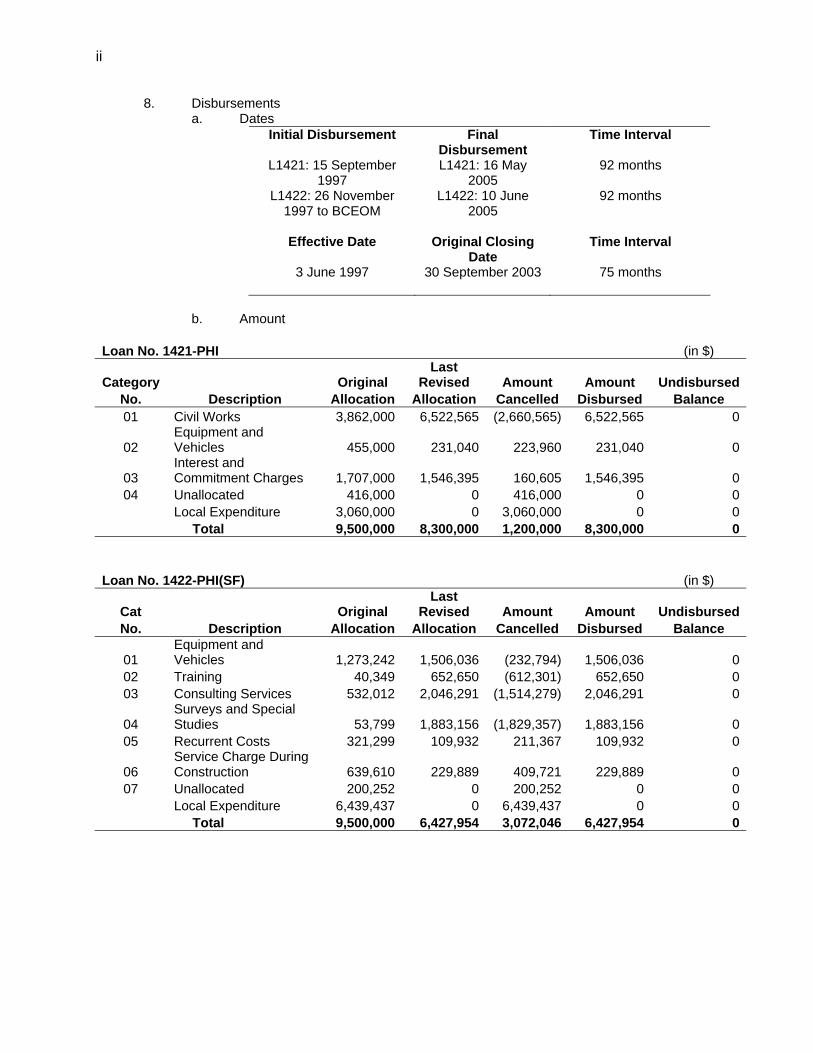
8. Disbursements a. Dates Initial Disbursement
L1421: 15 September
1997 L1422: 26 November
1997 to BCEOM
Final Disbursement L1421: 16 May
2005 L1422: 10 June
2005
Time Interval
92 months
92 months
Effective Date
3 June 1997
Original Closing
Date 30 September 2003
Time Interval
75 months
b. Amount
Loan No. 1421-PHI (in $)
Category Original Last
Revised Amount Amount UndisbursedNo. Description Allocation Allocation Cancelled Disbursed Balance 01 Civil Works 3,862,000 6,522,565 (2,660,565) 6,522,565 0
02 Equipment and Vehicles 455,000 231,040 223,960 231,040 0
03 Interest and Commitment Charges 1,707,000 1,546,395 160,605 1,546,395 0
04 Unallocated 416,000 0 416,000 0 0 Local Expenditure 3,060,000 0 3,060,000 0 0 Total 9,500,000 8,300,000 1,200,000 8,300,000 0 Loan No. 1422-PHI(SF) (in $)
Cat Original Last
Revised Amount Amount UndisbursedNo. Description Allocation Allocation Cancelled Disbursed Balance
01 Equipment and Vehicles 1,273,242 1,506,036 (232,794) 1,506,036 0
02 Training 40,349 652,650 (612,301) 652,650 0 03 Consulting Services 532,012 2,046,291 (1,514,279) 2,046,291 0
04 Surveys and Special Studies 53,799 1,883,156 (1,829,357) 1,883,156 0
05 Recurrent Costs 321,299 109,932 211,367 109,932 0
06 Service Charge During Construction 639,610 229,889 409,721 229,889 0
07 Unallocated 200,252 0 200,252 0 0 Local Expenditure 6,439,437 0 6,439,437 0 0 Total 9,500,000 6,427,954 3,072,046 6,427,954 0
iii
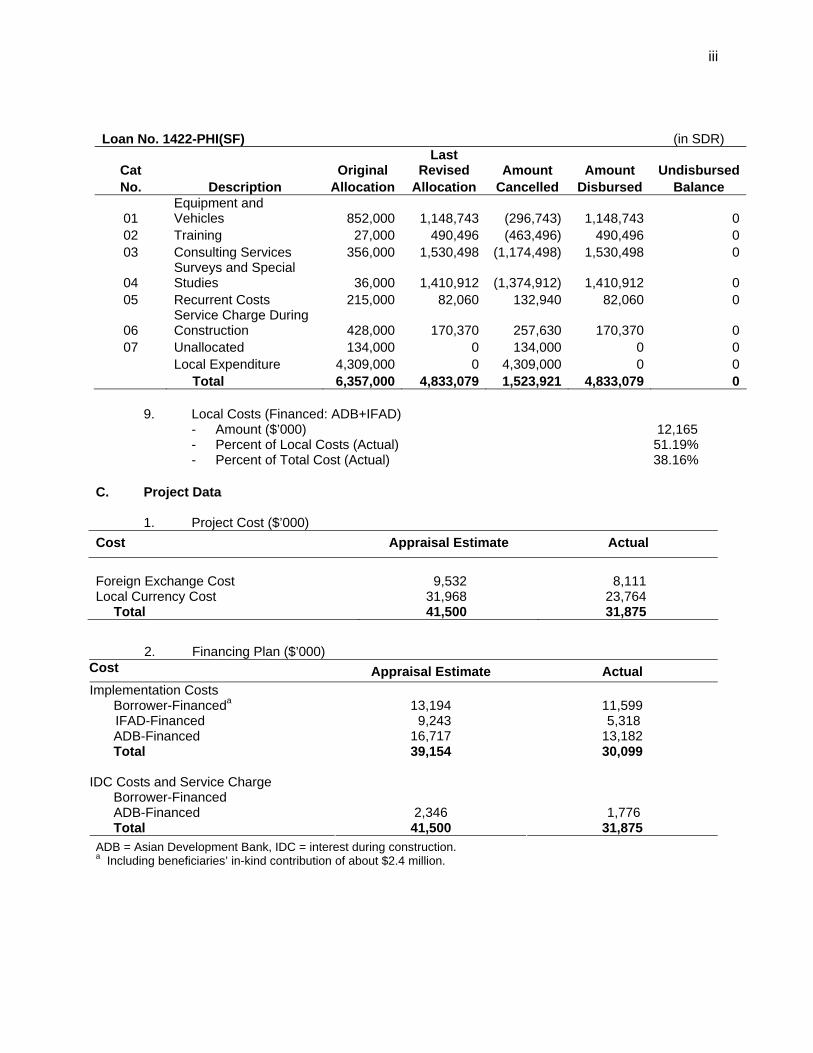
Loan No. 1422-PHI(SF) (in SDR)
Cat Original Last
Revised Amount Amount UndisbursedNo. Description Allocation Allocation Cancelled Disbursed Balance
01 Equipment and Vehicles 852,000 1,148,743 (296,743) 1,148,743 0
02 Training 27,000 490,496 (463,496) 490,496 0 03 Consulting Services 356,000 1,530,498 (1,174,498) 1,530,498 0
04 Surveys and Special Studies 36,000 1,410,912 (1,374,912) 1,410,912 0
05 Recurrent Costs 215,000 82,060 132,940 82,060 0
06 Service Charge During Construction 428,000 170,370 257,630 170,370 0
07 Unallocated 134,000 0 134,000 0 0 Local Expenditure 4,309,000 0 4,309,000 0 0
Total 6,357,000 4,833,079 1,523,921 4,833,079 0 9. Local Costs (Financed: ADB+IFAD) - Amount ($’000) 12,165 - Percent of Local Costs (Actual) 51.19% - Percent of Total Cost (Actual) 38.16% C. Project Data
1. Project Cost ($’000) Cost Appraisal Estimate Actual
Foreign Exchange Cost 9,532 8,111 Local Currency Cost 31,968 23,764 Total 41,500 31,875
2. Financing Plan ($’000) Cost Appraisal Estimate Actual Implementation Costs Borrower-Financeda IFAD-Financed ADB-Financed Total IDC Costs and Service Charge Borrower-Financed ADB-Financed Total
13,194 9,243 16,717 39,154
2,346 41,500
11,599 5,318
13,182 30,099
1,776 31,875
ADB = Asian Development Bank, IDC = interest during construction. a Including beneficiaries’ in-kind contribution of about $2.4 million.
iv
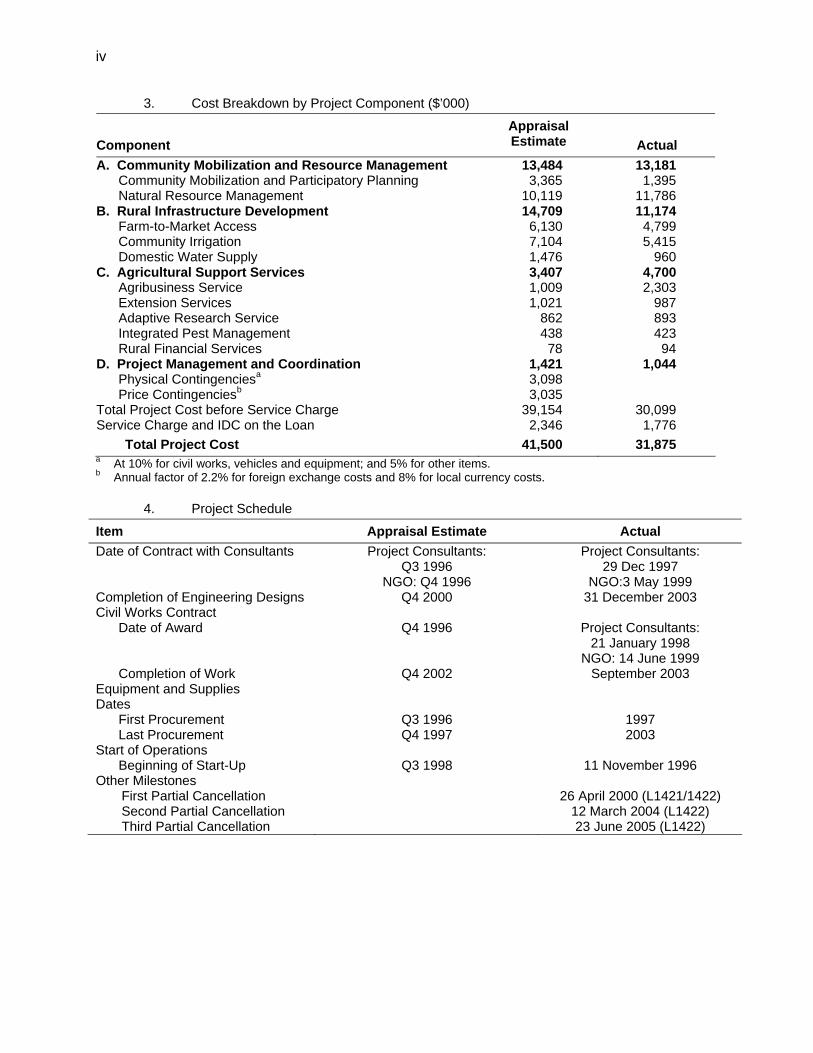
3. Cost Breakdown by Project Component ($’000) Component
Appraisal Estimate
Actual
A. Community Mobilization and Resource Management 13,484 13,181 Community Mobilization and Participatory Planning 3,365 1,395 Natural Resource Management 10,119 11,786 B. Rural Infrastructure Development 14,709 11,174 Farm-to-Market Access 6,130 4,799 Community Irrigation 7,104 5,415 Domestic Water Supply 1,476 960 C. Agricultural Support Services 3,407 4,700 Agribusiness Service 1,009 2,303 Extension Services 1,021 987 Adaptive Research Service 862 893 Integrated Pest Management 438 423 Rural Financial Services 78 94 D. Project Management and Coordination 1,421 1,044 Physical Contingenciesa 3,098 Price Contingenciesb 3,035 Total Project Cost before Service Charge 39,154 30,099 Service Charge and IDC on the Loan 2,346 1,776 Total Project Cost 41,500 31,875 a At 10% for civil works, vehicles and equipment; and 5% for other items. b Annual factor of 2.2% for foreign exchange costs and 8% for local currency costs. 4. Project Schedule
Item Appraisal Estimate Actual Date of Contract with Consultants Project Consultants:
Q3 1996 NGO: Q4 1996
Project Consultants: 29 Dec 1997
NGO:3 May 1999 Completion of Engineering Designs Q4 2000 31 December 2003 Civil Works Contract Date of Award Q4 1996 Project Consultants:
21 January 1998 NGO: 14 June 1999
Completion of Work Q4 2002 September 2003 Equipment and Supplies Dates First Procurement Q3 1996 1997 Last Procurement Q4 1997 2003 Start of Operations Beginning of Start-Up Q3 1998 11 November 1996 Other Milestones First Partial Cancellation Second Partial Cancellation Third Partial Cancellation
26 April 2000 (L1421/1422)
12 March 2004 (L1422) 23 June 2005 (L1422)
v
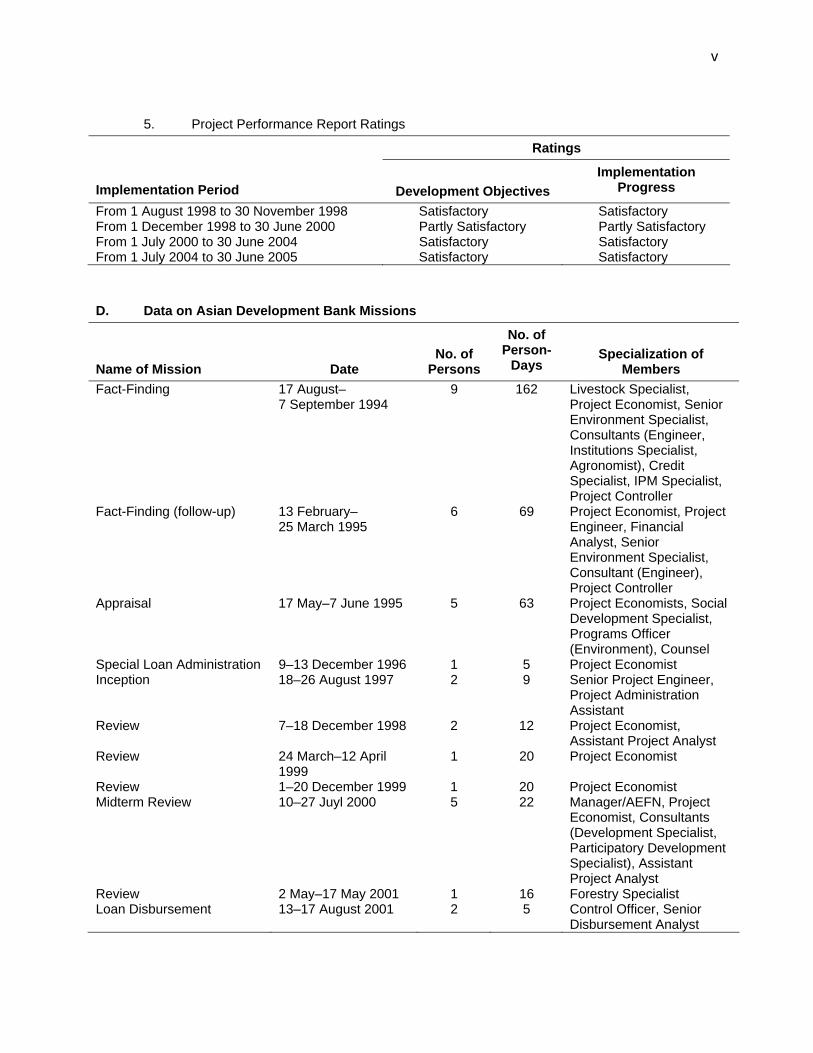
5. Project Performance Report Ratings
Ratings Implementation Period
Development Objectives
Implementation Progress
From 1 August 1998 to 30 November 1998 Satisfactory Satisfactory From 1 December 1998 to 30 June 2000 Partly Satisfactory Partly Satisfactory From 1 July 2000 to 30 June 2004 Satisfactory Satisfactory From 1 July 2004 to 30 June 2005 Satisfactory Satisfactory D. Data on Asian Development Bank Missions
Name of Mission
Date
No. of
Persons
No. of Person-
Days
Specialization of
Members Fact-Finding 17 August–
7 September 1994 9 162 Livestock Specialist,
Project Economist, Senior Environment Specialist, Consultants (Engineer, Institutions Specialist, Agronomist), Credit Specialist, IPM Specialist, Project Controller
Fact-Finding (follow-up) 13 February– 25 March 1995
6 69 Project Economist, Project Engineer, Financial Analyst, Senior Environment Specialist, Consultant (Engineer), Project Controller
Appraisal 17 May–7 June 1995 5 63 Project Economists, Social Development Specialist, Programs Officer (Environment), Counsel
Special Loan Administration 9–13 December 1996 1 5 Project Economist Inception 18–26 August 1997 2 9 Senior Project Engineer,
Project Administration Assistant
Review 7–18 December 1998 2 12 Project Economist, Assistant Project Analyst
Review 24 March–12 April 1999
1 20 Project Economist
Review 1–20 December 1999 1 20 Project Economist Midterm Review 10–27 Juyl 2000 5 22 Manager/AEFN, Project
Economist, Consultants (Development Specialist, Participatory Development Specialist), Assistant Project Analyst
Review 2 May–17 May 2001 1 16 Forestry Specialist Loan Disbursement 13–17 August 2001 2 5 Control Officer, Senior
Disbursement Analyst
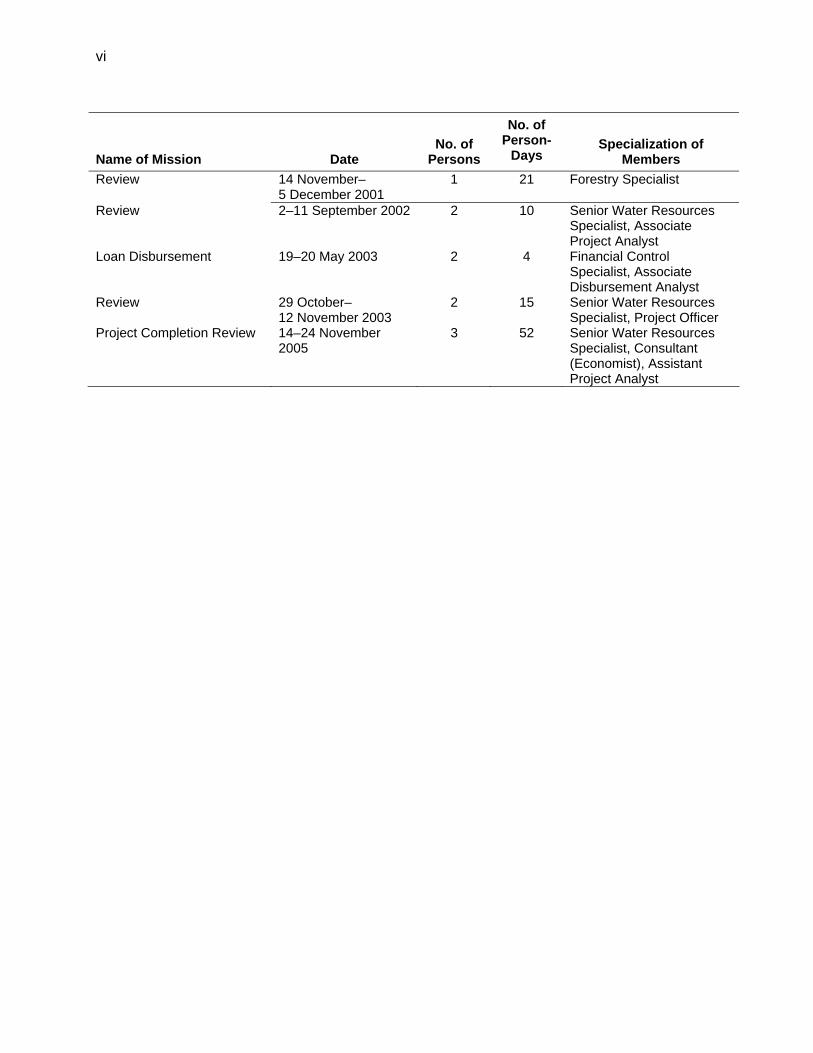
vi
Name of Mission
Date
No. of
Persons
No. of Person-
Days
Specialization of
Members Review 14 November–
5 December 2001 1 21 Forestry Specialist
Review 2–11 September 2002 2 10 Senior Water Resources Specialist, Associate Project Analyst
Loan Disbursement 19–20 May 2003 2 4 Financial Control Specialist, Associate Disbursement Analyst
Review 29 October– 12 November 2003
2 15 Senior Water Resources Specialist, Project Officer
Project Completion Review 14–24 November 2005
3 52 Senior Water Resources Specialist, Consultant (Economist), Assistant Project Analyst
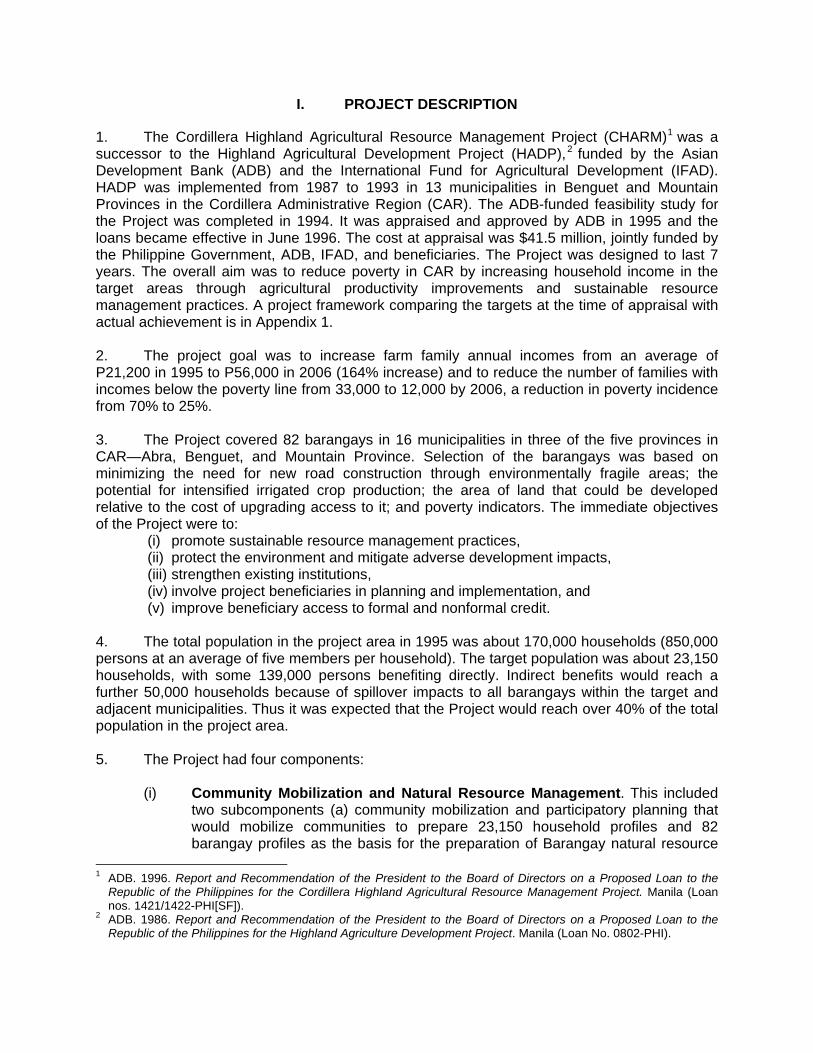
I. PROJECT DESCRIPTION
1. The Cordillera Highland Agricultural Resource Management Project (CHARM)1 was a successor to the Highland Agricultural Development Project (HADP),2 funded by the Asian Development Bank (ADB) and the International Fund for Agricultural Development (IFAD). HADP was implemented from 1987 to 1993 in 13 municipalities in Benguet and Mountain Provinces in the Cordillera Administrative Region (CAR). The ADB-funded feasibility study for the Project was completed in 1994. It was appraised and approved by ADB in 1995 and the loans became effective in June 1996. The cost at appraisal was $41.5 million, jointly funded by the Philippine Government, ADB, IFAD, and beneficiaries. The Project was designed to last 7 years. The overall aim was to reduce poverty in CAR by increasing household income in the target areas through agricultural productivity improvements and sustainable resource management practices. A project framework comparing the targets at the time of appraisal with actual achievement is in Appendix 1. 2. The project goal was to increase farm family annual incomes from an average of P21,200 in 1995 to P56,000 in 2006 (164% increase) and to reduce the number of families with incomes below the poverty line from 33,000 to 12,000 by 2006, a reduction in poverty incidence from 70% to 25%. 3. The Project covered 82 barangays in 16 municipalities in three of the five provinces in CAR—Abra, Benguet, and Mountain Province. Selection of the barangays was based on minimizing the need for new road construction through environmentally fragile areas; the potential for intensified irrigated crop production; the area of land that could be developed relative to the cost of upgrading access to it; and poverty indicators. The immediate objectives of the Project were to:
(i) promote sustainable resource management practices, (ii) protect the environment and mitigate adverse development impacts, (iii) strengthen existing institutions, (iv) involve project beneficiaries in planning and implementation, and (v) improve beneficiary access to formal and nonformal credit.
4. The total population in the project area in 1995 was about 170,000 households (850,000 persons at an average of five members per household). The target population was about 23,150 households, with some 139,000 persons benefiting directly. Indirect benefits would reach a further 50,000 households because of spillover impacts to all barangays within the target and adjacent municipalities. Thus it was expected that the Project would reach over 40% of the total population in the project area. 5. The Project had four components:
(i) Community Mobilization and Natural Resource Management. This included two subcomponents (a) community mobilization and participatory planning that would mobilize communities to prepare 23,150 household profiles and 82 barangay profiles as the basis for the preparation of Barangay natural resource
1 ADB. 1996. Report and Recommendation of the President to the Board of Directors on a Proposed Loan to the
Republic of the Philippines for the Cordillera Highland Agricultural Resource Management Project. Manila (Loan nos. 1421/1422-PHI[SF]).
2 ADB. 1986. Report and Recommendation of the President to the Board of Directors on a Proposed Loan to the Republic of the Philippines for the Highland Agriculture Development Project. Manila (Loan No. 0802-PHI).
2
management plans (BNRMPs) in the project areas, and (b) natural resources management involving reforestation projects identified from BNRMPs and facilitation of issuance of land tenure instruments.
(ii) Rural Infrastructure Development. This included (a) farm-to-market access involving the rehabilitation of 150 km of access roads, construction of 100 m of reinforced concrete bridges, 300 m of low-level spillways, 286 m of foot bridges, and a 2.5 km tramway; (b) community irrigation systems covering about 2,800 ha made up of rehabilitation of schemes with 1,066 ha and new construction of 1,688 ha; and (c) domestic water supply involving the installation of 63 domestic water supply schemes to about 3,260 households.
(iii) Agricultural Support Services. This provided for (a) enhancing agribusiness support services through market analysis, radio broadcasts on market prices and agricultural technology, market expansion, promotion and linkage and agro-processing and post-harvest technology promotion; (b) extension support services to improve the operational efficiency and effectiveness of agricultural support services at regional, provincial, and municipal levels with farmer training, trials, and demonstrations, including integrated pest management techniques; and (c) adaptive research services relevant to local needs and more closely integrated with extension functions within the Department of Agriculture (DA)-CAR and the replication of farmer-controlled parasitic wasp rearing facilities for integrated pest management (IPM).
(iv) Project Management and Coordination. Establishment of a project support office (PSO) in DA-CAR prior to loan effectiveness with the principal responsibility for facilitating the implementation of the Project, including financial budgeting and control, monitoring and evaluation, procurement of goods and services, loan disbursement, and coordination and supervision.
6. The DA was the executing agency, with DA-CAR as the lead implementing agency. Partner implementing agencies in CAR were the National Irrigation Administration (NIA), the Department of Environment and Natural Resources (DENR), the Department of Agrarian Reform (DAR), the National Commission on Indigenous Peoples (NCIP), and local government units (LGUs) of Abra, Benguet, and Mountain Province. The PSO of DA-CAR, assisted by contracted international and national consultants, was responsible for overall management of the Project. The implementing arrangements were formalized in several memoranda of agreement between the partner implementing agencies. Coordination at the regional level was provided by an interagency steering committee headed by a senior DA official. Provincial steering committees were headed by the provincial governor. At the provincial, municipal and barangay levels, project management groups were headed by provincial and municipal planning and development officers.
II. EVALUATION OF DESIGN AND IMPLEMENTATION
A. Relevance of Design and Formulation
7. The Project was designed to address the following constraints to agricultural development in CAR: (i) inadequate access, (ii) insufficient irrigation services, (iii) inadequate post-harvest facilities, (iv) lack of appropriate technologies for sustainable highland farming
3
systems, (v) inadequate access to credit for small farmers, (vi) poor marketing services brought about through a lack of market infrastructure and market information, (vii) land tenure issues, and (viii) land use conflicts between forest and proclaimed watershed reservations and agricultural lands. 8. At appraisal and completion, the Project was highly relevant to the Government’s priority of developing rural communities and reducing poverty. The overall aim was to reduce poverty in CAR by increasing household income in the target areas. Agricultural productivity would be improved by providing complementary infrastructure and agricultural support services and by promoting sustainable resource management practices. 9. The Project was designed under an ADB-financed project preparatory technical assistance3 (TA), conducted in close collaboration with the Government. It also drew on lessons learned from the earlier HADP. A joint ADB and IFAD appraisal mission was fielded in June 1995 and the Project became effective in June 1997. 10. The following changes to the design and institutional arrangements were made during the course of implementation.
(i) The passage of the Indigenous Peoples’ Rights Act in 1997 meant that the implementing agency responsible for the issuing certificate of ancestral domain titles (CADTs) and land tenure improvements was changed from the DAR to the NCIP, which joined the Project in early 2001.
(ii) A new target for the formulation of Ancestral Domain Sustainable Development and Protection Plans was incorporated to complement the issuance of CADTs and to help indigenous cultural communities (ICCs) in their resource management and development.
(iii) Indigenous resource management practices were promoted as a means of empowering and encouraging ICCs to take care of their resources. For example, lapa, the indigenous land management system in Abra, was officially recognized by the ICCS, LGUs, and DENR.
(iv) Agro-forestry was promoted to increase income generation and enhance forest conservation.
(v) NGO services were extended to help prepare beneficiaries for the eventual hand- over of project facilities to local communities and to help integrate people’s organizations into the activities of the LGUs, and BNRMPs into the barangay and municipal development plans.
(vi) Plans and targets for some infrastructure components were revised to make them more relevant, e.g., the number of domestic water supply systems (DWS) was reduced, design standards for farm-to-market roads (FMRs) were changed, the length of spillways and service areas for irrigation schemes was increased, and the tramline project was cancelled in favor of rehabilitating an existing road.
(vii) Targets for agricultural support services (ASS) were increased in response to proposals from beneficiaries made at annual planning workshops.
(viii) The roles of the project director and project manager were merged, allowing full-time leadership and supervision of the Project, and a more active regional coordination committee was created.
3 ADB. 1994. Technical Assistance to the Republic of the Philippines for Cordillera Highland Agricultural Resource
Management Project. Manila (TA 1915 PHI).
4
B. Project Outputs
1. Community Mobilization and Natural Resource Management
a. Community Mobilization and Participatory Planning
11. A consortium of six NGOs based in CAR was hired to undertake this activity. Community mobilization officers and NGO staff conducted participatory planning activities in the project area. The output was 10,200 household profiles and 82 barangay socioeconomic profiles in June–July 2000, and the finalization of 82 BNRMPs in July 2001.
b. Natural Resources Management
12. With respect to land tenure improvement in connection with the issuance of certificate of ancestral domain claims, DENR-CAR aimed to survey 150,000 ha of ancestral domain claims. By the end of 2000, it had surveyed 123,765 ha and turned over three certificate of ancestral domain claim documents (the target was four). After the passage of the Indigenous Peoples’ Rights Act in October 1997, the NCIP joined the Project as a partner implementing agency and took over responsibility for this subcomponent, with continuing assistance from DENR. In the course of the surveys a total of 423 Philippine reference system stations (PRS ’92) were established to serve as official reference points for ground surveys. Environment and natural resources maps of six municipalities were produced. DAR issued 13,905 ha of comprehensive agrarian reform program beneficiary certificates, for 12,276 farmer-beneficiaries, and 1,105 ha certificate of land ownership awards for 1,053 farmer-beneficiaries before NCIP joined the Project. 13. One certificate of ancestral domain title (CADT) covering 29,444 ha was issued to Bakum municipality in July 2002 and another covering 26,353 ha was issued to Kibungan municipality in March 2004. As of March 2005 the Atok ancestral domain was 100% complete and the Buguias ancestral domain was 70% complete. The CADT for a tribe in Abra was 75% complete. Some work relating to a boundary dispute remains to be completed. 14. A total of 6,560 ha was reforested (3,806 ha) or benefited from agroforestry (1,781 ha) or enrichment planting (973 ha). The overall achievement for reforestation was 99.65%.
2. Rural Infrastructure Development
a. Farm-to-Market Access Roads
15. Because of the delay in mobilizing the NGO, the identification of infrastructure projects was delayed. A total of 151.35 km of FMRs (target 150 km); 95.4 m of bridges (target 100m); 644.5 m of spillways (target 300 m); and 358.5 m of footbridges (target 286 m) were completed under the Project. All of the completed FMRs have been handed over to the local governments. The project completion review (PCR) mission visited several FMRs and found that the condition of FMRs handed over to the provincial governments (109.85 km) was generally satisfactory. However, FMRs handed over to the barangays (41.5 km) were not so well maintained.
5
b. Community Irrigation Systems
16. A total of 52 communal irrigation systems (CISs) covering an irrigation service area of 2,810 ha were completed under the Project, compared with the original target at appraisal of 63 CISs with 2,800 ha of service area. All of the completed CISs have been handed over to the irrigators’ associations (IAs) concerned. At PCR preparation, all but five CISs were operational. The five CISs at Baniwas, Daldalao-Malingeb, Ducligan, Lingey, and Mamulyas-Sinag in Abra province were badly damaged by floods caused by typhoon Igme in June 2004, affecting a service area of 645 ha. NIA has prepared a plan to rehabilitate damaged facilities at a total cost of P24.6 million. Works will begin in 2006.
c. Domestic Water Supply
17. A total of 30 domestic water supply systems (DWSs) covering 3,558 households were completed under the Project, compared with the original target of 63 systems covering 3,260 households. The size of each DWS at appraisal was smaller than the actual systems that were constructed, which led to a reduction in the number of number of systems constructed from 63 to 30 (although the number of households served by the DWSs exceeded the target). All 30 systems are operating without any difficulties.
3. Agricultural Support Services
18. This component comprised (i) agribusiness services, (ii) extension services, (iii) adaptive research services, and (iv) rural financial services. The performance of this component was generally satisfactory, especially a radio program aired from local radio stations called “CHARM on the Air” which provides market information and is much appreciated by the farmers in the area. Although project support has ended, the program is still running and is sponsored by several private companies. Integrated pest management (IPM) training for farmers was also much appreciated by farmers as it helped to reduce their pesticide use and lower their production costs. IPM is leading to safer vegetable and rice production. A summary of training implemented under the Project is shown in Appendix 2. 19. The targets for the rural finance services subcomponent were scaled back during project implementation. The Project organized and supported 172 small savings and credit groups (SSCGs) with 1,355 members, the great majority of whom are women. However, the performance and sustainability of SSCGs is mixed, with savings by groups mostly used for onlending to group members for productive purposes.
4. Project Management and Coordination
20. A PSO within the DA-CAR was established in November 1996 before loan effectiveness. It served as the center of operations for project implementation. Assisted by consultants, the PSO implemented the policies promulgated by the regional interagency steering committee (RISC) and carried out budgeting and financial control, procurement of goods and services, loan disbursement, and coordination and supervision of project implementation. The key staff at the PSO were obtained from DA-CAR and most had been involved in the earlier HADP. In each province, two provincial coordinating officers were responsible for coordination and liaison with the LGUs. A civil engineering assistant was detailed to each provincial engineering office (PEO). Appendix 3 shows the current project organization chart, compared with the organization envisaged at the time of appraisal.
6
C. Project Costs
21. At appraisal, the total project cost was estimated at $41.5 million, $9.532 million in foreign exchange cost and $31.968 million in local currency cost. ADB approved two loans for a total of $19.0 million equivalent (46% of total project cost) for the Project, consisting of $9.5 million from ADB’s Asian Development Fund (ADF), equivalent to SDR6.357 million, and $9.5 million from its ordinary capital resources (OCR). IFAD loaned $9.2 million (22% of the total project cost). The actual project cost was $31.875 million or 76.8% of the original estimate. The cost underrun was mainly attributed to the depreciation of the peso to the US dollar from P26 at appraisal to P55 at the loan closing date. In peso terms, the actual project cost was P1.45 billion, compared with P1.32 billion (including contingencies) at appraisal. Appendix 4 shows the actual annual disbursements under the Project. D. Disbursements
22. At the initial stage of the Project, disbursement of the loan proceeds was very slow, because of the delayed implementation of the infrastructure component, such as farm-to-market roads (FMRs), communal irrigation systems (CISs), and domestic water supply systems (DWS)—see para. 25. 23. Four imprest accounts amounting to $3 million were established for the Project to help expedite disbursements. Three imprest accounts were for the DA—two for ADB under L1421-PHI and L1422-PHI(SF) (footnote 1), and one for the DA component under IFAD. The fourth account ($327,048.95) was for the DENR component under IFAD, which was established at a later stage at the request of DENR. During the 5 years of implementation (2000–2004), the average annual turnover ratios of the imprest accounts were 1.4 for L1421-PHI and 1.0 for L1422-PHI(SF). E. Project Schedule
24. The Project was supposed to be implemented over a period of 7 years starting in early 1996. The original project completion date was 31 March 2003. Actual project implementation was delayed initially because of difficulties in recruiting NGOs, which were required for the formulation of BNRMPs for each barangay. L1421-PHI was extended once by 1 year and closed on 30 September 2004. L1422-PHI(SF) was extended twice until 31 March 2004, compared with the original closing date of 30 September 2003. The IFAD loan was also extended to 30 June 2005 from 30 September 2003. Appendix 5 shows the project implementation schedule at appraisal compared with the actual schedule. F. Implementation Arrangements
25. The implementation arrangements were generally successful. A major change from the previous project, HADP, was that implementation of FMRs was carried out by the provincial governments, instead of the Department of Public Works and Highways. ADB considered that the provincial governments were capable of implementing the FMR component, and that this would generate a stronger sense of ownership. 26. The Project established a project management office (PMO) with staff seconded from the executing and implementing agencies. The arrangement was different from the original
7
design, which envisaged that the PMO would be staffed by contractual staff, not from the government agencies. The revised arrangement meant that institutional memory has been retained within the executing and implementing agencies. Although most of the project staff have now returned to the DA and other agencies, the project office is still operating. 27. The DA, DENR, and local government project coordination teams in each Province had regular coordination meetings and visited the three provinces in turn, which helped to resolve implementation issues in a timely way. G. Conditions and Covenants
28. The Government’s compliance with the loan covenants was generally satisfactory. None of the covenants was modified, suspended, or waived during the implementation of the Project. All the reporting requirements were fulfilled by the Borrower and the executing agency. Appendix 6 shows the status of compliance with the loan covenants. One of the key covenants was the issuance of land title to indigenous people. The issuance of certificates of the land title by DAR and DENR was stopped because of the passage of the Indigenous Peoples’ Rights Act in October 1997, which effectively transferred the jurisdiction of ancestral lands from DENR and DAR to NCIP. As part of the Project, NCIP issued the Philippines’ first title for an ancestral domain for the Bago-Kankanaey tribe of Bakun on 20 July 2002. H. Consultant Recruitment and Procurement
29. Project consultants were engaged by DA-CAR in accordance with the ADB’s Guidelines on the Use of Consultants. In total, 283.3 person-months of consulting services were provided, of which 31.7 person-months were international (30 person-months estimated at appraisal) and 251.6 person-months were domestic (261 person-months estimated at appraisal)—see Appendix 7 for details. 30. The consultant team was fielded in January 1998 and the services were completed in September 2003, compared with the appraisal’s planned mobilization of consultants in 1996 and completion in 2003. Although ADB approved advance actions for the recruitment of consultants at appraisal, actual recruitment was delayed because of cumbersome government procedures. 31. The NGO for community mobilization and participatory planning was fielded in June 1999, a delay of about 24 months from the appraisal schedule. The main causes of the delay were (i) after evaluation of the proposals received from shortlisted firms, two first-ranked NGOs were asked by the Government to form a consortium and it took a long time for the NGOs to agree on the arrangements; and (ii) the contract amount was high and required the approval of the President of the Philippines, following time-consuming procedural requirements. 32. Procurement of all the equipment provided under the Project, including heavy equipment for operation and maintenance of the roads, for a total cost of P74.101 million was conducted from 1997 through 2003 (7 years), compared with 1996 to 2002 at the appraisal estimate. The equipment was procured following ADB’s Procurement Guidelines. All procured equipment was turned over to the user agency or user offices upon delivery. In general, the procurement process went smoothly. The list of procured equipment, with costs and users, is in Appendix 8.
8
I. Performance of Consultants, Contractors, and Suppliers
33. The performance of the consultants was generally satisfactory. The consultants (i) guided NGO, DA, and local government staff in formulating household and barangay profiles and preparing the BNRMPs, (ii) formulated and prepared a “catch-up plan” for the 4-year infrastructure program and guided the planning, directing, supervising and monitoring of projects from identification to maintenance after completion, (iii) formulated and prepared the agriculture support services, and (iv) assisted project management. 34. The NGO achieved the general objectives of managing community mobilization and participatory planning for 82 BNRMPs, one for each barangay covered, and preparing the profiles of 82 barangays and 10,200 households. However, with hindsight, it would have been better to have engaged four or five NGOs rather than one consortium under a large contract. This would have avoided delays in NGO selection and fielding and would have created a competitive environment. 35. As envisaged at appraisal, bridges, river crossing spillways, and some sections of FMRs which needed heavy equipment and technical capability, were implemented by contractors selected through local competitive bidding. The performance of the contractors was generally satisfactory. However, construction of small and simple infrastructure for CIS and DWS done by IAs with the participation of the beneficiaries was slow, and required close supervision and guidance by the PMO staff. J. Performance of the Borrower and the Executing Agency
36. The Borrower and the DA worked closely to solve problems, and their performance was satisfactory. The DA made an effort to provide sufficient counterpart budget and to ensure its timely release. The implementation capability of the provincial engineering offices (PEOs) for the rehabilitation of FMRs was weak at the beginning of the Project because of the new implementation mechanisms, but their performance improved rapidly after they became used to the system. The Project provided a good opportunity for PEO staff to gain experience. In addition, DA staff for the agricultural support services (ASS) activities were very innovative in initiating the radio broadcast program “CHARM on the Air”, which became very popular in the region and provided up-to-date information about market prices and agricultural technology. K. Performance of the Asian Development Bank
37. ADB monitored the Project closely, fielding one inception mission, nine review missions and two loan disbursement missions, involving 211 person-days of staff and consultant services, and including an intensive midterm review in July 2000. ADB reviewed the Project annually and took steps to solve problems appropriately during implementation. There were no disagreements with the Borrower or DA on the terms of reference, bid documents, awards, project costs, implementation schedule; or other matters affected implementation procedures. ADB’s performance in jointly administering the Project with DA was satisfactory.
9
III. EVALUATION OF PERFORMANCE
A. Relevance
38. At appraisal and completion, the Project was highly relevant to Government and ADB policies and priorities to develop rural communities and reduce poverty. The Project was in accord with the Government’s Medium-term Philippines Development Plan (1993–1998) which at the time of project formulation promoted sustainable economic growth and poverty reduction as the foundation for regional and sectoral policies, programs, and projects. The Project was also in accord with the Department of Agriculture’s Medium-term Agricultural Development Plan (1993–1998), under which government assistance was to be focused on infrastructure, post-harvest handling and market assistance, credit support, and research and extension services. It was compatible with regional planning priorities of the Cordillera Regional Physical Framework Plan (1994–2020) of the National Economic and Development Authority-CAR. The Project’s objectives complemented ADB’s country and sector strategy for the Philippines, which emphasized economic growth based on sustainable development. ADB’s strategy for agricultural and rural development in the Philippines was to increase agricultural production and productivity by developing rural infrastructure such as roads and irrigation, post-harvest and storage facilities, and agricultural support services, especially with respect to (i) community development and self-help approaches to increase rural incomes, (ii) sustainable approaches to resource management, and (iii) on-farm research and extension. B. Effectiveness in Achieving the Outcome
39. The Project was effective and contributed to reducing poverty. It had achieved most of its revised output implementation targets by the end of the 1-year project extension to March 2004. After the slow start to project implementation (caused by the delay in mobilizing NGOs) and delays in the process itself, the pace of project implementation picked up in the last 3 years. All works were completed during the revised project implementation period. 40. The overriding objectives of the Project as stated in the report and recommendation of the President (RRP) were to increase incomes for smallholder farm families and to reduce poverty (footnote 1). The appraisal document stated that the objective was to increase the average annual farm family income from about P21,200 ($820) in 1995 to at least P56,000 ($2,170) by 2006 in real terms (a 164% increase). It noted that about 70% of the 47,600 households in the target municipalities were below the poverty line (defined as an income less than P3,353 [$130] per month in 1992); an associated goal of the project was to reduce the number of households below the poverty line from about 33,000 to about 12,000. In order to accomplish this, the Project directly targeted about 23,150 households. Indirect benefits to another 50,000 households were anticipated through spillover impacts in the adjacent barangays and municipalities, as a result of the institutional strengthening of implementing agencies and NGOs, increased economic activity in the target communities, more connections between markets, and higher demand for labor. In addition it was anticipated that 8,000 households in the influence zone of the improved roads would also benefit, especially from better access to social services. 41. The Project’s poverty reduction goal was ambitious, as it implied that over 90% of the direct beneficiaries would be poor. By their nature, the Project’s main activities were aimed at benefiting the communities as whole rather than selected individuals, which implied that the Project was to target only the communities that had poverty incidence of over 90%. The detailed

10
social profiles undertaken by the Project showed that the poor households were spread out and not concentrated in distinct geographic areas, which made it difficult to target the planned number of poor households and reach the desired level of poverty reduction. Nevertheless, the Project targeted the barangays with high poverty incidence and had a significant impact in reducing poverty. 42. Despite the Project’s clear statement of its objectives, and considerable investments in benefit monitoring and evaluation (BME) during implementation, the available data do not allow a rigorous assessment of the Project’s impact. Delays in recruitment of NGOs meant that, although project implementation began in 1997, benchmark surveys could only be carried out in June 2000. Similarly, the final BME surveys were undertaken in February–March 2004, which was too early to gauge the full impact. For a sample of beneficiary households, the BME reports quantify the change in household income between the benchmark survey and the final BME survey. The results are summarized in Appendix 9, Table A9.2. The average income per month is expressed in current prices for three activities (CIS, FMR and DWS) and these show an average increase for the three activities of 97%. However when allowance is made for inflation between 2000 and 2004 of around 20%, the percentage increase in income in real terms is reduced to an average of 65% over the 5 years (an average increase of 13% per annum). This can be compared with the stated objective at appraisal to increase average family incomes by 168% in real teams for the 11 years from 1995 to 2006 (an average increase of 15.2% per annum). Although the Project has achieved a commendable increase in household income over the 5 years, it is unlikely that it will achieve its target of 168% by 2006. However, project benefits are expected to increase further, especially from CIS, because of anticipated increases in paddy yields. 43. In the absence of poverty data from the BME survey, results from the Family Income and Expenditures Survey (FIES) of 2000, conducted by the National Statistics Office, were used to ascertain the impact on poverty incidence. These showed that from 1997 to 2000 the poverty incidence among families in the CAR had been reduced by 5.9% (from 42.5% to 36.9%), the biggest decline in the country. For rural families in the CAR, the decline in poverty incidence for the same period was 5.5% (from 55.5% to 50.0%). Comparable data for poverty incidence are not available from the FIES 2003, but that year’s survey does show that, with regard to the real change in average family income by region, the CAR’s performance was the seventh best of the 17 regions in the Philippines, with a decline of 2.4%, compared with a national decline of 10%. In conclusion it can be assumed that CAR has achieved a measure of poverty reduction during the Project period that was higher than that in other regions, but considerably less than that envisaged during appraisal. Some of this poverty reduction would have been due to the Project, but it is not possible to differentiate its impact from other influences. C. Efficiency in Achieving Outcomes and Outputs
44. The economic internal rate of return (EIRR) for the overall project (excluding costs and benefits of the reforestation component funded by IFAD) is evaluated at 15.9%, compared with the EIRR at appraisal of 18% (Appendix 9). The project has achieved its targets for implementation of the various components with only a 1-year extension, and was cost-efficient in that its actual cost in dollar terms was less than the appraisal estimate (which allowed a write-off of the loans). 4 The EIRR is slightly lower than the appraisal estimate, despite an
4 It should be noted that the cost savings in dollar terms were a result of the depreciation of the peso against the US
dollar during implementation.
11
improvement in the terms of trade for agricultural commodities brought about by the devaluation of the peso vis-à-vis the dollar. Vegetable producers are facing pressure on prices because of increases in supply in the CAR and other regions and because of competition from vegetable imports. The sensitivity analysis shows that the economic return is sensitive to changes in the level of benefits, especially the returns from vegetable production. 45. The efficiency of the Project is also judged by the efficiency of the process (i.e., the way in which the executing and implementing agencies and ADB managed the Project). The efficiency of implementation was satisfactory, particularly through the supervision provided by the project management and the use of seconded staff with good local knowledge for project management, rather than hired contract staff. The Government’s allocation of counterpart funds from the national development budget was also efficient. However, the initial delays in the appointment of NGOs for the participatory planning process did result in a slow start that delayed the achievement of the outputs. Project management and ADB were responsive and flexible to changes in design and approach and maintained a very good dialogue and relationship throughout which also contributed to efficiency. D. Preliminary Assessment of Sustainability
46. The sustainability of the improvements to infrastructure and the resulting economic benefits of increased agricultural productivity largely depend on the effectiveness of the beneficiaries and local government to fund and organize operation and maintenance (O&M) adequately to ensure the durability of the irrigation, road, and water supply schemes. The Project encouraged traditional sustainable natural resources management through a participatory approach. Most communities prefer to rely on traditional methods of contributing voluntary labor and in-kind materials for O&M according to need, rather than making regular contributions of money to a maintenance fund. While this ad hoc system may be able to deal with minor and routine O&M, it is unlikely to be able to cope when a bigger effort is required to rectify major problems.5 The maintenance of FMRs, a responsibility of the barangays, also suffers from a lack of funds. The Cordillera region is susceptible to regular typhoons that can cause major flooding and damage, e.g., the damage caused by typhoon Igme to project irrigation and road infrastructure in June 2004. Although the beneficiaries are prepared to contribute labor and in-kind materials for periodic repair of the infrastructure, they have not put in place a system for regular contributions to a fund for O&M as was envisaged at appraisal. 47. These factors will reduce the sustainability of the facilities installed by the project. A culture of organized self-help needs to become institutionalized in the beneficiary communities and ways and means developed to apply “user pays“ to collect more finds for O&M. On the other hand, the sustainability of the agricultural support services appears to be more assured as there is good appreciation of the value of training and knowledge transfer (helped by the relatively high level of education of the beneficiaries). For example, it has been possible to attract private sector sponsorship in order to maintain the radio program “CHARM on the Air” after closure of the Project. As a result, overall the Project’s sustainability is rated as “less likely”. Follow-up action is recommended to ensure that the implementing agency continues to promote O&M by the communities. Overall the sustainability of the Project is assessed as “likely”.
5 This was also mentioned in ADB’s Special Evaluation Study on the Effectiveness of Participatory Approaches in
Rural Development Projects – Do the New Approaches Offer an Effective Solution to the Conventional Problems? (2004).

12
E. Impact
48. At completion, the Project had made significant strides towards achieving its twin goals of increased farm incomes and reductions in the poverty. As discussed above, farm incomes had risen by about 65% by 2004 (from 2000 levels), and poverty incidence had declined by about 6% in 2000 (from 1996 levels). Because of lack of data, these results, while significant, do not fully capture the Project’s impact on incomes or poverty levels. While the Project was implemented from 1997 to 2004, income improvements are reported for the period 2000–2004, and reductions in the poverty level for the period 1996–2000. Interestingly, the most recent data available for poverty incidence in the Project area predate the benchmarks for the income data. While the Project will not achieve the ambitious levels of poverty reduction envisaged at appraisal, the PCR mission’s interaction with the stakeholders suggests that the Project’s impact on incomes and poverty is considerably larger than that indicated by the available data, and is anticipated to increase further when the full benefits of components such as the CISs materialize. 49. The environmental impact was minimal and mostly positive. The Project was primarily involved with the rehabilitation and improvement of existing facilities—irrigation and roads—and the promotion of better agricultural practices. The changes it made to agricultural production systems are unlikely to have a major environmental impact. The development of new irrigation systems and the improvement of FMRs have resulted in the more intensive cultivation of some agricultural land, but most of the land was already being used for rainfed agriculture. Improved agricultural practices, especially the adoption of IPM by 52% of farmers, have helped farmers to make better informed decisions about the use of agro-chemicals and fertilizer, reducing risks to the ecosystem. The reforestation of 6,560 ha is expected to have major environmental benefits. On the other hand, the better infrastructure has resulted in more intensive vegetable production and there is a risk that inappropriate land management practices will be applied, especially on steep land, and that there will be greater use of agro-chemicals. 50. Construction of project facilities led to considerable local employment, which has had a positive impact on the local economy. The participatory approach that was used to identify community needs and to prepare the BNRMPs under the project has heightened awareness of development issues and priorities and has strengthened the sense of ownership and community responsibility. 51. The Project had no adverse impacts on livelihoods or assets. The amount of land voluntary contributed by the beneficiaries for infrastructure or conversion to other uses (resulting in loss of income, livelihood, or assets) was negligible. There was no land acquired under the Project. Most of the aggregates required for road rehabilitation were collected from riverbeds and no major quarry sites were opened. 52. The Project had a positive impact on indigenous people. It facilitated the first issuance of CADT of 29,444 ha for the Bakum and 26,353 ha for Kibungan communities. This was major breakthrough in the conflict over land titles in the Philippines and was the first step to giving the land titles to individual owners, which will have significant impact on the economic development of the indigenous people in the area.
13
IV. OVERALL ASSESSMENT AND RECOMMENDATIONS
A. Overall Assessment
53. The overall performance rating for the Project is “successful”. The Project was relevant to the Government’s and ADB’s agriculture and rural development policies when it was prepared and it continues to be relevant. The Project met all its physical targets and achieved most of its immediate development objectives. It was implemented as conceived with only minor changes that improved the overall outcome (e.g., the design for FMRs was changed from gravel roads to concrete wheel tracks). Agricultural support services have raised agricultural productivity but have yet to reach their full potential. Performance and project outcomes, as measured by the BME surveys, were in line with expectations for the main indicators: cropping intensity, rice yields, farm household income, and employment. It has also had a significant effect on rural poverty and livelihoods, but has not yet achieved the target for reducing the percentage of households below the poverty line. Overall, the reevaluated EIRR of 15.9% is acceptable and indicates that the Project was efficient.
54. The maintenance and sustainability of the infrastructure developed by the Project (FMR, CIS, DWS and reforestation) is an issue. The capacity of the beneficiaries and LGUs to provide ongoing O&M is not certain and further support is needed to build capacity, institutionalize fee collection, and introduce “user pays” systems. Repairs to major damage caused by extreme climatic events will continue to rely on support from provincial governments. B. Lessons
55. The following key lessons were learned from the Project.
(i) Using the new approach to the Project, it is necessary to train the government officials and project staff properly at the very beginning of the Project. The Project was the first ADB-funded project in the Philippines to use a participatory process to mobilize and empower local communities to bring them into the development process. It also strengthened the capacity of government institutions with responsibility for delivering a range of services. Although the participation of community members was largely confined to the planning stage, with implementation undertaken by the line agencies using conventional means, valuable experience was gained that will be relevant to similar projects.
(ii) In the participatory process, early and quick mobilization of planning facilitator is the key to success of the Project. The 2-year delay in completing the contractual arrangements and mobilizing the locally-based NGOs led to delays in initiating the participatory process and resulted in a compressed time frame for the participatory process and delayed implementation, which should be avoided in future projects.
(iii) The involvement of an NGO in the formulation of BNRMP was very useful since the NGO was familiar with the participatory approach, the CAR, and indigenous people.
(iv) For the establishment of new project implementation office, the secondment of staff from the participating agencies to the project support office, rather than hiring contract staff, contributed to human resource development and enabled
14
institutional knowledge to be retained within the implementing agencies, which will be useful for similar projects in the future.
(v) Support for the ‘CHARM on the Air” radio program provided market information and increased awareness of the Project. Because of strong support from listeners, the radio program has attracted private sector support since project completion of the Project, which is an ideal way of sustaining project activities.
(vi) The expansion of the IPM program through farmers’ field schools to cover other activities such as livestock, agro-forestry and child nutrition was successful and beneficial. This methodology may be applied to other agricultural activities.
(vii) Because of the sense of ownership generated by implementation arrangements under the Project, the construction of roads by the provincial engineering office was more effective than using the Department of Public Works and Highways (which had been used as the implementing agency for the previous HADP).
(viii) Incorporation of indigenous peoples knowledge to the project design makes the Project more implementable and easy to be understood by the people. The Project incorporated indigenous forest management practices called lapat. It may prove to be a model for the use of other indigenous knowledge and institutions in the management of other sectors—e.g., water, agriculture, and health. Such indigenous knowledge should be drawn on for future projects.
C. Recommendations
1. Project-Related
56. Future Monitoring. Ongoing monitoring of the Project needs to become institutionalized within the local government structure to ensure that an ongoing and cost-effective monitoring and evaluation system is operating and that there is good coordination between the DA and other line agencies. 57. Covenants. The current covenants in the loan agreement should be maintained without any major modifications for at least 5 years (unless the Project is affected by a catastrophic disaster). 58. Further Action or Follow-Up. Rehabilitation of the typhoon damage to irrigation systems and FMRs, including the abutment of the Wanga bridge, should be carried out as soon as possible. If feasible, flooded rice fields should be rehabilitated. 59. Timing of the Project Performance Evaluation Report. The project performance evaluation report should be produced in about 3 years. This will allow the sustainability of the infrastructure to be assessed and allow time for communities and LGUs to develop O&M processes.
2. General
60. For future rural development projects in the Philippines the following actions are recommended.
15
(i) The participatory approach with the local communities and beneficiaries’ full involvement in scheme selection, design, construction and O&M should be used.
(ii) The pre-construction and pre-implementation participatory planning phase should be clearly distinguished from the construction and implementation phase, in order to avoid delays in the implementation schedule and to allow lead-time for community consultation and preparation.
(iii) More consideration should be given to the sustainability of facilities in projects concerned with capacity building and strengthening of LGUs and people’s organizations responsible for O&M. An adequate monitoring system needs to be in place. Regular collection of fees and the possibility of user charges for the use of new facilities should be included in the project design.
(iv) Local governments should provide funding from their regular budget to cover O&M of completed FMRs. In allocating funds, priority should be given to the O&M budget over the new construction of roads.
(v) The design of FMRs should consider the future O&M needs and aim to reduce maintenance needs by use of concrete pavement rather than graveled surface, especially for steep sections.
(vi) Monitoring of household incomes to measure the impact of the Project on level of poverty levels should be conducted in close coordination with the National Statistics Office to ensure that the methodology used is compatible with the Family Income and Expenditure Survey that is usually conducted every 3 years.
16 Appendix 1
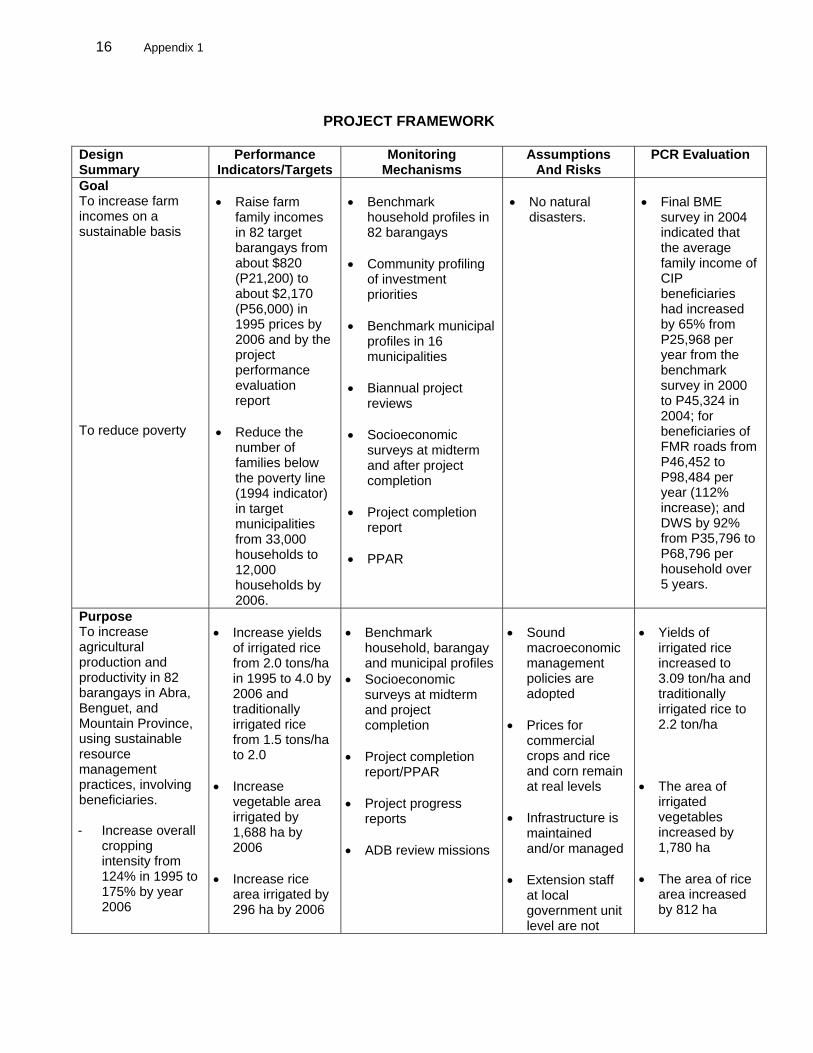
PROJECT FRAMEWORK
Design Summary
Performance Indicators/Targets
Monitoring Mechanisms
Assumptions And Risks
PCR Evaluation
Goal To increase farm incomes on a sustainable basis To reduce poverty
• Raise farm
family incomes in 82 target barangays from about $820 (P21,200) to about $2,170 (P56,000) in 1995 prices by 2006 and by the project performance evaluation report
• Reduce the
number of families below the poverty line (1994 indicator) in target municipalities from 33,000 households to 12,000 households by 2006.
• Benchmark
household profiles in 82 barangays
• Community profiling
of investment priorities
• Benchmark municipal
profiles in 16 municipalities
• Biannual project
reviews • Socioeconomic
surveys at midterm and after project completion
• Project completion
report • PPAR
• No natural
disasters.
• Final BME
survey in 2004 indicated that the average family income of CIP beneficiaries had increased by 65% from P25,968 per year from the benchmark survey in 2000 to P45,324 in 2004; for beneficiaries of FMR roads from P46,452 to P98,484 per year (112% increase); and DWS by 92% from P35,796 to P68,796 per household over 5 years.
Purpose To increase agricultural production and productivity in 82 barangays in Abra, Benguet, and Mountain Province, using sustainable resource management practices, involving beneficiaries. - Increase overall
cropping intensity from 124% in 1995 to 175% by year 2006
• Increase yields
of irrigated rice from 2.0 tons/ha in 1995 to 4.0 by 2006 and traditionally irrigated rice from 1.5 tons/ha to 2.0
• Increase
vegetable area irrigated by 1,688 ha by 2006
• Increase rice
area irrigated by 296 ha by 2006
• Benchmark
household, barangay and municipal profiles
• Socioeconomic surveys at midterm and project completion
• Project completion
report/PPAR • Project progress
reports • ADB review missions
• Sound
macroeconomic management policies are adopted
• Prices for
commercial crops and rice and corn remain at real levels
• Infrastructure is
maintained and/or managed
• Extension staff
at local government unit level are not
• Yields of
irrigated rice increased to 3.09 ton/ha and traditionally irrigated rice to 2.2 ton/ha
• The area of
irrigated vegetables increased by 1,780 ha
• The area of rice
area increased by 812 ha
Appendix 1 17
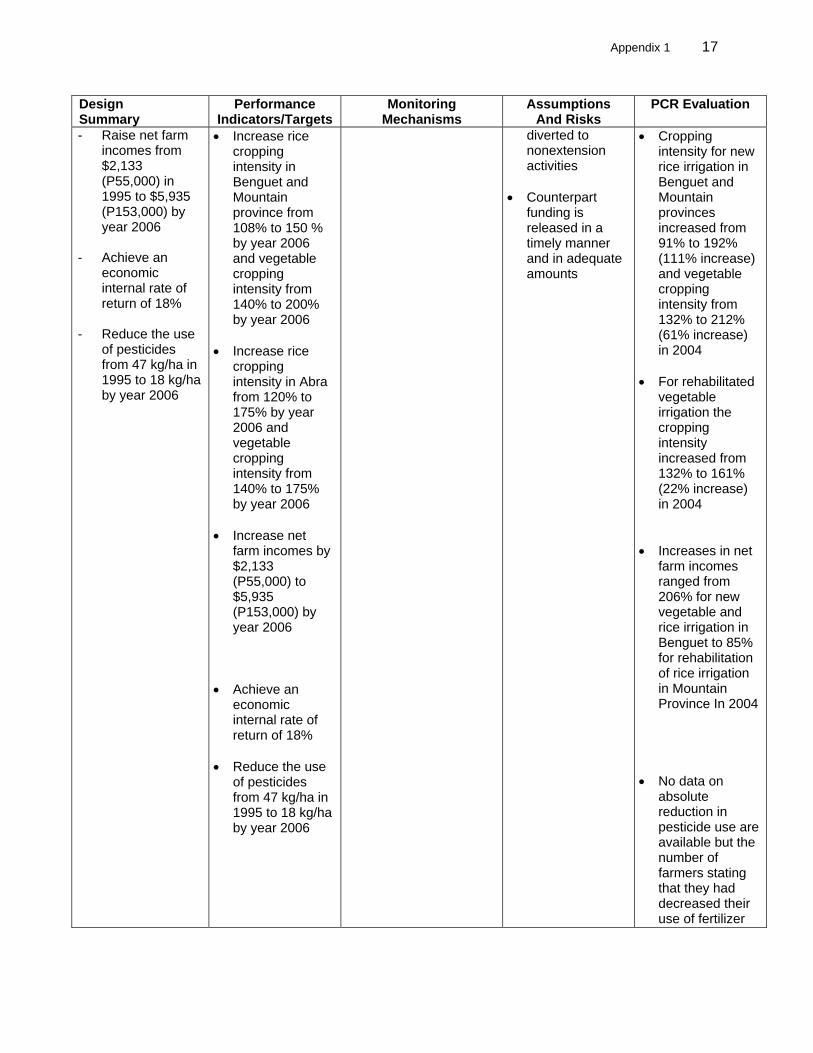
Design Summary
Performance Indicators/Targets
Monitoring Mechanisms
Assumptions And Risks
PCR Evaluation
- Raise net farm incomes from $2,133 (P55,000) in 1995 to $5,935 (P153,000) by year 2006
- Achieve an
economic internal rate of return of 18%
- Reduce the use
of pesticides from 47 kg/ha in 1995 to 18 kg/ha by year 2006
• Increase rice cropping intensity in Benguet and Mountain province from 108% to 150 % by year 2006 and vegetable cropping intensity from 140% to 200% by year 2006
• Increase rice
cropping intensity in Abra from 120% to 175% by year 2006 and vegetable cropping intensity from 140% to 175% by year 2006
• Increase net
farm incomes by $2,133 (P55,000) to $5,935 (P153,000) by year 2006
• Achieve an
economic internal rate of return of 18%
• Reduce the use
of pesticides from 47 kg/ha in 1995 to 18 kg/ha by year 2006
diverted to nonextension activities
• Counterpart
funding is released in a timely manner and in adequate amounts
• Cropping intensity for new rice irrigation in Benguet and Mountain provinces increased from 91% to 192% (111% increase) and vegetable cropping intensity from 132% to 212% (61% increase) in 2004
• For rehabilitated
vegetable irrigation the cropping intensity increased from 132% to 161% (22% increase) in 2004
• Increases in net
farm incomes ranged from 206% for new vegetable and rice irrigation in Benguet to 85% for rehabilitation of rice irrigation in Mountain Province In 2004
• No data on
absolute reduction in pesticide use are available but the number of farmers stating that they had decreased their use of fertilizer
18 Appendix 1
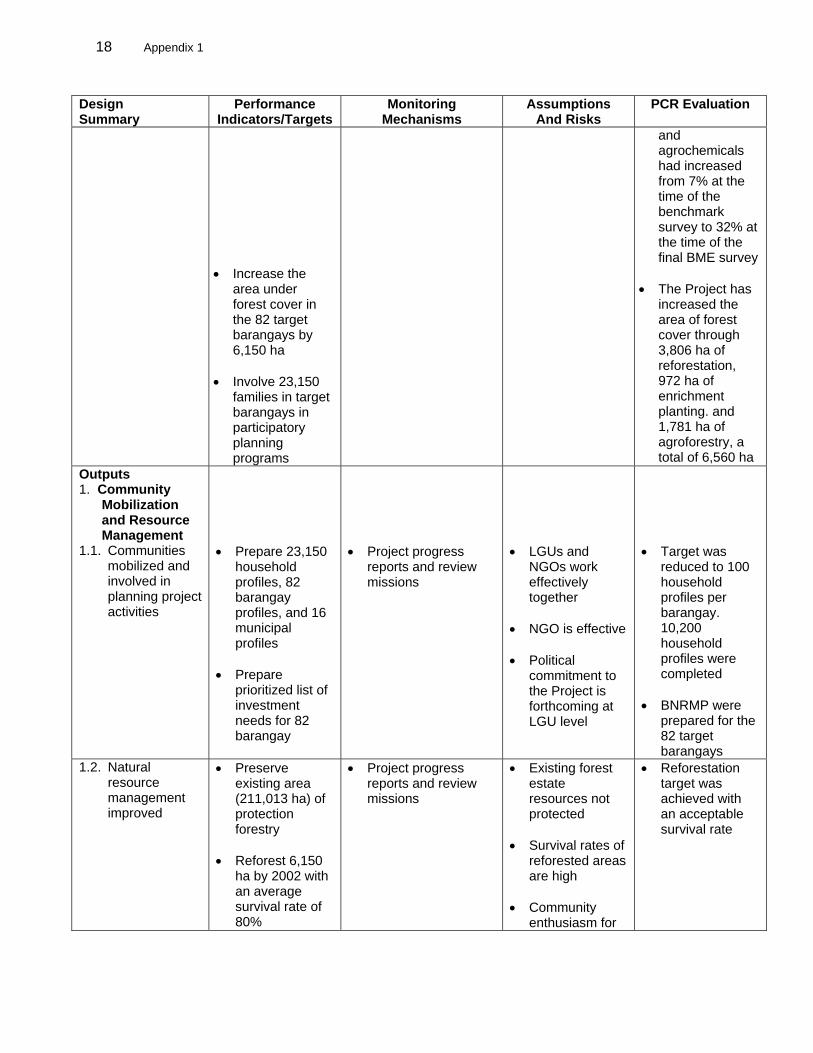
Design Summary
Performance Indicators/Targets
Monitoring Mechanisms
Assumptions And Risks
PCR Evaluation
• Increase the
area under forest cover in the 82 target barangays by 6,150 ha
• Involve 23,150
families in target barangays in participatory planning programs
and agrochemicals had increased from 7% at the time of the benchmark survey to 32% at the time of the final BME survey
• The Project has
increased the area of forest cover through 3,806 ha of reforestation, 972 ha of enrichment planting. and 1,781 ha of agroforestry, a total of 6,560 ha
Outputs 1. Community
Mobilization and Resource Management
1.1. Communities mobilized and involved in planning project activities
• Prepare 23,150
household profiles, 82 barangay profiles, and 16 municipal profiles
• Prepare
prioritized list of investment needs for 82 barangay
• Project progress
reports and review missions
• LGUs and
NGOs work effectively together
• NGO is effective • Political
commitment to the Project is forthcoming at LGU level
• Target was
reduced to 100 household profiles per barangay. 10,200 household profiles were completed
• BNRMP were
prepared for the 82 target barangays
1.2. Natural resource management improved
• Preserve existing area (211,013 ha) of protection forestry
• Reforest 6,150
ha by 2002 with an average survival rate of 80%
• Project progress reports and review missions
• Existing forest estate resources not protected
• Survival rates of
reforested areas are high
• Community
enthusiasm for
• Reforestation target was achieved with an acceptable survival rate
Appendix 1 19
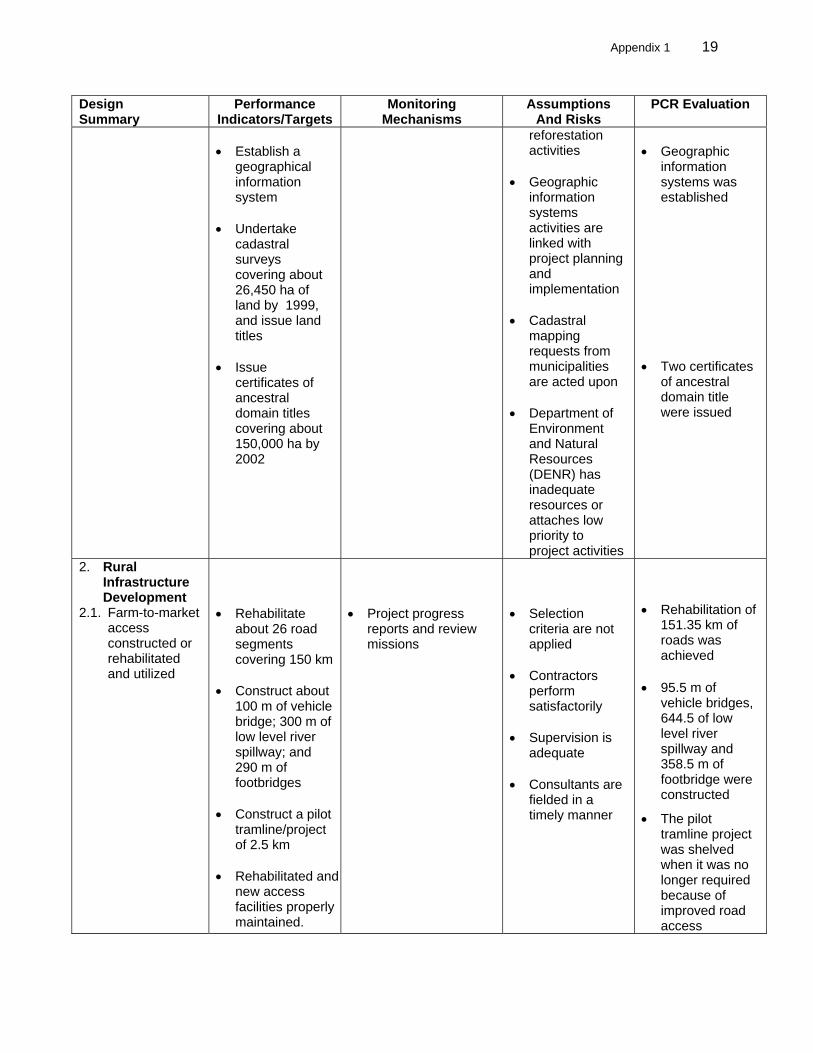
Design Summary
Performance Indicators/Targets
Monitoring Mechanisms
Assumptions And Risks
PCR Evaluation
• Establish a
geographical information system
• Undertake
cadastral surveys covering about 26,450 ha of land by 1999, and issue land titles
• Issue
certificates of ancestral domain titles covering about 150,000 ha by 2002
reforestation activities
• Geographic
information systems activities are linked with project planning and implementation
• Cadastral
mapping requests from municipalities are acted upon
• Department of
Environment and Natural Resources (DENR) has inadequate resources or attaches low priority to project activities
• Geographic
information systems was established
• Two certificates
of ancestral domain title were issued
2. Rural Infrastructure Development
2.1. Farm-to-market access constructed or rehabilitated and utilized
• Rehabilitate
about 26 road segments covering 150 km
• Construct about
100 m of vehicle bridge; 300 m of low level river spillway; and 290 m of footbridges
• Construct a pilot
tramline/project of 2.5 km
• Rehabilitated and
new access facilities properly maintained.
• Project progress
reports and review missions
• Selection
criteria are not applied
• Contractors
perform satisfactorily
• Supervision is
adequate • Consultants are
fielded in a timely manner
• Rehabilitation of 151.35 km of roads was achieved
• 95.5 m of vehicle bridges, 644.5 of low level river spillway and 358.5 m of footbridge were constructed
• The pilot tramline project was shelved when it was no longer required because of improved road access
20 Appendix 1
Design Summary
Performance Indicators/Targets
Monitoring Mechanisms
Assumptions And Risks
PCR Evaluation
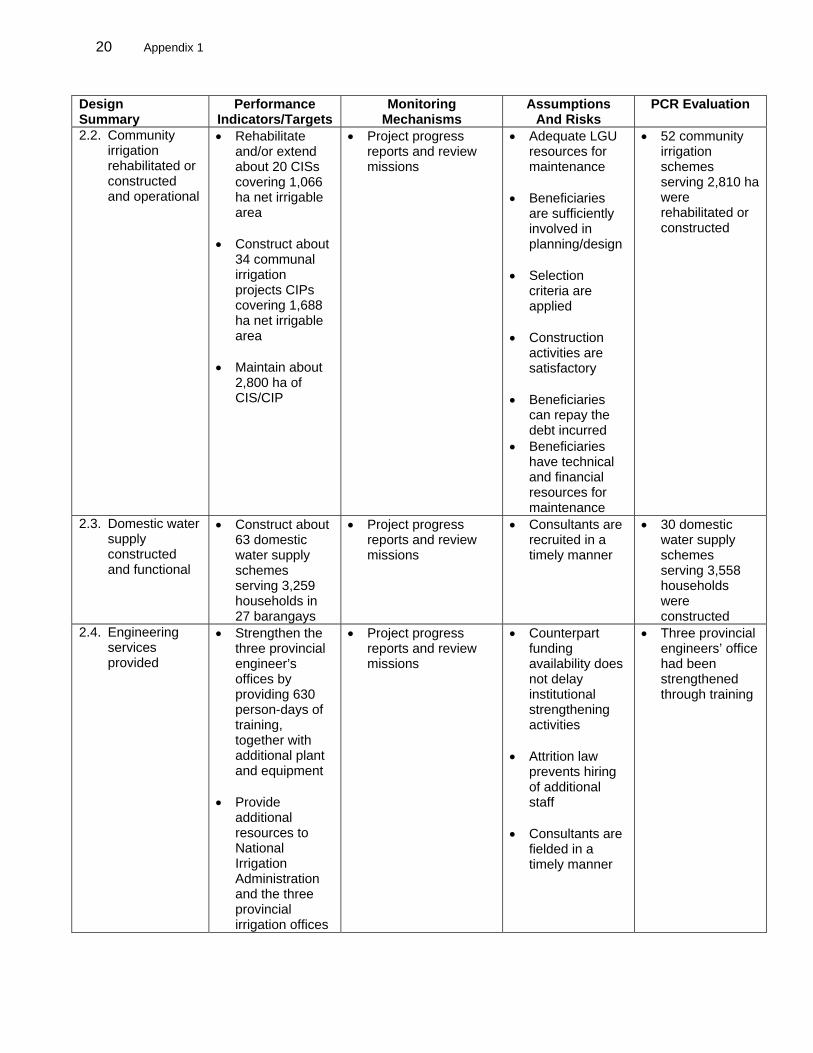
2.2. Community irrigation rehabilitated or constructed and operational
• Rehabilitate and/or extend about 20 CISs covering 1,066 ha net irrigable area
• Construct about
34 communal irrigation projects CIPs covering 1,688 ha net irrigable area
• Maintain about
2,800 ha of CIS/CIP
• Project progress reports and review missions
• Adequate LGU resources for maintenance
• Beneficiaries
are sufficiently involved in planning/design
• Selection
criteria are applied
• Construction
activities are satisfactory
• Beneficiaries
can repay the debt incurred
• Beneficiaries have technical and financial resources for maintenance
• 52 community irrigation schemes serving 2,810 ha were rehabilitated or constructed
2.3. Domestic water supply constructed and functional
• Construct about 63 domestic water supply schemes serving 3,259 households in 27 barangays
• Project progress reports and review missions
• Consultants are recruited in a timely manner
• 30 domestic water supply schemes serving 3,558 households were constructed
2.4. Engineering services provided
• Strengthen the three provincial engineer’s offices by providing 630 person-days of training, together with additional plant and equipment
• Provide
additional resources to National Irrigation Administration and the three provincial irrigation offices
• Project progress reports and review missions
• Counterpart funding availability does not delay institutional strengthening activities
• Attrition law
prevents hiring of additional staff
• Consultants are
fielded in a timely manner
• Three provincial engineers’ office had been strengthened through training
Appendix 1 21
Design Summary
Performance Indicators/Targets
Monitoring Mechanisms
Assumptions And Risks
PCR Evaluation
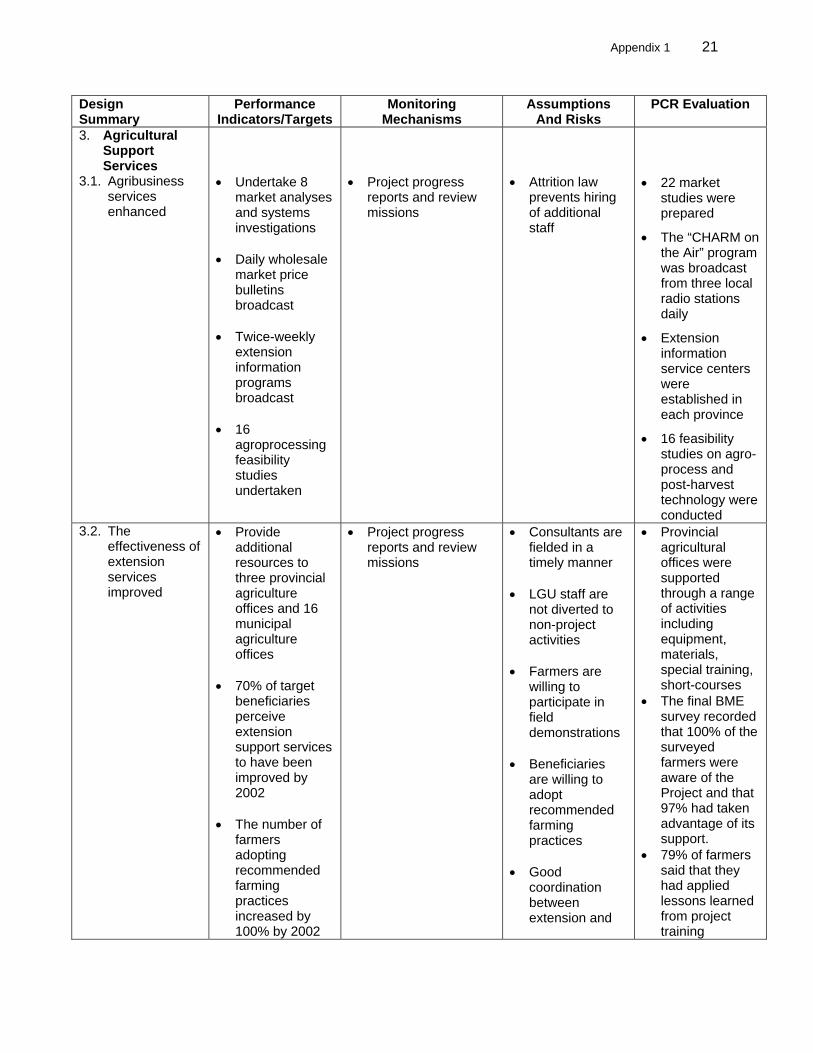
3. Agricultural Support Services
3.1. Agribusiness services enhanced
• Undertake 8
market analyses and systems investigations
• Daily wholesale
market price bulletins broadcast
• Twice-weekly
extension information programs broadcast
• 16
agroprocessing feasibility studies undertaken
• Project progress
reports and review missions
• Attrition law
prevents hiring of additional staff
• 22 market studies were prepared
• The “CHARM on the Air” program was broadcast from three local radio stations daily
• Extension information service centers were established in each province
• 16 feasibility studies on agro-process and post-harvest technology were conducted
3.2. The effectiveness of extension services improved
• Provide additional resources to three provincial agriculture offices and 16 municipal agriculture offices
• 70% of target
beneficiaries perceive extension support services to have been improved by 2002
• The number of
farmers adopting recommended farming practices increased by 100% by 2002
• Project progress reports and review missions
• Consultants are fielded in a timely manner
• LGU staff are
not diverted to non-project activities
• Farmers are
willing to participate in field demonstrations
• Beneficiaries
are willing to adopt recommended farming practices
• Good
coordination between extension and
• Provincial agricultural offices were supported through a range of activities including equipment, materials, special training, short-courses
• The final BME survey recorded that 100% of the surveyed farmers were aware of the Project and that 97% had taken advantage of its support.
• 79% of farmers said that they had applied lessons learned from project training
22 Appendix 1
Design Summary
Performance Indicators/Targets
Monitoring Mechanisms
Assumptions And Risks
PCR Evaluation
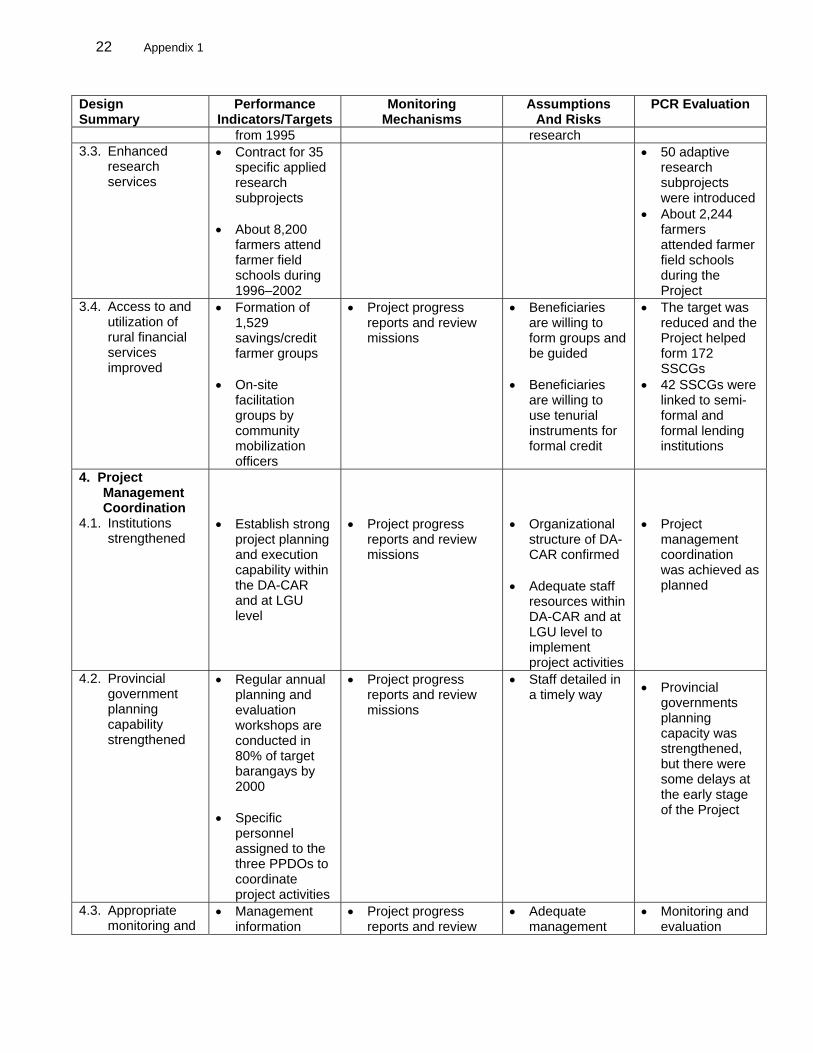
from 1995 research 3.3. Enhanced
research services
• Contract for 35 specific applied research subprojects
• About 8,200
farmers attend farmer field schools during 1996–2002
• 50 adaptive research subprojects were introduced
• About 2,244 farmers attended farmer field schools during the Project
3.4. Access to and utilization of rural financial services improved
• Formation of 1,529 savings/credit farmer groups
• On-site
facilitation groups by community mobilization officers
• Project progress reports and review missions
• Beneficiaries are willing to form groups and be guided
• Beneficiaries
are willing to use tenurial instruments for formal credit
• The target was reduced and the Project helped form 172 SSCGs
• 42 SSCGs were linked to semi-formal and formal lending institutions
4. Project Management Coordination
4.1. Institutions strengthened
• Establish strong
project planning and execution capability within the DA-CAR and at LGU level
• Project progress
reports and review missions
• Organizational
structure of DA-CAR confirmed
• Adequate staff
resources within DA-CAR and at LGU level to implement project activities
• Project
management coordination was achieved as planned
4.2. Provincial government planning capability strengthened
• Regular annual planning and evaluation workshops are conducted in 80% of target barangays by 2000
• Specific
personnel assigned to the three PPDOs to coordinate project activities
• Project progress reports and review missions
• Staff detailed in a timely way • Provincial
governments planning capacity was strengthened, but there were some delays at the early stage of the Project
4.3. Appropriate monitoring and
• Management information
• Project progress reports and review
• Adequate management
• Monitoring and evaluation

Appendix 1 23
Design Summary
Performance Indicators/Targets
Monitoring Mechanisms
Assumptions And Risks
PCR Evaluation
evaluation systems established
system provides timely feedback on the performance of project activities
• 6-monthly bank
review missions fielded and monitoring by an independent agency
• Benefit
monitoring evaluation surveys conducted in 1996, 1998, 2000, and 2002
missions information systems provided
• Benchmark
information collated and synthesized
• Feedback from
progress reports of mission reviews incorporated into project planning/ execution activities
system are in place, but needs to be strengthened
Activities 1. Community
Mobilization and Resource Management
Communities mobilized and involved in planning project activities
• $4.0 million • One NGO to
coordinate 41 community mobilization officers
• Community mobilization specialists (12 person-months)
• Review missions and
project progress reports
• Capable NGOs
are identified and are willing to participate
• Existing
provincial and municipal staff are detailed to community planning exercises
• Implemented as
appraised but slow
Enhanced Land Security:
- MOA with DENR and Department of Agrarian Reform
• $3.9 million • Review missions and project progress reports
• No delays in signing of MOA
• Implemented as appraised
Natural resource management:
- MOA with DENR
• $8.2 million • 35 person-
months of international and local consultants
• Review missions and project progress reports
• No delays in signing of MOA
• Good community
participation in reforestation activities
• Implemented as appraised but delayed
24 Appendix 1
Design Summary
Performance Indicators/Targets
Monitoring Mechanisms
Assumptions And Risks
PCR Evaluation
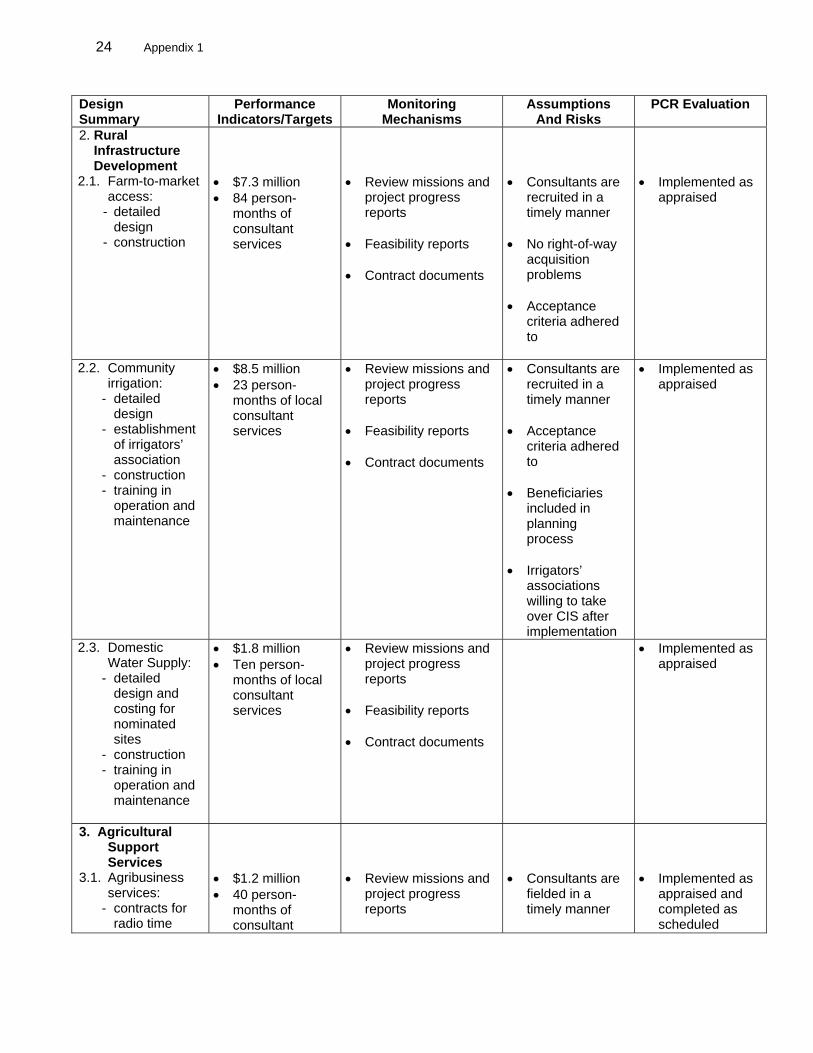
2. Rural Infrastructure Development 2.1. Farm-to-market
access: - detailed
design - construction
• $7.3 million • 84 person-
months of consultant services
• Review missions and
project progress reports
• Feasibility reports • Contract documents
• Consultants are
recruited in a timely manner
• No right-of-way
acquisition problems
• Acceptance
criteria adhered to
• Implemented as
appraised
2.2. Community irrigation:
- detailed design
- establishment of irrigators’ association
- construction - training in
operation and maintenance
• $8.5 million • 23 person-
months of local consultant services
• Review missions and project progress reports
• Feasibility reports • Contract documents
• Consultants are recruited in a timely manner
• Acceptance
criteria adhered to
• Beneficiaries
included in planning process
• Irrigators’
associations willing to take over CIS after implementation
• Implemented as appraised
2.3. Domestic Water Supply:
- detailed design and costing for nominated sites
- construction - training in
operation and maintenance
• $1.8 million • Ten person-
months of local consultant services
• Review missions and project progress reports
• Feasibility reports • Contract documents
• Implemented as appraised
3. Agricultural Support Services
3.1. Agribusiness services:
- contracts for radio time
• $1.2 million • 40 person-
months of consultant
• Review missions and
project progress reports
• Consultants are
fielded in a timely manner
• Implemented as
appraised and completed as scheduled
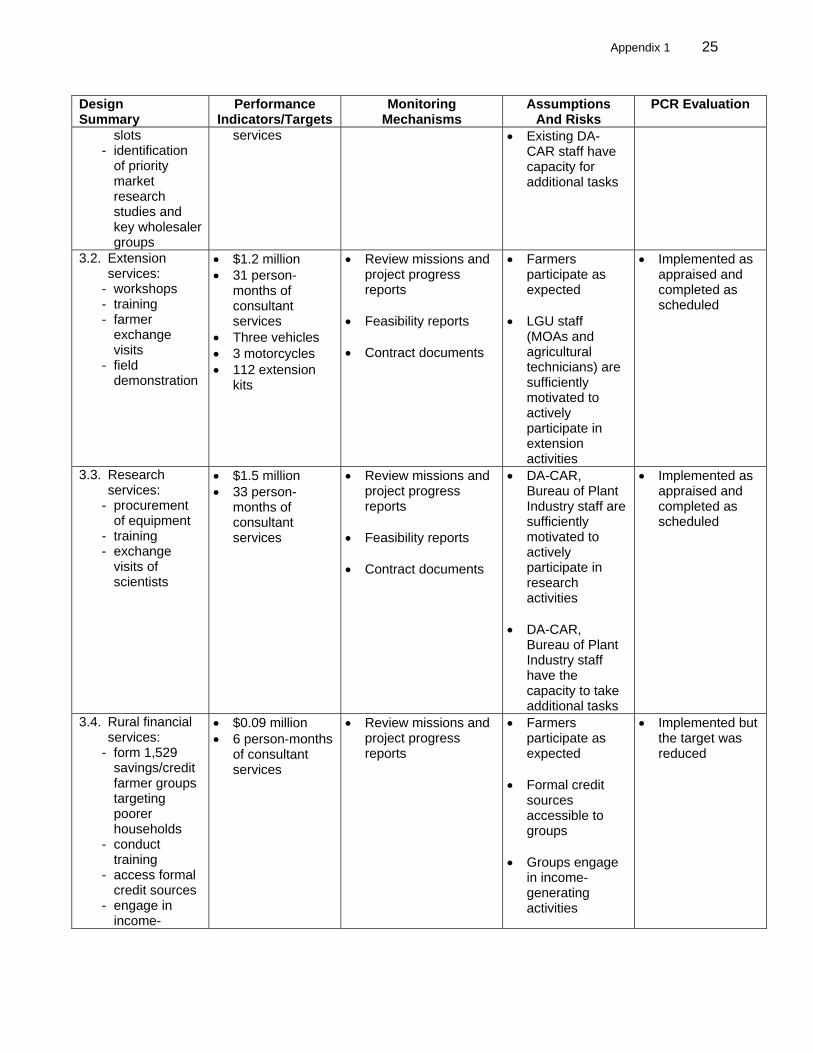
Appendix 1 25
Design Summary
Performance Indicators/Targets
Monitoring Mechanisms
Assumptions And Risks
PCR Evaluation
slots - identification
of priority market research studies and key wholesaler groups
services • Existing DA-CAR staff have capacity for additional tasks
3.2. Extension services:
- workshops - training - farmer
exchange visits
- field demonstration
• $1.2 million • 31 person-
months of consultant services
• Three vehicles • 3 motorcycles • 112 extension
kits
• Review missions and project progress reports
• Feasibility reports • Contract documents
• Farmers participate as expected
• LGU staff
(MOAs and agricultural technicians) are sufficiently motivated to actively participate in extension activities
• Implemented as appraised and completed as scheduled
3.3. Research services:
- procurement of equipment
- training - exchange
visits of scientists
• $1.5 million • 33 person-
months of consultant services
• Review missions and project progress reports
• Feasibility reports • Contract documents
• DA-CAR, Bureau of Plant Industry staff are sufficiently motivated to actively participate in research activities
• DA-CAR,
Bureau of Plant Industry staff have the capacity to take additional tasks
• Implemented as appraised and completed as scheduled
3.4. Rural financial services:
- form 1,529 savings/credit farmer groups targeting poorer households
- conduct training
- access formal credit sources
- engage in income-
• $0.09 million • 6 person-months
of consultant services
• Review missions and project progress reports
• Farmers participate as expected
• Formal credit
sources accessible to groups
• Groups engage
in income-generating activities
• Implemented but the target was reduced
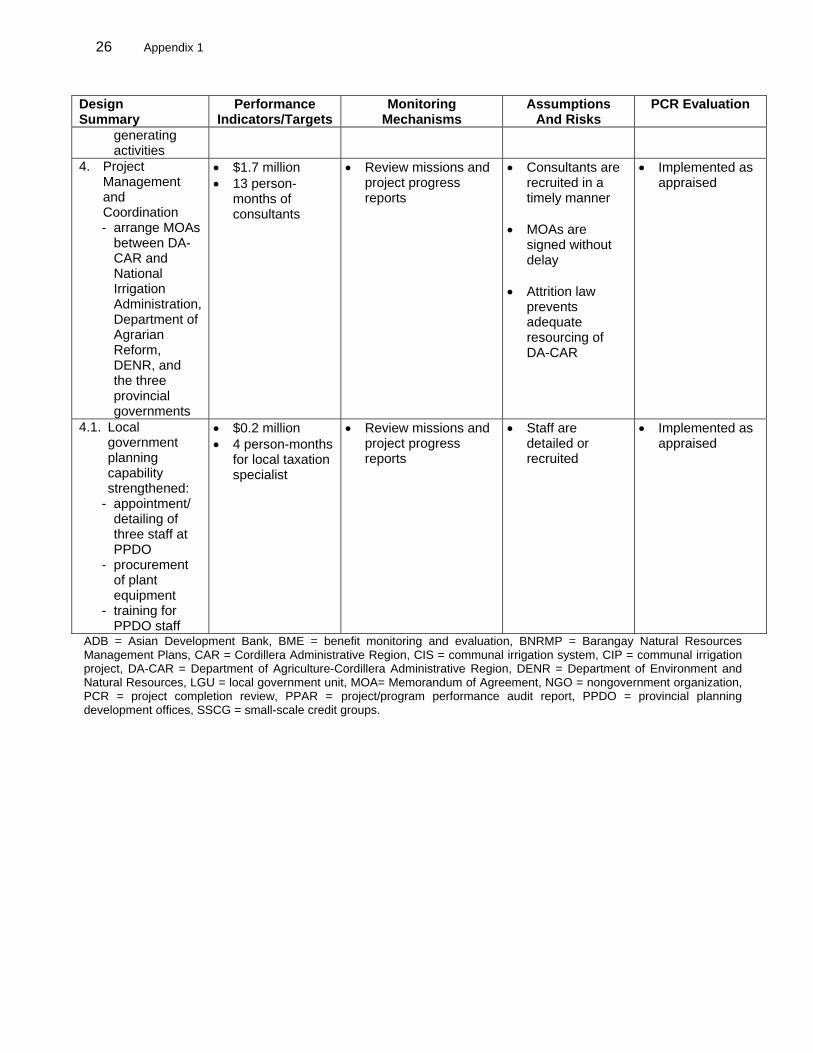
26 Appendix 1
Design Summary
Performance Indicators/Targets
Monitoring Mechanisms
Assumptions And Risks
PCR Evaluation
generating activities
4. Project Management and Coordination - arrange MOAs
between DA-CAR and National Irrigation Administration, Department of Agrarian Reform, DENR, and the three provincial governments
• $1.7 million • 13 person-
months of consultants
• Review missions and project progress reports
• Consultants are recruited in a timely manner
• MOAs are
signed without delay
• Attrition law
prevents adequate resourcing of DA-CAR
• Implemented as appraised
4.1. Local government planning capability strengthened:
- appointment/ detailing of three staff at PPDO
- procurement of plant equipment
- training for PPDO staff
• $0.2 million • 4 person-months
for local taxation specialist
• Review missions and project progress reports
• Staff are detailed or recruited
• Implemented as appraised
ADB = Asian Development Bank, BME = benefit monitoring and evaluation, BNRMP = Barangay Natural Resources Management Plans, CAR = Cordillera Administrative Region, CIS = communal irrigation system, CIP = communal irrigation project, DA-CAR = Department of Agriculture-Cordillera Administrative Region, DENR = Department of Environment and Natural Resources, LGU = local government unit, MOA= Memorandum of Agreement, NGO = nongovernment organization, PCR = project completion review, PPAR = project/program performance audit report, PPDO = provincial planning development offices, SSCG = small-scale credit groups.
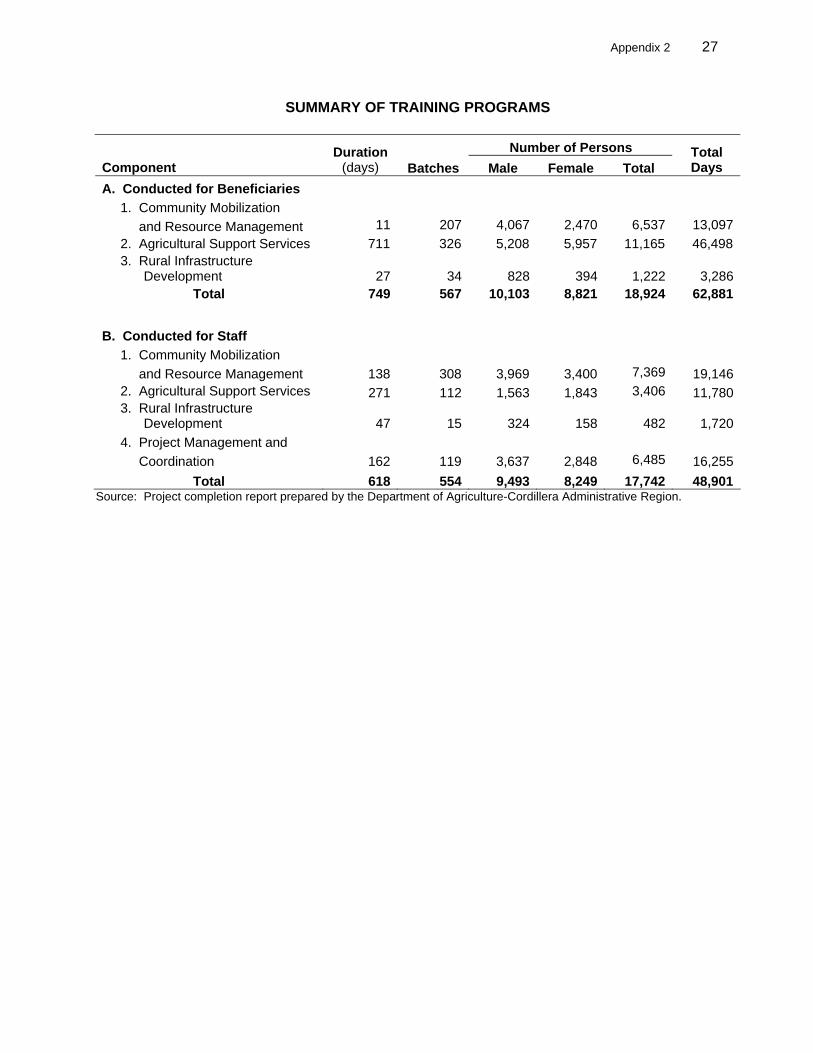
Appendix 2 27
SUMMARY OF TRAINING PROGRAMS
Number of Persons Component
Duration (days) Batches Male Female Total
Total Days
A. Conducted for Beneficiaries 1. Community Mobilization and Resource Management 11 207 4,067 2,470 6,537 13,097 2. Agricultural Support Services 711 326 5,208 5,957 11,165 46,498 3. Rural Infrastructure
Development
27
34
828
394
1,222
3,286 Total 749 567 10,103 8,821 18,924 62,881
B. Conducted for Staff 1. Community Mobilization and Resource Management 138 308 3,969 3,400 7,369 19,146 2. Agricultural Support Services 271 112 1,563 1,843 3,406 11,780 3. Rural Infrastructure
Development 47 15 324 158
482 1,720 4. Project Management and Coordination 162 119 3,637 2,848 6,485 16,255
Total 618 554 9,493 8,249 17,742 48,901 Source: Project completion report prepared by the Department of Agriculture-Cordillera Administrative Region.
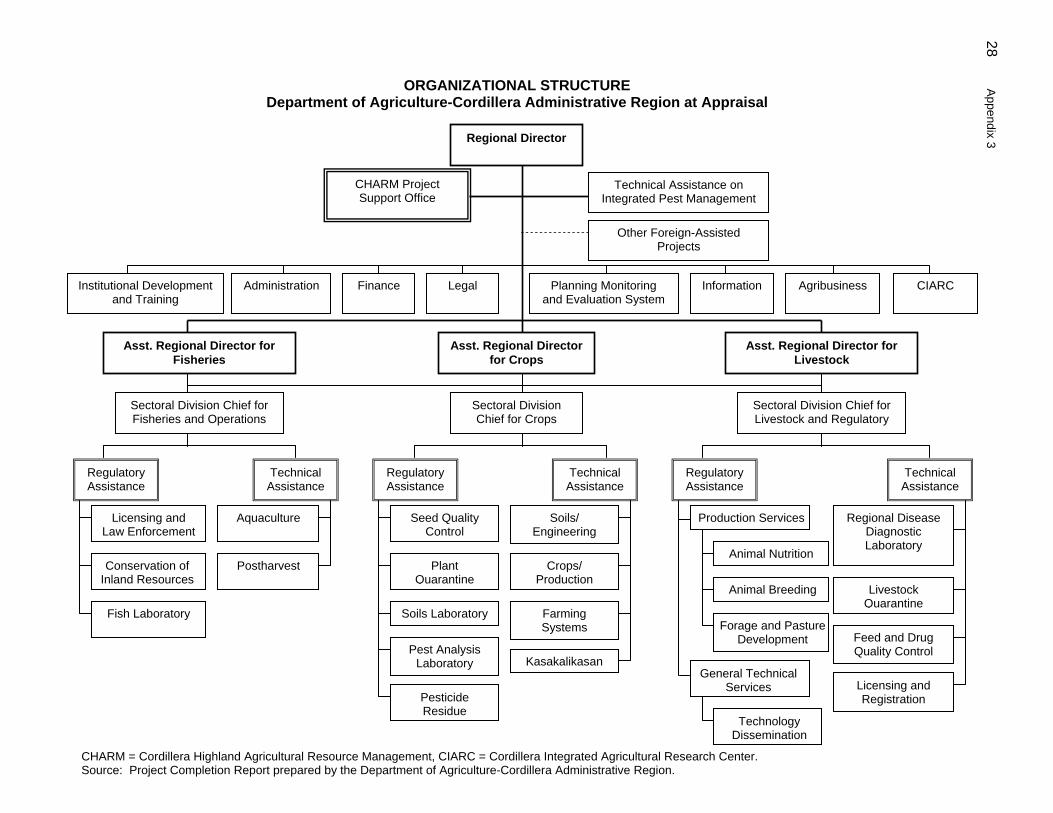
28 Appendix 3
ORGANIZATIONAL STRUCTURE Department of Agriculture-Cordillera Administrative Region at Appraisal
Regional Director
CHARM Project Support Office
Planning Monitoring and Evaluation System
Information Agribusiness CIARC Legal Finance Administration Institutional Development and Training
Asst. Regional Director for Crops
Asst. Regional Director for Livestock
Asst. Regional Director for Fisheries
Sectoral Division Chief for Fisheries and Operations
Sectoral Division Chief for Crops
Sectoral Division Chief for Livestock and Regulatory
Licensing and Law Enforcement
Conservation of Inland Resources
Fish Laboratory
Aquaculture
Postharvest
Seed Quality Control
Plant Quarantine
Soils Laboratory
Pest Analysis Laboratory
Pesticide Residue
Soils/ Engineering
Crops/ Production
Farming Systems
Kasakalikasan
Regional Disease Diagnostic Laboratory
Livestock Quarantine
Feed and Drug Quality Control
Licensing and Registration
Production Services
Animal Nutrition
Animal Breeding
Forage and PastureDevelopment
General Technical Services
Technology Dissemination
Technical Assistance on Integrated Pest Management
Other Foreign-Assisted Projects
Regulatory Assistance
Regulatory Assistance
Regulatory Assistance
Technical Assistance
Technical Assistance
Technical Assistance
CHARM = Cordillera Highland Agricultural Resource Management, CIARC = Cordillera Integrated Agricultural Research Center. Source: Project Completion Report prepared by the Department of Agriculture-Cordillera Administrative Region.
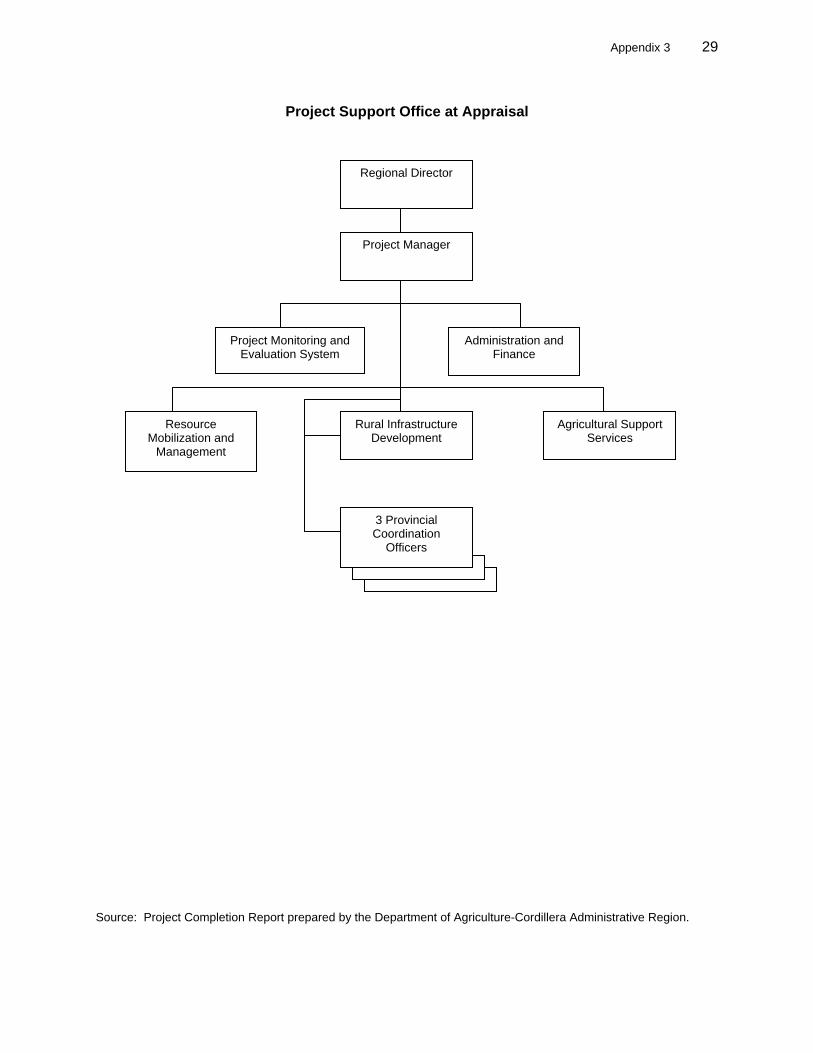
Appendix 3 29
Project Support Office at Appraisal
Source: Project Completion Report prepared by the Department of Agriculture-Cordillera Administrative Region.
Regional Director
Project Manager
Project Monitoring and Evaluation System
Administration and Finance
Agricultural Support Services
Rural Infrastructure Development
Resource Mobilization and
Management
3 Provincial Coordination
Officers
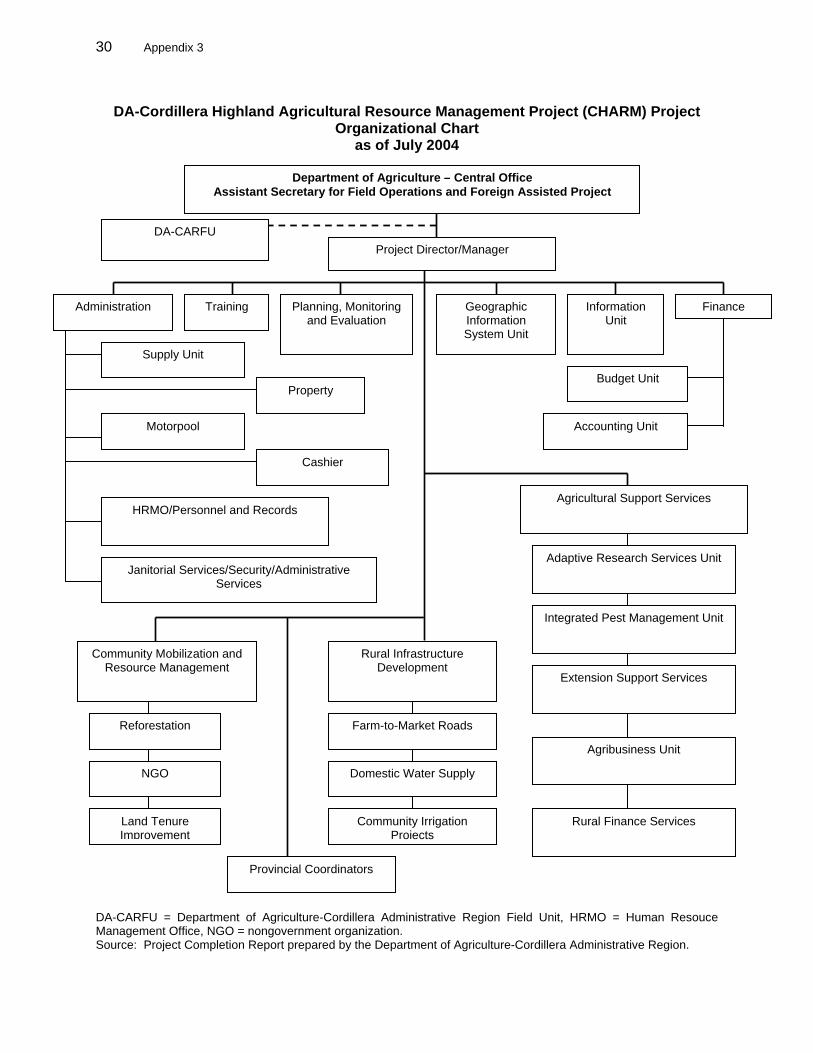
30 Appendix 3
DA-Cordillera Highland Agricultural Resource Management Project (CHARM) Project
Organizational Chart as of July 2004
DA-CARFU = Department of Agriculture-Cordillera Administrative Region Field Unit, HRMO = Human Resouce Management Office, NGO = nongovernment organization. Source: Project Completion Report prepared by the Department of Agriculture-Cordillera Administrative Region.
Department of Agriculture – Central OfficeAssistant Secretary for Field Operations and Foreign Assisted Project
Project Director/Manager DA-CARFU
Administration Training Planning, Monitoring and Evaluation
Geographic Information System Unit
Information Unit
Finance
Supply Unit
Motorpool
Property
HRMO/Personnel and Records
Cashier
Janitorial Services/Security/Administrative Services
Rural Infrastructure Development
Farm-to-Market Roads
Domestic Water Supply
Community Irrigation Projects
Community Mobilization and Resource Management
Reforestation
NGO
Land Tenure Improvement
Provincial Coordinators
Budget Unit
Accounting Unit
Agricultural Support Services
Adaptive Research Services Unit
Integrated Pest Management Unit
Extension Support Services
Agribusiness Unit
Rural Finance Services

Appendix 4 31
ACTUAL ANNUAL PROJECT COST Table A4.1: Actual Costs per Category per Year for L1421
Category Actual Cost Number Category Year ($)
01 Civil Works 1997 0.00 2000 299,124.37 2001 1,122,037.95 2002 1,274,834.60 2003 2,426,826.21 2004 373,600.36 2005 1,026,141.69 Subtotal Category 01 6,522,565.18
02 Training 2000 218,690.43 2001 12,349.66 Subtotal Category 02 231,040.09
03 Interest during Construction 1997 16,743.75 1998 89,002.77 1999 128,723.48 2000 139,722.46 2001 178,811.92 2002 257,707.09 2003 360,220.15 2004 375,463.10 Subtotal Category 03 1,546,394.72 Total 8,299,999.99
Source: Project completion review mission.

32 Appendix 4
Table A4.2: Actual Costs per Category per Year for L1422
Category Actual Cost Number Category Year ($)
01 Equipment and Vehicles 1997 0.00 1998 95,821.89 1999 38,901.97 2000 504,348.35 2001 298,075.44 2002 426,308.67 2003 114,832.64 2004 27,747.13 Subtotal Category 01 1,506,036.09
02 Training 1997 0.00 1998 7,239.93 1999 72,212.13 2000 110,873.28 2001 141,935.15 2002 61,401.20 2003 140,770.65 2004 118,217.66 Subtotal Category 02 652,650.00
03 Consulting Services 1997 0.00 1998 541,509.74 1999 354,547.23 2000 349,372.75 2001 323,508.03 2002 159,329.26 2003 254,334.88 2004 63,689.29 Subtotal Category 03 2,046,291.18
04 Surveys and Special Studies 1997 0.00 1999 238,569.19 2000 252,317.91 2001 271,700.72 2002 127,066.89 2003 508,167.78 2004 485,333.79 Subtotal Category 04 1,883,156.28
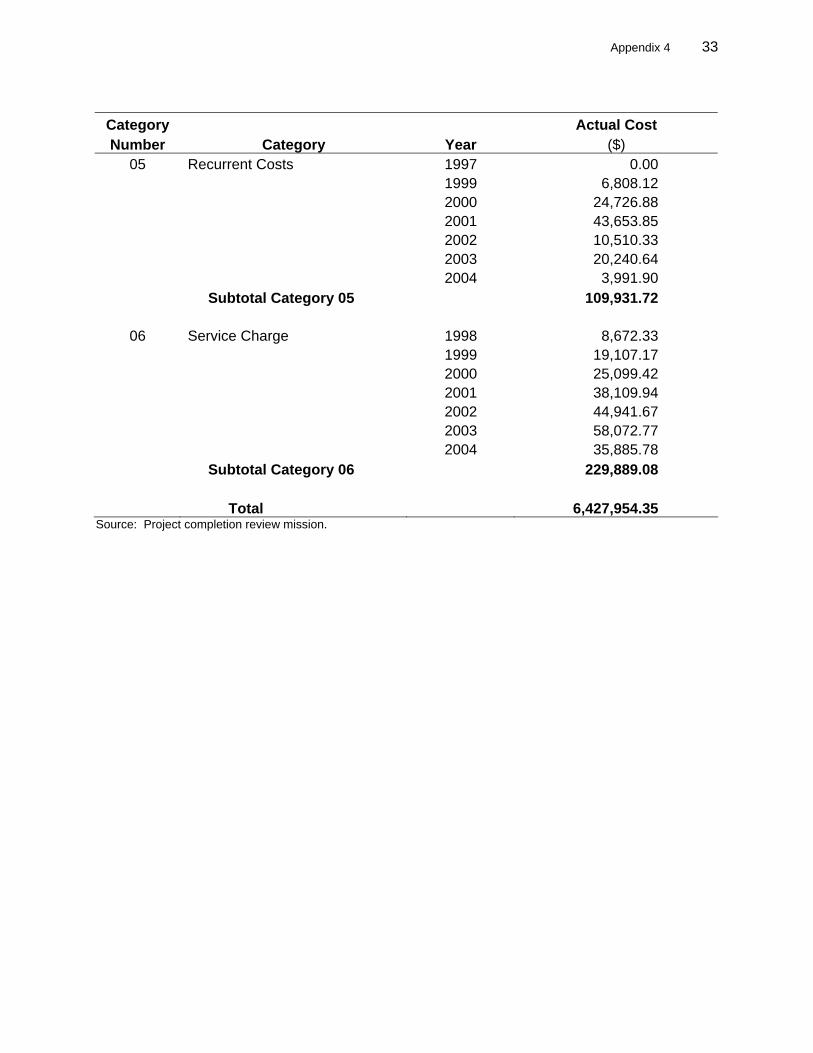
Appendix 4 33
Category Actual Cost Number Category Year ($)
05 Recurrent Costs 1997 0.00 1999 6,808.12 2000 24,726.88 2001 43,653.85 2002 10,510.33 2003 20,240.64 2004 3,991.90 Subtotal Category 05 109,931.72
06 Service Charge 1998 8,672.33 1999 19,107.17 2000 25,099.42 2001 38,109.94 2002 44,941.67 2003 58,072.77 2004 35,885.78 Subtotal Category 06 229,889.08 Total 6,427,954.35
Source: Project completion review mission.
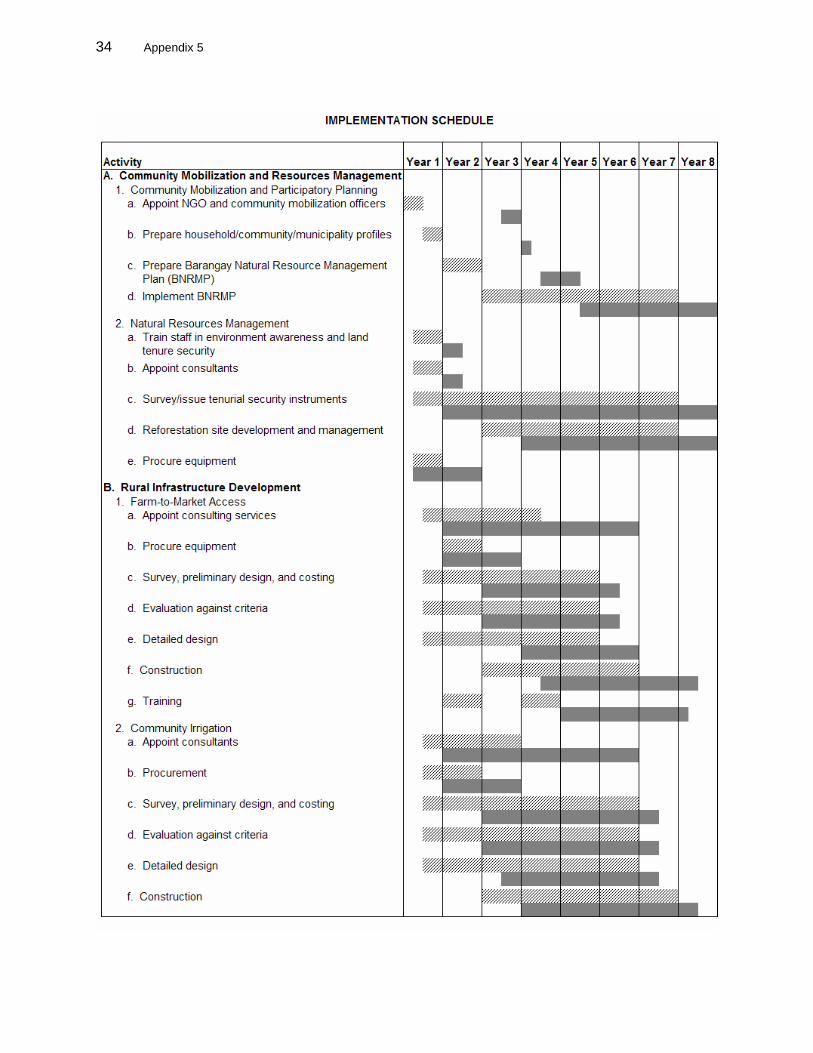
34 Appendix 5
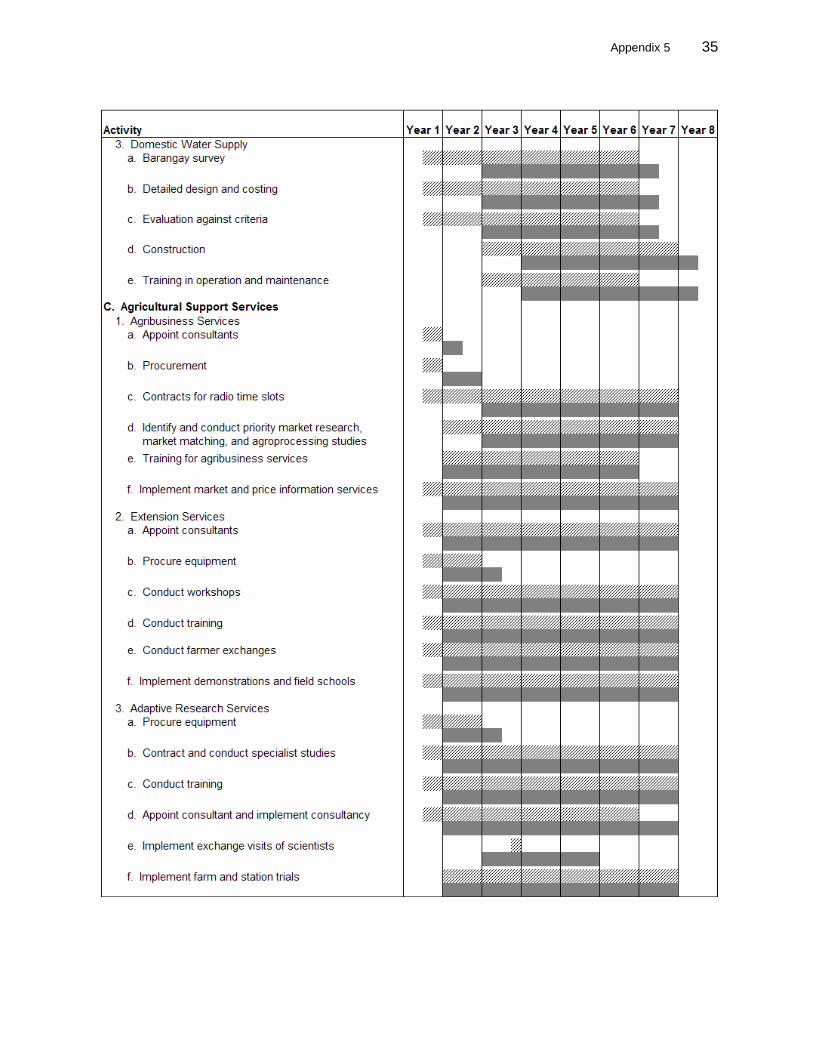
Appendix 5 35
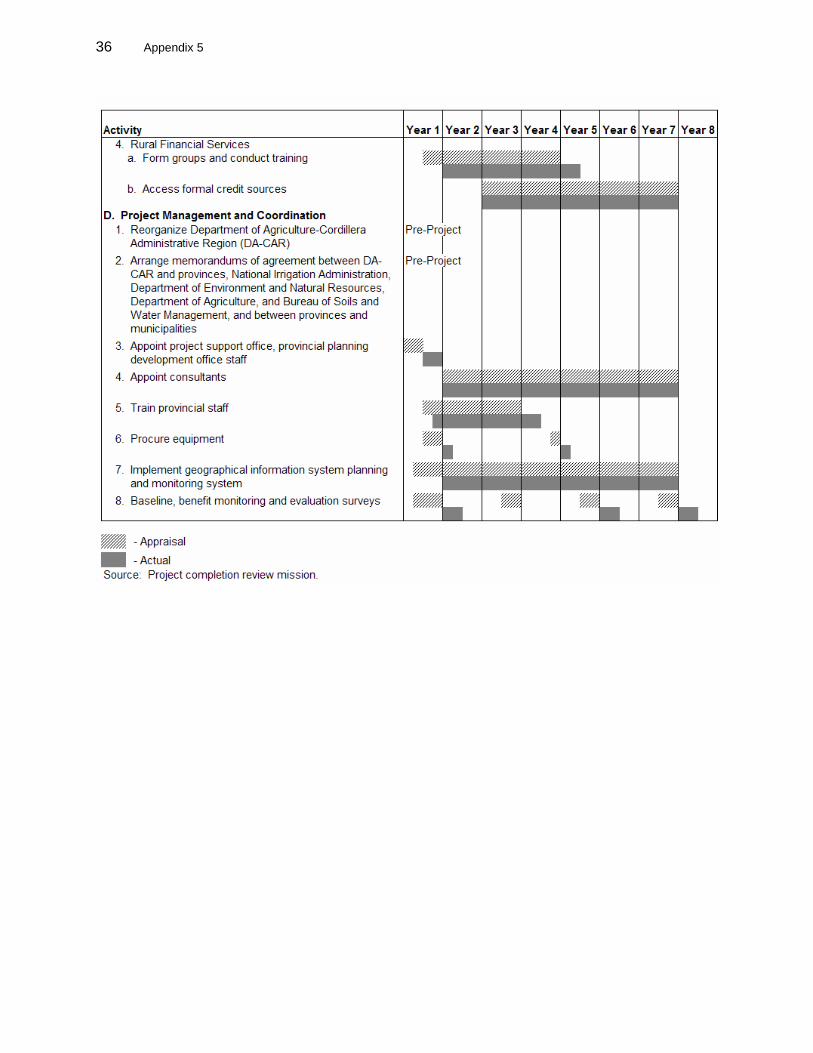
36 Appendix 5
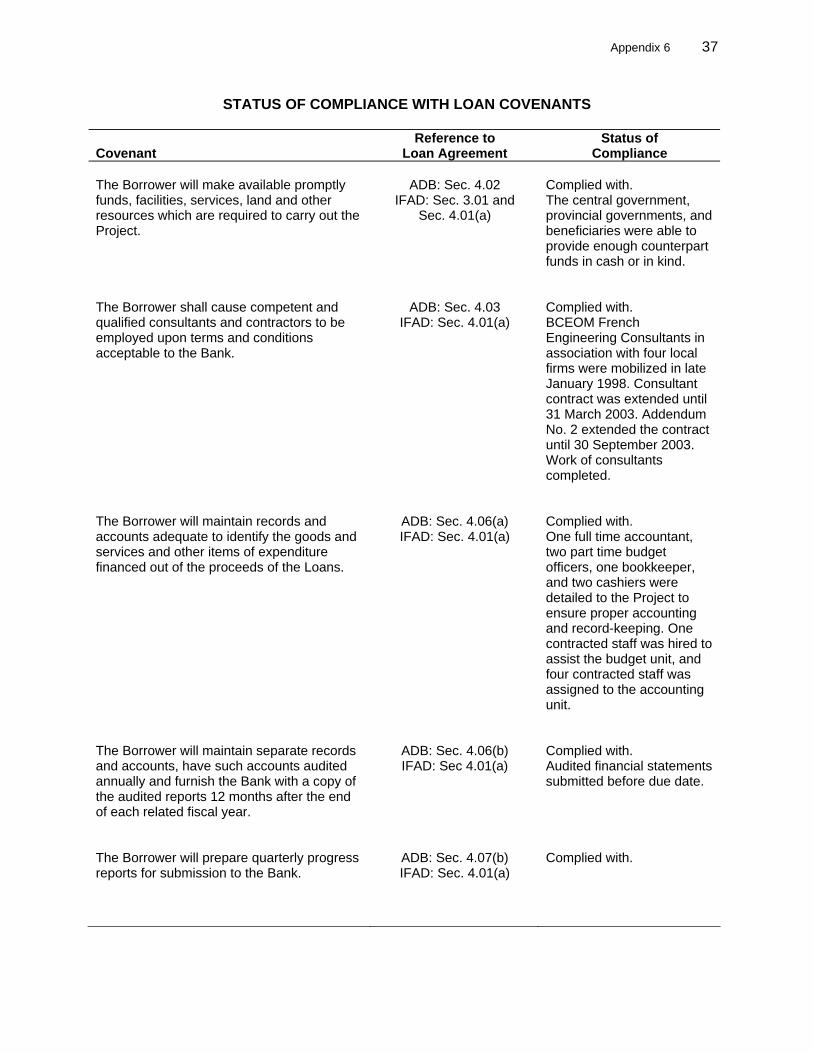
Appendix 6 37
STATUS OF COMPLIANCE WITH LOAN COVENANTS
Covenant
Reference to Loan Agreement
Status of Compliance
The Borrower will make available promptly funds, facilities, services, land and other resources which are required to carry out the Project.
ADB: Sec. 4.02
IFAD: Sec. 3.01 and Sec. 4.01(a)
Complied with. The central government, provincial governments, and beneficiaries were able to provide enough counterpart funds in cash or in kind.
The Borrower shall cause competent and qualified consultants and contractors to be employed upon terms and conditions acceptable to the Bank.
ADB: Sec. 4.03
IFAD: Sec. 4.01(a)
Complied with. BCEOM French Engineering Consultants in association with four local firms were mobilized in late January 1998. Consultant contract was extended until 31 March 2003. Addendum No. 2 extended the contract until 30 September 2003. Work of consultants completed.
The Borrower will maintain records and accounts adequate to identify the goods and services and other items of expenditure financed out of the proceeds of the Loans.
ADB: Sec. 4.06(a) IFAD: Sec. 4.01(a)
Complied with. One full time accountant, two part time budget officers, one bookkeeper, and two cashiers were detailed to the Project to ensure proper accounting and record-keeping. One contracted staff was hired to assist the budget unit, and four contracted staff was assigned to the accounting unit.
The Borrower will maintain separate records and accounts, have such accounts audited annually and furnish the Bank with a copy of the audited reports 12 months after the end of each related fiscal year.
ADB: Sec. 4.06(b) IFAD: Sec 4.01(a)
Complied with. Audited financial statements submitted before due date.
The Borrower will prepare quarterly progress reports for submission to the Bank.
ADB: Sec. 4.07(b) IFAD: Sec. 4.01(a)
Complied with.

38 Appendix 6
Covenant
Reference to Loan Agreement
Status of Compliance
The Borrower will prepare a Project Completion Report for submission to the Bank three months after the physical completion of the Project.
ADB: Sec. 4.07(c) IFAD: Sec. 4.01(a)
Complied with. Government’s project completion report was received in October 2005.
The Borrower shall establish immediately an Imprest Account at Bangko Sentral ng Pilipinas to expedite disbursements of the Loan proceeds.
ADB: Sched. 3, para 8 IFAD: Sec. 3.02 and
Sched. 4, para 1
Complied with.
The Borrower shall designate the Regional Director of the Department of Agriculture-Cordillera Administrative Region (DA-CAR) as Project Director, and establish an adequately staffed Project Support Office as a Section within DA-CAR reporting directly to the Project Director.
ADB: Sched. 6, para 2
Complied with in 1997. However, a minor change took place thereafter when the former project manager was promoted to project director in March 2001 to improve implementation and provide more hands-on guidance to the Project. The project support office was adequately staffed by qualified people.
The Borrower shall establish a Regional Interagency Steering Committee (RISC) which shall meet at least four times annually.
ADB: Sched. 6, para 3
Complied with. The regional coordinating committee was created in the first quarter of 1999 and meets monthly to settle implementation issues.
Each of the Provinces shall establish a Provincial Steering Committee (PSC) which shall meet at least four times annually following the RISC meeting.
ADB: Sched. 6, para 4
Complied with.
Each of the Participating Municipalities shall establish a Municipal Steering Committee which shall meet at least four times annually following the relevant PSC meeting.
ADB: Sched. 6, para 5
Complied with.
Each of the Provinces, Participating Municipalities, and Project Barangays shall establish a Project Management group composed of a local government unit action officer, a representative of the nongovernment organization engaged under the Project, and a community representative.
ADB: Sched. 6, para 6
Complied with.

Appendix 6 39
Covenant
Reference to Loan Agreement
Status of Compliance
The Provinces, Participating Municipalities and Project Barangays shall be responsible for the operation and maintenance (O&M) of the roads rehabilitated under the Project.
ADB: Sched. 6, Para 13
Complied with. Provinces have provided maintenance funds and equipments for completed road projects.
The Irrigators Associations (IAs) shall be responsible for the O&M of Irrigation systems after completion of the civil works.
ADB: Sched. 6,
Para 14
Complied with. IAs being trained for O&M of irrigation systems. 52 IAs were trained.
The O&M of trees shall be the full responsibility of the concerned community from a date three years after planting.
ADB: Sched. 6,
Para 15
Being complied with. Communities are maintaining the trees using the fund released as retention money, but funds are becoming depleted and no funds will be available in future.
Drinking water supply schemes shall be fully operated and maintained by Barangay Waterworks and Sanitation Associations (BWSAs) or Rural Waterworks and Sanitation Associations.
ADB: Sched. 6,
Para 16
Being complied with. Training on O&M was conducted for all beneficiary associations. Operation and maintenance of completed projects being carried out by by concerned BWSAs.
The Provinces shall ensure that adequate and timely funds are available for the proper maintenance of roads and facilities constructed under the Project and equipment provided or turned over to them.
ADB: Sched. 6,
Para 17
Complied with. Provinces have provided maintenance funds and equipment for completed road projects.
DA-CAR shall continuously monitor the physical progress of the Project implementation and the economic, financial, social and environmental impacts of Project activities, particularly on indigenous cultural communities.
ADB: Sched. 6
Para 18
Complied with. benefit monitoring and evaluation (BME) study was carried out by DA-CAR.
A Mid-Term Review shall be conducted and this will include BME survey.
ADB: Sched. 6
Para 19
Complied with. The BME study was implemented by the Benguet State University. A midterm review was conducted by an ADB mission from 10–21 July 2000.

40 Appendix 6
Covenant
Reference to Loan Agreement
Status of Compliance
DA-CAR shall ensure that necessary environmental mitigation measures will be carried out, including the maintenance of appropriate agricultural pesticide control practice.
ADB:Sched. 6, para 20 IFAD: Sec. 4.01(b)
Complied with. The implementing methods and approaches of the various project components and activities take into consideration environmental impacts and concerns and guard against adverse effects.
The Borrower shall expedite issuance of certificate of land ownership award by DAR and certificates of ancestral domain claim by the Department of Environment and Natural Resources (DENR) to qualified beneficiaries in the project area.
ADB: Sched. 6,
Para 21
Complied with. The issuance of certificates by DAR and DENR has been stopped because of the passage of the Indigenous People’s Rights Act which effectively transferred the jurisdiction of ancestral lands from DENR and DAR to the National Commission on Indigenous People (NCIP). NCIP now issues titles for ancestral domain lands. As part of this project, NCIP issued the first title for an ancestral domain in the Philippines (for the Bago-Kankanaey tribe of Bakun on 20 July 2002).
DA-CAR shall ensure that staff training provided under the Project is undertaken.
ADB: Sched. 6,
Para 23
Complied with. A total of 553 batches of staff development training were undertaken in the areas of project management, project implementation, report writing, documentation and enhancement of technical skills and knowledge, trainers’ training, etc.
The Borrower shall ensure that each of the Participating Municipalities will submit a report to the Bank on ways to mobilize additional revenue through new taxes permitted under the Local Government Code or through more efficient tax administration and collection.
ADB: Sched 6,
Para 24
Complied with. Municipal revenue plans for the three provinces have been submitted. Training and workshops for financial officers of the participating municipalities were conducted in 2002.
Source: Project completion review Mission.
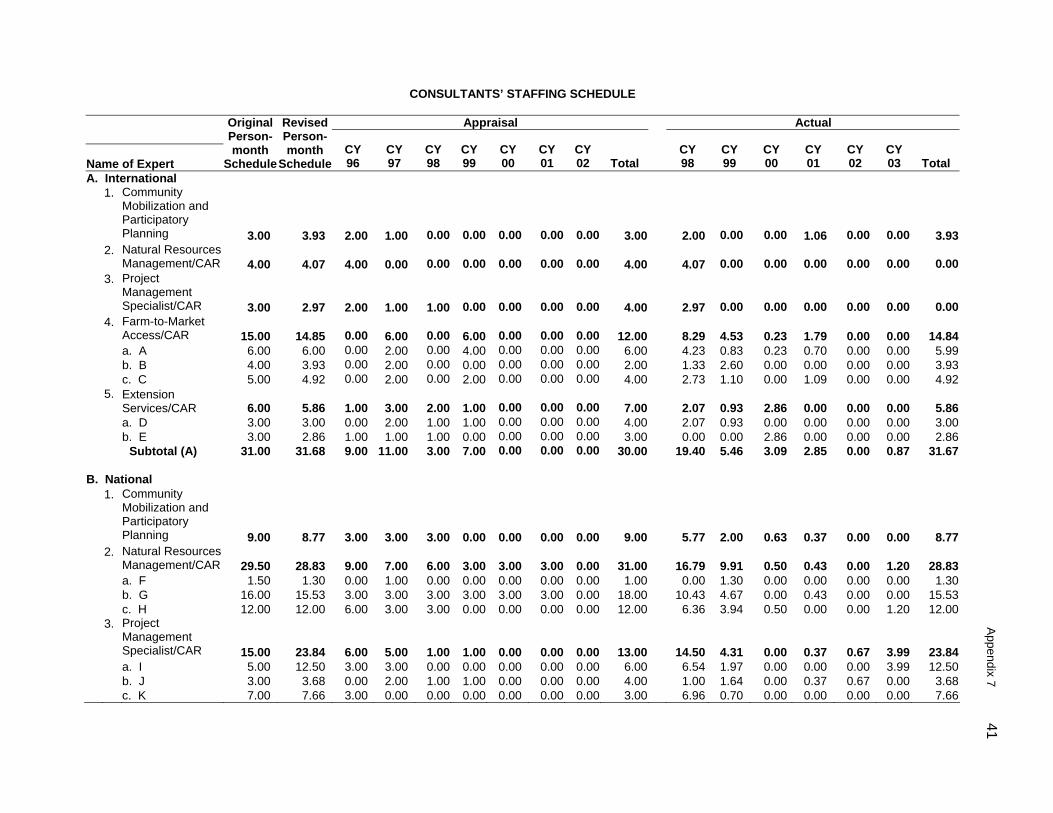
Appendix 7 41
CONSULTANTS’ STAFFING SCHEDULE Appraisal Actual
Name of Expert
Original Person-month
Schedule
Revised Person-month
ScheduleCY 96
CY 97
CY 98
CY 99
CY 00
CY 01
CY 02 Total
CY 98
CY 99
CY 00
CY 01
CY 02
CY 03 Total
A. International 1.
Community Mobilization and Participatory Planning 3.00 3.93 2.00 1.00 0.00 0.00 0.00 0.00 0.00 3.00 2.00 0.00 0.00 1.06 0.00 0.00 3.93
2.
Natural Resources Management/CAR 4.00 4.07 4.00 0.00 0.00 0.00 0.00 0.00 0.00 4.00 4.07 0.00 0.00 0.00 0.00 0.00 0.00
3.
Project Management Specialist/CAR 3.00 2.97 2.00 1.00 1.00 0.00 0.00 0.00 0.00 4.00 2.97 0.00 0.00 0.00 0.00 0.00 0.00
4.
Farm-to-Market Access/CAR 15.00 14.85 0.00 6.00 0.00 6.00 0.00 0.00 0.00 12.00 8.29 4.53 0.23 1.79 0.00 0.00 14.84
a. A 6.00 6.00 0.00 2.00 0.00 4.00 0.00 0.00 0.00 6.00 4.23 0.83 0.23 0.70 0.00 0.00 5.99 b. B 4.00 3.93 0.00 2.00 0.00 0.00 0.00 0.00 0.00 2.00 1.33 2.60 0.00 0.00 0.00 0.00 3.93 c. C 5.00 4.92 0.00 2.00 0.00 2.00 0.00 0.00 0.00 4.00 2.73 1.10 0.00 1.09 0.00 0.00 4.92 5.
Extension Services/CAR 6.00 5.86 1.00 3.00 2.00 1.00 0.00 0.00 0.00 7.00 2.07 0.93 2.86 0.00 0.00 0.00 5.86
a. D 3.00 3.00 0.00 2.00 1.00 1.00 0.00 0.00 0.00 4.00 2.07 0.93 0.00 0.00 0.00 0.00 3.00 b. E 3.00 2.86 1.00 1.00 1.00 0.00 0.00 0.00 0.00 3.00 0.00 0.00 2.86 0.00 0.00 0.00 2.86 Subtotal (A) 31.00 31.68 9.00 11.00 3.00 7.00 0.00 0.00 0.00 30.00 19.40 5.46 3.09 2.85 0.00 0.87 31.67
B. National 1.
Community Mobilization and Participatory Planning 9.00 8.77 3.00 3.00 3.00 0.00 0.00 0.00 0.00 9.00 5.77 2.00 0.63 0.37 0.00 0.00 8.77
2.
Natural Resources Management/CAR 29.50 28.83 9.00 7.00 6.00 3.00 3.00 3.00 0.00 31.00 16.79 9.91 0.50 0.43 0.00 1.20 28.83
a. F 1.50 1.30 0.00 1.00 0.00 0.00 0.00 0.00 0.00 1.00 0.00 1.30 0.00 0.00 0.00 0.00 1.30 b. G 16.00 15.53 3.00 3.00 3.00 3.00 3.00 3.00 0.00 18.00 10.43 4.67 0.00 0.43 0.00 0.00 15.53 c. H 12.00 12.00 6.00 3.00 3.00 0.00 0.00 0.00 0.00 12.00 6.36 3.94 0.50 0.00 0.00 1.20 12.00 3.
Project Management Specialist/CAR 15.00 23.84 6.00 5.00 1.00 1.00 0.00 0.00 0.00 13.00 14.50 4.31 0.00 0.37 0.67 3.99 23.84
a. I 5.00 12.50 3.00 3.00 0.00 0.00 0.00 0.00 0.00 6.00 6.54 1.97 0.00 0.00 0.00 3.99 12.50 b. J 3.00 3.68 0.00 2.00 1.00 1.00 0.00 0.00 0.00 4.00 1.00 1.64 0.00 0.37 0.67 0.00 3.68 c. K 7.00 7.66 3.00 0.00 0.00 0.00 0.00 0.00 0.00 3.00 6.96 0.70 0.00 0.00 0.00 0.00 7.66
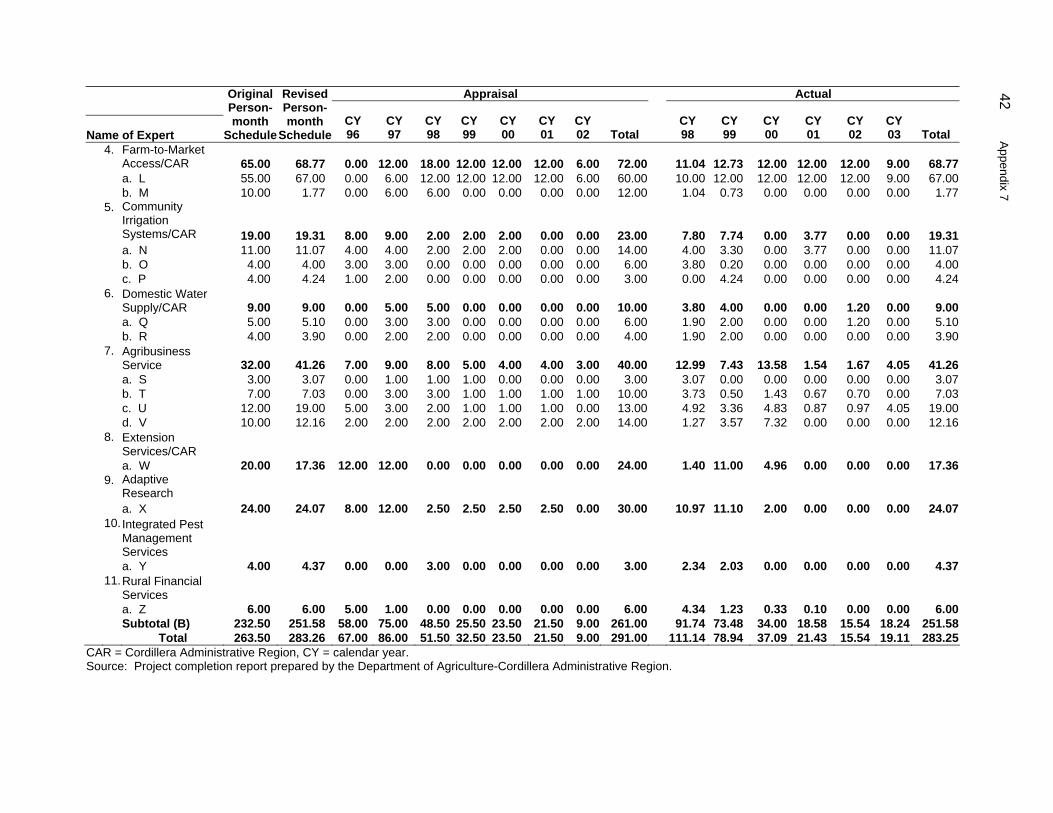
42 Appendix 7
Appraisal Actual
Name of Expert
Original Person-month
Schedule
Revised Person-month
ScheduleCY 96
CY 97
CY 98
CY 99
CY 00
CY 01
CY 02 Total
CY 98
CY 99
CY 00
CY 01
CY 02
CY 03 Total
4.
Farm-to-Market Access/CAR 65.00 68.77 0.00 12.00 18.00 12.00 12.00 12.00 6.00 72.00 11.04 12.73 12.00 12.00 12.00 9.00 68.77
a. L 55.00 67.00 0.00 6.00 12.00 12.00 12.00 12.00 6.00 60.00 10.00 12.00 12.00 12.00 12.00 9.00 67.00 b. M 10.00 1.77 0.00 6.00 6.00 0.00 0.00 0.00 0.00 12.00 1.04 0.73 0.00 0.00 0.00 0.00 1.77 5.
Community Irrigation Systems/CAR 19.00 19.31 8.00 9.00 2.00 2.00 2.00 0.00 0.00 23.00 7.80 7.74 0.00 3.77 0.00 0.00 19.31
a. N 11.00 11.07 4.00 4.00 2.00 2.00 2.00 0.00 0.00 14.00 4.00 3.30 0.00 3.77 0.00 0.00 11.07 b. O 4.00 4.00 3.00 3.00 0.00 0.00 0.00 0.00 0.00 6.00 3.80 0.20 0.00 0.00 0.00 0.00 4.00 c. P 4.00 4.24 1.00 2.00 0.00 0.00 0.00 0.00 0.00 3.00 0.00 4.24 0.00 0.00 0.00 0.00 4.24 6.
Domestic Water Supply/CAR 9.00 9.00 0.00 5.00 5.00 0.00 0.00 0.00 0.00 10.00 3.80 4.00 0.00 0.00 1.20 0.00 9.00
a. Q 5.00 5.10 0.00 3.00 3.00 0.00 0.00 0.00 0.00 6.00 1.90 2.00 0.00 0.00 1.20 0.00 5.10 b. R 4.00 3.90 0.00 2.00 2.00 0.00 0.00 0.00 0.00 4.00 1.90 2.00 0.00 0.00 0.00 0.00 3.90 7.
Agribusiness Service 32.00 41.26 7.00 9.00 8.00 5.00 4.00 4.00 3.00 40.00 12.99 7.43 13.58 1.54 1.67 4.05 41.26
a. S 3.00 3.07 0.00 1.00 1.00 1.00 0.00 0.00 0.00 3.00 3.07 0.00 0.00 0.00 0.00 0.00 3.07 b. T 7.00 7.03 0.00 3.00 3.00 1.00 1.00 1.00 1.00 10.00 3.73 0.50 1.43 0.67 0.70 0.00 7.03 c. U 12.00 19.00 5.00 3.00 2.00 1.00 1.00 1.00 0.00 13.00 4.92 3.36 4.83 0.87 0.97 4.05 19.00 d. V 10.00 12.16 2.00 2.00 2.00 2.00 2.00 2.00 2.00 14.00 1.27 3.57 7.32 0.00 0.00 0.00 12.16 8.
Extension Services/CAR
a. W 20.00 17.36 12.00 12.00 0.00 0.00 0.00 0.00 0.00 24.00 1.40 11.00 4.96 0.00 0.00 0.00 17.36 9.
Adaptive Research
a. X 24.00 24.07 8.00 12.00 2.50 2.50 2.50 2.50 0.00 30.00 10.97 11.10 2.00 0.00 0.00 0.00 24.07 10.
Integrated Pest Management Services
a. Y 4.00 4.37 0.00 0.00 3.00 0.00 0.00 0.00 0.00 3.00 2.34 2.03 0.00 0.00 0.00 0.00 4.37 11.
Rural Financial Services
a. Z 6.00 6.00 5.00 1.00 0.00 0.00 0.00 0.00 0.00 6.00 4.34 1.23 0.33 0.10 0.00 0.00 6.00 Subtotal (B) 232.50 251.58 58.00 75.00 48.50 25.50 23.50 21.50 9.00 261.00 91.74 73.48 34.00 18.58 15.54 18.24 251.58 Total 263.50 283.26 67.00 86.00 51.50 32.50 23.50 21.50 9.00 291.00 111.14 78.94 37.09 21.43 15.54 19.11 283.25
CAR = Cordillera Administrative Region, CY = calendar year. Source: Project completion report prepared by the Department of Agriculture-Cordillera Administrative Region.

Appendix 8 43
LIST OF PROCURED EQUIPMENT
Year Acquired
Quantity Particulars Amount User Agency/Office Procurement Method
1997 4 units Desktop Computer 352,000.00 PSO LCB 3 units Printer, Laser 134,400.00 PSO LCB
4 units Fax Machine 114,296.00 PSO LCB
6 units Plain Paper Copier 489,736.00 PSO LCB
4 units Total Station 1,195,920.00 3-DAR, 1-DENR LCB
1 unit GPS 839,850.00 DENR LCB
Subtotal 3,126,202.00
1998 1 unit Television 39,989.00 PSO LCB
1 unit Video Camera Recorder 36,140.00 PSO LCB
1 unit VHS Player Recorder 12,480.00 PSO LCB
10 units Desktop Computer 552,848.00 7-PSO, 3-DAR LCB
3 units Notebook Computer 274,482.00 PSO LCB
8 units Printer 132,158.00 5-PSO, 3-DAR LCB
1 unit UPS 24,800.00 PSO LCB
2 units Camera 98,847.00 PSO LCB
1 unit Scanner 37,000.00 PSO LCB
Subtotal 1,208,744.00
1999 3 units Notebook Computer 240,678.00 PSO LCB
16 units Motorcycles 1,183,200.00 LCB
1 each for the 16 municipalities
(OMAG) covered by the Project
LCB
2 sets GPS 1,571,999.94 DENR LCB
2 units Total Station 500,000.00 DENR LCB
7 units Desktop Computer 284,494.00 4-PSO LCB
1-OPAG Abra LCB
1-OPAG Benguet LCB
1-OPAG Mt. Province LCB
3 units Printer 62,544.00 1-OPAG Abra LCB
1-OPAG Benguet LCB
1-OPAG Mt. Province LCB
1 unit UPS 20,078.00 PSO LCB
1 unit Plotter 426,400.00 PSO LCB
1 unit Map Digitizer 209,400.00 PSO LCB
2 units Handled GPS 340,000.00 PSO LCB
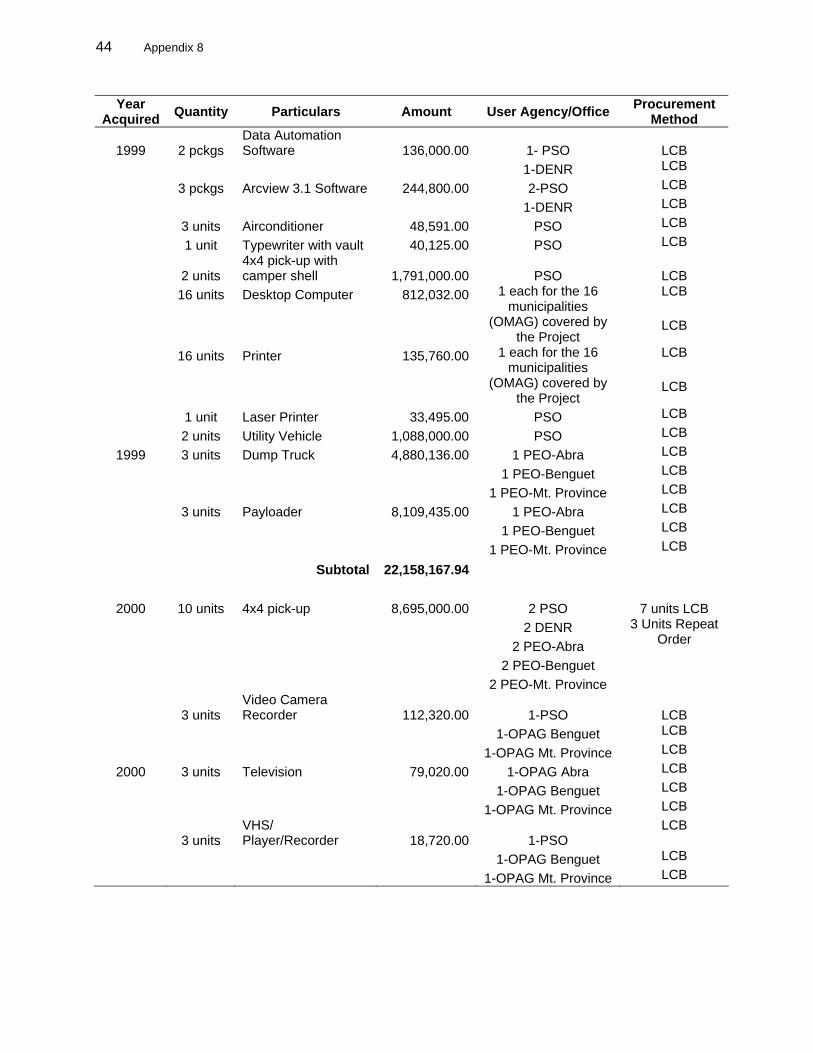
44 Appendix 8
Year Acquired Quantity Particulars Amount User Agency/Office Procurement
Method
1999 2 pckgs Data Automation Software 136,000.00 1- PSO LCB
1-DENR LCB
3 pckgs Arcview 3.1 Software 244,800.00 2-PSO LCB
1-DENR LCB
3 units Airconditioner 48,591.00 PSO LCB
1 unit Typewriter with vault 40,125.00 PSO LCB
2 units 4x4 pick-up with camper shell 1,791,000.00 PSO
LCB
16 units Desktop Computer 812,032.00 LCB
1 each for the 16 municipalities
(OMAG) covered by the Project
LCB
16 units Printer 135,760.00 LCB
1 each for the 16 municipalities
(OMAG) covered by the Project
LCB
1 unit Laser Printer 33,495.00 PSO LCB
2 units Utility Vehicle 1,088,000.00 PSO LCB
1999 3 units Dump Truck 4,880,136.00 1 PEO-Abra LCB
1 PEO-Benguet LCB
1 PEO-Mt. Province LCB
3 units Payloader 8,109,435.00 1 PEO-Abra LCB
1 PEO-Benguet LCB
1 PEO-Mt. Province LCB
Subtotal 22,158,167.94
2000 10 units 4x4 pick-up 8,695,000.00 2 PSO 7 units LCB 2 DENR 2 PEO-Abra
3 Units Repeat Order
2 PEO-Benguet 2 PEO-Mt. Province
3 units Video Camera Recorder 112,320.00 1-PSO LCB
1-OPAG Benguet LCB
1-OPAG Mt. Province LCB
2000 3 units Television 79,020.00 1-OPAG Abra LCB
1-OPAG Benguet LCB
1-OPAG Mt. Province LCB
3 units VHS/ Player/Recorder 18,720.00 1-PSO
LCB
1-OPAG Benguet LCB
1-OPAG Mt. Province LCB
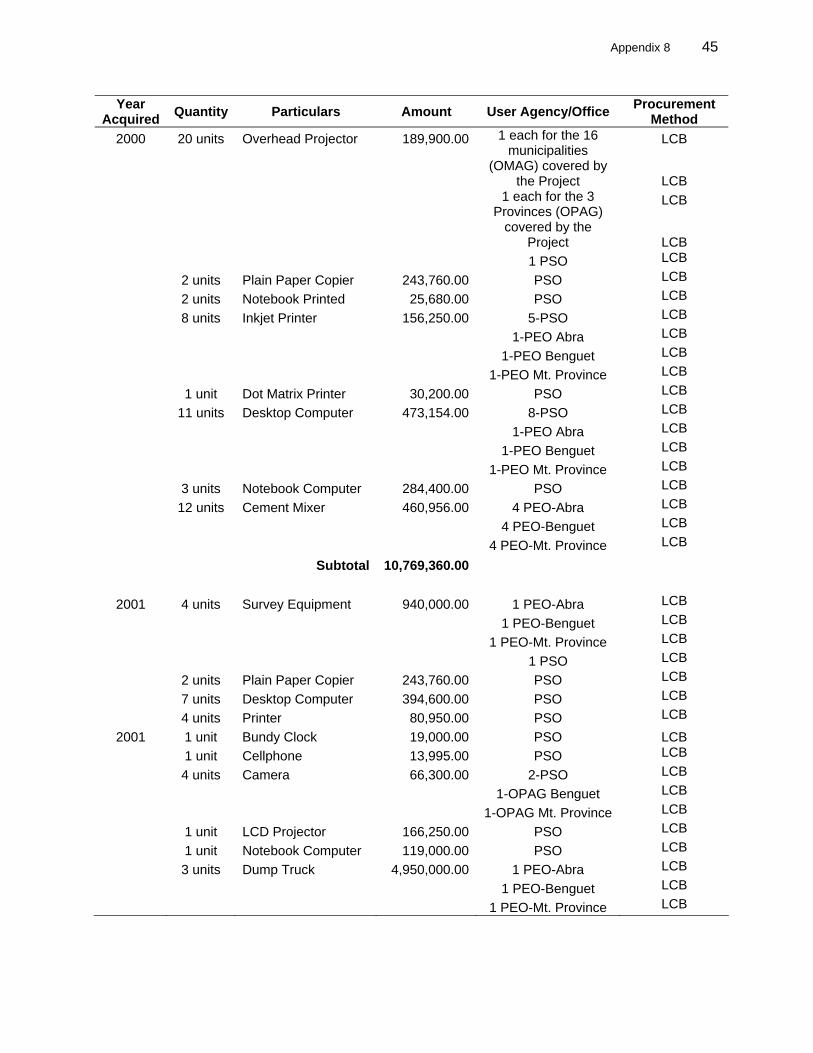
Appendix 8 45
Year Acquired Quantity Particulars Amount User Agency/Office Procurement
Method 2000 20 units Overhead Projector 189,900.00 LCB
1 each for the 16 municipalities
(OMAG) covered by the Project LCB
LCB
1 each for the 3 Provinces (OPAG)
covered by the Project LCB
1 PSO LCB
2 units Plain Paper Copier 243,760.00 PSO LCB
2 units Notebook Printed 25,680.00 PSO LCB
8 units Inkjet Printer 156,250.00 5-PSO LCB
1-PEO Abra LCB
1-PEO Benguet LCB
1-PEO Mt. Province LCB
1 unit Dot Matrix Printer 30,200.00 PSO LCB
11 units Desktop Computer 473,154.00 8-PSO LCB
1-PEO Abra LCB
1-PEO Benguet LCB
1-PEO Mt. Province LCB
3 units Notebook Computer 284,400.00 PSO LCB
12 units Cement Mixer 460,956.00 4 PEO-Abra LCB
4 PEO-Benguet LCB
4 PEO-Mt. Province LCB
Subtotal 10,769,360.00
2001 4 units Survey Equipment 940,000.00 1 PEO-Abra LCB
1 PEO-Benguet LCB
1 PEO-Mt. Province LCB
1 PSO LCB
2 units Plain Paper Copier 243,760.00 PSO LCB
7 units Desktop Computer 394,600.00 PSO LCB
4 units Printer 80,950.00 PSO LCB
2001 1 unit Bundy Clock 19,000.00 PSO LCB 1 unit Cellphone 13,995.00 PSO LCB
4 units Camera 66,300.00 2-PSO LCB
1-OPAG Benguet LCB
1-OPAG Mt. Province LCB
1 unit LCD Projector 166,250.00 PSO LCB
1 unit Notebook Computer 119,000.00 PSO LCB
3 units Dump Truck 4,950,000.00 1 PEO-Abra LCB
1 PEO-Benguet LCB
1 PEO-Mt. Province LCB
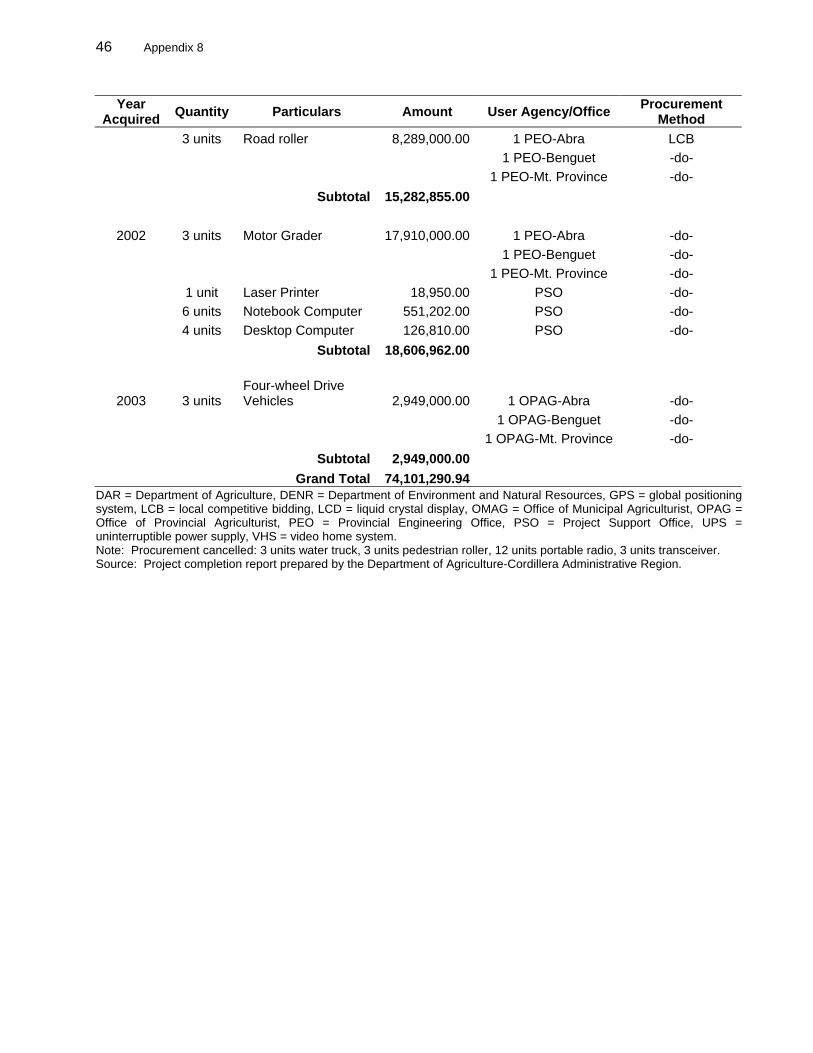
46 Appendix 8
Year Acquired Quantity Particulars Amount User Agency/Office Procurement
Method 3 units Road roller 8,289,000.00 1 PEO-Abra LCB 1 PEO-Benguet -do- 1 PEO-Mt. Province -do- Subtotal 15,282,855.00
2002 3 units Motor Grader 17,910,000.00 1 PEO-Abra -do- 1 PEO-Benguet -do- 1 PEO-Mt. Province -do- 1 unit Laser Printer 18,950.00 PSO -do- 6 units Notebook Computer 551,202.00 PSO -do- 4 units Desktop Computer 126,810.00 PSO -do- Subtotal 18,606,962.00
2003 3 units Four-wheel Drive Vehicles 2,949,000.00 1 OPAG-Abra -do-
1 OPAG-Benguet -do- 1 OPAG-Mt. Province -do- Subtotal 2,949,000.00
Grand Total 74,101,290.94 DAR = Department of Agriculture, DENR = Department of Environment and Natural Resources, GPS = global positioning system, LCB = local competitive bidding, LCD = liquid crystal display, OMAG = Office of Municipal Agriculturist, OPAG = Office of Provincial Agriculturist, PEO = Provincial Engineering Office, PSO = Project Support Office, UPS = uninterruptible power supply, VHS = video home system. Note: Procurement cancelled: 3 units water truck, 3 units pedestrian roller, 12 units portable radio, 3 units transceiver. Source: Project completion report prepared by the Department of Agriculture-Cordillera Administrative Region.
Appendix 9 47
ECONOMIC AND FINANCIAL ANALYSIS A. Economic Analysis 1. An economic reevaluation of the Project has been carried out for the project as a whole, excluding the reforestation and agroforestry component, which was funded separately by the International Fund for Agricultural Development (IFAD) loan. For the economic analysis the methodology used follows ADB’s Guidelines for the Economic Analysis of Projects. 1 The analysis is based on information obtained during field visits by the project completion review (PCR) mission, together with data from project reports, ADB supervision missions, and the project benefit monitoring and evaluation surveys.
1. Main Assumptions 2. The economic analysis is based on the following assumptions:
(i) Project costs have been adjusted to a constant 2005 base price by adjusting the actual costs each year by the Philippine consumer price index for the local cost element, and the manufacturers’ unit value index (MUV) for the international cost component (Table A9.1).
(ii) Economic prices for tradable commodities (rice, maize, and fertilizer) are based on the World Bank commodity price records of historical prices and forecasts of future prices converted to a 2005 base using historical exchange rates. Future prices are also expressed in constant 2005 prices using an exchange rate of P55=$1.00. Farmgate prices are derived by making adjustments for quality, transport and processing costs. These calculations are based on import parity prices for rice, maize and fertilizer (triple superphosphate [TSP], potassium chloride (KCL), and urea).
(iii) The costs of civil engineering works have been adjusted to economic levels by a standard conversion factor of 0.85. Unskilled labor used in construction has a shadow value of 0.65. Agricultural labor has a shadow value of 0.80.
(iv) Where necessary, allowance is made for additional capital investment to repair damaged irrigation schemes and for operation and maintenance (O&M) cost for farm-to-market roads (FMRs), irrigation schemes, and domestic water supply (to allow for an appropriate level of O&M for sustainable operations in the future to maintain the projected level of benefits).
(v) The cost of agricultural labor is P150 and P100 per day for male and female labor, respectively. A shadow value 0.8 is applied to agricultural labor.
(vi) The economic life of the project is assumed to be 25 years starting in 1997.
1 ADB. 1997. Guidelines for the Economic Analysis of Projects. Manila.
48 Appendix 9
Table A9.1: Data Used to Convert to 2005 Prices Item 1997 1998 1999 2000 2001 2002 2003 2004 2005 CPI Philippines 1994 base 124.70 136.80 145.90 152.30 161.60 167.00 170.00 176.00 2005 base 1.53 1.39 1.30 1.25 1.17 1.14 1.10 1.04 1.00 Ave Ex. rate 29.47 40.89 39.09 44.19 50.99 52.29 54.37 56.37 55.00 MUV Index 1990 base 104.28 104.90 103.56 97.17 95.95 92.99 99.97 106.86 109.43 2003 base 1.049 1.043 1.057 1.126 1.140 1.177 1.095 1.024 1.00 CPI = consumer price index, MUV = manufacturers’ unit value. Source: World Bank Global Commodity Price Prospects 2005, ADB. 1994. Key Indicators for Philippines. Manila.
2. Economic Benefits 3. Project benefits are calculated as the difference between the value of agricultural production that would have been obtained in the situation before and without the project (future without project) and the production with the project (future with project). Production in the “future without” scenario is assumed to be the same as at present, although it might be expected that in the future there would be a decline in production as the infrastructure degenerates and through the effect of inappropriate land use practices. In common with the original economic analysis in the report and recommendation of the President (RRP)2 the economic benefits are assumed to consist of (i) the incremental economic value of crop production due to the rehabilitation and construction of communal irrigation systems in the target barangays, (ii) the incremental production in the greater zone of influence of the Project, and (iii) the savings in freight and passenger transport costs resulting from the rehabilitation of the FMRs. The benefits from the domestic water supply systems constructed by the Project have not been included because of the difficulty of quantifying the benefits. The direct benefit is the time savings brought about from the convenience of having a closer and more reliable source of domestic water and the associated health benefits. It is also of interest to note that the beneficiaries mentioned that an added benefit of improved water supply is that it enabled them to rear more pigs because of the access to a reliable water supply for washing pig pens and for providing water for their pigs. No allowance is made for the benefits from the reforestation component (as this is funded separately by the IFAD loan) or of the impact on sustainable productivity because of the natural resource management component of the Project. 4. As a result of the rehabilitation and construction of the 52 irrigation schemes serving an area of 2,810 ha by the Project, there has been an increase in crop yields and cropping intensity resulting from the more reliable supply of water. The schemes are divided into three categories based on their predominant cropping pattern—vegetable alone, rice and vegetable, and rice alone within the three project provinces. The increase in cropping intensity varies between 25% and 58%. Crop yields for rice, as indicated by project benefit monitoring and evaluation (BME), have increased from 2 t/ha to 3.09 t/ha for improved rice varieties and from 1.41 t/ha to 2.21 t/ha for traditional rice production. For vegetable crops, the yield of cabbage has been shown to have increased from 12 t/ha to 14.5 t/ha as a result of improved irrigation and farming practices. To allow for the irrigation schemes in Abra province that were destroyed by typhoon Agme in June 2004, the irrigable area has been reduced by 101.7 ha to 2,708 ha.
2 ADB. 1996. Report and Recommendation of the President to the Board of Directors on a Proposed Loan to the
Republic of the Philippines for the Cordillera Highland Agricultural Resource Management Project. Manila (Loan nos. 1421/1422-PHI[SF]).
Appendix 9 49
5. The benefit from the improved access provided by the 151.35 km of FMRs upgraded by the Project is based on the same methodology as was used in the original economic analysis. This assumed a saving in vehicle operating costs, assessed as P0.48/tonne/km for the volume of goods using the roads. The roads are assumed to have a “zone of influence” of 14.52 ha/km of road, which is the agricultural land affected by the road, giving a total of 2,198 ha for the zone of influence of the FMRs. The average amount of produce utilizing the road is assumed to be 5.0 t/ha/year to account for the produce brought into and leaving the area served by the road. The total benefit estimated from the FMRs is estimated to build up to P79.8 million/year. Discussion with project beneficiaries during the course of the field work for the PCR confirmed that a major benefit of improved all-weather road access was increased volume of traffic and travel to and from the project area, particularly during the rainy season, when road access was previously often rendered impassable for several months. 6. The other significant benefit was the impact of the agricultural support services (ASS) which includes the various training courses provided to project beneficiaries, special studies and demonstration plots, integrated pest management (IPM) and the current vegetable market price information disseminated through the radio program “CHARM on the Air” that was funded by the Project. BME studies conducted in the project area have confirmed the high level of awareness and the positive impact of project activities on livelihoods. However, it is difficult to quantify the extent of these benefits accurately, although they are significant. To take into account the more general impact of these ASS activities, a modest percentage increase has been applied to the value of agricultural production in the project area. The target population in the Project that benefits directly is estimated as 23,150 households, which at an average farm size of 0.46 ha indicates that total productive agricultural land is in the order of 10,650 ha. From the sample survey of project beneficiaries conducted for the final BME study prepared by project management in 2004, the total annual amount of agricultural production is estimated to be 75,000 t with a value of P983 million. Using this as the base, and applying an increase of 5% for project impact, results in an annual benefit of P49.15 million per year. It is assumed that this benefit would build up over a period of time as farmers adopt new technology and reap the benefits of improvements to their farming systems. In addition to this population that have directly benefited from the Project, there is a wider group of 50,000 households within the Project area, and an additional 250,000 households in other barangays outside the Project that also benefit from the spill-over of broader project activities and FMRs and ASS, such as market information broadcast over the radio.
3. Results of Economic Analysis 7. The economic internal rate of return (EIRR) for the overall project is calculated to be 15.9%. This can be compared with the EIRR of 18% that was estimated at the time of project preparation in 1995 and the EIRR of 20% in the project completion report (PCR) prepared by the Project in 2004. The summary cash flows are included in the tables in Appendix 4.
4. Sensitivity Analysis 8. The results of the overall economic analysis have been tested for changes in the assumptions relating to the level of benefits and O&M cost, the two variables that will have the most impact on the future economic performance of the Project. A 17.5% decrease in the overall level of benefits reduces the EIRR from 15.9% to 12%. By comparison, the annual O&M costs would have to increase by 165% to reduce the EIRR to 12%. It appears that the economic performance is quite sensitive to the level of benefits, but is insensitive to changes in the O&M costs. As a major portion of the benefits is gained from the increase in vegetable production, it
50 Appendix 9
will be important that this industry continues to receive support from government and assistance to develop post-production packaging, processing, and marketing technology to meet the challenge from increased competition from imports from overseas and other production centers within the Philippines. B. Financial Analysis 9. The project design document states that the overall goal of the Project was to raise household income above the poverty line so that the percentage of households beneath the poverty line would reduce from 70% to 25% by 2006. It was predicted that average household incomes would increase from P21,200 ($820) to P56,000 ($2,170) per year in real terms in the target municipalities (a 168% increase), while net farm incomes would increase from 104% to 239%, depending on the farming system. While there is not sufficient information to quantify whether these targets have been actually achieved, they are considered to be optimistic within the context of rural development. 10. The original assessment of the level of poverty in the project area at the time of project preparation was based on the information obtained by the family income and expenditures survey (FIES)3 conducted by the National Statistics Office. FIESs are done at 3-year intervals (1997, 2000, and 2003 during the life of the Project). The 2000 FIES showed that, from 1997 to 2000, the poverty incidence of families in the Cordillera Administrative Region (CAR) decreased by 5.9% from 42.5% to 36.9%, the biggest decline in the country. For rural families, CAR’s decline in the incidence of poverty was 5.5% from 55.5% to 50.0%. Comparable data for the poverty incidence are not available from the FIES 2003 but that survey does show that, with regard to the real change in average family income by region, CAR’s performance was the seventh best of the 17 regions, with a decline of 2.4% compared with the overall national decline of 10%. During this period the Philippines experienced a decline in real average family income. In conclusion, it can be assumed that the CAR achieved a measure of poverty reduction during the Project period that was higher than those in other regions. Some of this was due to the Project but it is not possible to differentiate its impact from other factors. 11. The BME surveys conducted by the Project also provide information on changes in household income. The final BME survey conducted in 2004 on a sample of beneficiary households analyzed the change in household income between the benchmark survey conducted in 2000 at the start of the project by the NGO contracted to the Project and the final BME survey carried out in 2004. The results are summarized in Table A9.2. The average income per month amounts are expressed in current prices and show an average increase for the three activities of 93%. However, when allowance is made for inflation between 2000 and 2004 of about 20%, the percentage increase in income in real terms is reduced to an average of 61%. This can be compared with the stated objective of increasing average family incomes by 168% in real teams from 1995 to 2006. Although the Project achieved a considerable increase in household income, it is highly unlikely that its target of 168% by 2006 will be achieved.
3 The Family Income and Expenditure Survey (FIES) is a national survey of households undertaken every 3 years by
the National Statistics Office. It is the main source of data on family income and expenditure and includes levels of consumption by item of expenditure as well as sources of income in cash and in kind. The results of FIES provide information on the levels of living and disparities in family income as well as their spending patterns.
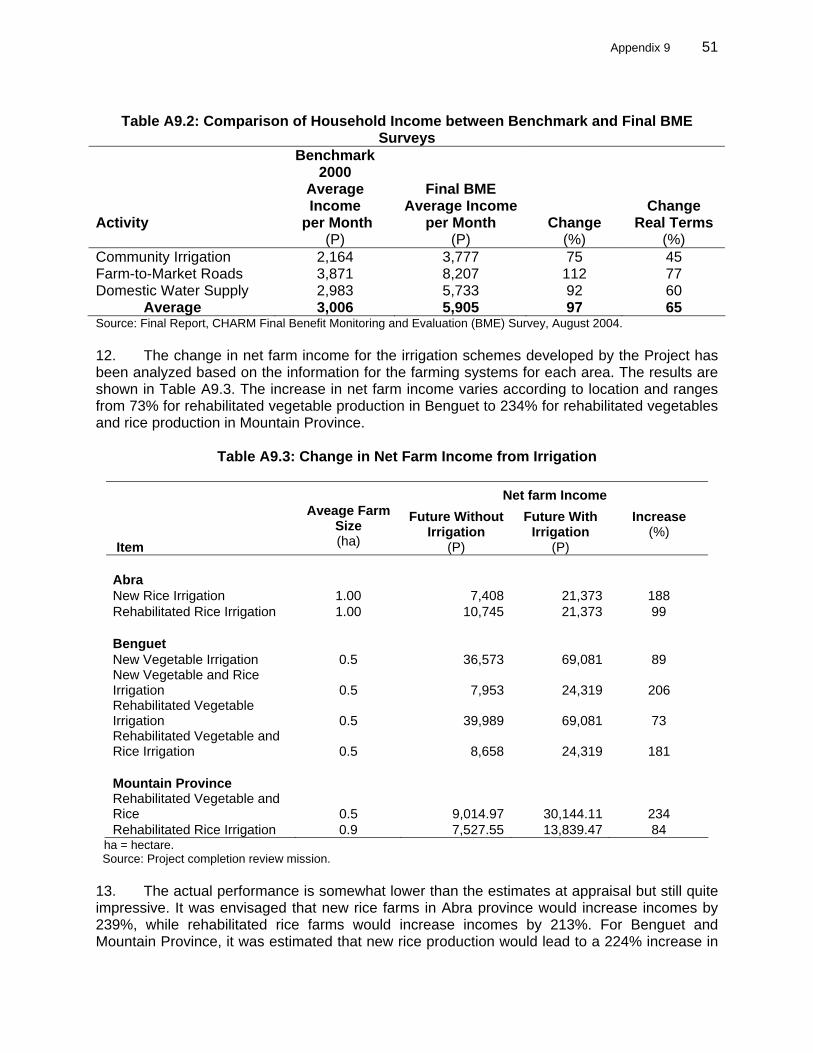
Appendix 9 51
Table A9.2: Comparison of Household Income between Benchmark and Final BME
Surveys Activity
Benchmark 2000
Average Income
per Month (P)
Final BME Average Income
per Month (P)
Change (%)
Change Real Terms
(%) Community Irrigation 2,164 3,777 75 45 Farm-to-Market Roads 3,871 8,207 112 77 Domestic Water Supply 2,983 5,733 92 60 Average 3,006 5,905 97 65 Source: Final Report, CHARM Final Benefit Monitoring and Evaluation (BME) Survey, August 2004. 12. The change in net farm income for the irrigation schemes developed by the Project has been analyzed based on the information for the farming systems for each area. The results are shown in Table A9.3. The increase in net farm income varies according to location and ranges from 73% for rehabilitated vegetable production in Benguet to 234% for rehabilitated vegetables and rice production in Mountain Province.
Table A9.3: Change in Net Farm Income from Irrigation
Net farm Income
Item
Aveage Farm
Size (ha)
Future Without Irrigation
(P)
Future With Irrigation
(P)
Increase (%)
Abra New Rice Irrigation 1.00 7,408 21,373 188 Rehabilitated Rice Irrigation 1.00 10,745 21,373 99 Benguet New Vegetable Irrigation 0.5 36,573 69,081 89 New Vegetable and Rice Irrigation 0.5 7,953
24,319 206
Rehabilitated Vegetable Irrigation 0.5 39,989 69,081 73 Rehabilitated Vegetable and Rice Irrigation 0.5 8,658
24,319 181
Mountain Province Rehabilitated Vegetable and Rice 0.5 9,014.97 30,144.11 234 Rehabilitated Rice Irrigation 0.9 7,527.55 13,839.47 84
ha = hectare. Source: Project completion review mission. 13. The actual performance is somewhat lower than the estimates at appraisal but still quite impressive. It was envisaged that new rice farms in Abra province would increase incomes by 239%, while rehabilitated rice farms would increase incomes by 213%. For Benguet and Mountain Province, it was estimated that new rice production would lead to a 224% increase in
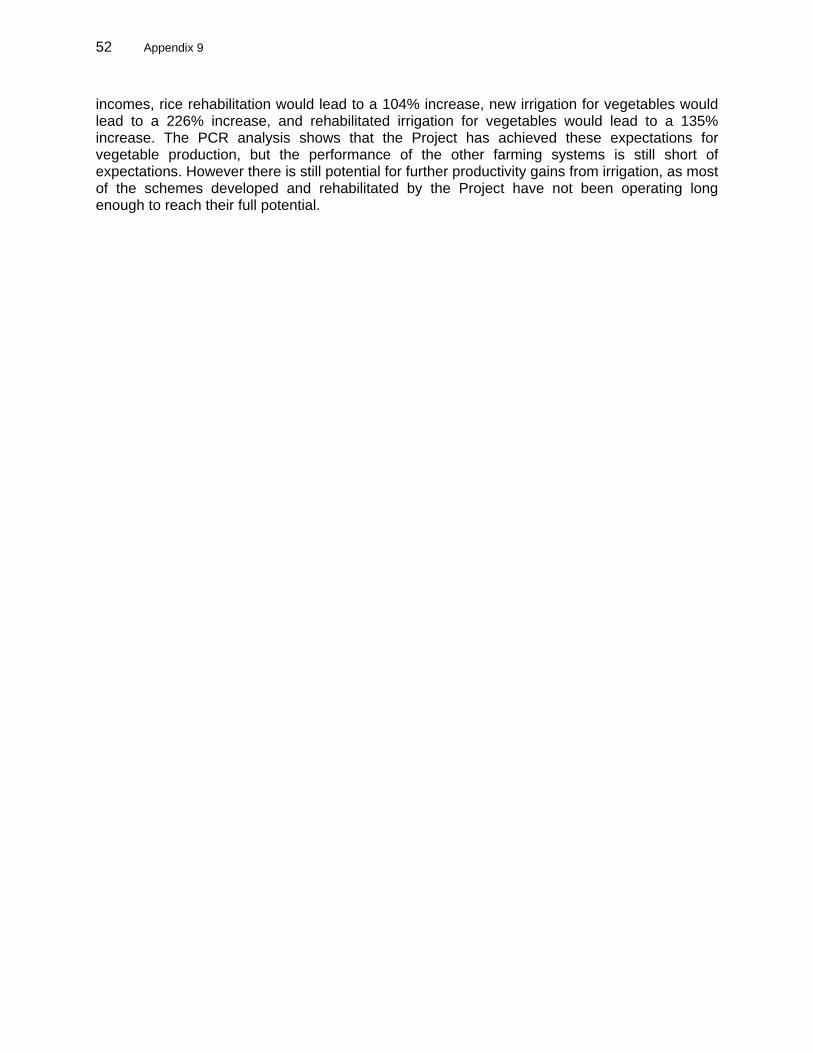
52 Appendix 9
incomes, rice rehabilitation would lead to a 104% increase, new irrigation for vegetables would lead to a 226% increase, and rehabilitated irrigation for vegetables would lead to a 135% increase. The PCR analysis shows that the Project has achieved these expectations for vegetable production, but the performance of the other farming systems is still short of expectations. However there is still potential for further productivity gains from irrigation, as most of the schemes developed and rehabilitated by the Project have not been operating long enough to reach their full potential.
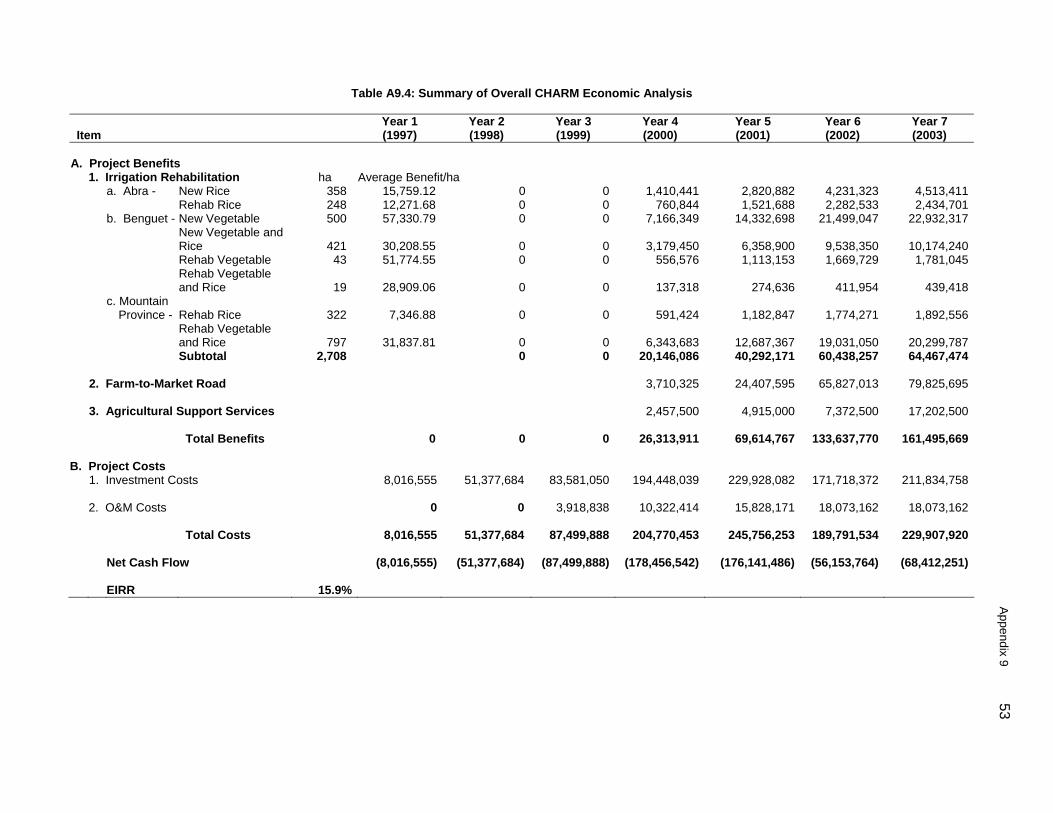
Appendix 9 53
Table A9.4: Summary of Overall CHARM Economic Analysis Year 1 Year 2 Year 3 Year 4 Year 5 Year 6 Year 7 Item (1997) (1998) (1999) (2000) (2001) (2002) (2003)
A. Project Benefits 1. Irrigation Rehabilitation ha Average Benefit/ha a. Abra - New Rice 358 15,759.12 0 0 1,410,441 2,820,882 4,231,323 4,513,411 Rehab Rice 248 12,271.68 0 0 760,844 1,521,688 2,282,533 2,434,701 b. Benguet - New Vegetable 500 57,330.79 0 0 7,166,349 14,332,698 21,499,047 22,932,317 New Vegetable and
Rice
421 30,208.55 0
0 3,179,450 6,358,900 9,538,350 10,174,240 Rehab Vegetable 43 51,774.55 0 0 556,576 1,113,153 1,669,729 1,781,045 Rehab Vegetable
and Rice
19 28,909.06 0
0 137,318 274,636 411,954 439,418 c. Mountain
Province - Rehab Rice
322 7,346.88 0
0 591,424 1,182,847 1,774,271 1,892,556
Rehab Vegetable and Rice
797
31,837.81 0
0 6,343,683 12,687,367 19,031,050 20,299,787
Subtotal 2,708 0 0 20,146,086 40,292,171 60,438,257 64,467,474 2. Farm-to-Market Road 3,710,325 24,407,595 65,827,013 79,825,695 3. Agricultural Support Services 2,457,500 4,915,000 7,372,500 17,202,500 Total Benefits 0 0 0 26,313,911 69,614,767 133,637,770 161,495,669
B. Project Costs
1. Investment Costs 8,016,555 51,377,684 83,581,050 194,448,039 229,928,082 171,718,372 211,834,758 2. O&M Costs 0 0 3,918,838 10,322,414 15,828,171 18,073,162 18,073,162 Total Costs 8,016,555 51,377,684 87,499,888 204,770,453 245,756,253 189,791,534 229,907,920 Net Cash Flow (8,016,555) (51,377,684) (87,499,888) (178,456,542) (176,141,486) (56,153,764) (68,412,251) EIRR 15.9%
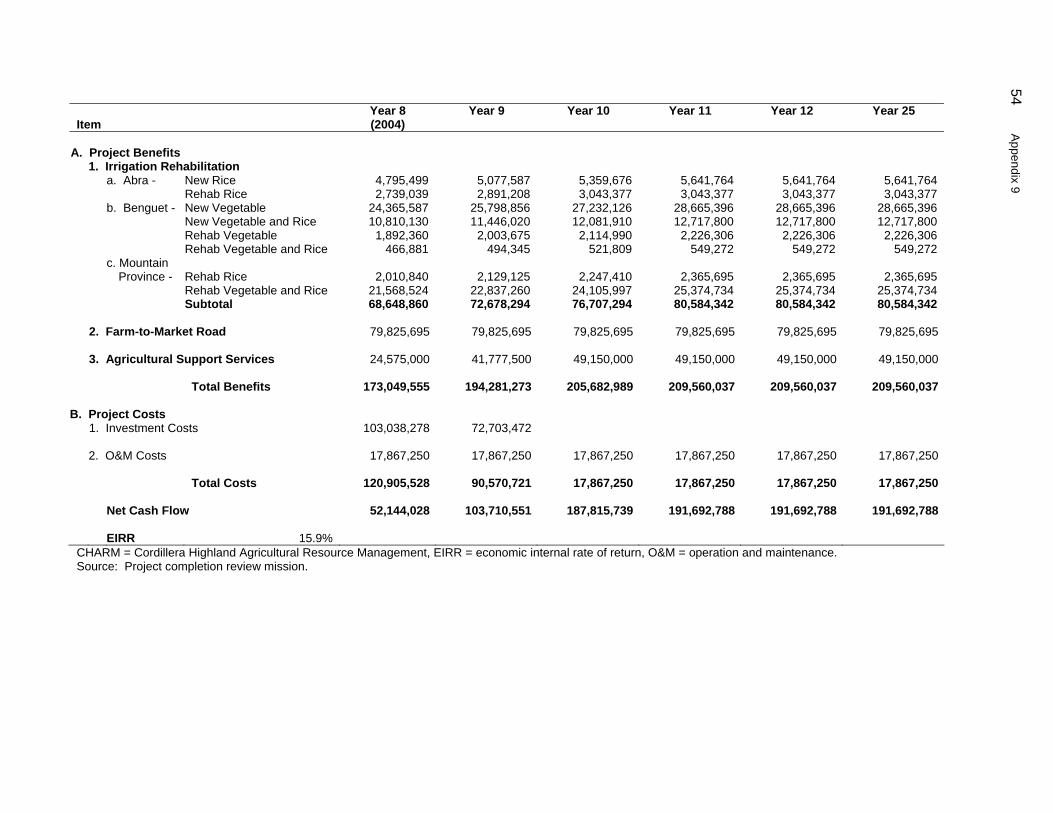
54 Appendix 9
Year 8 Year 9 Year 10 Year 11 Year 12 Year 25 Item (2004)
A. Project Benefits 1. Irrigation Rehabilitation a. Abra - New Rice 4,795,499 5,077,587 5,359,676 5,641,764 5,641,764 5,641,764 Rehab Rice 2,739,039 2,891,208 3,043,377 3,043,377 3,043,377 3,043,377 b. Benguet - New Vegetable 24,365,587 25,798,856 27,232,126 28,665,396 28,665,396 28,665,396 New Vegetable and Rice 10,810,130 11,446,020 12,081,910 12,717,800 12,717,800 12,717,800 Rehab Vegetable 1,892,360 2,003,675 2,114,990 2,226,306 2,226,306 2,226,306 Rehab Vegetable and Rice 466,881 494,345 521,809 549,272 549,272 549,272 c. Mountain
Province - Rehab Rice
2,010,840
2,129,125
2,247,410
2,365,695
2,365,695
2,365,695
Rehab Vegetable and Rice 21,568,524 22,837,260 24,105,997 25,374,734 25,374,734 25,374,734 Subtotal 68,648,860 72,678,294 76,707,294 80,584,342 80,584,342 80,584,342 2. Farm-to-Market Road 79,825,695 79,825,695 79,825,695 79,825,695 79,825,695 79,825,695 3. Agricultural Support Services 24,575,000 41,777,500 49,150,000 49,150,000 49,150,000 49,150,000 Total Benefits 173,049,555 194,281,273 205,682,989 209,560,037 209,560,037 209,560,037
B. Project Costs
1. Investment Costs 103,038,278 72,703,472 2. O&M Costs 17,867,250 17,867,250 17,867,250 17,867,250 17,867,250 17,867,250 Total Costs 120,905,528 90,570,721 17,867,250 17,867,250 17,867,250 17,867,250 Net Cash Flow 52,144,028 103,710,551 187,815,739 191,692,788 191,692,788 191,692,788 EIRR 15.9% CHARM = Cordillera Highland Agricultural Resource Management, EIRR = economic internal rate of return, O&M = operation and maintenance. Source: Project completion review mission.
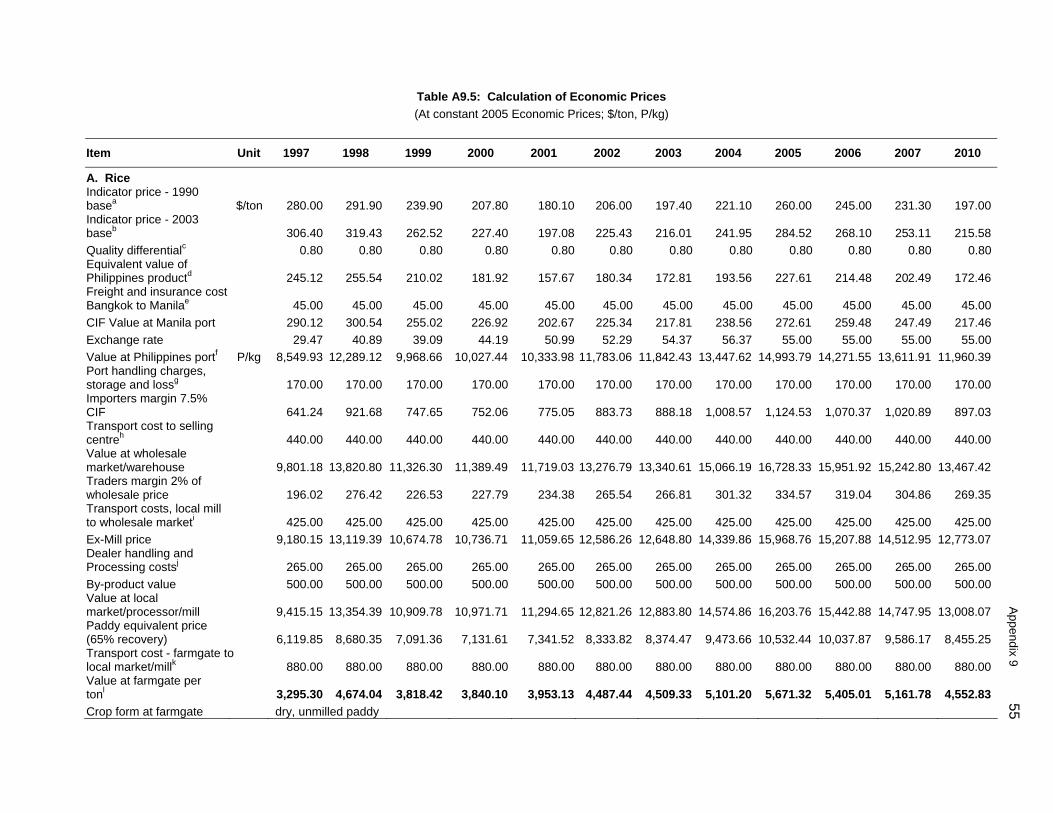
Appendix 9 55
Table A9.5: Calculation of Economic Prices (At constant 2005 Economic Prices; $/ton, P/kg)
Item Unit 1997 1998 1999 2000 2001 2002 2003 2004 2005 2006 2007 2010
A. Rice Indicator price - 1990 basea $/ton 280.00 291.90 239.90 207.80 180.10 206.00 197.40 221.10 260.00 245.00 231.30 197.00 Indicator price - 2003 baseb 306.40 319.43 262.52 227.40 197.08 225.43 216.01 241.95 284.52 268.10 253.11 215.58 Quality differentialc 0.80 0.80 0.80 0.80 0.80 0.80 0.80 0.80 0.80 0.80 0.80 0.80 Equivalent value of Philippines productd 245.12 255.54 210.02 181.92 157.67 180.34 172.81 193.56 227.61 214.48 202.49 172.46 Freight and insurance cost Bangkok to Manilae 45.00 45.00 45.00 45.00 45.00 45.00 45.00 45.00 45.00 45.00 45.00 45.00 CIF Value at Manila port 290.12 300.54 255.02 226.92 202.67 225.34 217.81 238.56 272.61 259.48 247.49 217.46 Exchange rate 29.47 40.89 39.09 44.19 50.99 52.29 54.37 56.37 55.00 55.00 55.00 55.00 Value at Philippines portf P/kg 8,549.93 12,289.12 9,968.66 10,027.44 10,333.98 11,783.06 11,842.43 13,447.62 14,993.79 14,271.55 13,611.91 11,960.39 Port handling charges, storage and lossg 170.00 170.00 170.00 170.00 170.00 170.00 170.00 170.00 170.00 170.00 170.00 170.00 Importers margin 7.5% CIF 641.24 921.68 747.65 752.06 775.05 883.73 888.18 1,008.57 1,124.53 1,070.37 1,020.89 897.03 Transport cost to selling centreh 440.00 440.00 440.00 440.00 440.00 440.00 440.00 440.00 440.00 440.00 440.00 440.00 Value at wholesale market/warehouse 9,801.18 13,820.80 11,326.30 11,389.49 11,719.03 13,276.79 13,340.61 15,066.19 16,728.33 15,951.92 15,242.80 13,467.42 Traders margin 2% of wholesale price 196.02 276.42 226.53 227.79 234.38 265.54 266.81 301.32 334.57 319.04 304.86 269.35 Transport costs, local mill to wholesale marketi 425.00 425.00 425.00 425.00 425.00 425.00 425.00 425.00 425.00 425.00 425.00 425.00 Ex-Mill price 9,180.15 13,119.39 10,674.78 10,736.71 11,059.65 12,586.26 12,648.80 14,339.86 15,968.76 15,207.88 14,512.95 12,773.07 Dealer handling and Processing costsj 265.00 265.00 265.00 265.00 265.00 265.00 265.00 265.00 265.00 265.00 265.00 265.00 By-product value 500.00 500.00 500.00 500.00 500.00 500.00 500.00 500.00 500.00 500.00 500.00 500.00 Value at local market/processor/mill 9,415.15 13,354.39 10,909.78 10,971.71 11,294.65 12,821.26 12,883.80 14,574.86 16,203.76 15,442.88 14,747.95 13,008.07 Paddy equivalent price (65% recovery) 6,119.85 8,680.35 7,091.36 7,131.61 7,341.52 8,333.82 8,374.47 9,473.66 10,532.44 10,037.87 9,586.17 8,455.25 Transport cost - farmgate to local market/millk 880.00 880.00 880.00 880.00 880.00 880.00 880.00 880.00 880.00 880.00 880.00 880.00 Value at farmgate per tonl 3,295.30 4,674.04 3,818.42 3,840.10 3,953.13 4,487.44 4,509.33 5,101.20 5,671.32 5,405.01 5,161.78 4,552.83 Crop form at farmgate dry, unmilled paddy
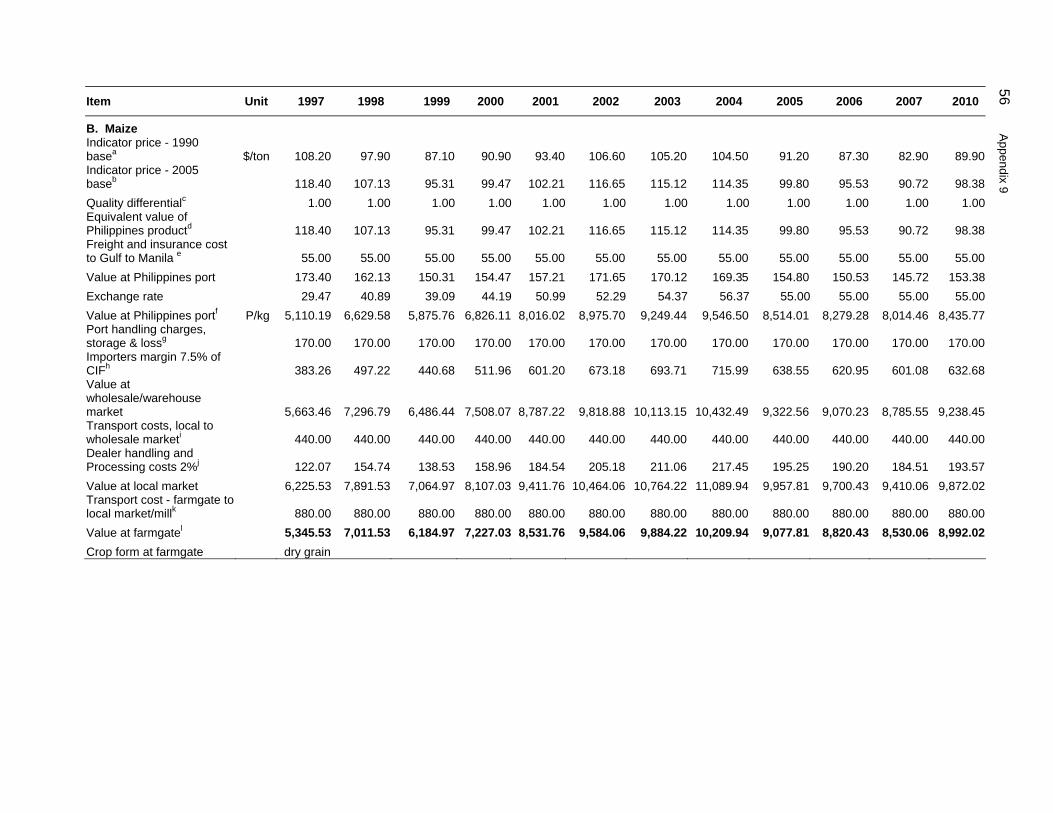
56 Appendix 9
Item Unit 1997 1998 1999 2000 2001 2002 2003 2004 2005 2006 2007 2010
B. Maize Indicator price - 1990 basea $/ton 108.20 97.90 87.10 90.90 93.40
106.60 105.20 104.50 91.20 87.30 82.90
89.90
Indicator price - 2005 baseb 118.40 107.13 95.31 99.47 102.21
116.65 115.12 114.35 99.80 95.53 90.72
98.38
Quality differentialc 1.00 1.00 1.00 1.00 1.00 1.00 1.00 1.00 1.00 1.00 1.00 1.00 Equivalent value of Philippines productd 118.40 107.13 95.31 99.47 102.21
116.65 115.12 114.35 99.80 95.53 90.72
98.38
Freight and insurance cost to Gulf to Manila e 55.00 55.00 55.00 55.00 55.00
55.00 55.00 55.00 55.00 55.00 55.00
55.00
Value at Philippines port 173.40 162.13 150.31 154.47 157.21 171.65 170.12 169.35 154.80 150.53 145.72 153.38 Exchange rate 29.47 40.89 39.09 44.19 50.99 52.29 54.37 56.37 55.00 55.00 55.00 55.00 Value at Philippines portf P/kg 5,110.19 6,629.58 5,875.76 6,826.11 8,016.02 8,975.70 9,249.44 9,546.50 8,514.01 8,279.28 8,014.46 8,435.77 Port handling charges, storage & lossg 170.00 170.00 170.00 170.00 170.00
170.00 170.00 170.00 170.00 170.00 170.00
170.00
Importers margin 7.5% of CIFh 383.26 497.22 440.68 511.96 601.20
673.18 693.71 715.99 638.55 620.95 601.08
632.68
Value at wholesale/warehouse market 5,663.46 7,296.79 6,486.44 7,508.07 8,787.22
9,818.88 10,113.15 10,432.49 9,322.56 9,070.23 8,785.55
9,238.45
Transport costs, local to wholesale marketi 440.00 440.00 440.00 440.00 440.00
440.00 440.00 440.00 440.00 440.00 440.00
440.00
Dealer handling and Processing costs 2%j 122.07 154.74 138.53 158.96 184.54
205.18 211.06 217.45 195.25 190.20 184.51
193.57
Value at local market 6,225.53 7,891.53 7,064.97 8,107.03 9,411.76 10,464.06 10,764.22 11,089.94 9,957.81 9,700.43 9,410.06 9,872.02 Transport cost - farmgate to local market/millk 880.00 880.00 880.00 880.00 880.00
880.00 880.00 880.00 880.00 880.00 880.00
880.00
Value at farmgatel 5,345.53 7,011.53 6,184.97 7,227.03 8,531.76 9,584.06 9,884.22 10,209.94 9,077.81 8,820.43 8,530.06 8,992.02 Crop form at farmgate dry grain
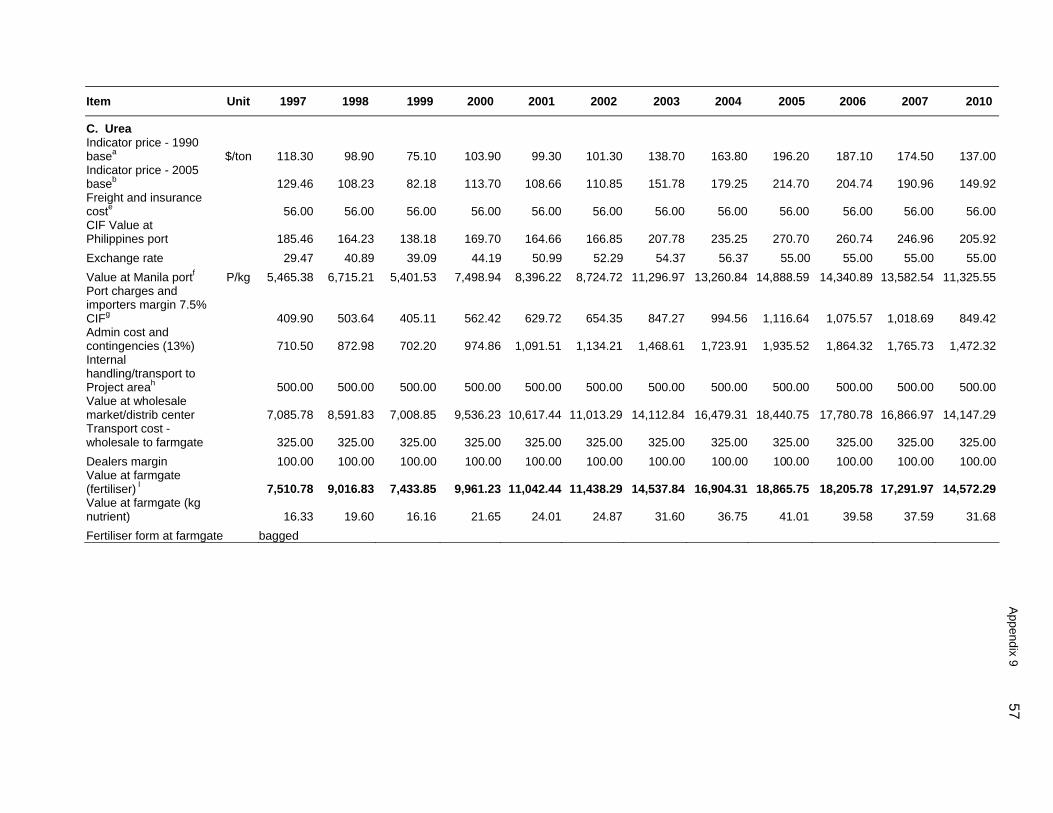
Appendix 9 57
Item Unit 1997 1998 1999 2000 2001 2002 2003 2004 2005 2006 2007 2010
C. Urea Indicator price - 1990 basea $/ton
118.30 98.90
75.10 103.90 99.30
101.30 138.70 163.80 196.20 187.10 174.50
137.00
Indicator price - 2005 baseb
129.46 108.23
82.18 113.70 108.66
110.85 151.78 179.25 214.70 204.74 190.96
149.92
Freight and insurance coste
56.00 56.00
56.00 56.00 56.00
56.00 56.00 56.00 56.00 56.00 56.00
56.00
CIF Value at Philippines port
185.46 164.23
138.18 169.70 164.66
166.85 207.78 235.25 270.70 260.74 246.96
205.92
Exchange rate 29.47 40.89 39.09 44.19 50.99 52.29 54.37 56.37 55.00 55.00 55.00 55.00 Value at Manila portf P/kg 5,465.38 6,715.21 5,401.53 7,498.94 8,396.22 8,724.72 11,296.97 13,260.84 14,888.59 14,340.89 13,582.54 11,325.55 Port charges and importers margin 7.5% CIFg
409.90 503.64
405.11 562.42 629.72
654.35 847.27 994.56 1,116.64 1,075.57 1,018.69
849.42
Admin cost and contingencies (13%)
710.50 872.98
702.20 974.86 1,091.51
1,134.21 1,468.61 1,723.91 1,935.52 1,864.32 1,765.73
1,472.32
Internal handling/transport to Project areah
500.00 500.00
500.00 500.00 500.00
500.00 500.00 500.00 500.00 500.00 500.00
500.00
Value at wholesale market/distrib center
7,085.78 8,591.83
7,008.85 9,536.23 10,617.44
11,013.29 14,112.84 16,479.31 18,440.75 17,780.78 16,866.97
14,147.29
Transport cost - wholesale to farmgate
325.00 325.00
325.00 325.00 325.00
325.00 325.00 325.00 325.00 325.00 325.00
325.00
Dealers margin 100.00 100.00 100.00 100.00 100.00 100.00 100.00 100.00 100.00 100.00 100.00 100.00 Value at farmgate (fertiliser) l
7,510.78 9,016.83
7,433.85 9,961.23 11,042.44
11,438.29 14,537.84 16,904.31 18,865.75 18,205.78 17,291.97
14,572.29
Value at farmgate (kg nutrient)
16.33 19.60
16.16 21.65 24.01
24.87 31.60 36.75 41.01 39.58 37.59
31.68
Fertiliser form at farmgate bagged
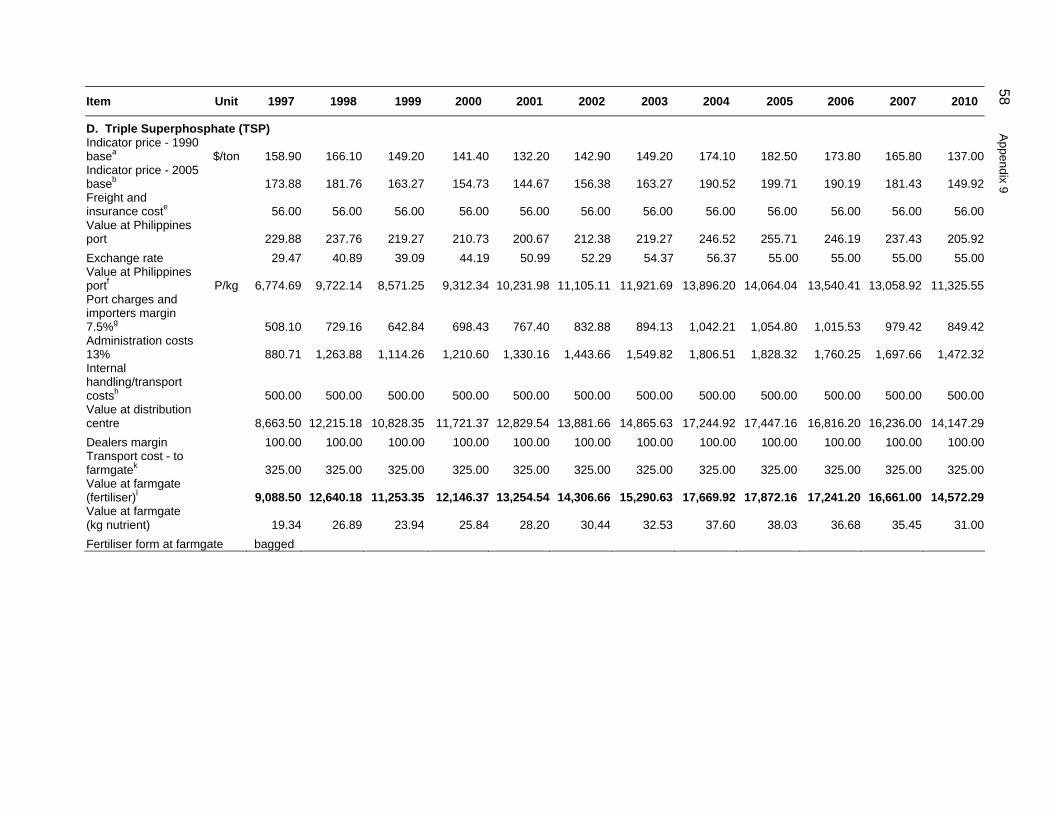
58 Appendix 9
Item Unit 1997 1998 1999 2000 2001 2002 2003 2004 2005 2006 2007 2010
D. Triple Superphosphate (TSP) Indicator price - 1990 basea $/ton
158.90 166.10
149.20 141.40 132.20
142.90 149.20 174.10 182.50 173.80 165.80
137.00
Indicator price - 2005 baseb
173.88 181.76
163.27 154.73 144.67
156.38 163.27 190.52 199.71 190.19 181.43
149.92
Freight and insurance coste
56.00 56.00
56.00 56.00 56.00
56.00 56.00 56.00 56.00 56.00 56.00
56.00
Value at Philippines port
229.88 237.76
219.27 210.73 200.67
212.38 219.27 246.52 255.71 246.19 237.43
205.92
Exchange rate 29.47 40.89 39.09 44.19 50.99 52.29 54.37 56.37 55.00 55.00 55.00 55.00 Value at Philippines portf P/kg
6,774.69 9,722.14
8,571.25 9,312.34 10,231.98
11,105.11 11,921.69 13,896.20 14,064.04 13,540.41 13,058.92
11,325.55
Port charges and importers margin 7.5%g
508.10 729.16
642.84 698.43 767.40
832.88 894.13 1,042.21 1,054.80 1,015.53 979.42
849.42
Administration costs 13%
880.71 1,263.88
1,114.26 1,210.60 1,330.16
1,443.66 1,549.82 1,806.51 1,828.32 1,760.25 1,697.66
1,472.32
Internal handling/transport costsh
500.00 500.00
500.00 500.00 500.00
500.00 500.00 500.00 500.00 500.00 500.00
500.00
Value at distribution centre
8,663.50 12,215.18
10,828.35 11,721.37 12,829.54
13,881.66 14,865.63 17,244.92 17,447.16 16,816.20 16,236.00
14,147.29
Dealers margin 100.00 100.00 100.00 100.00 100.00 100.00 100.00 100.00 100.00 100.00 100.00 100.00 Transport cost - to farmgatek
325.00 325.00
325.00 325.00 325.00
325.00 325.00 325.00 325.00 325.00 325.00
325.00
Value at farmgate (fertiliser)l
9,088.50 12,640.18
11,253.35 12,146.37 13,254.54
14,306.66 15,290.63 17,669.92 17,872.16 17,241.20 16,661.00
14,572.29
Value at farmgate (kg nutrient)
19.34 26.89
23.94 25.84 28.20
30.44 32.53 37.60 38.03 36.68 35.45
31.00
Fertiliser form at farmgate bagged

Appendix 9 59
Item Unit 1997 1998 1999 2000 2001 2002 2003 2004 2005 2006 2007 2010 E. Potassium Chloride KCL Indicator price - 1990 basea $/ton
107.70 112.40 117.50 125.80 123.10
121.70 113.10 116.40 141.40 129.20 122.20
107.00
Indicator price - 2005 baseb
117.86 123.00 128.58 137.66 134.71
133.18 123.77 127.38 154.73 141.38 133.72
117.09
Freight and insurance coste
56.00 56.00 56.00 56.00 56.00
56.00 56.00 56.00 56.00 56.00 56.00
56.00
CIF Value at Philippines port
173.86 179.00 184.58 193.66 190.71
189.18 179.77 183.38 210.73 197.38 189.72
173.09
Exchange rate 29.47 40.89 39.09 44.19 50.99 52.29 54.37 56.37 55.00 55.00 55.00 55.00 Value at Philippines portf P/kg
5,123.54 7,319.28 7,215.24 8,557.97 9,724.22
9,892.03 9,773.84 10,336.93 11,590.37 10,856.10 10,434.79
9,519.96
Port charges and importers margin 7.5%g
384.27 548.95 541.14 641.85 729.32
741.90 733.04 775.27 869.28 814.21 782.61
714.00
Admin costs and contingencies 13%h
666.06 951.51 937.98 1,112.54 1,264.15
1,285.96 1,270.60 1,343.80 1,506.75 1,411.29 1,356.52
1,237.59
Internal handling transport to project area
500.00 500.00 500.00 500.00 500.00
500.00 500.00 500.00 500.00 500.00 500.00
500.00
Value at distribution centre
6,673.87 9,319.74 9,194.37 10,812.35 12,217.68
12,419.90 12,277.48 12,956.01 14,466.40 13,581.60 13,073.92
11,971.55
Dealers margin 100.00 100.00 100.00 100.00 100.00 100.00 100.00 100.00 100.00 100.00 100.00 100.00 Transport cost to farmgatek
325.00 325.00 325.00 325.00 325.00
325.00 325.00 325.00 325.00 325.00 325.00
325.00
Value at farmgate (fertiliser)l
7,098.87 9,744.74 9,619.37 11,237.35 12,642.68
12,844.90 12,702.48 13,381.01 14,891.40 14,006.60 13,498.92
12,396.55
Value at farmgate (nutrient)
11.83 16.24 16.03 18.73 21.07
21.41 21.17 22.30 24.82 23.34 22.50
20.66
Fertiliser form at farmgate bagged Derived Value of Compound Fertiliser P/kg
6.65 8.78 7.86 9.27 10.26
10.74 11.94 13.53 14.54 13.94 13.38
11.67
(estimated from price of N, P205 and K20) CIF = cost, insurance, and freight; FOB = freight on board. a Price in constant 1990 $, World Bank Commodity Price Projections, 2005 November. b Price in constant 2005 $, World Bank Commodity Price Projections, 2005 November, having applied manufacturers’ unit value factor of 1.0943 . c Value of Philippines product/value of marker product. d Marker price x quality differential factor. e Cost of insurance and freight between marker product location and Manila port. f $/ton value converted to P/kg at $=P55 exchange rate. g Costs of port handling and other charges in Philippines % of freight on board/cost, insurance, and freight.
60 Appendix 9
h Costs of transport, handling etc, between wholesale market and port. i Costs of transport, handling etc, between local and wholesale market. j Processing costs/ton of processed product. k Transport/handling cost between farmgate and local market. l Farmgate value of unprocessed product.
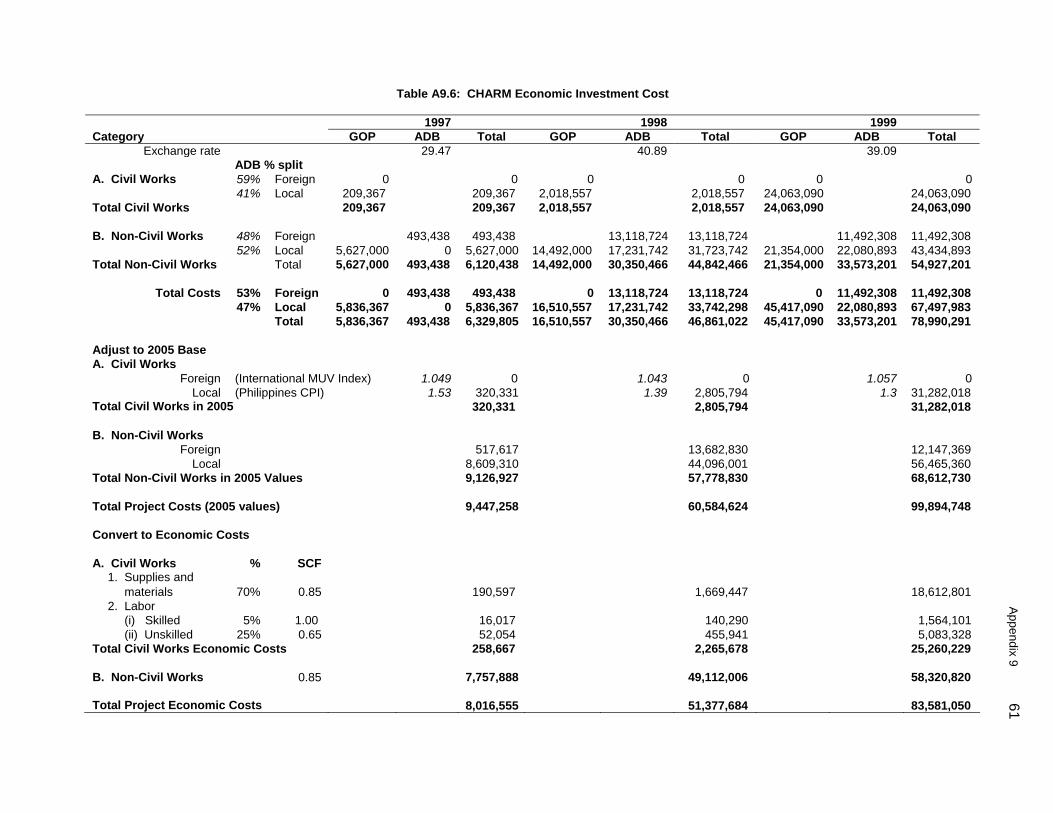
Appendix 9 61
Table A9.6: CHARM Economic Investment Cost 1997 1998 1999Category GOP ADB Total GOP ADB Total GOP ADB Total
Exchange rate 29.47 40.89 39.09 ADB % split A. Civil Works 59% Foreign 0 0 0 0 0 0 41% Local 209,367 209,367 2,018,557 2,018,557 24,063,090 24,063,090 Total Civil Works 209,367 209,367 2,018,557 2,018,557 24,063,090 24,063,090 B. Non-Civil Works 48% Foreign 493,438 493,438 13,118,724 13,118,724 11,492,308 11,492,308 52% Local 5,627,000 0 5,627,000 14,492,000 17,231,742 31,723,742 21,354,000 22,080,893 43,434,893 Total Non-Civil Works Total 5,627,000 493,438 6,120,438 14,492,000 30,350,466 44,842,466 21,354,000 33,573,201 54,927,201
Total Costs 53% Foreign 0 493,438 493,438 0 13,118,724 13,118,724 0 11,492,308 11,492,308 47% Local 5,836,367 0 5,836,367 16,510,557 17,231,742 33,742,298 45,417,090 22,080,893 67,497,983 Total 5,836,367 493,438 6,329,805 16,510,557 30,350,466 46,861,022 45,417,090 33,573,201 78,990,291 Adjust to 2005 Base A. Civil Works
Foreign (International MUV Index) 1.049 0 1.043 0 1.057 0 Local (Philippines CPI) 1.53 320,331 1.39 2,805,794 1.3 31,282,018
Total Civil Works in 2005 320,331 2,805,794 31,282,018 B. Non-Civil Works
Foreign 517,617 13,682,830 12,147,369 Local 8,609,310 44,096,001 56,465,360
Total Non-Civil Works in 2005 Values 9,126,927 57,778,830 68,612,730 Total Project Costs (2005 values) 9,447,258 60,584,624 99,894,748 Convert to Economic Costs A. Civil Works % SCF
1. Supplies and materials 70% 0.85 190,597 1,669,447 18,612,801 2. Labor (i) Skilled 5% 1.00 16,017 140,290 1,564,101 (ii) Unskilled 25% 0.65 52,054 455,941 5,083,328
Total Civil Works Economic Costs 258,667 2,265,678 25,260,229 B. Non-Civil Works 0.85 7,757,888 49,112,006 58,320,820 Total Project Economic Costs 8,016,555 51,377,684 83,581,050
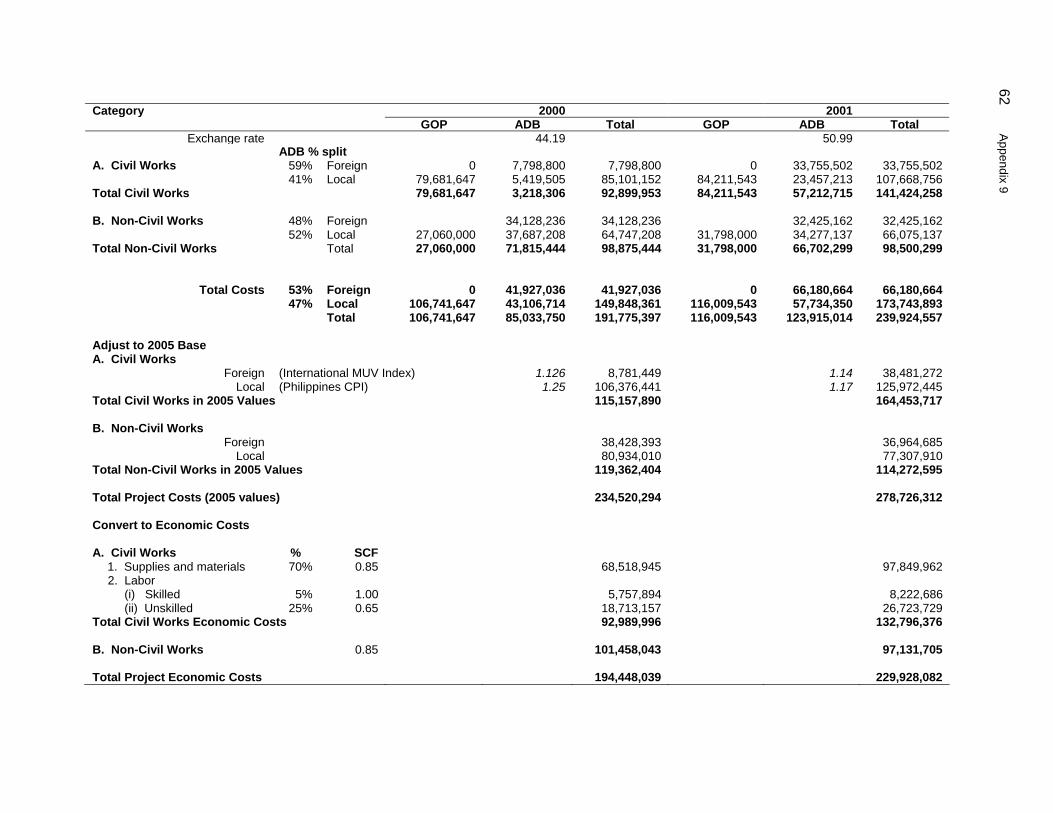
62 Appendix 9
Category 2000 2001
GOP ADB Total GOP ADB TotalExchange rate 44.19 50.99
ADB % split A. Civil Works 59% Foreign 0 7,798,800 7,798,800 0 33,755,502 33,755,502 41% Local 79,681,647 5,419,505 85,101,152 84,211,543 23,457,213 107,668,756 Total Civil Works 79,681,647 3,218,306 92,899,953 84,211,543 57,212,715 141,424,258 B. Non-Civil Works 48% Foreign 34,128,236 34,128,236 32,425,162 32,425,162 52% Local 27,060,000 37,687,208 64,747,208 31,798,000 34,277,137 66,075,137 Total Non-Civil Works Total 27,060,000 71,815,444 98,875,444 31,798,000 66,702,299 98,500,299
Total Costs 53% Foreign 0 41,927,036 41,927,036 0 66,180,664 66,180,664 47% Local 106,741,647 43,106,714 149,848,361 116,009,543 57,734,350 173,743,893 Total 106,741,647 85,033,750 191,775,397 116,009,543 123,915,014 239,924,557 Adjust to 2005 Base A. Civil Works
Foreign (International MUV Index) 1.126 8,781,449 1.14 38,481,272 Local (Philippines CPI) 1.25 106,376,441 1.17 125,972,445
Total Civil Works in 2005 Values 115,157,890 164,453,717 B. Non-Civil Works
Foreign 38,428,393 36,964,685 Local 80,934,010 77,307,910
Total Non-Civil Works in 2005 Values 119,362,404 114,272,595 Total Project Costs (2005 values) 234,520,294 278,726,312 Convert to Economic Costs A. Civil Works % SCF
1. Supplies and materials 70% 0.85 68,518,945 97,849,962 2. Labor (i) Skilled 5% 1.00 5,757,894 8,222,686 (ii) Unskilled 25% 0.65 18,713,157 26,723,729
Total Civil Works Economic Costs 92,989,996 132,796,376 B. Non-Civil Works 0.85 101,458,043 97,131,705 Total Project Economic Costs 194,448,039 229,928,082
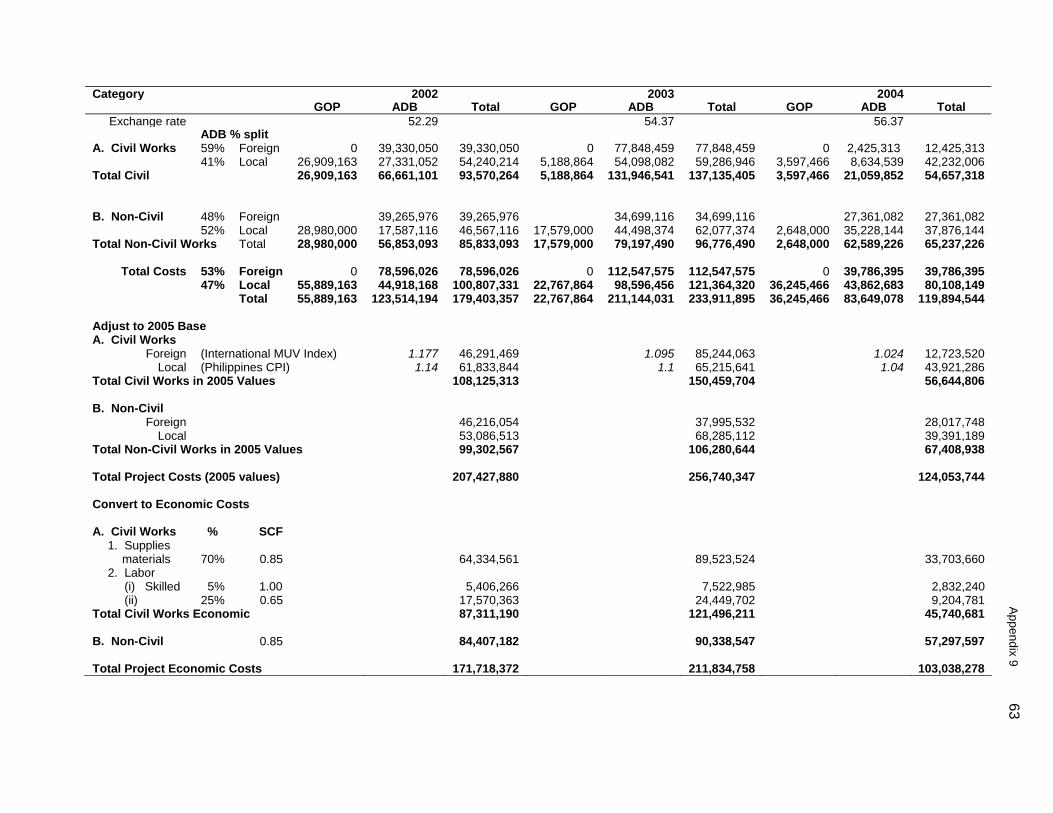
Appendix 9 63
Category 2002 2003 2004 GOP ADB Total GOP ADB Total GOP ADB Total
Exchange rate 52.29 54.37 56.37 ADB % split A. Civil Works 59% Foreign 0 39,330,050 39,330,050 0 77,848,459 77,848,459 0 2,425,313 12,425,313 41% Local 26,909,163 27,331,052 54,240,214 5,188,864 54,098,082 59,286,946 3,597,466 8,634,539 42,232,006 Total Civil 26,909,163 66,661,101 93,570,264 5,188,864 131,946,541 137,135,405 3,597,466 21,059,852 54,657,318 B. Non-Civil 48% Foreign 39,265,976 39,265,976 34,699,116 34,699,116 27,361,082 27,361,082 52% Local 28,980,000 17,587,116 46,567,116 17,579,000 44,498,374 62,077,374 2,648,000 35,228,144 37,876,144 Total Non-Civil Works Total 28,980,000 56,853,093 85,833,093 17,579,000 79,197,490 96,776,490 2,648,000 62,589,226 65,237,226
Total Costs 53% Foreign 0 78,596,026 78,596,026 0 112,547,575 112,547,575 0 39,786,395 39,786,395 47% Local 55,889,163 44,918,168 100,807,331 22,767,864 98,596,456 121,364,320 36,245,466 43,862,683 80,108,149 Total 55,889,163 123,514,194 179,403,357 22,767,864 211,144,031 233,911,895 36,245,466 83,649,078 119,894,544 Adjust to 2005 Base A. Civil Works
Foreign (International MUV Index) 1.177 46,291,469 1.095 85,244,063 1.024 12,723,520 Local (Philippines CPI) 1.14 61,833,844 1.1 65,215,641 1.04 43,921,286
Total Civil Works in 2005 Values 108,125,313 150,459,704 56,644,806 B. Non-Civil
Foreign 46,216,054 37,995,532 28,017,748 Local 53,086,513 68,285,112 39,391,189
Total Non-Civil Works in 2005 Values 99,302,567 106,280,644 67,408,938 Total Project Costs (2005 values) 207,427,880 256,740,347 124,053,744 Convert to Economic Costs A. Civil Works % SCF
1. Supplies materials 70% 0.85 64,334,561 89,523,524 33,703,660
2. Labor (i) Skilled 5% 1.00 5,406,266 7,522,985 2,832,240 (ii) 25% 0.65 17,570,363 24,449,702 9,204,781
Total Civil Works Economic 87,311,190 121,496,211 45,740,681 B. Non-Civil 0.85 84,407,182 90,338,547 57,297,597 Total Project Economic Costs 171,718,372 211,834,758 103,038,278
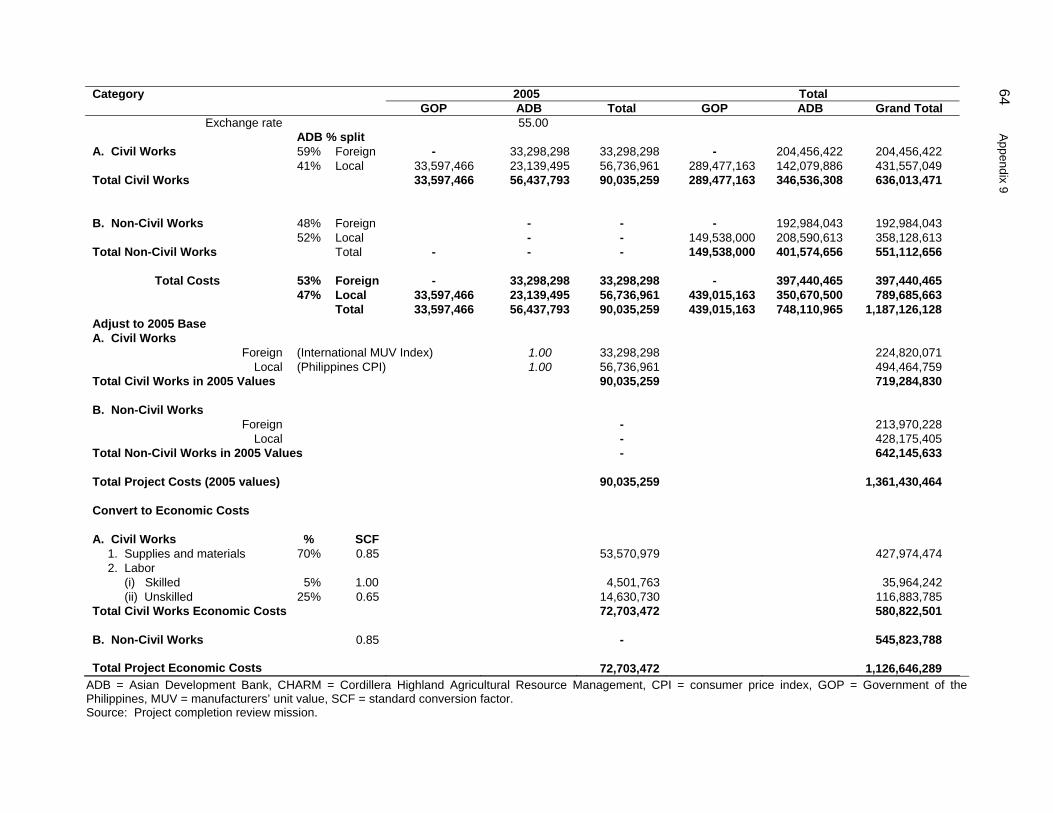
64 Appendix 9
ADB = Asian Development Bank, CHARM = Cordillera Highland Agricultural Resource Management, CPI = consumer price index, GOP = Government of the Philippines, MUV = manufacturers’ unit value, SCF = standard conversion factor. Source: Project completion review mission.
Category 2005 Total GOP ADB Total GOP ADB Grand Total
Exchange rate 55.00 ADB % split A. Civil Works 59% Foreign - 33,298,298 33,298,298 - 204,456,422 204,456,422 41% Local 33,597,466 23,139,495 56,736,961 289,477,163 142,079,886 431,557,049 Total Civil Works 33,597,466 56,437,793 90,035,259 289,477,163 346,536,308 636,013,471 B. Non-Civil Works 48% Foreign - - - 192,984,043 192,984,043 52% Local - - 149,538,000 208,590,613 358,128,613 Total Non-Civil Works Total - - - 149,538,000 401,574,656 551,112,656
Total Costs 53% Foreign - 33,298,298 33,298,298 - 397,440,465 397,440,465 47% Local 33,597,466 23,139,495 56,736,961 439,015,163 350,670,500 789,685,663 Total 33,597,466 56,437,793 90,035,259 439,015,163 748,110,965 1,187,126,128 Adjust to 2005 Base A. Civil Works
Foreign (International MUV Index) 1.00 33,298,298 224,820,071 Local (Philippines CPI) 1.00 56,736,961 494,464,759
Total Civil Works in 2005 Values 90,035,259 719,284,830 B. Non-Civil Works
Foreign - 213,970,228 Local - 428,175,405
Total Non-Civil Works in 2005 Values - 642,145,633 Total Project Costs (2005 values) 90,035,259 1,361,430,464 Convert to Economic Costs A. Civil Works % SCF
1. Supplies and materials 70% 0.85 53,570,979 427,974,474 2. Labor (i) Skilled 5% 1.00 4,501,763 35,964,242 (ii) Unskilled 25% 0.65 14,630,730 116,883,785
Total Civil Works Economic Costs 72,703,472 580,822,501 B. Non-Civil Works 0.85 - 545,823,788 Total Project Economic Costs 72,703,472 1,126,646,289
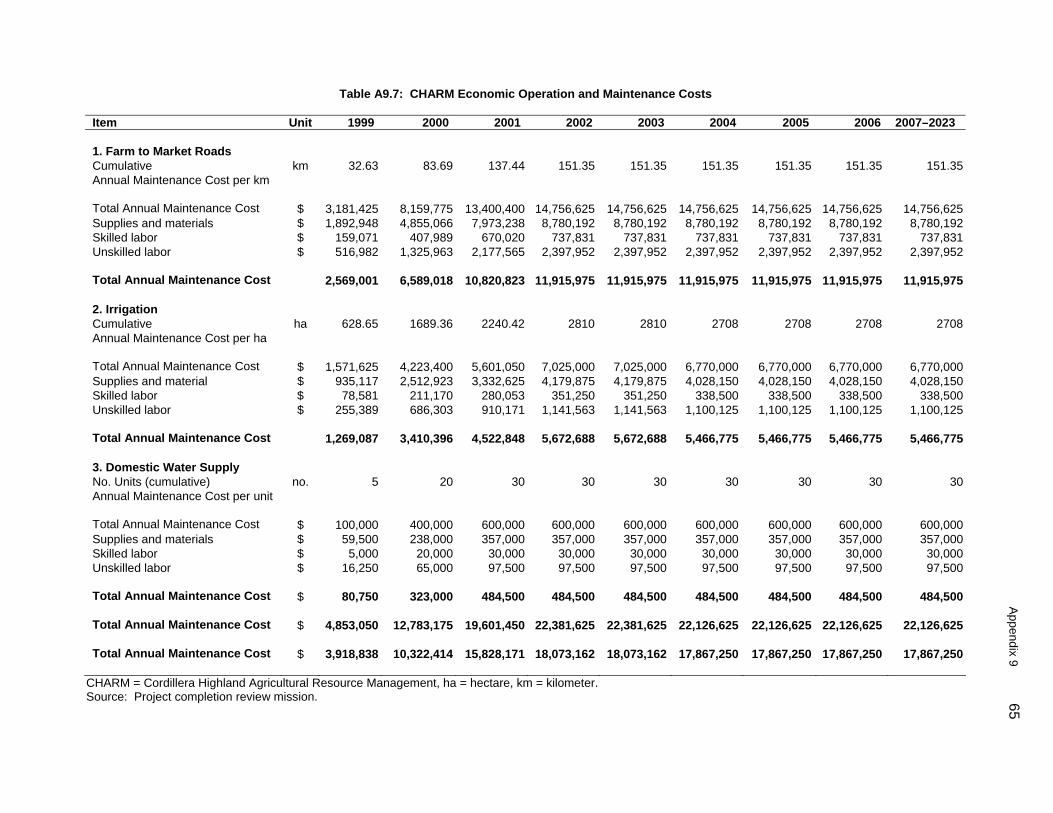
Appendix 9 65
Table A9.7: CHARM Economic Operation and Maintenance Costs Item Unit 1999 2000 2001 2002 2003 2004 2005 2006 2007–2023 1. Farm to Market Roads Cumulative km 32.63 83.69 137.44 151.35 151.35 151.35 151.35 151.35 151.35Annual Maintenance Cost per km Total Annual Maintenance Cost $ 3,181,425 8,159,775 13,400,400 14,756,625 14,756,625 14,756,625 14,756,625 14,756,625 14,756,625Supplies and materials $ 1,892,948 4,855,066 7,973,238 8,780,192 8,780,192 8,780,192 8,780,192 8,780,192 8,780,192Skilled labor $ 159,071 407,989 670,020 737,831 737,831 737,831 737,831 737,831 737,831Unskilled labor $ 516,982 1,325,963 2,177,565 2,397,952 2,397,952 2,397,952 2,397,952 2,397,952 2,397,952 Total Annual Maintenance Cost 2,569,001 6,589,018 10,820,823 11,915,975 11,915,975 11,915,975 11,915,975 11,915,975 11,915,975 2. Irrigation Cumulative ha 628.65 1689.36 2240.42 2810 2810 2708 2708 2708 2708Annual Maintenance Cost per ha Total Annual Maintenance Cost $ 1,571,625 4,223,400 5,601,050 7,025,000 7,025,000 6,770,000 6,770,000 6,770,000 6,770,000Supplies and material $ 935,117 2,512,923 3,332,625 4,179,875 4,179,875 4,028,150 4,028,150 4,028,150 4,028,150Skilled labor $ 78,581 211,170 280,053 351,250 351,250 338,500 338,500 338,500 338,500Unskilled labor $ 255,389 686,303 910,171 1,141,563 1,141,563 1,100,125 1,100,125 1,100,125 1,100,125 Total Annual Maintenance Cost 1,269,087 3,410,396 4,522,848 5,672,688 5,672,688 5,466,775 5,466,775 5,466,775 5,466,775 3. Domestic Water Supply No. Units (cumulative) no. 5 20 30 30 30 30 30 30 30Annual Maintenance Cost per unit Total Annual Maintenance Cost $ 100,000 400,000 600,000 600,000 600,000 600,000 600,000 600,000 600,000Supplies and materials $ 59,500 238,000 357,000 357,000 357,000 357,000 357,000 357,000 357,000Skilled labor $ 5,000 20,000 30,000 30,000 30,000 30,000 30,000 30,000 30,000Unskilled labor $ 16,250 65,000 97,500 97,500 97,500 97,500 97,500 97,500 97,500 Total Annual Maintenance Cost $ 80,750 323,000 484,500 484,500 484,500 484,500 484,500 484,500 484,500 Total Annual Maintenance Cost $ 4,853,050 12,783,175 19,601,450 22,381,625 22,381,625 22,126,625 22,126,625 22,126,625 22,126,625 Total Annual Maintenance Cost $ 3,918,838 10,322,414 15,828,171 18,073,162 18,073,162 17,867,250 17,867,250 17,867,250 17,867,250
CHARM = Cordillera Highland Agricultural Resource Management, ha = hectare, km = kilometer. Source: Project completion review mission.
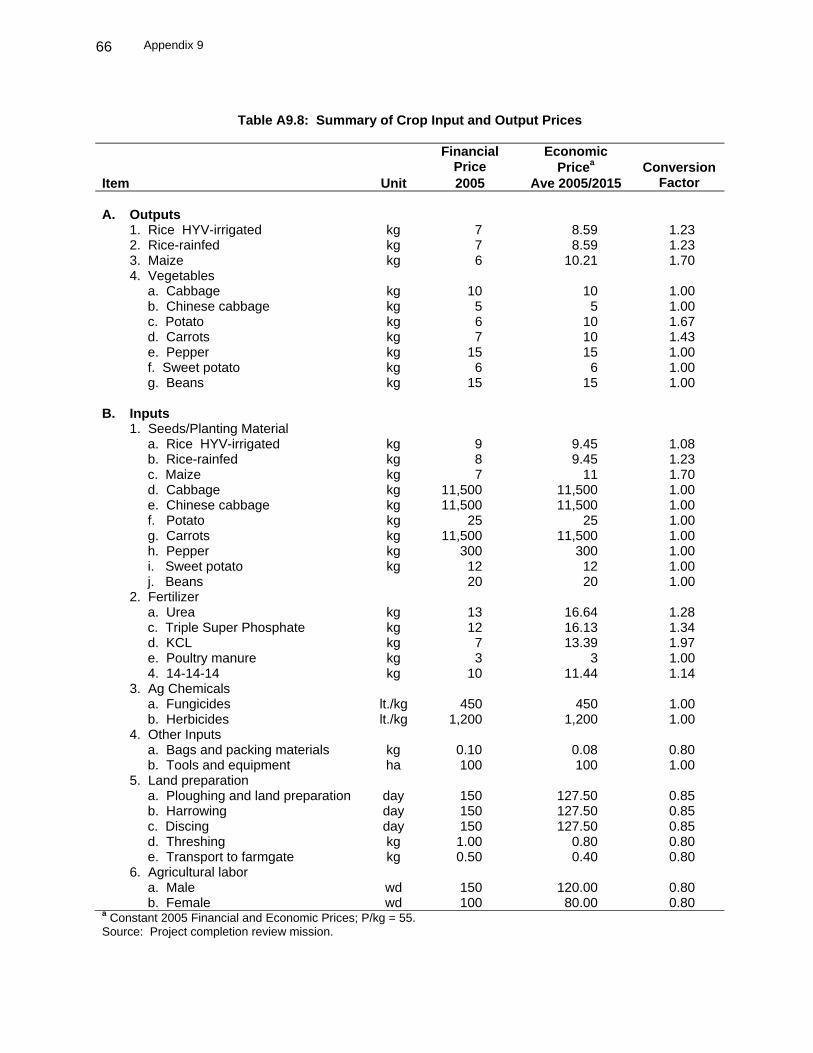
Appendix 9
66
Table A9.8: Summary of Crop Input and Output Prices
Economic
Financial Price Pricea
Item Unit 2005 Ave 2005/2015 Conversion
Factor A. Outputs 1. Rice HYV-irrigated kg 7 8.59 1.23 2. Rice-rainfed kg 7 8.59 1.23 3. Maize kg 6 10.21 1.70 4. Vegetables a. Cabbage kg 10 10 1.00 b. Chinese cabbage kg 5 5 1.00 c. Potato kg 6 10 1.67 d. Carrots kg 7 10 1.43 e. Pepper kg 15 15 1.00 f. Sweet potato kg 6 6 1.00 g. Beans kg 15 15 1.00 B. Inputs 1. Seeds/Planting Material a. Rice HYV-irrigated kg 9 9.45 1.08 b. Rice-rainfed kg 8 9.45 1.23 c. Maize kg 7 11 1.70 d. Cabbage kg 11,500 11,500 1.00 e. Chinese cabbage kg 11,500 11,500 1.00 f. Potato kg 25 25 1.00 g. Carrots kg 11,500 11,500 1.00 h. Pepper kg 300 300 1.00 i. Sweet potato kg 12 12 1.00 j. Beans 20 20 1.00 2. Fertilizer a. Urea kg 13 16.64 1.28 c. Triple Super Phosphate kg 12 16.13 1.34 d. KCL kg 7 13.39 1.97 e. Poultry manure kg 3 3 1.00 4. 14-14-14 kg 10 11.44 1.14 3. Ag Chemicals a. Fungicides lt./kg 450 450 1.00 b. Herbicides lt./kg 1,200 1,200 1.00 4. Other Inputs a. Bags and packing materials kg 0.10 0.08 0.80 b. Tools and equipment ha 100 100 1.00 5. Land preparation a. Ploughing and land preparation day 150 127.50 0.85 b. Harrowing day 150 127.50 0.85 c. Discing day 150 127.50 0.85 d. Threshing kg 1.00 0.80 0.80 e. Transport to farmgate kg 0.50 0.40 0.80 6. Agricultural labor a. Male wd 150 120.00 0.80 b. Female wd 100 80.00 0.80 a Constant 2005 Financial and Economic Prices; P/kg = 55. Source: Project completion review mission.
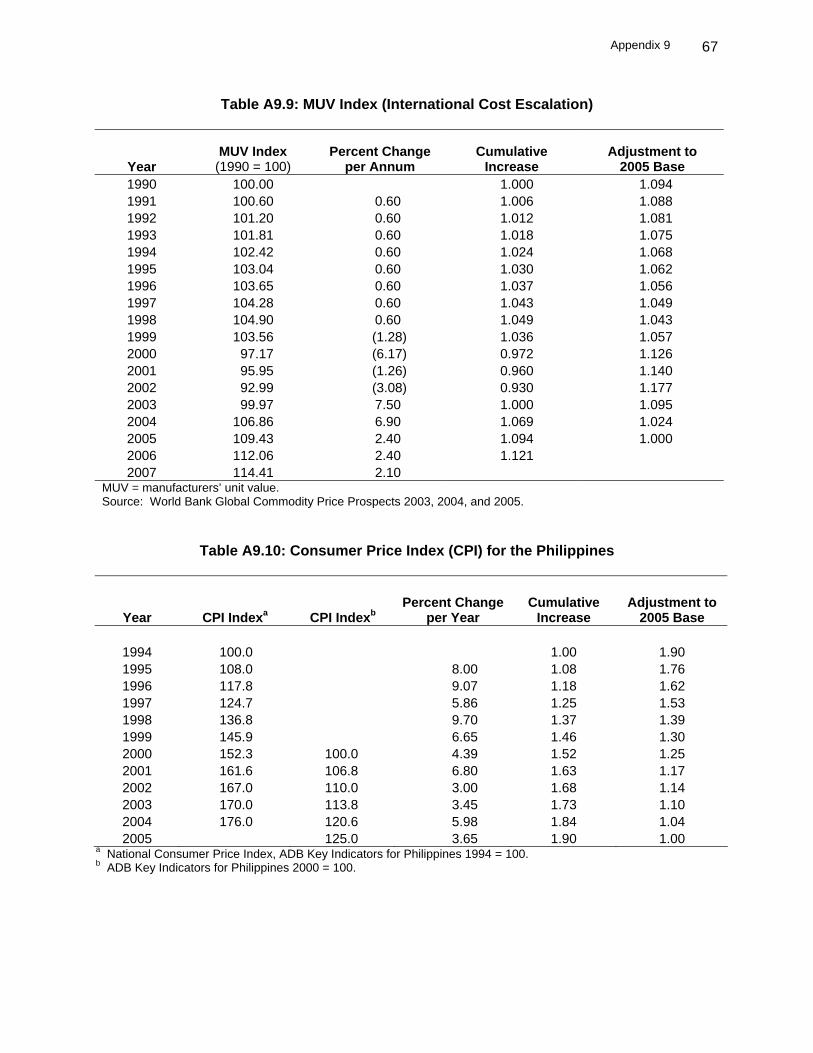
Appendix 9
67
Table A9.9: MUV Index (International Cost Escalation)
Year MUV Index
(1990 = 100) Percent Change
per Annum Cumulative
Increase Adjustment to
2005 Base 1990 100.00 1.000 1.094 1991 100.60 0.60 1.006 1.088 1992 101.20 0.60 1.012 1.081 1993 101.81 0.60 1.018 1.075 1994 102.42 0.60 1.024 1.068 1995 103.04 0.60 1.030 1.062 1996 103.65 0.60 1.037 1.056 1997 104.28 0.60 1.043 1.049 1998 104.90 0.60 1.049 1.043 1999 103.56 (1.28) 1.036 1.057 2000 97.17 (6.17) 0.972 1.126 2001 95.95 (1.26) 0.960 1.140 2002 92.99 (3.08) 0.930 1.177 2003 99.97 7.50 1.000 1.095 2004 106.86 6.90 1.069 1.024 2005 109.43 2.40 1.094 1.000 2006 112.06 2.40 1.121 2007 114.41 2.10
MUV = manufacturers’ unit value. Source: World Bank Global Commodity Price Prospects 2003, 2004, and 2005.
Table A9.10: Consumer Price Index (CPI) for the Philippines
Year CPI Indexa CPI Indexb Percent Change
per Year Cumulative
Increase Adjustment to
2005 Base
1994 100.0 1.00 1.90 1995 108.0 8.00 1.08 1.76 1996 117.8 9.07 1.18 1.62 1997 124.7 5.86 1.25 1.53 1998 136.8 9.70 1.37 1.39 1999 145.9 6.65 1.46 1.30 2000 152.3 100.0 4.39 1.52 1.25 2001 161.6 106.8 6.80 1.63 1.17 2002 167.0 110.0 3.00 1.68 1.14 2003 170.0 113.8 3.45 1.73 1.10 2004 176.0 120.6 5.98 1.84 1.04 2005 125.0 3.65 1.90 1.00
a National Consumer Price Index, ADB Key Indicators for Philippines 1994 = 100. b ADB Key Indicators for Philippines 2000 = 100.