Embed Size (px)
Citation preview

Copyright
by
Colin Healey Smith
2012

The Dissertation Committee for Colin Healey Smith certifies that this is the
approved version of the following dissertation:
Studies of Rich and Ultra-Rich Combustion for Syngas Production
Committee:
Janet Ellzey, Supervisor
Ofodike A Ezekoye
Carlos H Hidrovo
Halil Berberoglu
Laxminarayan L Raja
Studies of Rich and Ultra-Rich Combustion for Syngas Production
by
Colin Healey Smith, B.S.; M.S.E.
Dissertation
Presented to the Faculty of the Graduate School of
The University of Texas at Austin
in Partial Fulfillment
of the Requirements
for the Degree of
Doctor of Philosophy
The University of Texas at Austin
December 2012

Dedication
To my family
v
Acknowledgements
I was born with near-perfect parents who, crucially, have always been
tremendously supportive and always allowed me to think and express myself freely.
Another accident of birth is having my sister who has been a source of inspiration, and
my older brothers who have been generous. I have been tremendously lucky to cross
paths with some brilliant, well-rounded, challenging people who have contributed a
tremendous amount to my growth as a person and as an engineer/scientist. I cannot
imagine life, never mind finishing this degree, without my best friends: Richard
Sweeney, Kurt Lavetti, Michael Sienkiewicz, Paul White, Brent Castle and Conan Zhang.
These people have made me who I am, and though there are seven billion people on this
planet, I really feel I’ve come across some of the very best.
I’ve also been lucky to have some tremendous personal, academic and
professional support through the years. Cathy Salvo and Joel Herskowitz have been
major influences in my life, and I will never forget their generosity and caring. At Cornell
Frederick Gouldin, Matthew Miller, Charles Sinclair and Elizabeth Fisher taught me
incalculably valuable lessons in life, science and research. Adam Art was the only reason
my time at Raytheon was more than bearable.
At UT I’ve had the pleasure of working with some very talented and driven
undergraduate researchers. Daniel Pineda, Casey Zak, Liane Miller and Tommy Browder
deserve a tremendous amount of credit for the work reported in this document. I’m lucky
to have joined the same research group as Ingmar Schoegl, who taught me so much,
Daniel Leahey who is a great friend and co-author, and Erica Belmont who has been a
pleasure to work alongside. Brian Carroll, Patrick Jurney, Mohammad Mehrmohammadi,
Esfandiar Khatiblou, Stuart Cohen, Michael Pierce, Amanda Lanza, Thomas Lewis, Ben

vi
Gully and Todd Davidson are all good friends and helped me along, in various ways, in
my research and learning. I acknowledge my committee, Dr. Ezekoye, Dr. Hidrovo, Dr.
Berberoglu and Dr. Raja for their guidance and useful criticism. Dr. Ezekoye, in
particular, has had a great influence on me, and I will always look up to him. Other
professors at UT have aided me in various ways. Dr. Clemens, Dr. Bogard, Dr. Schmidt,
Dr. Hall, Dr. Howell, Dr. Matthews, Dr. Kovar and Dr. Webber have always been willing
to chat with me about research, fluid mechanics, ceramic materials, radiation or whatever.
Dr. Webber co-advised me for my MS degree, and I owe him a great debt for his support,
encouragement and advice throughout my entire time at UT.
Selecting an advisor is a decision quite fraught with uncertainty, so without
knowing quite what I was getting into, I became Dr. Ellzey’s student; what a great stroke
of luck. Dr. Ellzey is unbelievably wise, smart and patient. Critical to my development as
a researcher, she allowed me to make mistakes from which I would learn, but not to make
mistakes that would really set me back. Very important to me, she gave me the freedom
to experiment in the lab and even to take philosophy classes, which kept me sane during
five years of Thermal/Fluid Systems. Though extraordinarily busy even for a Professor,
she always spent the time to know what I was working on and help me come up with
ideas and work through technical problems. She also managed to weather my
organizational skills, procrastination and sometimes lazy writing. Put simply and
honestly, I cannot imagine having a better advisor than Dr. Ellzey.
I admit that I chose to work hard to write this dissertation and finish this degree.
However, as I’ve described, the path was pretty easy given all of the good fortune I’ve
stumbled upon. And that means I have to acknowledge the role of luck in my completing
this work.

vii
Studies of Rich and Ultra-Rich Combustion for Syngas Production
Colin Healey Smith, PhD
The University of Texas at Austin, 2012
Supervisor: Janet L. Ellzey
Syngas is a mixture of hydrogen (H2), carbon monoxide (CO) and other species
including nitrogen (N2), water (H2O), methane (CH4) and higher hydrocarbons. Syngas is
a highly desired product because it is very versatile. It can be used for combustion in
turbines or engines, converted to H2 for use in fuel cells, turned into diesel or other high-
molecular weight fuels by the Fischer-Tropsch process and used as a chemical feedstock.
Syngas can be derived from hydrocarbons in the presence of oxidizer or water as in steam
reforming. There are many demonstrated methods to produce syngas with or without
water addition including catalytic methods, plasma reforming and combustion.
The goal of this study is to add to the understanding of non-catalytic conversion
of hydrocarbon fuels to syngas, and this was accomplished through two investigations:
the first on fuel conversion potential and the second on the effect of preheat temperature.
A primarily experimental investigation of the conversion of jet fuel and butanol to
syngas was undertaken to understand the potential of these fuels for conversion. With
these new data and previously-published experimental data, a comparison amongst a
larger set of fuels for conversion was also conducted. Significant soot formation was
observed in experiments with both fuels, but soot formation was so significant in the jet
viii
fuel experiments that it limited the range of experimental operating conditions. The
comparison amongst fuels indicated that higher conversion rates are observed with
smaller molecular weight fuels, generally. However, equilibrium calculations, which are
often used to determine trends in fuel conversion, showed the opposite trend.
In order to investigate preheat temperature, which is one important aspect of non-
catalytic conversion, experiments were undertaken with burner-stabilized flames that are
effectively 1-D and steady-state. An extensive set of model calculations were compared
to the obtained experimental data and was used to investigate the effect of preheat
temperatures that were beyond what was achievable experimentally. Throughout the
range of operating conditions that were tested experimentally, the computational model
was excellent in its predictions. Experiments where the reactants were preheated showed
a significant expansion of the stable operating range of the burner (increasing the
equivalence ratio at which the flame blew off). However, increasing preheat temperature
beyond what is required for stabilization did not improve syngas yields.

ix
Table of Contents
Table of Contents
1 INTRODUCTION ...............................................................................................1
1.1 Combustion and Syngas......................................................................1
1.1 Flammability and Stability Limits ......................................................5
1.2 Combustion in Heat-Recirculating Reactors ....................................12
1.3 The Use of Heat-Recirculating Reactors for Syngas Production .....17
1.4 Objectives .........................................................................................18
1.5 Methodology .....................................................................................19
2 CONVERSION OF JET FUEL AND BUTANOL TO SYNGAS VIA FILTRATION
COMBUSTION ................................................................................................21
2.1 Introduction .......................................................................................21
2.2 Initial Experiments with Jet Fuel ......................................................22
3.2.1 Experimental Apparatus for Initial Experiments .........................23
2.2.1 Experimental Method ...................................................................26
2.2.2 Results and Discussion for Initial Experiments ...........................28
2.2.3 Conclusions for Initial Experiments ............................................48
2.3 Experiments with Re-Designed Experimental Apparatus ...............49
2.3.1 Experimental Apparatus ...............................................................49
2.3.2 Experimental Procedure ...............................................................53
2.3.3 Results and Discussion ................................................................54

x
2.4 Concluding Remarks Regarding the Conversion of Jet Fuel and Butanol
to Syngas ...........................................................................................79
3 RICH COMBUSTION FOR SYNGAS PRODUCTION: THE EFFECT OF PREHEAT ON
BURNER-STABILIZED FLAMES .....................................................................82
3.1 Analytical and Numerical Approach ................................................85
3.2 Experimental Approach ....................................................................92
3.2.1 Experimental Apparatus ...............................................................92
3.2.2 Chemiluminescence Measurement and Standoff Distance ..........95
3.2.3 Species Measurement ...................................................................99
3.2.4 Determination of Flame Flatness ...............................................101
3.3 Results and Discussion ...................................................................104
3.3.1 Comparison of Experimental and Numerical Modeling Data ...105
3.3.2 Effect of Preheating on the Conversion of Rich Mixtures to Syngas
112
3.4 Concluding Remarks Regarding the Effect of Preheat on Burner-
Stabilized Flames ............................................................................122
4 CONCLUSIONS AND RECOMMENDATIONS ..................................................125
5 APPENDIX A: UNCERTAINTY ......................................................................128
6 BIBLIOGRAPHY ...........................................................................................133
1
1 INTRODUCTION
1.1 Combustion and Syngas
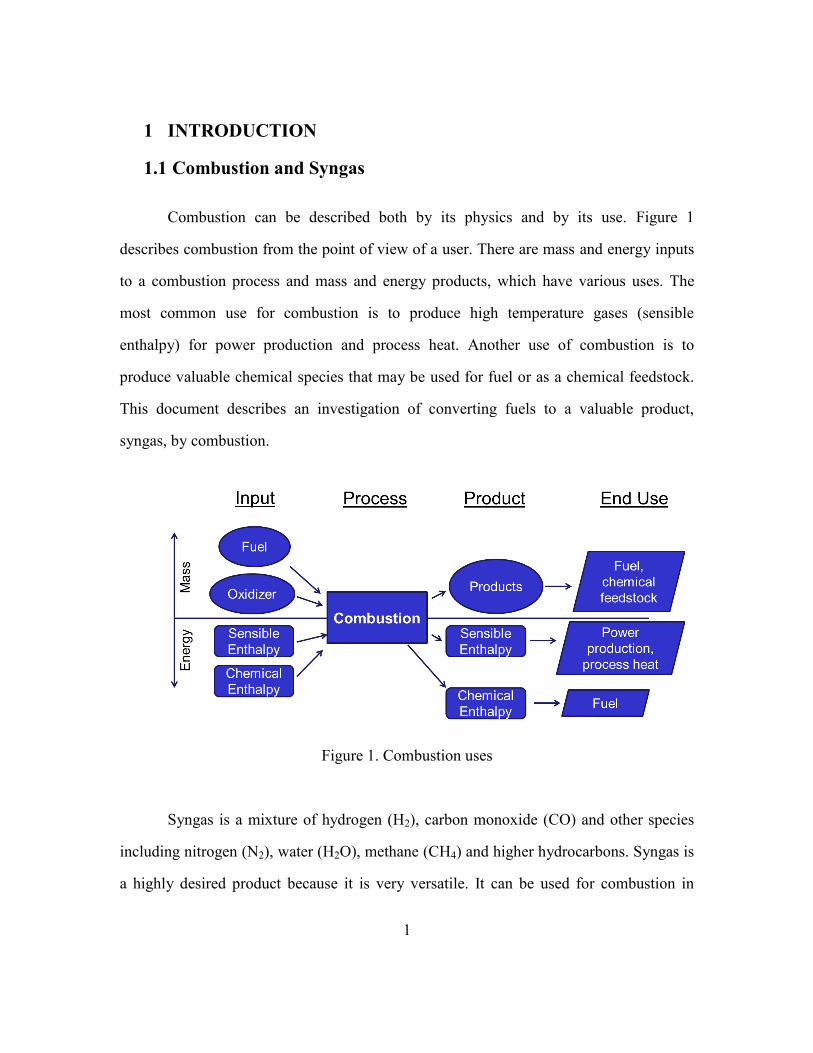
Combustion can be described both by its physics and by its use. Figure 1
describes combustion from the point of view of a user. There are mass and energy inputs
to a combustion process and mass and energy products, which have various uses. The
most common use for combustion is to produce high temperature gases (sensible
enthalpy) for power production and process heat. Another use of combustion is to
produce valuable chemical species that may be used for fuel or as a chemical feedstock.
This document describes an investigation of converting fuels to a valuable product,
syngas, by combustion.
Figure 1. Combustion uses
Syngas is a mixture of hydrogen (H2), carbon monoxide (CO) and other species
including nitrogen (N2), water (H2O), methane (CH4) and higher hydrocarbons. Syngas is
a highly desired product because it is very versatile. It can be used for combustion in

2
turbines or engines, converted to H2 for use in fuel cells, turned into diesel or other high-
molecular weight fuels by the Fischer-Tropsch process and used as a chemical feedstock
[1].
Figure 2. Fuel versatility and conversion technology efficiency [2]. Image from [3]
Various types of fuels and their respective applications are shown in Figure 2. In
this figure, the lines that link the fuels with the conversion technologies indicate which
fuels may be used with which conversion technologies. Solid lines indicate that a fuel can
easily be used with a particular technology and dashed lines indicate that a fuel can be
used with a conversion technology in some cases. Solid fuels are only appropriate when
the heat source can be isolated from all moving parts such as for steam boilers whereas
liquid fuels can be injected into the combustion chamber as in engines and gas turbines.
Gaseous fuels, including syngas and hydrogen, may be used in all of these applications.as
3
well as in fuel cells. In addition to being a fuel for power generation devices, syngas is a
feedstock for chemical processing and the petrochemical industry.
Syngas can be derived from hydrocarbons in the presence of oxidizer or water as
in steam reforming [4]. There are many demonstrated methods to produce syngas with or
without water addition including catalytic methods [5], plasma reforming [6] and
combustion [7]. A recent review of these methods can be found in the literature [8].
Catalytic conversion is the most popular method for converting fuels to syngas. In
particular, catalytic steam reforming of methane is relatively well-understood and
efficient [1]. However, there are drawbacks to using catalysts. They are expensive, prone
to degradation, inflexible in feedstock and operating conditions and can be poisoned or
deactivated by compounds in the reactants and soot deposition [9-11]. Regardless of
conversion method, syngas is produced by reacting rich hydrocarbon air mixtures and the
actual degree of conversion is determined by a variety of factors. Equilibrium
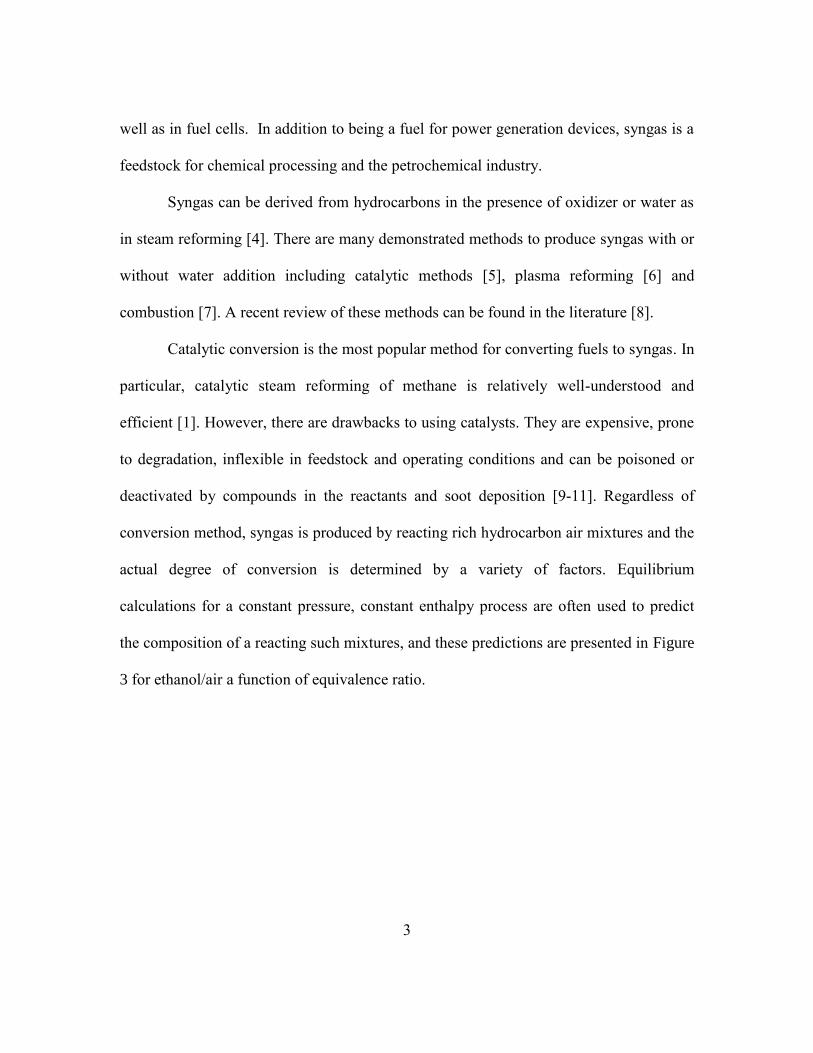
calculations for a constant pressure, constant enthalpy process are often used to predict
the composition of a reacting such mixtures, and these predictions are presented in Figure
3 for ethanol/air a function of equivalence ratio.

4
Figure 3. Concentration vs. Equivalence Ratio for ethanol/air (thickness of section in
ordinate indicates concentration of species)
Near φ = 1, almost all carbon and hydrogen are almost entirely converted to CO2
and H2O, respectively. At φ < 1 (lean) oxygen is observed in the product species. At φ >
1 (rich) CO and H2 have substantial concentrations. Although equilibrium predicts
significant concentrations of these species, very rich mixtures may not release enough
heat to produce temperatures high enough for self-sustained chemical reaction. To
maximize syngas production, then, reaction rates must be increased for self-sustaining
reaction of the mixture.
5
1.1 Flammability and Stability Limits
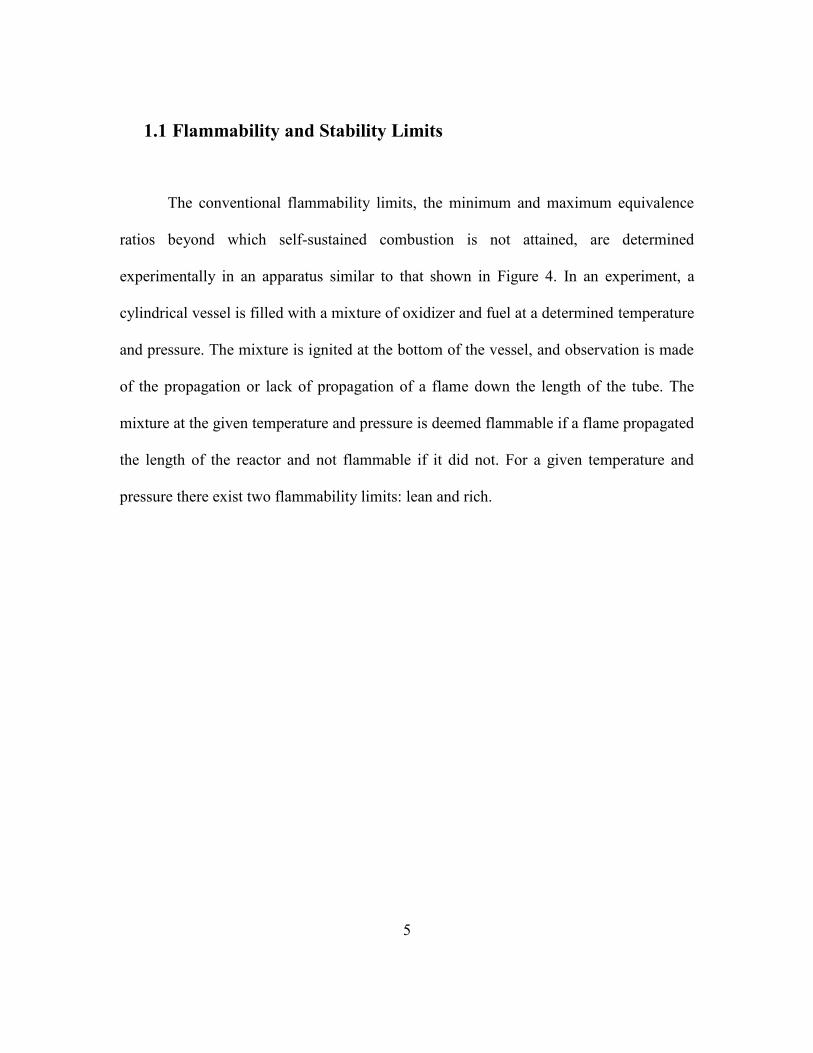
The conventional flammability limits, the minimum and maximum equivalence
ratios beyond which self-sustained combustion is not attained, are determined
experimentally in an apparatus similar to that shown in Figure 4. In an experiment, a
cylindrical vessel is filled with a mixture of oxidizer and fuel at a determined temperature
and pressure. The mixture is ignited at the bottom of the vessel, and observation is made
of the propagation or lack of propagation of a flame down the length of the tube. The
mixture at the given temperature and pressure is deemed flammable if a flame propagated
the length of the reactor and not flammable if it did not. For a given temperature and
pressure there exist two flammability limits: lean and rich.

6
Figure 4. Graphic describing device for measuring the flammability limits of gas
mixtures
This type of apparatus has been used to determine the flammability of many fuels
under various conditions, and the most comprehensive list of flammability limits is
reported in the US bureau of mines survey [12]. For reference, some typical flammability
limits are given in Table 1 in terms of the conventional definition of equivalence ratio
and the normalized equivalence ratio. The (conventional) equivalence ratio is defined as:
(1)

7
where the stoichiometric ratio is the ratio of fuel to oxidizer that would produce only H2O
and CO2 as products.
Under this definition, the equivalence ratio varies from 0 (pure oxidizer) to
infinity (pure fuel) with = 1 indicating stoichiometric (neither lean nor rich). A less
often used definition of equivalence ratio is a normalization of the traditional definition:
(2)
Under this definition, at stoichiometric , for pure fuel , and for pure
oxidizer .
Table 1. A selection of flammability limits for fuels mixed with air at standard
temperature and pressure
Fuel Lean
(conventional)
Lean
(normalized)
Rich
(conventional)
Rich
(normalized)
Methane [13] 0.5 0.33 1.67 0.625
Propane [13] 0.56 0.36 2.7 0.73
N-heptane
[14]
0.58 0.37 3.77 0.79
Ethanol [13] 0.41 0.29 2.8 0.74
Butanol [14] 0.5 0.33 3.9 0.8
Jet fuel [15] 0.55 0.35 4.0 0.8
The rich flammability limits differ significantly amongst the fuels while the lean
limits differ less substantially, however this is a result of the definition of equivalence
ratio rather than an important physical phenomenon. For the normalized equivalence
ratios, the rich and lean limits are seen to be fairly symmetric about 0.5 (Table 1), and

8
though there is more variance in the rich limits amongst the fuels than seen in the lean
limits, the difference is much less pronounced in the normalized form.
There is no general theory of flammability limits though the analysis of Williams
based on energy considerations is illuminating [16]. The adiabatic flame temperature is a
critical parameter in determining the extinction conditions, which determine the
flammability limits. Near stoichiometric the adiabatic flame temperature is maximum,
and it decreases on either side of stoichiometric. If the adiabatic flame temperature of a
mixture is low enough a flame will not propagate down a flammability tube and the
flammability limit is established. Given the dependence of flammability limits on the
adiabatic flame temperature, there is one obvious way to broaden these limits: to increase
the initial temperature of the mixture, thus increasing the adiabatic flame temperature.
The dependence of adiabatic flame temperature on reactant temperature is shown in
Figure 5 for a methane/air mixture with an equivalence ratio of 1.25:

9
200 400 600 800 1000 12002000
2100
2200
2300
2400
2500
2600
Inlet Temperature (K)
Ad
iab
atic F
lam
e T
em
pe
ratu
re (
K)
Figure 5. Adiabatic flame temperature vs. reactant temperature for methane/air with φ =
1.25
The adiabatic flame temperature is almost exactly linear for this mixture in the
range of reactant temperatures considered. Though preheating always increases the
adiabatic flame temperature, this linear dependency is not strictly expected since the
specific heat of the products and the distribution of product species depend on the
adiabatic flame temperature. The reason for the dependence of flammability limits on
adiabatic flame temperature is because reaction rate depends exponentially on the
adiabatic flame temperature. Increasing the adiabatic flame temperature through preheat
is a means to increase the reaction rate.
10
Though the adiabatic flame temperature is a critical parameter in determining the
flammability limits, transport phenomena are also relevant because the propagation of a
flame requires heat and mass transfer. The laminar flame speed of a mixture describes the
intensity of combustion as a consequence of both the adiabatic flame temperature and the
transport processes. Therefore, the laminar flame speed is also related to the flammability
limits; a rule of thumb is that a mixture with a laminar flame speed of 5 cm/s corresponds
approximately to a flammability limit [17].
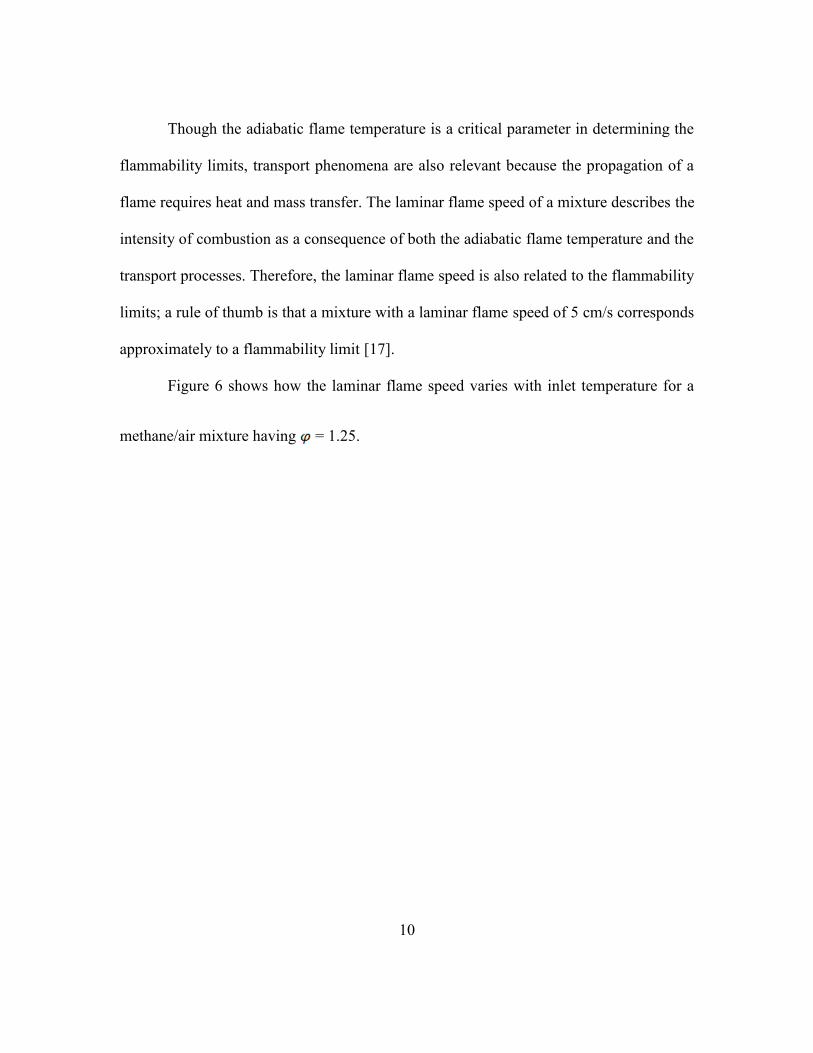
Figure 6 shows how the laminar flame speed varies with inlet temperature for a
methane/air mixture having = 1.25.

11
200 400 600 800 1000 12000
1
2
3
4
5
Inlet Temperature (K)
La
min
ar
Fla
me
Sp
ee
d (
m/s
)
Figure 6. Laminar flame speed vs inlet temperature for methane/air with φ = 1.25
As expected, the laminar flame speed increases with increasing reactant
temperature. This increase is nonlinear, unlike the adiabatic flame temperature, indicating
that factors other than the adiabatic flame temperature are important in flame
propagation. With an increase in preheat temperature from 300 K to 600 K, the adiabatic
flame temperature increases by about 200 K, but the laminar flame speed increases by
almost 4 times.
Flames propagate through premixed gases, so steady-state operation is achieved
by balancing convective motion of premixed gases with the propagation of a reaction
zone. The stability limits for a burner are often characterized in terms of flashback and
blowoff. Under flashback conditions, the flame speed is less than the convective speed of
12
the reactants resulting in the upstream propagation of the flame. For the reverse case
when the convective speed of the reactants is greater than the flame speed, the flame
propagates downstream and “blows off” the burner. Given a burner and a convection
condition, flashback and blowoff conditions may be found by varying the mixture
equivalence ratio; just like flammability limits, there are typically lean and rich blowoff
limits, and if flashback occurs near stoichiometric there are lean and rich equivalence
ratios that define the flashback range. The flame temperature strongly influences the
flammability limits, so non-adiabatic operation (either heat loss or heat addition) affects
the stability conditions.
1.2 Combustion in Heat-Recirculating Reactors
In a “free flame”, a reaction zone propagates into a mixture of fuel and oxidizer at
a certain speed, the laminar flame speed or laminar burning flux. The products are left at
the adiabatic flame temperature if the system is adiabatic. In contrast, in a heat
recirculating reactor (Figure 7) the reactants enter, release heat, and the hot products
circulate such that heat is transferred to the entering reactants. These preheated reactants
produce peak product temperatures that are higher than those in a free flame; that is, the
peak temperature is superadiabatic. These superadiabatic products lose heat to the
entering reactants and are at the adiabatic flame temperature at the exit of the reactor.

13
Figure 7. Graphic describing a generic heat-recirculating reactor
Since reactants are preheated before reaching the reaction zone, the flame speeds
are increased as shown in Figure 6. This reaction rate and flame speed enhancement
allows mixtures with equivalence ratios outside the conventional flammability limits to
burn and, if flashback is avoided, produces higher than normal burning fluxes. Both of
these properties can be used for interesting applications; therefore a significant amount of
work has been done with heat recirculating reactors.
The original idea of a heat recirculating reactor was developed in the 1960’s by
Felix Weinberg [18, 19] when studying the processes in smoldering cigarettes. Over the
next few decades [20-23], he and other researchers advanced the concept from both
theoretical and design perspectives. As described by Weinberg [24], there are many
possible designs for heat-recirculating reactors. Some of the more theoretical work

14
focused on combustion in a chamber where conducting rods or plates were introduced
[25]. Other designs include a swiss roll reactor [26] and a counterflow reactor [27] where
hot products and cool reactants are separated by a conducting wall. These designs feature
relatively simple fluid mechanics in contrast to flows that exist in other heat recirculating
reactors that are based on flow in porous media [28]. Two types of porous media reactors
are often studied: a 2-section burner [29-34] that operates at steady-state with a reaction
zone stabilized between two different types of porous media, and a filtration reactor [23,
35-40] with a reaction zone that often propagates relative to a solid porous medium.
The present study is focused on transient filtration combustion which is depicted
in Figure 8. The reactor is an insulated cylinder filled with a porous medium, which may
be a bed of individual particles [37] or reticulated ceramic foam [41].

15
Figure 8. Graphic describing heat transfer processes in filtration combustion
Fuel and oxidizer flow into the reactor and react within the pores resulting in heat
transfer to the solid matrix. Due to the temperature gradient, heat is transferred upstream
in the solid by conduction and radiation and then transferred to the incoming cold
reactants. The front may propagate upstream, downstream or remain stationary depending
on operating conditions and the properties of the solid. Maximum propagation speeds
observed in the filtration reactors examined in the present study are ~ 4 cm/s which is
significantly less than the flow velocities of ~30 cm/s. This propagation results in another
heat transfer mechanism because the front is moving through the heated solid.
Figure 9, which is a computational model solution for ethanol/air [42], shows the
gas temperature as a function of axial position for four different times. The equilibrium

16
temperature is ~1700 K, and the superadiabatic temperature spikes can be clearly seen in
each curve. The figure also shows that the preheat region expands as the front propagates
downstream.
0
500
1000
1500
2000
2500
0 5 10 15 20
Axial Position (cm)
Tem
peratu
re (
K) t=10
s
t=70s t=130s t=200s
Figure 9. Representative temperature vs. axial position for a reaction zone propagating
downstream in a filtration reactor. Figure taken with permission of the author from [42]
The superadiabatic temperatures make possible the combustion of mixtures far
outside the conventional flammability limits [43]. Theoretical analysis predicted no
flammability limit for filtration combustion [20], and experimental observations have
confirmed that stable combustion is achieved at both very rich and very lean conditions
[44]. The vast operating range associated with a filtration reactor is a feature that

17
distinguishes it from other types of heat-recirculating reactors, which typically produce
peak temperatures that are only slightly superadiabatic. Filtration combustion has been
the topic of multiple review papers [7, 45-47], and the detailed principles of operation can
be found in the literature [35, 48, 49].
1.3 The Use of Heat-Recirculating Reactors for Syngas Production
There have been many studies on the conversion of fuel to syngas using heat-
recirculating reactors. The earliest research on conversion of fuel to syngas was
completed by Kennedy from the University of Illinois at Chicago and coworkers. His
group and collaborators published multiple articles starting in 1998 with their study of the
conversion of methane to syngas using a filtration reactor [50]. Further studies were
conducted on methane [44, 51], hydrogen sulfide [52] and ethane and propane [53].
Conversion rates of methane to CO and H2 were reported at about 80% and 60%,
respectively, and they examined a very wide range of equivalence ratios (2 to 8) and
reactor pressures. The conversion rates for ethane and propane were similar to the
methane conversion rates with propane having slightly lower conversion. Ellzey and
coworkers investigated the conversion of methane [41, 54], ethanol [37] and heptane [39]
and several other articles on the conversion of methane have been published more
recently [55-58].
Some researchers have investigated the use of porous media reactors that operate
at steady-state for the conversion of fuels to syngas. In one design, a reaction stabilizes at
the interface of two sections of porous media that have different pore sizes or other
properties. The group of Mastorakos at the University of Cambridge experimented with

18
this type of reactor converting n-heptane and diesel in one study [59] and methanol,
methane, octane and petrol in another [31]. A reaction zone also may be stabilized in a
diverging channel [7]. Recently, Ellzey and coworkers have published results from the
conversion of methane [60] and heptane [61] to syngas in a counterflow reactor. In this
design, flames are stabilized in a counterflow heat exchanger in which reactants are
preheated by heat transfer from the products in a neighboring channel. These reactors,
which operate at steady state, have been shown to successfully convert fuels to syngas.
The range of equivalence ratios over which these reactors can operate, however, is
significantly smaller than that for filtration reactors.
1.4 Objectives
The primary goal of this study is to add to the understanding of non-catalytic
conversion hydrocarbon fuels to syngas. This is accomplished through experiments with
two different fuels in a filtration reactor and a comparison of these data with previously-
published experimental results with other fuels and equilibrium calculations. The other
means of contributing to the primary goal is to investigate the effect of preheat on syngas
production in simple, well-controlled burner-stabilized flames.
Jet fuel is widely-used across the world and in particular by the military. Butanol
can be produced from renewable sources [62], and is a proposed alternative to
hydrocarbon fuels. Though experimentation, the potential of these two fuels to be
converted to syngas by a noncatalytic method was investigated. With these data and data
from the literature an investigation of the effect of fuel type on syngas production was
conducted.

19
Combustion in heat-recirculating reactors is complex and especially complex in a
filtration reactor. Besides the gas phase reaction and transport, there is convection that
occurs between the gas and the solid and conduction and radiation within the solid.
Preheating of reactants is known to be a critical feature of a heat-recirculating reactor, but
temperature is not controlled in these reactors, so the specific effect of the preheat
temperature on syngas production is not known. In addition, the complexity of the
transport processes makes modeling difficult. Modeling work has shown significant
deviations from experimental data in terms of species predictions, but the reasons for this
are not known. The second contribution of this study is to understand the effect of preheat
on syngas production using flat, burner-stabilized flames. These burners do not have the
complex transport processes that occur in heat-recirculating reactors, so comparison with
model results can shed light on the reasons for the discrepancies observed in heat-
recirculating reactors.
1.5 Methodology
Experimentation with liquid fuels is more difficult than experimentation with
gaseous fuels because of the requirement of vaporization and mixing with air. In order to
complete the objectives, a new filtration reactor was constructed. This reactor was used to
study the transient filtration combustion of jet fuel and butanol. An analysis of the present
experimental data and the experimental data from the literature along with equilibrium
calculations and the results of computational modeling are used to perform a comparison
amongst fuels in terms of conversion potential. This work is discussed in chapter 2.
Flat flames were studied with two burners: a McKenna burner that is often used
for model comparison and a ceramic burner that was built to study flat flames with

20
preheated reactants. Extensive computational simulations were conducted with Cantera
and compared with experimental results to further investigate the effect of preheat. This
work is discussed in chapter 3.
21
2 CONVERSION OF JET FUEL AND BUTANOL TO SYNGAS
VIA FILTRATION COMBUSTION
2.1 Introduction
Although understanding of the combustion of rich mixtures is lacking, both
butanol and jet fuel have been studied extensively at more moderate equivalence ratios
(φ). Studies on butanol include basic investigations on flames [63], kinetic modeling [64,
65], combustion in engines [66], and catalytic combustion [67]. At rich conditions where
the interest is on the production of syngas, butanol research has focused on equilibrium
thermodynamic analysis [68-71], and conversion by catalytic methods [72-74].
At moderate φ, there has been significant work on jet fuel and other high
molecular weight fuels over the last two decades. Fundamental work on diffusion flames
[75, 76] and kinetic modeling [77, 78] has significantly advanced our understanding of
these complex fuels, as has work on cracking [79] and stability [80]. Equilibrium
analyses and computational studies [81] have shown the potential for syngas production
from jet fuel using various methods including catalysts [5, 11, 82-88] and plasmas [89].
Investigations of noncatalytic reforming have generally focused on reactors with
stationary reaction zones [90]. Soot formation is often a consideration when using these
fuels and their propensity to soot has been studied in various experimental configurations
including diffusion flames [77, 91, 92], pool fires [93, 94], and engine conditions [95-97].
Soot production in premixed flames has also been investigated at moderately rich φ [98,
22
99], but, as noted in the literature [100], very high equivalence ratios are difficult to study
because of flame instability.
As a demonstration and initial investigation of the principle of noncatalytic
conversion of jet fuel and butanol to syngas by transient filtration combustion, we
performed experiments over a range of rich equivalence ratios and inlet velocities (cold
gas). Both fuels are compared for syngas production potential and soot production, and a
comparison to other fuels is performed based on data found in the literature.
The following sections describe two sets of experiments. In one set jet fuel was
tested in multiple different types of porous media with significant degradation of porous
media observed. Soot formation was also observed at levels that produced reactor
clogging. Degradation and massive soot production were phenomena unique to jet fuel.
In the second set of experiments, the reactor was redesigned; both jet fuel and butanol
were successfully converted to syngas, though soot production remained an obstacle.
2.2 Initial Experiments with Jet Fuel
Initial experiments with jet fuel were attempted with multiple types of porous
media. The initial attempts showed that certain types of porous media degraded during
the combustion process. Experiments described in this section were performed with three
different reactors: a packed bed of aluminum oxide pellets, YZA (yttria stabilized
zirconia/alumina) porous ceramic and ZTM (zirconia toughened mullite) reticulated
porous ceramic.

23
3.2.1 EXPERIMENTAL APPARATUS FOR INITIAL EXPERIMENTS
The experimental apparatus (Figure 10) consisted of the reactor, the fuel
vaporization system, the reactant delivery system and the data acquisition system.
Figure 10. Experimental apparatus used in initial experiments with jet fuel
The reactor was an insulated cylinder of porous media, 20 cm long and 5.59 cm in
diameter. In our previous work in filtration combustion, various materials were used as
the porous medium. Alumina pellets of 3 mm in diameter have been successfully used by
24
the Ellzey group [37, 39] and others [50, 52] for various fuels. Two other materials YZA
(yttria stabilized zirconia/alumina) ceramic foam and ZTM (zirconia toughened mullite)
ceramic foam were also tested as porous media. Both YZA and ZTM have been used in
previous experimental work in our group [101, 102] for radiant burners operating at lean
conditions. YZA has also successfully been used in the Ellzey group for the conversion
of methane to syngas [41].
Zirconia (ZrO2), alumina (Al2O3) and mullite (Al6Si2O13) have melting points of
2717˚C [103], 2072˚C [104], 1840˚C [105], respectively, and temperatures in the type of
reactor that is employed here typically reach no more than 1800˚C. However, Mathis
[106] noted with regard to the ceramics (YZA and ZTM) that are used in this study that
“the manufacturer’s specifications indicate that the maximum exposure temperature for
YZA and ZTM it is 1870 K and 1920 K, respectively.” Since the manufacturer specifies a
lower temperature than typical peak temperatures in a reactor like this, material changes
or degradation seemed possible, if not likely.
The vaporization system consisted of an air-atomizing nozzle and a quartz
chamber for mixing. The atomized fuel droplets, approximately 20 microns in size, were
vaporized in a separate heated air stream in the quartz chamber. The base of the chamber,
which held the nozzle and air heater, was machined from stainless steel. The outer
surface of the quartz chamber was wrapped with resistance heaters and insulation to
prevent condensation of the fuel. Portions of the band heaters and insulation were
removable so that any potential condensation of the jet fuel could be observed.

25
The reactant delivery system included a tank, a pump and rotameters for jet fuel
and flow regulators for compressed, dry laboratory air. The air entering the nozzle and
the air entering the inline air heater were controlled with separate flow regulators.
For these experiments, jet fuel from Berry Aviation at the San Marcos Municipal
Airport was used. The fuel is supplied to Berry Aviation by AVFuel Corporation. Since
jet fuel can have a varying composition, an average chemical formula must be assumed.
In this work a chemical formula of C11H21 was used [107]. The density, as measured by a
laboratory scale, was 797 kg/m3, and the lower heating value was 43.2 MJ/kg as given by
[108].
Measurements included temperatures and exhaust species. The temperatures were
measured with 11 B-type thermocouples. The thermocouples were spaced at 1.5 cm
intervals with the junctions at the centerline of the reactor for the alumina experiments
and at the inside diameter of the alumina insulation for the YZA and ZTM experiments.
Additionally, the temperature of the reactant mixture was measured with a K-type
thermocouple just before entry to the reactor. The exhaust species were measured by a
Varian, Inc. gas chromatograph (GC), which was calibrated to measure the following
species: hydrogen, oxygen, nitrogen, methane, carbon dioxide, carbon monoxide,
ethylene, ethane, acetylene, propane, iso-butane, n-butane, iso-pentane, n-pentane and n-
hexane.
26
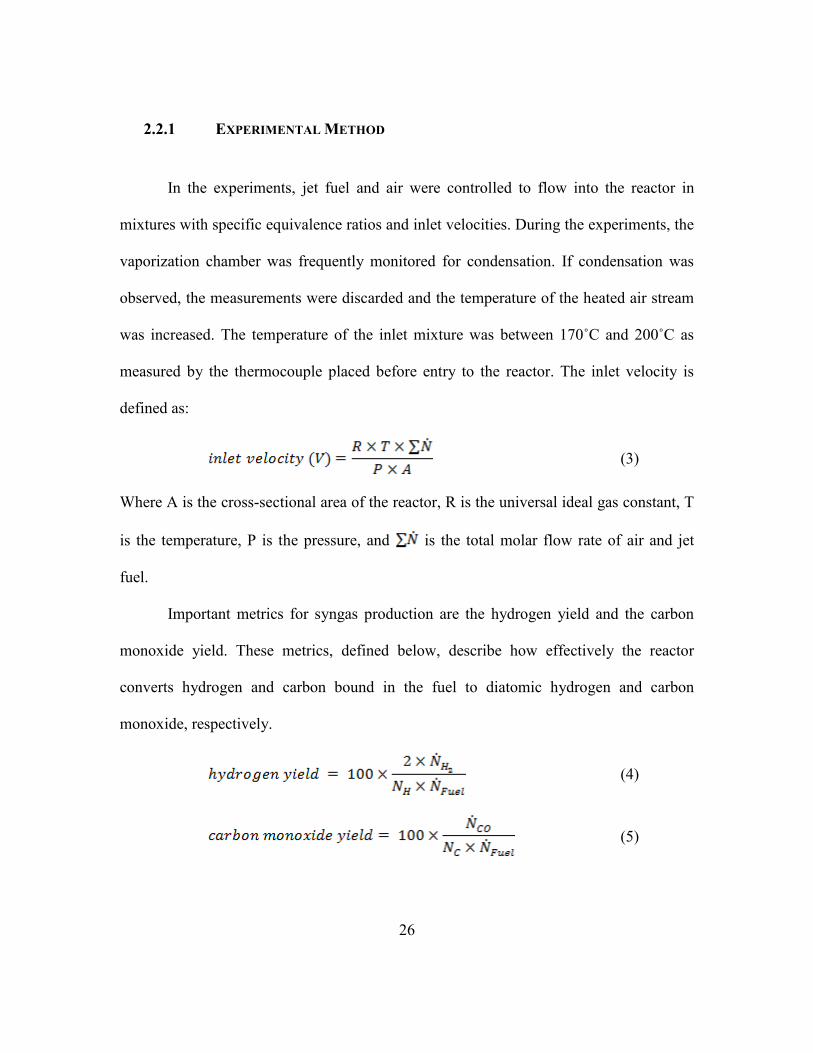
2.2.1 EXPERIMENTAL METHOD
In the experiments, jet fuel and air were controlled to flow into the reactor in
mixtures with specific equivalence ratios and inlet velocities. During the experiments, the
vaporization chamber was frequently monitored for condensation. If condensation was
observed, the measurements were discarded and the temperature of the heated air stream
was increased. The temperature of the inlet mixture was between 170˚C and 200˚C as
measured by the thermocouple placed before entry to the reactor. The inlet velocity is
defined as:
(3)
Where A is the cross-sectional area of the reactor, R is the universal ideal gas constant, T
is the temperature, P is the pressure, and is the total molar flow rate of air and jet
fuel.
Important metrics for syngas production are the hydrogen yield and the carbon
monoxide yield. These metrics, defined below, describe how effectively the reactor
converts hydrogen and carbon bound in the fuel to diatomic hydrogen and carbon
monoxide, respectively.
(4)
(5)
27
where the units of , and are moles per second and = 21 and = 11
for jet fuel.
The values for the chemical energy conversion efficiency were calculated. This
metric describes how much chemical energy in the fuel was converted to chemical energy
in a given exhaust species. The energy conversion efficiencies were calculated using the
LHV of the individual species as described by the following representative equation for
hydrogen:
(6)
where LHV values are in units of kJ per mole.
Similarly, the total energy conversion efficiency, a measure of how much energy
in the fuel was lost to thermal energy in the process, was calculated as follows:
(7)
The summation is performed over all gaseous species in the exhaust with positive
LHV and with non-negligible concentration (concentration > 0.1%). LHV values were
taken from [109].
As mentioned in the introduction, the reaction zone may propagate upstream or
downstream or remain stationary relative to the porous medium depending on the
operating conditions. To measure the product species for a given set of operating
conditions, the GC samples the exhaust gases at least 4 times with each sample requiring
160 seconds. The downstream propagation rate was observed up to about 3 cm/min, so

28
the 4th
sample of the products would take place when the reaction zone is 16 cm
downstream from the location of the reaction zone when the first sample was taken. This
difference in reaction zone locations between samples also implies a difference in
residence times that the gases experience in hot porous media downstream of the reaction
zone. Since some reactions that occur in the combustion of mixtures with very high
equivalence ratios are slow, the measurements of product species can differ from sample
to sample as the reaction zone propagates.
2.2.2 RESULTS AND DISCUSSION FOR INITIAL EXPERIMENTS
2.2.2.1 Experiments with alumina pellets – discussion of materials
Experiments were conducted with porous media consisting of a bed of 3 mm
diameter alumina pellets. After continuously burning jet fuel and air mixtures at various
equivalence ratios and inlet velocities for approximately 6 hours, the reactor was purged
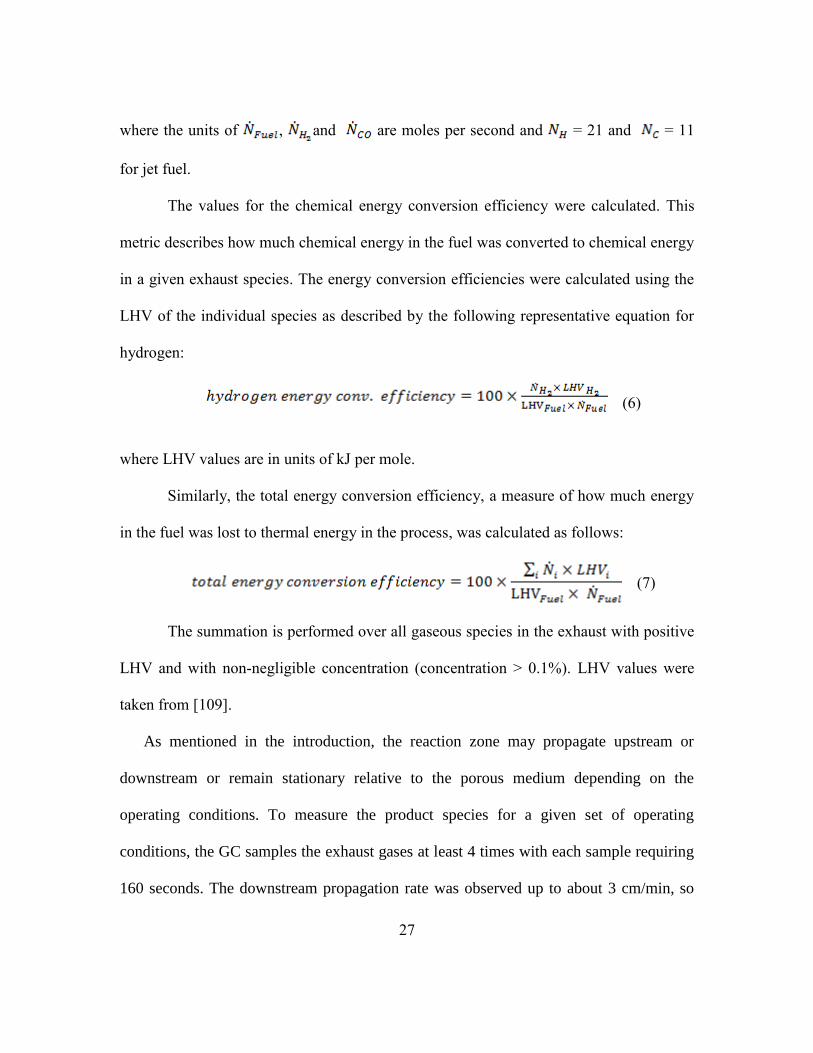
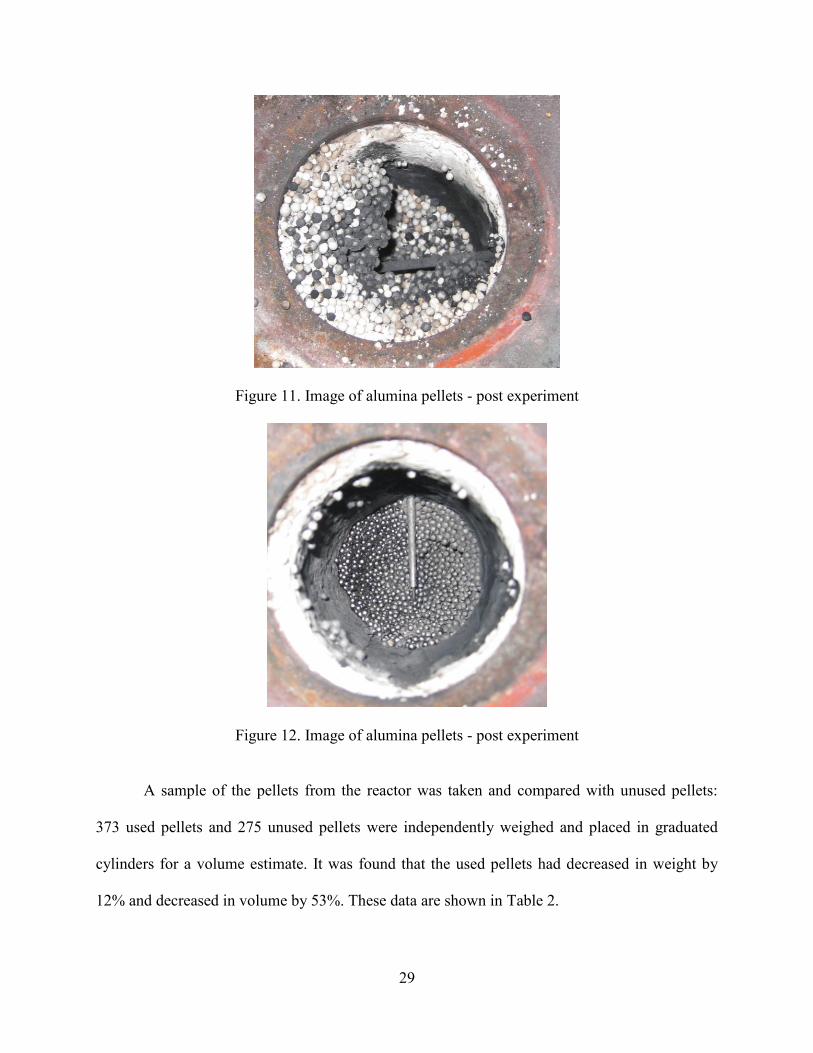
and cooled with N2 in order to examine soot buildup. Upon inspection, it was found that
the alumina pellets had degraded enough to form a large cavity in the packed bed (Figure
11) After removing the top layer of the pellets, a hardened bank of soot-covered alumina
pellets was observed (Figure 11 and Figure 12). To remove the pellets shown in the
figure, a metal tool with significant applied pressure was required.
29
Figure 11. Image of alumina pellets - post experiment
Figure 12. Image of alumina pellets - post experiment
A sample of the pellets from the reactor was taken and compared with unused pellets:
373 used pellets and 275 unused pellets were independently weighed and placed in graduated
cylinders for a volume estimate. It was found that the used pellets had decreased in weight by
12% and decreased in volume by 53%. These data are shown in Table 2.

30
Table 2. Weight and Volume of Alumina Pellets
# of pellets weight (g) volume (ml) weight/pellet (g) volume/pellet (ml)
Used 373 9.12 7.50 0.02 0.02
New 275 7.70 12.00 0.03 0.04
In addition to finding a mass and volume decrease of the individual pellets, seemingly
melted AL2O3 was taken from the apparatus (Figure 13). A sample of this material with no
visible alumina pellets was analyzed by X-ray diffraction. The material had a major phase of
AL2O3 (corundum/alumina) and a trace phase of Al6Si2O13 (mullite). The melting point of
alumina is 2072˚C [104] and the melting point of mullite is 1840˚C [105]. The peak temperature
measured in the bed during all experimentation was 1689˚C, so melting was not expected.
Further experiments are required to determine the reason for the alumina degradation.
Figure 13. Image of degraded alumina pellets
31
2.2.2.2 Experiments with alumina pellets – discussion of fuel conversion
Although the pellets had clearly degraded throughout the course of these experiments,
data for jet fuel reforming was still obtained. These data must be qualified, however, by the fact
that the experimental apparatus was changing in time. It is not possible to know when the
degradation occurred, and further experimentation is necessary to understand the observed
phenomena.
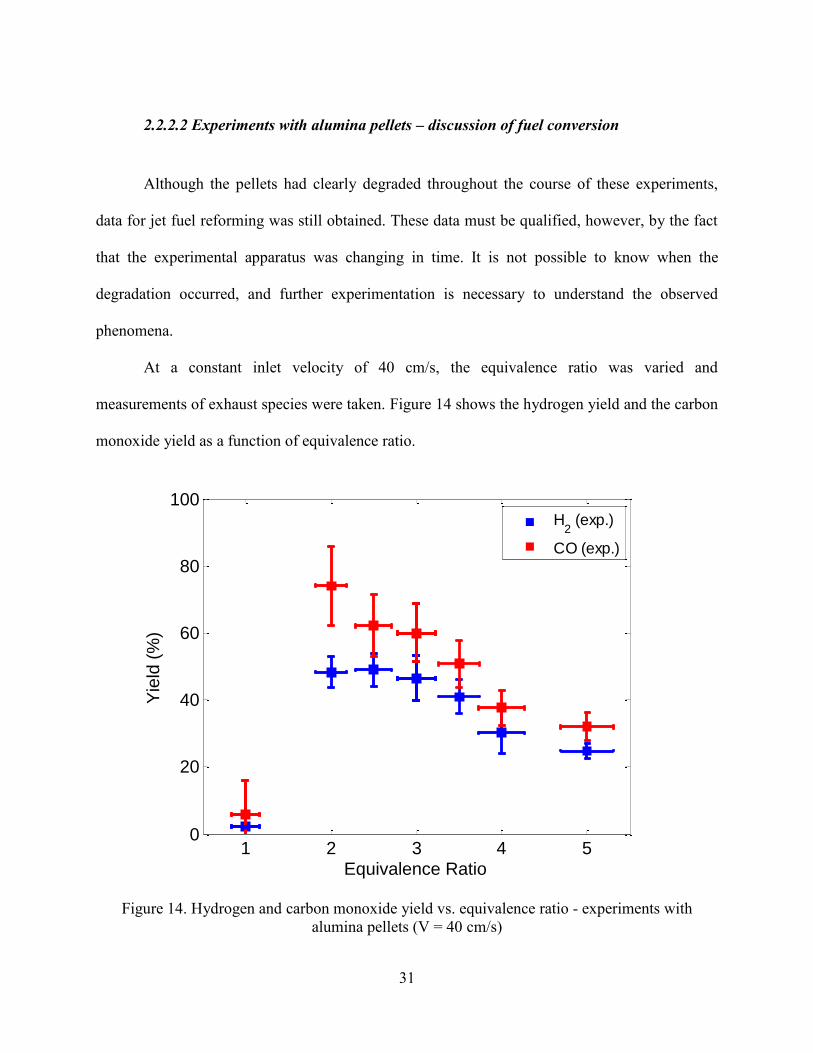
At a constant inlet velocity of 40 cm/s, the equivalence ratio was varied and
measurements of exhaust species were taken. Figure 14 shows the hydrogen yield and the carbon
monoxide yield as a function of equivalence ratio.
1 2 3 4 50
20
40
60
80
100
Equivalence Ratio
Yie
ld (
%)
H2 (exp.)
CO (exp.)
Figure 14. Hydrogen and carbon monoxide yield vs. equivalence ratio - experiments with
alumina pellets (V = 40 cm/s)

32
Near zero hydrogen is observed at an equivalence ratio of 1, and a large jump is seen
from equivalence ratios of 1 to 2 in terms of hydrogen and carbon monoxide yield. The carbon
monoxide yield peaks at = 2 with a value of about 75%, and the peak hydrogen yield of about
50% occurs at = 2.5. The carbon monoxide yield decreases rapidly with increasing
equivalence ratio after the peak, and the hydrogen yield decreases more smoothly. These results
are similar in trend and magnitude to our previous results for methane [41], n-heptane [39] and
ethanol [37].
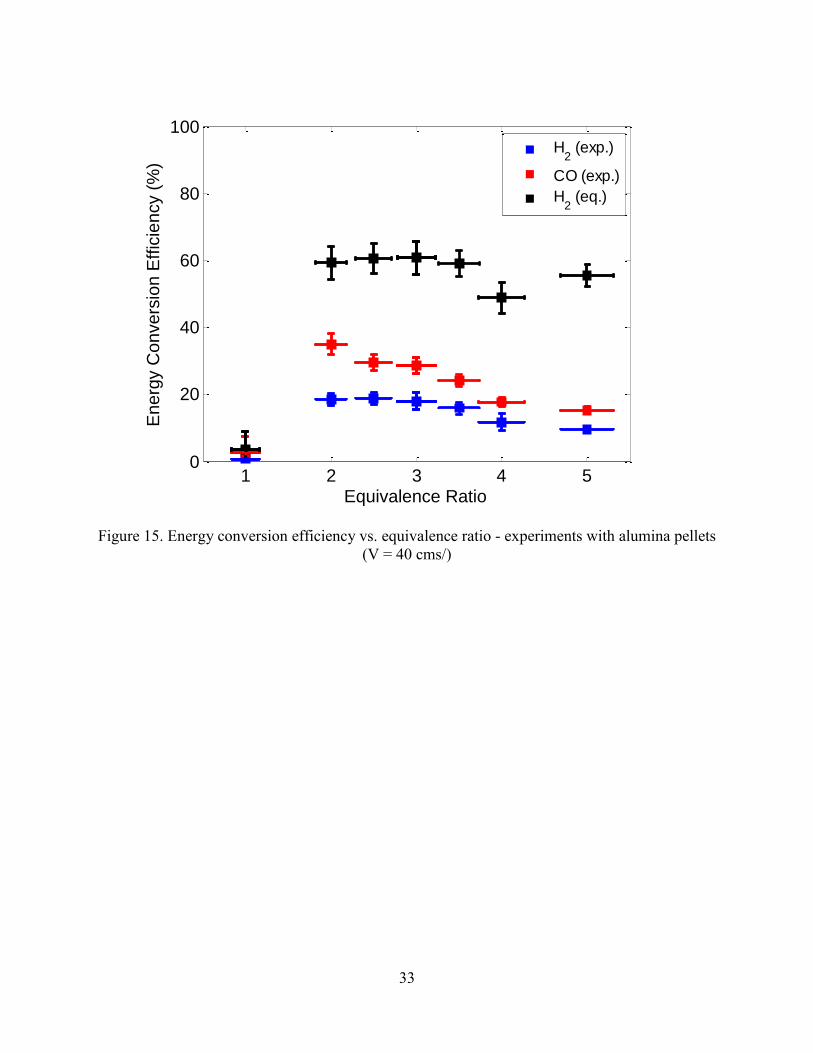
Figure 15 shows the energy conversion efficiency as a function of equivalence ratio for
hydrogen, carbon monoxide and the total energy conversion efficiency. The total energy
conversion efficiency is relatively constant with equivalence ratio at values of = 2 and above
except for an anomalous drop at = 4. These data show that about 40% of energy in jet fuel was
lost to heat in the conversion process. The conversion of energy in jet fuel to energy in carbon
monoxide and hydrogen both decrease after their peaks near = 2. The difference between the
total chemical energy and the sum of the hydrogen and carbon monoxide energy is contained in
other species, such as methane, ethylene and acetylene, which increase rapidly with increasing
equivalence ratio (Figure 16). At = 5, 15% of the energy in jet fuel is converted to energy in
methane and 6-7% was converted to both to ethylene and to acetylene.
33
1 2 3 4 50
20
40
60
80
100
Equivalence Ratio
Energ
y C
onvers
ion E
ffic
iency (
%)
H2 (exp.)
CO (exp.)
H2 (eq.)
Figure 15. Energy conversion efficiency vs. equivalence ratio - experiments with alumina pellets
(V = 40 cms/)
34
1 2 3 4 50
5
10
15
20
Equivalence Ratio
Energ
y C
onvers
ion E
ffic
iency (
%)
CH4 (jet exp.)
C2H
4 (jet exp.)
C2H
2 (jet exp.)
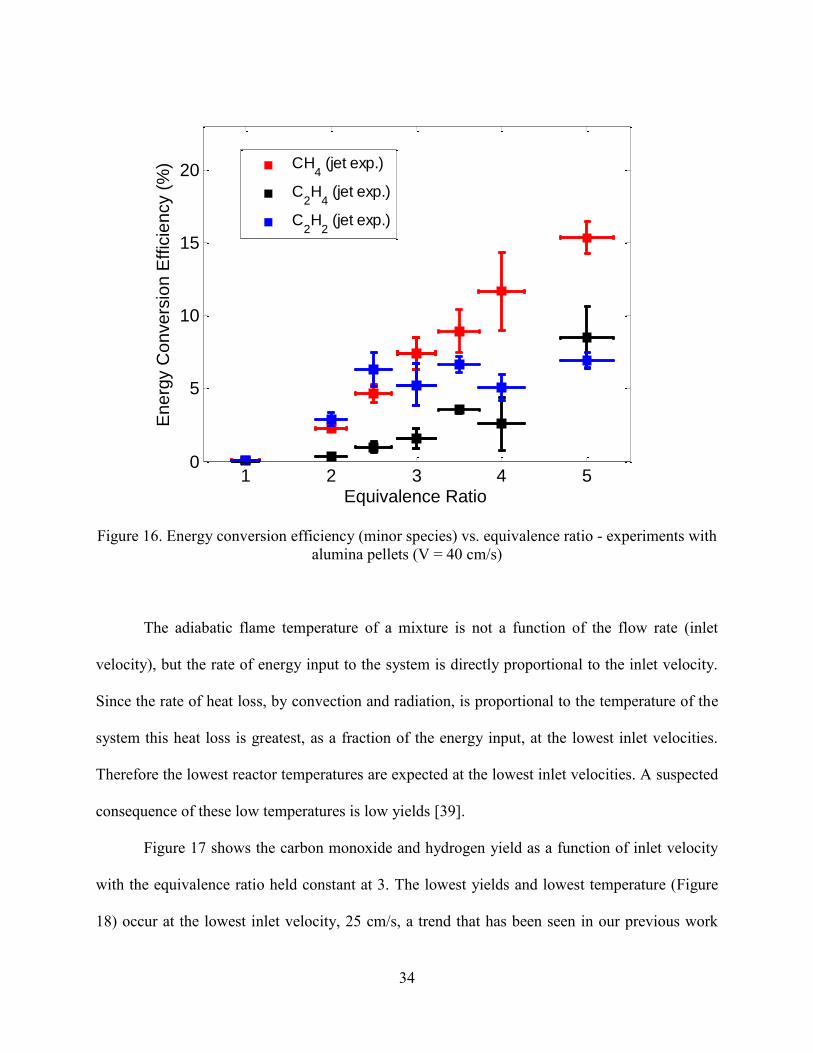
Figure 16. Energy conversion efficiency (minor species) vs. equivalence ratio - experiments with
alumina pellets (V = 40 cm/s)
The adiabatic flame temperature of a mixture is not a function of the flow rate (inlet
velocity), but the rate of energy input to the system is directly proportional to the inlet velocity.
Since the rate of heat loss, by convection and radiation, is proportional to the temperature of the
system this heat loss is greatest, as a fraction of the energy input, at the lowest inlet velocities.
Therefore the lowest reactor temperatures are expected at the lowest inlet velocities. A suspected
consequence of these low temperatures is low yields [39].
Figure 17 shows the carbon monoxide and hydrogen yield as a function of inlet velocity
with the equivalence ratio held constant at 3. The lowest yields and lowest temperature (Figure
18) occur at the lowest inlet velocity, 25 cm/s, a trend that has been seen in our previous work

35
[37, 39, 41]. However, the decrease in yield at velocities higher than 40 cm/s is not consistent
with our previous work [37, 39, 41]. In our filtration combustion experiments with other fuels,
the yields are almost always increasing with inlet velocity. The decrease in yield is, however,
consistent with the peak temperatures measured in the bed (Figure 18). Degradation of the
porous media is suspected as the cause of this anomalous behavior, though more testing is
required.
20 30 40 50 600
20
40
60
80
100
Inlet Velocity (cm/s)
Yie
ld (
%)
H2 (exp.)
CO (exp.)
Figure 17. Hydrogen and carbon monoxide yield vs. inlet velocity - experiments with alumina
pellets ( = 3)
36
20 30 40 50 601100
1150
1200
1250
1300
1350
1400
1450
Inlet Velocity (cm/s)
Tem
pera
ture
(C
)
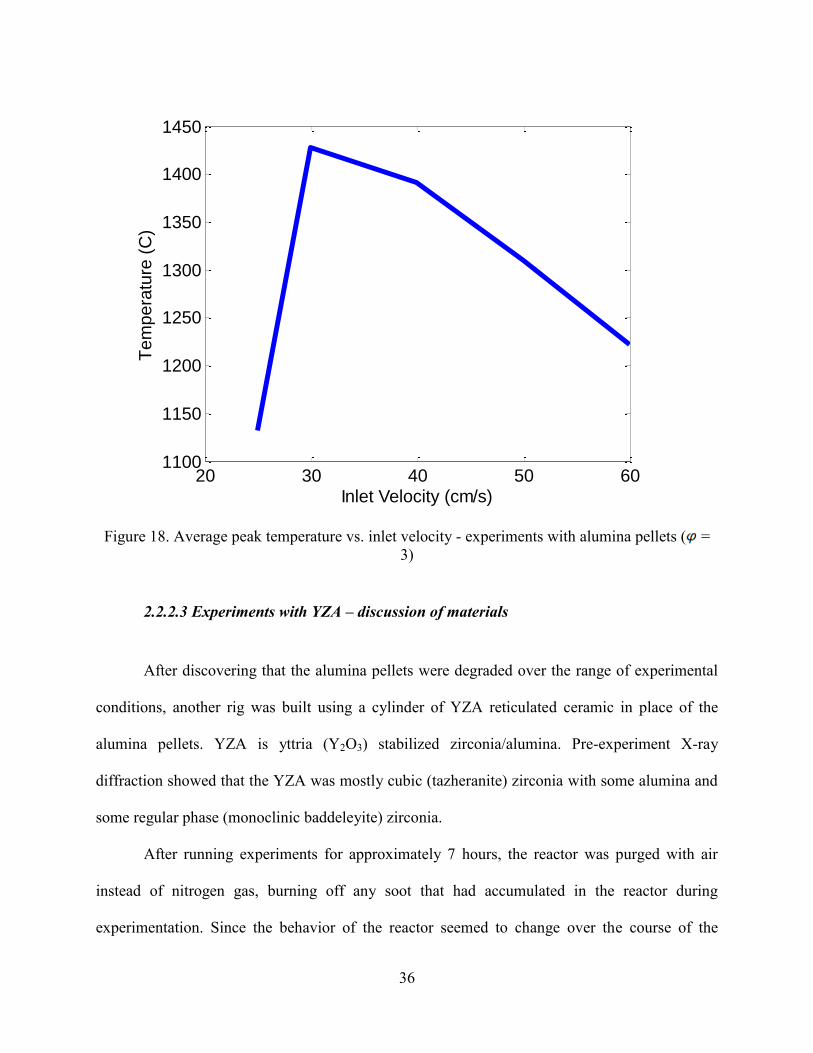
Figure 18. Average peak temperature vs. inlet velocity - experiments with alumina pellets ( =
3)
2.2.2.3 Experiments with YZA – discussion of materials
After discovering that the alumina pellets were degraded over the range of experimental
conditions, another rig was built using a cylinder of YZA reticulated ceramic in place of the
alumina pellets. YZA is yttria (Y2O3) stabilized zirconia/alumina. Pre-experiment X-ray
diffraction showed that the YZA was mostly cubic (tazheranite) zirconia with some alumina and
some regular phase (monoclinic baddeleyite) zirconia.
After running experiments for approximately 7 hours, the reactor was purged with air
instead of nitrogen gas, burning off any soot that had accumulated in the reactor during
experimentation. Since the behavior of the reactor seemed to change over the course of the
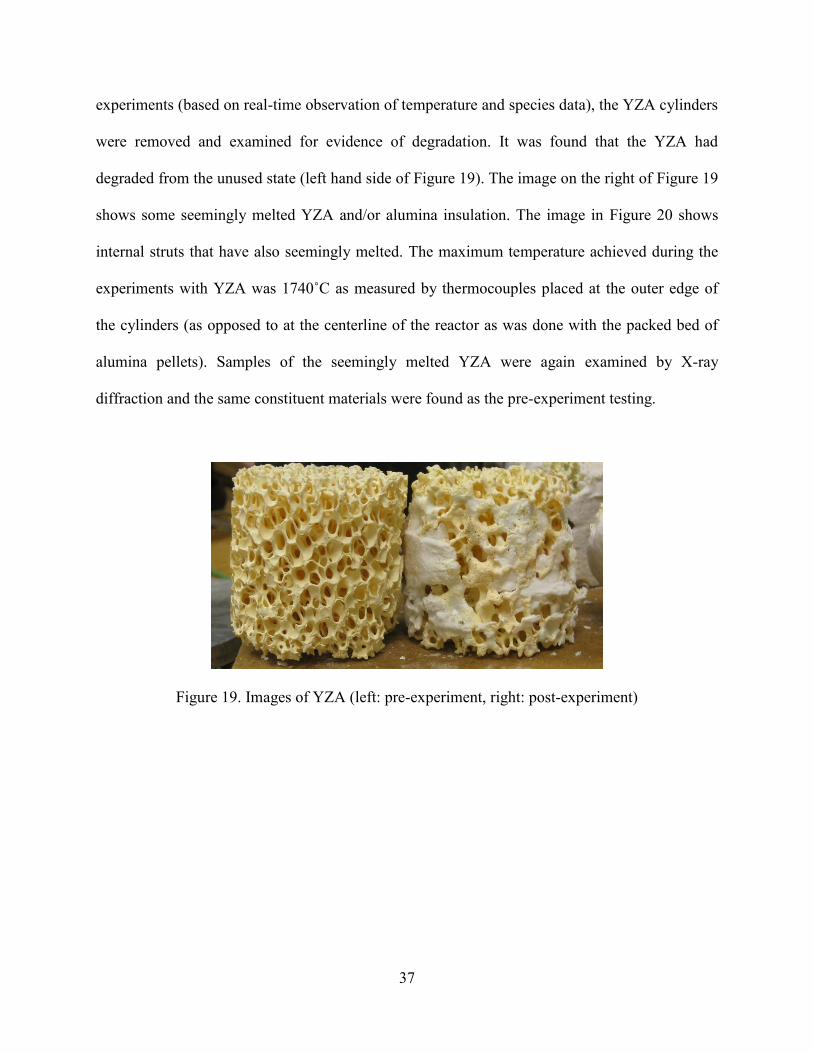
37
experiments (based on real-time observation of temperature and species data), the YZA cylinders
were removed and examined for evidence of degradation. It was found that the YZA had
degraded from the unused state (left hand side of Figure 19). The image on the right of Figure 19
shows some seemingly melted YZA and/or alumina insulation. The image in Figure 20 shows
internal struts that have also seemingly melted. The maximum temperature achieved during the
experiments with YZA was 1740˚C as measured by thermocouples placed at the outer edge of
the cylinders (as opposed to at the centerline of the reactor as was done with the packed bed of
alumina pellets). Samples of the seemingly melted YZA were again examined by X-ray
diffraction and the same constituent materials were found as the pre-experiment testing.
Figure 19. Images of YZA (left: pre-experiment, right: post-experiment)
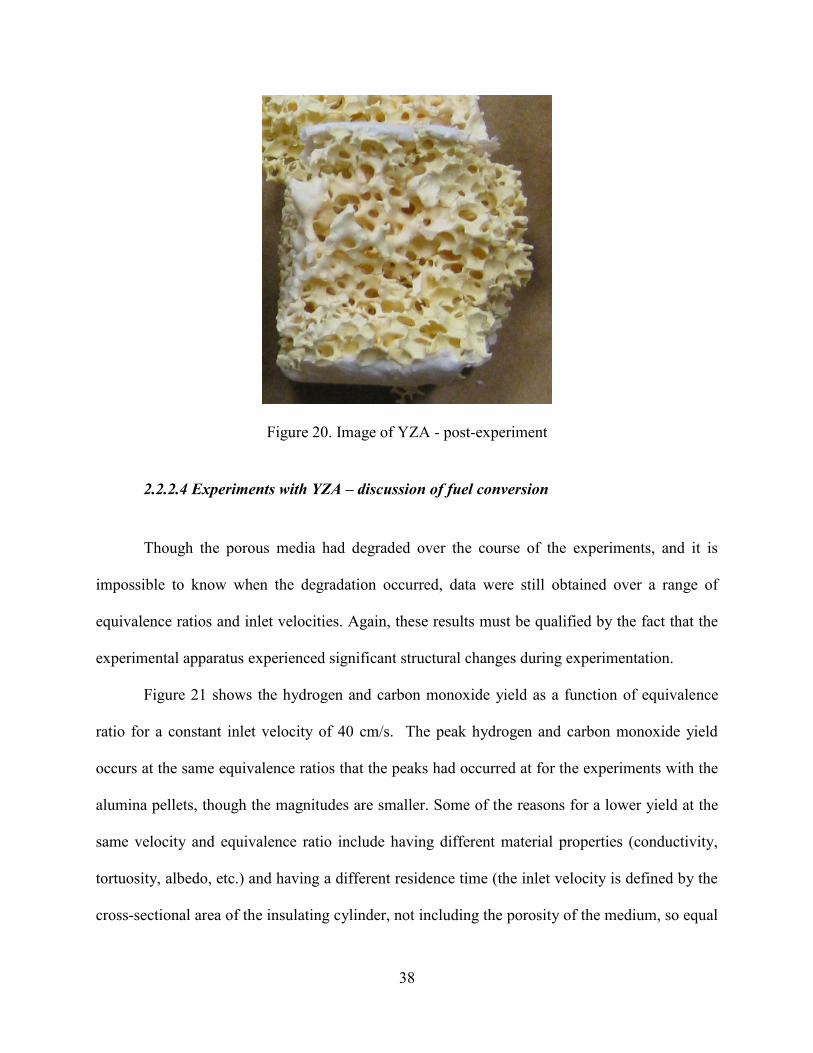
38
Figure 20. Image of YZA - post-experiment
2.2.2.4 Experiments with YZA – discussion of fuel conversion
Though the porous media had degraded over the course of the experiments, and it is
impossible to know when the degradation occurred, data were still obtained over a range of
equivalence ratios and inlet velocities. Again, these results must be qualified by the fact that the
experimental apparatus experienced significant structural changes during experimentation.
Figure 21 shows the hydrogen and carbon monoxide yield as a function of equivalence
ratio for a constant inlet velocity of 40 cm/s. The peak hydrogen and carbon monoxide yield
occurs at the same equivalence ratios that the peaks had occurred at for the experiments with the
alumina pellets, though the magnitudes are smaller. Some of the reasons for a lower yield at the
same velocity and equivalence ratio include having different material properties (conductivity,
tortuosity, albedo, etc.) and having a different residence time (the inlet velocity is defined by the
cross-sectional area of the insulating cylinder, not including the porosity of the medium, so equal

39
inlet velocities for different porous media have equivalent mass flows of air and fuel, but
different residence times in the reactor).
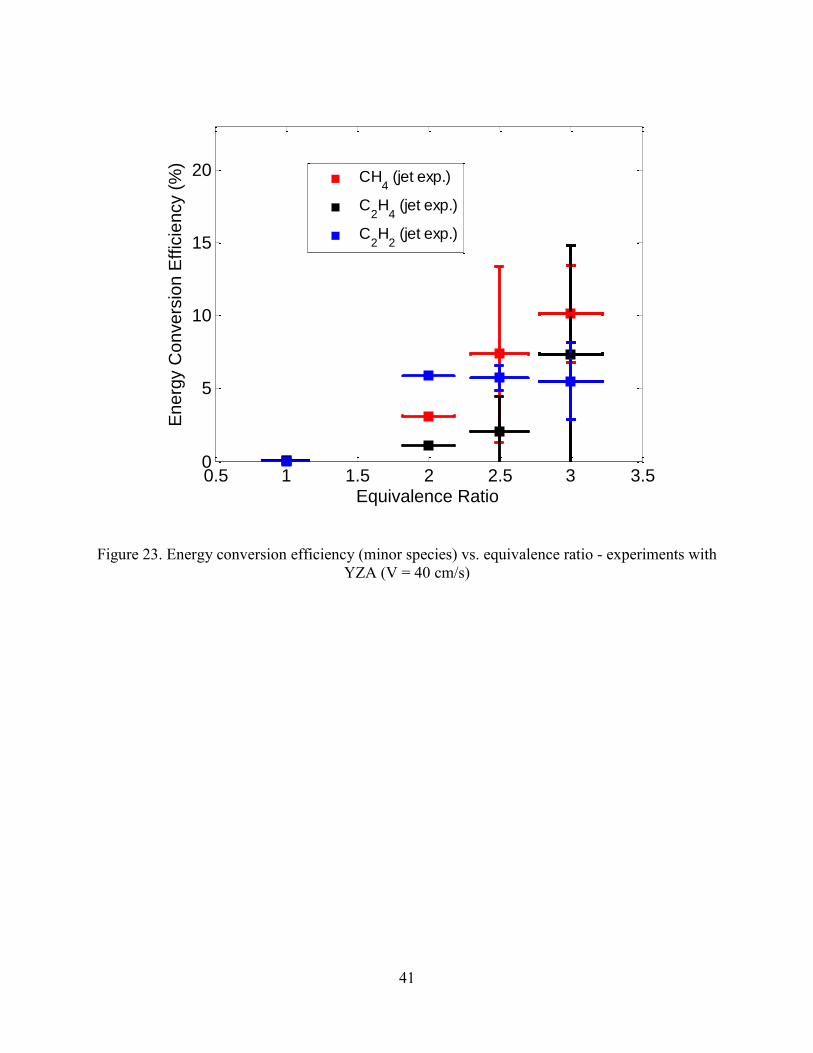
The energy conversion efficiency is shown in Figure 22. Similar to the experiments with
the alumina pellets, about 45% of the energy in the jet fuel is lost to heat. As the equivalence
ratio is increased, more energy is contained in species other than hydrogen and carbon monoxide
as shown in Figure 23.
0.5 1 1.5 2 2.5 3 3.50
20
40
60
80
100
Equivalence Ratio
Yie
ld (
%)
H2 (exp.)
CO (exp.)
Figure 21. Hydrogen and carbon monoxide yield vs. equivalence ratio - experiments with YZA
(V = 40 cm/s)

40
0.5 1 1.5 2 2.5 3 3.50
20
40
60
80
100
Equivalence Ratio
Energ
y C
onvers
ion E
ffic
iency (
%)
H2 (exp.)
CO (exp.)
H2 (eq.)
Figure 22. Energy conversion efficiency vs. equivalence ratio - experiments with YZA (V = 40
cm/s)
Holding the equivalence ratio constant at 2.5, the inlet velocity was varied from 30 to 60
cm/s, and the hydrogen and carbon monoxide yields for these conditions are shown in Figure 24.
There is little variation in the hydrogen and carbon monoxide yield as inlet velocity is changed,
though the hydrogen yield has a fairly noticeable decrease with increasing inlet velocity, again
contrary to our previous results with other fuels [37, 39, 41].
41
0.5 1 1.5 2 2.5 3 3.50
5
10
15
20
Equivalence Ratio
Energ
y C
onvers
ion E
ffic
iency (
%)
CH4 (jet exp.)
C2H
4 (jet exp.)
C2H
2 (jet exp.)
Figure 23. Energy conversion efficiency (minor species) vs. equivalence ratio - experiments with
YZA (V = 40 cm/s)

42
20 30 40 50 600
20
40
60
80
100
Inlet Velocity (cm/s)
Yie
ld (
%)
H2 (exp.)
CO (exp.)
Figure 24. Hydrogen and carbon monoxide yield vs. inlet velocity - experiments with YZA ( =
2.5)
43
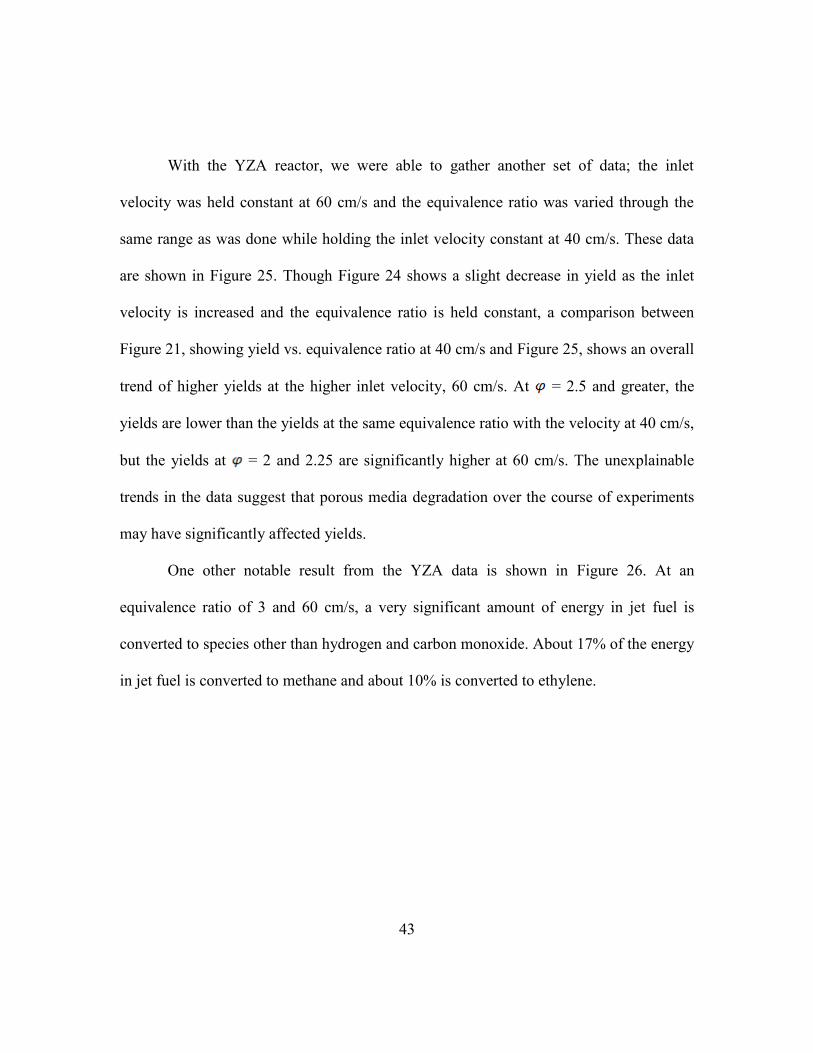
With the YZA reactor, we were able to gather another set of data; the inlet
velocity was held constant at 60 cm/s and the equivalence ratio was varied through the
same range as was done while holding the inlet velocity constant at 40 cm/s. These data
are shown in Figure 25. Though Figure 24 shows a slight decrease in yield as the inlet
velocity is increased and the equivalence ratio is held constant, a comparison between
Figure 21, showing yield vs. equivalence ratio at 40 cm/s and Figure 25, shows an overall
trend of higher yields at the higher inlet velocity, 60 cm/s. At = 2.5 and greater, the
yields are lower than the yields at the same equivalence ratio with the velocity at 40 cm/s,
but the yields at = 2 and 2.25 are significantly higher at 60 cm/s. The unexplainable
trends in the data suggest that porous media degradation over the course of experiments
may have significantly affected yields.
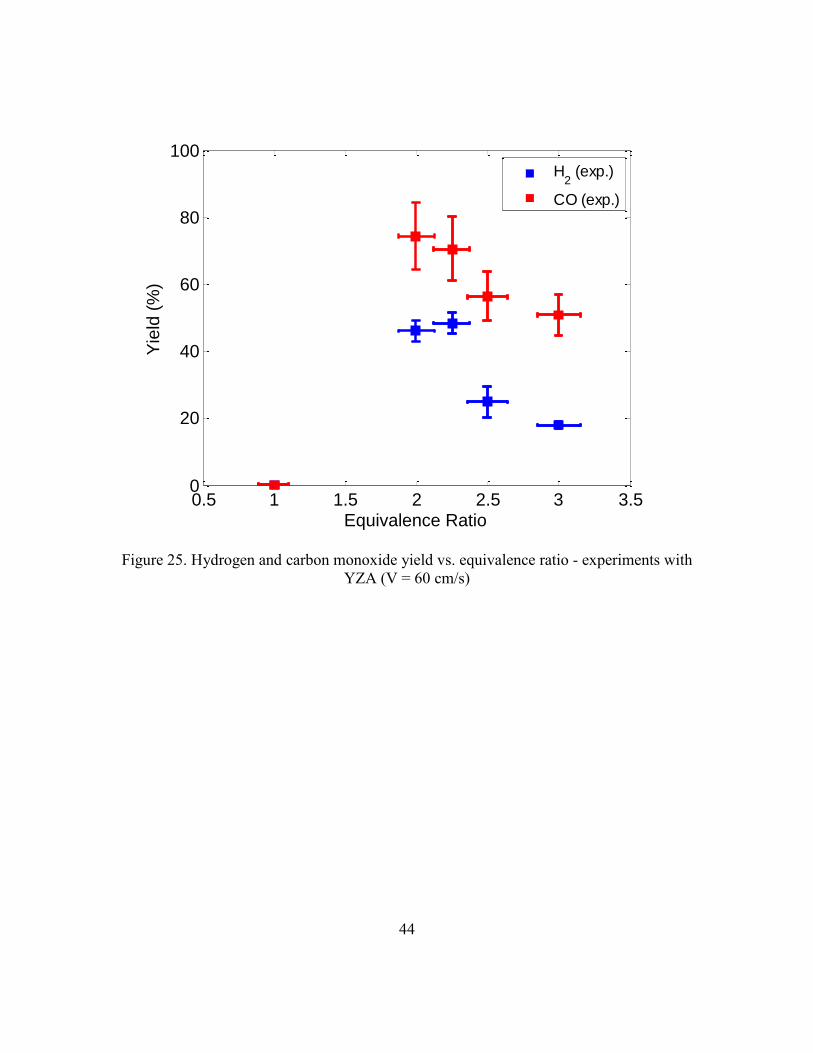
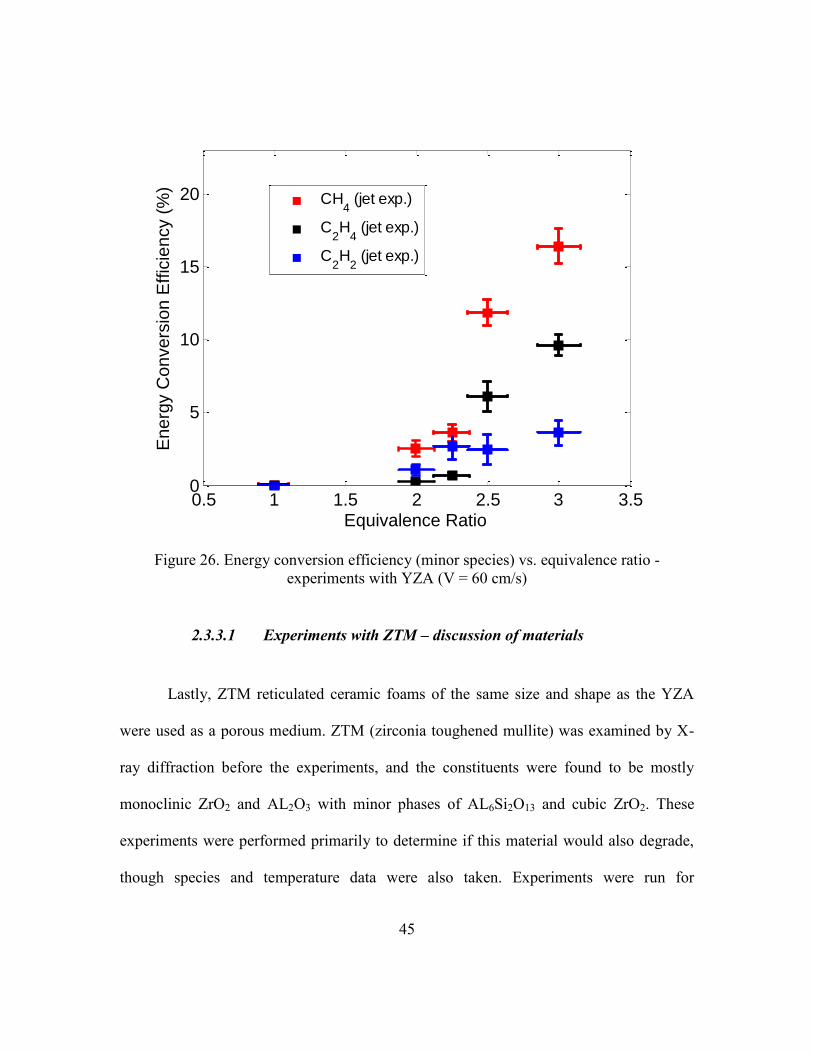
One other notable result from the YZA data is shown in Figure 26. At an
equivalence ratio of 3 and 60 cm/s, a very significant amount of energy in jet fuel is
converted to species other than hydrogen and carbon monoxide. About 17% of the energy
in jet fuel is converted to methane and about 10% is converted to ethylene.
44
0.5 1 1.5 2 2.5 3 3.50
20
40
60
80
100
Equivalence Ratio
Yie
ld (
%)
H2 (exp.)
CO (exp.)
Figure 25. Hydrogen and carbon monoxide yield vs. equivalence ratio - experiments with
YZA (V = 60 cm/s)
45
0.5 1 1.5 2 2.5 3 3.50
5
10
15
20
Equivalence Ratio
Energ
y C
onvers
ion E
ffic
iency (
%)
CH4 (jet exp.)
C2H
4 (jet exp.)
C2H
2 (jet exp.)
Figure 26. Energy conversion efficiency (minor species) vs. equivalence ratio -
experiments with YZA (V = 60 cm/s)
2.3.3.1 Experiments with ZTM – discussion of materials
Lastly, ZTM reticulated ceramic foams of the same size and shape as the YZA
were used as a porous medium. ZTM (zirconia toughened mullite) was examined by X-
ray diffraction before the experiments, and the constituents were found to be mostly
monoclinic ZrO2 and AL2O3 with minor phases of AL6Si2O13 and cubic ZrO2. These
experiments were performed primarily to determine if this material would also degrade,
though species and temperature data were also taken. Experiments were run for

46
approximately 3 hours until the rig became inoperable (the top piece of ZTM popped out
of the top of the reactor, creating a large cavity within the reactor). The rig was purged
and cooled with air and disassembled. Significant degradation of the ZTM was observed
as shown in Figure 27. Samples of the seemingly melted pieces of material were shown
to be, again by X-ray diffraction, equal monoclinic and cubic ZrO2 with some Al2O3. The
pre and post usage X-ray diffraction patterns seemed to indicate that the mullite phase
had been carried away in the gas flow.
Figure 27. Images of ZTM (left: post-experiment, right: pre-experiment)

47
2.2.2.5 Experiments with ZTM – discussion of fuel conversion
A limited data set was obtained before the rig had become inoperable. Figure 28
shows the hydrogen and carbon monoxide yield as a function of equivalence ratio at an
inlet velocity of 40 cm/s. Consistent with the previously discussed results, the peak yields
appeared to occur near an equivalence ratio of 2. The peak hydrogen and carbon
monoxide yields, about 47% and 70%, respectively, are also similar in magnitude to the
alumina and YZA results.
0.5 1 1.5 2 2.5 3 3.50
20
40
60
80
100
Equivalence Ratio
Yie
ld (
%)
H2 (exp.)
CO (exp.)
Figure 28. Hydrogen and carbon monoxide yield vs. equivalence ratio - experiments with
ZTM (V = 40 cm/s)

48
2.2.3 CONCLUSIONS FOR INITIAL EXPERIMENTS
The primary conclusion of this work was that the porous media that were used in
these tests was unacceptable for long-term use for jet fuel combustion. Even with the
observation of degradation, the conversion of jet fuel to syngas was demonstrated. The
degradation of the porous media under filtration combustion with jet fuel was unique; it
had not been observed in experimentation with other fuels with the same porous media.
Though an investigation of the material changes would be interesting, it was decided that
experiments would be performed with different porous media in the hope that the
conversion of jet fuel and butanol by filtration combustion could be investigated without
the complication of phase change or reactions with the porous media. Since the alumina
pellets had been most successfully used, new alumina pellets with a high level of purity
were obtained and the experiments were attempted again with the new porous media.
These experiments are described in the next section (2.3)
Acknowledgements for Work on Initial Experiments
Casey D. Zak, Daniel I. Pineda and Janet L. Ellzey contributed substantially to the
work described in this chapter, which is based on a conference publication [110]. I would
also like to acknowledge Dr. Steven Swinnea of the Texas Materials Institute for his X-
ray diffraction work and Dr. Desiderio Kovar of The University of Texas at Austin for
help understanding the materials science aspect of this work.
49
2.3 Experiments with Re-Designed Experimental Apparatus
2.3.1 EXPERIMENTAL APPARATUS
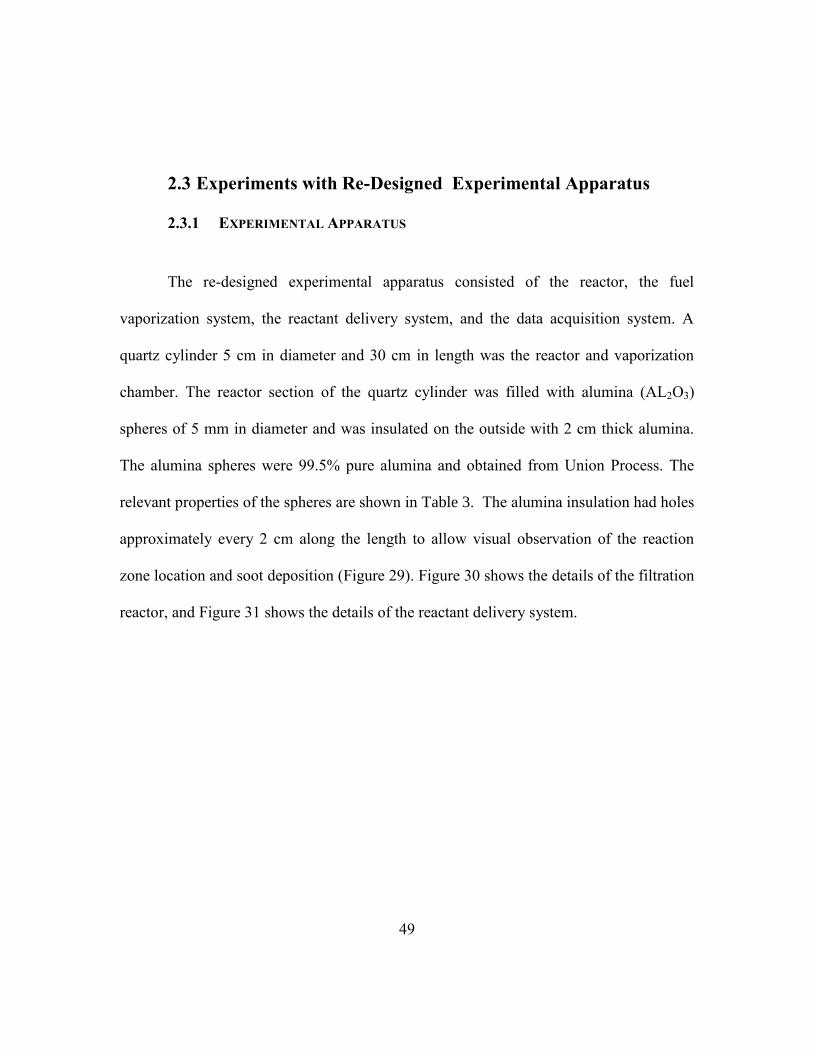
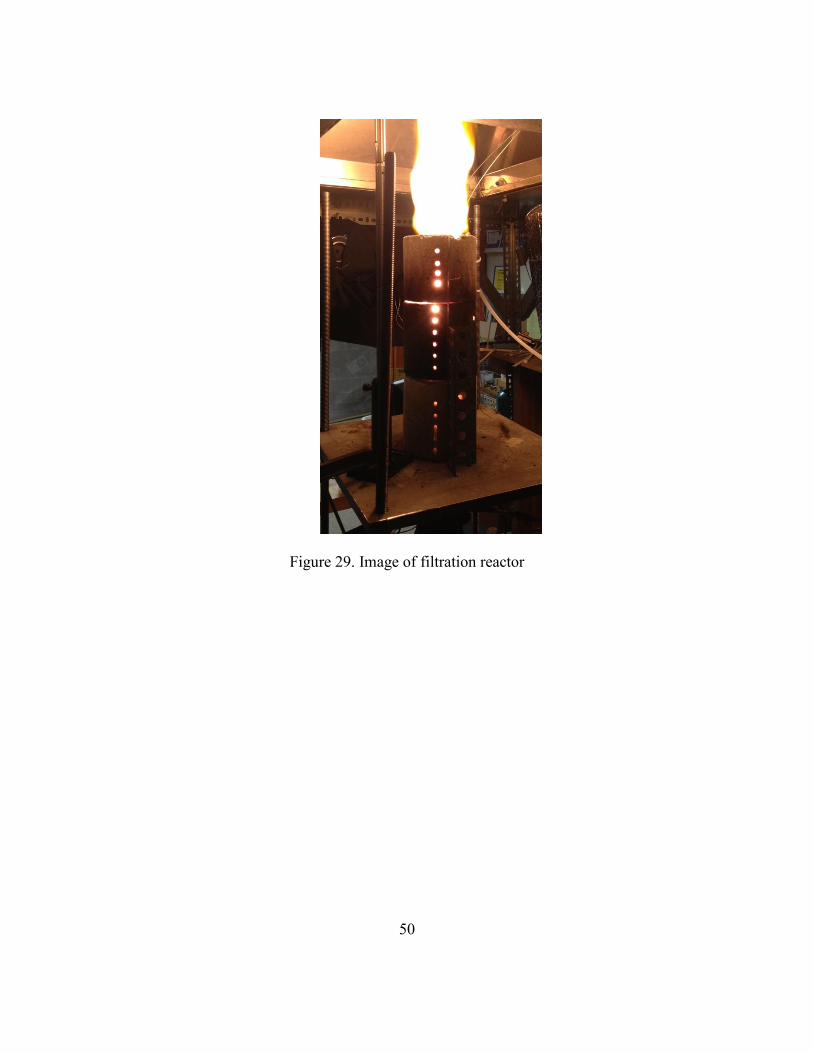
The re-designed experimental apparatus consisted of the reactor, the fuel
vaporization system, the reactant delivery system, and the data acquisition system. A
quartz cylinder 5 cm in diameter and 30 cm in length was the reactor and vaporization
chamber. The reactor section of the quartz cylinder was filled with alumina (AL2O3)
spheres of 5 mm in diameter and was insulated on the outside with 2 cm thick alumina.
The alumina spheres were 99.5% pure alumina and obtained from Union Process. The
relevant properties of the spheres are shown in Table 3. The alumina insulation had holes
approximately every 2 cm along the length to allow visual observation of the reaction
zone location and soot deposition (Figure 29). Figure 30 shows the details of the filtration
reactor, and Figure 31 shows the details of the reactant delivery system.
50
Figure 29. Image of filtration reactor

51
Figure 30. Diagram of re-designed experimental apparatus
Figure 31. Design of reactant delivery system

52
Table 3. Properties of alumina spheres [111]
Property Value
Specific heat [cs] 1255 J/kg-K
Conductivity [ks] 1.195 W/m-K
Albedo [ωλ] 0.8
Extinction Coefficient [βλ] 100 m-1
Density [ρs] 2334 kg/m3
Pore Diameter 0.005 m
Porosity 0.4
The vaporization system consisted of an air-atomizing nozzle (spraying systems
1/8 JBC-SS with 2050 fluid cap) and the quartz chamber for mixing. The atomized fuel
droplets, approximately 20 microns in size, were vaporized in a separate heated air
stream in the quartz chamber. The base of the chamber, which held the nozzle and air
heater, was machined from stainless steel. The outer surface of the quartz chamber was
wrapped with resistance band heaters and insulation to prevent condensation of the fuel.
Portions of the band heaters and insulation were removable so that any potential
condensation of the jet fuel could be observed. Especially since filtration combustion is a
transient process, having visual access to the vaporization chamber was critical. Some
operating conditions were not tested (high inlet velocities with high equivalence ratios)
because the vaporization system was unable to produce a gaseous stream of reactants.
Data is reported under no conditions when accumulation of liquid fuel was observed, and
the reactant stream was always transparent (ie: no observable droplets of liquid fuel)
before entry into the porous media. The temperature of the inlet mixture was always
53
between 150˚C and 200˚C as measured by the thermocouple placed before entry to the
reactor.
The fuel delivery system included a fuel tank, a pump and rotameters (Cole
Parmer) for fuel regulation. The stream of dry laboratory air entering the nozzle was
unheated, but an inline air heater (Convectronics Part 007-10135) heated the other stream
of air. The air entering the nozzle and the air entering the inline air heater were controlled
with separate mass flow controllers (Hastings).
For these experiments, jet fuel from Berry Aviation at the San Marcos Municipal
Airport was used. The fuel is supplied to Berry Aviation by AVFuel Corporation. Since
jet fuel can have a varying composition, an average chemical formula must be assumed.
In this work a chemical formula of C11H21 was used [107]. The density, as measured by a
laboratory scale, was 797 kg/m3, and the lower heating value was 43.2 MJ/kg as given by
[108]. The butanol that was used in this study was obtained from Superior Solvents and
Chemicals. The density was measured as 810 kg/m3 and the lower heating value was
33.1 MJ/kg [108].
2.3.2 EXPERIMENTAL PROCEDURE
When a specific operating condition (φ, V) was to be tested, the reaction front
was first positioned 5-10 cm from the bottom of the porous medium part of the reactor by
igniting a slightly lean flame at the exit of the porous medium and allowing it to
propagate upstream. This procedure ensured that any soot that was deposited within the

54
reactor during operation at the previous condition was completely burned off before the
start of the next condition to be tested. Then the flows of fuel and air were set to the
desired values, and the location of the reaction zone was monitored visually through the
holes in the insulation surrounding the reactor.
The exhaust species were measured by a Varian, Inc. gas chromatograph (GC)
that was calibrated to measure the following species: hydrogen, oxygen, nitrogen,
methane, carbon dioxide, carbon monoxide, ethylene, ethane, acetylene and select higher
hydrocarbons. The GC sampled the exhaust gas for measurement through a water-cooled
quartz probe. For every tested condition, the first two measurements were discarded and
the rest of the measurements were averaged. Measurement uncertainty was calculated
using a Student-t distribution. The contributions to the uncertainty were uncertainty in the
GC calibration gases, uncertainty in the GC calibration, and uncertainty in the flow rates
of air and fuel. Uncertainties for all calculations were based on sequential perturbation.
2.3.3 RESULTS AND DISCUSSION
In the experiments for each fuel, we obtained one set of data by varying φ and
holding V constant and another by varying V while holding constant. The experimental
operating conditions are described in Table 4.
55
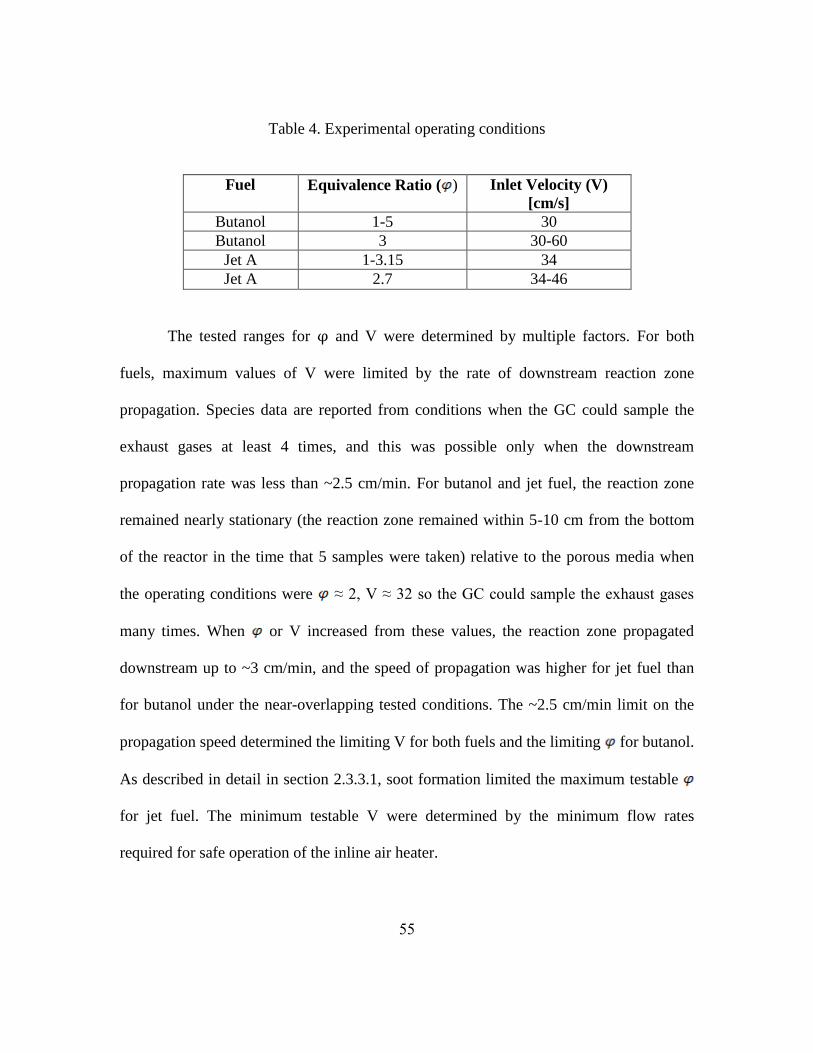
Table 4. Experimental operating conditions
Fuel Equivalence Ratio ( ) Inlet Velocity (V)
[cm/s]
Butanol 1-5 30
Butanol 3 30-60
Jet A 1-3.15 34
Jet A 2.7 34-46
The tested ranges for φ and V were determined by multiple factors. For both
fuels, maximum values of V were limited by the rate of downstream reaction zone
propagation. Species data are reported from conditions when the GC could sample the
exhaust gases at least 4 times, and this was possible only when the downstream
propagation rate was less than ~2.5 cm/min. For butanol and jet fuel, the reaction zone
remained nearly stationary (the reaction zone remained within 5-10 cm from the bottom
of the reactor in the time that 5 samples were taken) relative to the porous media when
the operating conditions were ≈ 2, V ≈ 32 so the GC could sample the exhaust gases
many times. When or V increased from these values, the reaction zone propagated
downstream up to ~3 cm/min, and the speed of propagation was higher for jet fuel than
for butanol under the near-overlapping tested conditions. The ~2.5 cm/min limit on the
propagation speed determined the limiting V for both fuels and the limiting for butanol.
As described in detail in section 2.3.3.1, soot formation limited the maximum testable
for jet fuel. The minimum testable V were determined by the minimum flow rates
required for safe operation of the inline air heater.

56
Important metrics for syngas production are the hydrogen yield and the carbon
monoxide yield. These metrics, defined below, describe how effectively the reactor
converts hydrogen and carbon bound in the fuel to diatomic hydrogen and carbon
monoxide, respectively.
where the units of , and are moles per second. = 10 and = 4 for
butanol, = 21 and = 11 for jet fuel [107].
We also calculated values for the chemical energy conversion efficiency. This
metric describes the percentage of chemical energy in the original fuel that was contained
in particular exhaust species. The energy conversion efficiencies were calculated using
the LHV of the individual species as described by the following representative equation
for hydrogen:
where LHV values are in units of kJ per mole.
Similarly, we calculated the total energy conversion efficiency, the percentage of
chemical energy in the original fuel contained in all fuel exhaust species. If all species are
at ambient temperature and no energy is lost through heat transfer, then this quantity
should be 100%. Values lower than 100% indicated how much energy is associated with

57
heat losses and the sensible energy of the products. The total energy conversion
efficiency was calculated as follows:
The summation is performed over all gaseous species in the exhaust with positive
LHV and with non-negligible concentration (concentration > 0.1%). LHV values were
taken from [109].
For comparison with experimental results, equilibrium values are also presented.
We calculated these values for a constant pressure/enthalpy process using the Cantera
software suite [112]. Previous work [39, 113] has shown that equilibrium calculations
predict trends in exhaust species as a function of reactant composition and can provide
insight into the thermodynamic character of the conversion process. All equilibrium
calculations included the formation of solid carbon.
2.3.3.1 Soot Investigation
One of the challenges of investigating butanol and jet fuel at rich conditions was
the propensity of these fuels to produce soot. For both fuels, when was greater than
approximately 1.5, soot was observed in the reactor through the holes in the insulation
surrounding the reactor and at the exit of the reactor (Figure 32). When the reaction zone
propagated downstream soot was observed both upstream (in Figure 32 the reaction zone
is at approximately 7 inches and soot can be observed upstream at 6 inches) and
downstream of the reaction zone. The highest tested with jet fuel was 3.58 because soot

58
laydown at this equivalence ratio and higher was so great that it clogged the pores of the
reactor. With butanol the reactor was not clogged at any tested equivalence ratio,
although significant soot was observed. The quantities of soot increased, based on
qualitative observation, with increasing .
Figure 32. Image of soot through holes in insulation

59
Figure 33. Images of Soot Formation for Butanol (left) and Jet Fuel (right)
The right hand image in Figure 33 shows the top of the filtration reactor after
experimenting with jet fuel/air mixtures with an equivalence ratio of 3.58 and an inlet
velocity of 34 cm/s. The following was observed previous to the time this image (right
hand image in Figure 33) was taken:
The reaction zone propagated upstream for the conditions of φ = 0.9, V=34 cm/s
until the reaction was ≈ 7 cm from the bottom of the pellets
60
The operating conditions were changed to = 3.15, V=34 cm/s, and the reaction
zone propagated downstream
When the reaction zone was 22 cm from the base, the operating conditions were
changed to φ = 1.4, V=34 cm/s
After a short time, the reaction zone appeared to “jump” from ≈ 22 cm from the
base to ≈ 7 cm from the base.
In order to avoid flashback into the mixing/vaporization chamber, the operating
conditions were changed to φ = 3.6, V=34 cm/s
After a short time, the pellets were ejected from the top of the reactor. Then the
image in Figure 33 was obtained.
Previous to the observations above, the reactor was operating normally. At high
equivalence ratios with jet fuel (φ > 3.15) soot formation is significant enough to clog the
pores in the packed bed of alumina pellets and block the flow of the reactants through the
reactor. Similar experiments were attempted after rebuilding the reactor and it was found
that the reactor could be operated at an equivalence ratio up to 3.15 without clogging, but
at φ = 3.58 clogging always occurred. In experiments performed by the authors’ research
group under similar experimental conditions with other fuels—including ethanol [37] and
methane [41], soot deposition was not observed in significant amounts. In experiments
with heptane [39, 114], soot was observed, but not at amounts that appear, qualitatively,
to those observed in the present experiments with butanol, and especially with jet fuel.
The left hand image in Figure 33 shows the quartz reactor with the insulation
removed after an experiment with butanol. At the bottom of the reactor, white alumina

61
pellets can be seen. The inside of the quartz chamber above these white pellets is black
from soot deposition. This image was taken after a filtration wave for an equivalence
ratio of 4 and an inlet velocity of 30 cm/s had propagated from the bottom of the reactor
to the top. During the propagation of the filtration wave, soot formation was observed
through the holes in the insulation that covers the quartz cylinder. Under these conditions
(φ = 4, V=30), the reaction zone propagates downstream, and soot was observed on
pellets both upstream and downstream of the reaction zone. Because of this phenomenon,
the soot-coated porous medium, instead of being inert, acts as a porous solid fuel. This
situation complicates the analysis of the results because the effective equivalence ratio at
any given time is not known. Soot deposition was observed for experiments with butanol
at equivalence ratios of 3 and greater at all inlet velocities.
In order to investigate further the magnitude of soot deposition, a carbon-flow
balance was performed from the experimental measurements and equilibrium
calculations. Figure 34 shows this carbon balance in terms of the ratio:

62
1 2 3 4 50
0.2
0.4
0.6
0.8
1
Equivalence Ratio
Ra
tio
of C
arb
on
Ou
t to
Ca
rbo
n In
Jet Exp.
Jet Eq.
But. Exp.
But. Eq.
Figure 34. Ratio of carbon out to carbon in vs. equivalence ratio with inlet velocity = 32
± 2 cm/s. Lines on the figure indicate approximate equivalence ratios at which upstream
and downstream propagation occurred.
As shown in the figure, equilibrium predicts that all carbon is in gaseous species
until φ ~ 3, above which significant solid carbon formation occurs. In the experiments
near stoichiometric conditions, carbon is in gaseous compounds for both butanol and jet
fuel. As φ increases, however, the ratio of carbon leaving to carbon entering decreases
steadily for jet fuel until the maximum φ tested (3.15) is reached indicating loss to carbon
laydown in the reactor. For jet fuel at φ = 3.15, about 40% of the carbon entering the
system is deposited in the reactor. These data are consistent with the qualitative
Upstream
prop.
Downstream
propagation

63
observation of heavy soot deposition and reactor clogging in the experiments with jet
fuel. For butanol the ratio decreases until φ = 3, and then rises again to exceed 1 at φ = 5.
The carbon ratio greater than 1 is counter-intuitive and initially suggests that
carbon is being “created.” On closer inspection, however, this is a consequence of the
transient nature of filtration combustion. As shown in Figure 9, when the front propagates
downstream three important parameters change with time: the residence time of the gas
upstream of the reaction increases, the residence time of the gas downstream of the
reaction zone decreases, and the preheat region expands. These effects, coupled with the
soot deposition complicate the analysis of the experimental results for downstream-
propagating reaction zones. As indicated in Figure 34, the reaction zone propagated
downstream when φ exceeded 2.5, and this downstream propagation rate increased with
equivalence ratio.
Soot is complex, containing a variety of chemical species and structures,
including adsorbed hydrocarbons [115]. Since soot is composed mainly of carbon and
hydrogen, it, along with adsorbed hydrocarbons, can be oxidized to other species that are
measured in the exhaust [99, 116]. One would expect this effect to be particularly
pronounced when O2 is in proximity to surfaces coated with soot at high temperature, and
this occurs significantly when the reaction zone propagates downstream as soot was
observed upstream of the reaction zone. Soot particles can grow on timescales similar to
the residence times in the reactor [117, 118]. Therefore an additional effect of
downstream propagation is that hydrocarbon species, particularly acetylene, that
contribute to soot growth have less time to do so because their residence time between

64
the reaction zone and the sampling point decreases with downstream propagation. The
carbon balance exceeding 1 at the highest φ is suspected to be the result of the soot
consumption/oxidation rate exceeding the soot deposition rate at the time those samples
were taken.
The data that were taken when the reaction zone was nearly stationary (φ ~ 2) or
upstream propagating (φ < 1.5) are considered as appropriate representations of the
conversion potential of these fuels. In these cases, soot is not observed upstream of the
reaction zone, and therefore there is no potential for additional fuel species to be added to
the gaseous stream. Results in the following sections are presented in terms of yield and
energy conversion efficiency, which are defined relative to the known fuel input at the
time of sample. The data shown in Figure 34 imply that the yields and energy conversion
efficiencies must be interpreted with the carbon flow balance in mind. If there is a net
deposition of soot at the time a given sample is taken, this will be reflected in lower
yields and energy conversion efficiencies. If the rate of oxidation/consumption exceeds
the deposition rate at the time a sample is taken the yields and energy conversion
efficiencies will be artificially high.
Not only do the results shown in Figure 34 and our qualitative observation of soot
(including complete pore blockage in the jet fuel experiments) have implications for the
present work, these data also have important implications for any experimental work with
butanol and jet fuel at high φ in premixed combustion. Burning the soot out of the reactor
at all conditions was accomplished by burning a lean mixture that propagated upstream
though the reactor. For a filtration reactor to be operated in any practical application this
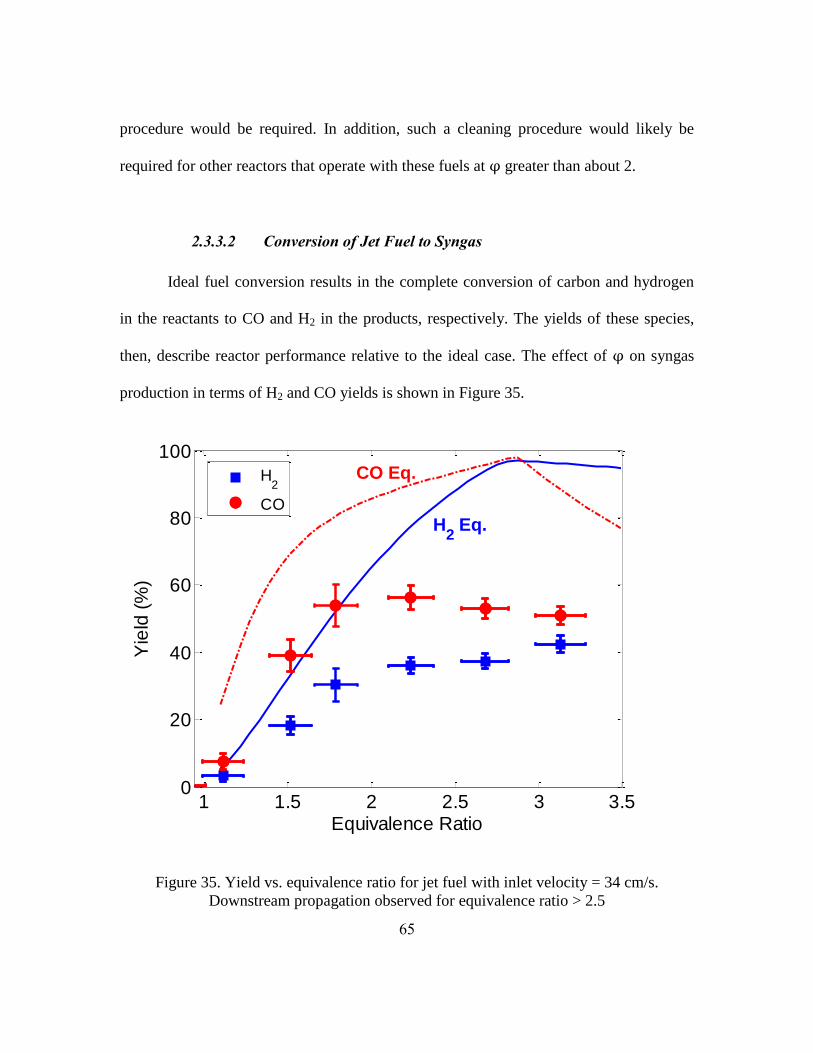
65
procedure would be required. In addition, such a cleaning procedure would likely be
required for other reactors that operate with these fuels at φ greater than about 2.
2.3.3.2 Conversion of Jet Fuel to Syngas
Ideal fuel conversion results in the complete conversion of carbon and hydrogen
in the reactants to CO and H2 in the products, respectively. The yields of these species,
then, describe reactor performance relative to the ideal case. The effect of φ on syngas
production in terms of H2 and CO yields is shown in Figure 35.
1 1.5 2 2.5 3 3.50
20
40
60
80
100
Equivalence Ratio
Yie
ld (
%)
H2
CO
CO Eq.
H2 Eq.
Figure 35. Yield vs. equivalence ratio for jet fuel with inlet velocity = 34 cm/s.
Downstream propagation observed for equivalence ratio > 2.5

66
The yields for CO and H2 are zero at stoichiometric, and very small for φ = 1.25.
At higher φ the equilibrium values are all higher than the corresponding experimental
measurements. The CO yield increases rapidly with φ until φ = 2.25 while the H2 yield
continues to increase over the entire tested range. The maximum yields for H2 and CO
occur at different φ and are 42% at φ = 3.15 and 56% at φ = 2.25, respectively. In
contrast, equilibrium calculations predict that the peaks in conversion of H2 and CO occur
at the same φ (φ ~ 2.9).
As mentioned previously, the energy conversion efficiency is the percentage of
chemical energy in the fuel that is contained in specific species in the exhaust. The total
energy conversion efficiency is percent of the chemical energy in the fuel that is
contained in the exhaust. Figure 36 and Figure 37 show the total energy conversion
efficiency and species energy conversion efficiency as a function of φ and V for jet fuel.
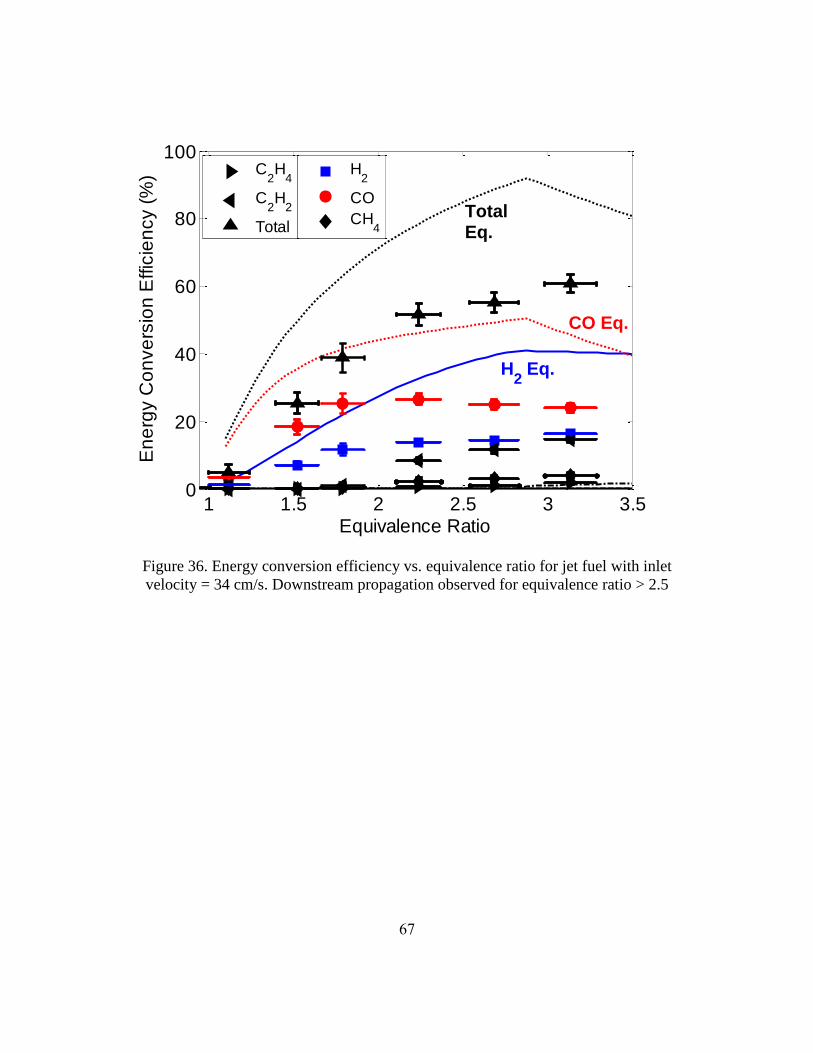
67
1 1.5 2 2.5 3 3.50
20
40
60
80
100
Equivalence Ratio
En
erg
y C
on
ve
rsio
n E
ffic
ien
cy (
%)
H2
CO
CH4
C2H
4
C2H
2
TotalTotalEq.
CO Eq.
H2 Eq.
Figure 36. Energy conversion efficiency vs. equivalence ratio for jet fuel with inlet
velocity = 34 cm/s. Downstream propagation observed for equivalence ratio > 2.5

68
34 36 38 40 42 44 46 480
20
40
60
80
100
Inlet Velocity (cm/s)
En
erg
y C
on
ve
rsio
n E
ffic
ien
cy (
%)
H2
CO
CH4
C2H
4
C2H
2
Total
TotalEq.
CO Eq.
H2 Eq.
Figure 37. Energy conversion efficiency vs. inlet velocity for jet fuel with equivalence
ratio = 2.7. Downstream propagation observed for all conditions
Similar to the trend observed in Figure 35, the experimental energy conversion
efficiencies for CO, H2 and the total are significantly lower than equilibrium (Figure 36).
The total energy conversion efficiency increases with φ up to a maximum of 61% at φ =
3.15, meaning that 39% of the energy in the original fuel is lost to heat. Besides H2 and
CO, acetylene and, to a lesser degree, methane are the only energy-containing species
that contributes substantially to the total energy conversion efficiency. This is in contrast
to equilibrium which predicts almost no hydrocarbons in the products.

69
Figure 37 shows equilibrium and experimental energy conversion efficiency as a
function of V for φ = 2.7. The experimental data show that V does not affect the energy
conversion efficiencies (species specific or total) to a large degree over the tested range.
Previous studies have shown that the energy conversion efficiency can depend strongly
on inlet velocity; however, the tested range in this study was not as large as the tested
ranges reported in previous studies.
2.3.3.3 Conversion of Butanol to Syngas
The potential of butanol for conversion to syngas was investigated through a
similar set of experiments to those performed with jet fuel. Butanol differs substantially
from jet fuel because it has a smaller molecular weight and is an alcohol, containing an
oxygen atom in the molecule. In Figure 38, the yields of H2 and CO are presented as a
function of φ with V held constant at 30 cm/s.
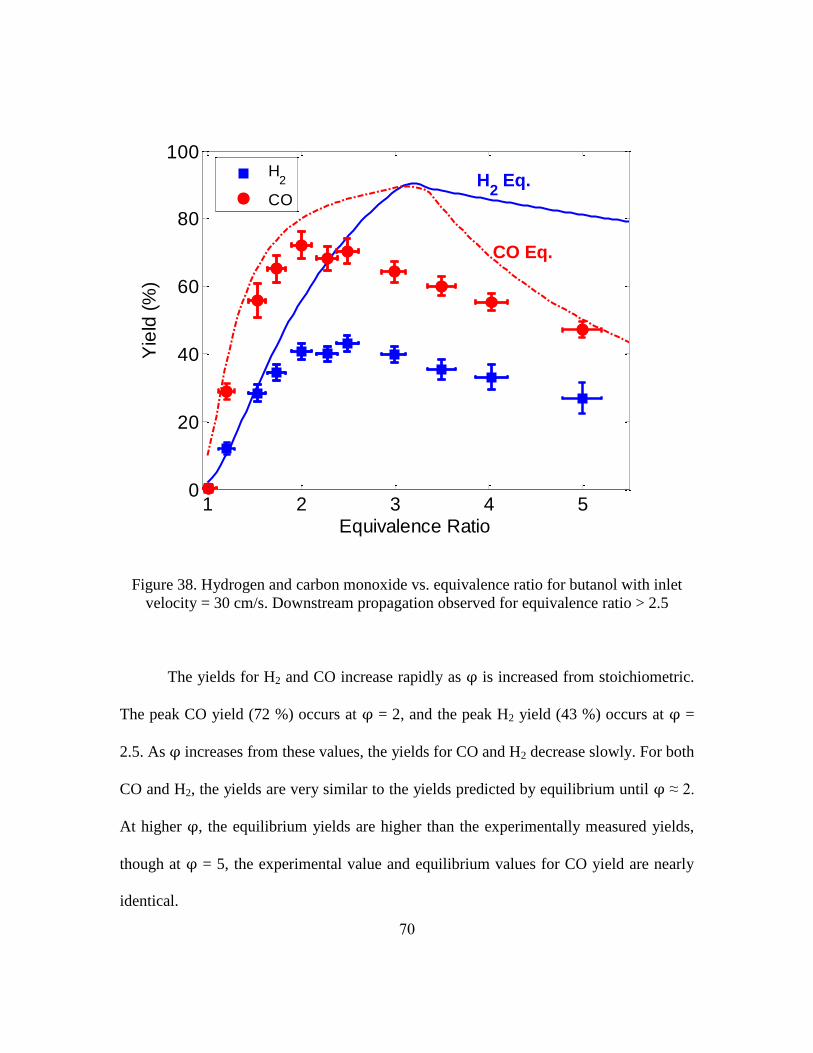
70
1 2 3 4 50
20
40
60
80
100
Equivalence Ratio
Yie
ld (
%)
H2
CO
CO Eq.
H2 Eq.
Figure 38. Hydrogen and carbon monoxide vs. equivalence ratio for butanol with inlet
velocity = 30 cm/s. Downstream propagation observed for equivalence ratio > 2.5
The yields for H2 and CO increase rapidly as φ is increased from stoichiometric.
The peak CO yield (72 %) occurs at φ = 2, and the peak H2 yield (43 %) occurs at φ =
2.5. As φ increases from these values, the yields for CO and H2 decrease slowly. For both
CO and H2, the yields are very similar to the yields predicted by equilibrium until φ ≈ 2.
At higher φ, the equilibrium yields are higher than the experimentally measured yields,
though at φ = 5, the experimental value and equilibrium values for CO yield are nearly
identical.
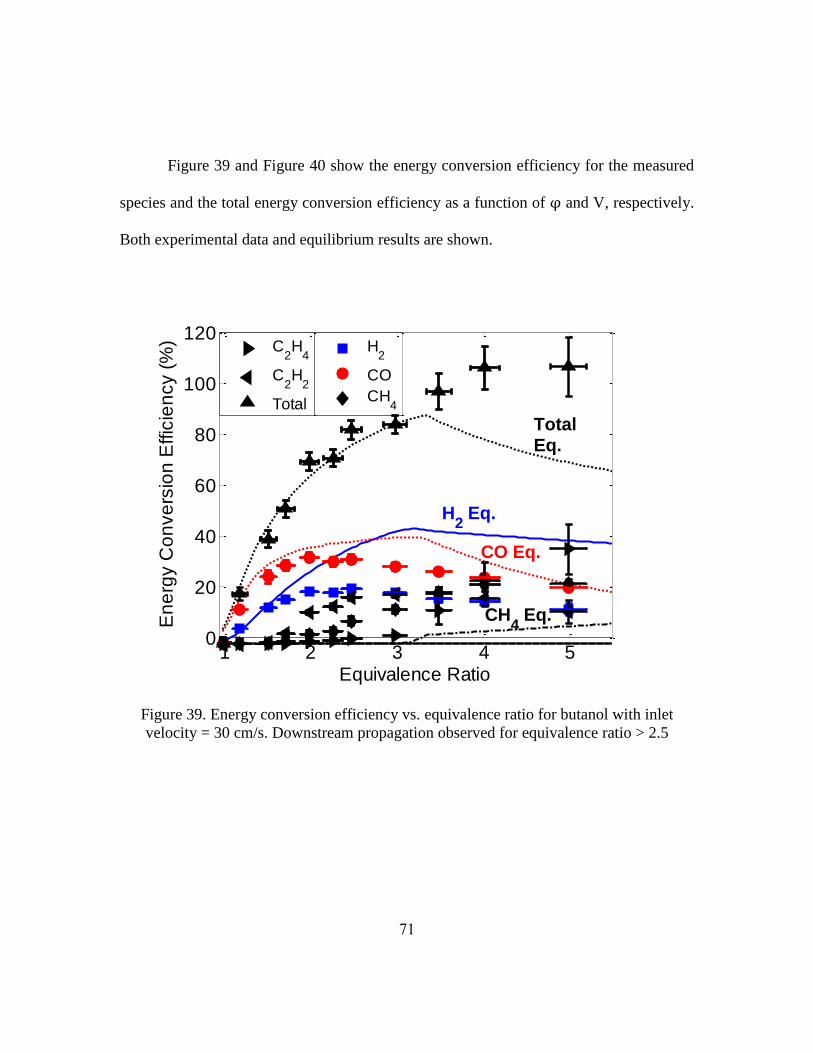
71
Figure 39 and Figure 40 show the energy conversion efficiency for the measured
species and the total energy conversion efficiency as a function of φ and V, respectively.
Both experimental data and equilibrium results are shown.
1 2 3 4 50
20
40
60
80
100
120
Equivalence Ratio
En
erg
y C
on
ve
rsio
n E
ffic
ien
cy (
%)
H
2
CO
CH4
C
2H
4
C2H
2
Total
TotalEq.
CH4 Eq.
CO Eq.
H2 Eq.
Figure 39. Energy conversion efficiency vs. equivalence ratio for butanol with inlet
velocity = 30 cm/s. Downstream propagation observed for equivalence ratio > 2.5
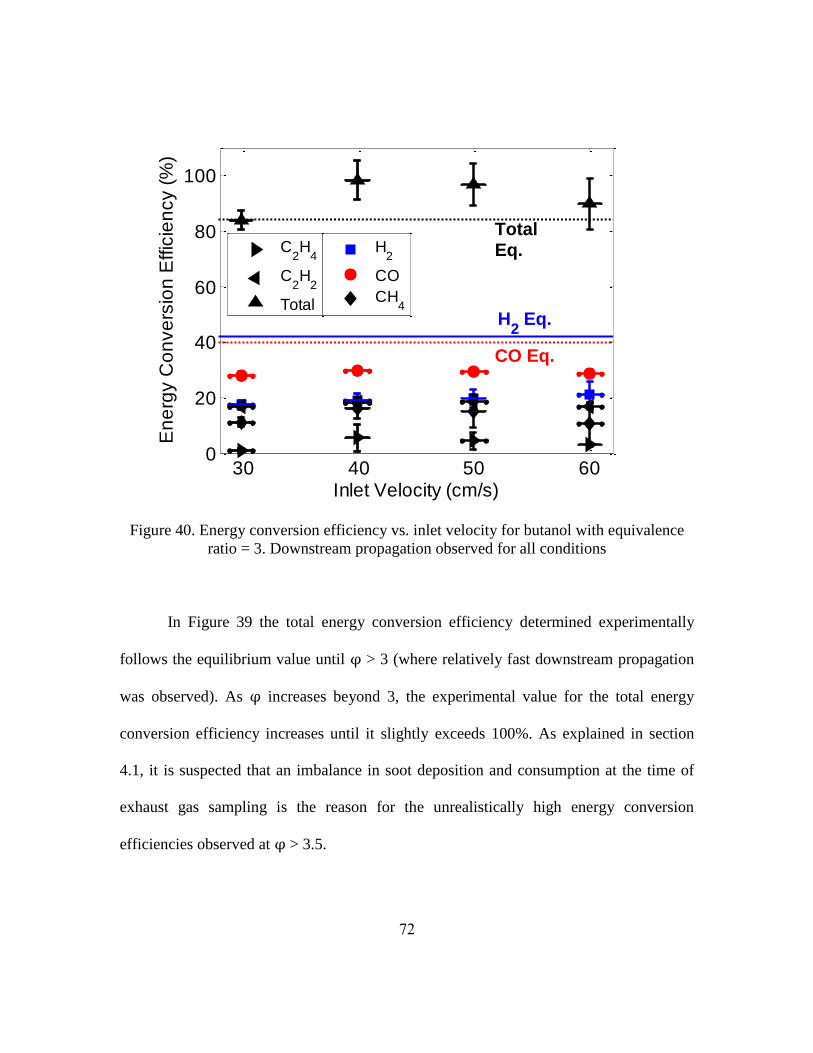
72
30 40 50 600
20
40
60
80
100
Inlet Velocity (cm/s)
En
erg
y C
on
ve
rsio
n E
ffic
ien
cy (
%)
H2
CO
CH4
C2H
4
C2H
2
Total
TotalEq.
H2 Eq.
CO Eq.
Figure 40. Energy conversion efficiency vs. inlet velocity for butanol with equivalence
ratio = 3. Downstream propagation observed for all conditions
In Figure 39 the total energy conversion efficiency determined experimentally
follows the equilibrium value until φ > 3 (where relatively fast downstream propagation
was observed). As φ increases beyond 3, the experimental value for the total energy
conversion efficiency increases until it slightly exceeds 100%. As explained in section
4.1, it is suspected that an imbalance in soot deposition and consumption at the time of
exhaust gas sampling is the reason for the unrealistically high energy conversion
efficiencies observed at φ > 3.5.

73
For conversion of butanol to H2 and CO, lower φ are optimal since the conversion
of energy from butanol to H2 and CO peaks at φ ≈ 2. At φ ≈ 2, a significant amount
(10%) of the chemical energy is in acetylene, and the contribution of acetylene to the
chemical energy outflow increases to a maximum of 20% at φ = 3.25 and then decreases
as φ increases. Methane and ethylene also contributed significantly to the chemical
energy outflow as φ exceeded 2. The energy in methane peaks at φ = 4 with a maximum
of 23%, while the energy in ethylene is nonzero at φ = 3 and rises steadily with φ up to a
maximum of 36% at φ = 5. These results contrast with those for jet fuel (Fig. 5) which
shows significantly less contribution from hydrocarbons to the energy content of the
exhaust.
Figure 40 shows the energy conversion efficiencies as a function of V for butanol
with φ = 3. Similar to the results for jet fuel, the energy conversion efficiencies for H2
and CO do not change significantly as V is increased, but the total energy conversion
efficiency does increase somewhat as V exceeds 30 cm/s. Exceeding the equilibrium
value for total energy conversion efficiency and having near 100% conversion when the
V was 40 cm/s and 50 cm/s is, again, likely the result of soot deposition/consumption
imbalance and reaction zone propagation (see section 2.3.3.1).
2.3.3.4 Fuels Comparison
Thermodynamic analysis is often used to investigate fuel conversion to syngas
[69, 119, 120]. In order to provide insight into the relative syngas production efficiencies

74
of a variety of fuels, equilibrium calculations were completed for a set of seven fuels with
a range of molecular weights. The computed hydrogen yield and carbon monoxide yield
as a function of φ for these fuels is shown in Figure 41 and Figure 42, respectively.
2 2.5 3 3.5 4 4.5 560
65
70
75
80
85
90
95
100
Equivalence Ratio
H2 Y
ield
(%
)
methane
propane
heptane
octane
jet fuel
ethanol
butanol
Figure 41. Hydrogen yield vs. equivalence ratio (equilibrium values)

75
1.5 2 2.5 3 3.5 4 4.5 530
40
50
60
70
80
90
100
Equivalence Ratio
CO
Yie
ld (
%)
methane
propane
heptane
octane
jet fuel
ethanol
butanol
Figure 42. Carbon monoxide yield vs. equivalence ratio (equilibrium values)
The equilibrium data show a trend of increasing H2 yield with increasing fuel
molecular weight. The trend is the same for CO yield excluding the behavior of the
oxygenated fuels at φ > 3. Based on equilibrium, jet fuel is expected to produce the
highest yields of H2 and CO, while ethanol should produce the lowest yields. Amongst
the non-oxygenated fuels, methane should produce the lowest yields.
In earlier publications, the authors’ group reported results of experiments
converting methane [41], heptane [39], and ethanol [37] to syngas by filtration
combustion. The filtration reactors that were used in these studies were similar to that
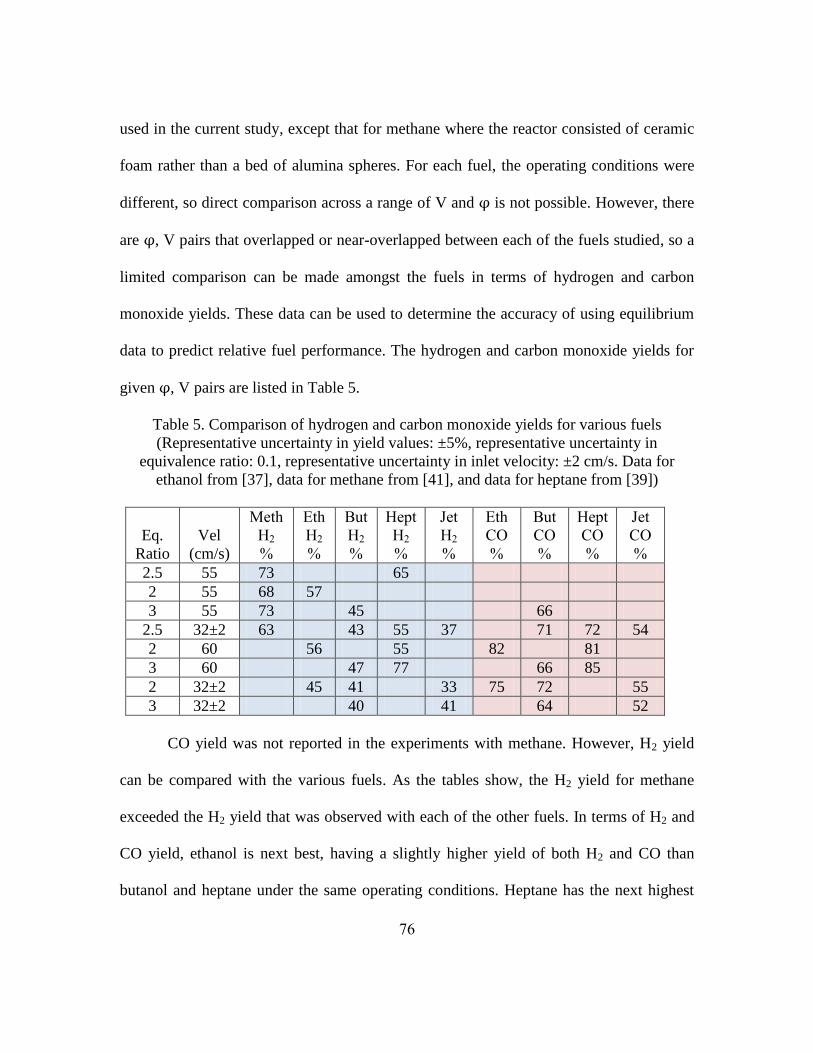
76
used in the current study, except that for methane where the reactor consisted of ceramic
foam rather than a bed of alumina spheres. For each fuel, the operating conditions were
different, so direct comparison across a range of V and φ is not possible. However, there
are φ, V pairs that overlapped or near-overlapped between each of the fuels studied, so a
limited comparison can be made amongst the fuels in terms of hydrogen and carbon
monoxide yields. These data can be used to determine the accuracy of using equilibrium
data to predict relative fuel performance. The hydrogen and carbon monoxide yields for
given φ, V pairs are listed in Table 5.
Table 5. Comparison of hydrogen and carbon monoxide yields for various fuels
(Representative uncertainty in yield values: ±5%, representative uncertainty in
equivalence ratio: 0.1, representative uncertainty in inlet velocity: ±2 cm/s. Data for
ethanol from [37], data for methane from [41], and data for heptane from [39])
Eq.
Ratio
Vel
(cm/s)
Meth
H2
%
Eth
H2
%
But
H2
%
Hept
H2
%
Jet
H2
%
Eth
CO
%
But
CO
%
Hept
CO
%
Jet
CO
%
2.5 55 73 65
2 55 68 57
3 55 73 45 66
2.5 32±2 63 43 55 37 71 72 54
2 60 56 55 82 81
3 60 47 77 66 85
2 32±2 45 41 33 75 72 55
3 32±2 40 41 64 52
CO yield was not reported in the experiments with methane. However, H2 yield
can be compared with the various fuels. As the tables show, the H2 yield for methane
exceeded the H2 yield that was observed with each of the other fuels. In terms of H2 and
CO yield, ethanol is next best, having a slightly higher yield of both H2 and CO than
butanol and heptane under the same operating conditions. Heptane has the next highest

77
conversion with yields higher than butanol. Jet fuel is, by far, the least efficient producer
of syngas with both H2 and CO yields less than those of all the other fuels except for the
H2 yield compared with butanol. Ten binary comparisons can be made amongst the fuels
in terms of H2 yield, and six can be made in terms of CO yield with these data. Among
the ten H2 yield comparisons and six CO yield comparisons only in two cases does a fuel
with a larger molecular weight have a greater hydrogen yield than one with lower
molecular weight (heptane vs butanol for both H2 and CO). These data, then, suggest that
syngas production efficiency generally decreases with molecular weight. Interestingly,
this is the opposite of what is predicted by thermodynamic equilibrium (Figure 41 and
Figure 42).
Experimental investigations of conversion of rich hydrocarbon mixtures have
been conducted by other groups in the last few years, and these data allow a further
comparison of the relative potential of fuels to be converted to syngas. Pedersen-Mjaanes,
Chan, and Mastorakos [121] investigated the conversion of methanol, methane, octane
and petrol to syngas in a 2-section heat recirculating reactor. They found methanol to
have the highest maximum yield followed by methane and then octane and petrol [121].
Pastore and Mastorakos performed experiments with heptane and diesel in a 2-section
reactor [59], and, in contrast to the trends observed in the work of the authors’ group,
they reported diesel to have a significantly higher rate of conversion than heptane in
terms of the conversion of energy in fuel to energy in both H2 and CO. Kennedy and
coworkers at the University of Illinois at Chicago who have contributed substantially to
the field of heat recirculating reactors and syngas production performed experiments with
78
methane, ethane, and propane in a filtration reactor very similar to the one used in the
present experiments [53]. Their experiments showed nearly identical CO yields for each
of the three fuels, but maximum H2 yields increased in order of decreasing molecular
weight. In a recent paper, the relative conversion efficiencies for experiments with
methane, propane and heptane in a counterflow reactor were compared [122]. In those
experiments, propane had the highest efficiency of conversion to H2, followed by
methane and then heptane. With these data from the literature ten binary comparisons can
be made in terms of H2 and CO yield. Of these ten comparisons, three are in agreement
with equilibrium prediction (yield increase with molecular weight), five suggest that yield
decreases with molecular weight, and two support neither trend. As with the filtration
combustion experiments, these data suggest that the trend in syngas production efficiency
as a function of fuel size is not predicted by equilibrium.
Based on the data reported in all of these studies, including the present study, the
potential of fuels to be converted to syngas roughly decreases with increasing molecular
weight. Currently, the available literature does not provide enough data to draw strong
conclusions about fuel optimization for conversion to syngas, and there are multiple
exceptions to this general trend indicating that there is a need for a comprehensive study
of the effect of fuel on conversion where fuels are tested under identical conditions. The
major conclusion of this fuels comparison is that equilibrium predictions of syngas
production as a function of fuel size are inaccurate under most conditions. Since
equilibrium is often used to predict general trends in syngas production, these data

79
suggest that care must be taken when interpreting the results of equilibrium
computations.
Acknowledgements for Work on Experiments with Re-Designed Apparatus
Casey D. Zak, Daniel I. Pineda and Janet L. Ellzey contributed substantially to the
work described in this section, which is based on a paper submitted to the International
Journal of Hydrogen Energy [123].
2.4 Concluding Remarks Regarding the Conversion of Jet Fuel
and Butanol to Syngas
The results of the conversion of butanol and jet fuel to syngas via non-catalytic
transient filtration combustion were presented. Initial attempts to convert jet fuel showed
degradation of porous media. The results of those initial experiments show that the
selection of materials for a porous media reactor can depend significantly on the fuel that
is being used. The reactor was redesigned and successful experiments were conducted
with the new apparatus.
At maximum, about 42% of the hydrogen in jet fuel was converted to H2 and 56%
of carbon was converted to CO. The H2 yield continued to increase with φ in the jet fuel
experiments whereas in the butanol experiments the yields for H2 and CO both reached
peaks within the tested operating range. The peak CO yield for experiments with butanol
was 72% and the peak H2 yield was 43%. Most of the chemical energy exiting the reactor

80
was bound in H2 and CO, but CH4, C2H2 and C2H4 were observed in substantial amounts
in experiments with both fuels, especially in experiments with butanol at high φ. In
contrast, equilibrium predicted nearly negligible amounts of energy-containing
compounds besides H2, CO and solid carbon.
Soot production proved to be substantial in experiments with both fuels, with the
qualitative observation of soot from both fuels exceeding the soot production observed in
similar experiments with methane, heptane, and ethanol. Soot production limited the
maximum testable φ for jet fuel experiments to φ = 3.15 since soot clogged the reactor
when φ exceeded this value. An analysis of the carbon balance for jet fuel experiments
showed that up to 40% of the carbon entering the system was deposited on the porous
medium. Similarly for butanol, the carbon balance showed significant loss up to an φ ~ 3.
At the most extreme φ, the reaction zone propagates downstream oxidizing some of the
soot that has been deposited previously, resulting in an exhaust stream with more carbon
atoms than are contained in the inlet fuel at the time of sample.
Equilibrium calculations and experimental results were analyzed to determine
trends in fuel conversion efficiency as a function of fuel type. The equilibrium
calculations predicted that larger fuel molecules would, generally, produce higher syngas
yields, but the experimental results disagreed with this trend. Generally, experimental
results show that smaller hydrocarbons produce higher syngas yields with jet fuel having
the lowest hydrogen and carbon monoxide yields. The comparison of these equilibrium
data with the experimental data available in the literature suggests that kinetic effects are
very important in fuel conversion to syngas and equilibrium results should be interpreted

81
carefully when predicting syngas production from the combustion of very rich mixtures
of fuel and air. Lastly, the demonstration of the conversion of jet fuel and butanol, along
with previous demonstrations with methane, ethanol and heptane show the robustness of
the non-catalytic filtration reactor.

82
3 RICH COMBUSTION FOR SYNGAS PRODUCTION: THE
EFFECT OF PREHEAT ON BURNER-STABILIZED FLAMES
Generally, in heat-recirculating reactors both conduction and radiation are
enhanced over gaseous values by the presence of a solid surface, and in some designs,
such as a packed bed or filtration reactor, mass transfer is enhanced over the gas phase
levels [124, 125]. The complexity of the transport processes in these reactors makes
analysis and the determination of the critical design parameters difficult.
Previous research has shown that the stable operating range, defined as the sets of
φ and inlet velocity (V) where stable combustion is attained, varies widely depending on
the reactor design even when operating on the same fuel. For example, when operating on
methane stable operation in a packed bed reactor was demonstrated up to φ = 5.0 [41]
while for a counter-flow reactor the limit was at φ = 2.5 [60]. When the reaction front
was stabilized at the interface of two sections of porous media the limit was φ = 1.9 [31].
The conversion of the reactants to syngas also depends on the reactor design.
Experiments reforming methane to syngas with filtration reactors [41, 50], a counter-flow
reactor [60] and another type of porous media reactor [119] showed a variety of syngas
yields with maximum H2 yields ranging from 40% to more than 70% amongst the
different reactors. Furthermore, experiments reforming heptane to syngas with two
different reactor types [39, 61] showed different reforming efficiencies. The filtration
reactors typically produce the highest syngas yields, but since the stable operating
conditions of the various reactors typically do not overlap, a direct comparison is
difficult.
83
Several computational studies have shown the importance of conduction,
radiation, and solid-to-gas heat transfer in these reactors [26, 32, 126, 127]. The
significant outcome of these enhanced processes is that the reactants are preheated and
will therefore react even at extreme equivalence ratios. In these devices, the preheat
temperature is a function of both the properties of the reactor and the combustion process.
In one study [6], the inlet mixture to a porous reactor was preheated externally to a
controlled temperature but since additional heat transfer takes place within the reactor,
the effective preheat temperature is difficult to discern. The development of an optimal
design is challenging because the level of preheat required for conversion and the specific
effect of preheat temperature on the conversion are unclear. An additional complication is
that preheating sometimes occurs under conditions where mass transfer is substantially
enhanced.
The purpose of the current work is to understand the effect of preheat temperature
on the conversion of rich mixtures of methane/air to syngas. In order to examine the
specific effect of preheat temperature, we investigated flames stabilized on flat flame
burners. In contrast to heat recirculating reactors, flat flame burners allow the control and
measurement of preheat temperature and do not have enhanced transport processes that
complicate the analysis.
There has been very substantial work on premixed methane/air laminar flames
stabilized by various methods including on flat flame burners. Most studies have focused
on lean or near-stoichiometric conditions, though there are many published investigations
of rich burner-stabilized flames as well. Most of the experiments with rich flames were
84
studies of detailed flame structure conducted at low-pressure [128]. It is known that
kinetics can differ between low and high pressure [128, 129] so studies at high pressure
are important to supplement the detailed low-pressure flame investigations. The studies at
atmospheric pressure [130-133] have typically focused on flame structure or
measurements of flame speed rather than the concentrations of species over a wide range
of conditions as is reported in this work. In one exception [131], CO concentrations over
a range of equivalence ratios were measured. Previous studies of rich premixed
methane/air flames with preheated reactants have not included exhaust product
measurements with the exception of NOx [134-138].
In this chapter, experimental measurements and computational predictions of
exhaust products are reported for rich methane/air flames with and without preheated
reactants. Chemical kinetic and flame models have not been validated extensively for
very rich equivalence ratios [50, 139], therefore included are comparisons of various
global flame characteristics such as standoff distance, flame temperature, and stable
operating range to establish confidence in these models to make adequate predictions.
The models are then used to compare to the experimental data from rich flames with and
without preheated reactants and also to extend the range of temperature conditions that
are investigated.

85
3.1 Analytical and Numerical Approach
In a laminar flame, such as that on a flat-flame burner, a reaction zone is sustained
by heat and mass diffusion from the reaction zone to the unburnt region. The
mathematical description of this type of reacting system requires solving the following
conservation equations: mass, momentum energy and chemical species. These equations
in full 3-D form are shown below.
Overall mass conservation
(8)
where and
Species conservation
(9)
where , ,
and
Momentum conservation
(10)
where and
Energy conservation

86
(11)
where
Solving this set of equations requires constitutive relations for transport
phenomena and a description of the chemistry. The production and destruction of
chemical species ( is described by the following:
Net rate of production of species i
(12)
(13)
Where and
The rate of reaction for reaction k is:
(14)
where and
and the reaction rate coefficients are given by the modified Arrhenius equation as:
(15)
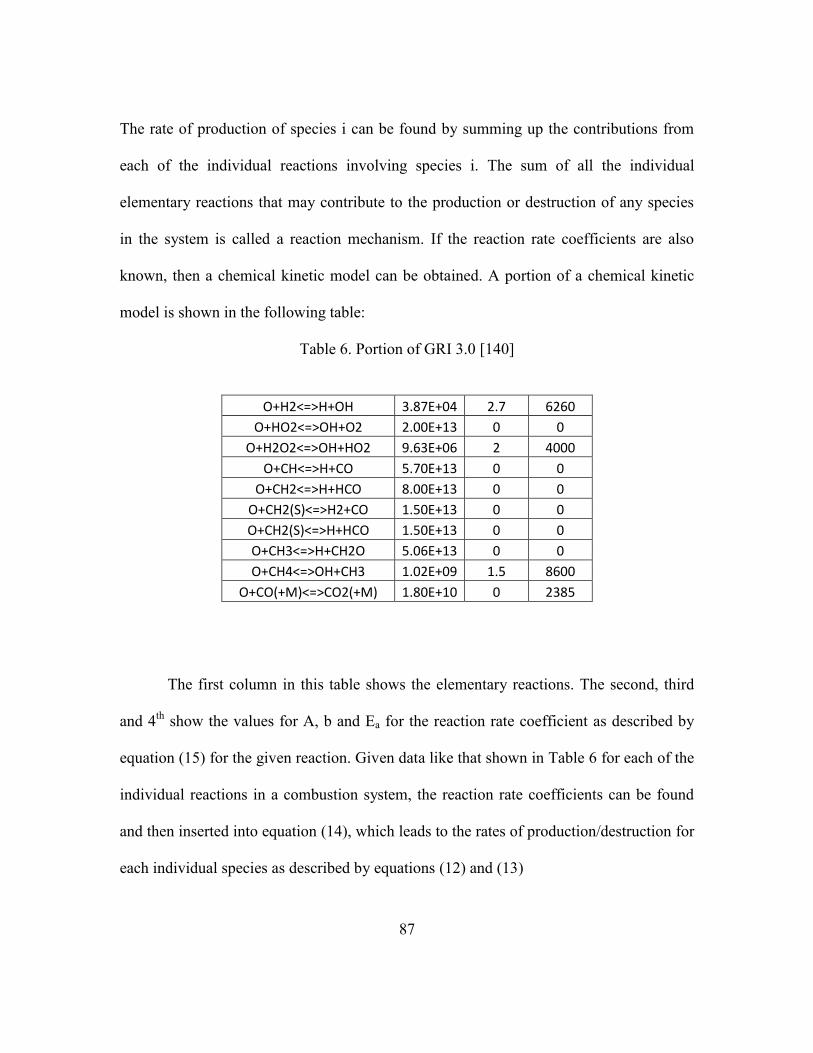
87
The rate of production of species i can be found by summing up the contributions from
each of the individual reactions involving species i. The sum of all the individual
elementary reactions that may contribute to the production or destruction of any species
in the system is called a reaction mechanism. If the reaction rate coefficients are also
known, then a chemical kinetic model can be obtained. A portion of a chemical kinetic
model is shown in the following table:
Table 6. Portion of GRI 3.0 [140]
O+H2<=>H+OH 3.87E+04 2.7 6260
O+HO2<=>OH+O2 2.00E+13 0 0
O+H2O2<=>OH+HO2 9.63E+06 2 4000
O+CH<=>H+CO 5.70E+13 0 0
O+CH2<=>H+HCO 8.00E+13 0 0
O+CH2(S)<=>H2+CO 1.50E+13 0 0
O+CH2(S)<=>H+HCO 1.50E+13 0 0
O+CH3<=>H+CH2O 5.06E+13 0 0
O+CH4<=>OH+CH3 1.02E+09 1.5 8600
O+CO(+M)<=>CO2(+M) 1.80E+10 0 2385
The first column in this table shows the elementary reactions. The second, third
and 4th
show the values for A, b and Ea for the reaction rate coefficient as described by
equation (15) for the given reaction. Given data like that shown in Table 6 for each of the
individual reactions in a combustion system, the reaction rate coefficients can be found
and then inserted into equation (14), which leads to the rates of production/destruction for
each individual species as described by equations (12) and (13)

88
One dimensional solutions of these equations were obtained for burner-stabilized
flames and laminar freely-propagating flames using Cantera [141] with GRI3.0 [140].
The Cantera codes that were used in the present study solved this set of equations use a
finite difference scheme to form nonlinear algebraic equations from the partial
differential equations. A hybrid Newton/time-stepping algorithm solves the equations and
the grids are refined between solutions to add points in regions of high gradients.
For a burner-stabilized flame, the energy equation was solved with an upstream
boundary condition of constant temperature and a downstream boundary condition of
zero temperature gradient. The species conservation equation was solved with
multicomponent transport. The upstream species boundary condition is zero
concentration, and the downstream condition was zero gradient. The domain was 1 cm
for all simulations.
For a freely-propagating flame, the energy equation was solved with upstream and
downstream boundary conditions of zero temperature gradient. The species conservation
equation was solved with multicomponent transport. The upstream and downstream
species boundary conditions were zero gradient. The domain was 30 cm. The details of
the burner-stabilized flame model and the freely-propagating flame model can be found
in the Cantera documentation [141].
In addition to the detailed computational models, the analytical solution of Law
[13] was used to compute the standoff distance as a function of operating conditions and
to understand the basic behavior of burner-stabilized flames. Law’s analytical solution to
the problem of the burner-stabilized flame begins with governing equations (8 through
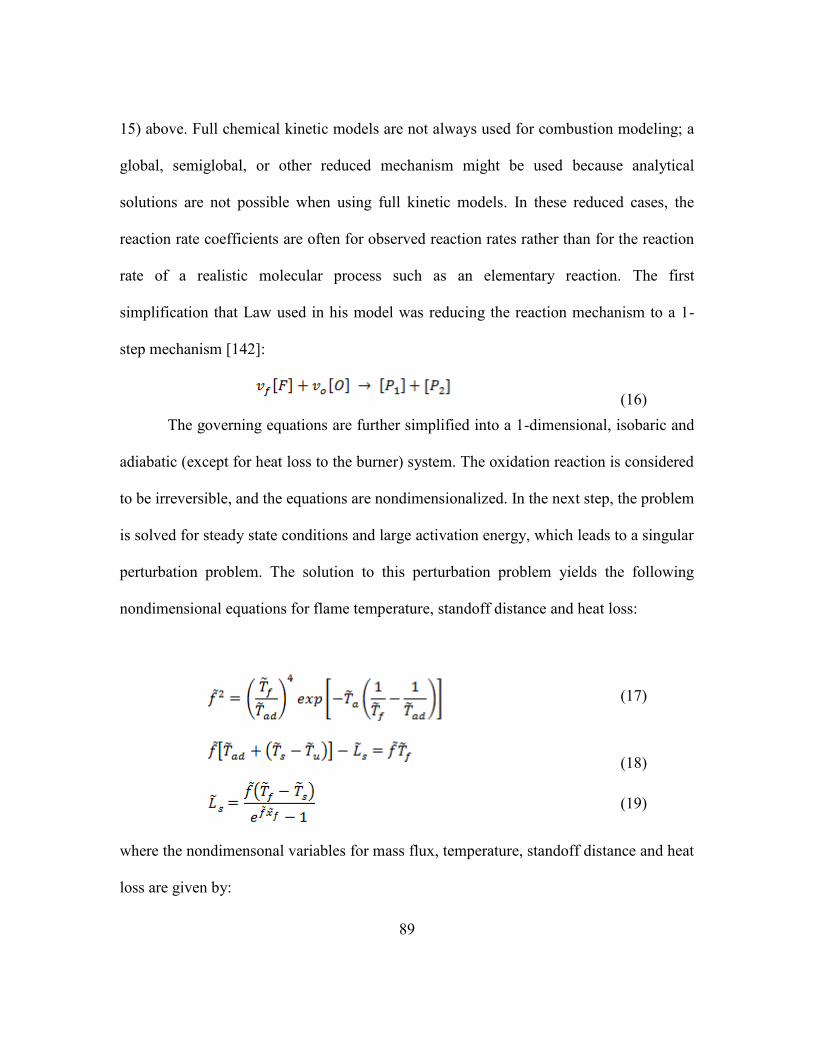
89
15) above. Full chemical kinetic models are not always used for combustion modeling; a
global, semiglobal, or other reduced mechanism might be used because analytical
solutions are not possible when using full kinetic models. In these reduced cases, the
reaction rate coefficients are often for observed reaction rates rather than for the reaction
rate of a realistic molecular process such as an elementary reaction. The first
simplification that Law used in his model was reducing the reaction mechanism to a 1-
step mechanism [142]:
(16)
The governing equations are further simplified into a 1-dimensional, isobaric and
adiabatic (except for heat loss to the burner) system. The oxidation reaction is considered
to be irreversible, and the equations are nondimensionalized. In the next step, the problem
is solved for steady state conditions and large activation energy, which leads to a singular
perturbation problem. The solution to this perturbation problem yields the following
nondimensional equations for flame temperature, standoff distance and heat loss:
(17)
(18)
(19)
where the nondimensonal variables for mass flux, temperature, standoff distance and heat
loss are given by:

90
and is the mass flux, is the laminar burning flux, is the temperature, is the
adiabatic flame temperature based on the unburned reactant temperature, , is the
standoff distance, is the density, and is the mass diffusion coefficient.
To obtain dimensional values for the quantities of interest, the following
dimensional versions of equations (17), (18) and (19) are used:
(20)
(21)
(22)
To obtain dimensional values for the quantities of interest, laminar burning fluxes
and adiabatic flame temperatures obtained from Cantera solutions were also used. Two
other parameters, the activation temperature, , and the product, , required
dimensional values. Both of these parameters were set by calibration to experimental
data. The activation temperature was set to 15098 K such that the flame temperature
given by the analytical model matched the flame temperature, 1850 K, for methane/air at
φ = 1.2, V = 11 cm/s as reported by [132]. Setting = 5.5E-5 yielded the best fit to our
experimental data for standoff distance at φ = 1.25. This value of corresponded to the
mass average value of for a mixture of methane and air with φ = 1.25 at
approximately 1025 K.

91
Using Law’s solution, first the laminar flame speed, adiabatic flame temperature
and activation temperature were used along with the mass flux to determine the flame
temperature. The flame temperature, the adiabatic flame temperature, the surface
temperature (which equals the unburned gas temperature), the density-diffusivity product
and the mass flux were then used to determine a value for the temperature gradient at the
surface. This temperature gradient was then used to determine the standoff distance in
equation (22).
Equilibrium calculations for varying φ and initial reactant temperature were
completed to compare with data from combustion processes that approach equilibrium in
the limit of infinitely fast kinetics and adiabatic conditions [39, 59]. In these calculations,
the initial temperature and φ were selected and enthalpy and pressure were held constant
for equilibration. The equilibrium calculations provide insight into the thermodynamic
properties of the mixtures, and equilibrium has been assumed to represent the species
concentrations in the post-flame region of burner-stabilized flames [132, 143]. These
calculations were performed in Cantera with thermodynamic data from GRI3.0. Solid
carbon formation was included in all of the presented equilibrium calculations. These
calculations show that no solid carbon is formed for methane/air mixtures until φ exceeds
approximately 3.3.
The models are used to predict flame standoff distance in terms of the location of
maximum CH concentration, flame temperature, stability limits and species yields.
Experimentally, we define a stability limit as φ, V pair where if either is increased the
flame ceases to be flat as described in detail in section 3.2.4. For the burner-stabilized
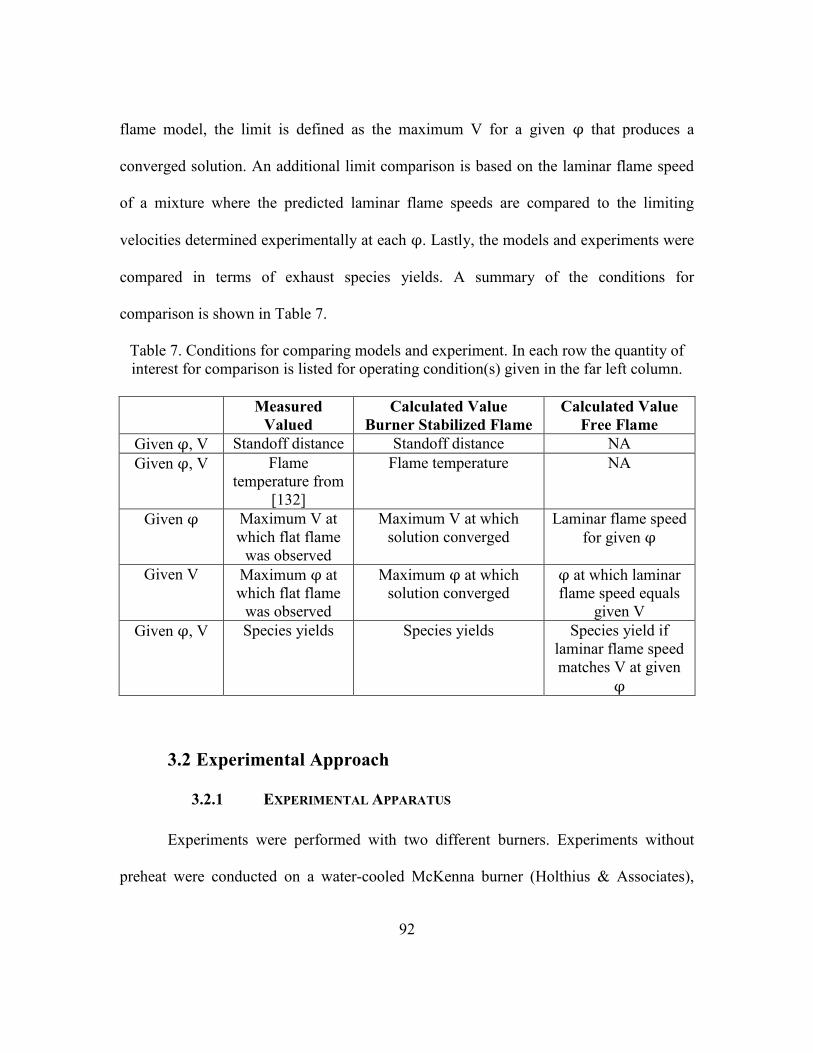
92
flame model, the limit is defined as the maximum V for a given φ that produces a
converged solution. An additional limit comparison is based on the laminar flame speed
of a mixture where the predicted laminar flame speeds are compared to the limiting
velocities determined experimentally at each φ. Lastly, the models and experiments were
compared in terms of exhaust species yields. A summary of the conditions for
comparison is shown in Table 7.
Table 7. Conditions for comparing models and experiment. In each row the quantity of
interest for comparison is listed for operating condition(s) given in the far left column.
Measured
Valued
Calculated Value
Burner Stabilized Flame
Calculated Value
Free Flame
Given φ, V Standoff distance Standoff distance NA
Given φ, V Flame
temperature from
[132]
Flame temperature NA
Given φ Maximum V at
which flat flame
was observed
Maximum V at which
solution converged
Laminar flame speed
for given φ
Given V Maximum φ at
which flat flame
was observed
Maximum φ at which
solution converged
φ at which laminar
flame speed equals
given V
Given φ, V Species yields Species yields Species yield if
laminar flame speed
matches V at given
φ
3.2 Experimental Approach
3.2.1 EXPERIMENTAL APPARATUS
Experiments were performed with two different burners. Experiments without
preheat were conducted on a water-cooled McKenna burner (Holthius & Associates),

93
which has a sintered porous bronze plate as the burner-surface. This burner is shown in
Figure 43. The water flow was ~13 [g/s] for all experiments, efficiently cooling the
burner surface. Because of the high thermal conductivity of the burner surface and the
high flow rate of the cooling water, the temperature of the burner surface was constant at
the water temperature during the experiments. The McKenna burner was used to establish
a baseline with which to compare the experiments with preheated reactants and to
determine the accuracy of the models since the McKenna burner is well-established for
this comparison.
Figure 43. Graphic of the McKenna burner [144]
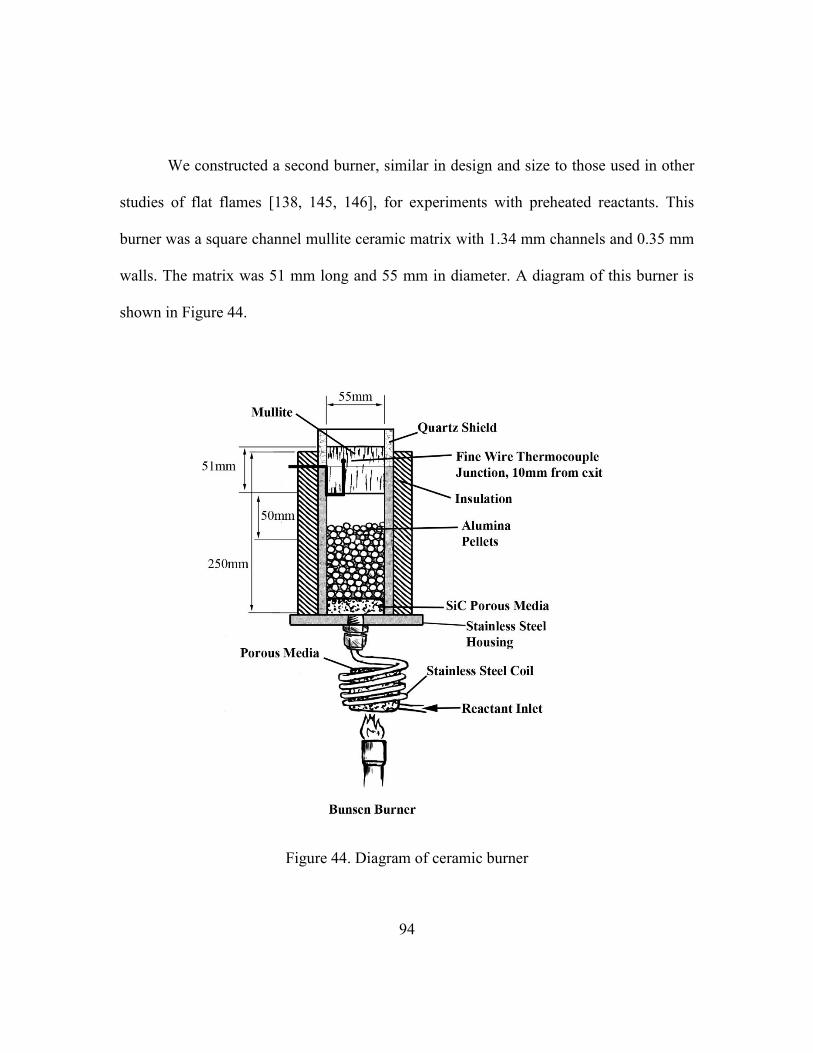
94
We constructed a second burner, similar in design and size to those used in other
studies of flat flames [138, 145, 146], for experiments with preheated reactants. This
burner was a square channel mullite ceramic matrix with 1.34 mm channels and 0.35 mm
walls. The matrix was 51 mm long and 55 mm in diameter. A diagram of this burner is
shown in Figure 44.
Figure 44. Diagram of ceramic burner

95
In all experiments, a quartz tube of 55 mm ID was used to shield the flames from
external air. The quartz tubes were used instead of inert gas shielding because the exhaust
gas samples were extracted from the center of the flame, where the quartz tube boundary
had no effect. We found no observable difference in any measurements by running
experiments with and without the quartz tube as a shield.
The flows were controlled with calibrated Hastings mass flow controllers. The air
was compressed, dry laboratory air, and the methane was CP grade from Air Liquide.
Preheating was accomplished by running the premixed methane/air through a helical coil
of stainless steel heated by a Bunsen-burner before entering the reactor housing. The
temperature of the reactants was monitored by a fine wire K-type thermocouple placed
within the ceramic plug upstream of the preheat zone of a burner-stabilized flame. It was
confirmed that fuel breakdown did not occur due to preheating before reaching the flame
by sampling the gases after heating but without a flame.
3.2.2 CHEMILUMINESCENCE MEASUREMENT AND STANDOFF
DISTANCE
In a hydrocarbon flame, fuel breakdown occurs and various intermediate species
are created. In some cases the intermediate species are formed in excited states. The CH
radical often is created in a higher electronic energy state than its ground electronic state,
2π Though CH can be created in multiple high energy states the most common is 2Δ.
This excited CH, defined as CH*, relaxes from 2π to
2Δ (with no change in vibrational
energy levels) and releases a photon with an energy equal to the difference between the

96
energies of those two states. In this case, a photon is released with a wavelength of
431.42 nm [147]. Hai Wang of USC [148] suggested the following reaction mechanism
for CH and CH*:
Table 8. Chemical kinetic mechanism for excited CH radical ([148])
Reaction A b Ea
1 C2H + O = CO + CH* 2.50E+12 0 0
2 C2H + O2 = CO2 + CH* 3.20E+11 0 1600
3 C2 + H2 = C2H + H 4.00E+05 2.4 1000
4 CH + CH = C2 + H2 5.00E+12 0 0
5 C + C + M = C2 + M 3.00E+14 0 1000.0
6 C + CH = C2 + H 5.00E+13 0 0
7 O + C2 = C + CO 5.00E+13 0 0
8 C2 + O2 = CO + CO 9.00E+12 0 980
9 C2 + OH = CO + CH* 1.11E+13 0 0
10 C + H + M = CH* + M 3.63E+13 0 0
11 CH* = CH 1.86E+06 0 0
12 CH* + N2 = CH + N2 3.03E+02 3.4 -381
13 CH* + O2 = CH + O2 2.48E+06 2.14 -1720
14 CH* + H2O = CH + H2O 5.30E+13 0 0
15 CH* + H2 = CH + H2 1.47E+14 0 1361
16 CH* + CO2 = CH + CO2 2.41E-01 4.3 1694.0
17 CH* + CO = CH + CO 2.44E+12 0.5 0
18 CH* + CH4 = CH + CH4 1.73E+13 0 167
This mechanism is used to determine the rate constant from the modified
Arrhenius equation. As can be seen from the mechanism, there are 4 reactions that
produce an excited CH molecule, three of them with C2 species as reactants (reactions 1,
2 and 9) and one three-body reaction (reaction 10). When an excited CH is created it has
many pathways to de-excite including spontaneous de-excitation (reaction 11). De-

97
excitation occurs quickly (typically between 10-6
and 10-8
seconds [147]) so CH* and CH
should be spatially nearly coincident. This spatial coincidence is predicted by numerical
simulation as described by Figure 45, which shows the normalized concentrations of CH
and CH* as a function of distance from the burner surface for a simulation of a flame
with φ = 1.1 and inlet velocity = 5 cm/s.
Figure 45. CH/CH* concentration vs distance from burner surface
As noted in the literature [149], CH and CH* are present in a thin region of a
premixed flame and is nearly coincident with location of the reaction zone. Consequently,
the standoff distance can be determined by measuring the distance between the burner
surface and the maximum CH* concentration. A system built to measure the spatial
location and intensity of CH* chemiluminescence, consisted of a digital webcam
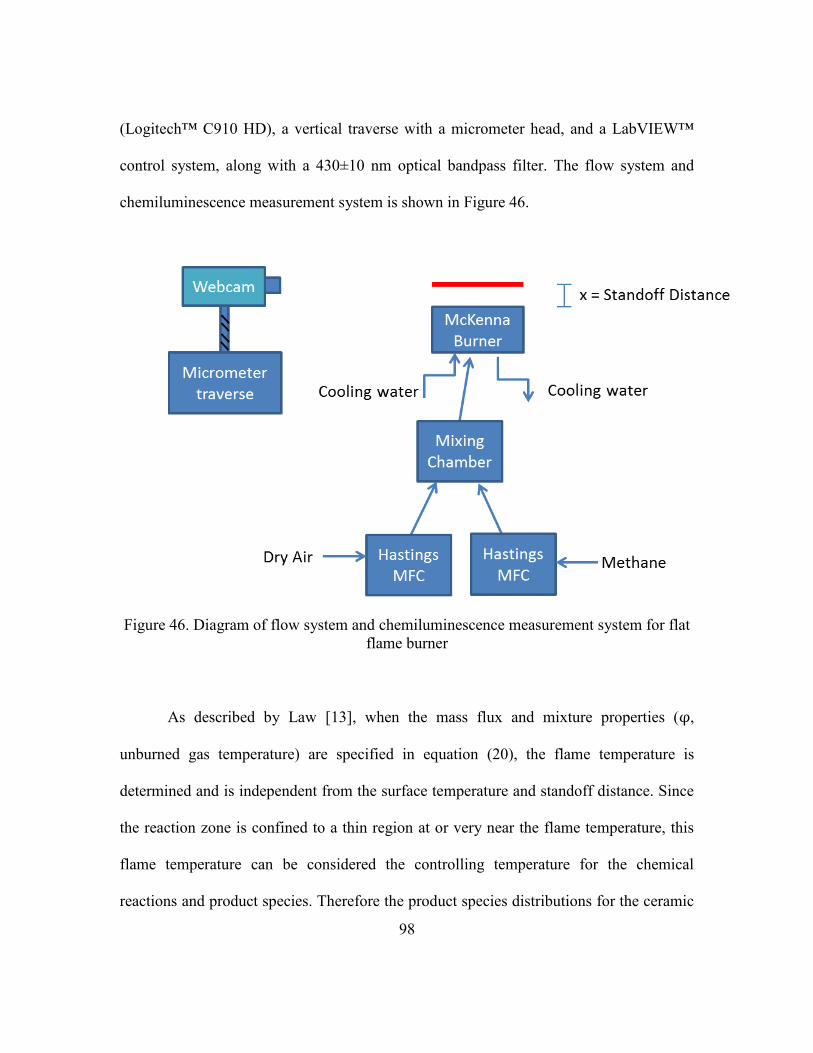
98
(Logitech™ C910 HD), a vertical traverse with a micrometer head, and a LabVIEW™
control system, along with a 430±10 nm optical bandpass filter. The flow system and
chemiluminescence measurement system is shown in Figure 46.
Figure 46. Diagram of flow system and chemiluminescence measurement system for flat
flame burner
As described by Law [13], when the mass flux and mixture properties (φ,
unburned gas temperature) are specified in equation (20), the flame temperature is
determined and is independent from the surface temperature and standoff distance. Since
the reaction zone is confined to a thin region at or very near the flame temperature, this
flame temperature can be considered the controlling temperature for the chemical
reactions and product species. Therefore the product species distributions for the ceramic

99
burner, which does not have a controlled surface temperature, the McKenna burner and
the burner-stabilized flame model may be directly compared when the mass flux and
mixture properties are identical. In addition they may be compared in terms of limit
conditions because under limit conditions there is no thermal interaction between the
flame and the burner surface.
The standoff distances are not compared to the modeling results for preheated
reactants because the standoff distance is a function of the surface temperature, which is
not controlled in these experiments using the ceramic burner. In contrast to the McKenna
burner where the surface temperature is effectively controlled by the temperature of the
cooling fluid, in the ceramic burner the surface temperature is a function of operating
conditions. Stabilization is achieved through heat loss to the environment primarily by
radiation from the burner surface. The required heat loss and burner surface temperature,
then, determine the standoff distance.
3.2.3 SPECIES MEASUREMENT
Measurements of species concentrations in the exhaust were taken with a Varian
(Agilent) CP-4900 gas chromatograph, which measures H2, CO, nitrogen (N2), carbon
dioxide (CO2), methane (CH4), ethylene (C2H4), acetylene (C2H2) and select higher
hydrocarbons. No compounds greater than C2 were detected in any experiments. The
sources of uncertainty were in the flow rates of methane and air, the calibration standards,
and the gas chromatograph calibration. Uncertainties in species measurements were
100
calculated using a Student t distribution, and uncertainties for calculations were based on
sequential perturbation (see appendix A).
The species results are reported in terms of dry species concentrations. The GC
does not report the concentration of water in the products, and besides solid carbon and
higher hydrocarbons, water is the only species that is not reported by the GC. Under
conditions when solid carbon and large hydrocarbons are not expected to form, the dry
mole fractions can be found by assuming that the difference between the concentrations
(reported in mole %) and 100% is the concentration of water. Each of the reported
species concentrations is then converted to a dry fraction by dividing the concentration by
the sum of the concentrations reported by the GC.
The ideal way to measure the species at a specific time and location would be to
freeze the reactions and count the number of moles of each species in a very small
volume without disturbing the fields of concentration, temperature or velocity. The best
approximation to this ideality when using a GC is to sample the gases through a quartz
(inert) tube that is very small and efficiently cooled. Cooling the gases reduces the rate of
reaction to a point where they are “frozen” so that the gas analyzed by the GC has the
same molecular composition as it had at the point of sampling. The cooling of the gases
within the tube, however, presents a problem because the temperature and velocity field
cannot be significantly disturbed by the sample probe, especially if it is cold. In order to
not disturb the fields, the sample probe was designed with a very thin tip (1 mm OD), and
cooling took place approximately 1 cm from the tip (Figure 47). After the gases passed
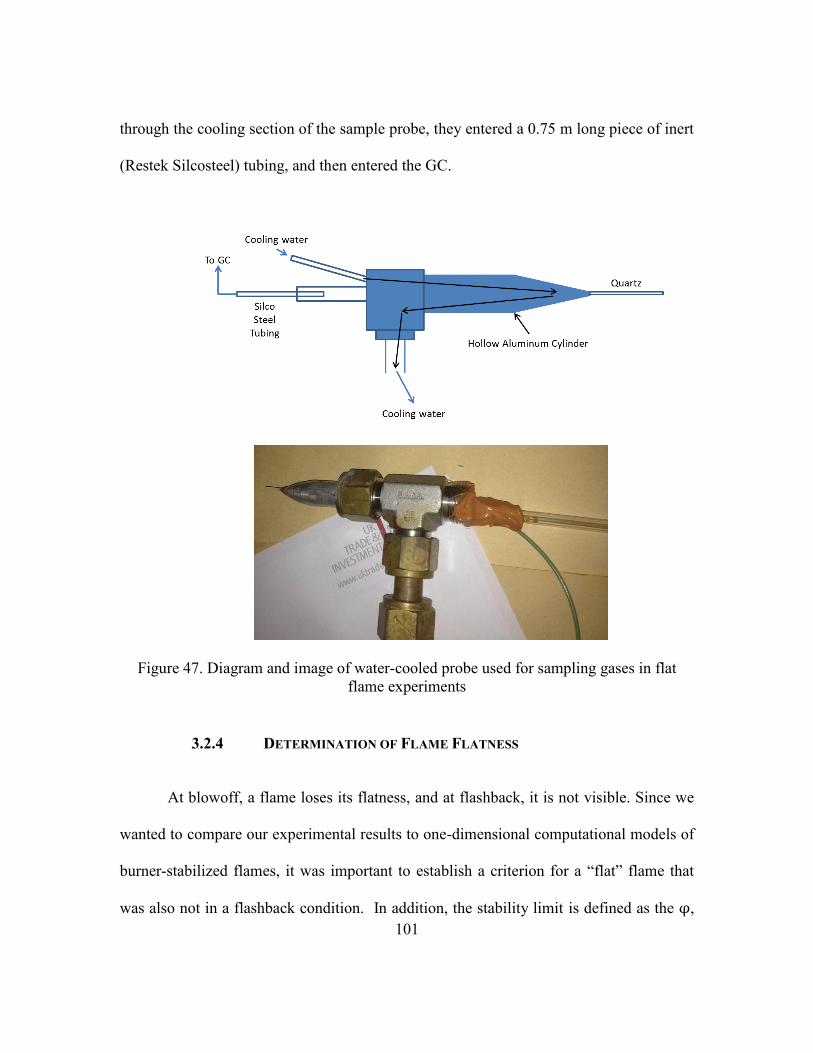
101
through the cooling section of the sample probe, they entered a 0.75 m long piece of inert
(Restek Silcosteel) tubing, and then entered the GC.
Figure 47. Diagram and image of water-cooled probe used for sampling gases in flat
flame experiments
3.2.4 DETERMINATION OF FLAME FLATNESS
At blowoff, a flame loses its flatness, and at flashback, it is not visible. Since we
wanted to compare our experimental results to one-dimensional computational models of
burner-stabilized flames, it was important to establish a criterion for a “flat” flame that
was also not in a flashback condition. In addition, the stability limit is defined as the φ,

102
V beyond which a flame would not be flat if either parameter was increased. These
limiting conditions were found by perturbing φ and V while monitoring the flame
flatness though CH* chemiluminescence imaging. Representative grayscale CH*
chemiliuminescence images of one flame that is not flat and one flame that is flat are
shown in Figure 48.
Figure 48. Pictorial diagrams describing the flatness metric used in this paper on a highly
non-flat flame and a flat one.
The flame flatness was quantified by finding the variance of the full width (in y
direction) at half maximum (FWHM) grayscale intensity along the x axis. By this
definition, a perfectly flat flame has zero FWHM intensity variance. To find the FWHM
intensity variance, the grayscale data was analyzed by a Matlab program using the
following psuedocode with input being a 3D matrix of intensity, pixel number in x
direction and pixel number in y direction;

103
for each pixel number in x
1. find maximum intensity amongst all y pixels
2. find y pixel on each side of maximum that has intensity value equal to
½ the maximum intensity
3. find distance between two pixels found in step 2. Store this value as
value of FWHM for given x pixel
end for loop
find variance of all FWHM values
To determine the experimental limiting conditions (the conditions where increases
in φ or V would produce a nonflat flame), velocity was held constant while φ was
adjusted by increments of 0.005 for five different values of φ surrounding a suspected
limit and images were taken to determine the FWHM variance for each condition. A limit
value of φ was defined as a tested φ limit where the FWHM variance found in the set of
five conditions at least doubled. A plot of FWHM variance vs. equivalence ratio (Figure
49) for a given inlet velocity (19.88 cm/s) describes how such a limit was found:

104
Figure 49. Variance of FWHM intensity of CH* chemiluminescence vs. equivalence ratio
(V = 19.88 cm/s)
Figure 49 shows a clear, rapid increase in FWHM variance as the equivalence
ratio increases from 1.33. From this figure one limit condition, V = 19.88 cm/s and phi =
1.33, was determined. From figures like these, we determined the limit conditions in the
entire equivalence ratio/inlet velocity parameter space. Flames with operating conditions
within the bounds of the limiting conditions were flat, and in this paper we only report
measurements from flat flames.
3.3 Results and Discussion
Previous research on the conversion of rich fuel/air mixtures has shown that
optimal production of syngas may occur beyond the conventional flammability limits.
105
Optimization, however, of reactor performance remains challenging because the level of
preheat necessary is unclear. In the following sections, we discuss experimental,
computational, and analytical results which provide some insight into the importance of
preheating for conversion of rich methane/air mixtures.
3.3.1 COMPARISON OF EXPERIMENTAL AND NUMERICAL MODELING
DATA
Since combustion models are not extensively compared to experimental data in
the rich regime [139], we present comparisons of standoff distance, stability, and
temperature in order to gain confidence in the predictions of the models, which are
subsequently used to investigate a broader range of conditions than was investigated
experimentally. In this section the computational models were compared to the results
from experiments on the McKenna burner and the analytical model under non-preheated
conditions.
Standoff distance
For a flat flame to stabilize on the surface of a burner, the burning velocity of the
flame must match the inlet velocity. Matching of these velocities occurs because heat loss
to the burner decreases the flame temperature and therefore decreases the burning
velocity as described in detail in the literature [13, 150, 151]. The standoff distance,
which we use for comparison between the model and experiment, is a fundamental

106
characteristic of burner-stabilized flames and has been used by other researchers for such
comparison [152, 153].
Experimental, computational, and analytical results show that the flame standoff
distance decreases with increasing inlet velocity, as shown in Figure 50. In the range of
inlet velocities tested, the model and experiment agreed very well in both trend and
magnitude, and the analytical model fits the data very well. This trend has been observed
by other researchers and is explained in detail in the literature [137, 151].
5 10 15 20 250
0.5
1
1.5
2
Inlet Velocity (cm/s)
Sta
nd
off D
ista
nce
(m
m)
Experiments
Computations
Analytical Model
Figure 50. Standoff distance vs. inlet velocity at equivalence ratio = 1.25 ± 0.05
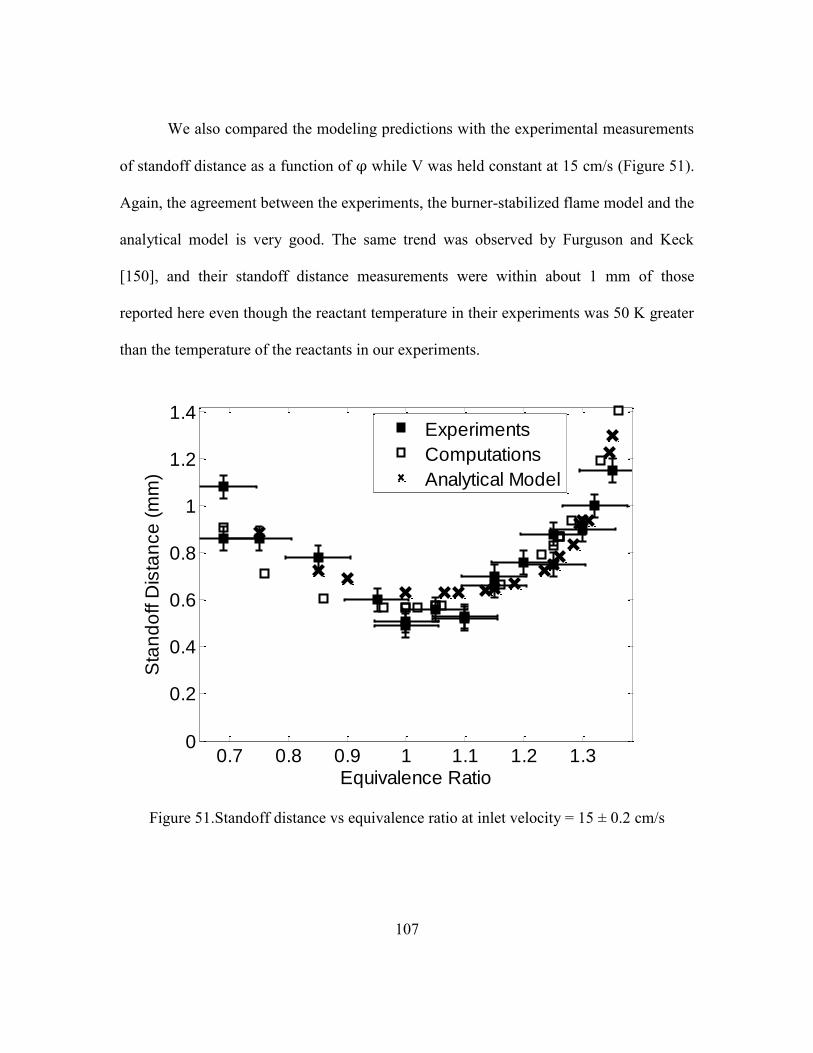
107
We also compared the modeling predictions with the experimental measurements
of standoff distance as a function of φ while V was held constant at 15 cm/s (Figure 51).
Again, the agreement between the experiments, the burner-stabilized flame model and the
analytical model is very good. The same trend was observed by Furguson and Keck
[150], and their standoff distance measurements were within about 1 mm of those
reported here even though the reactant temperature in their experiments was 50 K greater
than the temperature of the reactants in our experiments.
0.7 0.8 0.9 1 1.1 1.2 1.30
0.2
0.4
0.6
0.8
1
1.2
1.4
Equivalence Ratio
Sta
nd
off D
ista
nce
(m
m)
Experiments
Computations
Analytical Model
Figure 51.Standoff distance vs equivalence ratio at inlet velocity = 15 ± 0.2 cm/s

108
The standoff distance is one of the fundamental global parameters that
characterize burner-stabilized flames. Over a range of V and φ, the burner-stabilized
flame model was a very good predictor of standoff distance. Law’s analytical model also
fits the experimental and modeling data very well in trend and in magnitude except for a
slight overprediction near stoichiometric.
Flame Temperature
Simulations of burner-stabilized flames are often conducted using experimental
temperature profiles as inputs rather than solving the energy equation for the temperature
profile. In our case, the energy equation was solved and the temperature profile was a
simulation output. The model results for flame temperature were compared to
experimental data from published CARS measurements [132].
Figure 52 and Figure 53 show experimental temperature data based on CARS
measurements by [132] and computational data along with the adiabatic flame
temperature for reference. As is clear from the figures, heat loss to the burner makes
these flames have sub-adiabatic temperatures at all conditions. Significantly, the results
from Cantera matched the experimental results well in trend at all tested conditions
though the experimental data were slightly higher than the computational data. This
difference can be explained by the radiative heat loss of about 10K per mm [136]
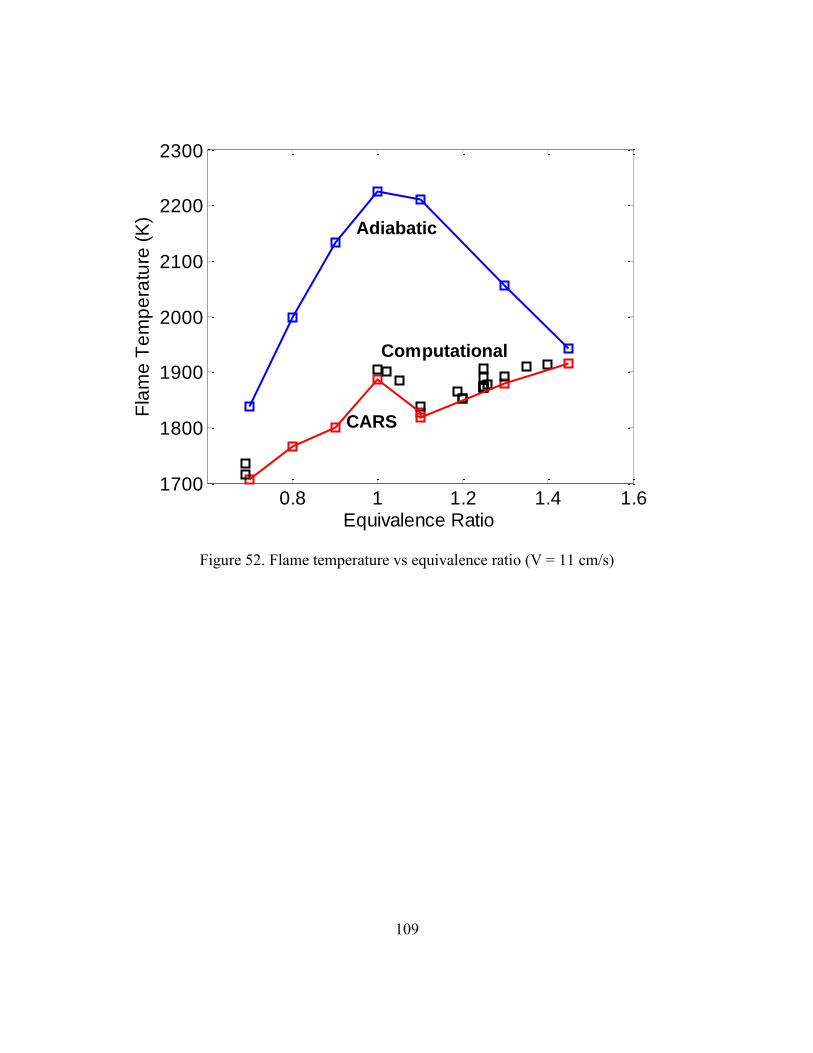
109
0.8 1 1.2 1.4 1.61700
1800
1900
2000
2100
2200
2300
Equivalence Ratio
Fla
me
Te
mp
era
ture
(K
)
Computational
Adiabatic
CARS
Figure 52. Flame temperature vs equivalence ratio (V = 11 cm/s)

110
0 5 10 15 20 25 301600
1700
1800
1900
2000
2100
2200
Inlet Velocity (cm/s)
Fla
me
Te
mp
era
ture
(K
)
Computational
Adiabatic
CARS
Figure 53. Flame temperature vs inlet velocity (φ = 1.2)
Limit conditions
We experimentally determined the limiting φ, V where a flat flame was stabilized
as explained in section 3.2.4. These values are compared to the calculated laminar flame
speeds in Figure 54. Also shown are the limiting φ, V pairs where converged solutions to
the burner-stabilized flame model were found. On the rich side, where our focus is, the
match between the experiments and computations is very good, except at the highest φ.
On the lean side the trend is correct, but the magnitudes of the laminar flame speeds are

111
somewhat higher than the limiting inlet velocities found in the experiments and the
burner-stabilized flame model. In the experiments the limiting velocities disagreed with
the laminar flame speeds at near stoichiometric conditions. The burner-stabilized flame
model predicted these near-stoichiometric limits as well; simulations of burner-stabilized
flames with φ near stoichiometric failed to converge with inlet velocities close to the
laminar flame speed.
0.6 0.8 1 1.2 1.4 1.60
10
20
30
40
50
Equivalence Ratio
Inle
t V
elo
city / la
min
ar
fla
me
sp
ee
d (
cm
/s)
Experiments
Burner-stabilized comp.
Free flame comp.
Figure 54. Limit inlet velocity and laminar flame speed vs equivalence ratio
These comparisons indicate that the computational model predicts flame standoff
distance and temperature across a broad range of φ. In addition, the limits of operating

112
conditions corresponded well with the laminar flame speed determined from freely-
propagating flame simulations. These comparisons establish confidence that the models
can be used to predict the behavior of burner-stabilized flames especially at rich
conditions.
3.3.2 EFFECT OF PREHEATING ON THE CONVERSION OF RICH
MIXTURES TO SYNGAS
To provide a baseline for comparison to the results for flames with preheated
reactants, experiments and simulations were conducted with reactants at standard
conditions. These data are important also to complete the comparison between the models
and experiments and to establish the similarity between the two burners used
experimentally. Then data are presented for experiments and modeling of burner-
stabilized flames with preheated reactants to show the effect of preheat on syngas
production.
Comparison of McKenna and ceramic burner at baseline (unheated) conditions
As discussed in previously, the McKenna burner cannot withstand the preheat
temperatures of interest in this study so we constructed a ceramic burner for this purpose.
In Figure 55, the concentrations of H2, CO and CO2 are shown for experiments with both
burners as well as predictions from burner-stabilized flame simulations, freely-
propagating flame simulations, and equilibrium calculations. The error bars shown in
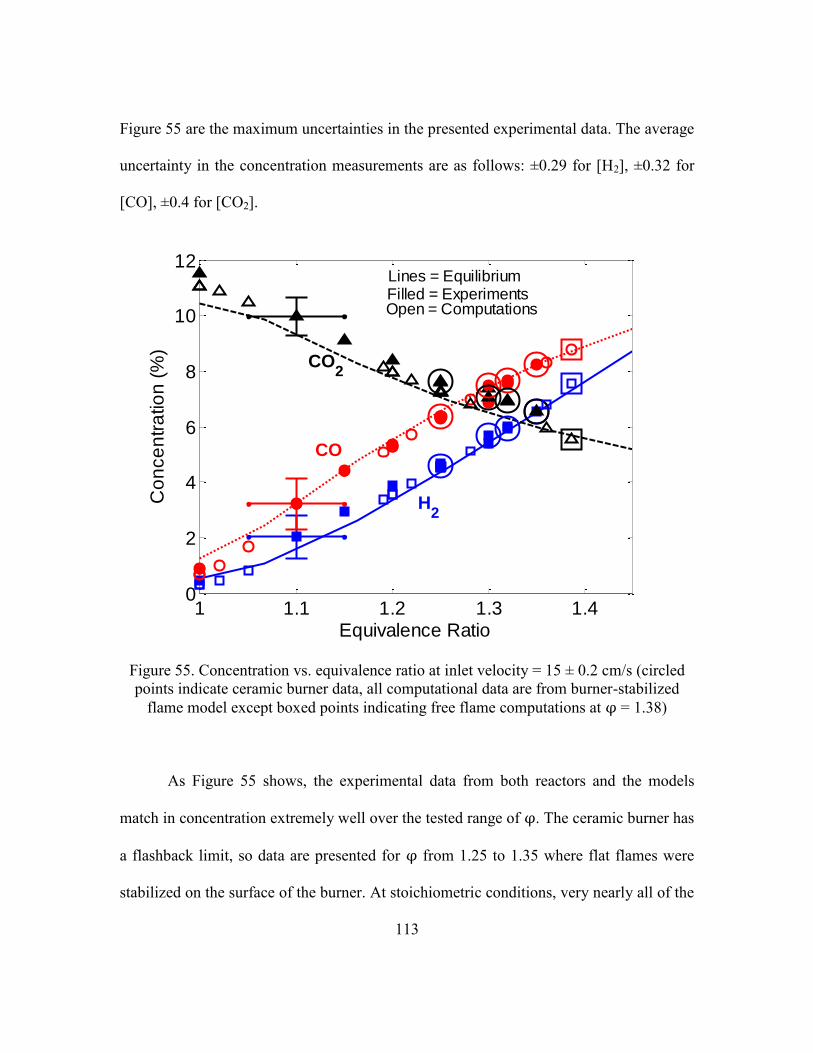
113
Figure 55 are the maximum uncertainties in the presented experimental data. The average
uncertainty in the concentration measurements are as follows: ±0.29 for [H2], ±0.32 for
[CO], ±0.4 for [CO2].
1 1.1 1.2 1.3 1.40
2
4
6
8
10
12
Equivalence Ratio
Co
nce
ntr
atio
n (
%)
Lines = EquilibriumFilled = ExperimentsOpen = Computations
CO2
CO
H2
Figure 55. Concentration vs. equivalence ratio at inlet velocity = 15 ± 0.2 cm/s (circled
points indicate ceramic burner data, all computational data are from burner-stabilized
flame model except boxed points indicating free flame computations at φ = 1.38)
As Figure 55 shows, the experimental data from both reactors and the models
match in concentration extremely well over the tested range of φ. The ceramic burner has
a flashback limit, so data are presented for φ from 1.25 to 1.35 where flat flames were
stabilized on the surface of the burner. At stoichiometric conditions, very nearly all of the

114
carbon in methane is converted to CO2 and little CO is observed. As φ increases, the
amount of carbon converted to CO2 decreases as the amount converted to CO increases.
Negligible amounts of small hydrocarbons were measured by the GC. Therefore, as φ is
increased, more hydrogen in methane is converted to H2 at the expense of H2O. Both
computations and experiments showed very nearly equilibrium levels of CO2, CO and H2.
Lastly, the concentration of syngas increases monotonically with φ suggesting that even
richer φ might improve syngas production if stable operation could be accomplished.
Concentrations for CO, CO2 and H2 are almost identical to the equilibrium values
and are consistent with the trend of species concentrations seen in the burner-stabilized
flame experiments and models. In the experiments if φ is increased, the standoff distance
increases, but the flame remains flat (burner-stabilized) until the φ ≈ 1.32 on the
McKenna burner and φ ≈ 1.35 on the ceramic burner. When φ is increased further, the
flame becomes unstable because the laminar flame speed of the mixture approaches V;
under this condition the flame can be considered nearly adiabatic, and the predictions of
the freely-propagating flame model become appropriate for comparison. At 300 K, a free
flame of methane and air has a laminar flame speed of 15 cm/s when φ ≈ 1.38.
We measured species concentrations while varying V and holding φ constant at
1.25 to determine if the two burners and the model results were consistent across a range
of V. These data are shown in Figure 56.

115
0 5 10 15 20 25 300
2
4
6
8
10
Inlet Velocity (cm/s)
Co
nce
ntr
atio
n (
%)
Open = ComputationsFilled = ExperimentsLines = Equilibrium
CO2
CO
H2
Figure 56. Concentration vs. inlet velocity at equivalence ratio = 1.25 ± 0.05 (circled
points indicate ceramic burner data, all computational data are from burner-stabilized
flame model except boxed points indicating free flame computations at V = 29 cm/s)
The computations predict almost no change in species concentration as a function
of V in the range of inlet velocities that were tested experimentally. However, at very low
inlet velocities the computations predict that more methane is converted to CO2 at the
expense of CO. The experiments show almost no change in concentration for both the
McKenna burner and the ceramic burner. The equivalence ratio strongly affects species
concentrations, as shown in Figure 55, and there is uncertainty in φ for all experimental
data points when V is varied and φ is held constant. The uncertainties in species
116
concentration due to uncertainty in φ around φ = 1.25 are estimated as follows: ±0.8 for
[H2], ±0.9 for [CO] and ±0.8 [CO2]. Because of these uncertainties, which are shown in
Fig. 7 because they are larger than the raw measurement uncertainty, no variation in the
experimental data as a function of inlet velocity is implied in Figure 56. Further
explanation of this method for determining uncertainty is given in Appendix A.
The major conclusions from the previously presented data are that the ceramic
burner and the McKenna burner produce nearly identical species concentrations across a
range of φ and V. In addition, the burner-stabilized flame model and the free flame
model were very accurate in predictions of standoff distance, limit conditions and [CO],
[CO2] and [H2] at all φ and V tested.
Results from experiments and modeling with preheated reactants
Using the ceramic burner, we performed experiments with preheated reactants.
Figure 57 shows concentration as a function of φ with V held constant at 25 cm/s and the
reactants preheated to 617 K. Under unheated conditions on the ceramic burner for V =
25 cm/s the limit φ is 1.26.

117
1.2 1.4 1.6 1.8 20
5
10
15
20
Equivalence Ratio
Co
nce
ntr
atio
n (
%)
Lines = Equilibrium
CO2
CO
H2
Filled = Experiments
Open = Computations
Figure 57. Concentration vs. equivalence ratio at inlet velocity = 25 ± 0.05 cm/s and
reactant temperature = 617 ± 10 K (all computational data are from burner-stabilized
flame model except boxed points indicating free flame computations at φ = 1.9,
uncertainty in temperature is ± 10 K)
The burner-stabilized flame model matches the experimental data very closely.
Under this preheat condition, a stable flame was obtained up to φ = 1.75, which is greater
than the conventional flammability limit of 1.67 and significantly greater than the
operating limit observed when reactants were unheated (φ = 1.26). The maximum [H2]
and [CO] achievable under unheated conditions at V = 15 cm/s were 6.5% and 8.3%,
respectively, both occurring at φ = 1.35 as shown in Figure 57.
118
With reactants preheated, the maximum [H2] was 12.7% and the maximum [CO]
was 12%. These data show that preheating significantly extends the operating range of
burner-stabilized flames such that the stable burning of mixtures that produce high syngas
yields can be achieved. The data also show that the burner-stabilized flame model
produces very good predictions of species at φ even beyond the rich flammability limit.
In section 3.3.1 it was shown that the limiting conditions for the experiments, the
burner stabilized flame model and the laminar flame speed/equivalence ratio pairs were
nearly coincident for flames with unheated reactants. As shown in Figure 57 with
reactants preheated to 617 K the limiting equivalence ratio (φ = 1.75) for a converged
solution with the burner-stabilized flame model is nearly identical to the experimental
value as well. However, the mixture equivalence ratio (φ = 1.9) having a flame speed of
25 cm/s was significantly greater than the experimental and model limit for the burner-
stabilized flame.
A difference between these data and the data with unheated reactants is that the
experimental results and the computational results do not match the equilibrium values at
the highest values of φ. Up to the maximum achievable φ for the burner-stabilized flame,
the experiments and the model concentrations are very close to equilibrium for [CO2],
however [CO] begins to diverge from equilibrium slightly and [H2] begins to diverge
significantly when φ is greater than about 1.4. This divergence is somewhat unexpected
since preheating should increase the rate at which the mixture reaches equilibrium
relative to unheated conditions. However, under the preheated conditions, the φ that were
accessible were all relatively high (φ > 1.4), and at high φ the heat release is low, thus

119
slowing the kinetic processes. Even though preheating increases the range of accessible φ
by increasing reaction rates, the reaction rate increase is not great enough to allow full
equilibration of the mixture. Lastly, the freely-propagating flame model shows even more
substantial divergence from equilibrium for both [CO] and [H2] while [CO2] remains very
close to the equilibrium value. The concentrations for the freely-propagating flame are
consistent with the trend in concentration for the burner-stabilized flame. However, the
difference between the limit φ for the burner-stabilized flame model and experiment and
the φ having a flame speed of 25 cm/s casts doubt on the accuracy of the freely-
propagating flame model under this preheated condition.
The effect of reactant temperature was investigated by preheating reactants while
the equivalence ratio was held at 1.4 and the inlet velocity was held at 24 cm/s (Figure
58). The minimum temperature at which a stable flame was observed for these conditions
was 365 K, and the maximum temperature to which reactants were preheated in
experiments was 630 K.
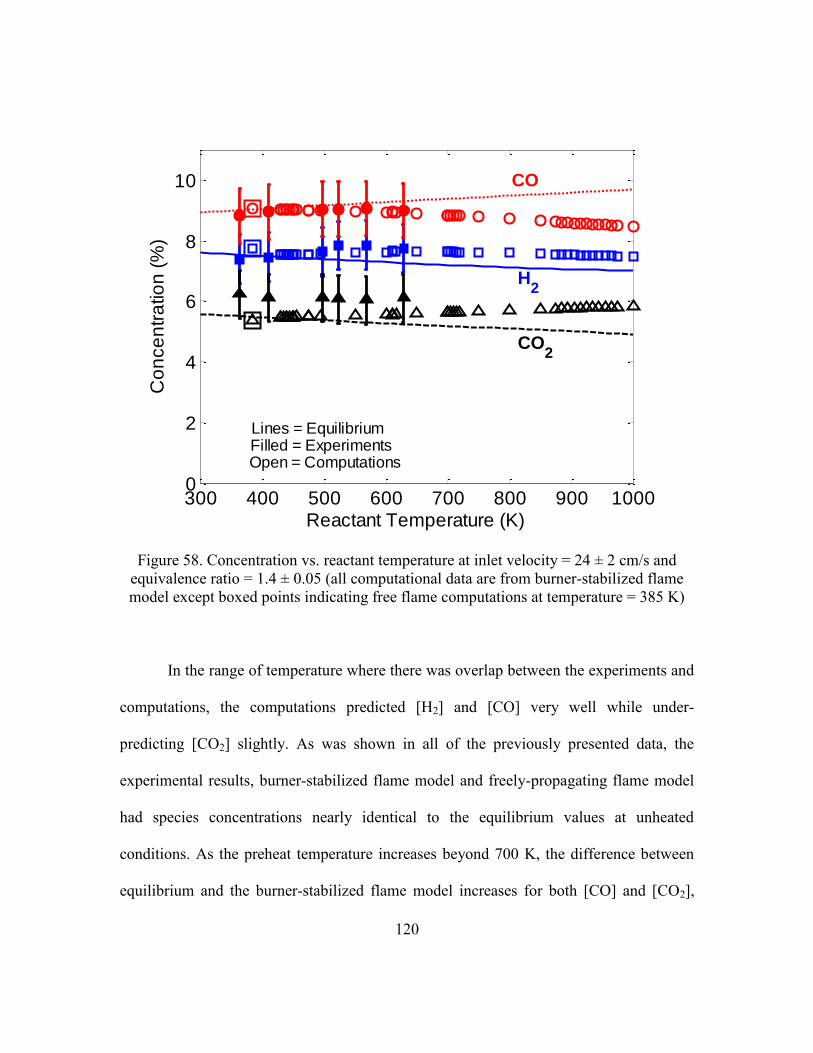
120
300 400 500 600 700 800 900 10000
2
4
6
8
10
Reactant Temperature (K)
Co
nce
ntr
atio
n (
%)
Lines = EquilibriumFilled = ExperimentsOpen = Computations
H2
CO2
CO
Figure 58. Concentration vs. reactant temperature at inlet velocity = 24 ± 2 cm/s and
equivalence ratio = 1.4 ± 0.05 (all computational data are from burner-stabilized flame
model except boxed points indicating free flame computations at temperature = 385 K)
In the range of temperature where there was overlap between the experiments and
computations, the computations predicted [H2] and [CO] very well while under-
predicting [CO2] slightly. As was shown in all of the previously presented data, the
experimental results, burner-stabilized flame model and freely-propagating flame model
had species concentrations nearly identical to the equilibrium values at unheated
conditions. As the preheat temperature increases beyond 700 K, the difference between
equilibrium and the burner-stabilized flame model increases for both [CO] and [CO2],
121
however the difference between the model and equilibrium in terms of [H2] does not
increase significantly with temperature. Lastly, the overall yield of syngas ([H2] and
[CO]) remains constant with preheat temperature indicating that preheating is important
for stabilizing a reaction, but not for improving syngas yield. The concentration
uncertainties shown in this plot are due to uncertainty in equivalence ratio because these
uncertainties are larger than the raw measurement uncertainties.
The minimum temperature at which a solution converged with the burner-
stabilized flame model was within 90 K of the limit temperature, which is the minimum
temperature at which a stable, flat flame was observed experimentally. The preheat
temperature at which the freely-propagating flame model reported a flame speed of 25
cm/s was within 20 K of this limit temperature. The coincidence of this temperature
amongst the models is another indication that the models are accurate in their prediction
of flame characteristics at low reactant temperature conditions.
Lastly, Figure 59 shows concentrations of CO, H2 and CO2 from four sets of
experiments with methane: unheated reactants on the McKenna burner, reactants
preheated to 617K on the ceramic burner, and two previously-published results from
experiments with filtration reactors [41, 43]. At the higher end of φ, the concentrations
are basically identical between the sets of data, and at the lower end H2 concentrations
match though CO2 concentrations and CO concentrations are higher and lower,
respectively, for the McKenna experiments versus the filtration combustion experiments.
Since these experiments were not all conducted under identical laboratory conditions,
strong conclusions cannot be drawn. However, the data suggest that enhancement of

122
transport processes has no effect on syngas production at the higher, syngas producing
equivalence ratios.
1 1.2 1.4 1.6 1.80
5
10
15
Equivalence Ratio
Co
nce
ntr
atio
n (
%)
Mck
Cer Heat
Bingue
Dhamrat
Figure 59. Comparison of concentrations for experiments with flat flame burners and
filtration reactors. Bingue [43] and Dhamrat [41] data are from filtration combustion
experiments.
3.4 Concluding Remarks Regarding the Effect of Preheat on
Burner-Stabilized Flames
An experimental and modeling study of burner-stabilized flames was conducted
to understand the effect of preheat on syngas production. First experiments were
123
conducted with unheated reactants so that confidence in the models could be gained for
their prediction of combustion characteristics, especially species yields, at high
equivalence ratios. The effect of preheat was investigated by preheating reactants up to
630 K while holding the inlet velocity and equivalence ratio constant.
The results showed that the burner stabilized flame model accurately predicts
standoff distance, limit conditions and species yields for experiments with flat flame
burners. Experiments with preheated reactants demonstrated that the operating limits for
a flat flame burner increase substantially with increased reactant temperature, allowing
the stable operation of the burner at richer equivalence ratios—where syngas yields are
greater—than those achievable with unheated reactants. The specific effect of inlet
temperature was investigated, and it was found that inlet temperature did not affect the
yield of syngas under the tested range of temperatures. Burner-stabilized flames with
preheated reactants showed deviations from equilibrium results in terms of species yields,
in contrast with unheated conditions where equilibrium predicts species yields for burner-
stabilized flames very well. The burner-stabilized flame model was able to predict the
deviation from equilibrium when reactants were preheated to ~630 K. At high preheat
temperatures, the limiting operating conditions of the experiment were well-predicted by
the burner-stabilized flame model but not by the laminar flame speed.
These results have important implications with regards to heat recirculating
reactors. First, the models, and therefore the kinetics mechanism, performed very well up
to richest equivalence ratio examined of 1.75, which exceeds the conventional rich
flammability limit. The only significant difference between the models and the

124
experiments was the difference between the limit equivalence ratio and the equivalence
ratio where the laminar flame speed was 25 cm/s when the reactants were preheated to
617 K. This means that those working on reactor models for rich combustion should have
confidence in GRI3.0 for predicting syngas production even beyond the rich flammability
limit. In heat-recirculating reactors, preheat is accomplished by transport enhancement,
which occurs in proximity to the reaction zone, as part of the reactor design. In the
experiments described here, the preheat occurred far upstream of the reaction zone and
was input from an external source. This experimental design provided a means to study
the effect of preheat temperature independent of enhanced transport mechanisms and
interaction with the reaction zone. The results show that preheat is necessary to attain
stable operation at extreme equivalence ratios. This was the expected result since
conditions (such as downstream propagation of the reaction zone in a filtration reactor)
that enhance preheat have been observed in heat-recirculating reactors when mixtures
expected to be unstable are burned. It was also found that further preheat does not
enhance syngas production. This result aids in the design of heat recirculating reactors
because it indicates that maximal heat recirculation may not be necessary for conversion
of fuel to syngas.

125
4 CONCLUSIONS AND RECOMMENDATIONS
Two aspects of rich and ultra-rich combustion for syngas production were
investigated in this study: the effect of fuel type and the effect of preheat. The effect of
fuel type was studied by performing new experiments with butanol and jet fuel in a
filtration reactor and comparing the results of these experiments with published
experimental data from studies with other fuels and with equilibrium calculations. The
effect of preheat was studied experimentally and numerically with burner-stabilized
methane flames. The results of these studies advance the knowledge of rich and ultra-rich
combustion for syngas production.
At present the study of rich combustion for syngas production is necessarily
mostly experimental since chemical kinetic mechanisms that are well-validated for very
rich conditions are not available. This is especially true for high molecular weight fuels
like butanol and jet fuel because the number of species and reactions that is necessary to
accurately model the chemistry grows exponentially with fuel size. A primarily
experimental investigation of the conversion of jet fuel and butanol to syngas was
undertaken to understand the potential of these fuels for conversion. With thee additional
experimental data, a comparison amongst fuels for conversion was also conducted. Soot
formation in jet fuel and butanol experiments complicated the analysis of the results. At
maximum, about 42% of the hydrogen in jet fuel was converted to H2 and 56% of carbon
was converted to CO. The H2 yield continued to increase with φ in the jet fuel
experiments whereas in the butanol experiments the yields for H2 and CO both reached
peaks within the tested operating range. The peak CO yield for experiments with butanol
was 72% and the peak H2 yield was 43%. Significant soot formation was observed in

126
experiments with both fuels, but soot formation was so significant in the jet fuel
experiments that it limited the range of experimental operating conditions. The
comparison amongst fuels indicated that higher conversion rates are observed with
smaller molecular weight fuels, generally. However, equilibrium calculations, which are
often used to determine trends in fuel conversion, showed the opposite trend.
Combustion in heat-recirculating reactors is very complex with solid phase
conduction and radiation, gas phase conduction and dispersion and convective coupling
between the solid and gas phases. Additionally, filtration combustion, which was the
focus of this study, is transient under many conditions, so measurements must be
interpreted relative to the state of the system at a given time. In order to investigate
preheat temperature, which is one important aspect of conversion in heat recirculating
reactors, experiments were undertaken with burner-stabilized flames that are effectively
1-D and steady-state. An additional advantage to this experimental design is that the
preheat temperature can be controlled as opposed to the situation in heat-recirculating
reactors. An extensive set of model calculations were compared to the experimental data
and used to investigate the effect of preheat temperatures that were beyond what was
achievable experimentally. Throughout the range of operating conditions that were tested
experimentally, the computational model was excellent in prediction of standoff distance,
flame temperature, and species concentration. Experiments where the reactants were
preheated showed a significant expansion of the stable operating range of the burner
(increasing the equivalence ratio at which the flame blew off). However, increasing
preheat temperature beyond what is required for stabilization did not improve syngas
yields.
Based on the results of this work, recommendations for further study include, first
and foremost, basic investigations of kinetics at high equivalence ratios. Though it was
127
shown that GRI3.0 predicted the behavior of premixed flames at relatively high
equivalence ratios, this was a low bar to pass relative to examinations at very high
equivalence ratios or with fuels that are significantly more complicated than methane.
The second major recommendation is to investigate soot production in premixed flames
of butanol and jet fuel. It was found that both fuels sooted significantly in experiments
with a filtration reactor, but a filtration reactor is not ideal for investigating soot
production because soot cannot be quantitatively measured in this configuration.

128
5 APPENDIX A: UNCERTAINTY
Uncertainty analysis relied upon the use of a Student-t distribution and sequential
perturbation. The values of concentration reported by the GC were averaged, and the
uncertainty was calculated by use of the student-t distribution [154]:
Where is the uncertainty of the mean value, is the tabulated value of the Student-t
distribution, is the standard deviation of the samples and is the sample size. The
distribution parameter, is a function of the number of samples, , and a confidence
interval, C.
The implementation of this equation in Matlab is given by the following Matlab
expression:
conf = .95;
dof = 1;
h2Unc = h2StdDev.*tinv(conf,dof)./sqrt(dof+1);
where h2Unc is the one-sided uncertainty bound, h2StdDev is the standard deviation
of the concentration measurements for h2, tinv is the Matlab function that computes the
value of t for the given confidence interval, conf, and degrees of freedom, dof. Degree
of freedom is defined as n-1.
Systematic uncertainty included uncertainty in the GC calibration and the
uncertainty in the calibration gas. The total uncertainty for each measurement was found
from the following equation:
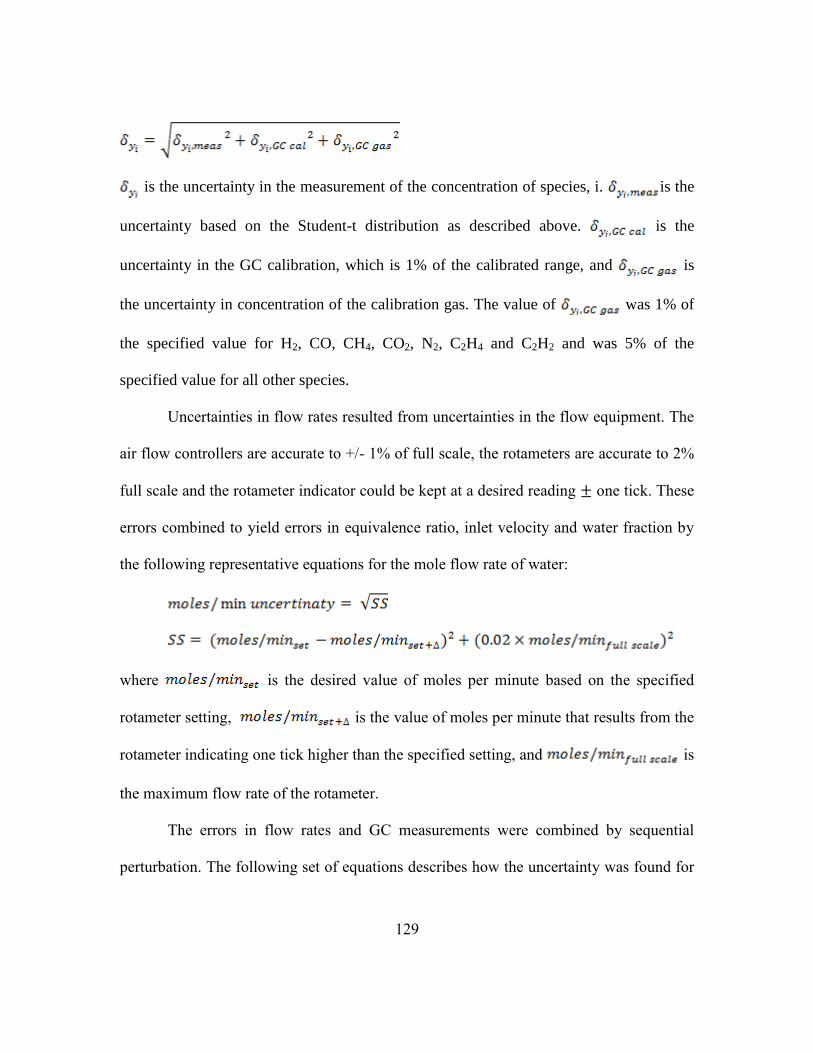
129
is the uncertainty in the measurement of the concentration of species, i. is the
uncertainty based on the Student-t distribution as described above. is the
uncertainty in the GC calibration, which is 1% of the calibrated range, and is
the uncertainty in concentration of the calibration gas. The value of was 1% of
the specified value for H2, CO, CH4, CO2, N2, C2H4 and C2H2 and was 5% of the
specified value for all other species.
Uncertainties in flow rates resulted from uncertainties in the flow equipment. The
air flow controllers are accurate to +/- 1% of full scale, the rotameters are accurate to 2%
full scale and the rotameter indicator could be kept at a desired reading ± one tick. These
errors combined to yield errors in equivalence ratio, inlet velocity and water fraction by
the following representative equations for the mole flow rate of water:
where is the desired value of moles per minute based on the specified
rotameter setting, is the value of moles per minute that results from the
rotameter indicating one tick higher than the specified setting, and is
the maximum flow rate of the rotameter.
The errors in flow rates and GC measurements were combined by sequential
perturbation. The following set of equations describes how the uncertainty was found for
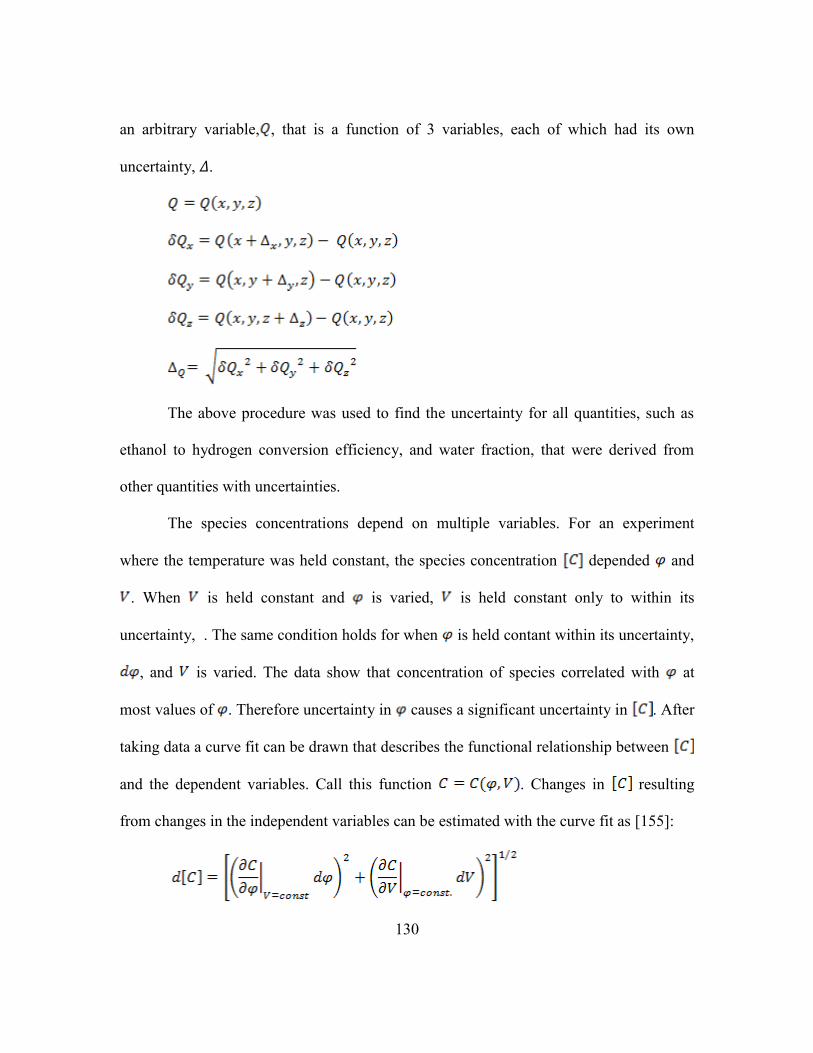
130
an arbitrary variable, , that is a function of 3 variables, each of which had its own
uncertainty, 𝛥.
The above procedure was used to find the uncertainty for all quantities, such as
ethanol to hydrogen conversion efficiency, and water fraction, that were derived from
other quantities with uncertainties.
The species concentrations depend on multiple variables. For an experiment
where the temperature was held constant, the species concentration depended and
. When is held constant and is varied, is held constant only to within its
uncertainty, . The same condition holds for when is held contant within its uncertainty,
, and is varied. The data show that concentration of species correlated with at
most values of . Therefore uncertainty in causes a significant uncertainty in . After
taking data a curve fit can be drawn that describes the functional relationship between
and the dependent variables. Call this function . Changes in resulting
from changes in the independent variables can be estimated with the curve fit as [155]:

131
where is the uncertainty in and is the uncertainty in
This method of finding the uncertainty in relies on a truncated Fourier
expansion of the function, so this expression is only valid if changes linearly within the
range of and . The uncertainty in equivalence ratio in the experiments
described in this document was typically large enough that the concentration did not
change linearly within the uncertainty of φ, so using this method would yield inaccurate
estimates of the uncertainty in . With a curve fit to the data, a more direct method of
obtaining the changes in with the changes in φ and V can be obtained as described by
the following graphic that describes the relationship between generic variables x and y.
Figure 60. Graphic describing uncertainty for large uncertainty in independent variable

132
Figure 60 shows a graph of a dependent variable, y, vs the independent variable,
x. The independent variable, x, has a fairly large uncertainties, Δx- and Δx
+. The
dependent variable, y, is not linear in the range x1-Δx- to x1+Δx
+. To find the uncertainty
in y given the uncertainty in x, the values of y at the extents of the range around x1 are
found. The value of y at x1 is then y(x1) = y1 with lower and upper bounds of y1-Δy- and
y1+ Δy+. This graphic is intended to illustrate the situation observed for the concentration
as a function of equivalence ratio and the uncertainty in the concentration that is a
consequence of the uncertainty in the equivalence ratio. Under some conditions, the raw
concentration measurement uncertainty described above is smaller than the uncertainty
due to uncertainty in equivalence ratio, so the larger of the two is shown on the plots
where equivalence ratio is held constant.

133
Bibliography
1. Spath, P.L. and D.C. Dayton, Preliminary Screening — Technical and Economic
Assessment of Synthesis Gas to Fuels and Chemicals with Emphasis on the
Potential for Biomass-Derived Syngas, NREL, Editor. 2003, NREL: Golden, CO.
2. Carrette, L., K.A. Friedrich, and U. Stimming, Fuel Cells - Fundamentals and
Applications. Fuel Cells, 2001. 1(1): p. 5-39.
3. Schoegl, I., Production of Hydrogen-Rich Syngas via Superadiabatic Combustion.
2009, Louisiana State University: Baton Rouge, LA.
4. Takanabe, K., K.-i. Aika, K. Seshan, and L. Lefferts, Catalyst deactivation during
steam reforming of acetic acid over Pt/ZrO2. Chemical Engineering Journal,
2006. 120(1-2): p. 133-137.
5. Krummenacher, J.J., K.N. West, and L.D. Schmidt, Catalytic partial oxidation of
higher hydrocarbons at millisecond contact times: decane, hexadecane, and
diesel fuel. Journal of Catalysis, 2003. 215(2): p. 332-343.
6. Sobacchi, M.G., A.V. Saveliev, A.A. Fridman, L.A. Kennedy, S. Ahmed, and T.
Krause, Experimental assessment of a combined plasma/catalytic system for
hydrogen production via partial oxidation of hydrocarbon fuels. Int. J. Hydrogen
Energy, 2002. 27: p. 635-642.
7. Al-Hamamre, Z. and A. Al-Zoubi, The use of inert porous media based reactors
for hydrogen production. International Journal of Hydrogen Energy. 35(5): p.
1971-1986.
8. Holladay, J.D., J. Hu, D.L. King, and Y. Wang, An Overview of Hydrogen
Production Technologies. Journal Name: Catalysis Today, 139(4):244-260;
Journal Volume: 130; Journal Issue: 4, 2009.
9. Moon, D.J., J.W. Ryu, S.D. Lee, B.G. Lee, and B.S. Ahn, Ni-based catalyst for
partial oxidation reforming of iso-octane. Applied Catalysis A: General, 2004.
272: p. 53-60.
10. Velu, S., X. Ma, C. Song, M. Namazian, S. Sethuraman, and G. Venkataraman,
Desulfurization of JP-8 Jet Fuel by Selective Adsorption over a Ni-based
Adsorbent for Micro Solid Oxide Fuel Cells. Energy & Fuels, 2005. 19(3): p.
1116-1125.
11. Lakhapatri, S.L. and M.A. Abraham, Analysis of catalyst deactivation during
steam reforming of jet fuel on Ni-(PdRh)-Al2O3 catalyst. Applied Catalysis A:
General. 405: p. 149-159.
12. Zabetakis, M.G., Flammability Characteristics of Combustible Gases and Vapors,
B.o.M. US Dept. of the Interior, Editor. 1965: Washington, DC.
13. Law, C.K., Combustion Physics. 2006: Cambridge University Press.
14. Lewis, B. and G. Von Elbe, Combustion, Flames, and Explosions of Gases. 1961,
New York: Academic Press.
15. Phillips, C., JP-8 Aviation Turbine Fuel MSDS, C. Phillips, Editor. 2012.
16. Williams, F.A., Combustion Theory. 1985: Benjamin/Cummings Pub. Co.
134
17. Liao, S.Y., D.M. Jiang, Z.H. Huang, Q. Cheng, J. Gao, and Y. Hu, Approximation
of flammability region for natural gas diluent mixture. Journal of Hazardous
Materials, 2005. 125(1–3): p. 23-28.
18. Weinberg, F.J., Combustion Temperatures: The Future? Nature, 1971. 233: p.
239.
19. Egerton, A., K. Gugan, and F.J. Weinberg, The Mechanism of Smouldering in
Cigarettes. Combust. Flame, 1963. 7: p. 63-78.
20. Takeno, T. and K. Sato, An Excess Enthalpy Flame Theory. Combust. Sci. Tech.,
1979. 20: p. 73-84.
21. Jones, A.R., S.A. Lloyd, and F.J. Weinberg, Combustion in Heat Exchangers.
Proc. R. Soc. Lond. A, 1978. 360: p. 97-115.
22. Advanced Combustion Methods, ed. F.J. Weinberg. 1986: Academic Press,
London, Orlando.
23. Babkin, V.S., V.I. Drobyshevich, Y.M. Laevskii, and S.I. Potytnyakov, Filtration
Combustion of Gases. Fizika Goreniya i Vzryva, 1983. 19(2): p. 17-26.
24. Hardesty, D.R. and F.J. Weinberg, Burners Producing Large Excess Enthalpies.
Combust. Sci. Tech., 1974. 8: p. 201-214.
25. Hackert, C.L., J.L. Ellzey, and O.A. Ezekoye, Combustion and heat transfer in
model two-dimensional porous burners. Combustion and Flame, 1999. 116(1-2):
p. 177-191.
26. Chen, C.-H. and P.D. Ronney, Three-dimensional effects in counterflow heat-
recirculating combustors. Proceedings of the Combustion Institute, 2010. 33(2):
p. 3285-3291.
27. Schoegl, I. and J.L. Ellzey, Superadiabatic Combustion in Conducting Tubes and
Heat Exchangers of Finite Length. Combust. Flame, 2007. 151: p. 142-159.
28. Sathe, S.B., M.R. Kulkarni, R.E. Peck, and T.W. Tong, An Experimental and
Theoretical Study of Porous Radiant Burner Performance. Proc. Combust. Inst.,
1990. 23: p. 1011-1018.
29. Smucker, M.T. and J.L. Ellzey, Computational and Experimental Study of a Two-
section Porous Burner. Combustion Science and Technology, 2004. 176(8): p.
1171 - 1189.
30. Vogel, B.J. and J.L. Ellzey, Subadiabatic and Superadiabatic Performance of a
Two-section Porous Burner. Combustion Science and Technology, 2005. 177(7):
p. 1323 - 1338.
31. Pedersen-Mjaanes, H., L. Chan, and E. Mastorakos, Hydrogen production from
rich combustion in porous media. International Journal of Hydrogen Energy,
2005. 30(6): p. 579-592.
32. Barra, A.J. and J.L. Ellzey, Heat Recirculation and Heat Transfer in Porous
Burners. Combust. Flame, 2004. 137: p. 230-241.
33. Alavandi, S.K. and A.K. Agrawal, Experimental study of combustion of
hydrogen-syngas/methane fuel mixtures in a porous burner. International Journal
of Hydrogen Energy, 2008. 33(4): p. 1407-1415.

135
34. Wood, S. and A.T. Harris, Porous burners for lean-burn applications. Progress in
Energy and Combustion Science, 2008. 34(5): p. 667-684.
35. Babkin, V.S., Filtrational Combustion of Gases. Present State of Affairs and
Prospects. Pure & Appl. Chem., 1993. 65(2): p. 335-344.
36. Bingue, J.P., A.V. Saveliev, and L.A. Kennedy, Optimization of hydrogen
production by filtration combustion of methane by oxygen enrichment and
depletion. International Journal of Hydrogen Energy, 2004. 29(13): p. 1365-1370.
37. Smith, C.H., D.M. Leahey, L.E. Miller, and J.L. Ellzey, Conversion of wet
ethanol to syngas via filtration combustion: An experimental and computational
investigation. Proceedings of the Combustion Institute, 2010. 33(2): p. 3317-
3324.
38. Zhdanok, S., L.A. Kennedy, and G. Koester, Superadiabatic Combustion of
Methane Air Mixtures under Filtration in a Packed Bed. Combust. Flame, 1995.
100: p. 221-231.
39. Dixon, M.J., I. Schoegl, C.B. Hull, and J.L. Ellzey, Experimental and numerical
conversion of liquid heptane to syngas through combustion in porous media.
Combustion and Flame, 2008. 154(1-2): p. 217-231.
40. Aldushin, A.P., New Results in the Theory of Filtration Combustion. Combust.
Flame, 1993. 94: p. 308-320.
41. Dhamrat, R.S. and J.L. Ellzey, Numerical and Experimental Study of the
Conversion of Methane to Hydrogen in a Porous Media Reactor. Combustion and
Flame, 2006. 144: p. 698-709.
42. Leahey, D.M., Computational Modeling of Fuel Reforming from Dry and Wet
Ethanol-air Mixtures to Hydrogen in a Filtration Reactor, M.S. Thesis. 2008,
University of Texas at Austin: Austin, TX.
43. P. Bingue, J., A. V. Saveliev, A. A. Fridman, and L.A. Kennedy, Hydrogen
production in ultra-rich filtration combustion of methane and hydrogen sulfide.
International Journal of Hydrogen Energy, 2002. 27(6): p. 643-649.
44. Kennedy, L.A., J.P. Bingue, A.V. Saveliev, A.A. Fridman, and S.I. Foutko,
Chemical Structures of Methane-Air Filtration Combustion Waves for Fuel-Lean
and Fuel-Rich Conditions. Proc. Combust. Inst., 2000. 28: p. 1431-1438.
45. Mujeebu, M.A., M.Z. Abdullah, M.Z.A. Bakar, A.A. Mohamad, and M.K.
Abdullah, A review of investigations on liquid fuel combustion in porous inert
media. Progress in Energy and Combustion Science, 2009. 35(2): p. 216-230.
46. Howell, J.R., M.J. Hall, and J.L. Ellzey, Combustion of Hydrocarbon Fuels within
Porous Inert Media. Prog. Energy Combust. Sci., 1996. 22: p. 121-145.
47. Mujeebu, M.A., M.Z. Abdullah, A.A. Mohamad, and M.Z.A. Bakar, Trends in
modeling of porous media combustion. Progress in Energy and Combustion
Science. 36(6): p. 627-650.
48. Futko, S.I., Effect of Kinetic Properties of a Mixture on Wave
Macrocharacteristics of Filtration Combustion of Gases. Combustion, Explosion,
and Shock Waves, 2003. 39(1): p. 11-22.

136
49. Foutko, S.I., S.I. Shabunya, S.A. Zhdanok, and L.A. Kennedy, Superadiabatic
Combustion Wave in a Diluted Methane-Air Mixture under Filtration in a Packed
Bed. Proc. Combust. Inst., 1996. 26: p. 3377-3382.
50. Drayton, M.K., A.V. Saveliev, L.A. Kennedy, A.A. Fridman, and Y. Li, Syngas
Production Using Superadiabatic Combustion of Ultra-Rich Methane-Air
Mixtures. Proc. Combust. Inst., 1998. 27: p. 1361-1367.
51. Bingue, J.P., A.V. Saveliev, and L.A. Kennedy, Optimization of hydrogen
production by filtration combustion of methane by oxygen enrichment and
depletion. Int. J. Hydrogen Energy, 2004. 29(13): p. 1365-1370.
52. Bingue, J.P., A.V. Saveliev, A.A. Fridman, and L.A. Kennedy, Hydrogen
production in ultra-rich filtration combustion of methane and hydrogen sulfide.
Int. J. Hydrogen Energy, 2002. 27: p. 643-649.
53. Toledo, M., V. Bubnovich, A. Saveliev, and L. Kennedy, Hydrogen production in
ultrarich combustion of hydrocarbon fuels in porous media. International Journal
of Hydrogen Energy, 2009. 34(4): p. 1818-1827.
54. Fay, M., R. Dhamrat, and J.L. Ellzey, Effect of Porous Reactor Design on
Conversion of Methane to Hydrogen. Combustion Science and Technology, 2005.
177(11): p. 2171 - 2189.
55. Dmitrenko, Y., S. Zhdanok, R. Klyovan, and V. Minkina, Methane-to-hydrogen
conversion in the filtration-combustion wave of rich methane-air mixtures.
Journal of Engineering Physics and Thermophysics, 2007. 80(2): p. 304-310.
56. Dmitrenko, Y. and P. Klevan, Hydrogen production in a reversible flow filtration
combustion reactor. Journal of Engineering Physics and Thermophysics. 84(6): p.
1296-1303.
57. Alabbadi, N., A. Al-Musa, Y. Dmitrenko, V. Martynenko, S. Shabunya, S. Al-
Maiman, K. Al-Enazi, and M. Al-Zhuhani, Conversion of methane to hydrogen in
a reversible flow superadiabatic inert porous medium reactor. Journal of
Engineering Physics and Thermophysics. 84(6): p. 1287-1295.
58. Gavrilyuk, V.V., Y.M. Dmitrienko, S.A. Zhdanok, V.G. Minkina, S.I. Shabunya,
N.L. Yadrevskaya, and A.D. Yakimovich, Conversion of Methane to Hydrogen
under Superadiabatic Filtration Combustion. Theoretical Foundations of
Chemical Engineering, 2001. 35(6): p. 589-596.
59. Pastore, A. and E. Mastorakos, Rich n-heptane and diesel combustion in porous
media. Experimental Thermal and Fluid Science, 2010. 34(3): p. 359-365.
60. Schoegl, I. and J.L. Ellzey, A mesoscale fuel reformer to produce syngas in
portable power systems. Proceedings of the Combustion Institute, 2009. 32(2): p.
3223-3230.
61. Belmont, E., S.M. Solomon, and J.L. Ellzey, Syngas Production from Heptane in
a Non-catalytic Counter-flow Reactor. Combustion and Flame, 2012. In Press.
62. Liu, J., M. Wu, and M. Wang, Simulation of the Process for Producing Butanol
from Corn Fermentation. Industrial & Engineering Chemistry Research, 2009.
48(11): p. 5551-5557.

137
63. Veloo, P.S., Y.L. Wang, F.N. Egolfopoulos, and C.K. Westbrook, A comparative
experimental and computational study of methanol, ethanol, and n-butanol
flames. Combustion and Flame. 157(10): p. 1989-2004.
64. Black, G., H.J. Curran, S. Pichon, J.M. Simmie, and V. Zhukov, Bio-butanol:
Combustion properties and detailed chemical kinetic model. Combustion and
Flame. 157(2): p. 363-373.
65. Dagaut, P., S.M. Sarathy, and M.J. Thomson, A chemical kinetic study of n-
butanol oxidation at elevated pressure in a jet stirred reactor. Proceedings of the
Combustion Institute, 2009. 32(1): p. 229-237.
66. Szwaja, S. and J.D. Naber, Combustion of n-butanol in a spark-ignition IC
engine. Fuel. 89(7): p. 1573-1582.
67. Behrens, D.A., I.C. Lee, and C.M. Waits, Catalytic combustion of alcohols for
microburner applications. Journal of Power Sources. 195(7): p. 2008-2013.
68. Nahar, G.A. and S.S. Madhani, Thermodynamics of hydrogen production by the
steam reforming of butanol: Analysis of inorganic gases and light hydrocarbons.
International Journal of Hydrogen Energy. In Press, Corrected Proof.
69. Wang, W. and Y. Cao, Hydrogen production via sorption enhanced steam
reforming of butanol: Thermodynamic analysis. International Journal of
Hydrogen Energy. 36(4): p. 2887-2895.
70. Wang, W. and Y. Cao, Hydrogen-rich gas production for solid oxide fuel cell
(SOFC) via partial oxidation of butanol: Thermodynamic analysis. International
Journal of Hydrogen Energy. 35(24): p. 13280-13289.
71. Lima da Silva, A. and I.L. Müller, Hydrogen production by sorption enhanced
steam reforming of oxygenated hydrocarbons (ethanol, glycerol, n-butanol and
methanol): Thermodynamic modelling. International Journal of Hydrogen Energy.
36(3): p. 2057-2075.
72. Rass-Hansen, J., R. Johansson, M. Møller, and C.H. Christensen, Steam reforming
of technical bioethanol for hydrogen production. International Journal of
Hydrogen Energy, 2008. 33(17): p. 4547-4554.
73. Lee, I.C., J.G. St. Clair, and A.S. Gamson, Catalytic partial oxidation of
isobutanol for the production of hydrogen. International Journal of Hydrogen
Energy. 37(2): p. 1399-1408.
74. Cai, W., P.R.d.l. Piscina, and N. Homs, Hydrogen production from the steam
reforming of bio-butanol over novel supported Co-based bimetallic catalysts.
Bioresource Technology. 107(0): p. 482-486.
75. Humer, S., A. Frassoldati, S. Granata, T. Faravelli, E. Ranzi, R. Seiser, and K.
Seshadri, Experimental and kinetic modeling study of combustion of JP-8, its
surrogates and reference components in laminar nonpremixed flows. Proceedings
of the Combustion Institute, 2007. 31(1): p. 393-400.
76. Cooke, J.A., M. Bellucci, M.D. Smooke, A. Gomez, A. Violi, T. Faravelli, and E.
Ranzi, Computational and experimental study of JP-8, a surrogate, and its
components in counterflow diffusion flames. Proceedings of the Combustion
Institute, 2005. 30(1): p. 439-446.
138
77. Honnet, S., K. Seshadri, U. Niemann, and N. Peters, A surrogate fuel for
kerosene. Proceedings of the Combustion Institute, 2009. 32(1): p. 485-492.
78. Dagaut, P., Kinetics of jet fuel combustion over extended conditions:
Experimental and modeling. Journal of Engineering for Gas Turbines and Power-
Transactions of the Asme, 2007. 129(2): p. 394-403.
79. Edwards*, T.I.M., Cracking and Deposition Behavior of Supercritical
Hydrocarbon Aviation Fuels. Combustion Science and Technology, 2006. 178(1-
3): p. 307-334.
80. Corporan, E., T. Edwards, L. Shafer, M.J. DeWitt, C. Klingshirn, S. Zabarnick, Z.
West, R. Striebich, J. Graham, and J. Klein, Chemical, Thermal Stability, Seal
Swell, and Emissions Studies of Alternative Jet Fuels. Energy & Fuels. 25(3): p.
955-966.
81. Ibarreta, A.F. and C.-J. Sung, Optimization of Jet-A fuel reforming for aerospace
applications. International Journal of Hydrogen Energy, 2006. 31(8): p. 1066-
1078.
82. Campbell, T.J., A.H. Shaaban, F.H. Holcomb, R. Salavani, and M.J. Binder, JP-8
catalytic cracking for compact fuel processors. Journal of Power Sources, 2004.
129(1): p. 81-89.
83. Shekhawat, D., D.A. Berry, D.J. Haynes, and J.J. Spivey, Fuel constituent effects
on fuel reforming properties for fuel cell applications. Fuel, 2009. 88(5): p. 817-
825.
84. Liu, D.-J., T.D. Kaun, H.-K. Liao, and S. Ahmed, Characterization of kilowatt-
scale autothermal reformer for production of hydrogen from heavy hydrocarbons.
International Journal of Hydrogen Energy, 2004. 29(10): p. 1035-1046.
85. Dreyer, B.J., I.C. Lee, J.J. Krummenacher, and L.D. Schmidt, Autothermal steam
reforming of higher hydrocarbons: n-Decane, n-hexadecane, and JP-8. Applied
Catalysis A: General, 2006. 307(2): p. 184-194.
86. Resini, C., C. Lucarelli, M. Taillades-Jacquin, K.-E. Liew, I. Gabellini, S.
Albonetti, D. Wails, J. Rozière, A. Vaccari, and D. Jones, Pt-Al2O3 and Pt-
Al2O3 catalysts for hydrogen production by dehydrogenation of Jet A-1 fuel:
Characterisation and preliminary activity tests. International Journal of Hydrogen
Energy. 36(10): p. 5972-5982.
87. Pasel, J., J. Meißner, Z. Porš, R.C. Samsun, A. Tschauder, and R. Peters,
Autothermal reforming of commercial Jet A-1 on a scale. International Journal of
Hydrogen Energy, 2007. 32(18): p. 4847-4858.
88. Goud, S.K., W.A. Whittenberger, S. Chattopadhyay, and M.A. Abraham, Steam
reforming of -hexadecane using a catalyst: Kinetics of catalyst deactivation.
International Journal of Hydrogen Energy, 2007. 32(14): p. 2868-2874.
89. Gallagher, M.J., R. Geiger, A. Polevich, A. Rabinovich, A. Gutsol, and A.
Fridman, On-board plasma-assisted conversion of heavy hydrocarbons into
synthesis gas. Fuel. 89(6): p. 1187-1192.
90. Pastore, A. and E. Mastorakos, Syngas production from liquid fuels in a non-
catalytic porous burner. Fuel. 90(1): p. 64-76.
139
91. Schmieder, R.W., Radiotracer studies of soot formation in diffusion flames.
Symposium (International) on Combustion, 1985. 20(1): p. 1025-1033.
92. Saffaripour, M., P. Zabeti, M. Kholghy, and M.J. Thomson, An Experimental
Comparison of the Sooting Behavior of Synthetic Jet Fuels. Energy & Fuels.
25(12): p. 5584-5593.
93. Shaddix, C.R., Ã.r.d.B. Palotás, C.M. Megaridis, M.Y. Choi, and N.Y.C. Yang,
Soot graphitic order in laminar diffusion flames and a large-scale JP-8 pool fire.
International Journal of Heat and Mass Transfer, 2005. 48(17): p. 3604-3614.
94. Jensen, K.A., J.M. Suo-Anttila, and L.G. Blevins, Measurement of Soot
Morphology, Chemistry, and Optical Properties in the Visible and Near-Infrared
Spectrum in the Flame Zone and Overfire Region of Large JP-8 Pool Fires.
Combustion Science and Technology, 2007. 179(12): p. 2453-2487.
95. Yao, M., H. Wang, Z. Zheng, and Y. Yue, Experimental study of n-butanol
additive and multi-injection on HD diesel engine performance and emissions.
Fuel. 89(9): p. 2191-2201.
96. Rakopoulos, D.C., C.D. Rakopoulos, E.G. Giakoumis, A.M. Dimaratos, and D.C.
Kyritsis, Effects of butanol/diesel fuel blends on the performance and emissions of
a high-speed DI diesel engine. Energy Conversion and Management. 51(10): p.
1989-1997.
97. Liu, H., C.-f.F. Lee, M. Huo, and M. Yao, Combustion Characteristics and Soot
Distributions of Neat Butanol and Neat Soybean Biodiesel. Energy & Fuels.
25(7): p. 3192-3203.
98. Camacho, J., S. Lieb, and H. Wang, Evolution of size distribution of nascent soot
in n- and i-butanol flames. Proceedings of the Combustion Institute, (0).
99. Echavarria, C.A., I.C. Jaramillo, A.F. Sarofim, and J.S. Lighty, Burnout of soot
particles in a two-stage burner with a JP-8 surrogate fuel. Combustion and
Flame. 159(7): p. 2441-2448.
100. Roesler, J.F., S. Martinot, C.S. McEnally, L.D. Pfefferle, J.L. Delfau, and C.
Vovelle, Investigating the role of methane on the growth of aromatic
hydrocarbons and soot in fundamental combustion processes. Combustion and
Flame, 2003. 134(3): p. 249-260.
101. Elverum, P.J., J.L. Ellzey, and D. Kovar, Durability of YZA ceramic foams in a
porous burner. Journal of Materials Science, 2005. 40(1): p. 155-164.
102. Mathis, W.M. and J.L. Ellzey, Flame Stabilization, Operating Range, and
Emissions for a Methane/Air Porous Burner. Combust. Sci. Tech., 2003. 175(5):
p. 825-239.
103. Davis, S., A. Belonoshko, A. Rosengren, A. van Duin, and B.r. Johansson,
Molecular dynamics simulation of zirconia melting. Central European Journal of
Physics. 8(5): p. 789-797.
104. Ansell, S., S. Krishnan, J.K.R. Weber, J.J. Felten, P.C. Nordine, M.A. Beno, D.L.
Price, and M.-L. Saboungi, Structure of Liquid Aluminum Oxide. Physical Review
Letters, 1997. 78(3): p. 464.
140
105. Howald, R.A. and I. Eliezer, The thermodynamic properties of mullite. The
Journal of Physical Chemistry, 1978. 82(20): p. 2199-2204.
106. Mathis, W.M. and J.L. Ellzey, Flame stabilization, operating range, and
emissions for a methane/air porous burner. Combustion Science and Technology,
2003. 175(5): p. 825 - 839.
107. Vasu, S.S., D.F. Davidson, and R.K. Hanson, Jet fuel ignition delay times: Shock
tube experiments over wide conditions and surrogate model predictions.
Combustion and Flame, 2008. 152(1-2): p. 125-143.
108. Hileman, I. James, Stratton, W. Russell, Donohoo, and E.G. Pearl, Energy
Content and Alternative Jet Fuel Viability, American Institute of Aeronautics and
Astronautics: Reston, VA, ETATS-UNIS. p. 12.
109. Babrauskas, V., Ignition handbook : principles and applications to fire safety
engineering, fire investigation, risk management and forensic science. 2003,
Issaquah, WA : [Bethesda, Md.] :: Fire Science Publishers ; Society of Fire
Protection Engineers. viii, 1116 p. :.
110. Smith, C.H., C.D. Zak, D.I. Pineda, and J.L. Ellzey, Conversion of Jet Fuel to
Syngas via Filtration Combustion, in 7th US National Meeting of the Combustion
Institute, C. Institute, Editor. 2011, The Combustion Institute: Atlanta, GA.
111. Smith, C.H., Conversion of Wet Ethanol to Syngas via Filtration Combustion,
M.S. Thesis. 2009, University of Texas at Austin: Austin.
112. Goodwin, D.G. Cantera. 2002-2007 [cited.
113. Smith, C.H., D.M. Leahey, L.E. Miller, and J.L. Ellzey, Conversion of Wet
Ethanol to Syngas via Filtration Combustion: an Experimental and
Computational Investigation, in 6th U.S. National Combustion Meeting, T.C.
Institute, Editor. 2009, The Combustion Institute: Ann Arbor, MI.
114. Dixon, M.J., Conversion of Liquid Heptane to Syngas through Combustion in
Porous Media, in Department of Mechanical Engineering. 2007, University of
Texas at Austin: Austin, TX.
115. Stanmore, B.R., J.F. Brilhac, and P. Gilot, The oxidation of soot: a review of
experiments, mechanisms and models. Carbon, 2001. 39(15): p. 2247-2268.
116. Warnatz, J., Combustion : physical and chemical fundamentals, modeling and
simulation, experiments, pollutant formation. 4th ed. ed. 2006, Berlin ; New York
:: Springer. xii, 378 p. :.
117. Dasch, C.J., The decay of soot surface growth reactivity and its importance in
total soot formation. Combustion and Flame, 1985. 61(3): p. 219-225.
118. Tsurikov, M.S., K.P. Geigle, V. KrÃœGer, Y. Schneider-KœHnle, W. Stricker, R.
LÃœCkerath, R. Hadef, and M. Aigner, Laser-based Investigation of Soot
Formation in Laminar Premixed Flames at Atmospheric and Elevated Pressures.
Combustion Science and Technology, 2005. 177(10): p. 1835-1862.
119. Al-Hamamre, Z., S. Voß, and D. Trimis, Hydrogen production by thermal partial
oxidation of hydrocarbon fuels in porous media based reformer. International
Journal of Hydrogen Energy, 2009. 34(2): p. 827-832.

141
120. Al-Hamamre, Z. and M.A. Hararah, Hydrogen production by thermal partial
oxidation of ethanol: Thermodynamics and kinetics study. International Journal of
Hydrogen Energy. 35(11): p. 5367-5377.
121. Pedersen-Mjaanes, H., L. Chan, and E. Mastorakos, Hydrogen Production from
Rich Combustion in Porous Media. Int. J. Hydrogen Energy, 2005. 30: p. 579-
592.
122. Belmont, E.L., S.M. Solomon, and J.L. Ellzey, Syngas production from heptane
in a non-catalytic counter-flow reactor. Combustion and Flame, (0).
123. Smith, C.H., D.I. Pineda, C.D. Zak, and J.L. Ellzey, Conversion of Jet Fuel and
Butanol to Syngas by Filtration Combustion. International Journal of Hydrogen
Energy, 2012. Submitted.
124. Koch, D.L., R.G. Cox, H. Brenner, and J.F. Brady, The Effect of Order on
Dispersion in Porous Media. J. Fluid Mech, 1989. 200: p. 173-188.
125. Hackert, C.L., J.L. Ellzey, O.A. Ezekoye, and M.J. Hall, Transverse Dispersion at
High Peclet Numbers in Short Porous Media. Exp. Fluids, 1996. 21: p. 286-290.
126. Ronney, P.D., Analysis of Non-Adiabatic Heat-Recirculating Combustors.
Combust. Flame, 2003. 135: p. 421-439.
127. Mishra, S.C., M. Steven, S. Nemoda, P. Talukdar, D. Trimis, and F. Durst, Heat
transfer analysis of a two-dimensional rectangular porous radiant burner.
International Communications in Heat and Mass Transfer, 2006. 33(4): p. 467-
474.
128. Khose-Hoinghaus, K. and J.B. Jeffries, eds. Applied Combustion Diagnostics.
Combustion: An International Series. 2002, Taylor & Francis: New York.
129. Hansen, N., T.A. Cool, P.R. Westmoreland, and K. Kohse-Hoinghaus, Recent
contributions of flame-sampling molecular-beam mass spectrometry to a
fundamental understanding of combustion chemistry. Progress in Energy and
Combustion Science, 2009. 35(2): p. 168-191.
130. Marinov, N.M., W.J. Pitz, C.K. Westbrook, M.J. Castaldi, and S.M. Senkan,
Modeling of Aromatic and Polycyclic Aromatic Hydrocarbon Formation in
Premixed Methane and Ethane Flames. Combustion Science and Technology,
1996. 116-117(1-6): p. 211-287.
131. Schoenung, M. and R.K. Hanson, CO and Temperature Measurements in a Flat
Flame by Laser Ab orption Spectroscopy and Probe Techniques. Combustion
Science and Technology, 1980. 24(5-6): p. 227-237.
132. Weigand, P., R. Luckerath, and W. Meier, Documentation of Flat Premixed
Laminar CH4/Air Standard Flames: Temperatures and Species Concentrations,
D.I.o.C.T.
(http://www.dlr.de/vt/PortalData/29/Resources/dokumente/ch4_air_flames.pdf),
Editor. 2003: Stuttgart.
133. Gersen, S., A.V. Mokhov, and H.B. Levinsky, Extractive probe/TDLAS
measurements of acetylene in atmospheric-pressure fuel-rich premixed
methane/air flames. Combustion and Flame, 2005. 143(3): p. 333-336.
142
134. Kumar, K. and C.-J. Sung, Laminar flame speeds and extinction limits of
preheated n-decane/O2/N2 and n-dodecane/O2/N2 mixtures. Combustion and
Flame, 2007. 151(1–2): p. 209-224.
135. Liu, F.S. and O.L. Gulder, Effects of pressure and preheat on super-adiabatic
flame temperatures in rich premixed methane/air flames. Combustion Science and
Technology, 2008. 180(3): p. 437-452.
136. Bosschaart, K.J. and L.P.H. de Goey, The laminar burning velocity of flames
propagating in mixtures of hydrocarbons and air measured with the heat flux
method. Combustion and Flame, 2004. 136(3): p. 261-269.
137. Gibson, J., M. Ayoobi, and I. Schoegl, Behavior of Preheated Premixed Flames
at Rich Conditions. Proc. Combust. Inst., 2012. 34(In Press).
138. Sepman, A., A.V. Mokhov, and H.B. Levinsky, A laser-induced fluorescence and
coherent anti-Stokes Raman scattering study of NO formation in preheated,
laminar, rich premixed, methane/air flames. Proceedings of the Combustion
Institute, 2002. 29: p. 2187-2194.
139. Hidaka, Y., K. Sato, Y. Henmi, H. Tanaka, and K. Inami, Shock-tube and
modeling study of methane pyrolysis and oxidation. Combustion and Flame, 1999.
118(3): p. 340-358.
140. Smith, G.P., D.M. Golden, M. Frenklach, N.W. Moriarty, B. Eiteneer, M.
Goldenberg, C.T. Bowman, R.K. Hanson, S. Song, J.W.C. Gardiner, V.V.
Lissianski, and Z. Qin, GRI-Mech 3.0 URL http://www.me.berkeley.edu/gri-
mech/version30/. 1999.
141. Goodwin, D.G. (2012) Cantera - An object-oriented software toolkit for chemical
kinetics, thermodynamics, and transport processes.
http://code.google.com/p/cantera/
142. Chao, B.H. and C.K. Law, Duality, Pulsating Instability, and Product
Dissociation in Burner-Stabilized Flames. Combustion Science and Technology,
1988. 62(4-6): p. 211-237.
143. Sutton, G., A. Levick, G. Edwards, and D. Greenhalgh, A combustion temperature
and species standard for the calibration of laser diagnostic techniques.
Combustion and Flame, 2006. 147: p. 39-48.
144. Associates, H. Diagram of McKenna Burner. 2012 [cited 2012 8/30/2012];
Available from: http://flatflame.com/.
145. Mokhov, A.V. and H.B. Levinsky, A LIF and cars investigation of upstream heat
loss and flue-gas recirculation as NOx control strategies for laminar, premixed
natural-gas/air flames. Proceedings of the Combustion Institute, 2000. 28(2): p.
2467-2474.
146. Cole, J.A., A Molecular-Beam Mass-Spectrometric Study of Stoichiometric and
Fuel-Rich 1,3-Butadiene Flames, in Chemical Engineering. 1982, Massachusetts
Institute of Technology: Cambridge.
147. Gaydon, A.G., The spectroscopy of flames. 2nd ed. ed. 1974, London :: Chapman
and Hall. xii, 412, [2] p., [15] p. of plates :.

143
148. Wang, H., CH* mechanism, in Personal Communication, C.H. Smith and J.L.
Ellzey, Editors. 2012.
149. Kathrotia, T., U. Riedel, A. Seipel, K. Moshammer, and A. Brockhinke,
Experimental and numerical study of chemiluminescent species in low-pressure
flames. Applied Physics B: Lasers and Optics. 107(3): p. 571-584.
150. Ferguson, C.R. and J.C. Keck, Stand-off distances on a flat flame burner.
Combustion and Flame, 1979. 34(0): p. 85-98.
151. Kurdyumov, V.N. and M. Matalon, The porous-plug burner: Flame stabilization,
onset of oscillation, and restabilization. Combustion and Flame, 2008. 153: p.
105-118.
152. Williams, B.A. and J.W. Fleming, Comparison of species profiles between O2
and NO2 oxidizers in premixed methane flames. Combustion and Flame, 1995.
100(4): p. 571-590.
153. Evertsen, R., J.A. Van Oijen, R.T.E. Hermanns, L.P.H. De Goey, and J.J. Ter
Meulen, Measurements of absolute concentrations of CH in a premixed
atmospheric flat flame by cavity ring-down spectroscopy. Combustion and Flame,
2003. 132: p. 34-42.
154. Devore, J.L., Probability and statistics for engineering and the sciences. 6th ed.
ed. 2004, Belmont, CA :: Thomson-Brooks/Cole. xvi, 795 p. :.
155. Moffat, R.J., Describing the uncertainties in experimental results. Experimental
Thermal and Fluid Science, 1988. 1(1): p. 3-17.