Embed Size (px)
Citation preview

Chile & Peru: Conquistadores, Copper & New Colonialism
April 25, 2016
J.D. Crouch
Introduction
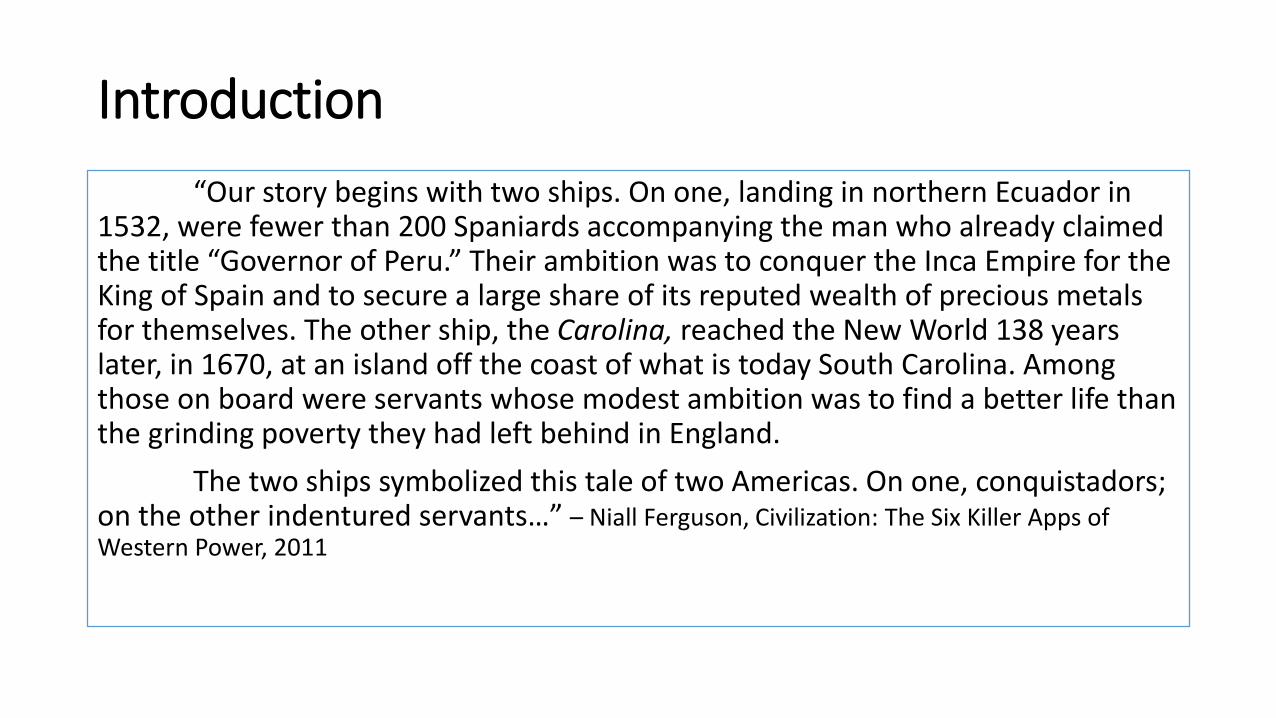
“Our story begins with two ships. On one, landing in northern Ecuador in 1532, were fewer than 200 Spaniards accompanying the man who already claimed the title “Governor of Peru.” Their ambition was to conquer the Inca Empire for the King of Spain and to secure a large share of its reputed wealth of precious metals for themselves. The other ship, the Carolina, reached the New World 138 years later, in 1670, at an island off the coast of what is today South Carolina. Among those on board were servants whose modest ambition was to find a better life than the grinding poverty they had left behind in England.
The two ships symbolized this tale of two Americas. On one, conquistadors; on the other indentured servants…” – Niall Ferguson, Civilization: The Six Killer Apps of Western Power, 2011

All that glitters is…copper
• Development gaps between Peru & Chile manifest themselves economically via GDP & Population and socio-politically via Corruption Index & Poverty Rate
• Likely that copper and gold prices matter more to FDI than political developments – or anything else
• Until they are not, Peru and Chile are safe havens for US FDI for a few natural resources but mostly copper
Chile Peru
Population 17,508,260 30,444,999
GNI Per Capita $ 14,900 $ 6,410
GDP (million) $ 258,100 $ 202,600
Top 5 Exports (2014) Copper cathodes, copper ores, copper unrefined,
wine, fresh grapes
Copper Ore, Gold, Petroleum, Copper cathodes, Flours
2013 Poverty headcount ratio at $1.90 a day (% of population) 0.9% 3.7%
# of Presidents since Independence
37 94
Coups since 1900 10 3
# of Presidents since 1990 4 6
Transparency International -Corruption Index Rating (0 = worst,
100 = best) 70 36

World Bank Doing Business Indicators: 2015
• Ease of Doing Business Rank indicator is the “overall” score
o Range: 1 = Best; 189 = Worst
o Peru = 50; Chile = 48
o USA = 7
• = Indicator of interest for multi-nationals
50
97
48
64
35
15
49 50
88
6974
48
62
24
5156
79
36 33
6356 58
Peru Chile

Freedom House – Overall Ratings: 1999 & 2015
4.5
2.0
2.5
1.0
4.0
2.0
3.0
1.0
5.0
2.0 2.0
1.0
0.0
1.0
2.0
3.0
4.0
5.0
6.0
Peru 1999 Chile 1999 Peru 2015 Chile 2015
1 =
Mo
st F
ree
, 7 =
Le
ast
Fre
e
Overall Freedom Rating Civil Liberties Political Rights

Freedom House –Details & Aggregate Score: 2015
• Categories:
o Free, Partly Free, Not Free
• Score based on aggregate of indicators:
o 0 = Worst, 100 = Best
• Aggregate Score:
o Peru: Free, 71
o Chile: Free, 95
o US: Free, 90
10
13
7
15
8 8
10
12
15
12
16
11
14
15
Electoral Process(12)
PoliticalPluralism &
Participation(16)
FunctioningGovernment
(12)
Freedom ofExpression &
Belief (16)
Associational &Organizational
Rights (12)
Rule of Law (16) PersonalAutonomy &
Individual Rights(16)
Peru Chile
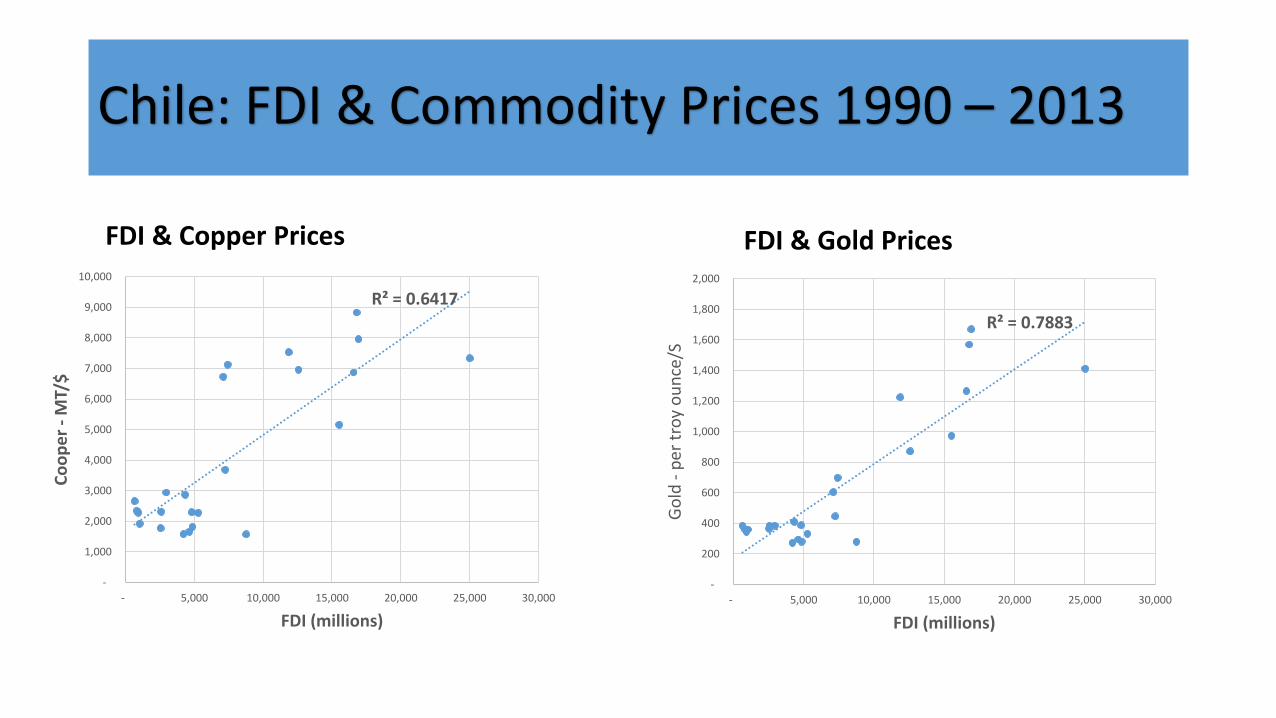
Chile: FDI & Commodity Prices 1990 – 2013
FDI & Copper Prices FDI & Gold Prices
R² = 0.6417
-
1,000
2,000
3,000
4,000
5,000
6,000
7,000
8,000
9,000
10,000
- 5,000 10,000 15,000 20,000 25,000 30,000
Co
op
er
-M
T/$
FDI (millions)
R² = 0.7883
-
200
400
600
800
1,000
1,200
1,400
1,600
1,800
2,000
- 5,000 10,000 15,000 20,000 25,000 30,000
Go
ld -
per
tro
y o
un
ce/S
FDI (millions)
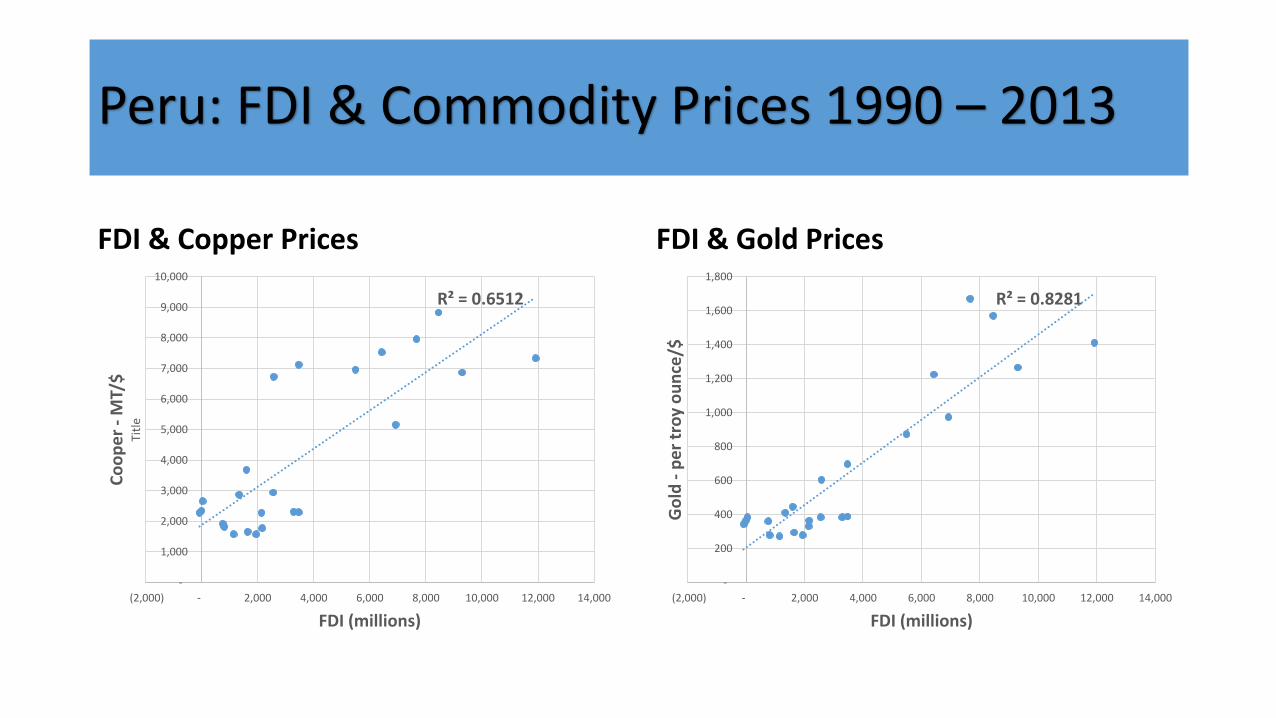
Peru: FDI & Commodity Prices 1990 – 2013
FDI & Copper Prices FDI & Gold Prices
R² = 0.8281
-
200
400
600
800
1,000
1,200
1,400
1,600
1,800
(2,000) - 2,000 4,000 6,000 8,000 10,000 12,000 14,000
Go
ld -
pe
r tr
oy
ou
nce
/$
FDI (millions)
R² = 0.6512
-
1,000
2,000
3,000
4,000
5,000
6,000
7,000
8,000
9,000
10,000
(2,000) - 2,000 4,000 6,000 8,000 10,000 12,000 14,000
Co
op
er
-M
T/$
Titl
e
FDI (millions)

FDI & Presidential Elections
Peru Chile
(2,000)
-
2,000
4,000
6,000
8,000
10,000
12,000
14,000
19
90
19
91
19
92
19
93
19
94
19
95
19
96
19
97
19
98
19
99
20
00
20
01
20
02
20
03
20
04
20
05
20
06
20
07
20
08
20
09
20
10
20
11
20
12
20
13
FDI -
mill
ion
s
FDI into Peru Peru Pres Election
-
5,000
10,000
15,000
20,000
25,000
30,000
19
90
19
91
19
92
19
93
19
94
19
95
19
96
19
97
19
98
19
99
20
00
20
01
20
02
20
03
20
04
20
05
20
06
20
07
20
08
20
09
20
10
20
11
20
12
20
13
FDI -
mill
ion
s
FDI into Chile (millions) Chile Pres Election
One off investments in service sector

Post Colonial Results: 2015
• 10 South American Spanish Colonies
o Population = 392,583,192
o GDP = $6.4 billion
• 10 US English Colonies
o Population = 90,990,181
o GDP = $5.4 billion
approx. year of colonization
approx. year of indepedence 2015 population 2015 GDP
10
So
uth
Am
eric
anSp
anis
h C
olo
nie
s
Brazil 1500 1850 204,259,812 $ 3,166,000.0
Colombia 1525 1811 46,736,728 $ 665,000.0
Argentina 1536 1853 43,431,886 $ 964,300.0
Peru 1529 1824 30,444,999 $ 385,400.0
Venezuela 1522 1830 29,275,460 $ 491,600.0
Chile 1541 1818 17,508,260 $ 424,000.0
Ecuador 1563 1820 15,868,396 $ 98,300.0
Bolivia 1524 1825 10,800,882 $ 73,800.0
Paraguay 1537 1811 6,783,272 $ 60,150.0
Uruguay 1516 1825 3,341,893 $ 72,360.0
10
US
Engl
ish
Co
lon
ies
Connecticut 1636 1776 3,596,677 $ 259,661.0
Georgia 1732 1776 10,097,343 $ 496,180.0
Maryland 1633 1776 5,976,407 $ 360,969.0
Massachusetts 1630 1776 6,745,408 $ 473,606.0
New Jersey 1664 1776 8,938,175 $ 573,947.0
New York 1626 1776 19,746,227 $ 1,444,406.0
North Carolina 1653 1776 9,943,964 $ 503,745.0
Pennsylvania 1682 1776 12,787,209 $ 677,582.0
South Carolina 1663 1776 4,832,482 $ 196,887.0
Virginia 1607 1776 8,326,289 $ 476,919.0

Conclusion
"The past is never dead. It's not even past.” – William Faulkner