Embed Size (px)
Citation preview
MARINE ECOLOGY PROGRESS SERIESMar Ecol Prog Ser
Vol. 382: 239–252, 2009doi: 10.3354/meps07963
Published April 30
INTRODUCTION
Biodiversity research has expanded in the past 2 to 3decades from the realm of systematics and biology tothe fields of biogeography and evolution. This trendhas resulted in renewed interest in describing andrecording taxa, with corresponding studies describingregional and global biodiversity patterns, developingnew techniques with which to measure diversity,proposing mechanisms responsible for generation andmaintenance of these patterns, and experimentallyinvestigating the functional significance of biodiversity
(e.g. Clarke & Warwick 1998, Willig et al. 2003, Gage2004, Hillebrand 2004, Solan et al. 2006, and refer-ences therein). These timely studies come as theearth’s ecosystems are confronted with natural andhuman-induced environmental change and its impacton biotic systems. Informed management and conser-vation strategies require a solid understanding ofunderlying biodiversity patterns and their conse-quences for system functioning.
Renewed efforts to document marine biodiversitywere probably initiated by Grassle & Maciolek (1992),who suggested that there may be as many as 10 million
© Inter-Research 2009 · www.int-res.com*Email: [email protected]
Addresses for other authors are given in the Electronic Appen-dix at www.int-res.com/articles/suppl/m382p221_app.pdf
Continental-scale patterns in benthic invertebratediversity: insights from the MacroBen database
P. E. Renaud1,*, T. J. Webb, A. Bjørgesæter, I. Karakassis, M. Kedra, M. A. Kendall, C. Labrune, N. Lampadariou, P. J. Somerfield, M. W8odarska-Kowalczuk, E. Vanden Berghe, S. Claus, I. F. Aleffi,
J. M. Amouroux, K. H. Bryne, S. J. Cochrane, S. Dahle, S. Degraer, S. G. Denisenko, T. Deprez,C. Dounas, D. Fleischer, J. Gil, A. Grémare, U. Janas, A. S. Y. Mackie, R. Palerud, H. Rumohr,
R. Sardá, J. Speybroeck, S. Taboada, G. Van Hoey, J. M. Wes8awski, P. Whomersley, M. L. Zettler
1Akvaplan-niva, Polar Environmental Centre, 9296 Tromsø, Norway
ABSTRACT: Latitudinal clines in species diversity in limnic and terrestrial habitats have been notedfor well over a century and are consistent across many taxonomic groups. However, studies in marinesystems over the past 2 to 3 decades have yielded equivocal results. We conducted initial analyses ofthe MarBEF (EU Network of Excellence for Marine Biodiversity and Ecosystem Function) database totest for trends in local and regional diversity over the latitudinal extent of European continental-shelfwaters (36° to 81° N). Soft-sediment benthic macrofauna exhibit little evidence of a latitudinal cline inlocal (α-) diversity measures. Relationships with water depth were relatively strong and complex.Statistically significant latitudinal trends were small and positive, suggesting a modest increase indiversity with latitude once water-depth covariates were removed. These results are consistentregardless of whether subsets of the database were used, replicates were pooled, or component tax-onomical groups were evaluated separately. Local and regional diversity measures were significantlyand positively correlated. Scientific cooperation through data-sharing is a powerful tool with whichto address fundamental ecological and evolutionary questions relating to large-scale patterns andprocesses.
KEY WORDS: Biodiversity · North Atlantic · Mediterranean · Arctic · Baltic · Continental shelf ·Benthos · Latitude
Resale or republication not permitted without written consent of the publisher
Contribution to the Theme Section ‘Large-scale studies of the European benthos: the MacroBen database’OPENPEN ACCESSCCESS
Mar Ecol Prog Ser 382: 239–252, 2009
benthic infaunal species yet to be identified in thedeep sea. Since then, there have been many studiesinvestigating diversity patterns, with special focus onhow biodiversity varies with water depth and latitude.Many studies have identified an increase in diversitywith water depth through the bathyal zone, followedby a decrease in abyssal and hadal zones (e.g. Rex1981, Levin et al. 2001). Latitudinal patterns have beenless clear, but, in general, diversity of benthic commu-nities or of component groups has been shown todecline with increasing latitude in the northern hemi-sphere (Rex et al. 1993, 2000, Boucher & Lambshead1995, Culver & Buzas 2000, Mokievsky & Azovsky2002, Gage et al. 2004, Hillebrand 2004, Witman et al.2004, Renaud et al. 2006). Other regional studies, how-ever, have failed to detect this pattern or even showedregionally opposite trends (Heip et al. 1992, Kendall &Aschan 1993, Dauvin et al. 1994, Kendall 1996, Clarke& Lidgard 2000, Lambshead et al. 2000, Ellingsen &Gray 2002, Rees et al. 2007), and patterns in some tax-onomic or trophic groups are not replicated in others(Azovsky 2000, Ellingsen 2001, Hillebrand 2004,Karakassis et al. 2006).
These conflicting results suggest that multiple fac-tors are responsible for generating and maintainingbiodiversity of the benthos. Instead of being viewed asa problem, these varying patterns can be used to helpdetect which factors/mechanisms are important for dif-ferent conditions, scales, and taxa. Proposed mecha-nisms can be divided into 2 principle categories: eco-logical and evolutionary. Ecological mechanismsinclude temperature, primary productivity, sedimentheterogeneity, and life-history strategy (e.g. Huston1979, Etter & Grassle 1992, Lambshead et al. 2000,2002, Roy et al. 2000, Levin et al. 2001, Renaud et al.2006), while evolutionary factors include tectonic his-tory, climate fluctuation, and the ages of taxonomicclades (e.g. Svavarsson et al. 1993, Crame 1997, 2001,Culver & Buzas 2000, Clarke & Crame 2003, Gage2004, W8odarska-Kowalczuk et al. 2004). Spatial vari-ability in these mechanisms determine biodiversitypatterns, and varying degrees of interaction amongthem may be responsible for the differing observationsrecorded in the literature.
Patterns of species richness in the global avifaunaappear to be well explained by models incorporatingboth spatial variation in available energy and the like-lihood of a species reaching potentially suitable areas(Storch et al. 2006). Simple geometrical constraintsmay also play a role in concentrating species richnesstowards the midpoint of a domain (the ‘mid-domaineffect’ or MDE, reviewed in Colwell et al. 2004). How-ever, the predictive power of MDE models is criticallydependent on a priori divisions between domains andknowledge of species ranges (Hawkins et al. 2005,
Zapata et al. 2005, Storch et al. 2006). They are, there-fore, likely to be of limited utility in marine systemswhere such information is largely absent. Determiningthe relative importance of ecological, evolutionary, andstatistical (geometrical) factors to the generation andmaintenance of observed patterns in species richnessremains a fundamental challenge for biodiversitystudies.
Before mechanisms can be assessed, however, it iscritical to evaluate the basis for the patterns that havebeen observed. Some studies have included extensivelocal sampling and meta-analysis, while others arebased on limited sampling. Sample-collection tech-niques have not always been comparable, and inten-sive sampling may be restricted over narrow geo-graphical ranges. An appropriate dataset must containmany samples collected by comparable proceduresacross a wide geographical domain: an effort notafforded through normal research projects — or evenmany careers. Marine Biodiversity and EcosystemFunctioning (MarBEF: www.marbef.org), an EU Net-work of Excellence, has made major strides to remedythese biases by compiling a database (MacroBen) com-prised of datasets from across the European domain.These datasets from marine benthic studies can beused for a variety of investigations of biodiversity-related questions.
In the present study, we perform initial analyses ofthis database in reference to European-scale gradientsin benthic biodiversity. With the power of such a largecollection of comparable data, we can investigatewhether there is support for previously identifiedtrends in local (α-) biodiversity with water depth andlatitude. We will pursue this for the entire benthic fau-nal communities, and for important component groups.In the process, we test for the effects of variable sam-pling effort represented in the database. Confidentlyidentifying latitudinal or depth patterns can informfuture investigations of underlying mechanisms re-sponsible for their generation and maintenance.
DATA AND METHODS
MacroBen database. Integrating individual datasetsinto large databases, to enable analysis on Europe-wide scales, was one of the core objectives of the Mar-BEF network. Different databases were planned, eachto capture comparable data for integrative analyses.The initial database included with data from soft-bottom benthic biotopes. A major effort was under-taken to harmonize the taxonomy across the differentdatasets: all names were matched, both for spellingand synonymy, with the European Register of MarineSpecies (ERMS) (Vanden Berghe et al. 2009, this
240
Renaud et al.: Continental-scale patterns in benthic invertebrate diversity from MacroBen database
Theme Section). Raw data were retained wheneverpossible to allow maximum flexibility during analyses.Most data providers also furnished geographical andphysical data.
The finalized dataset was distributed as an Accessfile to all data providers. Included in the database wereseveral tools to extract data and to calculate basic sta-tistics and diversity coefficients. The final databasecontained 465 354 distribution records, from 7481 taxaand 23 113 stations. There were 43 individual datasets.A full description of the database is given in VandenBerghe et al. (2009).
Latitudinal-gradient database. In effort to work withthe most inclusive, yet most comparable dataset possi-ble, we performed initial filtering on the MacroBendatabase. The extracted working database for latitudi-nal-gradient studies of soft-sediment benthos inclu-ded: (1) quantitative data, (2) non-juvenile animal taxa,(3) organisms identified to species level, (4) non-colo-nial animals (Bryozoa, Hydrozoa, Porifera excluded),(5) samples collected after 1980 (for taxonomic compa-rability reasons), (6) subtidal stations only, (7) samplescollected with 0.1 m2 grabs only, (8) samples sieved onmax. 1 mm mesh, and (9) multiple records from thesame location, if available.
While these criteria do not eliminate some potentialproblems (e.g. unequal effort per sampling location orlatitude), they do make initial analyses more straight-forward. Preliminary analyses of even this modifieddatabase suggested that some analyses should be per-formed following additional filtering (e.g. Fig. 1A,C).
Initially, samples were pooled for each 1° of latitude.This retains information contained in the database andallows calculation of a ‘γ-richness’ estimate for each1° of latitude. Species-area and species accumulationcurves were then constructed by plotting pooled ‘γ-richness’ by 2 measures of sampling effort, area sam-pled and number of individuals collected, for each 1° oflatitude. These are not the traditional species-area orspecies accumulation curves, but instead are plotted inthis way to test for effects of sampling intensity. ‘γ-rich-ness’ residuals of least-squares regressions (log-trans-formed variables) were plotted against latitude todetermine whether regional γ-diversity changed withlatitude after accounting for sampling intensity (Clarke& Lidgard 2000). A multiple linear regression tech-nique was also used to test for effect of latitude onregional diversity accounting for latitudinal differ-ences in area and number of individuals sampled.
The 2 α-diversity indices that we based most of ouranalyses on are the number of species, S, and Hurl-bert’s expected number of species calculated for 50individuals, E(S50). Species richness is better than equi-tability indices in the study of large-scale patterns, andE(Sn) is robust to sample size variations (Boucher &
Lambshead 1995). In addition, E(Sn) incorporates someof the evenness component of diversity. Analyses wereconducted for each sample in the database for theentire faunal assemblage, and initially on samplespooled by 5° increments of latitude.
S and E(S50) were plotted against latitude and waterdepth to determine whether relationships prevalent inthe literature were consistent with our data. We testedfor these relationships in several ways. First, linearand quadratic (unimodal) models were fitted to theplots of S and E(S50) with latitude and water depth.LOWESS (locally-weighted scatterplot smoothing) func-tions (Quinn & Keough 2002) were also fitted to thesedata, with α set to 0.75 (i.e. the neighborhood for eachlocally weighted regression includes 3/4 of all points).The shape of the LOWESS smooth is useful for charac-terizing the shape of the relationship, and for assess-ing whether the fitted linear or quadratic model ade-quately captures this shape. After finding that thewater-depth distribution of our sample locations wasnot random with respect to latitude, we controlled forthis covariance by running multiple linear regressionswith water depth and latitude as factors. This workswell if the underlying relationship is linear, but be-cause quadratic regressions had a better fit for muchof the data, we also plotted the residuals from thequadratic regressions of each diversity index withwater depth against the quadratic residuals of latitudewith water depth. Similar analyses have been per-formed using residuals from linear regressions (Lamb-shead et al. 2001, Renaud et al. 2006). Since the BalticSea exhibited relatively low biodiversity compared toother areas at that latitude, we performed a secondfiltering of the dataset by excluding Baltic stations todetermine whether this biased our findings for oragainst identifying latitudinal trends. We then re-peated the regression analyses on the dataset with theBaltic data excluded, and on major taxonomic groups(polychaetes, mollusks, and arthropods) from this newdataset.
In addition to species richness and evenness, it isalso relevant to ask whether variation in different axesof diversity may be contributing to observed patterns.Taxonomic distinctness, Δ+, a measure of relatednessamong species (Warwick & Clarke 2001), was calcu-lated for the subset of samples containing 5 or morespecies. Taxonomic relationships were determinedfrom ERMS. Values were calculated for whole as-semblages, annelids, crustaceans, and mollusks, andanalyzed using linear and multiple linear regression.
Finally, we wanted to ensure the validity of using α-diversity statistics to evaluate regional diversity pat-terns. Therefore, we calculated Chao1 and Chao2, andSobs γ-diversity estimators for each dataset and plottedthose values against the average S value for those
241
Mar Ecol Prog Ser 382: 239–252, 2009
datasets. If these indices are positively correlated, thenlocal diversity patterns are likely to reflect diversity onregional scales. Analyses were performed using theJMP-In (SAS Institute), PRIMER (Clarke & Gorley2006), Statistica (StatSoft), R (R Development CoreTeam 2005), and EstimateS (Colwell 1997) softwarepackages.
RESULTS
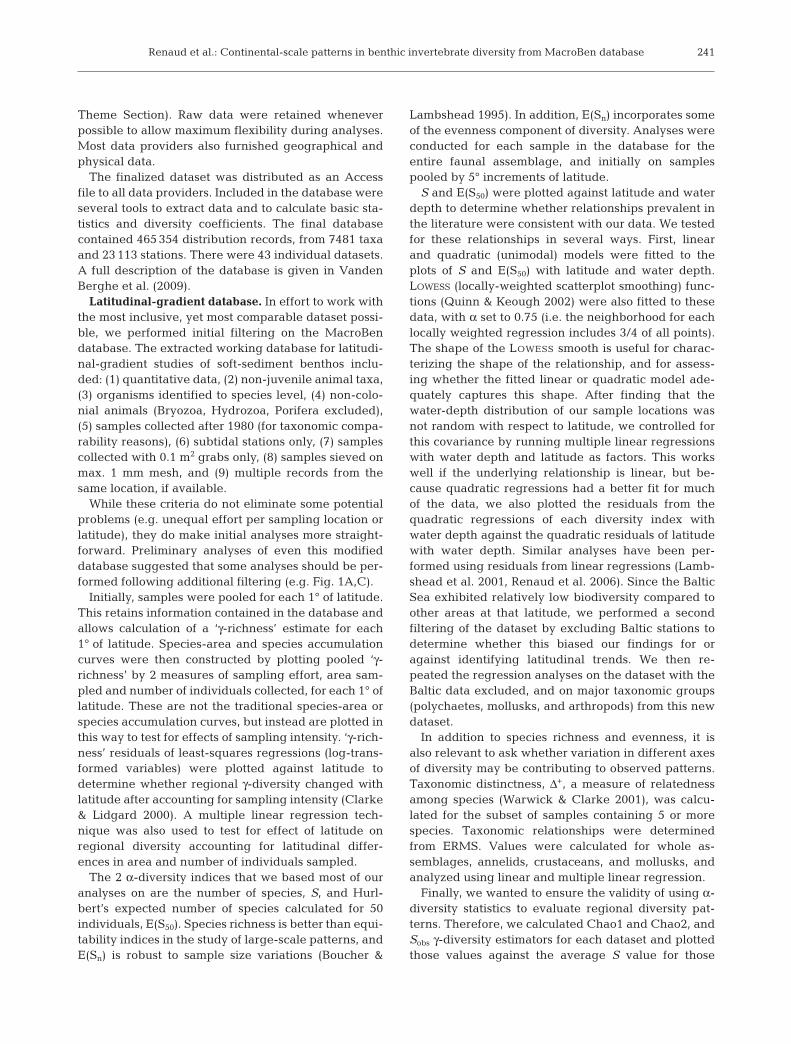
Initial filtering of the MarBEF database resulted in afile containing over 3200 samples and over 1 millionindividuals from nearly 2200 species. This represents16 individual datasets covering areas of the Adriatic,Mediterranean, Baltic, Irish, North, Barents, andPechora Seas, as well as the European Atlantic coast(Table 1), from 36° to 81° N. Depths of stations variedconsiderably with latitude, with stations in low andhigh latitudes being generally shallower than stationsat mid-latitudes (Table 2). Sample water depth was notrecorded for one of the datasets, so samples sizes forregressions (Table 3) against water depth were slightlylower than diversity–latitude relationships.
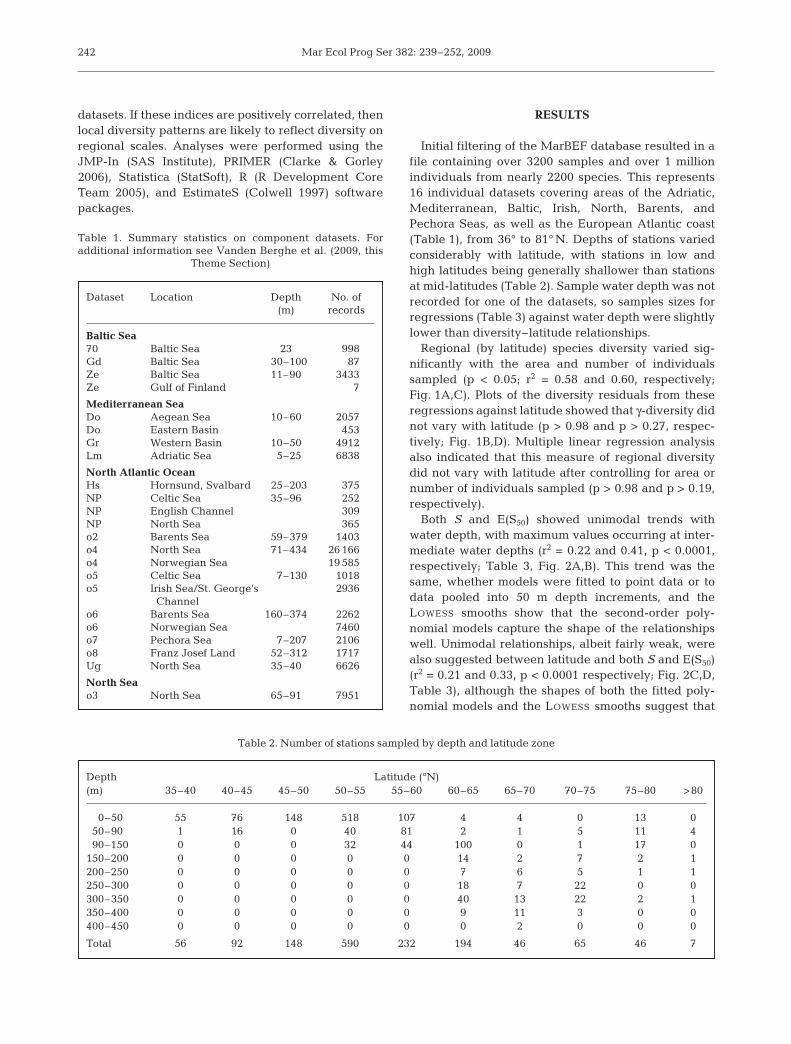
Regional (by latitude) species diversity varied sig-nificantly with the area and number of individualssampled (p < 0.05; r2 = 0.58 and 0.60, respectively;Fig. 1A,C). Plots of the diversity residuals from theseregressions against latitude showed that γ-diversity didnot vary with latitude (p > 0.98 and p > 0.27, respec-tively; Fig. 1B,D). Multiple linear regression analysisalso indicated that this measure of regional diversitydid not vary with latitude after controlling for area ornumber of individuals sampled (p > 0.98 and p > 0.19,respectively).
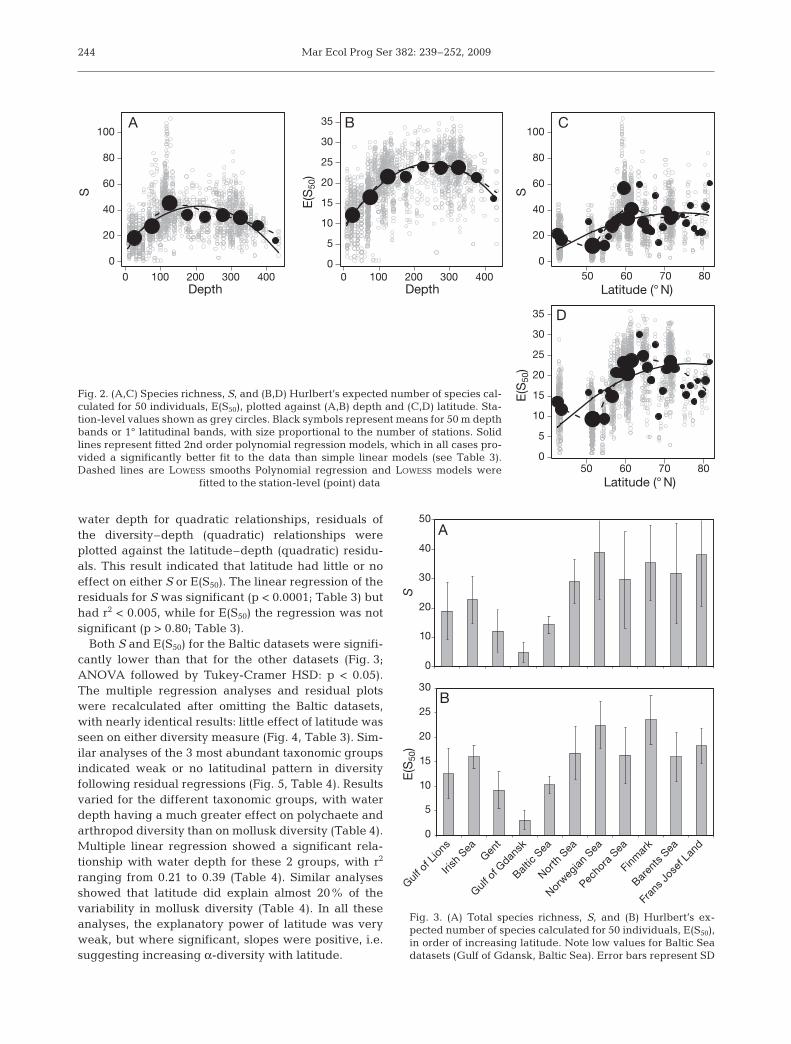
Both S and E(S50) showed unimodal trends withwater depth, with maximum values occurring at inter-mediate water depths (r2 = 0.22 and 0.41, p < 0.0001,respectively; Table 3, Fig. 2A,B). This trend was thesame, whether models were fitted to point data or todata pooled into 50 m depth increments, and theLOWESS smooths show that the second-order poly-nomial models capture the shape of the relationshipswell. Unimodal relationships, albeit fairly weak, werealso suggested between latitude and both S and E(S50)(r2 = 0.21 and 0.33, p < 0.0001 respectively; Fig. 2C,D,Table 3), although the shapes of both the fitted poly-nomial models and the LOWESS smooths suggest that
242
Dataset Location Depth No. of(m) records
Baltic Sea70 Baltic Sea 23 998Gd Baltic Sea 030–100 87Ze Baltic Sea 11–90 3433Ze Gulf of Finland 7
Mediterranean SeaDo Aegean Sea 10–60 2057Do Eastern Basin 453Gr Western Basin 10–50 4912Lm Adriatic Sea 05–25 6838
North Atlantic OceanHs Hornsund, Svalbard 025–203 375NP Celtic Sea 35–96 252NP English Channel 309NP North Sea 365o2 Barents Sea 059–379 1403o4 North Sea 071–434 26 166o4 Norwegian Sea 19 585o5 Celtic Sea 007–130 1018o5 Irish Sea/St. George’s 2936
Channelo6 Barents Sea 160–374 2262o6 Norwegian Sea 7460o7 Pechora Sea 007–207 2106o8 Franz Josef Land 052–312 1717Ug North Sea 35–40 6626
North Seao3 North Sea 65–91 7951
Table 1. Summary statistics on component datasets. Foradditional information see Vanden Berghe et al. (2009, this
Theme Section)
Depth Latitude (°N)(m) 35–40 40–45 45–50 50–55 55–60 60–65 65–70 70–75 75–80 >80
000–50 55 76 148 518 107 4 4 0 13 0050–90 1 16 0 40 81 2 1 5 11 4090–150 0 0 0 32 44 100 0 1 17 0150–200 0 0 0 0 0 14 2 7 2 1200–250 0 0 0 0 0 7 6 5 1 1250–300 0 0 0 0 0 18 7 22 0 0300–350 0 0 0 0 0 40 13 22 2 1350–400 0 0 0 0 0 9 11 3 0 0400–450 0 0 0 0 0 0 2 0 0 0
Total 56 92 148 590 232 194 46 65 46 7
Table 2. Number of stations sampled by depth and latitude zone
Renaud et al.: Continental-scale patterns in benthic invertebrate diversity from MacroBen database
the main pattern is a relatively abrupt increase north ofabout 55°, with little change thereafter. Results weresimilar when the data were pooled into 5° incrementsof latitude. To remove the potentially confoundingeffect of water depth on the latitudinal trend, 2 tech-niques were employed. (1) Multiple linear regression
analyses were performed, and these indicated thatboth water depth and latitude contributed signifi-cantly, but latitude only explained 9.5 and 3.2% of thevariability in S and E(S50), respectively, while waterdepth explained 0.3 and 27%, respectively (p < 0.02 forall relationships; Table 3). (2) To remove the effect of
243
Regression Type Entire dataset Baltic removedp r2 p r2
S × latitude Linear 0.0001 0.184 0.0001 0.178S × latitude Quadratic 0.0001 0.211 0.0001 0.212S × depth Linear 0.0001 0.028 0.0001 0.013S × depth Quadratic 0.0001 0.218 0.0001 0.185S × latitude, depth MLR 0.0001 0.095, 0.003 0.0001 0.082, 0.009Quadratic resid: S – depth × latitude – depth Linear 0.0008 0.005 0.0001 0.007
E(S50) × latitude Linear 0.0001 0.300 0.0001 0.297E(S50) × latitude Quadratic 0.0001 0.331 0.0001 0.337E(S50) × depth Linear 0.0001 0.267 0.0001 0.235E(S50) × depth Quadratic 0.0001 0.413 0.0001 0.376E(S50) × latitude, depth MLR 0.0001 0.032, 0.267 0.0001 0.037, 0.236Quadratic resid: E(S50) – depth × latitude – depth Linear 0.8010 na 0.7790 na
Table 3. Linear, quadratic, and multiple linear regression (MLR) analyses of total number of species, S, and Hurlbert’s expectednumber of species calculated for 50 individuals, E(S50), against depth and latitude. r2 values are presented for each model, or foreach predictor in MLR. Regressions of diversity–depth residuals in latitude–depth residuals are also presented. Since quadraticrelationships explained most of the variation, residuals (resid) of these regressions (and not the linear regressions) are used.
p-values for quadratic regressions are for the quadratic term in the equation; na: not applicable
y = 74.616Ln(x) – 413.97R2 = 0.5997
0
100
200
300
400
500
600
700
0 10 20 30 40 50 60 70 80 90 100
Number of individuals
C
y = 78.769Ln(x) + 128.56R2 = 0.5845
0
100
200
300
400
500
600
700
0 10 20 30 40 50 60 70
Area sampled (m2)
Sp
ecie
s c
ount
A
–0.5
–0.4
–0.3
–0.2
–0.1
0
0.1
0.2
0.3
0.4
0.5
30 40 50 60 70 80
Resid
ual sp
ecie
s r
ichness
B
ns
–0.4
–0.3
–0.2
–0.1
0
0.1
0.2
0.3
0.4
30 40 50 60 70 80
Latitude (° N)
Latitude (° N)
D
ns
Fig. 1. Regional species richness (species count) pooled by degree of latitude plotted against 2 measures of sampling efforts (A):area sampled and (C) number of individuals sampled. Linear regression of log-transformed data in these 2 plots was performed
and the residuals are plotted against latitude in (B) and (D)
Mar Ecol Prog Ser 382: 239–252, 2009
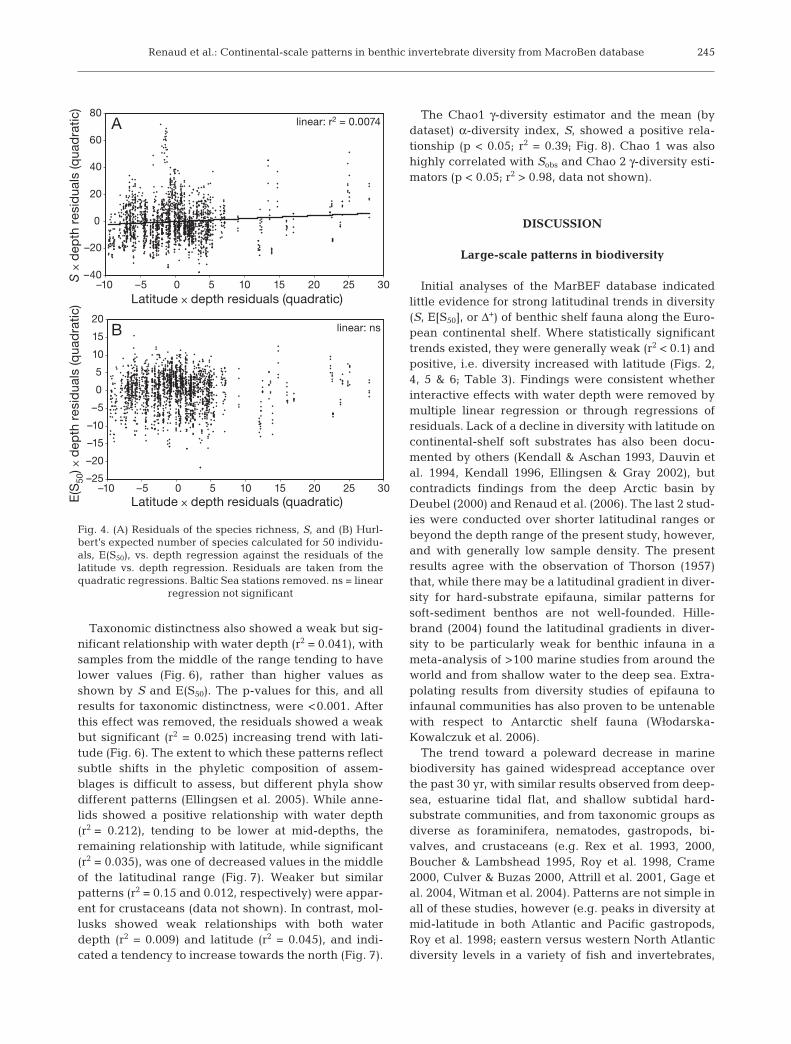
water depth for quadratic relationships, residuals ofthe diversity–depth (quadratic) relationships wereplotted against the latitude–depth (quadratic) residu-als. This result indicated that latitude had little or noeffect on either S or E(S50). The linear regression of theresiduals for S was significant (p < 0.0001; Table 3) buthad r2 < 0.005, while for E(S50) the regression was notsignificant (p > 0.80; Table 3).
Both S and E(S50) for the Baltic datasets were signifi-cantly lower than that for the other datasets (Fig. 3;ANOVA followed by Tukey-Cramer HSD: p < 0.05).The multiple regression analyses and residual plotswere recalculated after omitting the Baltic datasets,with nearly identical results: little effect of latitude wasseen on either diversity measure (Fig. 4, Table 3). Sim-ilar analyses of the 3 most abundant taxonomic groupsindicated weak or no latitudinal pattern in diversityfollowing residual regressions (Fig. 5, Table 4). Resultsvaried for the different taxonomic groups, with waterdepth having a much greater effect on polychaete andarthropod diversity than on mollusk diversity (Table 4).Multiple linear regression showed a significant rela-tionship with water depth for these 2 groups, with r2
ranging from 0.21 to 0.39 (Table 4). Similar analysesshowed that latitude did explain almost 20% of thevariability in mollusk diversity (Table 4). In all theseanalyses, the explanatory power of latitude was veryweak, but where significant, slopes were positive, i.e.suggesting increasing α-diversity with latitude.
244
0 100 200 300 400
0
20
40
60
80
100
Depth0 100 200 300 400
0
5
10
15
20
25
30
35
Depth
S
E(S
50)
E(S
50)
S
50 60 70 80
50 60 70 80
0
20
40
60
80
100
Latitude (° N)
Latitude (° N)
0
5
10
15
20
25
30
35 D
CBA
Fig. 2. (A,C) Species richness, S, and (B,D) Hurlbert’s expected number of species cal-culated for 50 individuals, E(S50), plotted against (A,B) depth and (C,D) latitude. Sta-tion-level values shown as grey circles. Black symbols represent means for 50 m depthbands or 1° latitudinal bands, with size proportional to the number of stations. Solidlines represent fitted 2nd order polynomial regression models, which in all cases pro-vided a significantly better fit to the data than simple linear models (see Table 3).Dashed lines are LOWESS smooths Polynomial regression and LOWESS models were
fitted to the station-level (point) data
0
10
20
30
40
50
S
A
0
5
10
15
20
25
30
Gul
f of L
ions
Irish
Sea
Gen
t
Gul
f of G
dansk
Bal
tic S
ea
Nort
h Sea
Norw
egia
n Sea
Pecho
ra S
ea
Finm
ark
Bar
ents
Sea
Fran
s Jo
sef L
and
E(S
50)
B
Fig. 3. (A) Total species richness, S, and (B) Hurlbert’s ex-pected number of species calculated for 50 individuals, E(S50),in order of increasing latitude. Note low values for Baltic Seadatasets (Gulf of Gdansk, Baltic Sea). Error bars represent SD
Renaud et al.: Continental-scale patterns in benthic invertebrate diversity from MacroBen database
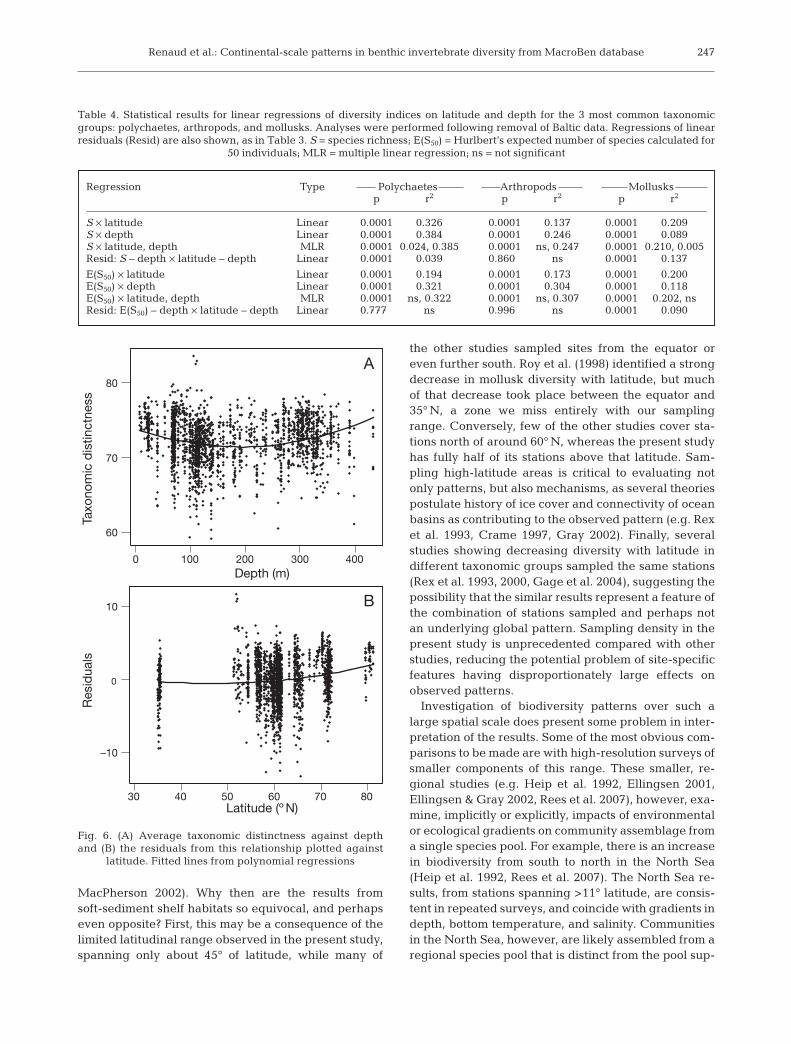
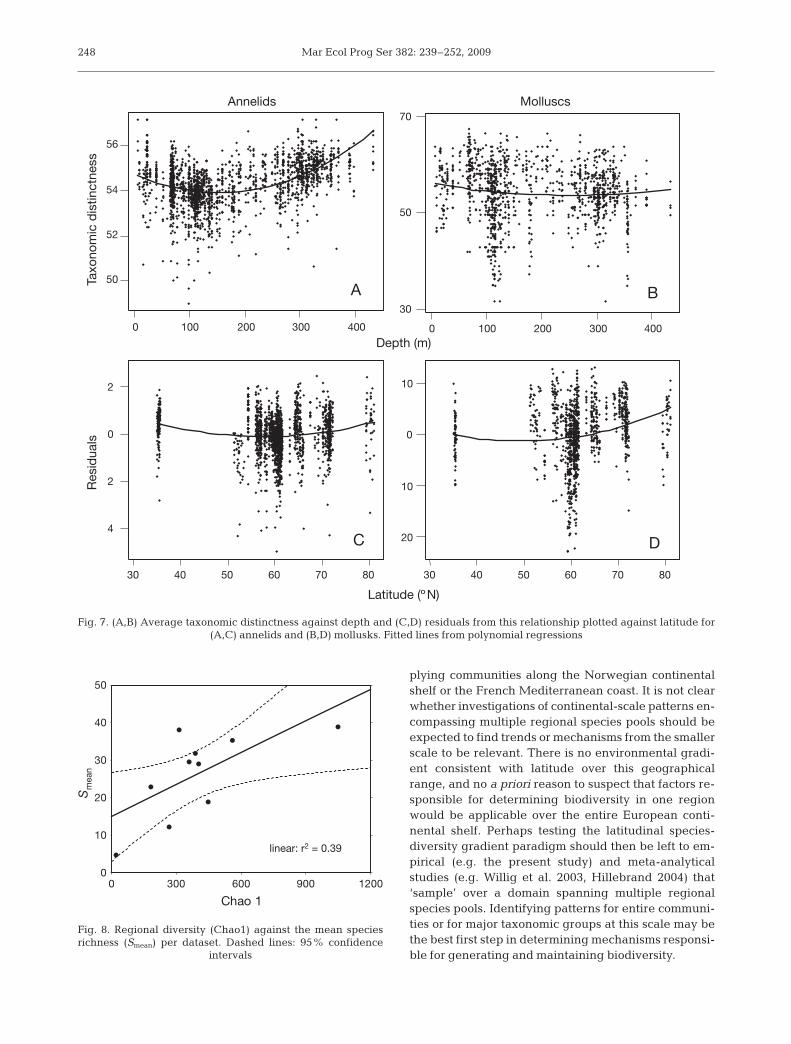
Taxonomic distinctness also showed a weak but sig-nificant relationship with water depth (r2 = 0.041), withsamples from the middle of the range tending to havelower values (Fig. 6), rather than higher values asshown by S and E(S50). The p-values for this, and allresults for taxonomic distinctness, were <0.001. Afterthis effect was removed, the residuals showed a weakbut significant (r2 = 0.025) increasing trend with lati-tude (Fig. 6). The extent to which these patterns reflectsubtle shifts in the phyletic composition of assem-blages is difficult to assess, but different phyla showdifferent patterns (Ellingsen et al. 2005). While anne-lids showed a positive relationship with water depth(r2 = 0.212), tending to be lower at mid-depths, theremaining relationship with latitude, while significant(r2 = 0.035), was one of decreased values in the middleof the latitudinal range (Fig. 7). Weaker but similarpatterns (r2 = 0.15 and 0.012, respectively) were appar-ent for crustaceans (data not shown). In contrast, mol-lusks showed weak relationships with both waterdepth (r2 = 0.009) and latitude (r2 = 0.045), and indi-cated a tendency to increase towards the north (Fig. 7).
The Chao1 γ-diversity estimator and the mean (bydataset) α-diversity index, S, showed a positive rela-tionship (p < 0.05; r2 = 0.39; Fig. 8). Chao 1 was alsohighly correlated with Sobs and Chao 2 γ-diversity esti-mators (p < 0.05; r2 > 0.98, data not shown).
DISCUSSION
Large-scale patterns in biodiversity
Initial analyses of the MarBEF database indicatedlittle evidence for strong latitudinal trends in diversity(S, E[S50], or Δ+) of benthic shelf fauna along the Euro-pean continental shelf. Where statistically significanttrends existed, they were generally weak (r2 < 0.1) andpositive, i.e. diversity increased with latitude (Figs. 2,4, 5 & 6; Table 3). Findings were consistent whetherinteractive effects with water depth were removed bymultiple linear regression or through regressions ofresiduals. Lack of a decline in diversity with latitude oncontinental-shelf soft substrates has also been docu-mented by others (Kendall & Aschan 1993, Dauvin etal. 1994, Kendall 1996, Ellingsen & Gray 2002), butcontradicts findings from the deep Arctic basin byDeubel (2000) and Renaud et al. (2006). The last 2 stud-ies were conducted over shorter latitudinal ranges orbeyond the depth range of the present study, however,and with generally low sample density. The presentresults agree with the observation of Thorson (1957)that, while there may be a latitudinal gradient in diver-sity for hard-substrate epifauna, similar patterns forsoft-sediment benthos are not well-founded. Hille-brand (2004) found the latitudinal gradients in diver-sity to be particularly weak for benthic infauna in ameta-analysis of >100 marine studies from around theworld and from shallow water to the deep sea. Extra-polating results from diversity studies of epifauna toinfaunal communities has also proven to be untenablewith respect to Antarctic shelf fauna (W8odarska-Kowalczuk et al. 2006).
The trend toward a poleward decrease in marinebiodiversity has gained widespread acceptance overthe past 30 yr, with similar results observed from deep-sea, estuarine tidal flat, and shallow subtidal hard-substrate communities, and from taxonomic groups asdiverse as foraminifera, nematodes, gastropods, bi-valves, and crustaceans (e.g. Rex et al. 1993, 2000,Boucher & Lambshead 1995, Roy et al. 1998, Crame2000, Culver & Buzas 2000, Attrill et al. 2001, Gage etal. 2004, Witman et al. 2004). Patterns are not simple inall of these studies, however (e.g. peaks in diversity atmid-latitude in both Atlantic and Pacific gastropods,Roy et al. 1998; eastern versus western North Atlanticdiversity levels in a variety of fish and invertebrates,
245
–25
–20
–15
–10
–5
0
5
10
15
20
–10 –5 0 5 10 15 20 25 30
Latitude x depth residuals (quadratic)E(S
50) x d
ep
th r
esid
uals
(q
uad
ratic)
linear: nsB
linear: r2 = 0.0074
–40
–20
0
20
40
60
80
–10 –5 0 5 10 15 20 25 30
Latitude x depth residuals (quadratic)
S x
dep
th r
esid
uals
(q
uad
ratic)
A
Fig. 4. (A) Residuals of the species richness, S, and (B) Hurl-bert’s expected number of species calculated for 50 individu-als, E(S50), vs. depth regression against the residuals of thelatitude vs. depth regression. Residuals are taken from thequadratic regressions. Baltic Sea stations removed. ns = linear
regression not significant

Mar Ecol Prog Ser 382: 239–252, 2009246
–15
–5
5
15
25
A D
B E
C F
–15 –5 5 15 25
S x
dep
th r
esid
uals
linear: ns
–20
–10
0
10
20
–15 –5 5 15 25 35
E(S
50) x d
ep
th r
esid
uals
E(S
50) x d
ep
th r
esid
uals
linear: ns
–15
–5
5
15
25
–15 –5 5 15 25
S x
dep
th r
esid
uals
–15
–5
5
15
–15 –5 5 15 25 35
–35
–15
5
25
45
–15 –5 5 15 25
Latitude x depth residuals (linear)
S x
dep
th r
esid
uals
linear: r2 = 0.039
linear: r2 = 0.136 linear: r2 = 0.090
–15
–5
5
15
–15 –5 5 15 25 35
Latitude x depth residuals (linear)
Latitude x depth residuals (linear) Latitude x depth residuals (linear)
Latitude x depth residuals (linear) Latitude x depth residuals (linear)
linear: ns
E(S
50) x d
ep
th r
esid
uals
Fig. 5. (A–C) Residuals of the species richness, S, and (D–F) Hurlbert’s expected number of species calculated for 50 individuals,E(S50), vs. depth regression against the residuals of the latitude vs. depth regression. Data exclude Baltic Sea samples and are forthe 3 most common taxonomic groups: (A,D) arthropods, (B, E) mollusks, and (C,F) polychaetes. Regression results expressed as
in Table 4
Renaud et al.: Continental-scale patterns in benthic invertebrate diversity from MacroBen database
MacPherson 2002). Why then are the results fromsoft-sediment shelf habitats so equivocal, and perhapseven opposite? First, this may be a consequence of thelimited latitudinal range observed in the present study,spanning only about 45° of latitude, while many of
the other studies sampled sites from the equator oreven further south. Roy et al. (1998) identified a strongdecrease in mollusk diversity with latitude, but muchof that decrease took place between the equator and35° N, a zone we miss entirely with our samplingrange. Conversely, few of the other studies cover sta-tions north of around 60° N, whereas the present studyhas fully half of its stations above that latitude. Sam-pling high-latitude areas is critical to evaluating notonly patterns, but also mechanisms, as several theoriespostulate history of ice cover and connectivity of oceanbasins as contributing to the observed pattern (e.g. Rexet al. 1993, Crame 1997, Gray 2002). Finally, severalstudies showing decreasing diversity with latitude indifferent taxonomic groups sampled the same stations(Rex et al. 1993, 2000, Gage et al. 2004), suggesting thepossibility that the similar results represent a feature ofthe combination of stations sampled and perhaps notan underlying global pattern. Sampling density in thepresent study is unprecedented compared with otherstudies, reducing the potential problem of site-specificfeatures having disproportionately large effects onobserved patterns.
Investigation of biodiversity patterns over such alarge spatial scale does present some problem in inter-pretation of the results. Some of the most obvious com-parisons to be made are with high-resolution surveys ofsmaller components of this range. These smaller, re-gional studies (e.g. Heip et al. 1992, Ellingsen 2001,Ellingsen & Gray 2002, Rees et al. 2007), however, exa-mine, implicitly or explicitly, impacts of environmentalor ecological gradients on community assemblage froma single species pool. For example, there is an increasein biodiversity from south to north in the North Sea(Heip et al. 1992, Rees et al. 2007). The North Sea re-sults, from stations spanning >11° latitude, are consis-tent in repeated surveys, and coincide with gradients indepth, bottom temperature, and salinity. Communitiesin the North Sea, however, are likely assembled from aregional species pool that is distinct from the pool sup-
247
Regression Type Polychaetes Arthropods Mollusksp r2 p r2 p r2
S × latitude Linear 0.0001 0.326 0.0001 0.137 0.0001 0.209S × depth Linear 0.0001 0.384 0.0001 0.246 0.0001 0.089S × latitude, depth MLR 0.0001 0.024, 0.385 0.0001 ns, 0.247 0.0001 0.210, 0.005Resid: S – depth × latitude – depth Linear 0.0001 0.039 0.8600 ns 0.0001 0.137
E(S50) × latitude Linear 0.0001 0.194 0.0001 0.173 0.0001 0.200E(S50) × depth Linear 0.0001 0.321 0.0001 0.304 0.0001 0.118E(S50) × latitude, depth MLR 0.0001 ns, 0.322 0.0001 ns, 0.307 0.0001 0.202, nsResid: E(S50) – depth × latitude – depth Linear 0.7770 ns 0.9960 ns 0.0001 0.090
Table 4. Statistical results for linear regressions of diversity indices on latitude and depth for the 3 most common taxonomicgroups: polychaetes, arthropods, and mollusks. Analyses were performed following removal of Baltic data. Regressions of linearresiduals (Resid) are also shown, as in Table 3. S = species richness; E(S50) = Hurlbert’s expected number of species calculated for
50 individuals; MLR = multiple linear regression; ns = not significant
4003002001000
80
70
60
Depth (m)
Taxo
no
mic
dis
tinctn
ess
A
807060504030
10
0
Latitude (º N)
Resid
uals
B
–10
Fig. 6. (A) Average taxonomic distinctness against depthand (B) the residuals from this relationship plotted against
latitude. Fitted lines from polynomial regressions
Mar Ecol Prog Ser 382: 239–252, 2009
plying communities along the Norwegian continentalshelf or the French Mediterranean coast. It is not clearwhether investigations of continental-scale patterns en-compassing multiple regional species pools should beexpected to find trends or mechanisms from the smallerscale to be relevant. There is no environmental gradi-ent consistent with latitude over this geographicalrange, and no a priori reason to suspect that factors re-sponsible for determining biodiversity in one regionwould be applicable over the entire European conti-nental shelf. Perhaps testing the latitudinal species-diversity gradient paradigm should then be left to em-pirical (e.g. the present study) and meta-analyticalstudies (e.g. Willig et al. 2003, Hillebrand 2004) that‘sample’ over a domain spanning multiple regionalspecies pools. Identifying patterns for entire communi-ties or for major taxonomic groups at this scale may bethe best first step in determining mechanisms responsi-ble for generating and maintaining biodiversity.
248
0 300 600
linear: r2 = 0.39
900 1200
Chao 1
0
10
20
30
40
50
Sm
ean
Fig. 8. Regional diversity (Chao1) against the mean speciesrichness (Smean) per dataset. Dashed lines: 95% confidence
intervals
0
4003002001000
56
54
52
50
807060504030
2
0
2
4
4003002001000
70
50
30
807060504030
10
10
20
Depth (m)
Annelids Molluscs
Latitude (ºN)
A
C D
B
Taxo
no
mic
dis
tin
ctn
ess
Resid
uals
Fig. 7. (A,B) Average taxonomic distinctness against depth and (C,D) residuals from this relationship plotted against latitude for (A,C) annelids and (B,D) mollusks. Fitted lines from polynomial regressions
Renaud et al.: Continental-scale patterns in benthic invertebrate diversity from MacroBen database
Patterns observed for the entire community werealso seen in the 3 dominant taxonomic groups (mol-lusks, annelids, and crustaceans), although molluskdiversity exhibited a positive trend with increasinglatitude with a higher r2 of around 0.2 (Fig. 5, Table 4).It has been proposed that calcification is energeticallycostly at low temperatures, possibly resulting in lowerdiversity of mollusks and foraminiferans toward thepoles (Clarke 1992). We see no evidence to support thisidea in our data, and in fact see an opposite pattern.The similarity of responses among the different groupsis somewhat surprising following the recent suggestionthat diversity of different functional groups may varydifferently across latitudinal gradients (Roy et al. 2000,Valentine et al. 2002, Ellingsen et al. 2005). It is possi-ble that characteristic responses of different subsets ofthe community were masked by treating each groupwithout regard to functionality of component taxa.Each taxon could be further dissected in effort to iden-tify which components contributed to the diversity atdifferent latitudes (e.g. Roy et al. 2000).
Two additional spatial patterns in biodiversity wereobserved: (1) The well-known low diversity of the BalticSea was confirmed (Fig. 3). While low salinity excludessome taxa and thus affects species diversity, Bonsdorff(2006) suggested that low diversity in the Baltic in gen-eral is not due to an inherent property of the Baltic envi-ronment (low salinity, reduced water exchange, etc.),but instead to its ecological youth. Only 8000 yr ago itwas completely glaciated and it is being recolonizedslowly (see discussion in Bonsdorff 2006). More than40% of the individuals included in the present analyseswere sampled during intensive studies of the Baltic, butremoving them from the analysis resulted in virtuallyidentical results (Table 3, Fig. 4). This suggests thatthese data did not bias our results, and that the patternswe observed are robust to exclusion of even such alarge subset of the data. (2) We see a higher point diver-sity (grab-level) at stations north of about 50° N than indatasets from more temperate areas (Fig. 3). Much ofthis, however, be due to the depth covariate, as thetrend toward increasing diversity at high latitudes isless clear when this is taken into account (Fig. 4). In-creased sampling across a wider depth range at thesehigh-latitude areas would help clarify this.
Whereas the present study does not test specifichypotheses regarding mechanisms responsible forgeneration or maintenance of diversity, the patternsobserved may aid in validation or refutation of some ofthe prevailing ideas. As mentioned in the Introduction,a major hypothesis explaining observed declines indiversity with latitudes north of the equator, and anabsence of this decline toward the Antarctic continent,suggests that recent glaciation in the Arctic has led toa younger fauna that relies on recolonization from the
south, and limited speciation in recent millennia, com-pared to the extensive and geologically old SouthernOcean (e.g. Gray 2001). We see little evidence for astrong cline from 36 to 81° N, and the taxonomic dis-tinctness data suggest equally diverse clades in thehighest-latitude fauna, which is presumably geologi-cally younger. Ecological mechanisms, from primaryproductivity and hydrographical events to sedimentgrain-size patchiness, have been invoked for explain-ing local and regional differences in diversity (e.g. Royet al. 1998, Deubel 2000, Levin et al. 2001, MacPherson2002). We do not have accompanying data on theseparameters for our sampling stations, but these may befruitful areas of future research into causes of diversitypatterns. Finally, diversity can vary within an area — orat the same location — over decadal time scales. Cli-mate variability affects benthic community structure,including biodiversity parameters (e.g. Kröncke et al.1998, Beuchel et al. 2006), largely through the effect oftemperature. Regional temperature changes can thenaffect both physical (e.g. stratification) and biological(e.g. primary production) parameters impacting repro-duction, recruitment, and persistence in the system.These findings also suggest potential mechanisms act-ing on regional scales.
While a unimodal depth–diversity relationship witha peak in diversity between 2000 and 3000 m is wellsupported in the deep-sea literature (reviewed in Rex1981, Levin et al. 2001), 2 recent studies conductedalong depth transects in the North Atlantic and Arctichave failed to identify such a trend (W8odarska-Kowal-czuk et al. 2004, Renaud et al. 2006). In the presentstudy, we found that water depth explained over 20%(and up to 40%) of the variability in community diver-sity measures, and had contrasting effects for differentcomponents of the community. We also found a uni-modal response with peak diversity (S and E[S50]) andreduced average taxonomic distinctness (Δ+) from qua-dratic fits between 200 and 250 m depth. It is unclearwhat could explain such a pattern across the narrowdepth range of the continental shelf. Explanations forobserved variability of diversity with water depthrange from disturbance frequency and food supply(Levin et al. 2001), to sediment properties (Etter &Grassle 1992), to an artifact of constrained speciesrange boundaries (mid-domain effect, Colwell et al.2004). Additionally, site-specific factors may play arole, since the only deep shelf stations are at the north-ern end of the latitudinal range. The contrast betweenS and Δ+ indicates that there are more species in themiddle of the range, but they are more closely relatedto each other, lending some weight to the possibility ofeither the mid-domain artifact interpretation, or somelocal ‘hot spot’ of biological diversity. We have no evi-dence to support or discount any of these possibilities.
249
Mar Ecol Prog Ser 382: 239–252, 2009
MacroBen database: strengths and caveats
It is only through the vision of contributors to andmanagers of MarBEF’s MacroBen database that thisanalysis is possible. The sampling density, geographi-cal range, and habitat distribution of the data allow in-depth studies of many questions regarding biodiversityin European waters. Subsets of the database can beanalyzed to test for sensitivity to specific components(e.g. Table 3), or for methodological biases. Specificactions taken to achieve such a database are describedin more detail in Vanden Berghe et al. (2009).
Despite all these efforts, the database is not perfect.Any dataset is biased in what it includes and what it ex-cludes. Confining our study to the European continen-tal shelf excludes the apparently more diverse westernAtlantic basin (MacPherson 2002). Component data-sets, many of which have been the subject of site-spe-cific biodiversity publications, represent non-randomand non-regular sampling. Another issue arising in thepresent study is that not all latitudinal zones were sam-pled across their entire depth range (Table 2), and sam-ples were not available from all latitudes. This likely re-sulted in under-sampling of diversity from deeper areasat the south and shallower areas further north. Al-though we were able to control for some of this bias sta-tistically (e.g. Fig. 4), it is not possible to completely fac-tor out the potential biological significance of awater-depth covariate from sections of the latitudinalrange where, for example, water depths >100 m werenot sampled. Additionally, sediment parameters mayvary among sites, even if water depth is controlledfor. These issues will have to be addressed furtherwhen more datasets are added to the European benthicdatabase.
A second potential problem is the effect of unequalsampling density across the gradient range. We showthat the number of species identified per degree of lat-itude is influenced by the area and number of individ-uals sampled per degree. Residual analysis and multi-ple linear regression, however, indicated no trend inγ-diversity with latitude after correction for samplingeffort (Fig. 1B,D, and ‘Results’). This is in agreementwith our results for α-diversity (Figs. 2 & 4, Table 3),suggesting that sampling-effort differences did notbias our results. Furthermore, Δ+ is relatively sample-size independent (Warwick & Clarke 2001), and simi-lar patterns were apparent in analyses of this measure.Most studies evaluating the presence of a latitudinalgradient in diversity use point or station (α) diversitymeasures to address regional diversity questions (e.g.Gray 2002). Our results show that mean α (point) diver-sity for each dataset was positively correlated withregional diversity estimates for that dataset (Fig. 8).While we do not necessarily imply a causal relation-
ship, it does show that α-diversity patterns may be suit-able for investigating regional-scale patterns.
Biodiversity research: future directions and needs
The present study highlights the importance of usinglarge databases to answer questions across regionalspatial scales. Such databases have been lacking, butthis is being addressed through international coopera-tion coordinated by organizations such as MarBEF andthe Census of Marine Life (CoML). These efforts mustbe continued in order to address similar questions,whether they be investigating trends in different habi-tats, on temporal scales, or in other regions of theworld’s oceans.
Progress in macroecology has been rapid in recentyears (e.g. Brown 1995, Blackburn & Gaston 2003), andfocus has shifted from identifying patterns in regionaldiversity to determining the processes underlying thepatterns (Gaston & Blackburn 2000). Willig et al. (2003)showed that we are still far from distinguishing amongthe many proposed mechanisms that may be responsi-ble for geographical patterns in diversity. However, afundamental prerequisite to any such mechanistic ana-lysis is to document the patterns in a robust fashion.The present study provides such an input into futurestudies of diversity gradients in the European soft-sed-iment marine benthic fauna. Importantly, our resultsmean that any mechanism predicting strong latitudinalgradients in diversity in these taxa may not be valid.
Studies conducted over long periods of time and atlarge spatial scales would be invaluable in aiding thetransition from describing pattern to elucidating process.One promising avenue would be to expand the recolo-nization study underway in the Baltic Sea by Bonsdorff(2006) and follow the system as it develops, with care-fully designed studies and targeted research questions.Such studies, combined into databases such as those an-alyzed here, will help to instill a more data-driven, hy-pothesis-led approach to marine biodiversity studies.The need for such studies gains urgency as the effects ofhuman activities on natural systems become apparent atever-larger spatial scales (Chapin et al. 2000).
Acknowledgements. We are grateful for the inspiration andmotivation provided by C. Arvanitidis. Preparation of thispaper was supported in part by Akvaplan-niva. T.J.W.acknowledges support from the Leverhulme Trust. We thank4 reviewers for comments that improved the manuscript.The authors acknowledge the support of the MarBEF Net-work of Excellence ‘Marine Biodiversity and EcosystemFunctioning’ which is funded by the Sustainable Develop-ment, Global Change and Ecosystems Programme of theEuropean Community’s Sixth Framework Programme (con-tract no. GOCE-CT-2003-505446). This publication is contri-bution no. MPS-09014 of MarBEF.
250
Renaud et al.: Continental-scale patterns in benthic invertebrate diversity from MacroBen database
LITERATURE CITED
Attrill MJ, Stafford R, Rowden AA (2001) Latitudinal diversitypatterns in estuarine tidal flats: indications of a globalcline. Ecography 24:318–324
Azovsky A (2000) Concept of scale in marine ecology: linkingthe words or the worlds? Web Ecol 1:28–34
Beuchel F, Gulliksen B, Carroll ML (2006) Long-term patternsof rocky bottom macrobenthic community structure in anarctic fjord (Kongsfjorden, Svalbard) in relation to climatevariability (1980–2003). J Mar Syst 63:35–48
Blackburn TM, Gaston KJ (eds) (2003) Macroecology: con-cepts and consequences. Blackwell, Oxford
Bonsdorff E (2006) Zoobenthic diversity-gradients in theBaltic Sea: continuous post-glacial succession in a stressedecosystem. J Exp Mar Biol Ecol 330:383–391
Boucher G, Lambshead PJD (1995) Ecological biodiversity ofmarine nematodes in samples from temperate, tropical,and deep-sea regions. Conserv Biol 9:1594–1604
Brown JH (1995) Macroecology. University of Chicago Press,Chicago, IL
Chapin FS, Zavaleta ES, Evlner VT, Naylor RL and others(2000) Consequences of changing biodiversity. Nature 405:234–242
Clarke A (1992) Is there a latitudinal diversity cline in the sea?Trends Ecol Evol 7:286–287
Clarke A, Crame JA (2003) The importance of historical pro-cesses in global patterns of diversity. In: Blackburn, TM,Gaston KJ (eds) Macroecology: concepts and conse-quences. Blackwell, Oxford, p 130–151
Clarke A, Lidgard S (2000) Spatial patterns of diversity in thesea: bryozoan species richness in the North Atlantic. JAnim Ecol 69:799–814
Clarke KR, Gorley RN (2006) Primer v6: user manual/tutorial.Primer-E, Plymouth
Clarke KR, Warwick RM (1998) A taxonomic distinctnessindex and its statistical properties. J Appl Ecol 35:523–531
Colwell RK (1997) EstimateS: statistical estimation of speciesrichness and shared species from samples, Version 5. Usersguide and application. Department of Ecology and Evolu-tionary Biology, University of Connecticut, Storrs, CT
Colwell RK, Rahbek C, Gotelli NJ (2004) The mid-domaineffect and species richness patterns: What have we learnedso far? Am Nat 163:E1–E23
Crame JA (1997) An evolutionary framework for the polarregions. J Biogeogr 24:1–9
Crame JA (2000) Evolution of taxonomic diversity gradients inthe marine realm: evidence from the composition of recentbivalve faunas. Paleobiology 26:188–214
Crame JA (2001) Taxonomic diversity gradients through geo-logic time. Divers Distrib 7:175–189
Culver SJ, Buzas MA (2000) Global latitudinal species diver-sity gradient in deep-sea benthic foraminifera. Deep-SeaRes I 47:259–275
Dauvin JC, Kendall M, Patterson G, Gentil F, Jirkov I,Sheader M, De Lange M (1994) An initial assessment ofpolychaete diversity in the northeastern Atlantic Ocean.Biodiversity Lett 2:171–181
Deubel H (2000) Structures and nutritional requirements ofmacrozoobenthic communities in the area of the Lomo-nosov Ridge in the Arctic Ocean. Ber Polarforsch 370:1–147
Ellingsen KE (2001) Biodiversity of a continental shelf soft-sediment macrobenthos community. Mar Ecol Prog Ser218:1–15
Ellingsen KE, Gray JS (2002) Spatial patterns of benthicdiversity: Is there a latitudinal gradient along the Norwe-gian continental shelf? J Anim Ecol 71:373–389
Ellingsen KE, Clarke KR, Somerfield PJ, Warwick RM (2005)Taxonomic distinctness as a measure of diversity appliedover a large scale: the benthos of the Norwegian continen-tal shelf. J Anim Ecol 74:1069–1079
Etter RJ, Grassle JF (1992) Patterns of species diversity in thedeep sea as a function of sediment particle size diversity.Nature 360:576–578
Gage JD (2004) Diversity in deep-sea benthic macrofauna:the importance of local ecology, the larger scale, historyand the Antarctic. Deep-Sea Res II 51:1689–1708
Gage JD, Lambshead PJD, Bishop JDD, Stuart CT, Jones NS(2004) Large-scale biodiversity pattern of Cumacea (Peri-carida: Crustacea). Mar Ecol Prog Ser 277:181–196
Gaston KJ, Blackburn TM (2000) Pattern and process inmacroecology. Blackwell, Oxford
Grassle JF, Maciolek NJ (1992) Deep-sea species richness:regional and local diversity estimates from quantitativebottom samples. Am Nat 139:313–341
Gray JS (2001) Antarctic marine benthic biodiversity in aworldwide latitudinal context. Polar Biol 24:633–641
Gray JS (2002) Species richness of marine soft sediments. MarEcol Prog Ser 244:285–297
Hawkins BA, Diniz-Filho JAF, Weis AE (2005) The mid-domain effect and diversity gradients: Is there anything tolearn? Am Nat 166:E140–E143
Heip C, Basford D, Craeymeersh JA, Dewarumez JM and oth-ers (1992) Trends in biomass, density and biodiversity ofNorth Sea macrofauna. ICES J Mar Sci 49:13–22
Hillebrand H (2004) Strength, slope and variability of marinelatitudinal gradients. Mar Ecol Prog Ser 273:251–267
Huston M (1979) A general hypothesis of species diversity.Am Nat 113:81–101
Karakassis I, Machias A, Pitta P, Papadopoulou KN and others(2006) Cross-community congruence of patterns in amarine ecosystem: Do the parts reflect the whole? MarEcol Prog Ser 310:47–54
Kendall M (1996) Are Arctic soft-sediment macrobenthiccommunities impoverished? Polar Biol 16:393–399
Kendall M, Aschan M (1993) Latitudinal gradients in thestructure of macrobenthic communities: a comparison ofArctic, temperate and tropical sites. J Exp Mar Biol Ecol172:157–169
Kröncke I, Dippner JW, Heyen H (1998) Long-term changesin the macrofaunal communities off Norderney (EastFrisia, Germany) in relation to climate variability. MarEcol Prog Ser 167:25–36
Lambshead PJD, Tietjen J, Ferrero T, Jensen P (2000) Latitu-dinal diversity gradients in the deep-sea with special ref-erence to North Atlantic nematodes. Mar Ecol Prog Ser194:159–167
Lambshead PJD, Tietjen J, Moncrieff CB, Ferrero T (2001)North Atlantic latitudinal diversity patterns in deep-seamarine nematode data: a reply to Rex et al. Mar Ecol ProgSer 210:299–301
Lambshead PJD, Brown CJ, Ferrero T, Mitchell NJ, Smith CR,Hawkins LE, Tietjen J (2002) Latitudinal diversity patternsof deep-sea marine nematodes and organic fluxes: a testfrom the central equatorial Pacific. Mar Ecol Prog Ser 236:129–135
Levin LA, Etter RJ, Rex MA, Gooday AJ and others (2001)Environmental influences of regional deep-sea speciesdiversity. Annu Rev Ecol Syst 32:51–93
MacPherson E (2002) Large-scale species-richness gradientsin the Atlantic Ocean. Proc R Soc Lond B 269:1715–1720
Mokievsky V, Azovsky A (2002) Re-evaluation of speciesdiversity patterns of free-living nematodes. Mar Ecol ProgSer 238:101–108
251
Mar Ecol Prog Ser 382: 239–252, 2009
Quinn GP, Keough MJ (2002) Data analysis and experimentaldesign for biologists. Cambridge University Press, Cam-bridge
R Development Core Team (2005) R: a language and environ-ment for statistical computing. R Foundation for StatisticalComputing, Vienna. Available at www.R-project.org
Rees HL, Eggleton JD, Rachor E, Vanden Berghe E (eds)(2007) Structure and dynamics of the North Sea benthos.ICES Coop Res Rep 288:1–258 pp
Renaud PE, Ambrose WG, Vanreusel A, Clough LM (2006)Nematode and macrofaunal diversity in central ArcticOcean benthos. J Exp Mar Biol Ecol 330:297–306
Rex MA (1981) Community structure in the deep-sea benthos.Annu Rev Ecol Syst 12:331–353
Rex MA, Stuart CT, Hessler RR, Allen JA, Sanders HL, WilsonGDF (1993) Global-scale latitudinal patterns of speciesdiversity in the deep-sea benthos. Nature 365:636–639
Rex MA, Stuart CT, Coyne G (2000) Latitudinal gradients ofspecies richness in the deep-sea benthos of the NorthAtlantic. Proc Natl Acad Sci USA 97:4082–4085
Roy K, Jablonski D, Valentine JW, Rosenberg G (1998)Marine latitudinal diversity gradients: tests of causalhypotheses. Proc Natl Acad Sci USA 95:3699–3702
Roy K, Jablonski D, Valentine JW (2000) Dissecting latitudi-nal diversity gradients: functional groups and clades ofmarine bivalves. Proc R Soc Lond B 267:293–299
Solan M, Raffaelli DG, Paterson DM, White PCL, Pierce GJ(2006) Marine biodiversity and ecosystem function: empir-ical approaches and future research needs. Mar Ecol ProgSer 311:175–178
Storch D, Davies RG, Zajicek S, Orme CDL and others (2006)Energy, range dynamics and global species richnesspatterns: reconciling mid-domain effects and environ-mental determinants of avian diversity. Ecol Lett 9:1308–1320
Svavarsson J, Stomberg JO, Brattegard T (1993) The deep-
sea asellote (Isopoda, Crustacea) fauna of the northernseas: species composition, distributional patterns and ori-gin. J Biogeogr 20:537–555
Thorson G (1957) Bottom communities (sublittoral or shallowshelf). In: Hedgepeth JW (ed) Treatise on marine ecologyand paleoecology. Geological Society of America, NewYork, p 461–534
Valentine JW, Roy K, Jablonski D (2002) Carnivore/non-carnivore ratios in northeastern Pacific marine gastropods.Mar Ecol Prog Ser 228:153–163
Vanden Berghe E, Claus S, Appeltans W, Faulwetter S andothers (2009) Description of an integrated database onbenthic invertebrates of European continental shelves: atool for large-scale analysis across Europe. Mar Ecol ProgSer 382:225–238
Warwick RM, Clarke KR (2001) Practical measures of marinebiodiversity based on relatedness of species. OceanogrMar Biol Annu Rev 39:532–543
Willig MR, Kaufman DM, Stevens RD (2003) Latitudinal gra-dients of biodiversity: patterns, process, scale, and synthe-sis. Annu Rev Ecol Syst 34:273–309
Witman JD, Etter RJ, Smith F (2004) The relationship betweenregional and local diversity in marine benthic communi-ties: a global perspective. Proc Natl Acad Sci USA 101:15664–15669
W8odarska-Kowalczuk M, Kendall MA, Wes8awski JM,Klages M, Soltwedel T (2004) Depth gradients of benthicstanding stock and diversity on the continental margin ata high-latitude ice-free site (off Spitsbergen, 79° N). Deep-Sea Res I 51:1903–1914
W8odarska-Kowalczuk M, Sicinski J, Gromisz S, Kendall MA,Dahle S (2006) Similar soft-bottom polychaete diversity inArctic and Antarctic marine inlets. Mar Biol 151:607–616doi:10.1007/s00227-006-0496-9
Zapata FA, Gaston KJ, Chown SL (2005) The mid-domaineffect revisited. Am Nat 166:E144–E148
252
Submitted: July 5, 2008; Accepted: February 6, 2009 Proofs received from author(s): March 17, 2009


![macroinvertebrate is the term used for invertebrate fauna ... · A [benthic] macroinvertebrate is the term used for invertebrate fauna that can be captured by a 500-‐µm net or](https://img.dokumen.tips/doc/110x75/5f927494dae45a5acc3453f3/macroinvertebrate-is-the-term-used-for-invertebrate-fauna-a-benthic-macroinvertebrate.jpg)