Embed Size (px)
Citation preview
Contents Page No
Coconut conversion tables ............................................................................................................... 2
Standards in coconut extent estimation .......................................................................................... 2
General conversion factors .............................................................................................................. 2
1. GENERAL INFORMATION ............................................................................................................. 3
1.1 Land use pattern in Sri Lanka ..................................................................................................... 3
Table 1: Agricultural lands as percentage of total lands by districts ............................................... 3
Table 2: Agricultural land extent and percentage distribution of land use pattern by district - 2002.................................................................................................................................................. 4
Table 3: Rainfall data - 1970 - 2008 ................................................................................................. 5
Table 4: Rainfall data (mm) collected in CRI meteorological stations 2000 – 2010 ........................ 6
Table 4.1: Ambekele genetic resource centre (North Western Province) ...................................... 6
Table 4.2: Maduruoya genetic resource centre (North Central Province) ...................................... 6
Table 4.3: Pallama genetic resource centre (North Western Province) .......................................... 7
Table 4.4: Bandirippuwa research substation (North Western Province) ....................................... 7
Table 4.5: Pottukulama research substation (North Western Province) ........................................ 8
Table 4.6: Ratmalagara research substation (North Western Province) ......................................... 8
2. COCONUT STATISTICS .................................................................................................................. 9
2.1 Extent of cultivation ................................................................................................................... 9
Table 5: Extent under coconut ......................................................................................................... 9
Table 6: Coconut cultivation by age and by sector – 2002 .............................................................. 9
Table 7: Distribution of coconut small holdings and estates by size classes ................................. 10
Table 8: Coconut extent under systematic and scattered cultivations ......................................... 10
Table 9: Extent under coconuts by districts ................................................................................... 11
Table 10: District-wise Distribution of coconut cultivation according to the growing pattern ..... 12
Table 11: Areas under coconut in the world (' 000 ha) ................................................................. 13
2.2 Coconut production and consumption statistics ..................................................................... 15
Table 12: Coconut production and domestic consumption (2005-2010) ..................................... 15
Table 13: National monthly coconut production data - 2009-2010 (mln. nuts) ........................... 15
Table 14: National coconut production ( actual and estimated production) ................................ 15
Table 15: Coconut - pattern of utilization (mln. nuts) ................................................................... 16
Table 16: Monthly per capita consumption of coconut products ................................................. 16
Table 17: Yearly per capita consumption by districts .................................................................... 16
3. PRODUCTIVITY ........................................................................................................................... 17
Table 18: Productivity of coconut lands in Sri Lanka 1997-2007 ................................................... 17
Table 19: Productivity of coconut lands in the world Nuts/ha ...................................................... 17
4. COCONUT PRODUCTS ................................................................................................................ 18
Table 20: Fresh nut prices (wholesale) .......................................................................................... 18
Table 21: Fresh nut prices (retail) .................................................................................................. 18
Table 22: Coconut oil production................................................................................................... 19
Table 23: Local market price of coconut oil ................................................................................... 19
Table 24: Coconut oil exports ........................................................................................................ 20
Table 25: Total import of edible oils ............................................................................................. 20
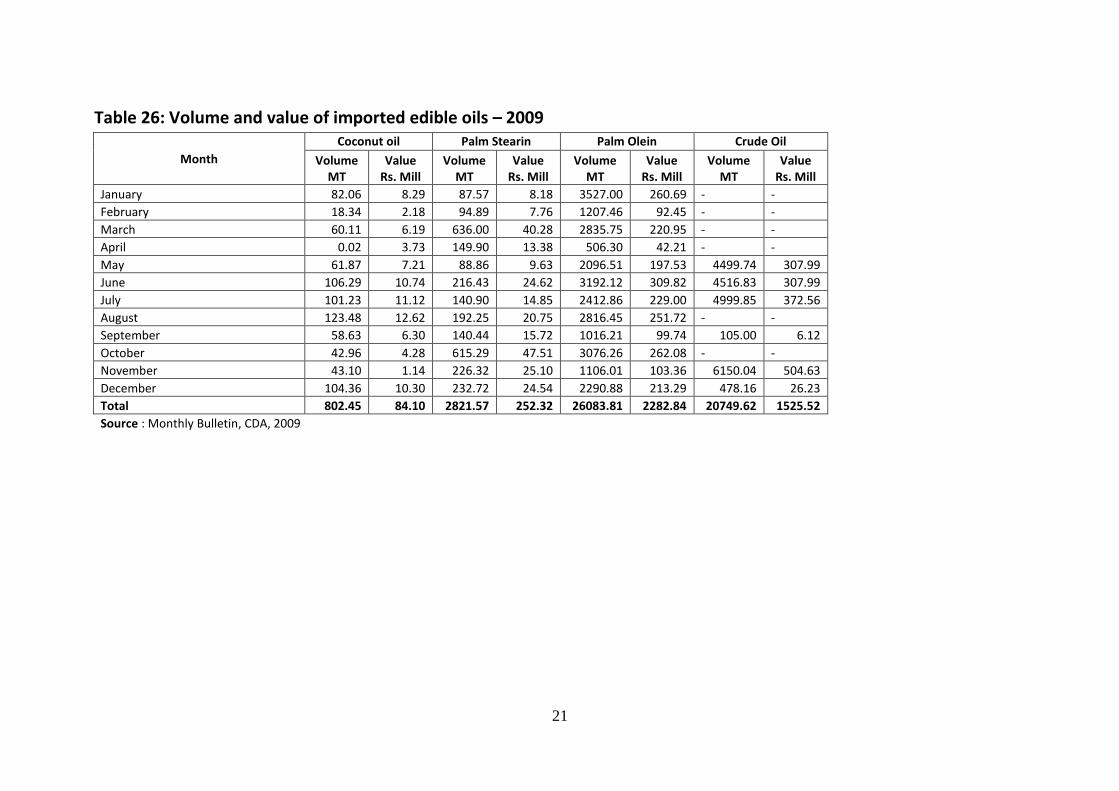
Table 26: Volume and value of imported edible oils – 2009 ......................................................... 21
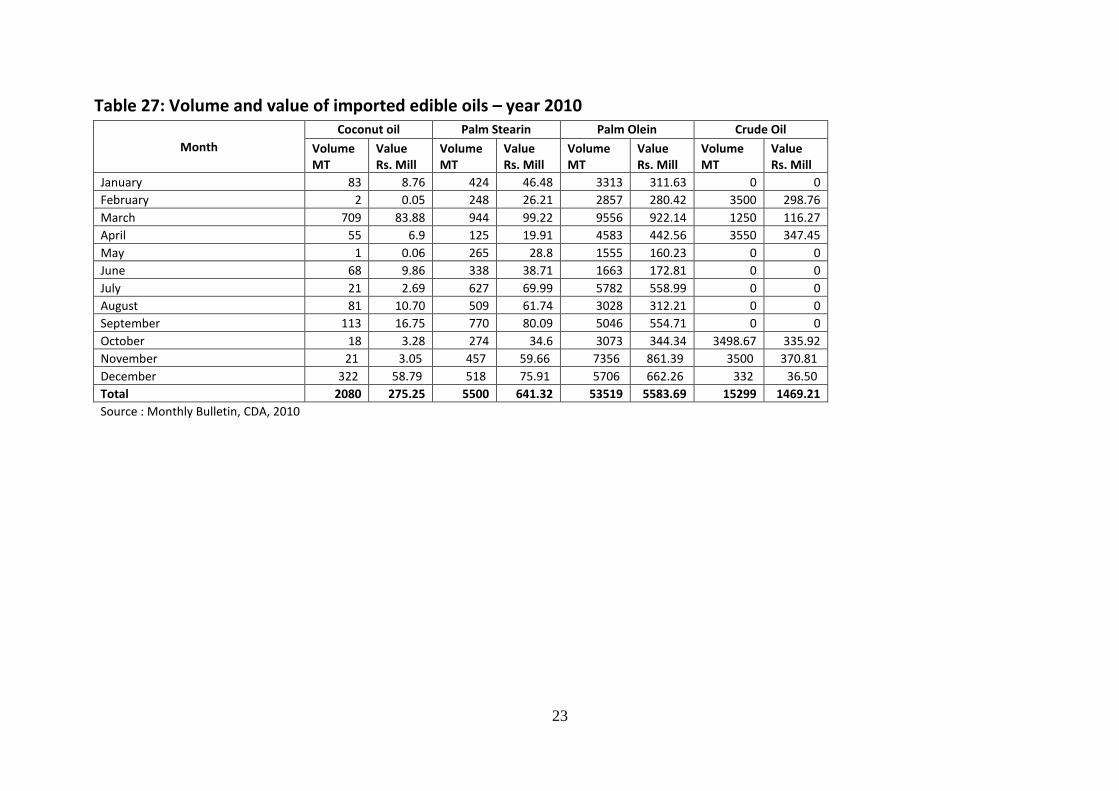
Table 27: Volume and value of Imported edible oils – year 2010 ................................................. 23
1
Table 28: Desiccated coconut production (MT) ............................................................................ 25
Table 29: Desiccated coconut exports (MT) .................................................................................. 26
Table 30: Local market price of desiccated coconut ..................................................................... 26
Table 31: World exports of fresh coconut 2004-2008 (tones) ...................................................... 27
Table 32: World exports of coconut oil, 2004-2008 ( MT)............................................................. 28
Table 33: World exports of copra meal, 2004-2008 ( MT) ............................................................ 30
Table 34: World estimated consumption of desiccated coconut, 2004-2008 (MT) ...... 31
Table 35: Exports of Mattress Fibre in Bales, Monthly Statistics 2007-2010 .............................. 32
Table 36: Exports of Bristle Fibre, Monthly Statistics 2007-2010 ................................................ 33
Table 37: Exports of Twisted Fibre, Monthly Statistics 2007-2010 ............................................. 34
Table 38: Exports of Coir Yarn, Monthly Statistics 2007-2010 .................................................... 35
Table 39: Exports of Coir Twine, Monthly Statistics 2007-2010 .................................................. 36
Table 40: Exports of Coir Fibre Pith, Monthly Statistics 2007-2010 ............................................ 37
Table 41: Monthly Export of CSC Activated Carbon from the APCC Member Countries to the USA, 2009 - 2010 (MT) ................................................................................................................... 38
Table 42: Monthly Export of Coconut Shell Charcoal by Selected Countries - 2008 - 2010 ( MT) 39
Table 43: Monthly Export of Activated Carbon by Selected Countries, 2008 - 2010 ( MT) ......... 40
5. PALM OIL INDUSTRY ............................................................................................................... 41 Table 44: Extent of oil palm cultivation in the world .................................................................... 41
Table 45: Major palm oil importers .............................................................................................. 41 Table 46: Main palm oil producers ................................................................................................ 41
Table 47: Existing extent of oil palm in Sri Lanka ........................................................................ 41 Table 48: Future plan ..................................................................................................................... 42
Table 49: Local palm oil production .............................................................................................. 42
Table 50: Vegetable oils and fats imports by Sri Lanka – quantity kg .......................................... 43
Table 51: Vegetable oil and fats imported by Sri Lanka – value Rs. .............................................. 44
6. INFORMATION ON GENETIC RESOURCE CENTERS AND RESEARCH SUB STATIONS OF CRI ...... 45
Table 52: Genetic resource centers of CRI ..................................................................................... 45
Table 53: Research sub stations of CRI .......................................................................................... 45
Table 54: Distribution of coconut palms in genetic resource centers of CRI ................................ 46
Table 55: Number of palms and nut per palm in research sub stations and genetic resources center from 2006 to 2010 .............................................................................................................. 47
Table 56: Land utilization pattern of the research sub stations and genetic resources centers in 2010................................................................................................................................................ 48
Table 57: Nut production in CRI estates ........................................................................................ 49
7. REGIONAL NURSERIES ................................................................................................................ 50
Table 58: Regional nurseries under CRI estates ............................................................................ 50
Table 59: Regional nurseries under CCB ....................................................................................... 51
Table 60: Registered nurseries of Coconut Research Institute...................................................... 52
8. COST OF PRODUCTION OF COCONUT ........................................................................................ 53
Table 61: COP of monocrop cultivation (S1 and S2 Land) ............................................................. 53
Table 62: COP of monocrop cultivation (S3 Land) ......................................................................... 56
Table 63: COP of monocrop cultivation (S4 Land) ......................................................................... 59

2
Coconut conversion tables
Item Coconut (Nuts)
Copra (MT) Desiccated coconut (MT)
Coconut oil (MT)
Poonac (MT)
1 MT Copra 5,230 1.000 0.684 0.602 0.301
1 MT Desiccated coconut 7,650 1.463 1.000 0.880 0.440
1 MT Coconut oil 8,690 1.662 1.136 1.000 0.500
1 MT Poonac 17,380 3.323 2.272 2.000 1.000
1000 Coconuts 1,000 0.192 0.131 0.115 0.057
1 MT Coconut cream 7,650 1.463 1.000 0.880 0.440
1 MT Coconut milk 3,250 0.621 0.425 0.374 0.187
1 MT Coconut milk powder 12,000 2.294 1.569 1.381 0.690
Source: Sri Lanka Coconut Statistics, CDA, 2009
Standards in coconut extent estimation
Item Standard Palms/acre
Recommended no of palms per ac. (CRI) 26 ft x 26 ft 64
Conversion rate used by the Department of Census and Statistics 60
Density of mature palms (Diagnostic Survey, CRI, 2006) 50
General conversion factors
Type Unit Quantity
Weight of 1000 nuts kg 130-140
No of shell for kg no 07-08
Average weight of kernel kg 0.35-0.40
3
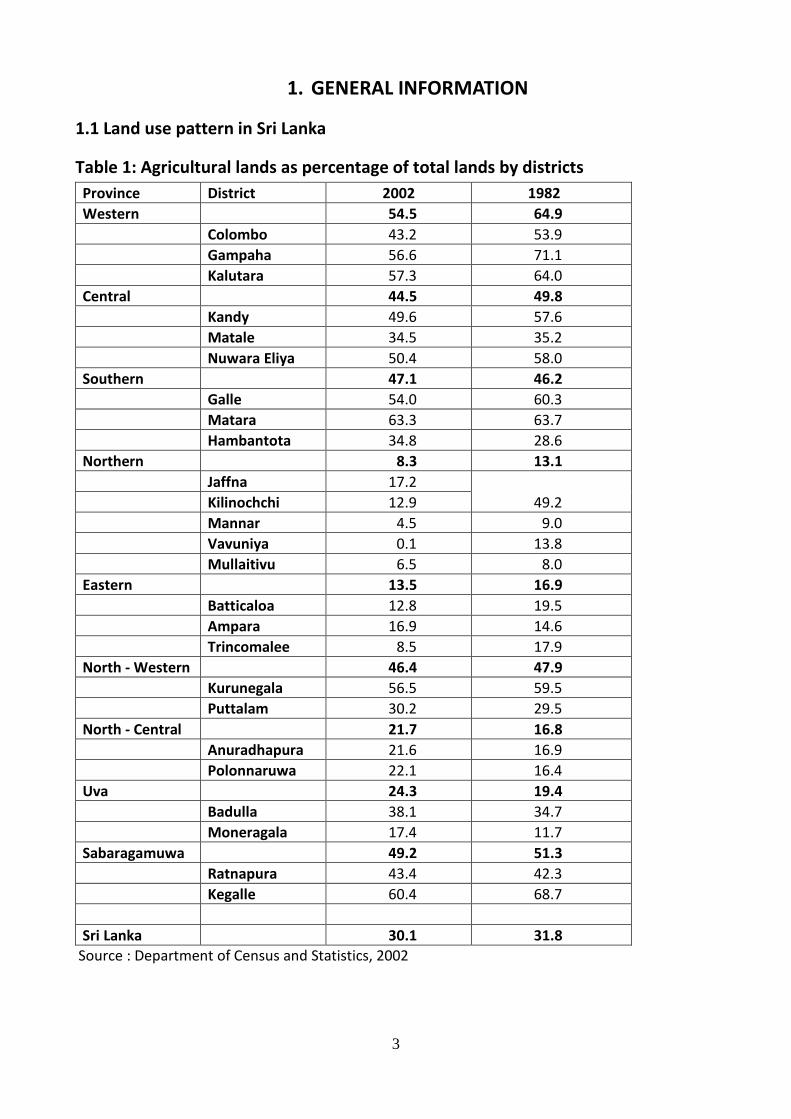
1. GENERAL INFORMATION
1.1 Land use pattern in Sri Lanka
Table 1: Agricultural lands as percentage of total lands by districts
Province District 2002 1982
Western 54.5 64.9
Colombo 43.2 53.9
Gampaha 56.6 71.1
Kalutara 57.3 64.0
Central 44.5 49.8
Kandy 49.6 57.6
Matale 34.5 35.2
Nuwara Eliya 50.4 58.0
Southern 47.1 46.2
Galle 54.0 60.3
Matara 63.3 63.7
Hambantota 34.8 28.6
Northern 8.3 13.1
Jaffna 17.2
49.2
Kilinochchi 12.9
Mannar 4.5 9.0
Vavuniya 0.1 13.8
Mullaitivu 6.5 8.0
Eastern 13.5 16.9
Batticaloa 12.8 19.5
Ampara 16.9 14.6
Trincomalee 8.5 17.9
North - Western 46.4 47.9
Kurunegala 56.5 59.5
Puttalam 30.2 29.5
North - Central 21.7 16.8
Anuradhapura 21.6 16.9
Polonnaruwa 22.1 16.4
Uva 24.3 19.4
Badulla 38.1 34.7
Moneragala 17.4 11.7
Sabaragamuwa 49.2 51.3
Ratnapura 43.4 42.3
Kegalle 60.4 68.7
Sri Lanka 30.1 31.8
Source : Department of Census and Statistics, 2002
4
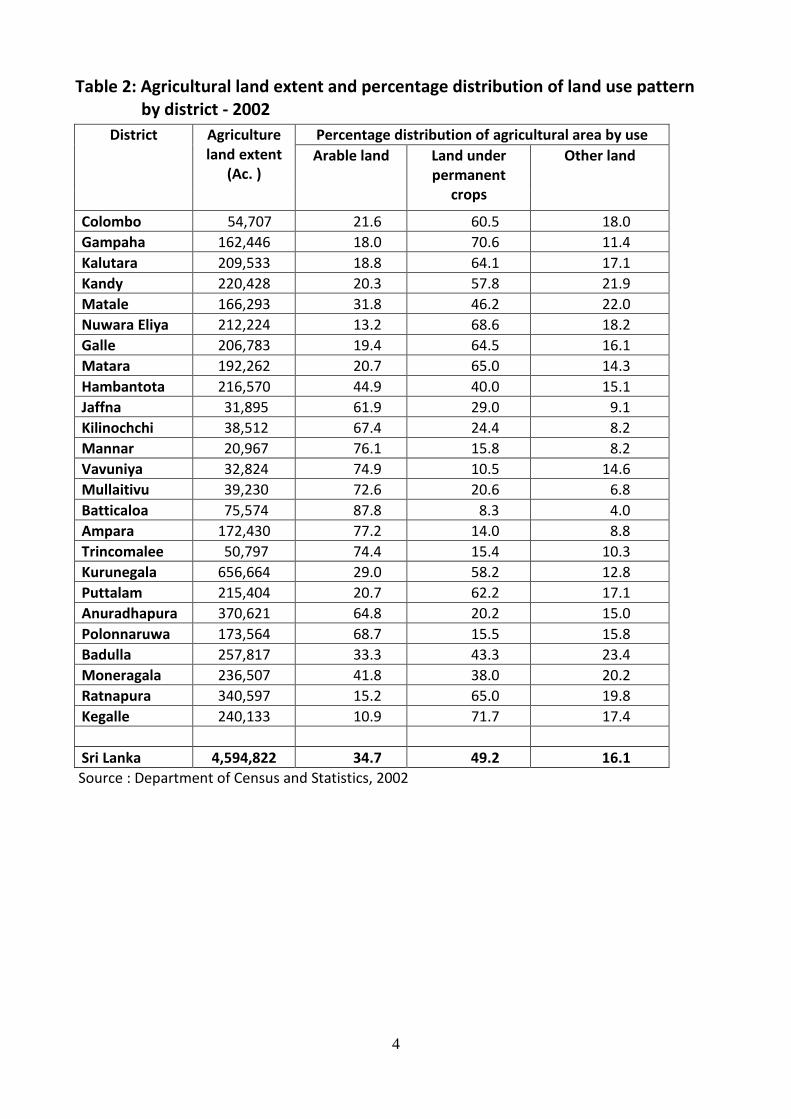
Table 2: Agricultural land extent and percentage distribution of land use pattern by district - 2002
District Agriculture land extent
(Ac. )
Percentage distribution of agricultural area by use
Arable land Land under permanent
crops
Other land
Colombo 54,707 21.6 60.5 18.0
Gampaha 162,446 18.0 70.6 11.4
Kalutara 209,533 18.8 64.1 17.1
Kandy 220,428 20.3 57.8 21.9
Matale 166,293 31.8 46.2 22.0
Nuwara Eliya 212,224 13.2 68.6 18.2
Galle 206,783 19.4 64.5 16.1
Matara 192,262 20.7 65.0 14.3
Hambantota 216,570 44.9 40.0 15.1
Jaffna 31,895 61.9 29.0 9.1
Kilinochchi 38,512 67.4 24.4 8.2
Mannar 20,967 76.1 15.8 8.2
Vavuniya 32,824 74.9 10.5 14.6
Mullaitivu 39,230 72.6 20.6 6.8
Batticaloa 75,574 87.8 8.3 4.0
Ampara 172,430 77.2 14.0 8.8
Trincomalee 50,797 74.4 15.4 10.3
Kurunegala 656,664 29.0 58.2 12.8
Puttalam 215,404 20.7 62.2 17.1
Anuradhapura 370,621 64.8 20.2 15.0
Polonnaruwa 173,564 68.7 15.5 15.8
Badulla 257,817 33.3 43.3 23.4
Moneragala 236,507 41.8 38.0 20.2
Ratnapura 340,597 15.2 65.0 19.8
Kegalle 240,133 10.9 71.7 17.4
Sri Lanka 4,594,822 34.7 49.2 16.1
Source : Department of Census and Statistics, 2002
5
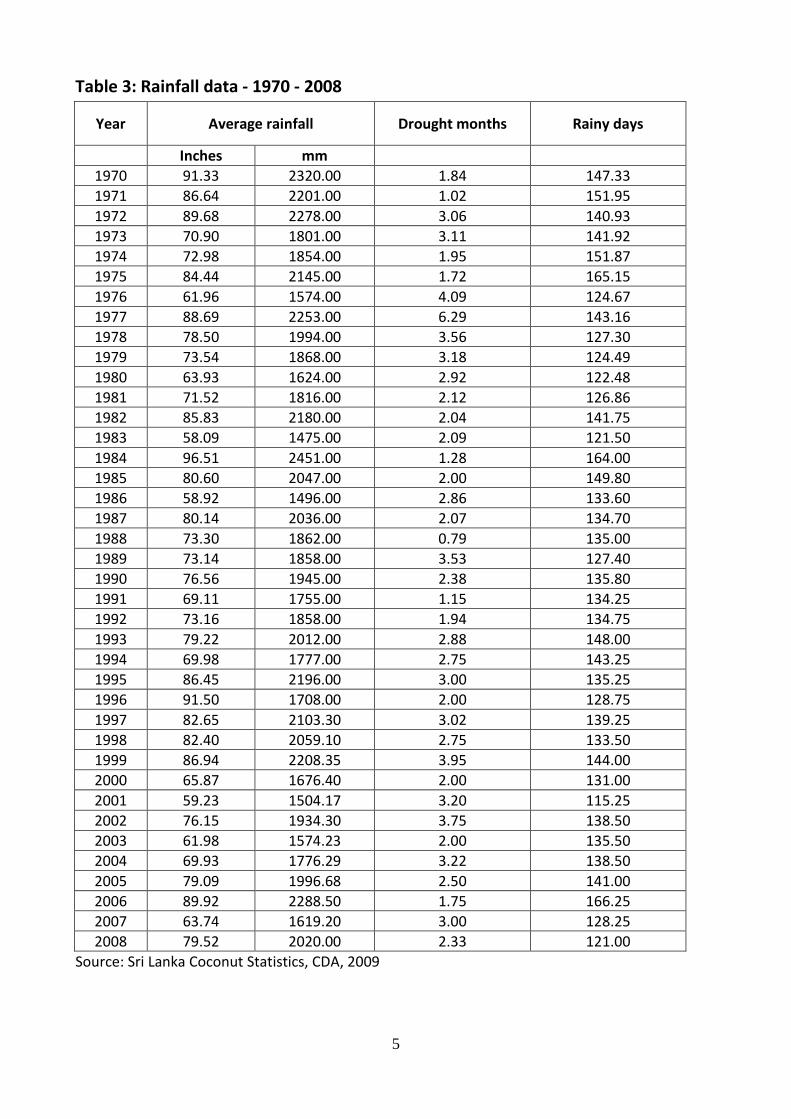
Table 3: Rainfall data - 1970 - 2008
Year Average rainfall Drought months Rainy days
Inches mm
1970 91.33 2320.00 1.84 147.33
1971 86.64 2201.00 1.02 151.95
1972 89.68 2278.00 3.06 140.93
1973 70.90 1801.00 3.11 141.92
1974 72.98 1854.00 1.95 151.87
1975 84.44 2145.00 1.72 165.15
1976 61.96 1574.00 4.09 124.67
1977 88.69 2253.00 6.29 143.16
1978 78.50 1994.00 3.56 127.30
1979 73.54 1868.00 3.18 124.49
1980 63.93 1624.00 2.92 122.48
1981 71.52 1816.00 2.12 126.86
1982 85.83 2180.00 2.04 141.75
1983 58.09 1475.00 2.09 121.50
1984 96.51 2451.00 1.28 164.00
1985 80.60 2047.00 2.00 149.80
1986 58.92 1496.00 2.86 133.60
1987 80.14 2036.00 2.07 134.70
1988 73.30 1862.00 0.79 135.00
1989 73.14 1858.00 3.53 127.40
1990 76.56 1945.00 2.38 135.80
1991 69.11 1755.00 1.15 134.25
1992 73.16 1858.00 1.94 134.75
1993 79.22 2012.00 2.88 148.00
1994 69.98 1777.00 2.75 143.25
1995 86.45 2196.00 3.00 135.25
1996 91.50 1708.00 2.00 128.75
1997 82.65 2103.30 3.02 139.25
1998 82.40 2059.10 2.75 133.50
1999 86.94 2208.35 3.95 144.00
2000 65.87 1676.40 2.00 131.00
2001 59.23 1504.17 3.20 115.25
2002 76.15 1934.30 3.75 138.50
2003 61.98 1574.23 2.00 135.50
2004 69.93 1776.29 3.22 138.50
2005 79.09 1996.68 2.50 141.00
2006 89.92 2288.50 1.75 166.25
2007 63.74 1619.20 3.00 128.25
2008 79.52 2020.00 2.33 121.00
Source: Sri Lanka Coconut Statistics, CDA, 2009
6
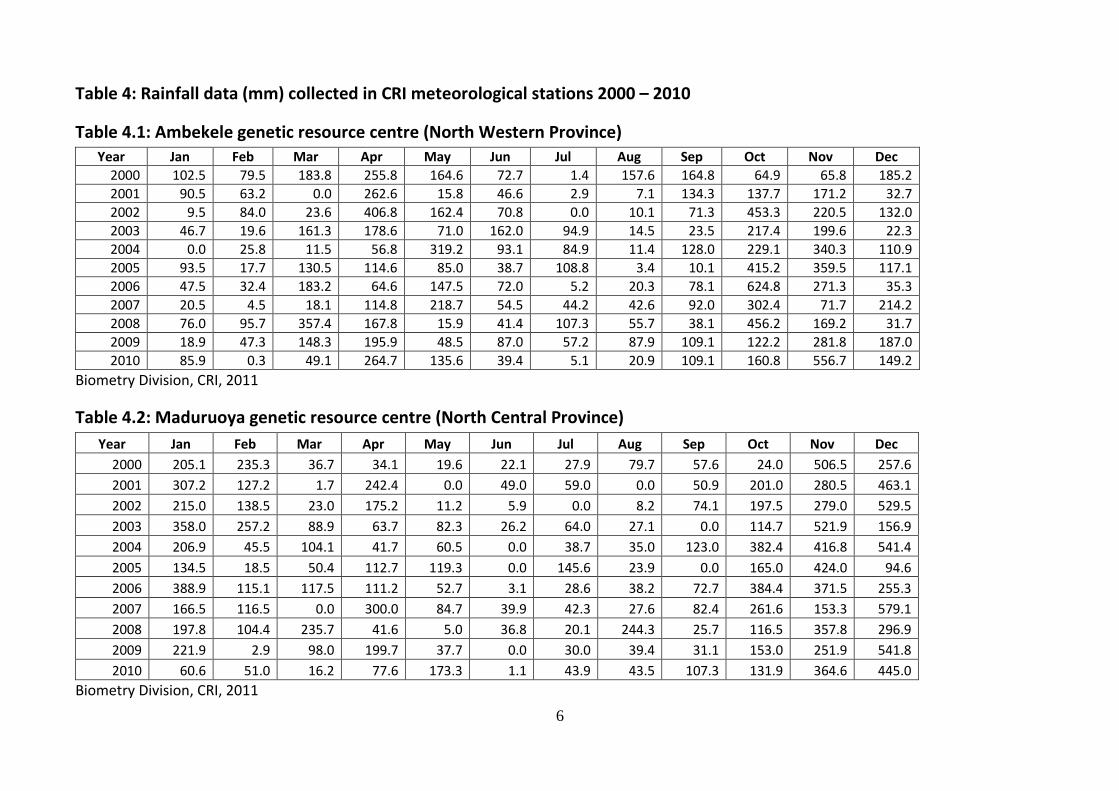
Table 4: Rainfall data (mm) collected in CRI meteorological stations 2000 – 2010
Table 4.1: Ambekele genetic resource centre (North Western Province)
Year Jan Feb Mar Apr May Jun Jul Aug Sep Oct Nov Dec
2000 102.5 79.5 183.8 255.8 164.6 72.7 1.4 157.6 164.8 64.9 65.8 185.2
2001 90.5 63.2 0.0 262.6 15.8 46.6 2.9 7.1 134.3 137.7 171.2 32.7
2002 9.5 84.0 23.6 406.8 162.4 70.8 0.0 10.1 71.3 453.3 220.5 132.0
2003 46.7 19.6 161.3 178.6 71.0 162.0 94.9 14.5 23.5 217.4 199.6 22.3
2004 0.0 25.8 11.5 56.8 319.2 93.1 84.9 11.4 128.0 229.1 340.3 110.9
2005 93.5 17.7 130.5 114.6 85.0 38.7 108.8 3.4 10.1 415.2 359.5 117.1
2006 47.5 32.4 183.2 64.6 147.5 72.0 5.2 20.3 78.1 624.8 271.3 35.3
2007 20.5 4.5 18.1 114.8 218.7 54.5 44.2 42.6 92.0 302.4 71.7 214.2
2008 76.0 95.7 357.4 167.8 15.9 41.4 107.3 55.7 38.1 456.2 169.2 31.7
2009 18.9 47.3 148.3 195.9 48.5 87.0 57.2 87.9 109.1 122.2 281.8 187.0
2010 85.9 0.3 49.1 264.7 135.6 39.4 5.1 20.9 109.1 160.8 556.7 149.2
Biometry Division, CRI, 2011
Table 4.2: Maduruoya genetic resource centre (North Central Province)
Year Jan Feb Mar Apr May Jun Jul Aug Sep Oct Nov Dec
2000 205.1 235.3 36.7 34.1 19.6 22.1 27.9 79.7 57.6 24.0 506.5 257.6
2001 307.2 127.2 1.7 242.4 0.0 49.0 59.0 0.0 50.9 201.0 280.5 463.1
2002 215.0 138.5 23.0 175.2 11.2 5.9 0.0 8.2 74.1 197.5 279.0 529.5
2003 358.0 257.2 88.9 63.7 82.3 26.2 64.0 27.1 0.0 114.7 521.9 156.9
2004 206.9 45.5 104.1 41.7 60.5 0.0 38.7 35.0 123.0 382.4 416.8 541.4
2005 134.5 18.5 50.4 112.7 119.3 0.0 145.6 23.9 0.0 165.0 424.0 94.6
2006 388.9 115.1 117.5 111.2 52.7 3.1 28.6 38.2 72.7 384.4 371.5 255.3
2007 166.5 116.5 0.0 300.0 84.7 39.9 42.3 27.6 82.4 261.6 153.3 579.1
2008 197.8 104.4 235.7 41.6 5.0 36.8 20.1 244.3 25.7 116.5 357.8 296.9
2009 221.9 2.9 98.0 199.7 37.7 0.0 30.0 39.4 31.1 153.0 251.9 541.8
2010 60.6 51.0 16.2 77.6 173.3 1.1 43.9 43.5 107.3 131.9 364.6 445.0
Biometry Division, CRI, 2011
7
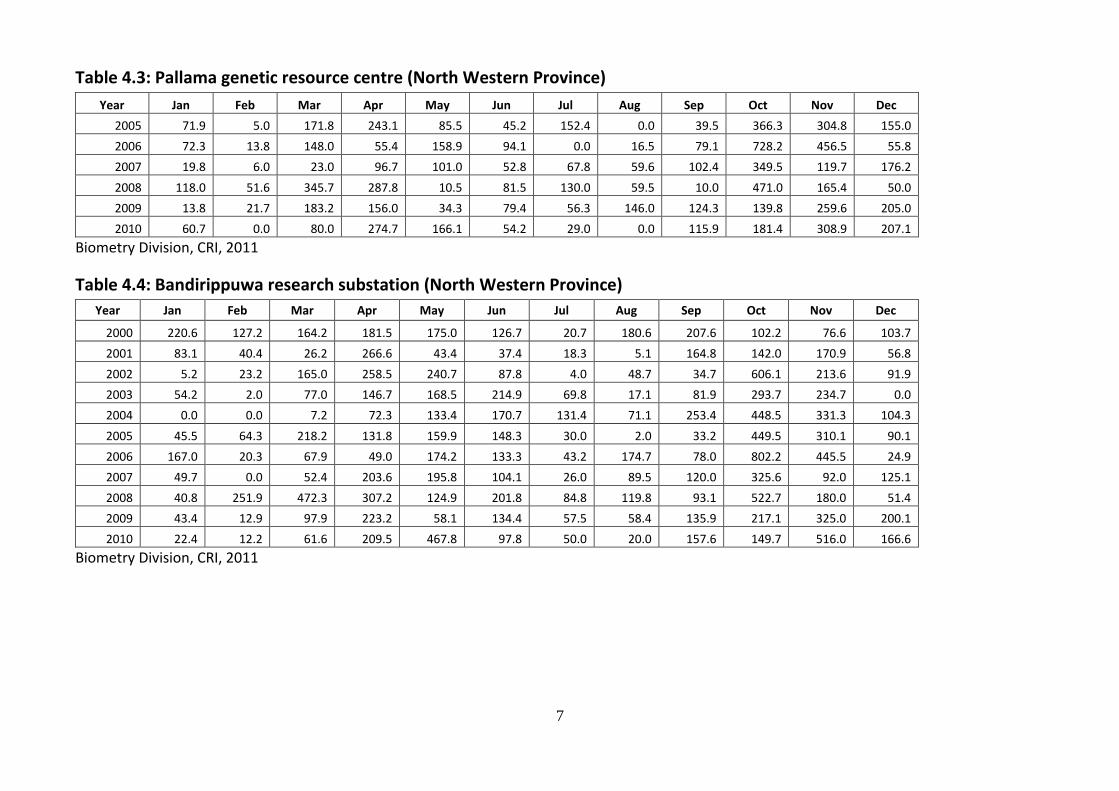
Table 4.3: Pallama genetic resource centre (North Western Province)
Year Jan Feb Mar Apr May Jun Jul Aug Sep Oct Nov Dec
2005 71.9 5.0 171.8 243.1 85.5 45.2 152.4 0.0 39.5 366.3 304.8 155.0
2006 72.3 13.8 148.0 55.4 158.9 94.1 0.0 16.5 79.1 728.2 456.5 55.8
2007 19.8 6.0 23.0 96.7 101.0 52.8 67.8 59.6 102.4 349.5 119.7 176.2
2008 118.0 51.6 345.7 287.8 10.5 81.5 130.0 59.5 10.0 471.0 165.4 50.0
2009 13.8 21.7 183.2 156.0 34.3 79.4 56.3 146.0 124.3 139.8 259.6 205.0
2010 60.7 0.0 80.0 274.7 166.1 54.2 29.0 0.0 115.9 181.4 308.9 207.1
Biometry Division, CRI, 2011
Table 4.4: Bandirippuwa research substation (North Western Province)
Year Jan Feb Mar Apr May Jun Jul Aug Sep Oct Nov Dec
2000 220.6 127.2 164.2 181.5 175.0 126.7 20.7 180.6 207.6 102.2 76.6 103.7
2001 83.1 40.4 26.2 266.6 43.4 37.4 18.3 5.1 164.8 142.0 170.9 56.8
2002 5.2 23.2 165.0 258.5 240.7 87.8 4.0 48.7 34.7 606.1 213.6 91.9
2003 54.2 2.0 77.0 146.7 168.5 214.9 69.8 17.1 81.9 293.7 234.7 0.0
2004 0.0 0.0 7.2 72.3 133.4 170.7 131.4 71.1 253.4 448.5 331.3 104.3
2005 45.5 64.3 218.2 131.8 159.9 148.3 30.0 2.0 33.2 449.5 310.1 90.1
2006 167.0 20.3 67.9 49.0 174.2 133.3 43.2 174.7 78.0 802.2 445.5 24.9
2007 49.7 0.0 52.4 203.6 195.8 104.1 26.0 89.5 120.0 325.6 92.0 125.1
2008 40.8 251.9 472.3 307.2 124.9 201.8 84.8 119.8 93.1 522.7 180.0 51.4
2009 43.4 12.9 97.9 223.2 58.1 134.4 57.5 58.4 135.9 217.1 325.0 200.1
2010 22.4 12.2 61.6 209.5 467.8 97.8 50.0 20.0 157.6 149.7 516.0 166.6
Biometry Division, CRI, 2011
8
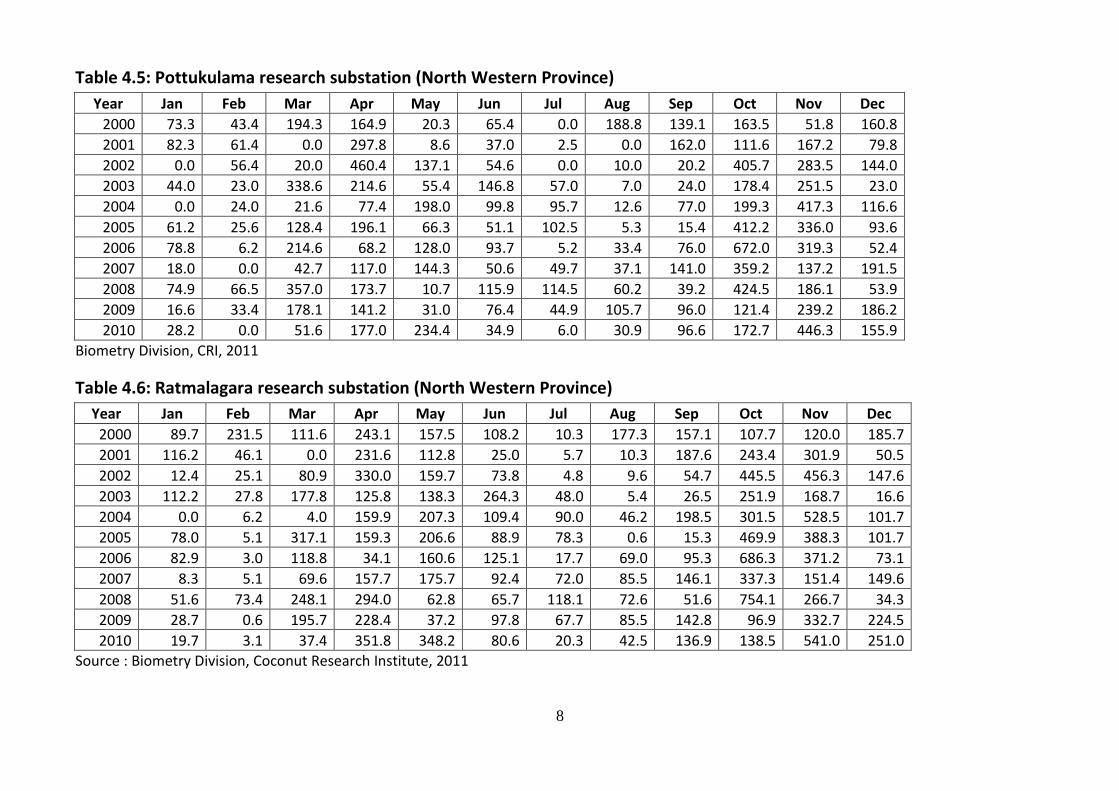
Table 4.5: Pottukulama research substation (North Western Province)
Year Jan Feb Mar Apr May Jun Jul Aug Sep Oct Nov Dec
2000 73.3 43.4 194.3 164.9 20.3 65.4 0.0 188.8 139.1 163.5 51.8 160.8
2001 82.3 61.4 0.0 297.8 8.6 37.0 2.5 0.0 162.0 111.6 167.2 79.8
2002 0.0 56.4 20.0 460.4 137.1 54.6 0.0 10.0 20.2 405.7 283.5 144.0
2003 44.0 23.0 338.6 214.6 55.4 146.8 57.0 7.0 24.0 178.4 251.5 23.0
2004 0.0 24.0 21.6 77.4 198.0 99.8 95.7 12.6 77.0 199.3 417.3 116.6
2005 61.2 25.6 128.4 196.1 66.3 51.1 102.5 5.3 15.4 412.2 336.0 93.6
2006 78.8 6.2 214.6 68.2 128.0 93.7 5.2 33.4 76.0 672.0 319.3 52.4
2007 18.0 0.0 42.7 117.0 144.3 50.6 49.7 37.1 141.0 359.2 137.2 191.5
2008 74.9 66.5 357.0 173.7 10.7 115.9 114.5 60.2 39.2 424.5 186.1 53.9
2009 16.6 33.4 178.1 141.2 31.0 76.4 44.9 105.7 96.0 121.4 239.2 186.2
2010 28.2 0.0 51.6 177.0 234.4 34.9 6.0 30.9 96.6 172.7 446.3 155.9
Biometry Division, CRI, 2011
Table 4.6: Ratmalagara research substation (North Western Province)
Year Jan Feb Mar Apr May Jun Jul Aug Sep Oct Nov Dec
2000 89.7 231.5 111.6 243.1 157.5 108.2 10.3 177.3 157.1 107.7 120.0 185.7
2001 116.2 46.1 0.0 231.6 112.8 25.0 5.7 10.3 187.6 243.4 301.9 50.5
2002 12.4 25.1 80.9 330.0 159.7 73.8 4.8 9.6 54.7 445.5 456.3 147.6
2003 112.2 27.8 177.8 125.8 138.3 264.3 48.0 5.4 26.5 251.9 168.7 16.6
2004 0.0 6.2 4.0 159.9 207.3 109.4 90.0 46.2 198.5 301.5 528.5 101.7
2005 78.0 5.1 317.1 159.3 206.6 88.9 78.3 0.6 15.3 469.9 388.3 101.7
2006 82.9 3.0 118.8 34.1 160.6 125.1 17.7 69.0 95.3 686.3 371.2 73.1
2007 8.3 5.1 69.6 157.7 175.7 92.4 72.0 85.5 146.1 337.3 151.4 149.6
2008 51.6 73.4 248.1 294.0 62.8 65.7 118.1 72.6 51.6 754.1 266.7 34.3
2009 28.7 0.6 195.7 228.4 37.2 97.8 67.7 85.5 142.8 96.9 332.7 224.5
2010 19.7 3.1 37.4 351.8 348.2 80.6 20.3 42.5 136.9 138.5 541.0 251.0
Source : Biometry Division, Coconut Research Institute, 2011
9
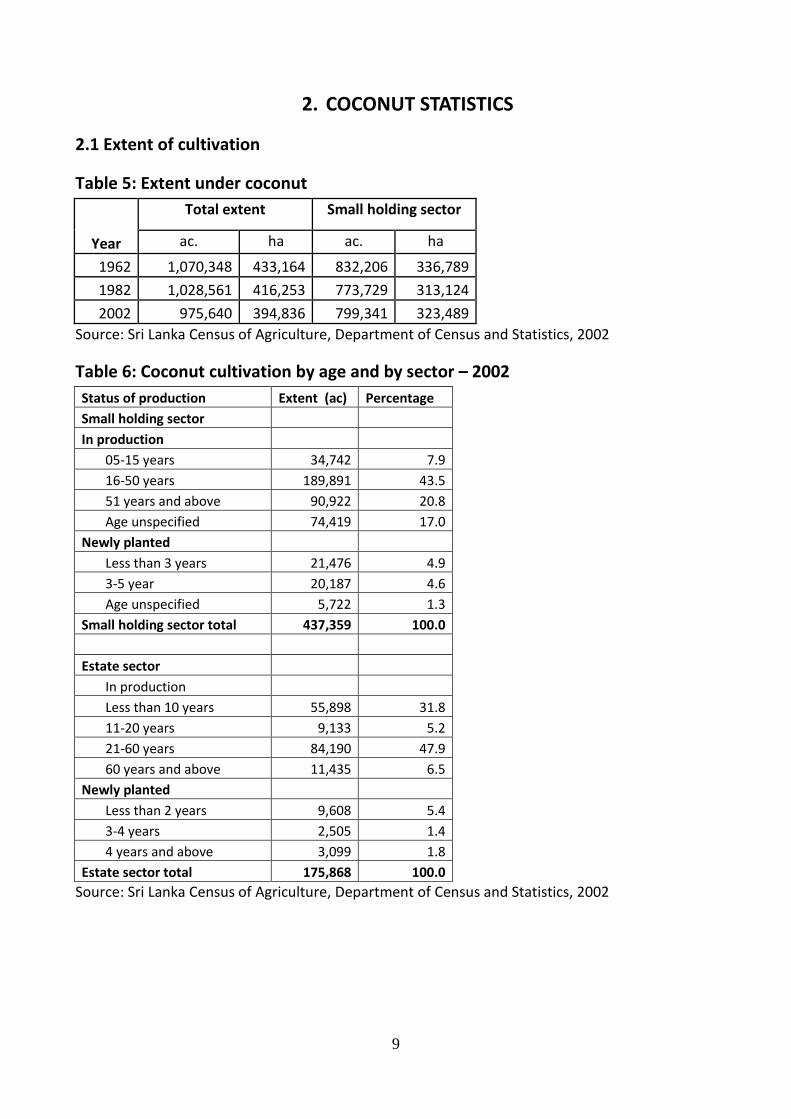
2. COCONUT STATISTICS
2.1 Extent of cultivation
Table 5: Extent under coconut
Year
Total extent Small holding sector
ac. ha ac. ha
1962 1,070,348 433,164 832,206 336,789
1982 1,028,561 416,253 773,729 313,124
2002 975,640 394,836 799,341 323,489
Source: Sri Lanka Census of Agriculture, Department of Census and Statistics, 2002
Table 6: Coconut cultivation by age and by sector – 2002
Status of production Extent (ac) Percentage
Small holding sector In production 05-15 years 34,742 7.9
16-50 years 189,891 43.5
51 years and above 90,922 20.8
Age unspecified 74,419 17.0
Newly planted Less than 3 years 21,476 4.9
3-5 year 20,187 4.6
Age unspecified 5,722 1.3
Small holding sector total 437,359 100.0
Estate sector In production
Less than 10 years 55,898 31.8
11-20 years 9,133 5.2
21-60 years 84,190 47.9
60 years and above 11,435 6.5
Newly planted Less than 2 years 9,608 5.4
3-4 years 2,505 1.4
4 years and above 3,099 1.8
Estate sector total 175,868 100.0
Source: Sri Lanka Census of Agriculture, Department of Census and Statistics, 2002
10
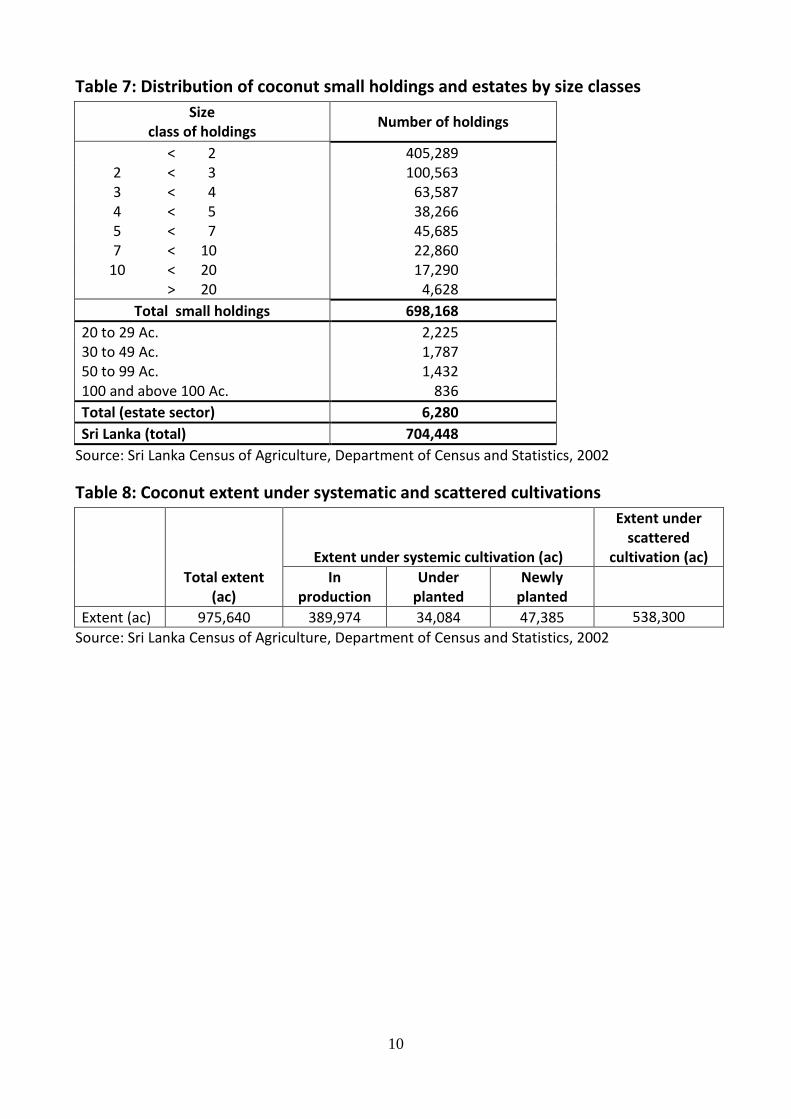
Table 7: Distribution of coconut small holdings and estates by size classes
Size class of holdings
Number of holdings
< 2 405,289 2 < 3 100,563 3 < 4 63,587 4 < 5 38,266 5 < 7 45,685 7 < 10 22,860
10 < 20 17,290 > 20 4,628
Total small holdings 698,168
20 to 29 Ac. 2,225 30 to 49 Ac. 1,787 50 to 99 Ac. 1,432 100 and above 100 Ac. 836
Total (estate sector) 6,280
Sri Lanka (total) 704,448
Source: Sri Lanka Census of Agriculture, Department of Census and Statistics, 2002
Table 8: Coconut extent under systematic and scattered cultivations
Total extent (ac)
Extent under systemic cultivation (ac)
Extent under scattered
cultivation (ac)
In production
Under planted
Newly planted
Extent (ac) 975,640 389,974 34,084 47,385 538,300
Source: Sri Lanka Census of Agriculture, Department of Census and Statistics, 2002
11
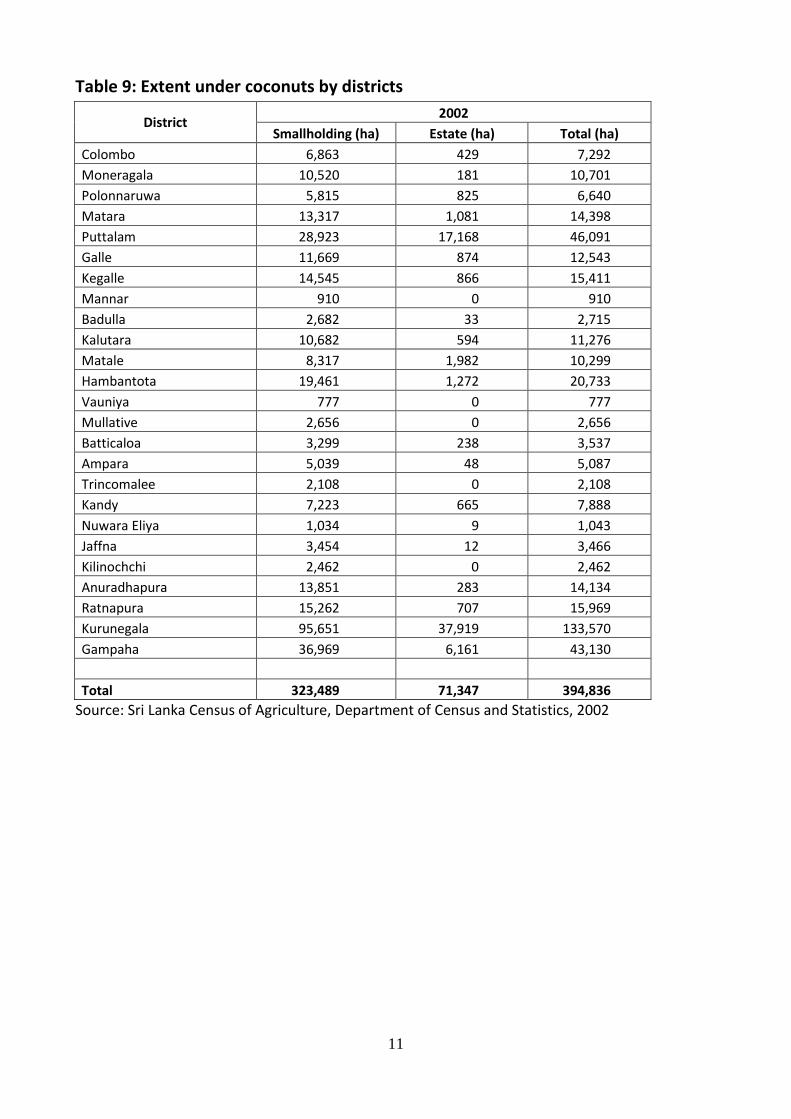
Table 9: Extent under coconuts by districts
District 2002
Smallholding (ha) Estate (ha) Total (ha)
Colombo 6,863 429 7,292
Moneragala 10,520 181 10,701
Polonnaruwa 5,815 825 6,640
Matara 13,317 1,081 14,398
Puttalam 28,923 17,168 46,091
Galle 11,669 874 12,543
Kegalle 14,545 866 15,411
Mannar 910 0 910
Badulla 2,682 33 2,715
Kalutara 10,682 594 11,276
Matale 8,317 1,982 10,299
Hambantota 19,461 1,272 20,733
Vauniya 777 0 777
Mullative 2,656 0 2,656
Batticaloa 3,299 238 3,537
Ampara 5,039 48 5,087
Trincomalee 2,108 0 2,108
Kandy 7,223 665 7,888
Nuwara Eliya 1,034 9 1,043
Jaffna 3,454 12 3,466
Kilinochchi 2,462 0 2,462
Anuradhapura 13,851 283 14,134
Ratnapura 15,262 707 15,969
Kurunegala 95,651 37,919 133,570
Gampaha 36,969 6,161 43,130
Total 323,489 71,347 394,836
Source: Sri Lanka Census of Agriculture, Department of Census and Statistics, 2002

12
Table 10: District-wise distribution of coconut cultivation according to the growing pattern
District
Operated area of holdings(ac) Pattern of coconut cultivation in holdings above 1/4 acre of land
No. of scattered trees in holdings less than 1/4 acre
Estimated extent under coconut (ac)
Total King Coconut Trees
Report in extent (ac) Reported in number of trees
Less than 1/4 acre
Above 1/4 acre Total extent
In -production
Not yet in-production
Under plantation In -production
Not yet in -production
Badulla 5,788.9 156,696.1 162,485.0 542.1 509.3 98.4 109,961 193,687 30,872 6,626.6 14,544
Moneragala 1,583.9 224,717.3 226,301.2 4,701.4 3,154.8 439.4 455,708 611,883 20,656 25,995.4 42,024
Kurunegala 15,137.6 533,644.7 548,782.3 175,135.6 16,260.8 16,334.6 1,539,878 778,638 378,981 236,354.6 170,927
Puttalam 9,479.2 159,230.9 168,710.1 49,165.4 5,690.1 2,691.0 470,783 240,327 285,700 71,468.9 67,556
Jaffna 9,940.5 32,316.6 42,257.1 1,189.1 129.6 93.2 159,309 57,940 215,688 8,536.3 36,995
Mannar 1,053.8 20,804.6 21,858.4 567.6 243.4 26.0 30,118 21,576 34,556 2,249.5 5.103
Vavuniya 1,343.8 32,784.9 34,128.7 273.3 172.3 24.8 27,448 38,403 22,661 1,921.1 8,154
Mulativu 993.8 39,234.9 40,228.7 3,252.0 1,682.4 586.4 44,334 42,550 10,774 6,562.3 5,766
Kilinochchi 838.7 38,020.2 38,858.9 2,292.1 1,140.3 221.5 84,547 63,915 10,617 6,084.3 3,406
Galle 11,312.1 167,538.9 178,851.0 5,834.4 589.9 536.1 697,254 362,139 284,461 28,834.1 202,228
Matara 8,354.9 156,923.8 165,278.7 9,294.0 992.5 1,030.6 724,481 431,257 202,297 32,906.1 143,538
Hambanthota 4,919.5 202,289.5 207,209.0 23,002.1 3,132.9 3,063.1 688,782 523,374 105,009 48,087.7 62,947
Batticaloa 9,585.3 74,570.2 84,155.5 1,024.4 282.5 131.1 71,186 52,920 286,667 8,153.2 37,359
Ampara 8,118.4 171,238.9 179,357.3 740.8 199.6 53.0 227,898 223,663 235,704 12,398.4 70,739
Trincomalee 4,705.0 50,551.0 55,256.0 431.4 143.2 36.6 100,993 77,398 99,679 5,209.4 20,182
Kandy 13,375.3 151,855.7 165,231.0 3,044.9 257.7 293.9 502,196 213,610 156,325 17,847.1 65,794
Matale 3,454.4 122,539.0 125,993.4 7,953.8 1,323.3 351.6 396,913 230,248 49,361 20,552.5 28,875
Nuwara Eliya 2,106.5 60,280.5 62,387.0 409.5 41.9 19.0 60,996 50,001 15,051 2,554.0 4,183
Anuradapura 4,491.2 364,165.7 368,656.9 6,388.3 2,621.2 663.5 668,149 761,114 83,809 34,227.3 101,335
Polonnaruwa 2,237.9 163,288.2 165,526.1 383.6 217.8 47.6 418,366 355,464 52,232 14,369.2 58,815
Rathnapura 8,498.9 228,656.9 237,155.8 12,386.3 2,306.7 801.0 722,970 486,907 171,278 37,712.6 113,889
Kegalle 12,415.2 148,951.5 161,366.7 14,326.5 1,243.5 1,538.3 712,337 262,579 247,294 35,940.7 111,174
Gampaha 31,648.1 139,528.6 171,176.7 50,182.8 3,147.60 53,330.4 1,155,829 331,855 802,442 91,499.0 326,784
Colombo 15,397.8 43,563.5 58,961.3 5,495.2 896.8 418.8 254,351 74,430 305,164 16,958.8 218,211
Kaluthara 15,335.7 141,647.7 156,983.4 6,164.6 1,110.2 630.8 547,033 242,946 357,197 26,394.5 229,518
Total 202,116.4 3,625,039.8 3,827,156.2 384,181.2 47,490.3 83,460.7 10,871,820 6,728,824 4,464,475 799,443.6 2,144,948.10
Source: Sri Lanka Census of Agriculture, Department of Census and Statistics, 2002
13
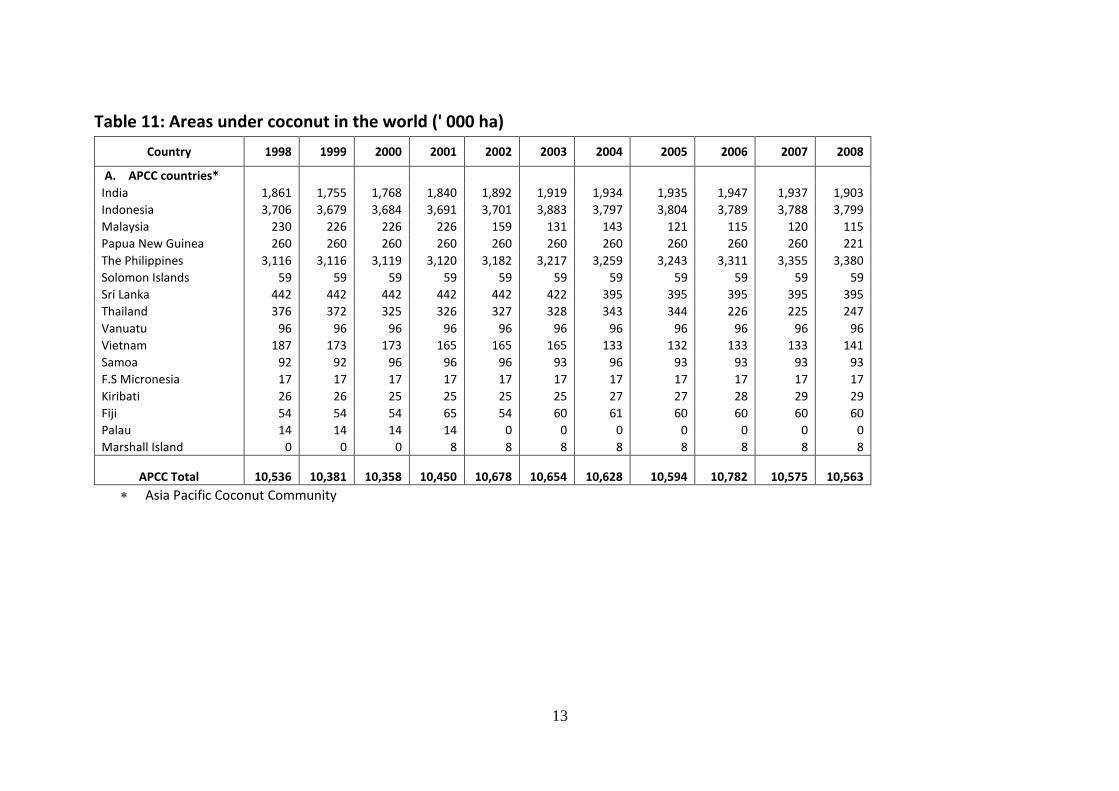
Table 11: Areas under coconut in the world (' 000 ha)
Country 1998 1999 2000 2001 2002 2003 2004 2005 2006 2007 2008
A. APCC countries* India 1,861 1,755 1,768 1,840 1,892 1,919 1,934 1,935 1,947 1,937 1,903
Indonesia 3,706 3,679 3,684 3,691 3,701 3,883 3,797 3,804 3,789 3,788 3,799
Malaysia 230 226 226 226 159 131 143 121 115 120 115
Papua New Guinea 260 260 260 260 260 260 260 260 260 260 221
The Philippines 3,116 3,116 3,119 3,120 3,182 3,217 3,259 3,243 3,311 3,355 3,380
Solomon Islands 59 59 59 59 59 59 59 59 59 59 59
Sri Lanka 442 442 442 442 442 422 395 395 395 395 395
Thailand 376 372 325 326 327 328 343 344 226 225 247
Vanuatu 96 96 96 96 96 96 96 96 96 96 96
Vietnam 187 173 173 165 165 165 133 132 133 133 141
Samoa 92 92 96 96 96 93 96 93 93 93 93
F.S Micronesia 17 17 17 17 17 17 17 17 17 17 17
Kiribati 26 26 25 25 25 25 27 27 28 29 29
Fiji 54 54 54 65 54 60 61 60 60 60 60
Palau 14 14 14 14 0 0 0 0 0 0 0
Marshall Island 0 0 0 8 8 8 8 8 8 8 8
APCC Total 10,536 10,381 10,358 10,450 10,678 10,654 10,628 10,594 10,782 10,575 10,563
Asia Pacific Coconut Community
14
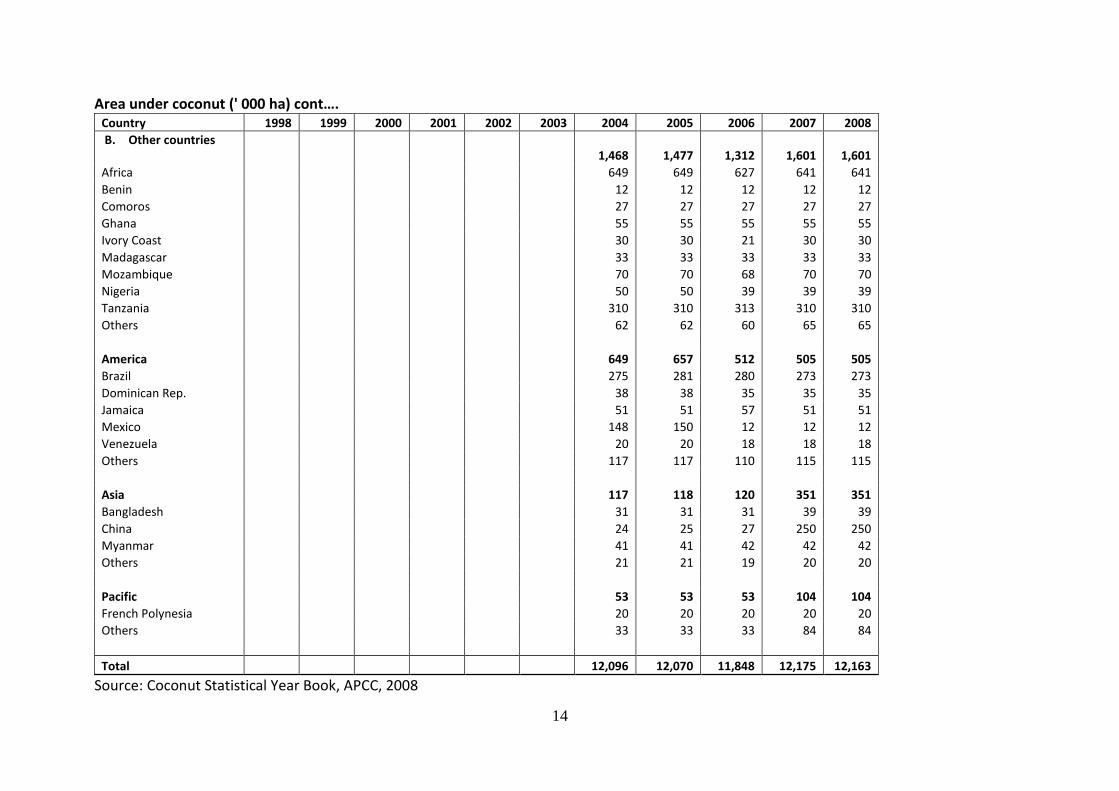
Area under coconut (' 000 ha) cont…. Country 1998 1999 2000 2001 2002 2003 2004 2005 2006 2007 2008
B. Other countries
1,468 1,477 1,312 1,601 1,601
Africa
649 649 627 641 641
Benin
12 12 12 12 12
Comoros
27 27 27 27 27
Ghana
55 55 55 55 55
Ivory Coast
30 30 21 30 30
Madagascar
33 33 33 33 33
Mozambique
70 70 68 70 70
Nigeria
50 50 39 39 39
Tanzania
310 310 313 310 310
Others
62 62 60 65 65
America
649 657 512 505 505
Brazil
275 281 280 273 273
Dominican Rep.
38 38 35 35 35
Jamaica
51 51 57 51 51
Mexico
148 150 12 12 12
Venezuela
20 20 18 18 18
Others
117 117 110 115 115
Asia
117 118 120 351 351
Bangladesh
31 31 31 39 39
China
24 25 27 250 250
Myanmar
41 41 42 42 42
Others
21 21 19 20 20
Pacific
53 53 53 104 104
French Polynesia
20 20 20 20 20
Others
33 33 33 84 84
Total
12,096 12,070 11,848 12,175 12,163
Source: Coconut Statistical Year Book, APCC, 2008

15
2.2 Coconut production and consumption statistics
Table 12: Coconut production and domestic consumption (2005-2010)
Year Coconut
production (mln. nuts)
Domestic consumption
(mln. nuts)
2005 2,515 2,047
2006 2,785 2,222
2007 2,869 2,451
2008 2,909 2,437
2009 2,853 2,269
2010 2,317 Source: Sri Lanka Coconut Statistics, CDA, 2009, Biometry Division, CRI, 2011
Table 13: National monthly coconut production data - 2009-2010 (mln. nuts)
Month 2009 2010
January 194 204
February 271 207
March 211 165
April 299 323
May 217 254
June 367 218
July 160 182
August 346 181
September 158 154
October 255 180
November 110 105
December 265 144
Total 2,853 2,317
Biometry Division, CRI (2011)
Table 14: National coconut production ( actual and estimated production)
Bimonthly intervals
Actual nut production
2010 mln nuts
Change compared
to 2009 mln nuts
Change compared
to 2009 %
Predicted production
for 2010 mln nuts
Change compared
to 2009 mln nuts
Change compared
to 2010 %
Jan/Feb 411 -54 -11.61 455 -44 -9.67
Mar/Apr 488 -22 - 4.31 516 -28 -5.43
May/Jun 472 -112 -19.18 559 -87 -15.56
Jul/Aug 363 -143 -28.26 463 -100 -21.59
Sep/Oct 334 -79 -19.13 416 -82 -19.71
Nov/Dec 249 -126 -33.6 382 -133 -34.82
Total 2317 -536 -18.79 2791 -474 -16.98
Biometry Division, CRI, 2011

16
Table 15: Coconut - pattern of utilization (mln. nuts)
Year Desiccated coconut Coconut oil Stock adjustment
2004 439 220 -35
2005 292 176 16
2006 352 268 31
2007 337 548 -108
2008 301 515 106
Source: Sri Lanka Coconut Statistics, CDA, 2004-2008
Table 16: Monthly per capita consumption of coconut products Item Unit Quantity
Coconut oil ml. 318.26 Vegetable oil ml. 15.84
Coconuts no. 8.18 Coconut milk powder grams 0.56 Other processed coconut products grams 0.14 Source : Consumer Finance Survey, 2006-2007, Dept. of Census and Statistics, 2011
Table 17: Yearly per capita consumption by districts
District
2006 2007 2008
Consumption rate/person/year
Consumption rate/person/year
Consumption rate/person/year
Number of Number of Number of Number of Number of Number of
Nuts oil bottles Nuts oil bottles Nuts oil bottles
Anuradhapura 111.6 7.3 103.11 8.22 89.87 7.79
Badulla 62.1 8.2 57.25 9.71 58.65 9.40
Colombo 90.0 6.9 75.82 7.93 83.09 6.60
Galle 104.4 6.8 99.85 6.74 87.80 6.01
Gampaha 81.9 6.6 102.14 6.72 88.35 69.56
Hambantota 126.9 6.7 128.51 5.07 115.58 4.40
Kalutara 101.7 7.7 99.49 6.72 96.43 6.17
Kandy 98.1 7.1 82.65 7.39 73.77 6.84
Kegalle 131.4 6.1 111.06 6.56 94.14 5.54
Kurunegala 151.2 6.5 143.59 6.11 134.98 5.48
Matale 101.7 8.1 101.45 7.71 89.52 6.95
Matara 106.2 6.7 105.32 5.74 93.86 5.08
Moneragala 101.7 8.6 96.55 8.22 85.36 7.33
Nuwara Eliya 64.8 7.5 66.64 9.35 59.09 8.00
Polonnaruwa 103.5 5.7 101.17 7.9 104.61 6.57
Puttalam 124.2 8.5 125.72 7.72 102.57 6.64
Ratnapura 120.6 7.6 112.87 7.44 96.99 5.93
National Mean SE 104.8 ± 3.5 7.2 ± 0.2 101 ± 4.75 7.3 ± 0.26 92.65 ± 4.56 6.46 ± 0.28
Source: Biometry Division, CRI, 2008
17
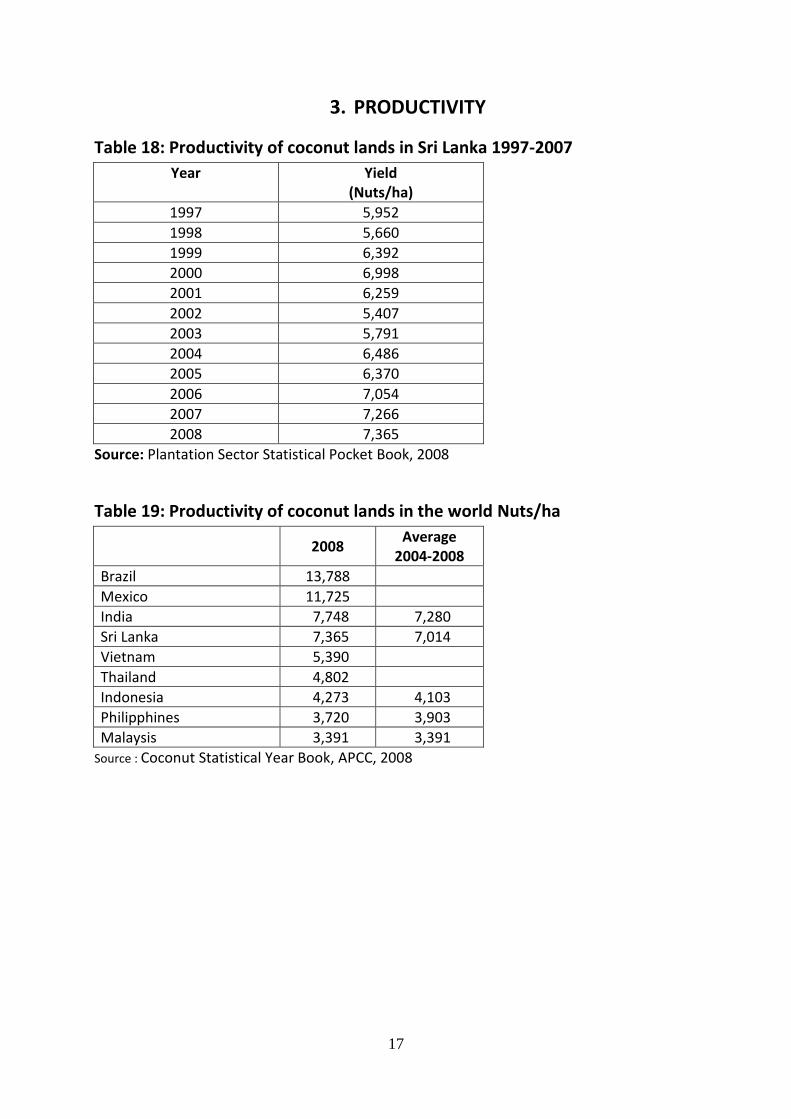
3. PRODUCTIVITY
Table 18: Productivity of coconut lands in Sri Lanka 1997-2007
Year Yield (Nuts/ha)
1997 5,952
1998 5,660
1999 6,392
2000 6,998
2001 6,259
2002 5,407
2003 5,791
2004 6,486
2005 6,370
2006 7,054
2007 7,266
2008 7,365
Source: Plantation Sector Statistical Pocket Book, 2008
Table 19: Productivity of coconut lands in the world Nuts/ha
2008
Average 2004-2008
Brazil 13,788 Mexico 11,725 India 7,748 7,280
Sri Lanka 7,365 7,014
Vietnam 5,390 Thailand 4,802 Indonesia 4,273 4,103
Philipphines 3,720 3,903
Malaysis 3,391 3,391
Source : Coconut Statistical Year Book, APCC, 2008

18
4. COCONUT PRODUCTS
Table 20: Fresh nut prices (wholesale)
Month Rs/1000nuts % change
2008-2009 % change
2009-2010 2005 2006 2007 2008 2009 2010
January 15,220 11,625 12,950 25,000 15,985 22,000 -36.1 37.6
February 16,375 11,188 13,000 28,775 15,640 23,500 -45.6 50.3
March 15,845 11,000 13,100 30,315 14,098 19,750 -53.5 40.1
April 13,970 10,333 12,960 27,430 12,178 19,250 -55.6 58.1
May 13,450 9,775 13,240 23,640 15,395 19,250 -34.9 25.0
June 13,230 9,000 14,120 22,395 15,762 19,619 -29.6 24.5
July 10,560 8,813 15,490 19,990 14,651 19,202 -26.7 31.1
August 10,310 8,555 16,445 18,570 15,619 20,155 -15.9 29.4
September 10,750 9,800 16,785 19,480 17,125 23,253 -12.1 35.8
October 10,500 11,200 18,125 18,080 18,464 27,938 2.1 51.3
November 11,372 12,100 21,525 15,890 20,273 39,150 27.6 99.3
December 12,308 12,440 20,460 15,735 20,191 45,170 28.3 123.7
Average 12,824 10,486 15,683 22,108 16,282 24,853 -21.0 50.5
Source : Sri Lanka Coconut Statistics, CDA, 2005-2010
Table 21: Fresh nut prices (retail) Month
Rs/nut % change 2008-2009
% change 2009-2010 2005 2006 2007 2008 2009 2010
January 20.80 18.00 18.50 28.90 22.30 29.74 -22.8 33.4
February 20.71 16.00 18.50 34.50 22.30 28.76 -35.4 29.0
March 19.17 15.50 18.88 34.50 25.80 28.81 -25.2 11.7
April 18.50 16.25 19.25 32.40 22.95 28.57 -29.2 24.5
May 16.75 15.00 18.25 27.75 22.69 28.99 -18.2 27.8
June 17.00 15.50 19.28 25.50 22.56 28.10 -11.5 24.6
July 14.50 14.00 17.38 23.70 22.90 28.63 -3.4 25.0
August 15.34 14.25 18.03 24.00 22.82 32.96 -4.92 44.4
September 15.50 15.25 18.93 24.60 24.99 35.72 1.59 42.9
October 16.33 16.50 23.00 26.40 25.16 38.77 -4.70 54.1
November 17.63 17.75 25.25 25.10 24.88 39.15 -0.88 57.4
December 17.75 18.00 25.15 23.50 25.50 45.17 8.51 77.1
Average 17.49 16.00 20.03 27.57 23.74 32.78 -12.17 37.6
Source : Sri Lanka Coconut Statistics, CDA, 2005-2010
19
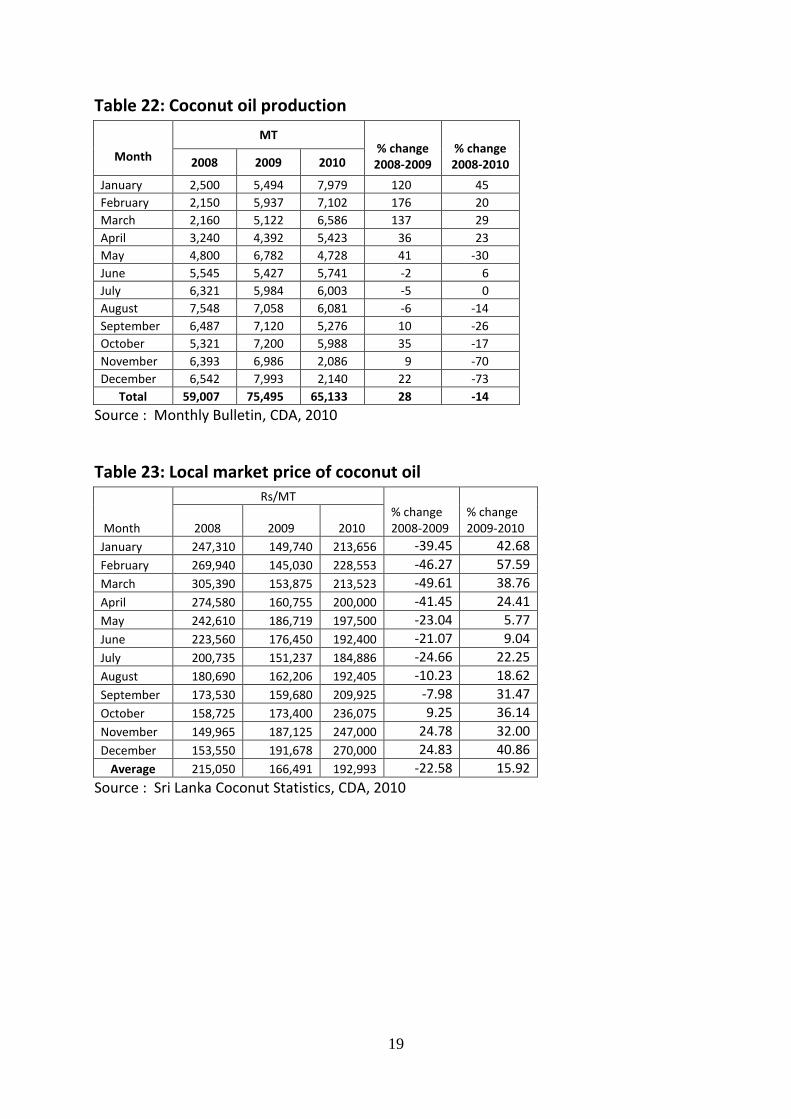
Table 22: Coconut oil production
Month
MT % change 2008-2009
% change 2008-2010 2008 2009 2010
January 2,500 5,494 7,979 120 45
February 2,150 5,937 7,102 176 20
March 2,160 5,122 6,586 137 29
April 3,240 4,392 5,423 36 23
May 4,800 6,782 4,728 41 -30
June 5,545 5,427 5,741 -2 6
July 6,321 5,984 6,003 -5 0
August 7,548 7,058 6,081 -6 -14
September 6,487 7,120 5,276 10 -26
October 5,321 7,200 5,988 35 -17
November 6,393 6,986 2,086 9 -70
December 6,542 7,993 2,140 22 -73
Total 59,007 75,495 65,133 28 -14
Source : Monthly Bulletin, CDA, 2010
Table 23: Local market price of coconut oil
Month
Rs/MT % change 2008-2009
% change 2009-2010 2008 2009 2010
January 247,310 149,740 213,656 -39.45 42.68
February 269,940 145,030 228,553 -46.27 57.59
March 305,390 153,875 213,523 -49.61 38.76
April 274,580 160,755 200,000 -41.45 24.41
May 242,610 186,719 197,500 -23.04 5.77
June 223,560 176,450 192,400 -21.07 9.04
July 200,735 151,237 184,886 -24.66 22.25
August 180,690 162,206 192,405 -10.23 18.62
September 173,530 159,680 209,925 -7.98 31.47
October 158,725 173,400 236,075 9.25 36.14
November 149,965 187,125 247,000 24.78 32.00
December 153,550 191,678 270,000 24.83 40.86
Average 215,050 166,491 192,993 -22.58 15.92
Source : Sri Lanka Coconut Statistics, CDA, 2010
20
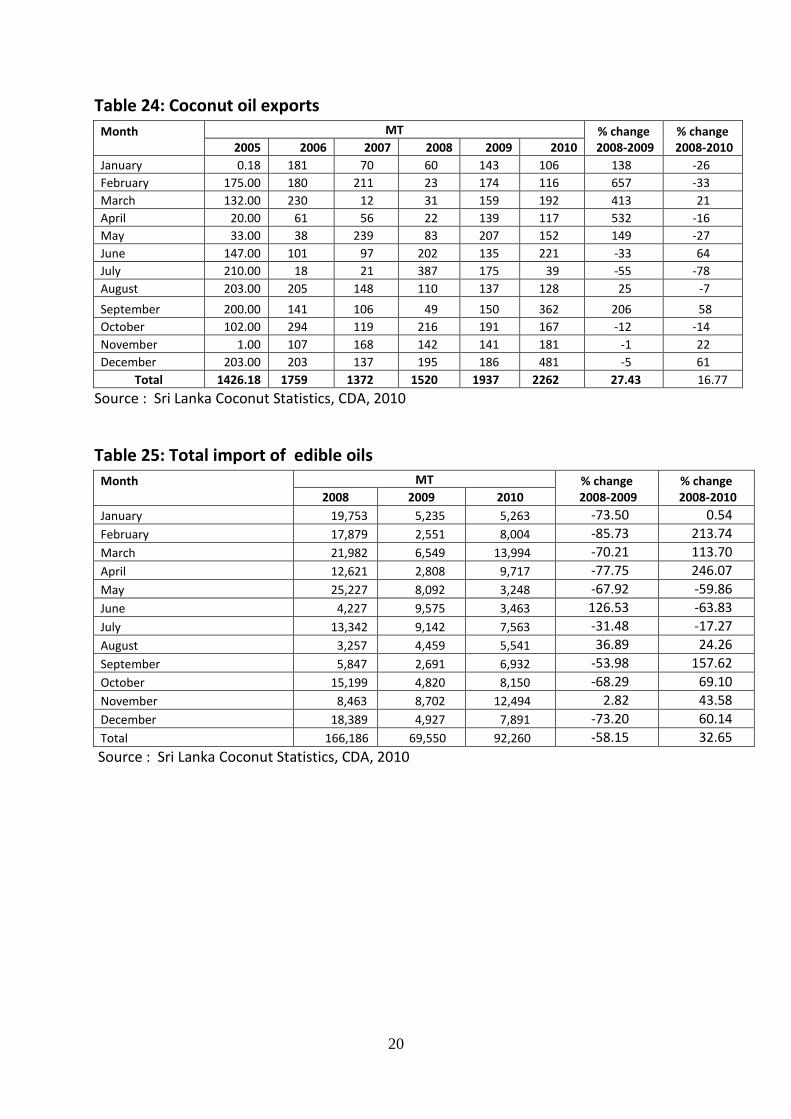
Table 24: Coconut oil exports
Month
MT % change 2008-2009
% change 2008-2010 2005 2006 2007 2008 2009 2010
January 0.18 181 70 60 143 106 138 -26
February 175.00 180 211 23 174 116 657 -33
March 132.00 230 12 31 159 192 413 21
April 20.00 61 56 22 139 117 532 -16
May 33.00 38 239 83 207 152 149 -27
June 147.00 101 97 202 135 221 -33 64
July 210.00 18 21 387 175 39 -55 -78
August 203.00 205 148 110 137 128 25 -7
September 200.00 141 106 49 150 362 206 58
October 102.00 294 119 216 191 167 -12 -14
November 1.00 107 168 142 141 181 -1 22
December 203.00 203 137 195 186 481 -5 61
Total 1426.18 1759 1372 1520 1937 2262 27.43 16.77
Source : Sri Lanka Coconut Statistics, CDA, 2010
Table 25: Total import of edible oils
Month
MT % change 2008-2009
% change 2008-2010 2008 2009 2010
January 19,753 5,235 5,263 -73.50 0.54
February 17,879 2,551 8,004 -85.73 213.74
March 21,982 6,549 13,994 -70.21 113.70
April 12,621 2,808 9,717 -77.75 246.07
May 25,227 8,092 3,248 -67.92 -59.86
June 4,227 9,575 3,463 126.53 -63.83
July 13,342 9,142 7,563 -31.48 -17.27
August 3,257 4,459 5,541 36.89 24.26
September 5,847 2,691 6,932 -53.98 157.62
October 15,199 4,820 8,150 -68.29 69.10
November 8,463 8,702 12,494 2.82 43.58
December 18,389 4,927 7,891 -73.20 60.14
Total 166,186 69,550 92,260 -58.15 32.65
Source : Sri Lanka Coconut Statistics, CDA, 2010
21
Table 26: Volume and value of imported edible oils – 2009
Month
Coconut oil Palm Stearin Palm Olein Crude Oil
Volume MT
Value Rs. Mill
Volume MT
Value Rs. Mill
Volume MT
Value Rs. Mill
Volume MT
Value Rs. Mill
January 82.06 8.29 87.57 8.18 3527.00 260.69 - -
February 18.34 2.18 94.89 7.76 1207.46 92.45 - -
March 60.11 6.19 636.00 40.28 2835.75 220.95 - -
April 0.02 3.73 149.90 13.38 506.30 42.21 - -
May 61.87 7.21 88.86 9.63 2096.51 197.53 4499.74 307.99
June 106.29 10.74 216.43 24.62 3192.12 309.82 4516.83 307.99
July 101.23 11.12 140.90 14.85 2412.86 229.00 4999.85 372.56
August 123.48 12.62 192.25 20.75 2816.45 251.72 - -
September 58.63 6.30 140.44 15.72 1016.21 99.74 105.00 6.12
October 42.96 4.28 615.29 47.51 3076.26 262.08 - -
November 43.10 1.14 226.32 25.10 1106.01 103.36 6150.04 504.63
December 104.36 10.30 232.72 24.54 2290.88 213.29 478.16 26.23
Total 802.45 84.10 2821.57 252.32 26083.81 2282.84 20749.62 1525.52
Source : Monthly Bulletin, CDA, 2009
22
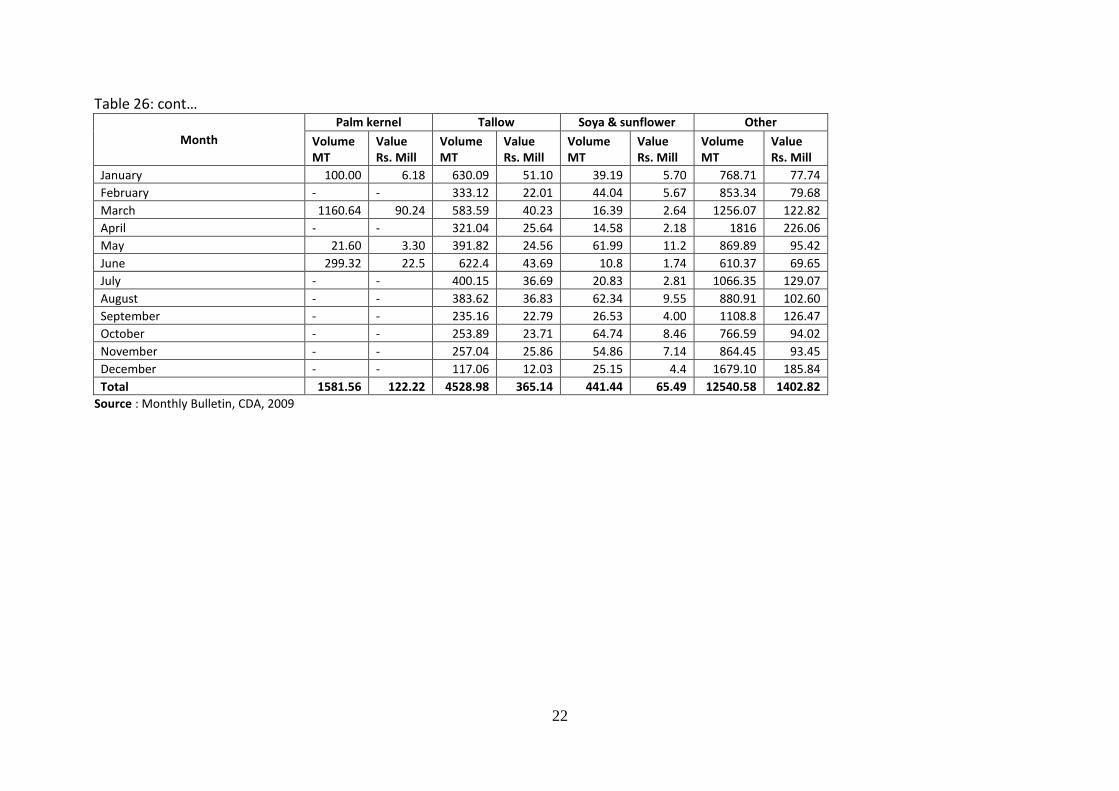
Table 26: cont…
Month
Palm kernel Tallow Soya & sunflower Other
Volume MT
Value Rs. Mill
Volume MT
Value Rs. Mill
Volume MT
Value Rs. Mill
Volume MT
Value Rs. Mill
January 100.00 6.18 630.09 51.10 39.19 5.70 768.71 77.74
February - - 333.12 22.01 44.04 5.67 853.34 79.68
March 1160.64 90.24 583.59 40.23 16.39 2.64 1256.07 122.82
April - - 321.04 25.64 14.58 2.18 1816 226.06
May 21.60 3.30 391.82 24.56 61.99 11.2 869.89 95.42
June 299.32 22.5 622.4 43.69 10.8 1.74 610.37 69.65
July - - 400.15 36.69 20.83 2.81 1066.35 129.07
August - - 383.62 36.83 62.34 9.55 880.91 102.60
September - - 235.16 22.79 26.53 4.00 1108.8 126.47
October - - 253.89 23.71 64.74 8.46 766.59 94.02
November - - 257.04 25.86 54.86 7.14 864.45 93.45
December - - 117.06 12.03 25.15 4.4 1679.10 185.84
Total 1581.56 122.22 4528.98 365.14 441.44 65.49 12540.58 1402.82
Source : Monthly Bulletin, CDA, 2009
23
Table 27: Volume and value of imported edible oils – year 2010
Month
Coconut oil Palm Stearin Palm Olein Crude Oil
Volume MT
Value Rs. Mill
Volume MT
Value Rs. Mill
Volume MT
Value Rs. Mill
Volume MT
Value Rs. Mill
January 83 8.76 424 46.48 3313 311.63 0 0
February 2 0.05 248 26.21 2857 280.42 3500 298.76
March 709 83.88 944 99.22 9556 922.14 1250 116.27
April 55 6.9 125 19.91 4583 442.56 3550 347.45
May 1 0.06 265 28.8 1555 160.23 0 0
June 68 9.86 338 38.71 1663 172.81 0 0
July 21 2.69 627 69.99 5782 558.99 0 0
August 81 10.70 509 61.74 3028 312.21 0 0
September 113 16.75 770 80.09 5046 554.71 0 0
October 18 3.28 274 34.6 3073 344.34 3498.67 335.92
November 21 3.05 457 59.66 7356 861.39 3500 370.81
December 322 58.79 518 75.91 5706 662.26 332 36.50
Total 2080 275.25 5500 641.32 53519 5583.69 15299 1469.21
Source : Monthly Bulletin, CDA, 2010
24
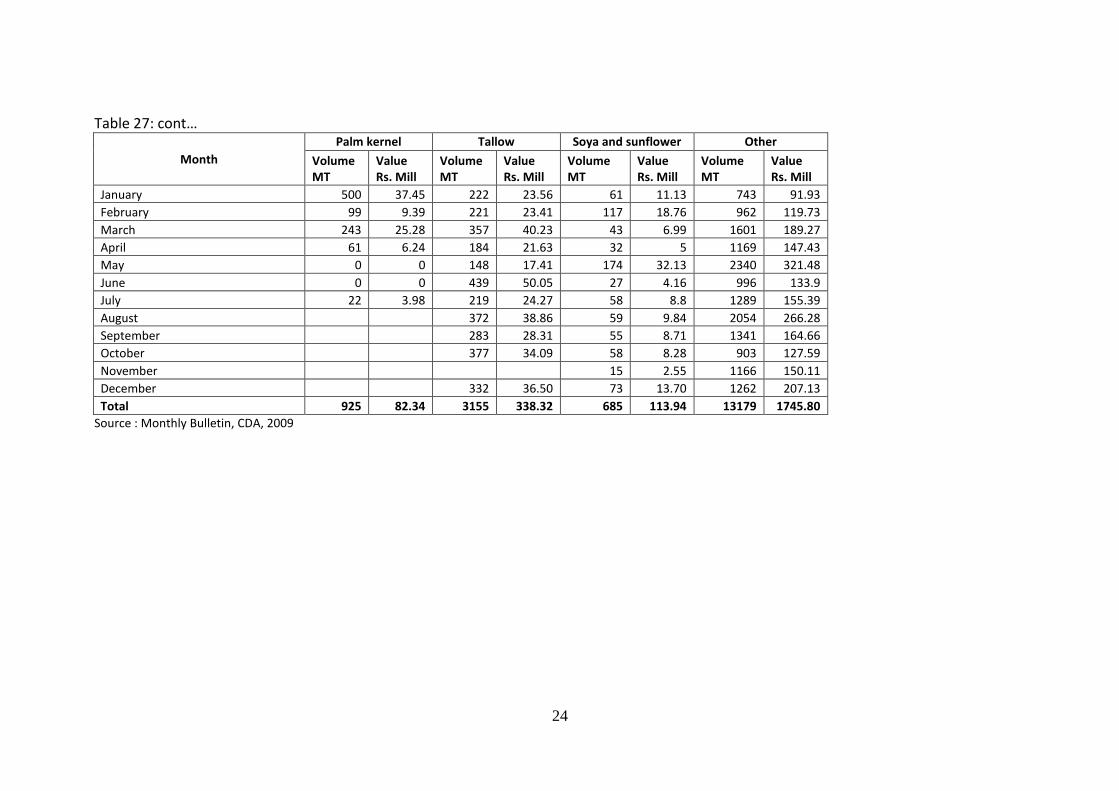
Table 27: cont…
Month
Palm kernel Tallow Soya and sunflower Other
Volume MT
Value Rs. Mill
Volume MT
Value Rs. Mill
Volume MT
Value Rs. Mill
Volume MT
Value Rs. Mill
January 500 37.45 222 23.56 61 11.13 743 91.93
February 99 9.39 221 23.41 117 18.76 962 119.73
March 243 25.28 357 40.23 43 6.99 1601 189.27
April 61 6.24 184 21.63 32 5 1169 147.43
May 0 0 148 17.41 174 32.13 2340 321.48
June 0 0 439 50.05 27 4.16 996 133.9
July 22 3.98 219 24.27 58 8.8 1289 155.39
August 372 38.86 59 9.84 2054 266.28
September 283 28.31 55 8.71 1341 164.66
October 377 34.09 58 8.28 903 127.59
November 15 2.55 1166 150.11
December 332 36.50 73 13.70 1262 207.13
Total 925 82.34 3155 338.32 685 113.94 13179 1745.80
Source : Monthly Bulletin, CDA, 2009
25
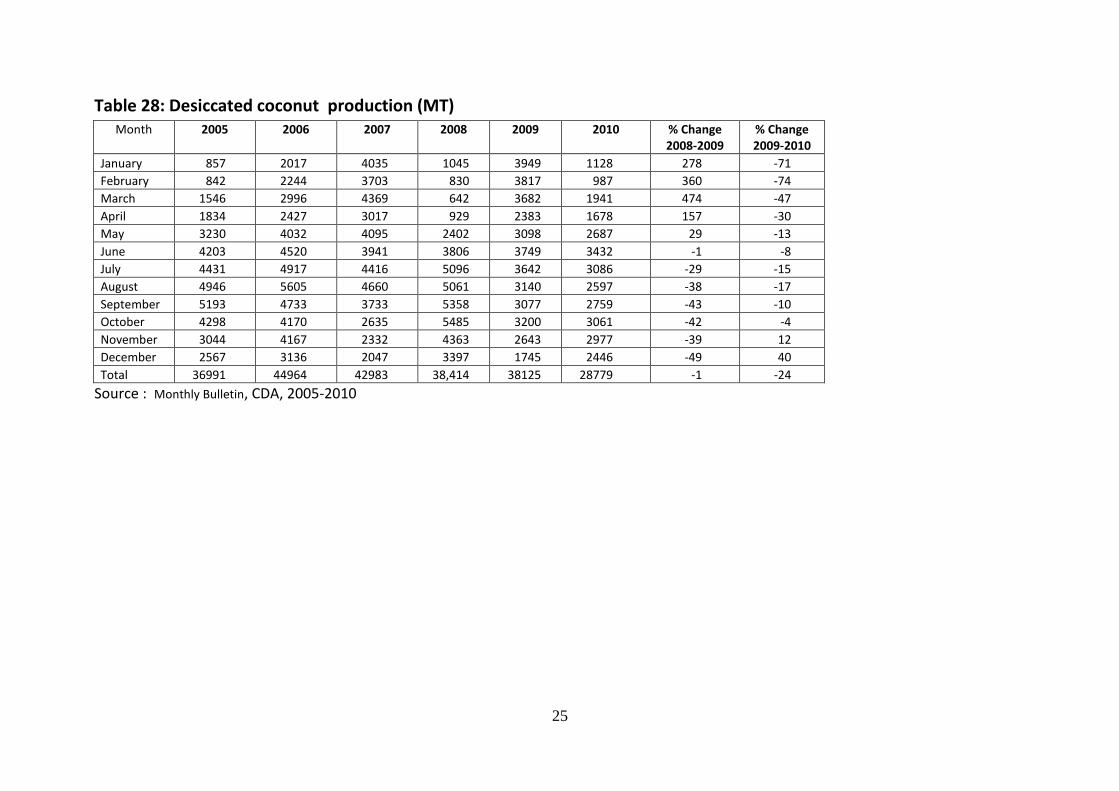
Table 28: Desiccated coconut production (MT) Month 2005 2006 2007 2008 2009 2010 % Change
2008-2009 % Change 2009-2010
January 857 2017 4035 1045 3949 1128 278 -71
February 842 2244 3703 830 3817 987 360 -74
March 1546 2996 4369 642 3682 1941 474 -47
April 1834 2427 3017 929 2383 1678 157 -30
May 3230 4032 4095 2402 3098 2687 29 -13
June 4203 4520 3941 3806 3749 3432 -1 -8
July 4431 4917 4416 5096 3642 3086 -29 -15
August 4946 5605 4660 5061 3140 2597 -38 -17
September 5193 4733 3733 5358 3077 2759 -43 -10
October 4298 4170 2635 5485 3200 3061 -42 -4
November 3044 4167 2332 4363 2643 2977 -39 12
December 2567 3136 2047 3397 1745 2446 -49 40
Total 36991 44964 42983 38,414 38125 28779 -1 -24
Source : Monthly Bulletin, CDA, 2005-2010

26
Table 29: Desiccated coconut exports (MT) Month MT %
change 2008-2009
% change 2009-2010 2005 2006 2007 2008 2009 2010
January 908 2123 2715 1266 3699 1315 192 -64
February 880 2372 4581 873 2969 1173 240 -60
March 1442 2783 3810 533 4527 1189 749 -74
April 944 1848 3451 816 2276 1620 179 -29
May 2859 3055 3717 1046 3622 2867 246 -21
June 2928 3689 3729 2791 3132 3281 12 5
July 3522 4540 4784 5423 3845 2701 -29 -30
August 4759 5421 5687 4638 3428 2654 -26 -23
September 5153 4242 4408 5272 2794 2758 -47 -1
October 4951 4354 3115 5319 3198 3095 -40 -3
November 2570 3407 2802 4290 2661 3103 -38 14
December 2461 3801 4494 3997 2500 2592 -37 3
Total 33377 41635 45393 36,264 38,651 28348 7 -36
Source : Sri Lanka Coconut Statistics, CDA, 2010
Table 30: Local market price of desiccated coconut
Month
Rs/kg % change 2008-2009
% change 2009-2010 2005 2006 2007 2008 2009 2010
January 115.00 83.00 112.50 167.75 123.20 147.32 -26.6 19.57
February 123.00 85.00 114.00 198.00 121.15 147.79 -38.8 21.98
March 108.00 83.00 113.25 200.30 108.65 144.55 -45.8 33.04
April 99.00 83.00 112.00 192.00 110.58 153.00 -42.4 38.36
May 100.00 80.00 119.00 194.40 123.97 155.00 -36.2 25.03
June 96.00 81.00 124.50 212.80 124.30 152.98 -41.6 23.07
July 84.00 83.00 127.50 209.90 111.64 144.50 -46.8 29.43
August 85.00 85.00 132.00 170.50 117.91 152.75 -30.84 29.54
September 85.00 86.00 126.50 175.50 118.25 175.00 -32.62 47.99
October 83.00 90.00 139.38 154.00 134.00 205.00 -12.99 52.98
November 83.50 99.00 144.50 126.00 143.05 222.00 13.53 55.24
December 84.00 107.00 147.00 115.50 136.09 293.00 17.83 115.44
Average 95.54 87.08 126.01 176.89 122.73 174.41 -30.61 42.10
Source : Sri Lanka Coconut Statistics, CDA, 2010
27
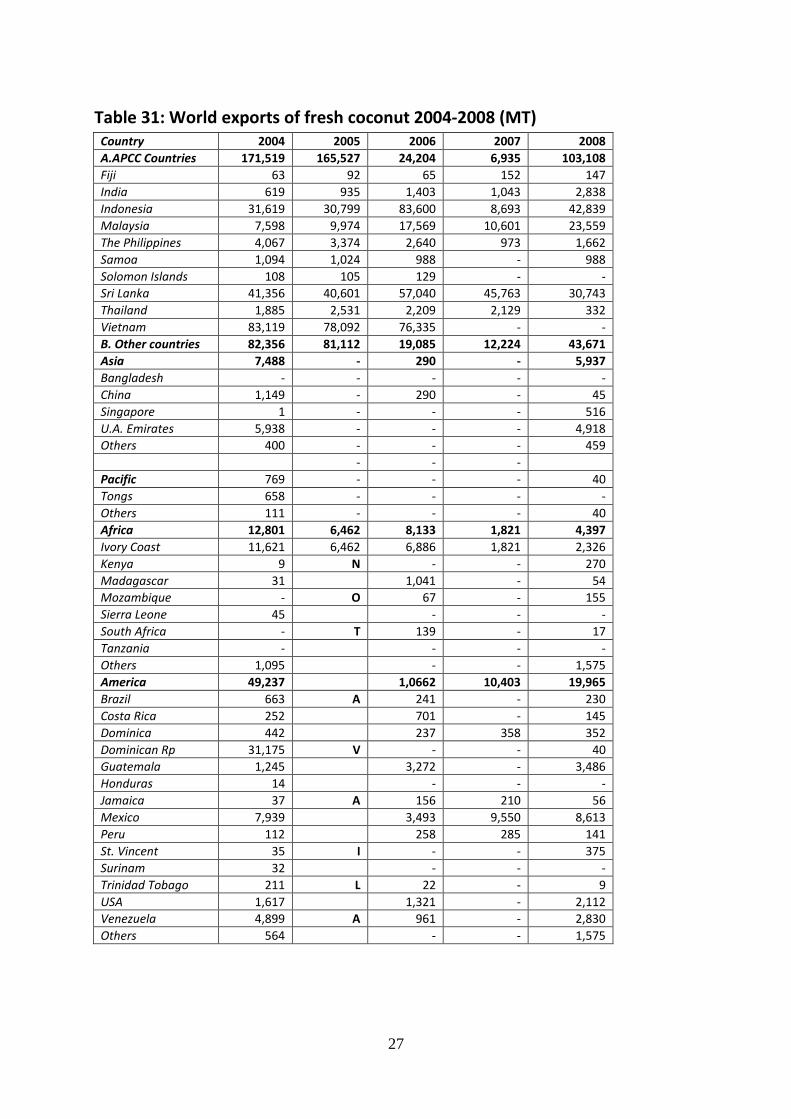
Table 31: World exports of fresh coconut 2004-2008 (MT) Country 2004 2005 2006 2007 2008
A.APCC Countries 171,519 165,527 24,204 6,935 103,108
Fiji 63 92 65 152 147
India 619 935 1,403 1,043 2,838
Indonesia 31,619 30,799 83,600 8,693 42,839
Malaysia 7,598 9,974 17,569 10,601 23,559
The Philippines 4,067 3,374 2,640 973 1,662
Samoa 1,094 1,024 988 - 988
Solomon Islands 108 105 129 - -
Sri Lanka 41,356 40,601 57,040 45,763 30,743
Thailand 1,885 2,531 2,209 2,129 332
Vietnam 83,119 78,092 76,335 - -
B. Other countries 82,356 81,112 19,085 12,224 43,671
Asia 7,488 - 290 - 5,937
Bangladesh - - - - -
China 1,149 - 290 - 45
Singapore 1 - - - 516
U.A. Emirates 5,938 - - - 4,918
Others 400 - - - 459
- - - Pacific 769 - - - 40
Tongs 658 - - - -
Others 111 - - - 40
Africa 12,801 6,462 8,133 1,821 4,397
Ivory Coast 11,621 6,462 6,886 1,821 2,326
Kenya 9 N - - 270
Madagascar 31
1,041 - 54
Mozambique - O 67 - 155
Sierra Leone 45
- - -
South Africa - T 139 - 17
Tanzania -
- - -
Others 1,095
- - 1,575
America 49,237
1,0662 10,403 19,965
Brazil 663 A 241 - 230
Costa Rica 252
701 - 145
Dominica 442
237 358 352
Dominican Rp 31,175 V - - 40
Guatemala 1,245
3,272 - 3,486
Honduras 14
- - -
Jamaica 37 A 156 210 56
Mexico 7,939
3,493 9,550 8,613
Peru 112
258 285 141
St. Vincent 35 I - - 375
Surinam 32
- - -
Trinidad Tobago 211 L 22 - 9
USA 1,617
1,321 - 2,112
Venezuela 4,899 A 961 - 2,830
Others 564
- - 1,575

28
Country 2004 2005 2006 2007 2008
Europe 12,061 B - - 13,332
Belgium Lux 733
- - 577
Czech Rep. 17
- - 490
France 681 L - - 734
Germany 413
- - 1,090
Italy 20
- - 42
Netherland 8,745
- - 8,729
Spain 304
- - -
United Kingdom 638 E - - 558
Others 510
- - 1,111
Total 253,875 248,639 261,089 81,579 146,779
Source : Coconut Statistical Year Book, APCC, 2008
Table 32: World exports of coconut oil, 2004-2008 ( MT)
Country 2004 2005 2006 2007 2008
A.APCC Countries 1,626,284 2,157,446 1,816,442 2,193,966 1,940,351
Fiji 3,504 5,189 4,676 5,503 6,152
India 6,014 5,954 5,378 3,677 6,817
Indonesia 443,762 745,742 519,556 793,923 649,255
Malaysia 151,566 180,717 16,570 486,143 297,007
Marshall Island 1,302 5,012 - 5,608 5,600
Papua New Guinea 5,165 52,029 39,272 56,100 64,525
The Philippines 959,151 1,151,639 1,070,269 886,561 874,626
Samoa 600 1,067 39 39 32
Solomon Islands - 200 2,500 741 505
Sri Lanka 2,095 1,426 1,759 1,372 1,520
Thailand 3,635 2,671 493 4,399 48,312
Vanuatu - - 5,400 2,400 11,500
Vietnam 3,000 4,000 1,400 1,500 150
B.Other countries 314,700 296,100 290,375 303,300 319,200
Asia 11,900 1,070 7,975 8,900 10,300
China - 100 75 - -
Hong Kong 100 - - - -
Japan 200 200 - - -
Singapore 11,600 1,040 7,900 8,900 10,300
Korea - - - - -
Others - - - - -
Pacific 9,000 9,300 8,800 9,100 9,100
French Polynesia 5,400 5,700 5,300 5,600 5,500
Tongs 900 900 900 900 900
Palau - - - - -
Others 2,700 2,700 2,600 2,600 2,700
29
Country 2004 2005 2006 2007 2008 Africa 10,300 9,300 11,100 15,200 16,200
Ivory Coast 9,100 7,300 5,700 9,900 1,000
Kenya 600 600 600 500 300
Mozambique 600 1,400 4,800 4,800 5,900
Others - - - - -
America 8,600 19,300 2,230 11,600 14,400
Canada 300 700 400 200 100
Dominica - - - - -
Dominican Rp 300 300 100 - 100
USA 8,000 18,300 21,800 11,400 14,200
Others - - - - -
Europe 274,900 247,500 240,200 258,500 269,200
Austria - - - - -
Belgium Lux 13,200 9,700 4,400 4,100 2,700
Denmark 1,300 1,100 900 500 300
France 4,000 3,200 2,500 3,000 5,200
Germany 31,300 28,800 27,100 19,200 134
Italy 3,100 3,700 2,200 1,000 2,300
Netherlands 214,800 193,100 190,200 222,000 231,200
Norway - - - - -
Portugal - - - - -
Spain 3,700 4,000 6,700 360 10,500
Sweden 2,800 1,500 1,300 400 1,100
United Kingdom 500 2,200 4,600 4,400 2,200
Others 200 200 300 300 300
TOTAL 1,940,984 2,453,546 2,106,817 2,497,266 2,259,551
Source : Coconut Statistical Year Book, APCC, 2008
30
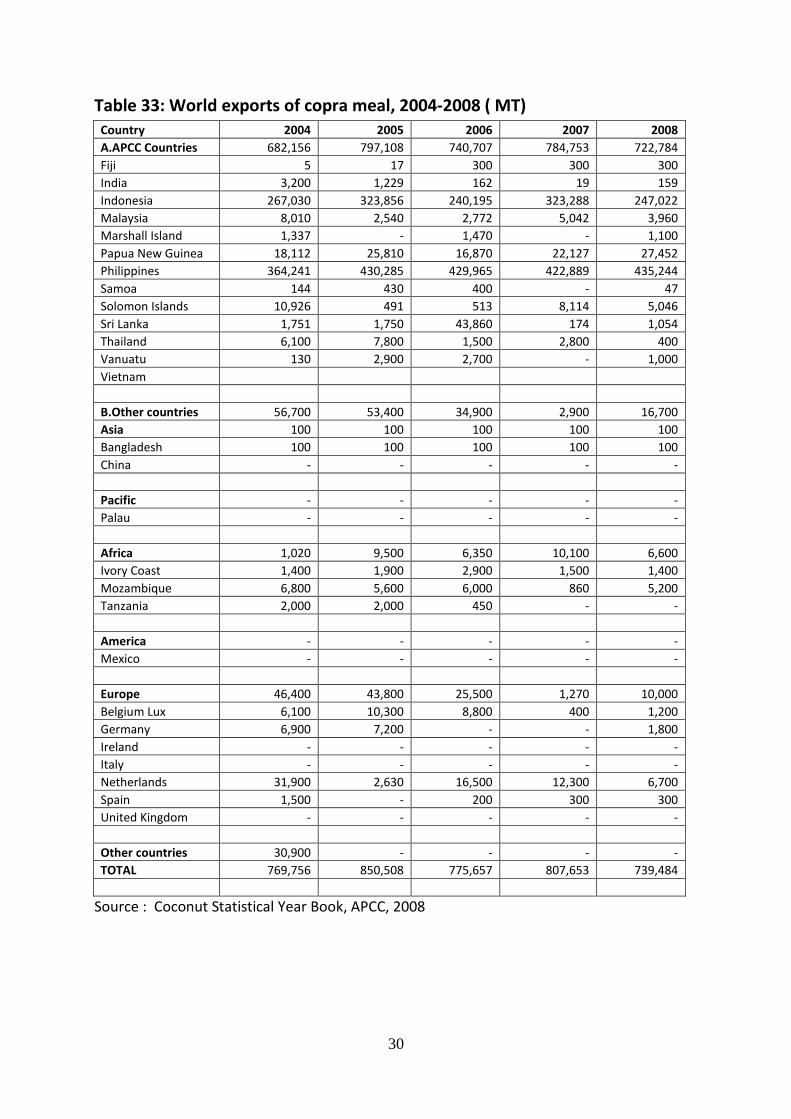
Table 33: World exports of copra meal, 2004-2008 ( MT) Country 2004 2005 2006 2007 2008
A.APCC Countries 682,156 797,108 740,707 784,753 722,784
Fiji 5 17 300 300 300
India 3,200 1,229 162 19 159
Indonesia 267,030 323,856 240,195 323,288 247,022
Malaysia 8,010 2,540 2,772 5,042 3,960
Marshall Island 1,337 - 1,470 - 1,100
Papua New Guinea 18,112 25,810 16,870 22,127 27,452
Philippines 364,241 430,285 429,965 422,889 435,244
Samoa 144 430 400 - 47
Solomon Islands 10,926 491 513 8,114 5,046
Sri Lanka 1,751 1,750 43,860 174 1,054
Thailand 6,100 7,800 1,500 2,800 400
Vanuatu 130 2,900 2,700 - 1,000
Vietnam B.Other countries 56,700 53,400 34,900 2,900 16,700
Asia 100 100 100 100 100
Bangladesh 100 100 100 100 100
China - - - - -
Pacific - - - - -
Palau - - - - -
Africa 1,020 9,500 6,350 10,100 6,600
Ivory Coast 1,400 1,900 2,900 1,500 1,400
Mozambique 6,800 5,600 6,000 860 5,200
Tanzania 2,000 2,000 450 - -
America - - - - -
Mexico - - - - -
Europe 46,400 43,800 25,500 1,270 10,000
Belgium Lux 6,100 10,300 8,800 400 1,200
Germany 6,900 7,200 - - 1,800
Ireland - - - - -
Italy - - - - -
Netherlands 31,900 2,630 16,500 12,300 6,700
Spain 1,500 - 200 300 300
United Kingdom - - - - -
Other countries 30,900 - - - -
TOTAL 769,756 850,508 775,657 807,653 739,484
Source : Coconut Statistical Year Book, APCC, 2008
31
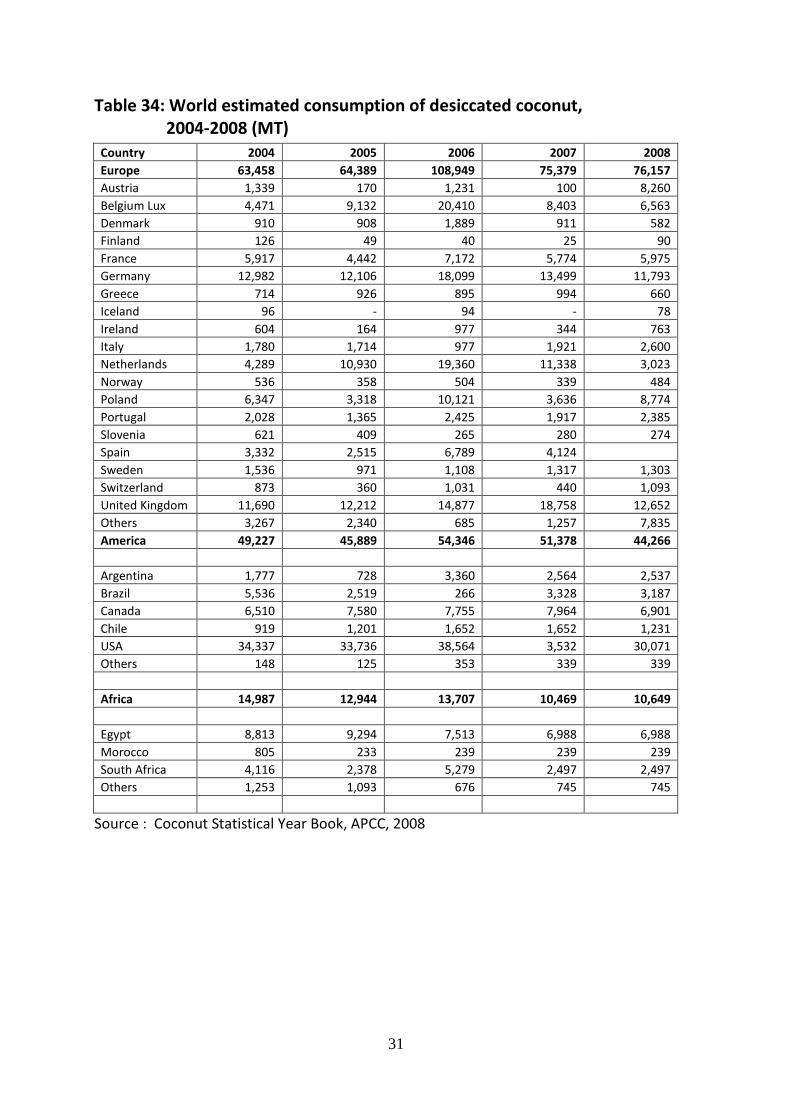
Table 34: World estimated consumption of desiccated coconut, 2004-2008 (MT)
Country 2004 2005 2006 2007 2008
Europe 63,458 64,389 108,949 75,379 76,157
Austria 1,339 170 1,231 100 8,260
Belgium Lux 4,471 9,132 20,410 8,403 6,563
Denmark 910 908 1,889 911 582
Finland 126 49 40 25 90
France 5,917 4,442 7,172 5,774 5,975
Germany 12,982 12,106 18,099 13,499 11,793
Greece 714 926 895 994 660
Iceland 96 - 94 - 78
Ireland 604 164 977 344 763
Italy 1,780 1,714 977 1,921 2,600
Netherlands 4,289 10,930 19,360 11,338 3,023
Norway 536 358 504 339 484
Poland 6,347 3,318 10,121 3,636 8,774
Portugal 2,028 1,365 2,425 1,917 2,385
Slovenia 621 409 265 280 274
Spain 3,332 2,515 6,789 4,124 Sweden 1,536 971 1,108 1,317 1,303
Switzerland 873 360 1,031 440 1,093
United Kingdom 11,690 12,212 14,877 18,758 12,652
Others 3,267 2,340 685 1,257 7,835
America 49,227 45,889 54,346 51,378 44,266
Argentina 1,777 728 3,360 2,564 2,537
Brazil 5,536 2,519 266 3,328 3,187
Canada 6,510 7,580 7,755 7,964 6,901
Chile 919 1,201 1,652 1,652 1,231
USA 34,337 33,736 38,564 3,532 30,071
Others 148 125 353 339 339
Africa 14,987 12,944 13,707 10,469 10,649
Egypt 8,813 9,294 7,513 6,988 6,988
Morocco 805 233 239 239 239
South Africa 4,116 2,378 5,279 2,497 2,497
Others 1,253 1,093 676 745 745
Source : Coconut Statistical Year Book, APCC, 2008
32
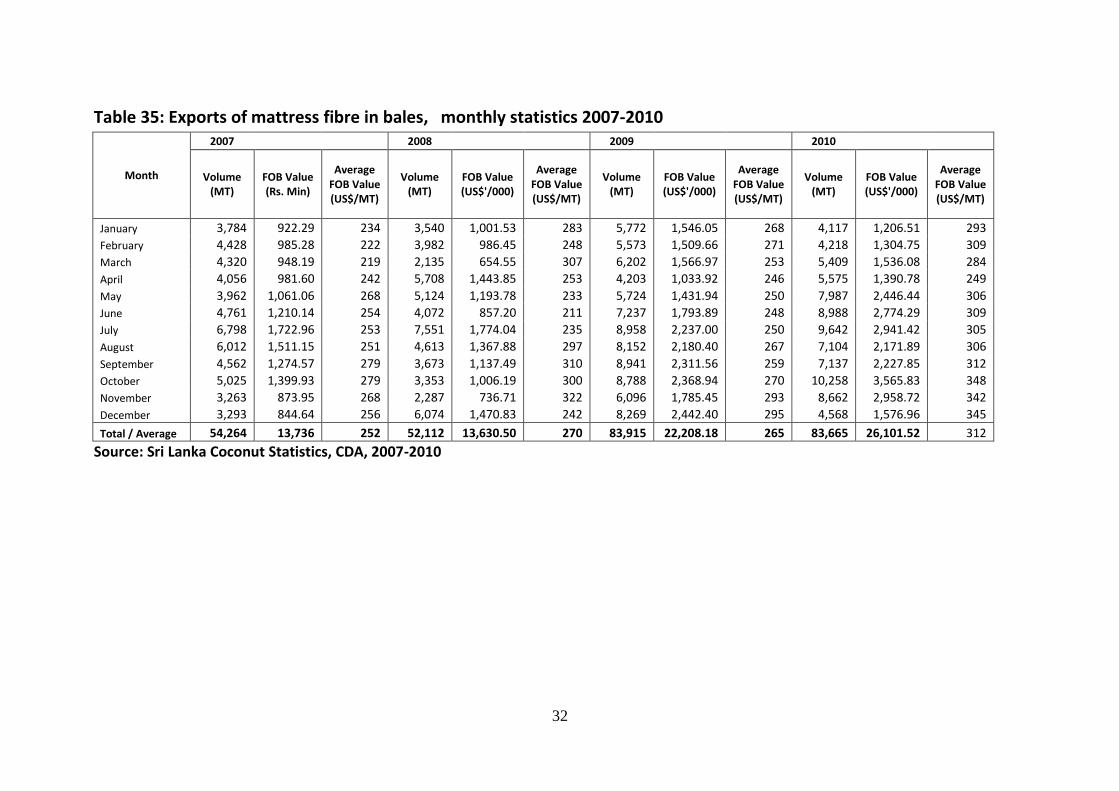
Table 35: Exports of mattress fibre in bales, monthly statistics 2007-2010
Month
2007 2008 2009 2010
Volume (MT)
FOB Value (Rs. Min)
Average FOB Value (US$/MT)
Volume (MT)
FOB Value (US$'/000)
Average FOB Value (US$/MT)
Volume (MT)
FOB Value (US$'/000)
Average FOB Value (US$/MT)
Volume (MT)
FOB Value (US$'/000)
Average FOB Value (US$/MT)
January 3,784 922.29 234 3,540 1,001.53 283 5,772 1,546.05 268 4,117 1,206.51 293
February 4,428 985.28 222 3,982 986.45 248 5,573 1,509.66 271 4,218 1,304.75 309
March 4,320 948.19 219 2,135 654.55 307 6,202 1,566.97 253 5,409 1,536.08 284
April 4,056 981.60 242 5,708 1,443.85 253 4,203 1,033.92 246 5,575 1,390.78 249
May 3,962 1,061.06 268 5,124 1,193.78 233 5,724 1,431.94 250 7,987 2,446.44 306
June 4,761 1,210.14 254 4,072 857.20 211 7,237 1,793.89 248 8,988 2,774.29 309
July 6,798 1,722.96 253 7,551 1,774.04 235 8,958 2,237.00 250 9,642 2,941.42 305
August 6,012 1,511.15 251 4,613 1,367.88 297 8,152 2,180.40 267 7,104 2,171.89 306
September 4,562 1,274.57 279 3,673 1,137.49 310 8,941 2,311.56 259 7,137 2,227.85 312
October 5,025 1,399.93 279 3,353 1,006.19 300 8,788 2,368.94 270 10,258 3,565.83 348
November 3,263 873.95 268 2,287 736.71 322 6,096 1,785.45 293 8,662 2,958.72 342
December 3,293 844.64 256 6,074 1,470.83 242 8,269 2,442.40 295 4,568 1,576.96 345
Total / Average 54,264 13,736 252 52,112 13,630.50 270 83,915 22,208.18 265 83,665 26,101.52 312
Source: Sri Lanka Coconut Statistics, CDA, 2007-2010
33
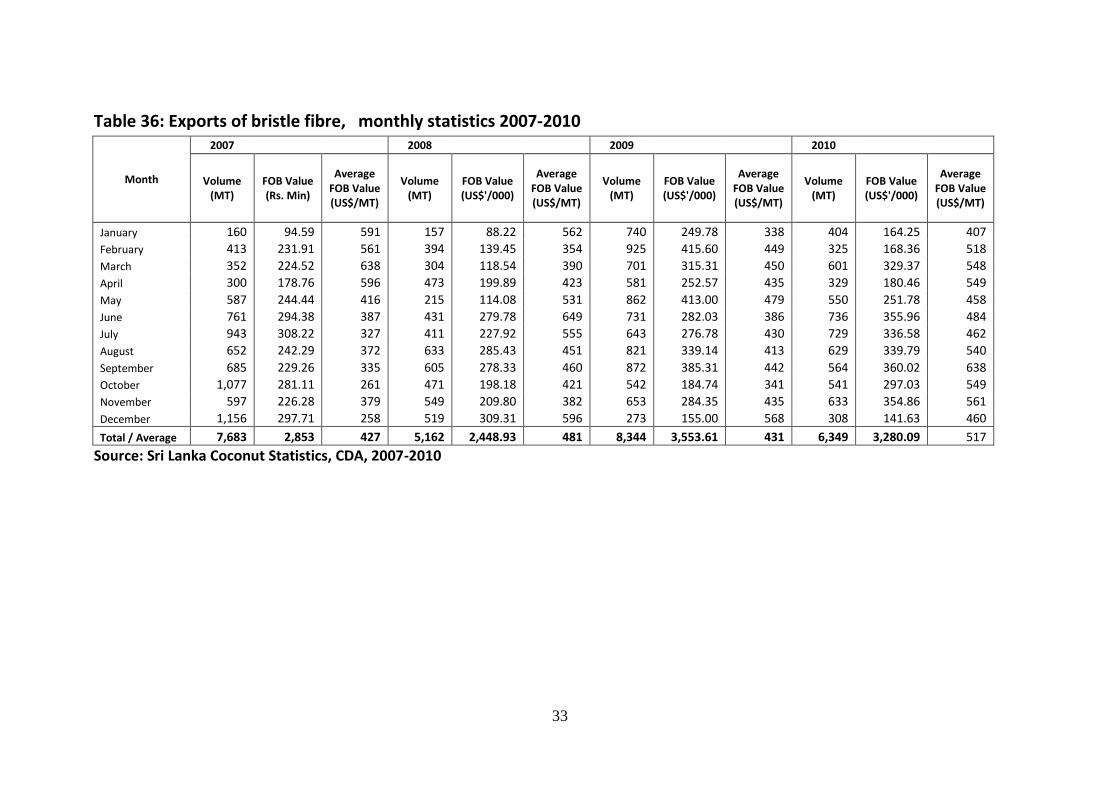
Table 36: Exports of bristle fibre, monthly statistics 2007-2010
Month
2007 2008 2009 2010
Volume (MT)
FOB Value (Rs. Min)
Average FOB Value (US$/MT)
Volume (MT)
FOB Value (US$'/000)
Average FOB Value (US$/MT)
Volume (MT)
FOB Value (US$'/000)
Average FOB Value (US$/MT)
Volume (MT)
FOB Value (US$'/000)
Average FOB Value (US$/MT)
January 160 94.59 591 157 88.22 562 740 249.78 338 404 164.25 407
February 413 231.91 561 394 139.45 354 925 415.60 449 325 168.36 518
March 352 224.52 638 304 118.54 390 701 315.31 450 601 329.37 548
April 300 178.76 596 473 199.89 423 581 252.57 435 329 180.46 549
May 587 244.44 416 215 114.08 531 862 413.00 479 550 251.78 458
June 761 294.38 387 431 279.78 649 731 282.03 386 736 355.96 484
July 943 308.22 327 411 227.92 555 643 276.78 430 729 336.58 462
August 652 242.29 372 633 285.43 451 821 339.14 413 629 339.79 540
September 685 229.26 335 605 278.33 460 872 385.31 442 564 360.02 638
October 1,077 281.11 261 471 198.18 421 542 184.74 341 541 297.03 549
November 597 226.28 379 549 209.80 382 653 284.35 435 633 354.86 561
December 1,156 297.71 258 519 309.31 596 273 155.00 568 308 141.63 460
Total / Average 7,683 2,853 427 5,162 2,448.93 481 8,344 3,553.61 431 6,349 3,280.09 517
Source: Sri Lanka Coconut Statistics, CDA, 2007-2010

34
Table 37: Exports of twisted fibre, monthly statistics 2007-2010
Month
2007 2008 2009 2010
Volume (MT)
FOB Value (Rs. Min)
Average FOB Value (US$/MT)
Volume (MT)
FOB Value (US$'/000)
Average FOB Value (US$/MT)
Volume (MT)
FOB Value (US$'/000)
Average FOB Value (US$/MT)
Volume (MT)
FOB Value (US$'/000)
Average FOB Value (US$/MT)
January 1,702 631.67 371 1,432 634.18 443 4,949 1,235.07 250 2,762 992.29 1,702
February 1,847 640.24 347 1,819 729.43 401 4,497 1,254.69 279 3,419 1,143.26 1,847
March 2,146 714.10 333 1,196 462.68 387 5,302 1,646.20 310 4,543 1,557.03 2,146
April 1,570 565.30 360 2,049 648.24 316 3,761 1,060.78 282 3,028 874.16 1,570
May 1,720 593.47 345 1,805 590.46 327 4,186 1,120.17 268 4,297 1,368.99 1,720
June 2,113 793.85 376 1,210 426.73 353 2,608 754.79 289 3,572 1,257.78 2,113
July 2,136 693.73 325 2,663 977.65 367 3,395 1,079.90 318 2,994 1,264.20 2,136
August 1,891 656.58 347 3,439 1,044.77 304 3,848 1,136.97 295 2,457 1,051.42 1,891
September 1,857 622.04 335 2,300 703.14 306 3,654 1,089.77 298 2,799 885.20 1,857
October 2,460 773.32 314 2,332 644.04 276 3,884 1,214.00 313 3,137 1,381.46 2,460
November 1,615 555.80 344 4,141 1,262.69 305 5,264 1,633.48 310 2,344 857.02 1,615
December 1,806 728.73 403 4,474 1,381.12 309 6,108 1,865.57 305 1,542 620.28 1,806
Total / Average 22,863 7,969 350 28,860 9,505.13 341 51,456 15,091.39 293 36,894 13,253.09 22,863
Source: Sri Lanka Coconut Statistics, CDA, 2007-2010
35
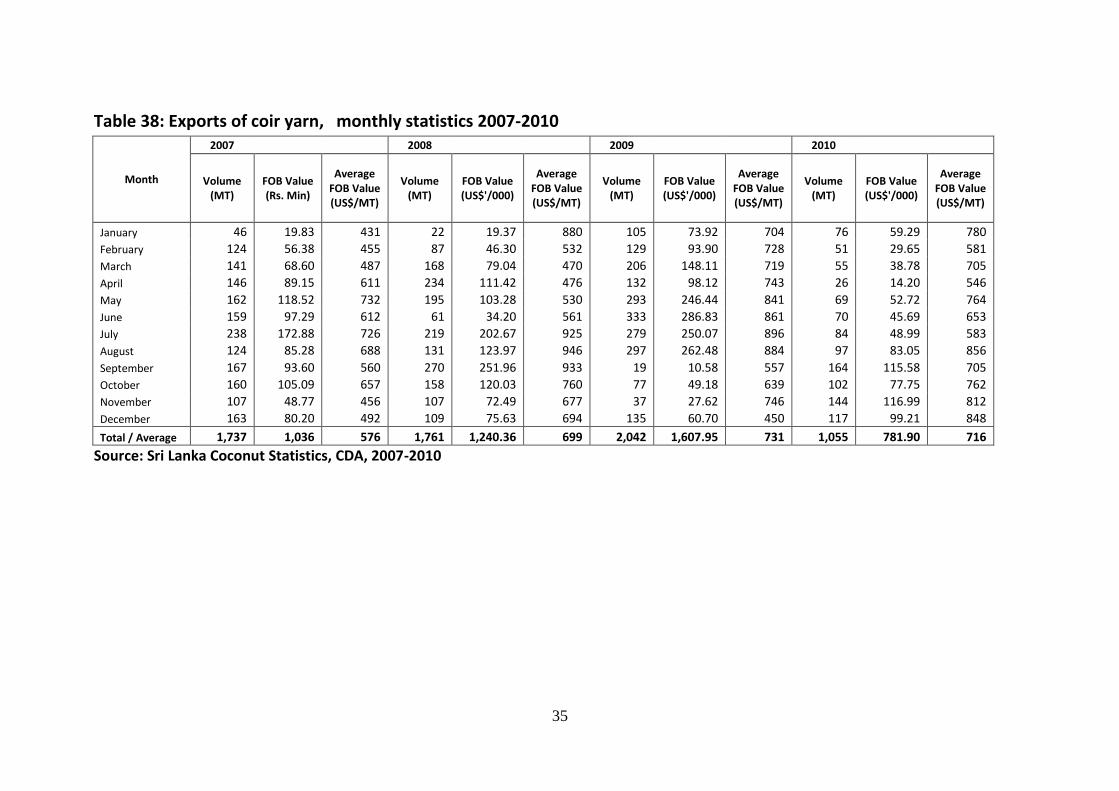
Table 38: Exports of coir yarn, monthly statistics 2007-2010
Month
2007 2008 2009 2010
Volume (MT)
FOB Value (Rs. Min)
Average FOB Value (US$/MT)
Volume (MT)
FOB Value (US$'/000)
Average FOB Value (US$/MT)
Volume (MT)
FOB Value (US$'/000)
Average FOB Value (US$/MT)
Volume (MT)
FOB Value (US$'/000)
Average FOB Value (US$/MT)
January 46 19.83 431 22 19.37 880 105 73.92 704 76 59.29 780
February 124 56.38 455 87 46.30 532 129 93.90 728 51 29.65 581
March 141 68.60 487 168 79.04 470 206 148.11 719 55 38.78 705
April 146 89.15 611 234 111.42 476 132 98.12 743 26 14.20 546
May 162 118.52 732 195 103.28 530 293 246.44 841 69 52.72 764
June 159 97.29 612 61 34.20 561 333 286.83 861 70 45.69 653
July 238 172.88 726 219 202.67 925 279 250.07 896 84 48.99 583
August 124 85.28 688 131 123.97 946 297 262.48 884 97 83.05 856
September 167 93.60 560 270 251.96 933 19 10.58 557 164 115.58 705
October 160 105.09 657 158 120.03 760 77 49.18 639 102 77.75 762
November 107 48.77 456 107 72.49 677 37 27.62 746 144 116.99 812
December 163 80.20 492 109 75.63 694 135 60.70 450 117 99.21 848
Total / Average 1,737 1,036 576 1,761 1,240.36 699 2,042 1,607.95 731 1,055 781.90 716
Source: Sri Lanka Coconut Statistics, CDA, 2007-2010
36
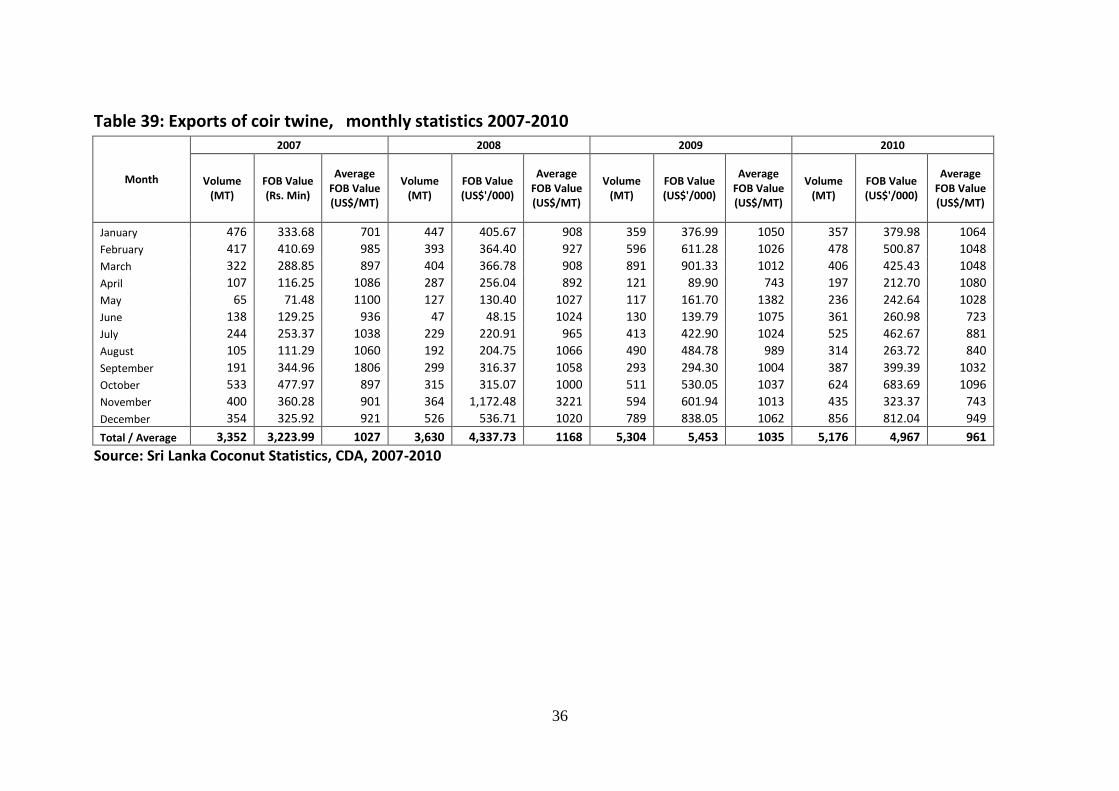
Table 39: Exports of coir twine, monthly statistics 2007-2010
Month
2007 2008 2009 2010
Volume (MT)
FOB Value (Rs. Min)
Average FOB Value (US$/MT)
Volume (MT)
FOB Value (US$'/000)
Average FOB Value (US$/MT)
Volume (MT)
FOB Value (US$'/000)
Average FOB Value (US$/MT)
Volume (MT)
FOB Value (US$'/000)
Average FOB Value (US$/MT)
January 476 333.68 701 447 405.67 908 359 376.99 1050 357 379.98 1064
February 417 410.69 985 393 364.40 927 596 611.28 1026 478 500.87 1048
March 322 288.85 897 404 366.78 908 891 901.33 1012 406 425.43 1048
April 107 116.25 1086 287 256.04 892 121 89.90 743 197 212.70 1080
May 65 71.48 1100 127 130.40 1027 117 161.70 1382 236 242.64 1028
June 138 129.25 936 47 48.15 1024 130 139.79 1075 361 260.98 723
July 244 253.37 1038 229 220.91 965 413 422.90 1024 525 462.67 881
August 105 111.29 1060 192 204.75 1066 490 484.78 989 314 263.72 840
September 191 344.96 1806 299 316.37 1058 293 294.30 1004 387 399.39 1032
October 533 477.97 897 315 315.07 1000 511 530.05 1037 624 683.69 1096
November 400 360.28 901 364 1,172.48 3221 594 601.94 1013 435 323.37 743
December 354 325.92 921 526 536.71 1020 789 838.05 1062 856 812.04 949
Total / Average 3,352 3,223.99 1027 3,630 4,337.73 1168 5,304 5,453 1035 5,176 4,967 961
Source: Sri Lanka Coconut Statistics, CDA, 2007-2010
37
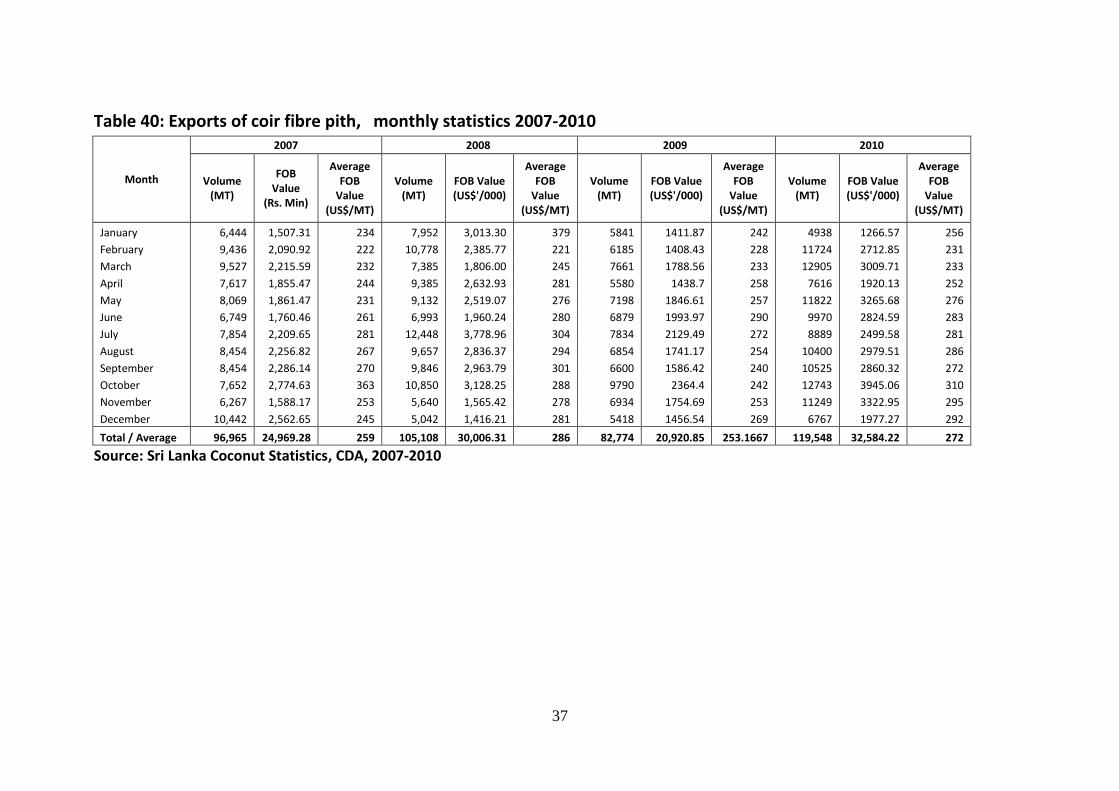
Table 40: Exports of coir fibre pith, monthly statistics 2007-2010
Month
2007 2008 2009 2010
Volume (MT)
FOB Value
(Rs. Min)
Average FOB
Value (US$/MT)
Volume (MT)
FOB Value (US$'/000)
Average FOB
Value (US$/MT)
Volume (MT)
FOB Value (US$'/000)
Average FOB
Value (US$/MT)
Volume (MT)
FOB Value (US$'/000)
Average FOB
Value (US$/MT)
January 6,444 1,507.31 234 7,952 3,013.30 379 5841 1411.87 242 4938 1266.57 256
February 9,436 2,090.92 222 10,778 2,385.77 221 6185 1408.43 228 11724 2712.85 231
March 9,527 2,215.59 232 7,385 1,806.00 245 7661 1788.56 233 12905 3009.71 233
April 7,617 1,855.47 244 9,385 2,632.93 281 5580 1438.7 258 7616 1920.13 252
May 8,069 1,861.47 231 9,132 2,519.07 276 7198 1846.61 257 11822 3265.68 276
June 6,749 1,760.46 261 6,993 1,960.24 280 6879 1993.97 290 9970 2824.59 283
July 7,854 2,209.65 281 12,448 3,778.96 304 7834 2129.49 272 8889 2499.58 281
August 8,454 2,256.82 267 9,657 2,836.37 294 6854 1741.17 254 10400 2979.51 286
September 8,454 2,286.14 270 9,846 2,963.79 301 6600 1586.42 240 10525 2860.32 272
October 7,652 2,774.63 363 10,850 3,128.25 288 9790 2364.4 242 12743 3945.06 310
November 6,267 1,588.17 253 5,640 1,565.42 278 6934 1754.69 253 11249 3322.95 295
December 10,442 2,562.65 245 5,042 1,416.21 281 5418 1456.54 269 6767 1977.27 292
Total / Average 96,965 24,969.28 259 105,108 30,006.31 286 82,774 20,920.85 253.1667 119,548 32,584.22 272
Source: Sri Lanka Coconut Statistics, CDA, 2007-2010
38
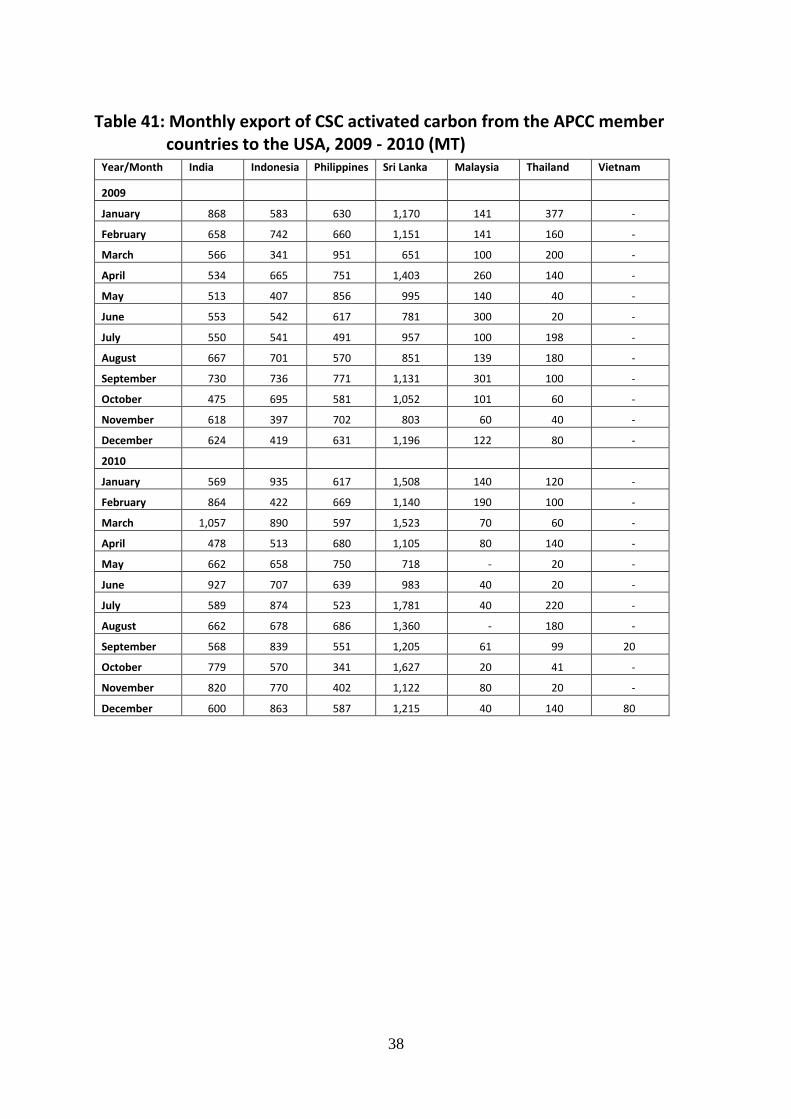
Table 41: Monthly export of CSC activated carbon from the APCC member countries to the USA, 2009 - 2010 (MT)
Year/Month India Indonesia Philippines Sri Lanka Malaysia Thailand Vietnam
2009
January 868 583 630 1,170 141 377 -
February 658 742 660 1,151 141 160 -
March 566 341 951 651 100 200 -
April 534 665 751 1,403 260 140 -
May 513 407 856 995 140 40 -
June 553 542 617 781 300 20 -
July 550 541 491 957 100 198 -
August 667 701 570 851 139 180 -
September 730 736 771 1,131 301 100 -
October 475 695 581 1,052 101 60 -
November 618 397 702 803 60 40 -
December 624 419 631 1,196 122 80 -
2010
January 569 935 617 1,508 140 120 -
February 864 422 669 1,140 190 100 -
March 1,057 890 597 1,523 70 60 -
April 478 513 680 1,105 80 140 -
May 662 658 750 718 - 20 -
June 927 707 639 983 40 20 -
July 589 874 523 1,781 40 220 -
August 662 678 686 1,360 - 180 -
September 568 839 551 1,205 61 99 20
October 779 570 341 1,627 20 41 -
November 820 770 402 1,122 80 20 -
December 600 863 587 1,215 40 140 80
39
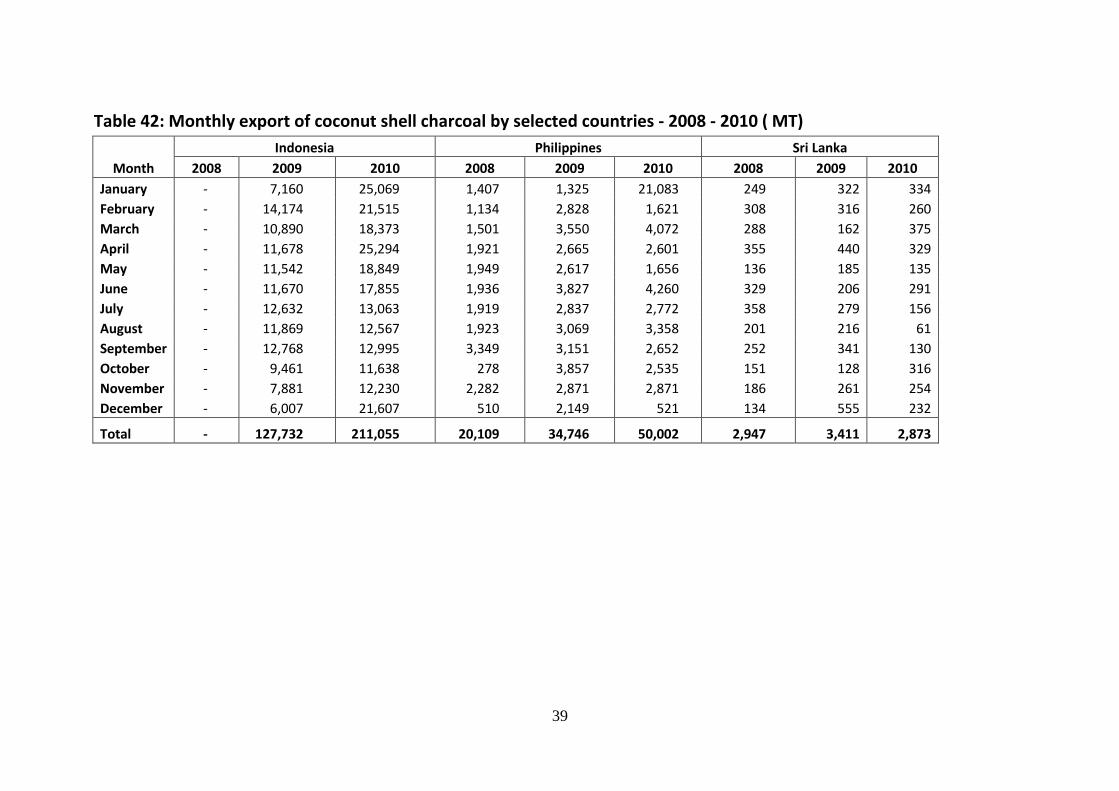
Table 42: Monthly export of coconut shell charcoal by selected countries - 2008 - 2010 ( MT)
Month
Indonesia Philippines Sri Lanka
2008 2009 2010 2008 2009 2010 2008 2009 2010
January - 7,160 25,069 1,407 1,325 21,083 249 322 334
February - 14,174 21,515 1,134 2,828 1,621 308 316 260
March - 10,890 18,373 1,501 3,550 4,072 288 162 375
April - 11,678 25,294 1,921 2,665 2,601 355 440 329
May - 11,542 18,849 1,949 2,617 1,656 136 185 135
June - 11,670 17,855 1,936 3,827 4,260 329 206 291
July - 12,632 13,063 1,919 2,837 2,772 358 279 156
August - 11,869 12,567 1,923 3,069 3,358 201 216 61
September - 12,768 12,995 3,349 3,151 2,652 252 341 130
October - 9,461 11,638 278 3,857 2,535 151 128 316
November - 7,881 12,230 2,282 2,871 2,871 186 261 254
December - 6,007 21,607 510 2,149 521 134 555 232
Total - 127,732 211,055 20,109 34,746 50,002 2,947 3,411 2,873
40
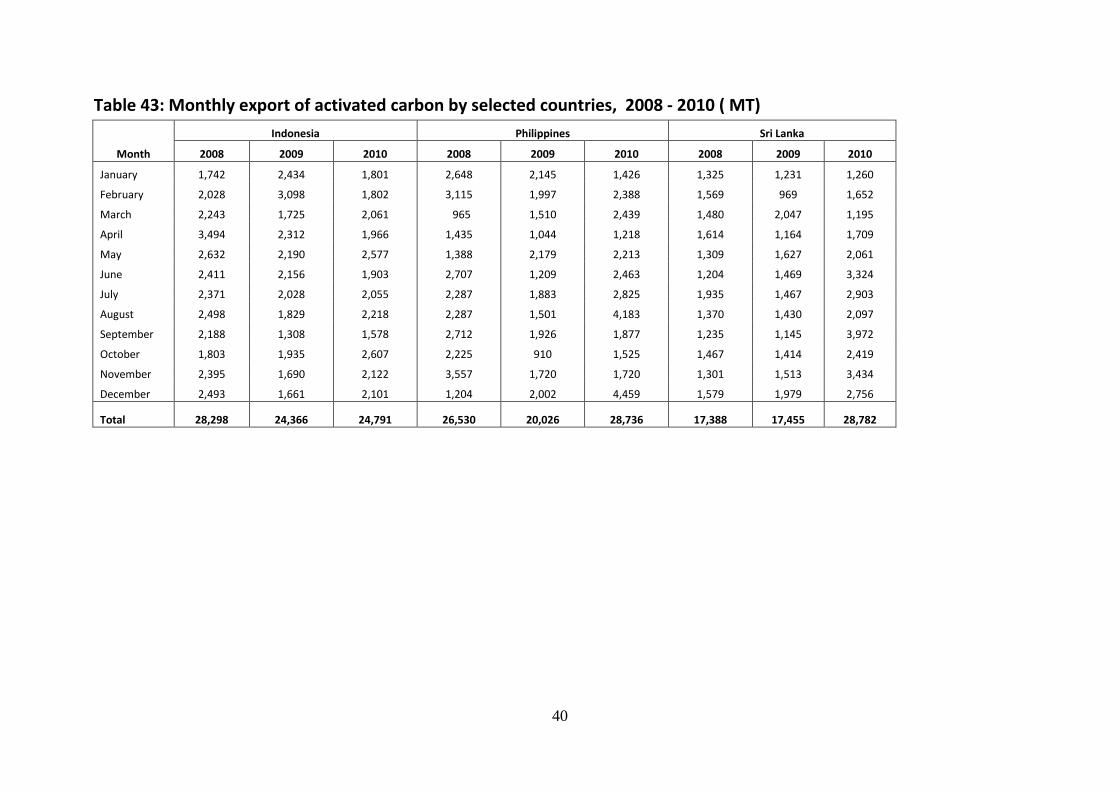
Table 43: Monthly export of activated carbon by selected countries, 2008 - 2010 ( MT)
Month
Indonesia Philippines Sri Lanka
2008 2009 2010 2008 2009 2010 2008 2009 2010
January 1,742 2,434 1,801 2,648 2,145 1,426 1,325 1,231 1,260
February 2,028 3,098 1,802 3,115 1,997 2,388 1,569 969 1,652
March 2,243 1,725 2,061 965 1,510 2,439 1,480 2,047 1,195
April 3,494 2,312 1,966 1,435 1,044 1,218 1,614 1,164 1,709
May 2,632 2,190 2,577 1,388 2,179 2,213 1,309 1,627 2,061
June 2,411 2,156 1,903 2,707 1,209 2,463 1,204 1,469 3,324
July 2,371 2,028 2,055 2,287 1,883 2,825 1,935 1,467 2,903
August 2,498 1,829 2,218 2,287 1,501 4,183 1,370 1,430 2,097
September 2,188 1,308 1,578 2,712 1,926 1,877 1,235 1,145 3,972
October 1,803 1,935 2,607 2,225 910 1,525 1,467 1,414 2,419
November 2,395 1,690 2,122 3,557 1,720 1,720 1,301 1,513 3,434
December 2,493 1,661 2,101 1,204 2,002 4,459 1,579 1,979 2,756
Total 28,298 24,366 24,791 26,530 20,026 28,736 17,388 17,455 28,782
41
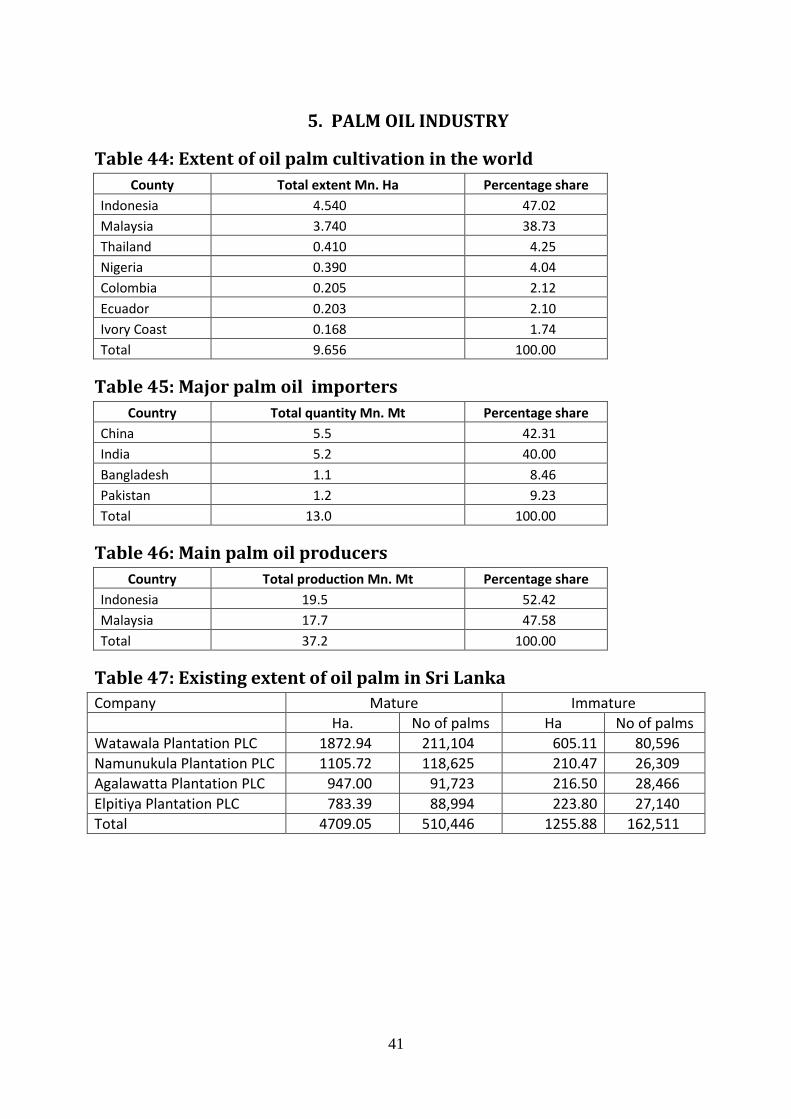
5. PALM OIL INDUSTRY
Table 44: Extent of oil palm cultivation in the world
County Total extent Mn. Ha Percentage share
Indonesia 4.540 47.02
Malaysia 3.740 38.73
Thailand 0.410 4.25
Nigeria 0.390 4.04
Colombia 0.205 2.12
Ecuador 0.203 2.10
Ivory Coast 0.168 1.74
Total 9.656 100.00
Table 45: Major palm oil importers
Country Total quantity Mn. Mt Percentage share
China 5.5 42.31
India 5.2 40.00
Bangladesh 1.1 8.46
Pakistan 1.2 9.23
Total 13.0 100.00
Table 46: Main palm oil producers
Country Total production Mn. Mt Percentage share
Indonesia 19.5 52.42
Malaysia 17.7 47.58
Total 37.2 100.00
Table 47: Existing extent of oil palm in Sri Lanka
Company Mature Immature
Ha. No of palms Ha No of palms
Watawala Plantation PLC 1872.94 211,104 605.11 80,596
Namunukula Plantation PLC 1105.72 118,625 210.47 26,309
Agalawatta Plantation PLC 947.00 91,723 216.50 28,466
Elpitiya Plantation PLC 783.39 88,994 223.80 27,140
Total 4709.05 510,446 1255.88 162,511

42
Table 48: Proposed expansion of oil palm 2011-2015
Company Extent (ha) Total
2011 2012 2013 2014 2015
Watawala Plantation PLC 198.50 258.58 316.79 219.50 323.97 1317.34
Namunukula Plantation PLC - - - - 330.97
Agalawatte Plantation PLC 136.60 - 90.00 67.00 46.00 339.60
Elpitiya Plantation PLC 150.00 150.00 125.00 125.00 15.00 700.00
Kotagala Plantation PLC 140.00 250.00 350.00 260.00 - 1000.00
Total 625.10 658.58 881.79 671.50 519.97
Table 49: Local palm oil production
Mill Volume (MT)
2009 2010
Nakiyadeniya Estate 5498 5016
AEN ,Baduruliya 7224 7297
Total 12722 12313
43
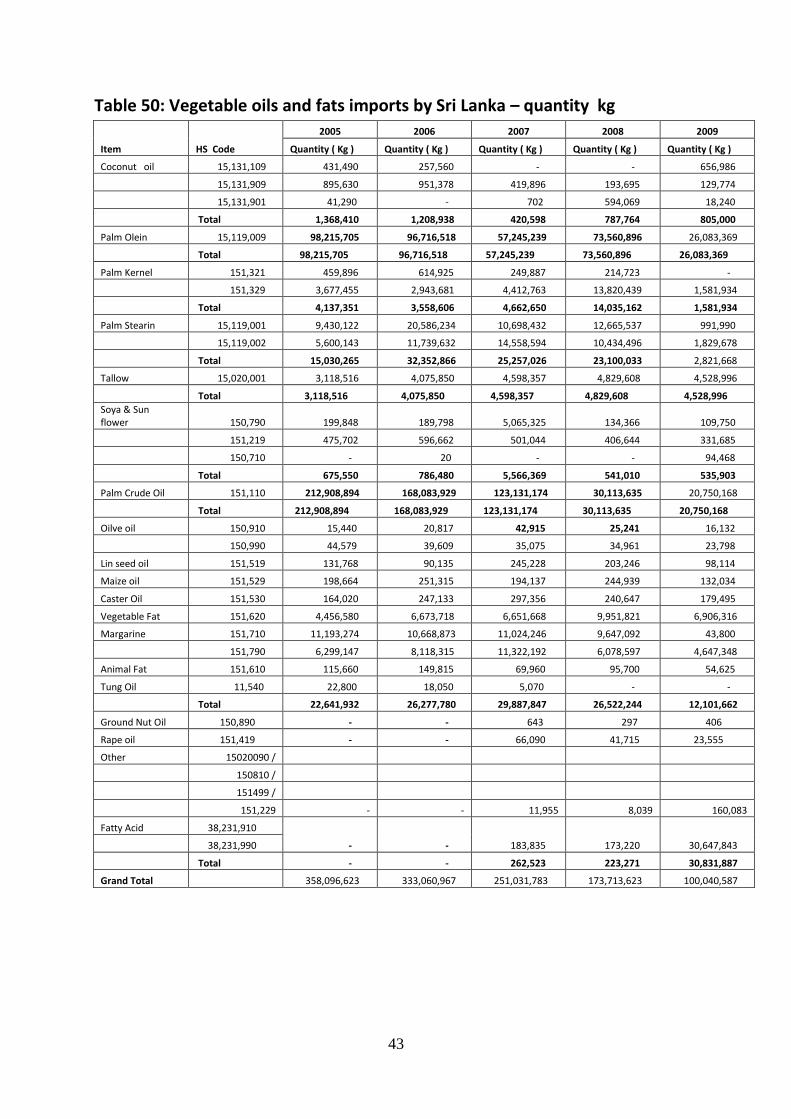
Table 50: Vegetable oils and fats imports by Sri Lanka – quantity kg
Item HS Code
2005 2006 2007 2008 2009
Quantity ( Kg ) Quantity ( Kg ) Quantity ( Kg ) Quantity ( Kg ) Quantity ( Kg )
Coconut oil 15,131,109 431,490 257,560 - - 656,986
15,131,909 895,630 951,378 419,896 193,695 129,774
15,131,901 41,290 - 702 594,069 18,240
Total 1,368,410 1,208,938 420,598 787,764 805,000
Palm Olein 15,119,009 98,215,705 96,716,518 57,245,239 73,560,896 26,083,369
Total 98,215,705 96,716,518 57,245,239 73,560,896 26,083,369
Palm Kernel 151,321 459,896 614,925 249,887 214,723 -
151,329 3,677,455 2,943,681 4,412,763 13,820,439 1,581,934
Total 4,137,351 3,558,606 4,662,650 14,035,162 1,581,934
Palm Stearin 15,119,001 9,430,122 20,586,234 10,698,432 12,665,537 991,990
15,119,002 5,600,143 11,739,632 14,558,594 10,434,496 1,829,678
Total 15,030,265 32,352,866 25,257,026 23,100,033 2,821,668
Tallow 15,020,001 3,118,516 4,075,850 4,598,357 4,829,608 4,528,996
Total 3,118,516 4,075,850 4,598,357 4,829,608 4,528,996
Soya & Sun flower 150,790 199,848 189,798 5,065,325 134,366 109,750
151,219 475,702 596,662 501,044 406,644 331,685
150,710 - 20 - - 94,468
Total 675,550 786,480 5,566,369 541,010 535,903
Palm Crude Oil 151,110 212,908,894 168,083,929 123,131,174 30,113,635 20,750,168
Total 212,908,894 168,083,929 123,131,174 30,113,635 20,750,168
Oilve oil 150,910 15,440 20,817 42,915 25,241 16,132
150,990 44,579 39,609 35,075 34,961 23,798
Lin seed oil 151,519 131,768 90,135 245,228 203,246 98,114
Maize oil 151,529 198,664 251,315 194,137 244,939 132,034
Caster Oil 151,530 164,020 247,133 297,356 240,647 179,495
Vegetable Fat 151,620 4,456,580 6,673,718 6,651,668 9,951,821 6,906,316
Margarine 151,710 11,193,274 10,668,873 11,024,246 9,647,092 43,800
151,790 6,299,147 8,118,315 11,322,192 6,078,597 4,647,348
Animal Fat 151,610 115,660 149,815 69,960 95,700 54,625
Tung Oil 11,540 22,800 18,050 5,070 - -
Total 22,641,932 26,277,780 29,887,847 26,522,244 12,101,662
Ground Nut Oil 150,890 - - 643 297 406
Rape oil 151,419 - - 66,090 41,715 23,555
Other 15020090 /
150810 /
151499 /
151,229 - - 11,955 8,039 160,083
Fatty Acid 38,231,910
- - 183,835 173,220 30,647,843 38,231,990
Total - - 262,523 223,271 30,831,887
Grand Total 358,096,623 333,060,967 251,031,783 173,713,623 100,040,587
44
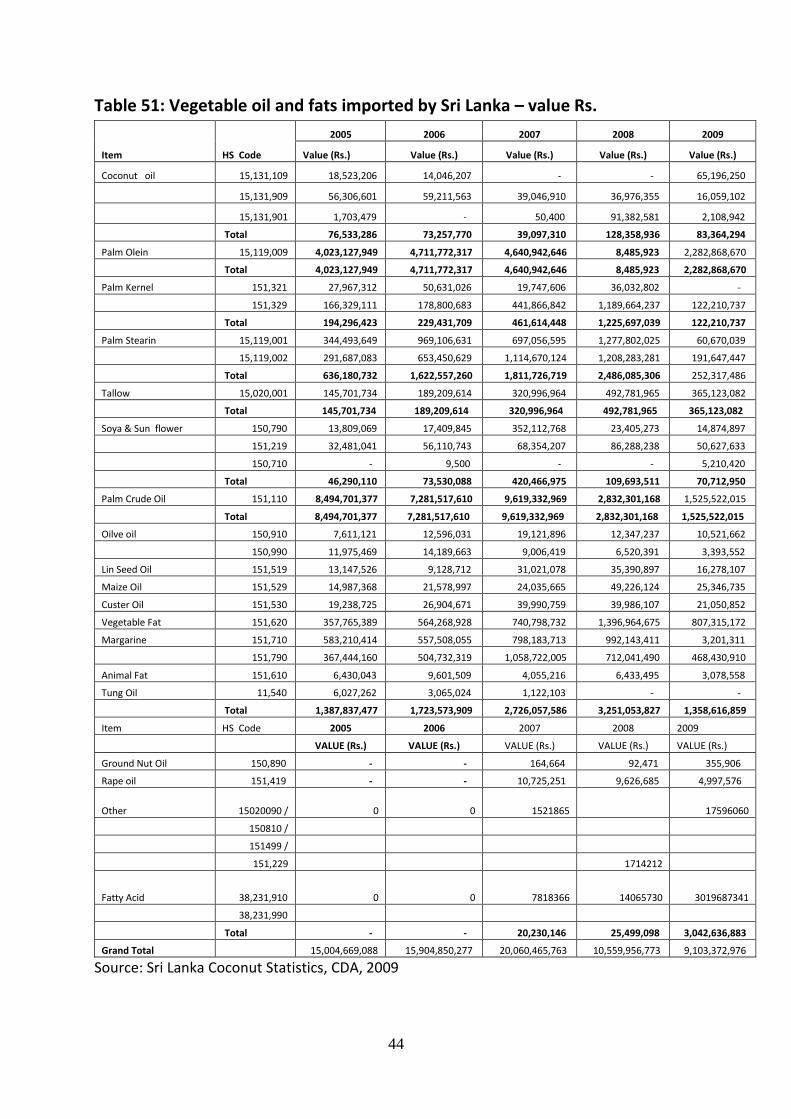
Table 51: Vegetable oil and fats imported by Sri Lanka – value Rs.
Item HS Code
2005 2006 2007 2008 2009
Value (Rs.) Value (Rs.) Value (Rs.) Value (Rs.) Value (Rs.)
Coconut oil 15,131,109 18,523,206 14,046,207 - - 65,196,250
15,131,909 56,306,601 59,211,563 39,046,910 36,976,355 16,059,102
15,131,901 1,703,479 - 50,400 91,382,581 2,108,942
Total 76,533,286 73,257,770 39,097,310 128,358,936 83,364,294
Palm Olein 15,119,009 4,023,127,949 4,711,772,317 4,640,942,646 8,485,923 2,282,868,670
Total 4,023,127,949 4,711,772,317 4,640,942,646 8,485,923 2,282,868,670
Palm Kernel 151,321 27,967,312 50,631,026 19,747,606 36,032,802 -
151,329 166,329,111 178,800,683 441,866,842 1,189,664,237 122,210,737
Total 194,296,423 229,431,709 461,614,448 1,225,697,039 122,210,737
Palm Stearin 15,119,001 344,493,649 969,106,631 697,056,595 1,277,802,025 60,670,039
15,119,002 291,687,083 653,450,629 1,114,670,124 1,208,283,281 191,647,447
Total 636,180,732 1,622,557,260 1,811,726,719 2,486,085,306 252,317,486
Tallow 15,020,001 145,701,734 189,209,614 320,996,964 492,781,965 365,123,082
Total 145,701,734 189,209,614 320,996,964 492,781,965 365,123,082
Soya & Sun flower 150,790 13,809,069 17,409,845 352,112,768 23,405,273 14,874,897
151,219 32,481,041 56,110,743 68,354,207 86,288,238 50,627,633
150,710 - 9,500 - - 5,210,420
Total 46,290,110 73,530,088 420,466,975 109,693,511 70,712,950
Palm Crude Oil 151,110 8,494,701,377 7,281,517,610 9,619,332,969 2,832,301,168 1,525,522,015
Total 8,494,701,377 7,281,517,610 9,619,332,969 2,832,301,168 1,525,522,015
Oilve oil 150,910 7,611,121 12,596,031 19,121,896 12,347,237 10,521,662
150,990 11,975,469 14,189,663 9,006,419 6,520,391 3,393,552
Lin Seed Oil 151,519 13,147,526 9,128,712 31,021,078 35,390,897 16,278,107
Maize Oil 151,529 14,987,368 21,578,997 24,035,665 49,226,124 25,346,735
Custer Oil 151,530 19,238,725 26,904,671 39,990,759 39,986,107 21,050,852
Vegetable Fat 151,620 357,765,389 564,268,928 740,798,732 1,396,964,675 807,315,172
Margarine 151,710 583,210,414 557,508,055 798,183,713 992,143,411 3,201,311
151,790 367,444,160 504,732,319 1,058,722,005 712,041,490 468,430,910
Animal Fat 151,610 6,430,043 9,601,509 4,055,216 6,433,495 3,078,558
Tung Oil 11,540 6,027,262 3,065,024 1,122,103 - -
Total 1,387,837,477 1,723,573,909 2,726,057,586 3,251,053,827 1,358,616,859
Item HS Code 2005 2006 2007 2008 2009
VALUE (Rs.) VALUE (Rs.) VALUE (Rs.) VALUE (Rs.) VALUE (Rs.)
Ground Nut Oil 150,890 - - 164,664 92,471 355,906
Rape oil 151,419 - - 10,725,251 9,626,685 4,997,576
Other
15020090 / 0 0 1521865 17596060
150810 /
151499 /
151,229
1714212
Fatty Acid
38,231,910 0 0 7818366 14065730 3019687341
38,231,990
Total - - 20,230,146 25,499,098 3,042,636,883
Grand Total 15,004,669,088 15,904,850,277 20,060,465,763 10,559,956,773 9,103,372,976
Source: Sri Lanka Coconut Statistics, CDA, 2009
45
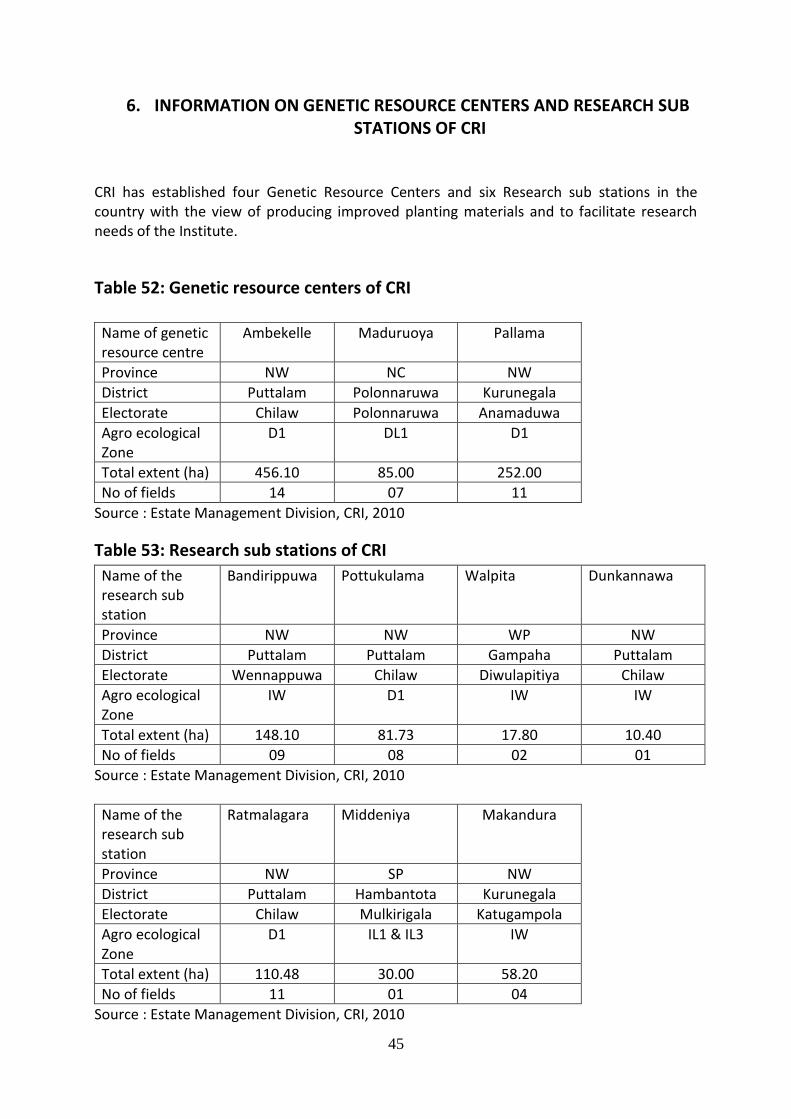
6. INFORMATION ON GENETIC RESOURCE CENTERS AND RESEARCH SUB STATIONS OF CRI
CRI has established four Genetic Resource Centers and six Research sub stations in the country with the view of producing improved planting materials and to facilitate research needs of the Institute.
Table 52: Genetic resource centers of CRI
Name of genetic resource centre
Ambekelle Maduruoya Pallama
Province NW NC NW
District Puttalam Polonnaruwa Kurunegala
Electorate Chilaw Polonnaruwa Anamaduwa
Agro ecological Zone
D1 DL1 D1
Total extent (ha) 456.10 85.00 252.00
No of fields 14 07 11
Source : Estate Management Division, CRI, 2010
Table 53: Research sub stations of CRI
Name of the research sub station
Bandirippuwa Pottukulama Walpita Dunkannawa
Province NW NW WP NW
District Puttalam Puttalam Gampaha Puttalam
Electorate Wennappuwa Chilaw Diwulapitiya Chilaw
Agro ecological Zone
IW D1 IW IW
Total extent (ha) 148.10 81.73 17.80 10.40
No of fields 09 08 02 01
Source : Estate Management Division, CRI, 2010
Name of the research sub station
Ratmalagara Middeniya Makandura
Province NW SP NW
District Puttalam Hambantota Kurunegala
Electorate Chilaw Mulkirigala Katugampola
Agro ecological Zone
D1 IL1 & IL3 IW
Total extent (ha) 110.48 30.00 58.20
No of fields 11 01 04
Source : Estate Management Division, CRI, 2010
46
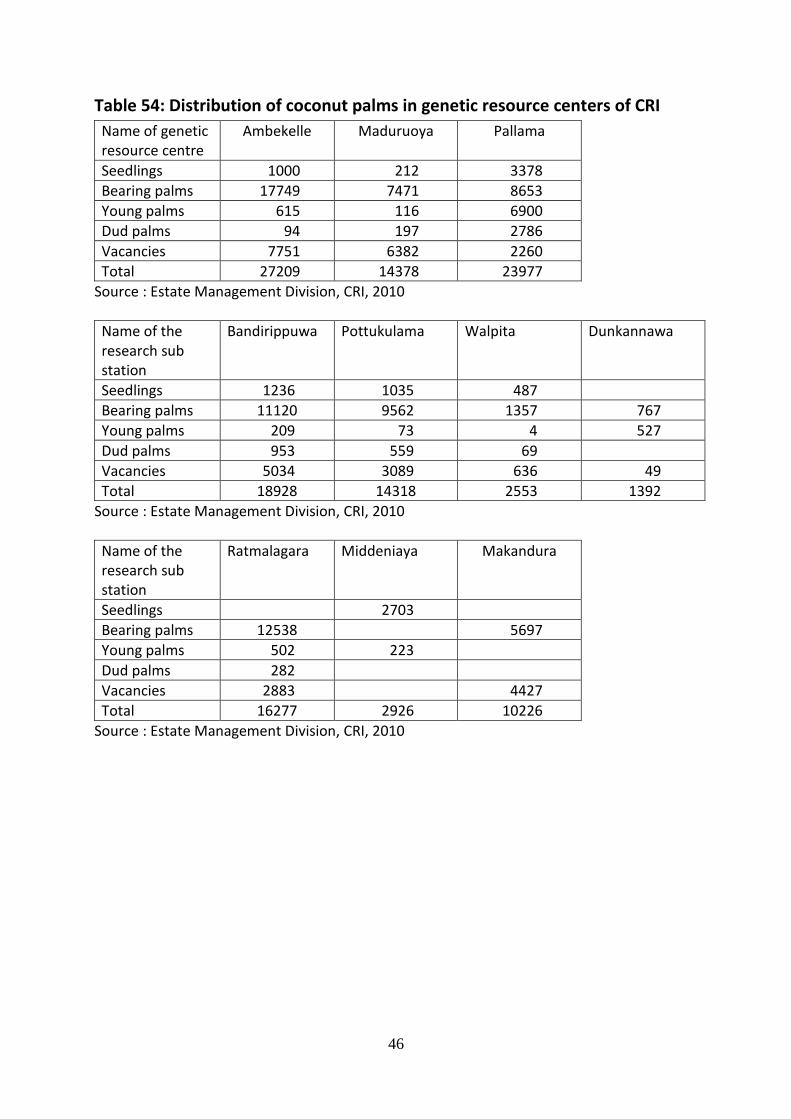
Table 54: Distribution of coconut palms in genetic resource centers of CRI
Name of genetic resource centre
Ambekelle Maduruoya Pallama
Seedlings 1000 212 3378
Bearing palms 17749 7471 8653
Young palms 615 116 6900
Dud palms 94 197 2786
Vacancies 7751 6382 2260
Total 27209 14378 23977
Source : Estate Management Division, CRI, 2010
Name of the research sub station
Bandirippuwa Pottukulama Walpita Dunkannawa
Seedlings 1236 1035 487
Bearing palms 11120 9562 1357 767
Young palms 209 73 4 527
Dud palms 953 559 69
Vacancies 5034 3089 636 49
Total 18928 14318 2553 1392
Source : Estate Management Division, CRI, 2010
Name of the research sub station
Ratmalagara Middeniaya Makandura
Seedlings 2703
Bearing palms 12538 5697
Young palms 502 223
Dud palms 282
Vacancies 2883 4427
Total 16277 2926 10226
Source : Estate Management Division, CRI, 2010
47
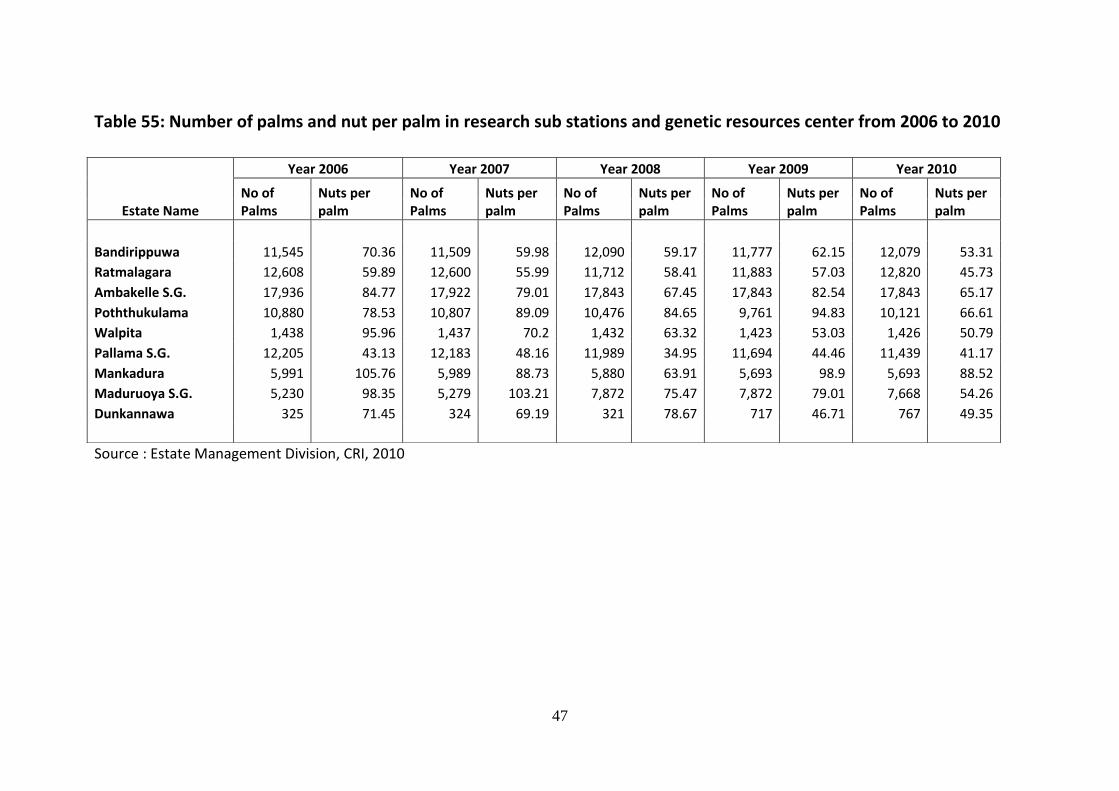
Table 55: Number of palms and nut per palm in research sub stations and genetic resources center from 2006 to 2010
Source : Estate Management Division, CRI, 2010
Estate Name
Year 2006 Year 2007 Year 2008 Year 2009 Year 2010
No of Palms
Nuts per palm
No of Palms
Nuts per palm
No of Palms
Nuts per palm
No of Palms
Nuts per palm
No of Palms
Nuts per palm
Bandirippuwa 11,545 70.36 11,509 59.98 12,090 59.17 11,777 62.15 12,079 53.31
Ratmalagara 12,608 59.89 12,600 55.99 11,712 58.41 11,883 57.03 12,820 45.73
Ambakelle S.G. 17,936 84.77 17,922 79.01 17,843 67.45 17,843 82.54 17,843 65.17
Poththukulama 10,880 78.53 10,807 89.09 10,476 84.65 9,761 94.83 10,121 66.61
Walpita 1,438 95.96 1,437 70.2 1,432 63.32 1,423 53.03 1,426 50.79
Pallama S.G. 12,205 43.13 12,183 48.16 11,989 34.95 11,694 44.46 11,439 41.17
Mankadura 5,991 105.76 5,989 88.73 5,880 63.91 5,693 98.9 5,693 88.52
Maduruoya S.G. 5,230 98.35 5,279 103.21 7,872 75.47 7,872 79.01 7,668 54.26
Dunkannawa 325 71.45 324 69.19 321 78.67 717 46.71 767 49.35
48
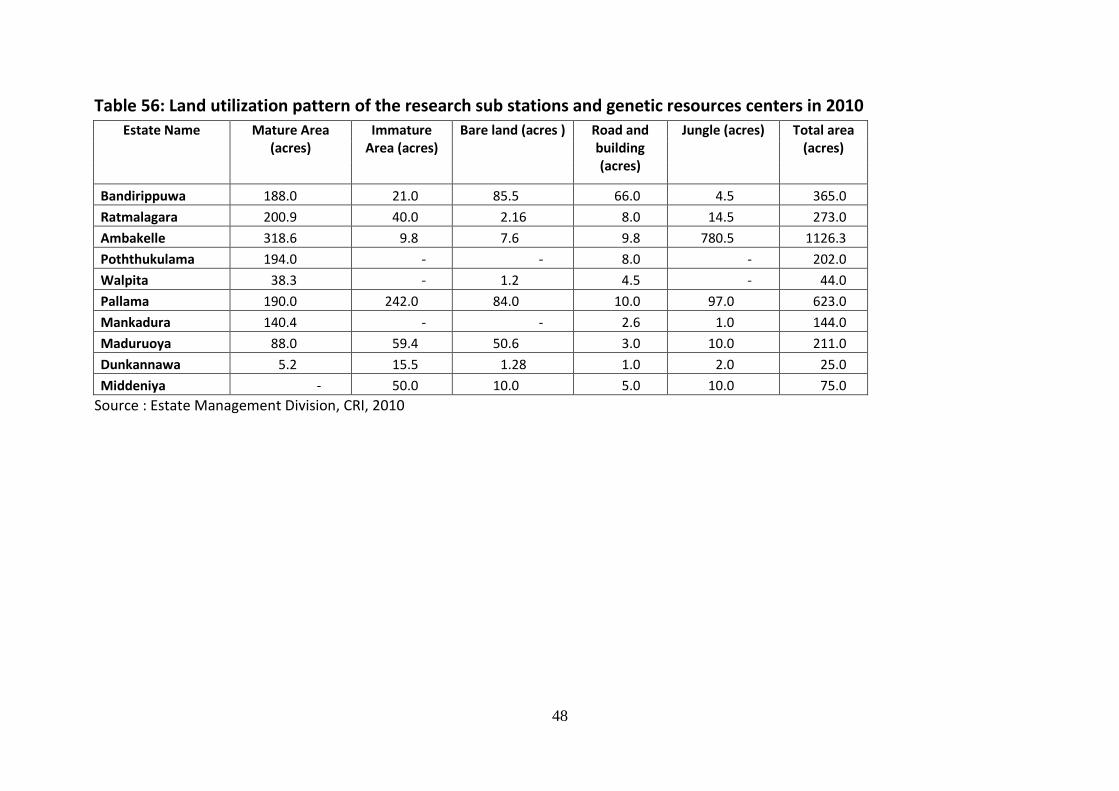
Table 56: Land utilization pattern of the research sub stations and genetic resources centers in 2010 Estate Name Mature Area
(acres) Immature
Area (acres) Bare land (acres ) Road and
building (acres)
Jungle (acres) Total area (acres)
Bandirippuwa 188.0 21.0 85.5 66.0 4.5 365.0
Ratmalagara 200.9 40.0 2.16 8.0 14.5 273.0
Ambakelle 318.6 9.8 7.6 9.8 780.5 1126.3
Poththukulama 194.0 - - 8.0 - 202.0
Walpita 38.3 - 1.2 4.5 - 44.0
Pallama 190.0 242.0 84.0 10.0 97.0 623.0
Mankadura 140.4 - - 2.6 1.0 144.0
Maduruoya 88.0 59.4 50.6 3.0 10.0 211.0
Dunkannawa 5.2 15.5 1.28 1.0 2.0 25.0
Middeniya - 50.0 10.0 5.0 10.0 75.0
Source : Estate Management Division, CRI, 2010

49
Table 57: Nut production in CRI estates
Name of the Estate 2009 2010 % change
Bandirippuwa 731,971 643,986 -12
Rathmalagara 677,727 586,276 -13
Maduru Oya 621,903 416,109 -33
Ambekele 1,472,768 1,163,000 -21
Makandura 563,038 503,951 -10
Walpita 75,474 72,436 -4
Potthukkulama 925,707 674,188 -27
Dunkannawa 33,492 37,859 13
Pallama 519,922 471,026 -9
Average 5,622,002 4,568,831 -19
Source: Estate Management Division, CRI, 2010
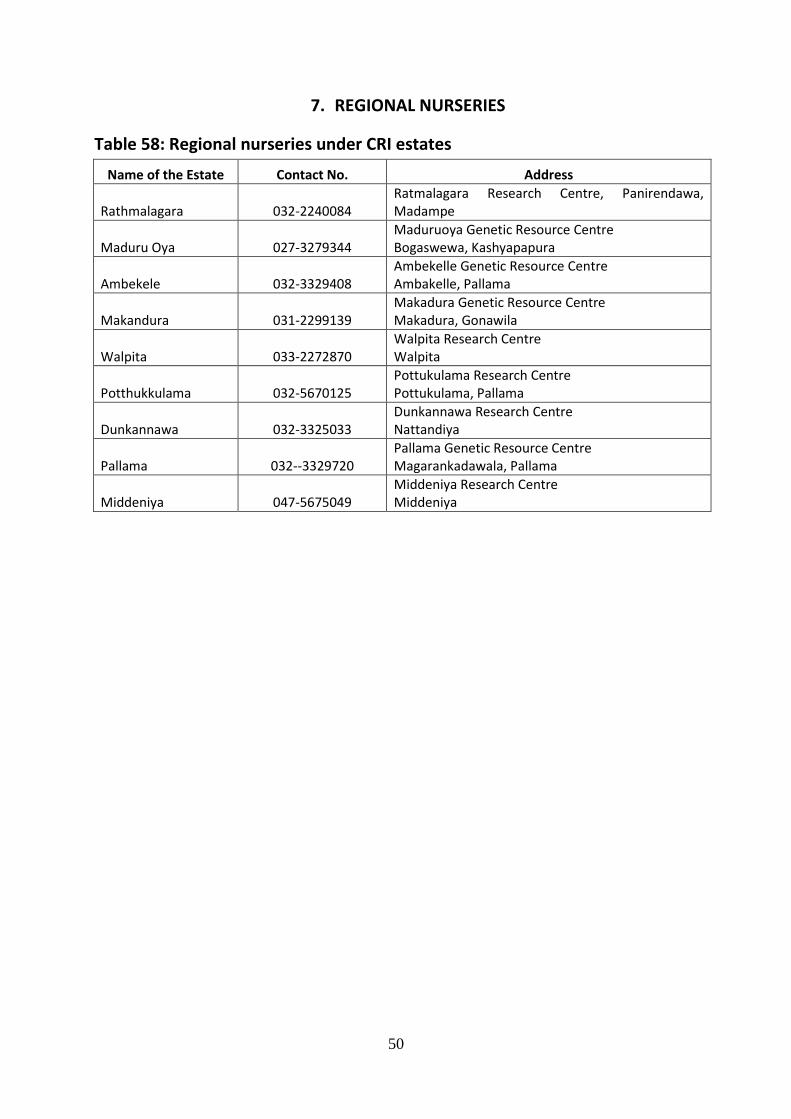
50
7. REGIONAL NURSERIES
Table 58: Regional nurseries under CRI estates
Name of the Estate Contact No. Address
Rathmalagara 032-2240084 Ratmalagara Research Centre, Panirendawa, Madampe
Maduru Oya 027-3279344 Maduruoya Genetic Resource Centre Bogaswewa, Kashyapapura
Ambekele 032-3329408 Ambekelle Genetic Resource Centre Ambakelle, Pallama
Makandura 031-2299139 Makadura Genetic Resource Centre Makadura, Gonawila
Walpita 033-2272870 Walpita Research Centre Walpita
Potthukkulama 032-5670125 Pottukulama Research Centre Pottukulama, Pallama
Dunkannawa 032-3325033 Dunkannawa Research Centre Nattandiya
Pallama 032--3329720 Pallama Genetic Resource Centre Magarankadawala, Pallama
Middeniya 047-5675049 Middeniya Research Centre Middeniya
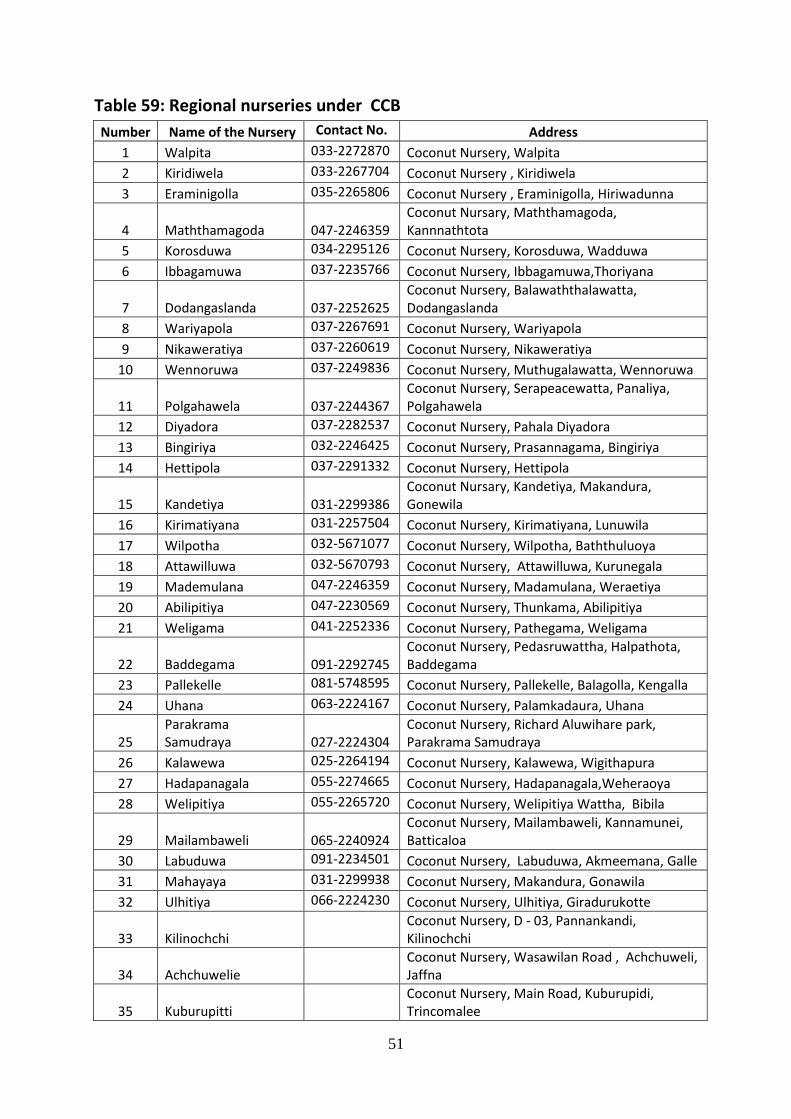
51
Table 59: Regional nurseries under CCB
Number Name of the Nursery Contact No. Address
1 Walpita 033-2272870 Coconut Nursery, Walpita
2 Kiridiwela 033-2267704 Coconut Nursery , Kiridiwela
3 Eraminigolla 035-2265806 Coconut Nursery , Eraminigolla, Hiriwadunna
4 Maththamagoda 047-2246359
Coconut Nursary, Maththamagoda, Kannnathtota
5 Korosduwa 034-2295126 Coconut Nursery, Korosduwa, Wadduwa
6 Ibbagamuwa 037-2235766 Coconut Nursery, Ibbagamuwa,Thoriyana
7 Dodangaslanda 037-2252625
Coconut Nursery, Balawaththalawatta, Dodangaslanda
8 Wariyapola 037-2267691 Coconut Nursery, Wariyapola
9 Nikaweratiya 037-2260619 Coconut Nursery, Nikaweratiya
10 Wennoruwa 037-2249836 Coconut Nursery, Muthugalawatta, Wennoruwa
11 Polgahawela 037-2244367
Coconut Nursery, Serapeacewatta, Panaliya, Polgahawela
12 Diyadora 037-2282537 Coconut Nursery, Pahala Diyadora
13 Bingiriya 032-2246425 Coconut Nursery, Prasannagama, Bingiriya
14 Hettipola 037-2291332 Coconut Nursery, Hettipola
15 Kandetiya 031-2299386
Coconut Nursary, Kandetiya, Makandura, Gonewila
16 Kirimatiyana 031-2257504 Coconut Nursery, Kirimatiyana, Lunuwila
17 Wilpotha 032-5671077 Coconut Nursery, Wilpotha, Baththuluoya
18 Attawilluwa 032-5670793 Coconut Nursery, Attawilluwa, Kurunegala
19 Mademulana 047-2246359 Coconut Nursery, Madamulana, Weraetiya
20 Abilipitiya 047-2230569 Coconut Nursery, Thunkama, Abilipitiya
21 Weligama 041-2252336 Coconut Nursery, Pathegama, Weligama
22 Baddegama 091-2292745
Coconut Nursery, Pedasruwattha, Halpathota, Baddegama
23 Pallekelle 081-5748595 Coconut Nursery, Pallekelle, Balagolla, Kengalla
24 Uhana 063-2224167 Coconut Nursery, Palamkadaura, Uhana
25 Parakrama Samudraya
027-2224304
Coconut Nursery, Richard Aluwihare park, Parakrama Samudraya
26 Kalawewa 025-2264194 Coconut Nursery, Kalawewa, Wigithapura
27 Hadapanagala 055-2274665 Coconut Nursery, Hadapanagala,Weheraoya
28 Welipitiya 055-2265720 Coconut Nursery, Welipitiya Wattha, Bibila
29 Mailambaweli 065-2240924
Coconut Nursery, Mailambaweli, Kannamunei, Batticaloa
30 Labuduwa 091-2234501 Coconut Nursery, Labuduwa, Akmeemana, Galle
31 Mahayaya 031-2299938 Coconut Nursery, Makandura, Gonawila
32 Ulhitiya 066-2224230 Coconut Nursery, Ulhitiya, Giradurukotte
33 Kilinochchi Coconut Nursery, D - 03, Pannankandi,
Kilinochchi
34 Achchuwelie Coconut Nursery, Wasawilan Road , Achchuweli,
Jaffna
35 Kuburupitti Coconut Nursery, Main Road, Kuburupidi,
Trincomalee
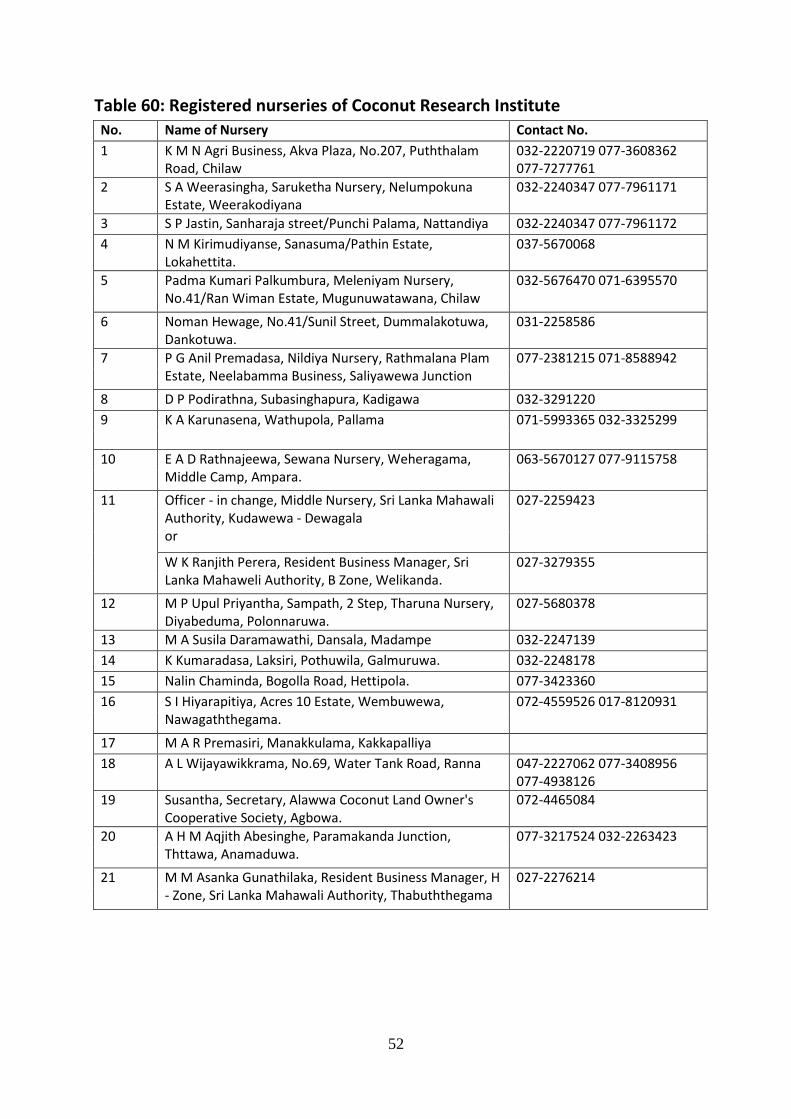
52
Table 60: Registered nurseries of Coconut Research Institute No. Name of Nursery Contact No.
1 K M N Agri Business, Akva Plaza, No.207, Puththalam Road, Chilaw
032-2220719 077-3608362 077-7277761
2 S A Weerasingha, Saruketha Nursery, Nelumpokuna Estate, Weerakodiyana
032-2240347 077-7961171
3 S P Jastin, Sanharaja street/Punchi Palama, Nattandiya 032-2240347 077-7961172
4 N M Kirimudiyanse, Sanasuma/Pathin Estate, Lokahettita.
037-5670068
5 Padma Kumari Palkumbura, Meleniyam Nursery, No.41/Ran Wiman Estate, Mugunuwatawana, Chilaw
032-5676470 071-6395570
6 Noman Hewage, No.41/Sunil Street, Dummalakotuwa, Dankotuwa.
031-2258586
7 P G Anil Premadasa, Nildiya Nursery, Rathmalana Plam Estate, Neelabamma Business, Saliyawewa Junction
077-2381215 071-8588942
8 D P Podirathna, Subasinghapura, Kadigawa 032-3291220
9 K A Karunasena, Wathupola, Pallama 071-5993365 032-3325299
10 E A D Rathnajeewa, Sewana Nursery, Weheragama, Middle Camp, Ampara.
063-5670127 077-9115758
11 Officer - in change, Middle Nursery, Sri Lanka Mahawali Authority, Kudawewa - Dewagala or
027-2259423
W K Ranjith Perera, Resident Business Manager, Sri Lanka Mahaweli Authority, B Zone, Welikanda.
027-3279355
12 M P Upul Priyantha, Sampath, 2 Step, Tharuna Nursery, Diyabeduma, Polonnaruwa.
027-5680378
13 M A Susila Daramawathi, Dansala, Madampe 032-2247139
14 K Kumaradasa, Laksiri, Pothuwila, Galmuruwa. 032-2248178
15 Nalin Chaminda, Bogolla Road, Hettipola. 077-3423360
16 S I Hiyarapitiya, Acres 10 Estate, Wembuwewa, Nawagaththegama.
072-4559526 017-8120931
17 M A R Premasiri, Manakkulama, Kakkapalliya
18 A L Wijayawikkrama, No.69, Water Tank Road, Ranna 047-2227062 077-3408956 077-4938126
19 Susantha, Secretary, Alawwa Coconut Land Owner's Cooperative Society, Agbowa.
072-4465084
20 A H M Aqjith Abesinghe, Paramakanda Junction, Thttawa, Anamaduwa.
077-3217524 032-2263423
21 M M Asanka Gunathilaka, Resident Business Manager, H - Zone, Sri Lanka Mahawali Authority, Thabuththegama
027-2276214
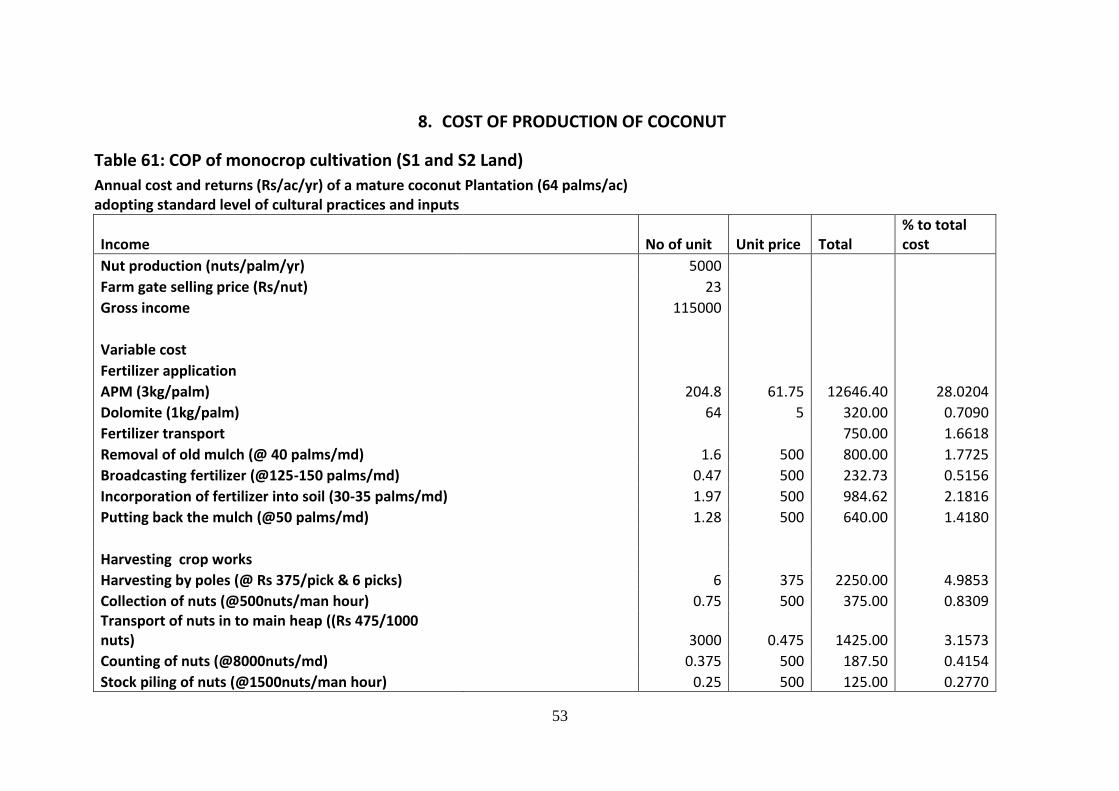
53
8. COST OF PRODUCTION OF COCONUT
Table 61: COP of monocrop cultivation (S1 and S2 Land)
Annual cost and returns (Rs/ac/yr) of a mature coconut Plantation (64 palms/ac) adopting standard level of cultural practices and inputs
Income No of unit Unit price Total % to total cost
Nut production (nuts/palm/yr)
5000
Farm gate selling price (Rs/nut)
23
Gross income
115000
Variable cost
Fertilizer application
APM (3kg/palm)
204.8 61.75 12646.40 28.0204
Dolomite (1kg/palm)
64 5 320.00 0.7090
Fertilizer transport
750.00 1.6618
Removal of old mulch (@ 40 palms/md)
1.6 500 800.00 1.7725
Broadcasting fertilizer (@125-150 palms/md)
0.47 500 232.73 0.5156
Incorporation of fertilizer into soil (30-35 palms/md)
1.97 500 984.62 2.1816
Putting back the mulch (@50 palms/md)
1.28 500 640.00 1.4180
Harvesting crop works
Harvesting by poles (@ Rs 375/pick & 6 picks)
6 375 2250.00 4.9853
Collection of nuts (@500nuts/man hour)
0.75 500 375.00 0.8309 Transport of nuts in to main heap ((Rs 475/1000 nuts)
3000 0.475 1425.00 3.1573
Counting of nuts (@8000nuts/md)
0.375 500 187.50 0.4154
Stock piling of nuts (@1500nuts/man hour)
0.25 500 125.00 0.2770
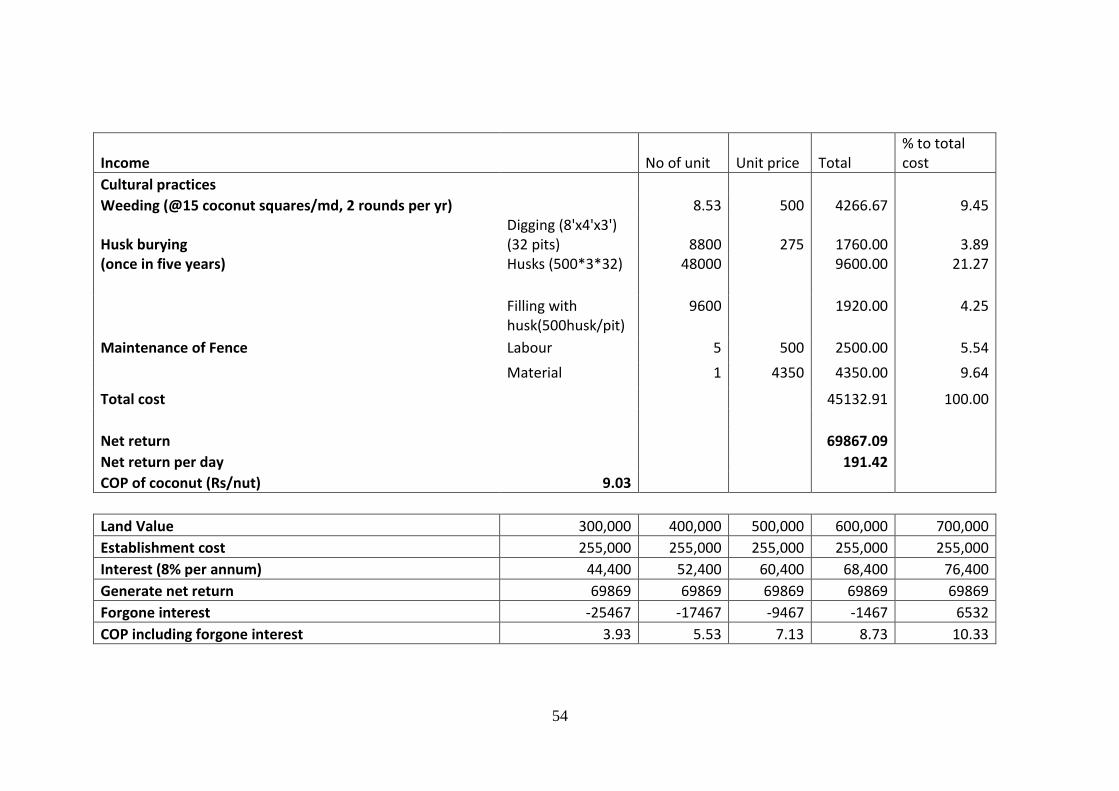
54
Income No of unit Unit price Total % to total cost
Cultural practices
Weeding (@15 coconut squares/md, 2 rounds per yr)
8.53 500 4266.67 9.45
Husk burying Digging (8'x4'x3') (32 pits) 8800 275 1760.00 3.89
(once in five years) Husks (500*3*32) 48000 9600.00 21.27
Filling with husk(500husk/pit)
9600 1920.00 4.25
Maintenance of Fence Labour 5 500 2500.00 5.54
Material 1 4350 4350.00 9.64
Total cost
45132.91 100.00
Net return
69867.09
Net return per day
191.42
COP of coconut (Rs/nut) 9.03
Land Value 300,000 400,000 500,000 600,000 700,000
Establishment cost 255,000 255,000 255,000 255,000 255,000
Interest (8% per annum) 44,400 52,400 60,400 68,400 76,400
Generate net return 69869 69869 69869 69869 69869
Forgone interest -25467 -17467 -9467 -1467 6532
COP including forgone interest 3.93 5.53 7.13 8.73 10.33

55
Land Value 800,000 900,000 1,000,000 1,100,000 1,200,000
Establishment cost 255,000 255,000 255,000 255,000 255,000
Interest (8% per annum) 84,400 92,400 100,400 108,400 116,400
Generate net return 69869 69869 69869 69869 69869
Forgone interest 14532 22532 30532 38532 46532
COP including forgone interest 11.93 13.53 15.13 16.73 18.33
Land Value 1,300,000 1,400,000 1,500,000 Establishment cost 255,000 255,000 255,000 Interest (8% per annum) 124,400 132,400 140,400 Generate net return 69869 69869 69869 Forgone interest 54532 62532 70532 COP including forgone interest 19.93 21.53 23.13
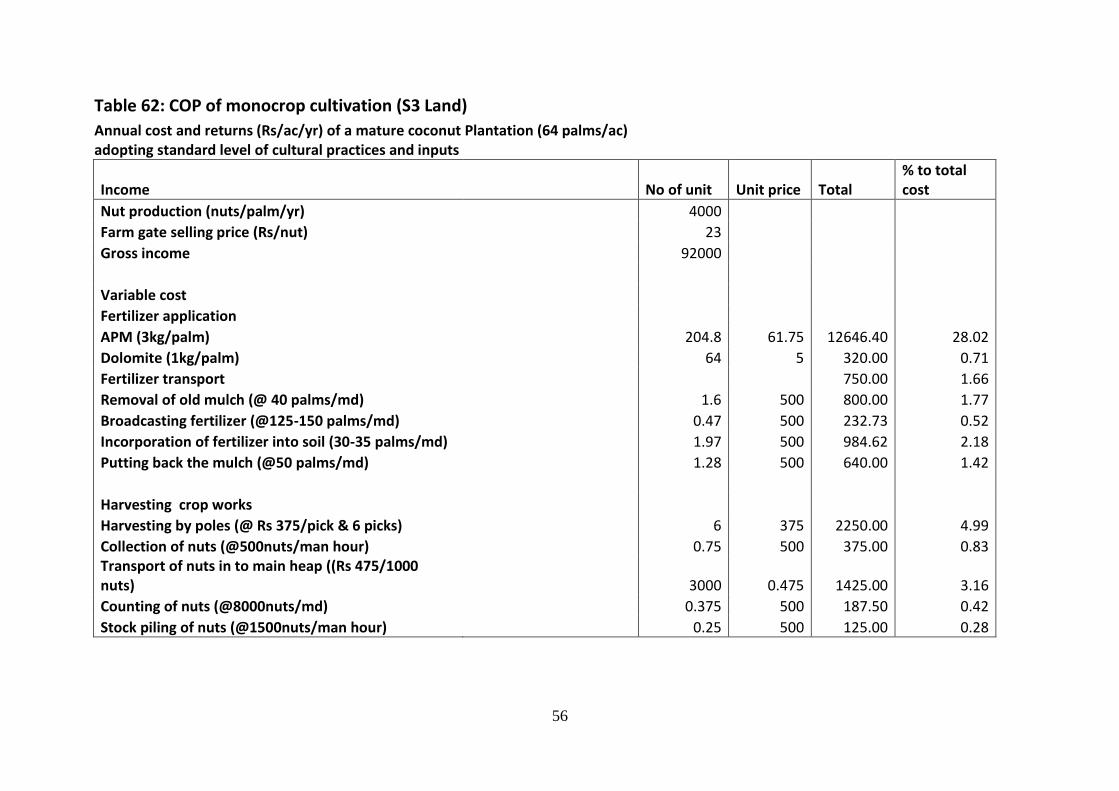
56
Table 62: COP of monocrop cultivation (S3 Land)
Annual cost and returns (Rs/ac/yr) of a mature coconut Plantation (64 palms/ac) adopting standard level of cultural practices and inputs
Income No of unit Unit price Total % to total cost
Nut production (nuts/palm/yr)
4000
Farm gate selling price (Rs/nut)
23
Gross income
92000
Variable cost
Fertilizer application
APM (3kg/palm)
204.8 61.75 12646.40 28.02
Dolomite (1kg/palm)
64 5 320.00 0.71
Fertilizer transport
750.00 1.66
Removal of old mulch (@ 40 palms/md)
1.6 500 800.00 1.77
Broadcasting fertilizer (@125-150 palms/md)
0.47 500 232.73 0.52
Incorporation of fertilizer into soil (30-35 palms/md)
1.97 500 984.62 2.18
Putting back the mulch (@50 palms/md)
1.28 500 640.00 1.42
Harvesting crop works
Harvesting by poles (@ Rs 375/pick & 6 picks)
6 375 2250.00 4.99
Collection of nuts (@500nuts/man hour)
0.75 500 375.00 0.83 Transport of nuts in to main heap ((Rs 475/1000 nuts)
3000 0.475 1425.00 3.16
Counting of nuts (@8000nuts/md)
0.375 500 187.50 0.42
Stock piling of nuts (@1500nuts/man hour)
0.25 500 125.00 0.28

57
Income No of unit Unit price Total % to total cost
Cultural practices
Weeding (@15 coconut squares/md, 2 rounds per yr)
8.53 500 4266.67 9.45
Husk burying Digging (8'x4'x3') (32 pits) 8800 275 1760.00 3.89
(once in five years) Husks (500*3*32) 48000 9600.00 21.27
Filling with husk(500husk/pit)
9600 1920.00 4.25
Maintenance of Fence Labour 5 500 2500.00 5.54
Material 1 4350 4350.00 9.64
Total cost
45132.91 100.00
Net return
46867.09
Net return per day
128.09
COP of coconut (Rs/nut) 11.28
Land Value 300,000 400,000 500,000 600,000 700,000
Establishment cost 255,000 255,000 255,000 255,000 255,000
Interest (8% per annum) 44,400 52,400 60,400 68,400 76,400
Generate net return 46,867 46,867 46,867 46,867 46,867
Forgone interest -2,467 5,532 13,532 21,532 29,532
COP including forgone interest 10.67 12.67 14.67 16.67 18.67
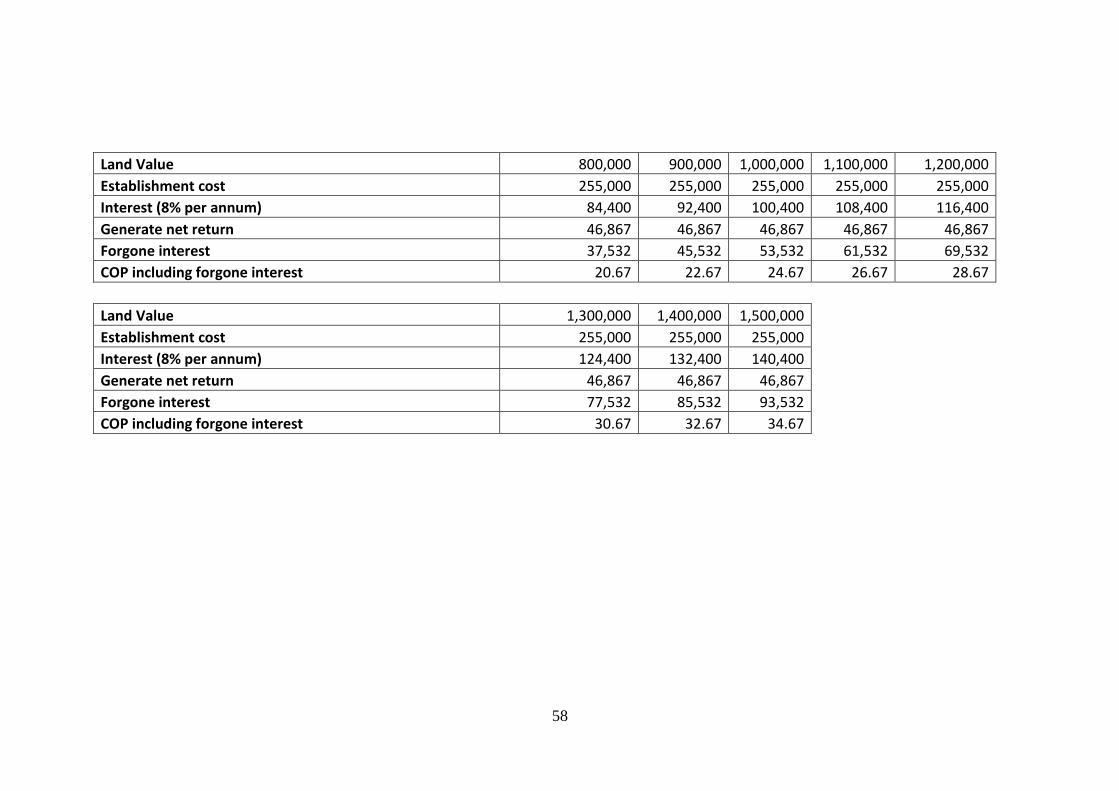
58
Land Value 800,000 900,000 1,000,000 1,100,000 1,200,000
Establishment cost 255,000 255,000 255,000 255,000 255,000
Interest (8% per annum) 84,400 92,400 100,400 108,400 116,400
Generate net return 46,867 46,867 46,867 46,867 46,867
Forgone interest 37,532 45,532 53,532 61,532 69,532
COP including forgone interest 20.67 22.67 24.67 26.67 28.67
Land Value 1,300,000 1,400,000 1,500,000 Establishment cost 255,000 255,000 255,000 Interest (8% per annum) 124,400 132,400 140,400 Generate net return 46,867 46,867 46,867 Forgone interest 77,532 85,532 93,532 COP including forgone interest 30.67 32.67 34.67

59
Table 63: COP of monocrop cultivation (S4 Land)
Annual cost and returns (Rs/ac/yr) of a mature coconut Plantation (64 palms/ac) adopting standard level of cultural practices and inputs
Income No of unit Unit price Total % to total cost
Nut production (nuts/palm/yr)
2500
Farm gate selling price (Rs/nut)
23
Gross income
57500
Variable cost
Fertilizer application
APM (3kg/palm)
204.8 61.75 12646.40 28.02
Dolomite (1kg/palm)
64 5 320.00 0.71
Fertilizer transport
750.00 1.66
Removal of old mulch (@ 40 palms/md)
1.6 500 800.00 1.77
Broadcasting fertilizer (@125-150 palms/md)
0.47 500 232.73 0.52
Incorporation of fertilizer into soil (30-35 palms/md)
1.97 500 984.62 2.18
Putting back the mulch (@50 palms/md)
1.28 500 640.00 1.42
Harvesting crop works
Harvesting by poles (@ Rs 375/pick & 6 picks)
6 375 2250.00 4.99
Collection of nuts (@500nuts/man hour)
0.75 500 375.00 0.83 Transport of nuts in to main heap ((Rs 475/1000 nuts)
3000 0.475 1425.00 3.16
Counting of nuts (@8000nuts/md)
0.375 500 187.50 0.42
Stock piling of nuts (@1500nuts/man hour)
0.25 500 125.00 0.28
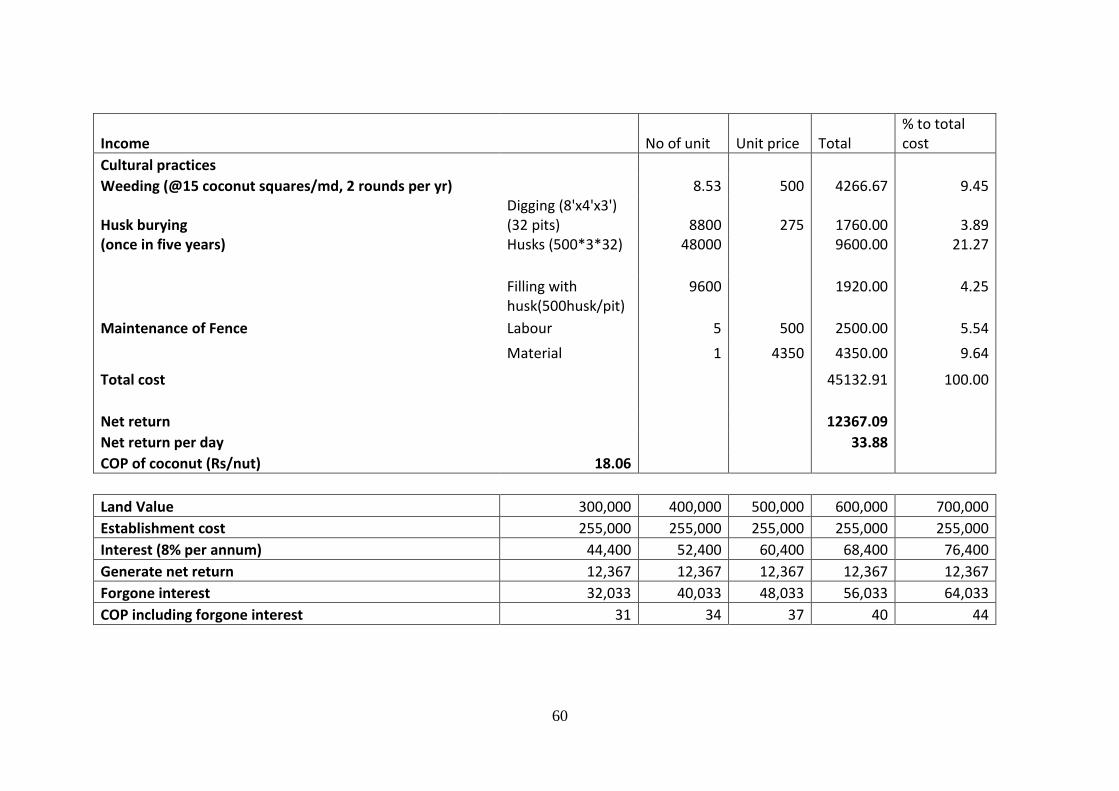
60
Income No of unit Unit price Total % to total cost
Cultural practices Weeding (@15 coconut squares/md, 2 rounds per yr)
8.53 500 4266.67 9.45
Husk burying Digging (8'x4'x3') (32 pits) 8800 275 1760.00 3.89
(once in five years) Husks (500*3*32) 48000 9600.00 21.27
Filling with husk(500husk/pit)
9600 1920.00 4.25
Maintenance of Fence Labour 5 500 2500.00 5.54
Material 1 4350 4350.00 9.64
Total cost
45132.91 100.00
Net return
12367.09 Net return per day
33.88
COP of coconut (Rs/nut) 18.06
Land Value 300,000 400,000 500,000 600,000 700,000
Establishment cost 255,000 255,000 255,000 255,000 255,000
Interest (8% per annum) 44,400 52,400 60,400 68,400 76,400
Generate net return 12,367 12,367 12,367 12,367 12,367
Forgone interest 32,033 40,033 48,033 56,033 64,033
COP including forgone interest 31 34 37 40 44
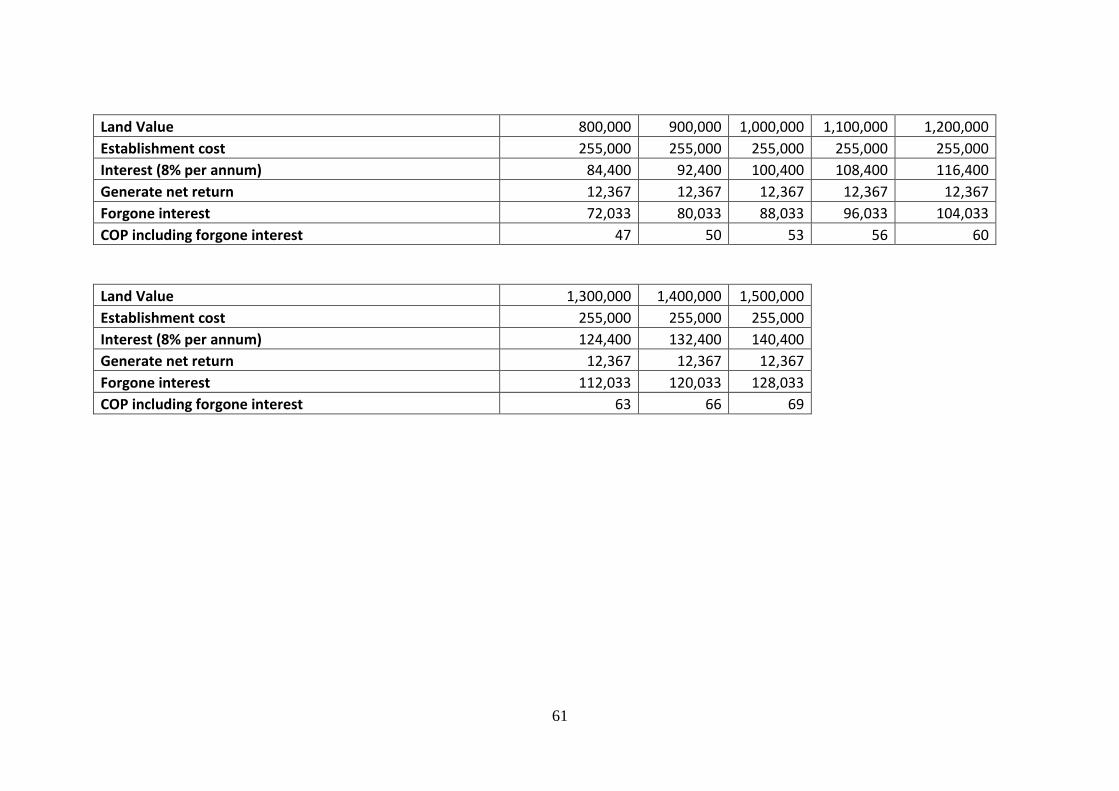
61
Land Value 800,000 900,000 1,000,000 1,100,000 1,200,000
Establishment cost 255,000 255,000 255,000 255,000 255,000
Interest (8% per annum) 84,400 92,400 100,400 108,400 116,400
Generate net return 12,367 12,367 12,367 12,367 12,367
Forgone interest 72,033 80,033 88,033 96,033 104,033
COP including forgone interest 47 50 53 56 60
Land Value 1,300,000 1,400,000 1,500,000 Establishment cost 255,000 255,000 255,000 Interest (8% per annum) 124,400 132,400 140,400 Generate net return 12,367 12,367 12,367 Forgone interest 112,033 120,033 128,033 COP including forgone interest 63 66 69

62


