Embed Size (px)
Citation preview
heritage
Article
Contemporary Landscape Structure withinMonumental Zone-1 at Bagan Cultural HeritageSite, Myanmar
Min Zar Ni Aung *,† and Shozo Shibata †
Laboratory of Landscape Architecture, Division of Forest and Biomaterials Science, Graduate School ofAgriculture, Kyoto University, Kyoto 606-8502, Japan; [email protected]* Correspondence: [email protected]† These authors contributed equally to this work.
Received: 21 May 2019; Accepted: 21 June 2019; Published: 25 June 2019�����������������
Abstract: This study examines the contemporary landscape structure of the Monumental Zone(MZ)-1 at the Bagan Cultural Heritage Site in the Dry Zone of Myanmar. With respect to hundredsof medieval monuments, how local residents in the residential areas within the MZ-1 manage thelandscape was the focus of the current study, conducted with two objectives: (1) Identifying landcovers as features of the contemporary landscape on the basis of land use and (2) evaluating howthe features interrelate. The landscape features were identified by the analysis of Landsat 8 satelliteimagery, followed by variance analysis for comparison of the features’ areas, and interrelationships offeatures were evaluated by multivariate analysis. Vegetated features were identified in coexistencewith non-vegetated ones, while crop coverage and non-vegetated features were smaller than thearea of the other two vegetated features. Semi-natural woody vegetation was found in proximityto monuments and was dependent on the occurrence of the shrub-prone patch that, in turn, wastriggered by the expansion of exposed land containing a large segment of cultivatable area. Thecurrent study suggests the need to prioritise timely land use and management, focusing on localagricultural activity for safeguarding the heritage as well as the historical settings.
Keywords: Bagan; Myanmar; monument; cultural heritage; landscape features and structure;unmanaged vegetated cover; anthropogenic artefacts; agricultural land
1. Introduction
Landscape, at a given spatial scale, fundamentally represents a heterogeneous composition ofbiophysical, social, and cultural objects developed by natural means and/or human interventions onthe earth’s surface [1,2]. These objects in a landscape scale can be seen as various landforms, vegetationpatches, water bodies, settlement areas, roads, etc., and are referred to as land covers or features [3,4].The features in spatial configuration make up the landscape structure [1,5], giving an identity to thelandscape that can possess a distinctive appearance, in contrast to the surroundings [6]. Nevertheless,the natural pressure, including storm, flood, fire, earthquake, and/or anthropogenic land use andmanagement, are all drivers that modify the landscape and make it unstable [6,7].
Modification of the landscape by humans has been rather significant across the globe, and, inconsequence, it yields an impact on the landscape structure as well as on the interaction betweenlandscape features [8]. However, research on the ecological aspects of landscape is very limited intropical Asia [9]. The current study is a preliminary effort to develop deeper knowledge of ecosystemservices and management through safeguarding the cultural heritage at the Dry Zone of Myanmar.
The Bagan Cultural Heritage Site (BCHS) is home to 3822 medieval-aged Buddhistmonuments—stupas (solid-type pyramidal structures), temples, and monasteries [10–13]. The entire
Heritage 2019, 2, 1748–1761; doi:10.3390/heritage2020107 www.mdpi.com/journal/heritage

Heritage 2019, 2 1749
stretch of the BCHS is 22,809.85 ha, composed of eight monumental zones (MZ), together with othercomponents, and it expands over the eastern and western banks of the Ayeyarwady River [14]. TheMZ is defined by the presence of monuments within a designated area and, of the eight zones, theMZ-1 accounts for more than 2000 monuments [15–17].
The presence of more than 50% of the region’s total monuments makes the MZ-1 a uniquelandscape. The monuments were built during the 11–13th centuries [18] by early settlers in the Baganarea, and such activities are regarded as attempts to transform the terrain into a cultural landscape [19].In the present era, there are seven residential areas in the MZ-1, and agricultural lands managed by theresidents in the environs of the monuments endow the zone with a living landscape. This study’s focus,therefore, centres on how residents in those areas manage the landscape with respect to the hundreds ofmonuments as safeguarding measures for tangible and intangible cultural heritage. Agricultural landmanagement, in explicit postulation, is a trigger of impacts on the environmental setting of the heritagesite; therefore, management-related data to date are a prerequisite for long-term analytical studies.
Within the Dry Zone of Myanmar, people’s livelihoods are primarily dependent on agriculture,with 57% of the land altered through cultivation [20]. Nevertheless, global climate change has alsoaffected agricultural production for people in the dry zone, due to irregular rainfall [21,22]. Moreover,experiencing life in the Dry Zone, the MZ-1 settlers have experienced the ripple effects of the adverseclimate on their agricultural activities. If crop production declines, the land used for cultivation bylocal farmers is likely to be minimized. Reducing cultivated land implies shrinking crop cover in oneword, and expanding weedy cover and/ or shrub on the agricultural land in other words. The currentconditions of agricultural land use might have created some distinctive characteristics regardinglandscape features at the MZ-1. The speculation, therefore, was a matter of the analytical study oncontemporary landscape structure, based on two specific objectives: (1) To identify landscape featuresas land cover on the basis of land use, and (2) to evaluate the interrelationship of features at the MZ-1in terms of spatial coverage.
The status of features, as well as land use impacts, was first assessed by satellite image analysis,and, second, the interdependence among the features was evaluated by multivariate analysis. The studyshed light on vegetated and non-vegetated features as a primary structure of the landscape of the MZ-1,reflecting four major components in coexistence—“unmanaged vegetated cover”, “anthropogenicartefacts”, “agricultural land”, and “reservoir”. The results of the current study stress the important roleof site management, explicitly, agricultural land, due to massive expansion of unmanaged vegetatedcover in landscape scale. Regarding well-rooted conservation and preservation measures for themonuments and the site, the study suggests the vegetation in the zone to be under management forstrengthening integrity of the cultural landscape.
2. Materials and Methods
2.1. Study Site
The study site for this research was the MZ- 1 in the BCHS, which extends 21.10093–21.19742 N,94.84953–94.91978 E in the central Dry Zone of Myanmar (Figure 1). Among the eight MZs of theBCHS, the MZ-1 stands apart as the largest repository of more than half of the total monuments of theBCHS, on its expansion to 4164 ha. The MZ-1 occupies 18% of the land surface in the BCHS, while theother 7 MZs, 2 urban areas (Nyaung-U and New Bagan or Myo-thit), 37 villages, and the buffer zonesaccount for 82%. The topography of the MZ-1 characterizes massive stretches of level terrain, despitethe presence of a few depressions for reservoirs.
At the study site, six villages are composed of four village-tracts, comprising “Bwasaw”, “MinNan Thu”, “Taungbi-Leya” and “Myinkaba” in Nyaung-U Town, and one ward in New Bagan Town.According to the National Population and Housing Census of Myanmar (2014) [23], the total numberof residents of these areas is 15,706, contributing to 8% of the Nyaung-U Township population. Theresidents’ primary source of income is through farming, whereas crafts, tourism-related businesses,

Heritage 2019, 2 1750
and seasonal labour supplement their earnings. Being situated in the drier part of Myanmar, where thescant annual rainfall rarely exceeds 1000 mm [24], the land in the MZ-1 primarily favours production ofoil-seed crops and pulses. The farmlands for these crops spread mainly in the environs of monuments,coexisting with semi-arid vegetation.
Heritage 2019, 2 FOR PEER REVIEW 3
residents’ primary source of income is through farming, whereas crafts, tourism-related businesses, and seasonal labour supplement their earnings. Being situated in the drier part of Myanmar, where the scant annual rainfall rarely exceeds 1000 mm [24], the land in the MZ-1 primarily favours production of oil-seed crops and pulses. The farmlands for these crops spread mainly in the environs of monuments, coexisting with semi-arid vegetation.
Figure 1. Location of Monumental Zone (MZ)-1, Bagan Cultural Heritage Site (BCHS) at central Dry Zone of Myanmar. Source [14,25].
2.2. Field Survey
Two field surveys were performed for spatial knowledge of the study site: The first in August– September of the rainy season in 2017 and again in 2018. Across the MZ-1, geolocations of zone boundary, monuments, fields covered with crops and shrubs, ploughed and/or exposed lands, patches of semi-natural woody vegetation (woods that have not been planted, but occur due to human interference), roads, settlements, and reservoirs were recorded with a handheld Global Positioning System (GPS) (Oregon® 700, Garmin). The locations of the monuments were crosschecked with the inventory list developed by Pichard (1992–1995) [12]. During the field surveys, monuments in inaccessible locations were assessed by satellite image (2 m resolution) from Google Earth (CNES/ Airbus, 2018), and points for 2348 monuments and unexcavated mounds were recorded within the MZ-1 (Figure 1).
2.3. Image Processing
Multiband satellite images from Landsat 8 (Optimal Land Image (OLI), 8 Bands, 30 m resolution) were acquired for 28 September, 2018, in cloud free conditions, from the United States Geological Survey (USGS) [26]. Although September is late in the rainy season within the Dry Zone of Myanmar, farmers generally maintain a cover for the cultivatable land with crops and vegetation, and cover can also be of good foliage mass. The image (Landsat scene ID: LC81340452018271LGN00) covered the
Figure 1. Location of Monumental Zone (MZ)-1, Bagan Cultural Heritage Site (BCHS) at central DryZone of Myanmar. Source [14,25].
2.2. Field Survey
Two field surveys were performed for spatial knowledge of the study site: The first in August–September of the rainy season in 2017 and again in 2018. Across the MZ-1, geolocations of zoneboundary, monuments, fields covered with crops and shrubs, ploughed and/or exposed lands, patchesof semi-natural woody vegetation (woods that have not been planted, but occur due to humaninterference), roads, settlements, and reservoirs were recorded with a handheld Global PositioningSystem (GPS) (Oregon®700, Garmin). The locations of the monuments were crosschecked withthe inventory list developed by Pichard (1992–1995) [12]. During the field surveys, monuments ininaccessible locations were assessed by satellite image (2 m resolution) from Google Earth (CNES/
Airbus, 2018), and points for 2348 monuments and unexcavated mounds were recorded within theMZ-1 (Figure 1).
2.3. Image Processing
Multiband satellite images from Landsat 8 (Optimal Land Image (OLI), 8 Bands, 30 m resolution)were acquired for 28 September, 2018, in cloud free conditions, from the United States Geological Survey(USGS) [26]. Although September is late in the rainy season within the Dry Zone of Myanmar, farmersgenerally maintain a cover for the cultivatable land with crops and vegetation, and cover can also be ofgood foliage mass. The image (Landsat scene ID: LC81340452018271LGN00) covered the overall extent(upper left corner, 22.72132 N, 93.61154 E; upper right corner, 22.69764 N, 95.81883 E; lower left corner,20.62895 N, 93.60277 E; lower right corner, 20.60766 N, 95.77850 E) of the site integrated into the study.
Heritage 2019, 2 1751
The images were pre-processed by raster clipping into the MZ-1, followed by generating reflectanceimages using Bands 2, 3, 4, 5, 6, and 7 in a semi-automatic classification plugin (SCP, version 6.2.7Greenbelt) of the Quantum Geographic Information System (QGIS 3.4.2). Pan-sharpening of the image,using Bands 2, 3, 4 and 8, was also processed for reference images in accuracy checks after land coverclassifications. A pan-chromatic image of Landsat 8, 15 m resolution (Band 8), was blended with theother three bands, and the pan-sharpened image generated was of high resolution (15 m).
Bands of the reflectance images were computed for the Modified Soil Adjusted Vegetation Index(MSAVI) as follows: MSAVI = {(NIR − RED)/ (NIR + RED + L)} × (1 + L), where NIR and RED ofthe images are near infrared (Band 5) and red (Band 4), respectively [27]. The “L” represents the soiladjustment factor equal to 0.5, fit for the broad range of vegetation cover, and was used in computationto suppress interference of background soil reflectance, due to sparse vegetation density at the studysite [28]. The MSAVI, therefore, was applied to improve the surface reflectance of vegetation coverwhere it existed across the MZ-1, while reducing soil influence on the index value.
For the presence of residential areas, monuments, and paved roads as built-up features at thestudy site, image interpretation with MSAVI alone was doubtful in displaying all land covers. In thisregard, the image was further analysed with the Normalized Difference Built-up Index (NDBI): NDBI= {(SWIR − NIR) / (SWIR + NIR)} [29], where SWIR is short-wave infrared-1 (Band 6). The vegetationindex (MSAVI) was subtracted from the NDBI to delineate the built-up features that suppress thevegetation influence in this study. As described by Zha et al. (2003) [29], the ploughed and/or exposedland, which is part of the agricultural land and will be termed “exposed land” henceforth, displayedpositive value, similar to that of the built-up features. In addition, water features were interpreted witha Normalized Difference Water Index (NDWI): NDWI = (Green − SWIR) / (Green + SWIR) [30], wheregreen is Band 3. The image assessed with NDWI enhanced water surfaces in order to differentiate themfrom other land covers. When compared with the image of MSAVI and checked against ground-truthrecords, the features interpreted with NDBI and NDWI were found to be the same as those displayedwith MSAVI.
Following the image interpretation with the indices, the land covers and features were classified,using the supervised classification by the SCP, according to Congedo (2016) [31]. The algorithmgenerated a representation of the maximum likelihood of the total features by segmenting them intoclasses via computing pixel similarity [32]. Once classified, the features were checked for accuracy bymeans of an error (fusion) matrix with randomly selected polygons (pixels) for respective featuresfrom the pan-sharpened reference image (15 m resolution). The polygons for the feature ranged from20–120, and, before accuracy assessment, they were checked against field-recorded GPS points in a2-m resolution Google Earth map (CNES/Airbus, 2018). The smaller number of polygons than thoserepresenting the other features were water and cultivated field, the former of which will be termed“reservoir” and the latter considered “crop field”, hereafter. Land use for each feature was furtheranalysed, following an accuracy check.
In order to evaluate the interrelationships of each feature with the others and as a crosscheck forthe accuracy of classification, pixels of respective features were counted manually in a 30 m resolutionLandsat 8 multiband image. The pixels were marked with regular points of 50 m distance so that twoadjacent pixels accounted for corresponding features. For precision of counting, grids were applied tothe image, and the size of each grid cell was 1 km2. Within each grid, 400 points marked the pixels,and 8562 pixel counts of the six features were accessed in 30 grid cells that completely and maximallyoverlaid the image. Some grids at the boundary of the image did not encompass the marked pointscompletely, thus, the points in these parts gave no account. In this case, locations of monumentsdigitized as point data were also added to the image, and many points of the monuments fitted to thepixels were counted. As an estimate of area for each feature, the extracted pixel was multiplied byits area (900 m2) [33]; the data were then applied to verify the tendency of land use for each featuregenerated by supervised classification.

Heritage 2019, 2 1752
2.4. Data Analysis
The calculated pixel areas of the six features were assessed for analysis of variance (ANOVA) withDuncan’s Multiple Range Test (DMRT) at a significant level (α = 0.05). The point-data of the featurescounted, including the monument, were processed for multivariate analysis (principal componentanalysis {PCA}). The statistical analyses were implemented by SAS University Edition.
3. Results
3.1. Landscape Features and Land Use
The contemporary landscape of the MZ-1 was interpreted by five index ranges of MSAVI (Figure 2)into two major types of land cover or feature: Vegetated and non-vegetated. The vegetated coversdepicted the index values in descending order, from 0.662 to 0.272, and represented crop fields,semi-natural woody vegetation, and shrub-prone patches. The non-vegetated covers ranged from0.246 to −0.223 and included built-up area, exposed land surface, and water.
The crop fields were found under coverage of oil-seed crops, pulses, and sorghum, which reflectedhigh indices, between 0.558 and 0.662. The semi-natural woody vegetation consisted predominantly ofxeromorphic thorny plants, and it indexed between 0.350 and 0.532. Nevertheless, a patch of broadleafwoody plants in the “Lawka Nanda” Wildlife Sanctuary responded with similar indices to the cropfield. Shrub-prone patches characterized the lands where crop cultivation was practised in previousyears, but they still represent part of agricultural land. This feature ranged between 0.272 and 0.324among the indices of vegetated covers.
Heritage 2019, 2 FOR PEER REVIEW 5
2.4. Data Analysis
The calculated pixel areas of the six features were assessed for analysis of variance (ANOVA) with Duncan’s Multiple Range Test (DMRT) at a significant level (α = 0.05). The point-data of the features counted, including the monument, were processed for multivariate analysis (principal component analysis {PCA}). The statistical analyses were implemented by SAS University Edition.
3. Results
3.1. Landscape Features and Land Use
The contemporary landscape of the MZ-1 was interpreted by five index ranges of MSAVI (Figure 2) into two major types of land cover or feature: Vegetated and non-vegetated. The vegetated covers depicted the index values in descending order, from 0.662 to 0.272, and represented crop fields, semi-natural woody vegetation, and shrub-prone patches. The non-vegetated covers ranged from 0.246 to –0.223 and included built-up area, exposed land surface, and water.
The crop fields were found under coverage of oil-seed crops, pulses, and sorghum, which reflected high indices, between 0.558 and 0.662. The semi-natural woody vegetation consisted predominantly of xeromorphic thorny plants, and it indexed between 0.350 and 0.532. Nevertheless, a patch of broadleaf woody plants in the “Lawka Nanda” Wildlife Sanctuary responded with similar indices to the crop field. Shrub-prone patches characterized the lands where crop cultivation was practised in previous years, but they still represent part of agricultural land. This feature ranged between 0.272 and 0.324 among the indices of vegetated covers.
Figure 2. Landscape features (land covers) of the Monumental Zone-1 in the Bagan Cultural HeritageSite. Features interpreted with the Modified Soil Adjusted Vegetation Index (MSAVI) by five indexranges. The index range, 0.350 to 0.662, represents vegetated cover, and −0.223 to 0.324 reflectsnon-vegetated cover. Source [26].
Heritage 2019, 2 1753
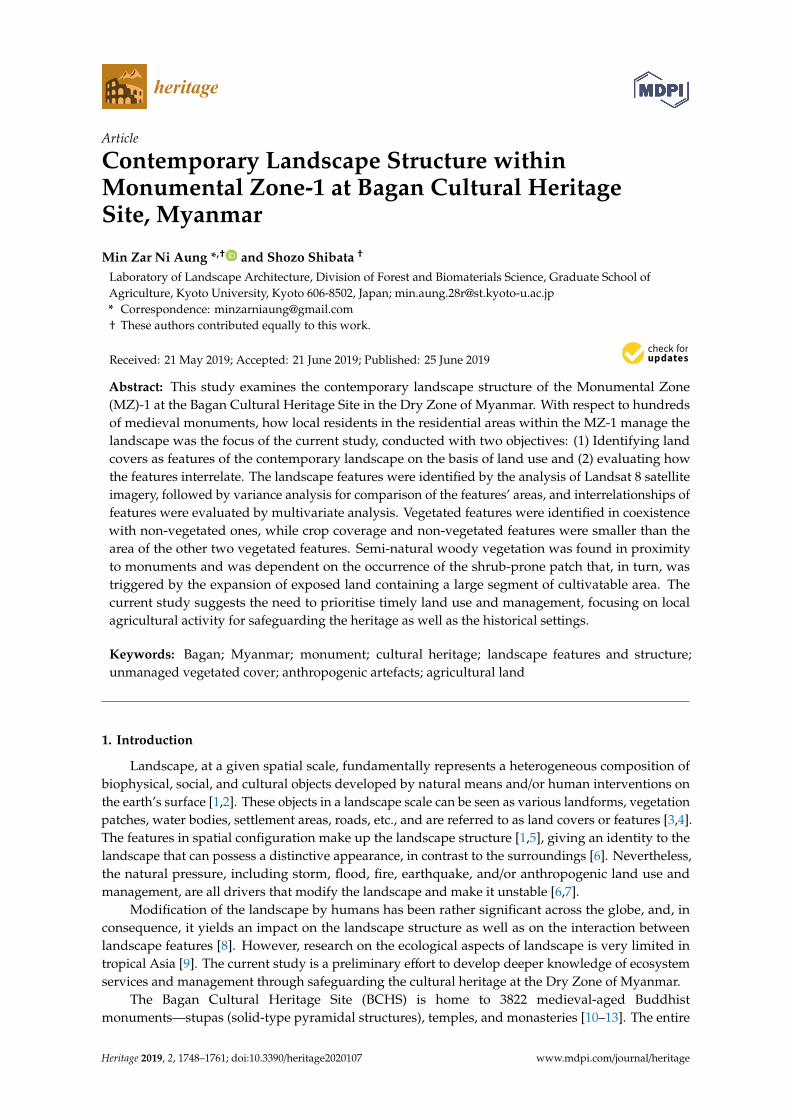
The interpretations of landscape features did present some ambiguities. In fact, the buildings inthe villages resembled exposed land surfaces, possibly for their closeness of indices. Irrespective of thevillage area, these two features are supposed to be homogeneous (Figure 2); therefore, the built-upfeatures were further assessed with NDBI (Figure 3). However, the built-up area was indistinguishablefrom the exposed lands in the range of NDBI, 0.322 to 0.234, while other features were suppressed.Paved roads as built-up structures were not supported by the NDBI, and they were seen instead underthe influence of semi-natural woody and shrub-prone features (Figure 2). Similarly, monuments werenot sharply interpreted by the NBDI in the study. Thus, cautious interpretation here was applied,based on local knowledge in order to discriminate the features correctly. The water reflected from nearzero to negative MSAVI (0.037 to −0.223); therefore the existence of water was affirmed in the zonewith NDWI, ranging from 0.334 to 0.943 in which other features were not recognized (Figure 4).
Heritage 2019, 2 FOR PEER REVIEW 6
Figure 2. Landscape features (land covers) of the Monumental Zone-1 in the Bagan Cultural Heritage Site. Features interpreted with the Modified Soil Adjusted Vegetation Index (MSAVI) by five index ranges. The index range, 0.350 to 0.662, represents vegetated cover, and –0.223 to 0.324 reflects non-vegetated cover. Source [26].
The interpretations of landscape features did present some ambiguities. In fact, the buildings in the villages resembled exposed land surfaces, possibly for their closeness of indices. Irrespective of the village area, these two features are supposed to be homogeneous (Figure 2); therefore, the built-up features were further assessed with NDBI (Figure 3). However, the built-up area was indistinguishable from the exposed lands in the range of NDBI, 0.322 to 0.234, while other features were suppressed. Paved roads as built-up structures were not supported by the NDBI, and they were seen instead under the influence of semi-natural woody and shrub-prone features (Figure 2). Similarly, monuments were not sharply interpreted by the NBDI in the study. Thus, cautious interpretation here was applied, based on local knowledge in order to discriminate the features correctly. The water reflected from near zero to negative MSAVI (0.037 to –0.223); therefore the existence of water was affirmed in the zone with NDWI, ranging from 0.334 to 0.943 in which other features were not recognized (Figure 4).
Figure 3. Buildings in the villages of the Monumental Zone-1 interpreted with Normalized Difference Built-up Index (NDBI) (–0.322 to 0.234), in contrast with non-built-up features (–1.0 to –0.364). Residences in the villages resemble exposed lands across the zone, and some are influenced by vegetated features. Source [26].
Figure 3. Buildings in the villages of the Monumental Zone-1 interpreted with Normalized DifferenceBuilt-up Index (NDBI) (−0.322 to 0.234), in contrast with non-built-up features (−1.0 to −0.364).Residences in the villages resemble exposed lands across the zone, and some are influenced byvegetated features. Source [26].

Heritage 2019, 2 1754
Heritage 2019, 2 FOR PEER REVIEW 7
Figure 4. Water surfaces at the Monumental Zone-1 interpreted with Normalized Difference Water Index (NDWI) (0.334–0.943), contrasting non-water features of NDWI 0.029 and –0.580. Source [26].
The index-based interpretation was followed by supervised classification with SCP to evaluate landscape features and land use. As a result, six features were classified as land cover, with an overall accuracy of 82% (Kappa index 0.8), and, in addition, built-up features were distinguished from exposed land in another four (Table 1). The features were as accurate as 71.6–100% in terms of producer accuracy and 69.4–100% according to user accuracy. The Kappa indices for the agreement between producer and user ranged from 0.64 to 1, indicating that the features were classified with high accuracy. Of the six land covers, only the built-up features were around 70% accuracy in each case, with a Kappa index of 0.64, while the other five were accurate by above 70%.
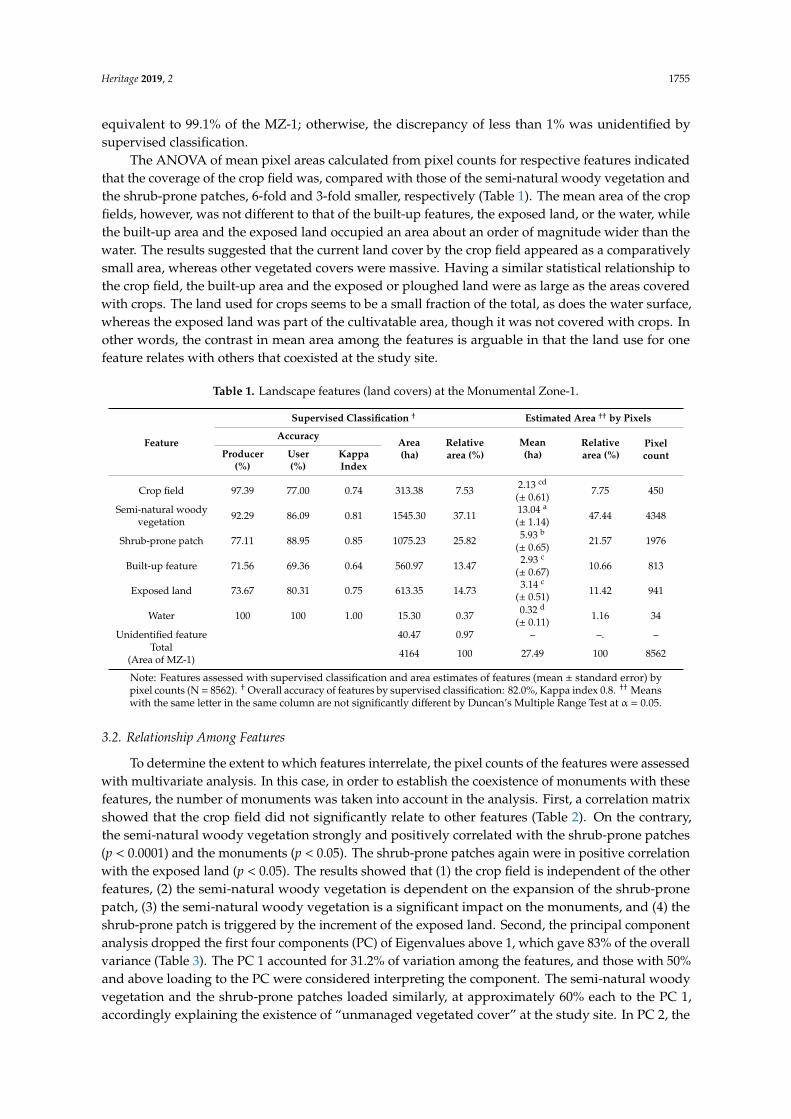
The land use for the crop field was found to account for 7.5% in terms of relative area, whereas those for the semi-natural woody vegetation and the shrub-prone patches were 37.1% and 25.8%, respectively (see Table 1). These three features representing vegetated cover occupied 2933.91 ha, or 70.5% of the MZ-1. In other words, proportions of the built-up features, the exposed land, and the water were 13.5%, 14.7%, and 0.4%, respectively, which make up 28.6% of the non-vegetated area, or 1189.62 ha. The data in such circumstances showed that a small proportion of land was used for cultivated crops, while there were about 2–5 times larger land parcels covered by the other features, exempting water. The overall area covered by the six features accounted for 4123.53 ha, equivalent to 99.1% of the MZ-1; otherwise, the discrepancy of less than 1% was unidentified by supervised classification.
Figure 4. Water surfaces at the Monumental Zone-1 interpreted with Normalized Difference WaterIndex (NDWI) (0.334–0.943), contrasting non-water features of NDWI 0.029 and −0.580. Source [26].
The index-based interpretation was followed by supervised classification with SCP to evaluatelandscape features and land use. As a result, six features were classified as land cover, with an overallaccuracy of 82% (Kappa index 0.8), and, in addition, built-up features were distinguished from exposedland in another four (Table 1). The features were as accurate as 71.6–100% in terms of producer accuracyand 69.4–100% according to user accuracy. The Kappa indices for the agreement between producerand user ranged from 0.64 to 1, indicating that the features were classified with high accuracy. Of thesix land covers, only the built-up features were around 70% accuracy in each case, with a Kappa indexof 0.64, while the other five were accurate by above 70%.
The land use for the crop field was found to account for 7.5% in terms of relative area, whereasthose for the semi-natural woody vegetation and the shrub-prone patches were 37.1% and 25.8%,respectively (see Table 1). These three features representing vegetated cover occupied 2933.91 ha,or 70.5% of the MZ-1. In other words, proportions of the built-up features, the exposed land, andthe water were 13.5%, 14.7%, and 0.4%, respectively, which make up 28.6% of the non-vegetatedarea, or 1189.62 ha. The data in such circumstances showed that a small proportion of land wasused for cultivated crops, while there were about 2–5 times larger land parcels covered by the otherfeatures, exempting water. The overall area covered by the six features accounted for 4123.53 ha,
Heritage 2019, 2 1755
equivalent to 99.1% of the MZ-1; otherwise, the discrepancy of less than 1% was unidentified bysupervised classification.
The ANOVA of mean pixel areas calculated from pixel counts for respective features indicatedthat the coverage of the crop field was, compared with those of the semi-natural woody vegetation andthe shrub-prone patches, 6-fold and 3-fold smaller, respectively (Table 1). The mean area of the cropfields, however, was not different to that of the built-up features, the exposed land, or the water, whilethe built-up area and the exposed land occupied an area about an order of magnitude wider than thewater. The results suggested that the current land cover by the crop field appeared as a comparativelysmall area, whereas other vegetated covers were massive. Having a similar statistical relationship tothe crop field, the built-up area and the exposed or ploughed land were as large as the areas coveredwith crops. The land used for crops seems to be a small fraction of the total, as does the water surface,whereas the exposed land was part of the cultivatable area, though it was not covered with crops. Inother words, the contrast in mean area among the features is arguable in that the land use for onefeature relates with others that coexisted at the study site.
Table 1. Landscape features (land covers) at the Monumental Zone-1.
Feature
Supervised Classification † Estimated Area †† by Pixels
AccuracyArea(ha)
Relativearea (%)
Mean(ha)
Relativearea (%)
PixelcountProducer
(%)User(%)
KappaIndex
Crop field 97.39 77.00 0.74 313.38 7.53 2.13 cd
(± 0.61)7.75 450
Semi-natural woodyvegetation 92.29 86.09 0.81 1545.30 37.11 13.04 a
(± 1.14) 47.44 4348
Shrub-prone patch 77.11 88.95 0.85 1075.23 25.82 5.93 b
(± 0.65)21.57 1976
Built-up feature 71.56 69.36 0.64 560.97 13.47 2.93 c
(± 0.67) 10.66 813
Exposed land 73.67 80.31 0.75 613.35 14.73 3.14 c
(± 0.51) 11.42 941
Water 100 100 1.00 15.30 0.37 0.32 d
(± 0.11)1.16 34
Unidentified feature 40.47 0.97 – –. –Total
(Area of MZ-1) 4164 100 27.49 100 8562
Note: Features assessed with supervised classification and area estimates of features (mean ± standard error) bypixel counts (N = 8562). † Overall accuracy of features by supervised classification: 82.0%, Kappa index 0.8. †† Meanswith the same letter in the same column are not significantly different by Duncan’s Multiple Range Test at α = 0.05.
3.2. Relationship Among Features
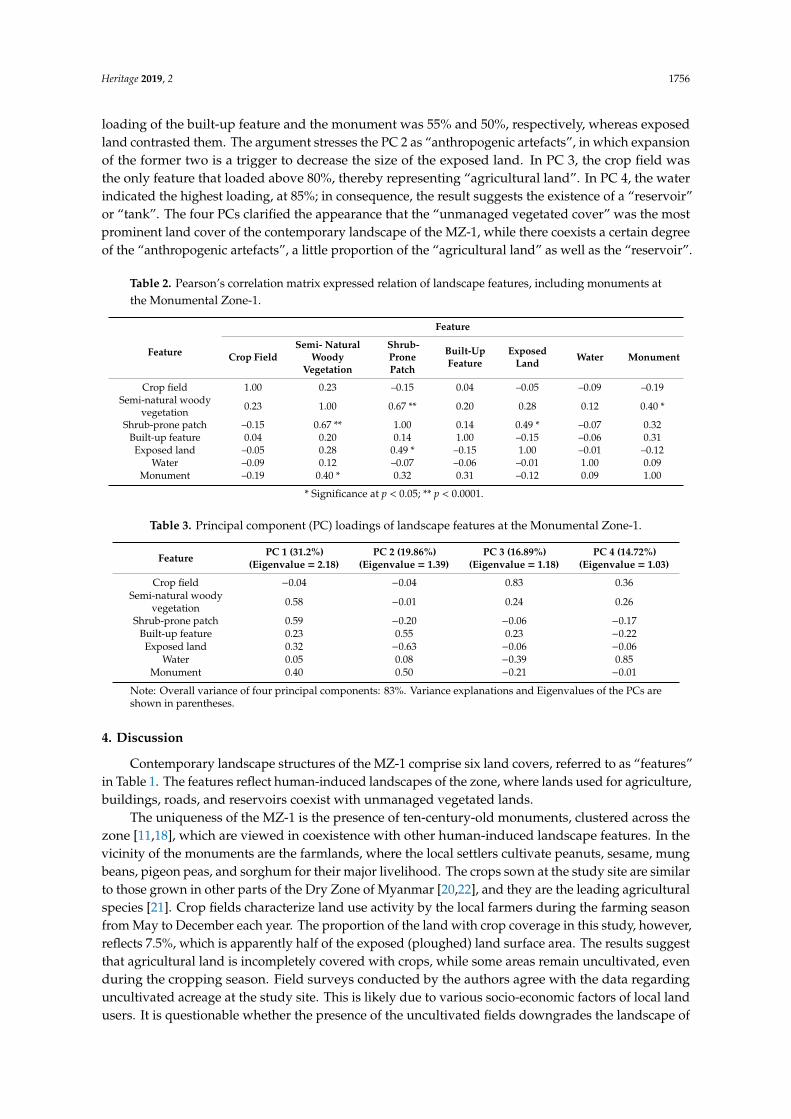
To determine the extent to which features interrelate, the pixel counts of the features were assessedwith multivariate analysis. In this case, in order to establish the coexistence of monuments with thesefeatures, the number of monuments was taken into account in the analysis. First, a correlation matrixshowed that the crop field did not significantly relate to other features (Table 2). On the contrary,the semi-natural woody vegetation strongly and positively correlated with the shrub-prone patches(p < 0.0001) and the monuments (p < 0.05). The shrub-prone patches again were in positive correlationwith the exposed land (p < 0.05). The results showed that (1) the crop field is independent of the otherfeatures, (2) the semi-natural woody vegetation is dependent on the expansion of the shrub-pronepatch, (3) the semi-natural woody vegetation is a significant impact on the monuments, and (4) theshrub-prone patch is triggered by the increment of the exposed land. Second, the principal componentanalysis dropped the first four components (PC) of Eigenvalues above 1, which gave 83% of the overallvariance (Table 3). The PC 1 accounted for 31.2% of variation among the features, and those with 50%and above loading to the PC were considered interpreting the component. The semi-natural woodyvegetation and the shrub-prone patches loaded similarly, at approximately 60% each to the PC 1,accordingly explaining the existence of “unmanaged vegetated cover” at the study site. In PC 2, the
Heritage 2019, 2 1756
loading of the built-up feature and the monument was 55% and 50%, respectively, whereas exposedland contrasted them. The argument stresses the PC 2 as “anthropogenic artefacts”, in which expansionof the former two is a trigger to decrease the size of the exposed land. In PC 3, the crop field wasthe only feature that loaded above 80%, thereby representing “agricultural land”. In PC 4, the waterindicated the highest loading, at 85%; in consequence, the result suggests the existence of a “reservoir”or “tank”. The four PCs clarified the appearance that the “unmanaged vegetated cover” was the mostprominent land cover of the contemporary landscape of the MZ-1, while there coexists a certain degreeof the “anthropogenic artefacts”, a little proportion of the “agricultural land” as well as the “reservoir”.
Table 2. Pearson’s correlation matrix expressed relation of landscape features, including monuments atthe Monumental Zone-1.
Feature
Feature
Crop FieldSemi- Natural
WoodyVegetation
Shrub-PronePatch
Built-UpFeature
ExposedLand Water Monument
Crop field 1.00 0.23 –0.15 0.04 –0.05 –0.09 –0.19Semi-natural woody
vegetation 0.23 1.00 0.67 ** 0.20 0.28 0.12 0.40 *
Shrub-prone patch –0.15 0.67 ** 1.00 0.14 0.49 * –0.07 0.32Built-up feature 0.04 0.20 0.14 1.00 –0.15 –0.06 0.31Exposed land –0.05 0.28 0.49 * –0.15 1.00 –0.01 –0.12
Water –0.09 0.12 –0.07 –0.06 –0.01 1.00 0.09Monument –0.19 0.40 * 0.32 0.31 –0.12 0.09 1.00
* Significance at p < 0.05; ** p < 0.0001.
Table 3. Principal component (PC) loadings of landscape features at the Monumental Zone-1.
Feature PC 1 (31.2%)(Eigenvalue = 2.18)
PC 2 (19.86%)(Eigenvalue = 1.39)
PC 3 (16.89%)(Eigenvalue = 1.18)
PC 4 (14.72%)(Eigenvalue = 1.03)
Crop field −0.04 −0.04 0.83 0.36Semi-natural woody
vegetation 0.58 −0.01 0.24 0.26
Shrub-prone patch 0.59 −0.20 −0.06 −0.17Built-up feature 0.23 0.55 0.23 −0.22Exposed land 0.32 −0.63 −0.06 −0.06
Water 0.05 0.08 −0.39 0.85Monument 0.40 0.50 −0.21 −0.01
Note: Overall variance of four principal components: 83%. Variance explanations and Eigenvalues of the PCs areshown in parentheses.
4. Discussion
Contemporary landscape structures of the MZ-1 comprise six land covers, referred to as “features”in Table 1. The features reflect human-induced landscapes of the zone, where lands used for agriculture,buildings, roads, and reservoirs coexist with unmanaged vegetated lands.
The uniqueness of the MZ-1 is the presence of ten-century-old monuments, clustered across thezone [11,18], which are viewed in coexistence with other human-induced landscape features. In thevicinity of the monuments are the farmlands, where the local settlers cultivate peanuts, sesame, mungbeans, pigeon peas, and sorghum for their major livelihood. The crops sown at the study site are similarto those grown in other parts of the Dry Zone of Myanmar [20,22], and they are the leading agriculturalspecies [21]. Crop fields characterize land use activity by the local farmers during the farming seasonfrom May to December each year. The proportion of the land with crop coverage in this study, however,reflects 7.5%, which is apparently half of the exposed (ploughed) land surface area. The results suggestthat agricultural land is incompletely covered with crops, while some areas remain uncultivated, evenduring the cropping season. Field surveys conducted by the authors agree with the data regardinguncultivated acreage at the study site. This is likely due to various socio-economic factors of local landusers. It is questionable whether the presence of the uncultivated fields downgrades the landscape of

Heritage 2019, 2 1757
the MZ-1; nevertheless, it is an issue for future research and analysis. A tourism sector developmentproject implemented in very recent years promotes the unique landscape of Bagan for the coexistenceof its agricultural lands with its monuments [34]. Interestingly, the crop fields are independent of themonuments and other existing features, and this reveals that the presence of the cultivated fields inparticular has little or no impact on the monuments in terms of land use.
The exposed land that is recognized as a part of the agricultural area, on the other hand, is in apositive relationship with the shrub-prone patches. The land appears to have been left uncroppedafter ploughing until the end of September, which is the later part of the monsoon season (mid-May toOctober). It seems that rainfall at the study site did not provide sufficient moisture for crop growing asthe crops are exclusively rain-fed, thereby expanding the exposed land surface to about 15% of theMZ-1 (Table 1). Receiving erratic rainfall during the crop season has driven the failure of crop yieldin an area of the Dry Zone [22]. This might have led to a socio-economic impact on the livelihood oflocal farmers. In the case of leaving the land exposed, the incidence of shrubs appears to conquer suchland surfaces by means of natural succession. The land, in consequence, would have transformed intoshrub-prone area, and the data of the current study suggest that the more the exposed land, the largerthe expansion of the shrub-prone patch.
The second largest area of shrub-prone patch at the study site implies that the massive proportionof cultivatable lands has been recently left with no more crop cover after ploughing or previous sowing.Under favourable conditions, those lands are subject to the regeneration of shrubs, which graduallyinvade the entire exposed land surface. Within a short duration of exposure after crop activity, thedegree of shrub incidence on the land is found to be high [35]. If continuous cultivation is practiced ineach growing season, ploughing the earth’s crust is a means of destroying shrub propagules and wouldreduce the shrub-invaded lands. The shrub-invaded patches may have functioned as storehouses fordisseminated propagules of woody plant species in the surrounding areas. This argument is supportedby reports on increasing plant species and density, including woody plants, due to the presenceof shrubs in a particular habitat [36,37]. The shrub-prone patch supports growth of woody plantsthat, unless encountered by further human intervention, would transform into semi-natural woodyvegetation. The results of the current study also suggest that the shrub-prone land is a trigger for theincremental spread of the semi-natural woody vegetation. The data agreed with the observations ofWang et al. (2016) [38] that a forest regenerates by natural means of grass and shrub covers via landuse change after agricultural activity.
The stretch of the semi-natural woody vegetation at the MZ-1 is astonishingly large, covering37% of the zone (Table 1). Since it is a time-course factor, massive expansion of such vegetation in thecontemporary landscape shows that little or no management has been applied to the shrub-pronepatches developed from the exposed lands in recent years. Local xeromorphic woody plants such asAcacia catechu, Acacia leucophloea, Borassus flabellifer, and Zizyphus jujuba are common to the study site,whereas Prosopis juliflora has become an invasive species widely across the Dry Zone of Myanmar [39,40].The P. juliflora is a robust, semi-arid tree species that has an outstanding characteristic of invasion intonatural and/or human-induced landscapes [41]. However, no data of its location-specific invasion tothe landscape of the MZ-1 are available for the current study. A remarkable result of the relationshipbetween the semi-natural woody vegetation and the monument, instead, reveals that the area’sexpansion of woody plant species has been extending to the environs of the monuments. If theplants grow close to the monuments, the root extension could penetrate the structures, inducingflaws and cracks. Under severe conditions, a collapse of the monuments might lead to the loss of thehistorical symbols.
The existence of the built-up features and the water is also independent of others at the MZ-1.The built-up features are mainly seen as settlement areas, paved roads, and monumental compoundsoccupying 13% of the zone, while the waters as the reservoirs are the smallest occupancy, at less than1%. The data suggest that the MZ-1 is not yet very urbanized, although there are anthropogenicfeatures integrating into the landscape.

Heritage 2019, 2 1758
This study was unable to interpret the monuments, both in the 30-m and the 15-m resolution imagesof Landsat 8, probably due to insufficient image quality to access the monuments. Field-recordedGPS points of monument locations and/or those accessed in a 2-m resolution Google Earth map(CNES/ Airbus, 2018), however, accounted 2348 monuments scattered within the MZ-1. This revealedthat ground-truth data are of the utmost importance to validate the monuments in this study. Ofthe geolocated monument points plotted on the pan-sharpened image, they superimposed thebuilt-up features and the semi-natural woody vegetation. Crosscheck in Google Earth clarifiedthat some monument points in the range of 1–6 were in the enclosures designated as monumentalcompounds, where platforms and developed structures stretched in proximity to the monuments. Theenclosures spotted in and outside the residential areas, and some intermingled with the semi-naturalvegetation. The locations of the monument enclosures were also checked in the inventory maps ofPichard (1992–1995) [12]. Validations supported interpreting the monumental compounds as thebuilt-up feature.
The close relationship existing between the shrub-prone patches and the semi-natural woodyvegetation accounts for the prominence of “unmanaged vegetated cover” at the study site. Theargument illustrates on the one hand the tendency for land to transform into a natural state; on the otherhand, it points to the amendment of the current landscape as a safeguarding measure for protectionof the historical setting. Reflecting poor site management apparently, the expansion of unmanagedvegetation within the MZ-1 would become an interference for access to the monuments. The threatmay also downgrade the attractiveness and magnificence of the cultural landscape. Stands of tallwoody plants are supposedly an obstruction to the view and to the monuments. Erect above thesmall-sized monuments, tree-type vegetation would hinder the structures and seriously damage themonuments by root penetration. Propagules disseminated by such vegetation to the surrounding areaare an important source of regeneration over the landscape. Cultivation activities on the farmland arecreditable to suppress the sprouts and seeds of those plants, mainly in the rainy season. Successivecontrols in every onset of rain by agricultural land management of local farmers are highly appreciatedas a matter of timely site management. Since the MZ-1 is of a historically developed landscape,anthropogenic modifications over time have remade the landscape as part of the cultural identity. Inshort, coexisting with the built-up features, referred to as “anthropogenic artefacts”, “agriculturalland”, and “reservoir”, proper management of semi-natural vegetation, would improve the value ofthe landscape. Through enhancing living landscape, local communities, pilgrims and visitors, and,collectively, the global society are expected to receive ecosystem services directly or indirectly from theheritage site in the Dry Zone of Myanmar.
5. Conclusions
The contemporary landscape of the MZ-1 is predominantly structured with (1) vegetated landcovers or features of crop field, semi-natural woody vegetation, and shrub-prone patches; and(2) non-vegetated built-up features, exposed land, and water. The land use for the crop field quantifiesa small proportion, compared to the 4–6 times larger coverage of the other two vegetated features. Thebuilt-up feature and the exposed land also occupy the amount of area similar to that of the crop field,whilst the water makes up the smallest fraction. In land-use aspects, crop cultivation on agriculturalland is found to have depreciated, while the exposed land surface remains as large as the crop-coveredarea. Low occupancy of the built-up structures reflects the fact that the zone is not highly populated,perhaps still in the (traditional) rural landscape. The contrasting areas of features yield to the evaluationof their coexisting relationships in the MZ-1.
Independence of the existing crop field indicates that agricultural area has no impact on otherfeatures, particularly on monuments at the MZ-1. However, the semi-natural woody vegetationdevelops in the environs of the monuments and seems to be a threat to them. The growth of thisvegetation is triggered by the occurrence of the shrub-prone patch; the latter, in turn, is driven bythe expansion of the exposed lands. In this regard, agricultural land use and management and the
Heritage 2019, 2 1759
coverage of semi-natural vegetation relative to the monument areas in such landscapes are significantmatters for further investigation. The remarkable prominence of “unmanaged vegetated cover”coexisting with “anthropogenic artefacts”, “agricultural land”, and “reservoirs” draws attention totimely amendments of the human-induced landscape as safeguarding measures for the historicalsettings in Bagan. Provided that no accessibility to the locations of the monuments was available, theassessment of the relationship between the monuments and the other features will not be given anyaccount in the current study.
The study deduces management-related features of the contemporary landscape, stressing priorityto locally best-fit strategies for long-term management of tangible and intangible cultural heritage,through broadly covered national law. The study’s results emphasize the role of agricultural land thatprimarily matters for safeguarding the heritage site. Coverage of cultivated crops over the farmlandsin corresponding growing seasons will be a breakthrough of strengthening the living landscape in thedry zone ecosystem. Suggesting governmental policy implication and supports, the study urges theintrinsic involvement of local stakeholders in the holistic management of the entities and the site.
Author Contributions: M.Z.N.A. wrote the manuscript, and S.S. supervised, reviewed, and edited it.
Funding: This research was funded by the Japan International Cooperation Agency (JICA), titled the Long-termTraining Programme for Academic Staff in Yezin Agricultural University for Postgraduate Degree (Ph.D.) in Japan.And the APC was funded by the Kyoto University.
Acknowledgments: The authors gratefully acknowledge miscellaneous support from the Technical CooperationProject of Yezin Agricultural University and Japan International Cooperation Agency (YAU-JICA TCP) whiletravelling to the research site. Contributions and assistance of officials as well as staff members of the Departmentof Agriculture (Ministry of Agriculture, Livestock and Irrigation) and the Department of Archaeology and NationalMuseum (Ministry of Religious Affairs and Culture), the Republic of The Union of Myanmar, are also appreciatedfor acquiring ground-truth data, which are invaluable sources for analyses.
Conflicts of Interest: The authors declare no conflict of interest.
References
1. Eigenbrod, F. Redefining landscape structure for ecosystem services. Curr. Landsc. Ecol. Rep. 2016, 1, 80–86.[CrossRef]
2. Forman, R.T.T.; Gordron, M. Landscape and principles. In Landscape Ecology; John Wiley & Sons, Inc.:New York, NY, USA, 1986; pp. 3–32.
3. Radoux, J.; Chome, G.; Jacques, D.C.; Waldner, F.; Bellemans, N.; Matton, N.; Defourny, P. Sentinel-2’spotential for sub-pixel landscape feature detection. Remote Sens. 2016, 8, 488. [CrossRef]
4. Perry, J.; Falzon, C. Climate change adaptation for natural world heritage sites. In A Practical Guide; WorldHeritage Paper 37; United Nations Educational, Scientific and Cultural Organization: Paris, France, 2014;pp. 13–14.
5. Herlin, I.L.; Fry, G.L.A. Dispersal of woody plants in forest edges and hedgerows in a Southern Swedishagricultural area: The role of site and landscape structure. Landsc. Ecol. 2000, 15, 229–242. [CrossRef]
6. Butler, A.; Sarlov-Herlin, I.; Knezd, I.; Angmana, E.; Sangc, A.O.; Akerskoge, A. Landscape identity, beforeand after a forest fire. Landsc. Res. 2018, 43, 878–889. [CrossRef]
7. Butler, A.; Sarlov-Herlin, I. Changing landscape identity—Practice, plurality and power. Landsc. Res. 2019,44, 271–277. [CrossRef]
8. Mitchell, M.G.E.; Suarez-Castro, A.F.; Martinez-Harms, M.; Maron, M.; McAlpine, C.; Gaston, K.J.; Rhodes, J.R.Reframing landscape fragmentation’s effects on ecosystem services. Trends Ecol. Evol. 2015, 30, 190–198.[CrossRef] [PubMed]
9. Metzger, J.P. Landscape ecology: Perspectives based on the 2007 IALE world congress. Lands. Ecol. 2008, 23,501–504. [CrossRef]

Heritage 2019, 2 1760
10. Aung, M.N. Archaeological conservation of Bagan Ancient Monuments in Myanmar. In Proceedings of theEstablishment of the Network for Safeguarding and Development of the Cultural Heritage in the MekongBasin Countries, Seminar and Workshop Establishment for Issues, Problems and Future Challenges of WorldHeritage Sites and Its Frontal Base Town/ City: Making a Key Step Towards Close Cooperation on HistoricCity Summit in Southeast Asian Countries Focusing on Siem Reap, Bangkok, Thailand, 16–17 December2017; pp. B23–B42.
11. Hudson, B. Restoration and reconstruction of monuments at Bagan (Pagan), Myanmar (Burma), 1995–2008.World Archae. 2008, 40, 553–571. [CrossRef]
12. Pichard, P. Inventory of Monuments at Pagan; KISCADALE EFEO UNESCO: Paris, France, 1992–1995;Volume 1–6.
13. Luce, G.H. Rise of Pagan. In Old Burma-Early Pagan; J.J. Augustin Publisher: New York, NY, USA, 1969;Volume 1, pp. 4–11.
14. Department of Archaeology and National Museum. Proposed World Heritage List Bagan: Cultural Heritage Sitesin Myanmar; Ministry of Religious Affairs and Culture, The Republic of the Union of Myanmar: Nay Pyi Taw,Myanmar, 2018.
15. Aung-Thwin, M.; Aung-Thwin, M. Pagan: The golden age of Myanmar. In A history of Myanmar since AncientTimes. Traditions and Transformations; Reaktion Books Ltd.: London, UK, 2012; pp. 77–106.
16. Hudson, B. The Merits of Rebuilding Bagan. Orientation 2000, 5, 85–86.17. Aung-Thwin, M. The effects of beliefs and institutions on events. In Pagan: The Origins of Modern Burma;
University of Hawaii Press: Honolulu, HI, USA, 1985; pp. 167–198.18. Hudson, B. The king of “Free Rabbit Island”: A G.I.S.-based archaeological approach to Myanmar’s medieval
capital, Bagan. In Proceedings of the Myanmar Two-Millennial Conference, Yangon, Myanmar, 15–17December 1999; Universities Historical Research Centre: Yangon, Myanmar, 2000; pp. 10–19.
19. Antrop, M. Why landscapes of the past are important for the future. Landsc. Urban Plan. 2005, 70, 21–34.[CrossRef]
20. Yee, M.S.; Nawata, E. Land use and farming systems in Dry Zone, Myanmar: A case study in Kani, SagaingRegion. Trop. Agri. Dev. 2014, 58, 169–179.
21. Oo, A.T.; Huylenbroeck, G.V.; Speelman, S. Determining factors for the application of climate changeadaptation strategies among farmers in Magwe District, Dry Zone region of Myanmar. Int. J. Clim. Chang.Strat. Manag. 2017, 9, 36–55.
22. Matsuda, M. Upland farming systems coping with uncertain rainfall in the central Dry Zone of Myanmar:How stable is indigenous multiple cropping under semi-arid conditions? Hum. Ecol. 2013, 41, 927–936.[CrossRef]
23. Department of Population. The 2014 Myanmar Population and Housing Census. Mandalay Region, Nyaung-UDistrict, Nyaung-U Township; Ministry of Labour, Immigration and Population, The Republic of the Unionof Myanmar: Nay Pyi Taw, Myanmar, 2017. Available online: www.dop.gov.mm/sitesdop.gov.mm/files/publication_docs/naung_u.pdf (accessed on 1 April 2019).
24. Drury, L.W. Hydrology of the Dry Zone—Central Myanmar; The Australian Water Partnership: Canberra,Australia, 2017; pp. 13–16. Available online: http://themimu.info/sites/themimu.info/files/documents/Report_Hydrogeology_of_the_Dry_Zone_-_Central_Myanmar_2017_low-res.pdf (accessed on 1 August 2018).
25. Myanmar Information Management Unit (MIMU). Myanmar State/Region (with Sub-Regions), District, TownshipBoundary Lines. 2019. Available online: Geonode.themimu.info/layers/geonode%3Ammr_polbnd12_250k_mimu#license-more-above (accessed on 1 April 2019).
26. United States Geological Survey (USGS). Available online: https://earthexplorer.usgs.gov (accessed on10 January 2019).
27. Qi, J.; Chehbouni, A.; Huete, A.R.; Kerr, Y.H.; Sorroshian, S. A modified soil adjusted vegetation index.Remote Sens. Environ. 1994, 48, 119–126. [CrossRef]
28. Huete, A.R. A soil-adjusted vegetation index (SAVI). Remote Sens. Environ. 1988, 25, 259–305. [CrossRef]29. Zha, Y.; Gao, J.; Ni, S. Use of normalized difference built-up index in automatically mapping urban areas
from TM imagery. Int. J. Remote Sens. 2003, 24, 583–594. [CrossRef]30. Xu, H. Modification of normalized difference water index (NDWI) to enhance open water features in remotely
sensed imagery. Int. J. Remote Sens. 2006, 27, 3025–3033. [CrossRef]

Heritage 2019, 2 1761
31. Congedo, L. Semi-Automatic Classification Plugin User Manual. 2016. Available online: http://dx.doi.org/10.13140/RG.2.1.1219.3524 (accessed on 13 March 2019).
32. Jellema, A.; Stobbelaar, D.-J.; Groot, J.C.J.; Rossing, W.A.H. Landscape character assessment using regiongrowing technique in geographic information systems. J. Environ. Manag. 2009, 90, 161–174. [CrossRef]
33. Waldner, F.; Defourny, P. Where can pixel counting area estimates meet user-defined accuracy requirements?Int. J. Appl. Earth Obser. Geoinf. 2017, 60, 1–10. [CrossRef]
34. Ministry of Hotel and Tourism; Japan International Cooperation Agency. Project for Establishment of thePilot Model for Regional Tourism Development in the Republic of the Union of Myanmar; Final Report; JapanInternational Cooperation Agency; Koei Research & Consulting Inc., Nippon Koei Co., JTB Cooperate SalesInc.: Tokyo, Japan, 2018. Available online: http://open_jicareport.jica.go.jp/pdf/12306734_01.pdf (accessed on12 March 2019).
35. Mosher, E.S.; Silander, J.A., Jr.; Latimer, A.M. The role of land-use history in major invasions by woody plantspecies in the northeastern North American landscape. Biol. Invasions 2009, 11, 2317–2318. [CrossRef]
36. Thompson, J.A.; Zinnert, J.C.; Young, D.R. Immediate effects of microclimate modification enhance nativeshrub encroachment. Ecosphere 2017, 82, 2–11. [CrossRef]
37. Bueno, A.; Llambi, L.D. Facilitation and edge effects influence vegetation regeneration in old-fields at thetropical Andean forest line. Appl. Veg. Sci. 2015, 18, 613–623. [CrossRef]
38. Wang, W.; Zhang, C.; Allen, J.M.; Li, W.; Boyer, M.A.; Segerson, K.; Silander, J.A., Jr. Analysis and predictionof land use changes related to invasive species and major driving forces in the State of Connecticut. Land2016, 5, 25. [CrossRef]
39. Oo, W.P.; Koike, F. Dry forest community types and their predicted distribution based on habitat model forthe central dry zone of Myanmar. For. Ecol. Manag. 2015, 358, 108–121. [CrossRef]
40. Aung, T.; Koike, F. Identification of invasion status using a habitat invasibility assessment model: The case ofProsopis species in the dry zone of Myanmar. J. Arid Environ. 2015, 120, 87–95. [CrossRef]
41. Rembold, F.; Leonardib, U.; Ngc, W.-T.; Gadainb, H.; Meronia, M.; Atzbergerc, C. Mapping areas invaded byProsopis juliflora in Somaliland on Landsat 8 imagery. In Proceedings of the SPIE 9637, Remote Sensing forAgriculture, Ecosystems, and Hydrology XVII, Toulouse, France, 14 October 2015.
© 2019 by the authors. Licensee MDPI, Basel, Switzerland. This article is an open accessarticle distributed under the terms and conditions of the Creative Commons Attribution(CC BY) license (http://creativecommons.org/licenses/by/4.0/).


![Groundswell : [brochure] constructing the contemporary ... · Groundswell : [brochure] constructing the contemporary landscape Date 2005 Publisher The Museum of Modern Art Exhibition](https://img.dokumen.tips/doc/110x75/5ae2dce87f8b9ae74a8cfdb8/groundswell-brochure-constructing-the-contemporary-brochure-constructing.jpg)