Embed Size (px)
Citation preview
AFRL-RX-TY-TP-2008-4554 CONTAMINATION CONTROL AREA – AIRLOCK – TOXIC FREE AREA PROCESS ANALYSIS (BRIEFING CHARTS) Bruce J. Nielsen Air Force Research Laboratory MAY 2007 Interim Report for 1 April 2006 to 1 January 2007
DISTRIBUTION STATEMENT A: Approved for public release, distribution unlimited. Presented at the bi-annual meeting of the DOD Joint Committee on Tactical Shelters (JOCOTAS) and Rigid Wall and Soft Wall Shelter Industry and Exhibition, Panama City Beach, FL 30 April – 2 May 2007. AIRBASE TECHNOLOGIES DIVISION MATERIALS AND MANUFACTURING DIRECTORATE AIR FORCE RESEARCH LABORATORY AIR FORCE MATERIEL COMMAND 139 BARNES DRIVE, SUITE 2 TYNDALL AIR FORCE BASE, FL 32403-5323
Standard Form 298 (Rev. 8/98)
REPORT DOCUMENTATION PAGE
Prescribed by ANSI Std. Z39.18
Form Approved OMB No. 0704-0188
The public reporting burden for this collection of information is estimated to average 1 hour per response, including the time for reviewing instructions, searching existing data sources, gathering and maintaining the data needed, and completing and reviewing the collection of information. Send comments regarding this burden estimate or any other aspect of this collection of information, including suggestions for reducing the burden, to Department of Defense, Washington Headquarters Services, Directorate for Information Operations and Reports (0704-0188), 1215 Jefferson Davis Highway, Suite 1204, Arlington, VA 22202-4302. Respondents should be aware that notwithstanding any other provision of law, no person shall be subject to any penalty for failing to comply with a collection of information if it does not display a currently valid OMB control number. PLEASE DO NOT RETURN YOUR FORM TO THE ABOVE ADDRESS. 1. REPORT DATE (DD-MM-YYYY) 2. REPORT TYPE 3. DATES COVERED (From - To)
4. TITLE AND SUBTITLE 5a. CONTRACT NUMBER
5b. GRANT NUMBER
5c. PROGRAM ELEMENT NUMBER
5d. PROJECT NUMBER
5e. TASK NUMBER
5f. WORK UNIT NUMBER
6. AUTHOR(S)
7. PERFORMING ORGANIZATION NAME(S) AND ADDRESS(ES) 8. PERFORMING ORGANIZATION REPORT NUMBER
9. SPONSORING/MONITORING AGENCY NAME(S) AND ADDRESS(ES) 10. SPONSOR/MONITOR'S ACRONYM(S)
11. SPONSOR/MONITOR'S REPORT NUMBER(S)
12. DISTRIBUTION/AVAILABILITY STATEMENT
13. SUPPLEMENTARY NOTES
14. ABSTRACT
15. SUBJECT TERMS
16. SECURITY CLASSIFICATION OF: a. REPORT b. ABSTRACT c. THIS PAGE
17. LIMITATION OF ABSTRACT
18. NUMBER OF PAGES
19a. NAME OF RESPONSIBLE PERSON
19b. TELEPHONE NUMBER (Include area code)

1
Contamination Control Area -Airlock - Toxic Free Area
Process Analysis
Bruce NielsenBruce NielsenAir Force Research LaboratoryAir Force Research LaboratoryAirbase Technologies DivisionAirbase Technologies Division
AFRL/MLQLAFRL/MLQLApproved for Public Release
Good Morning!
In my past position as DTRA COLPRO Thrust Manager I heard many discussions regarding CCA/A/TFA Processing, usually focusing on one component of the process by many of the capability areas to include: Individual Protection, DECON, Collective Protection, Detection, Threat Agent Science and Modeling & Simulation.
But no one really was looking at the whole process.
I saw many proposals for airlocks citing that they are a “bottleneck” to COLPRO ingress/egress while others looked at the CCA process as the most cumbersome process
A better understanding of the CCA/A/TFA Process as a system was needed.
2
Contamination Control Area, Airlock and Toxic Free Area (CCA/A/TFA) Process Analysis
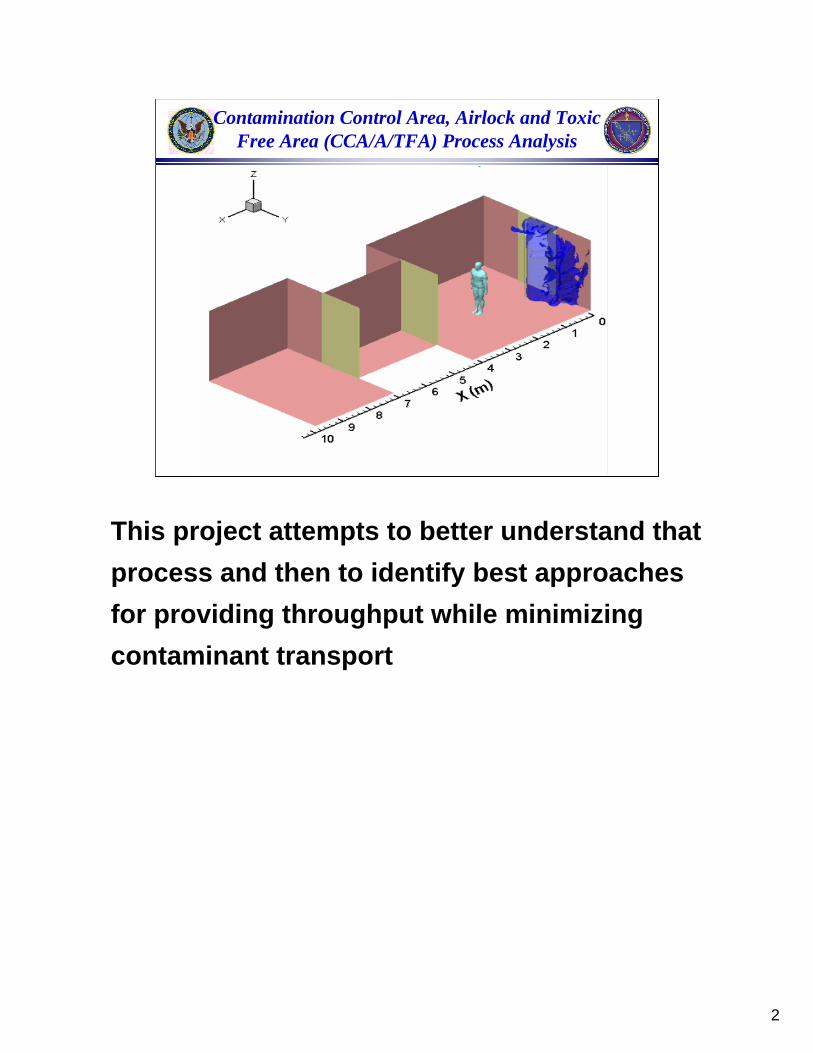
This project attempts to better understand that process and then to identify best approaches for providing throughput while minimizing contaminant transport
3
Contamination Control Area, Airlock and Toxic Free Area (CCA/A/TFA) Process Analysis
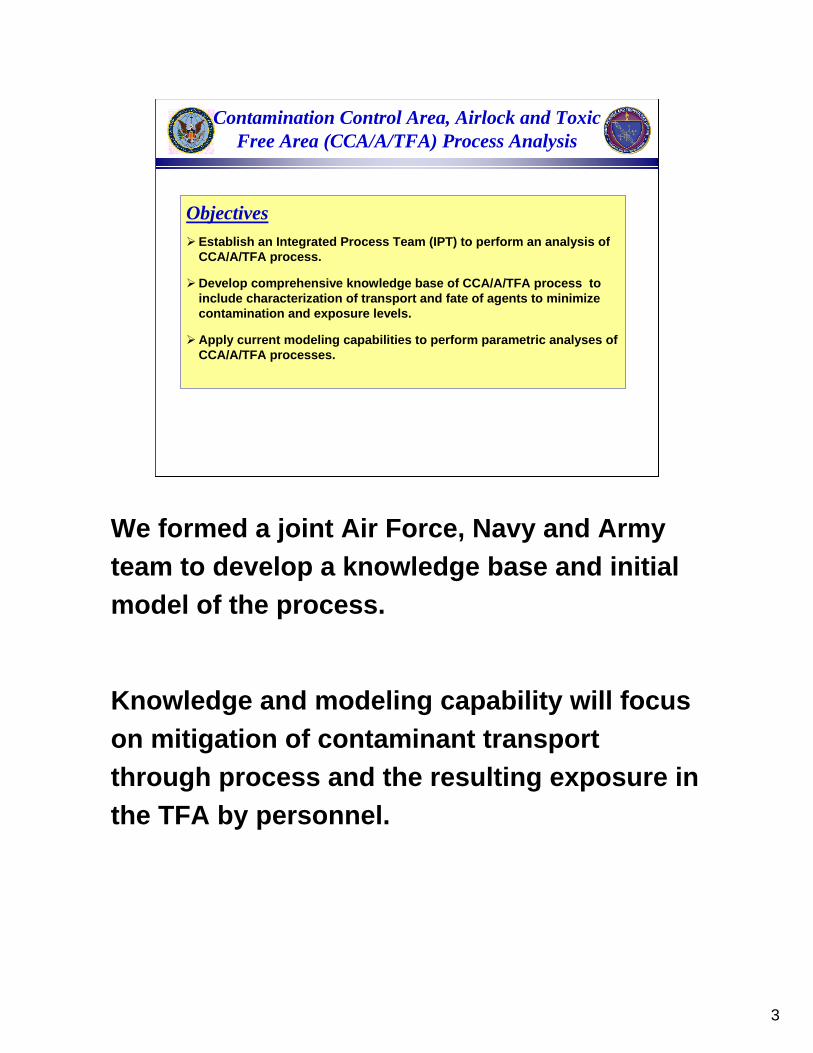
ObjectivesEstablish an Integrated Process Team (IPT) to perform an analysis of CCA/A/TFA process.
Develop comprehensive knowledge base of CCA/A/TFA process to include characterization of transport and fate of agents to minimize contamination and exposure levels.
Apply current modeling capabilities to perform parametric analyses of CCA/A/TFA processes.
We formed a joint Air Force, Navy and Army team to develop a knowledge base and initial model of the process.
Knowledge and modeling capability will focus on mitigation of contaminant transport through process and the resulting exposure in the TFA by personnel.
4
DTRA/CBTProj. Mgr.
Bruce Nielsen
AFRL/MLQLPIs
George LaventureBob McDonald
NSWC/Z-23PI
Will Clark
NatickPI
Amy Soo Leighton
NSWC/Z-22PI
Matt Woloski
AFRL/HEPCPIs
Lt Jennifer PlourdeAaron Fifarek
Literature Reviewand Analysis
CCA/A/TFA ProcessModel Development
CCA/A/TFAProcess Analysis
Summary Report andRecommendations
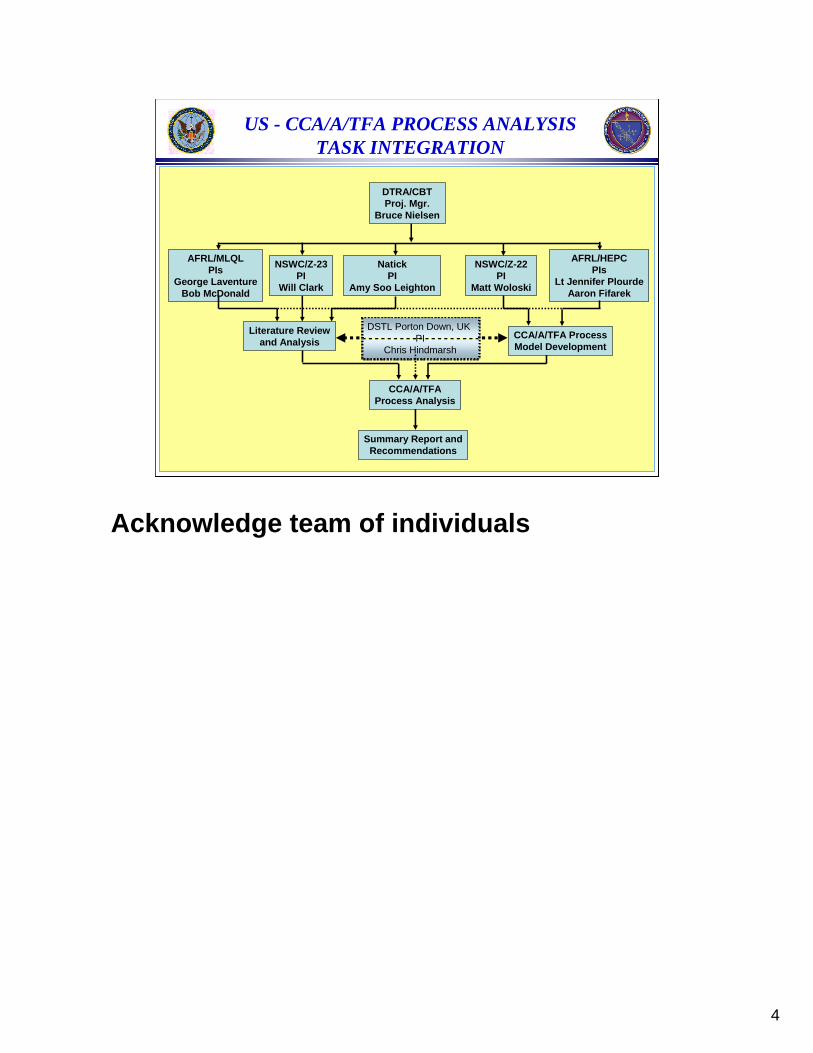
US - CCA/A/TFA PROCESS ANALYSISTASK INTEGRATION
DSTL Porton Down, UK PI
Chris Hindmarsh
Acknowledge team of individuals
5
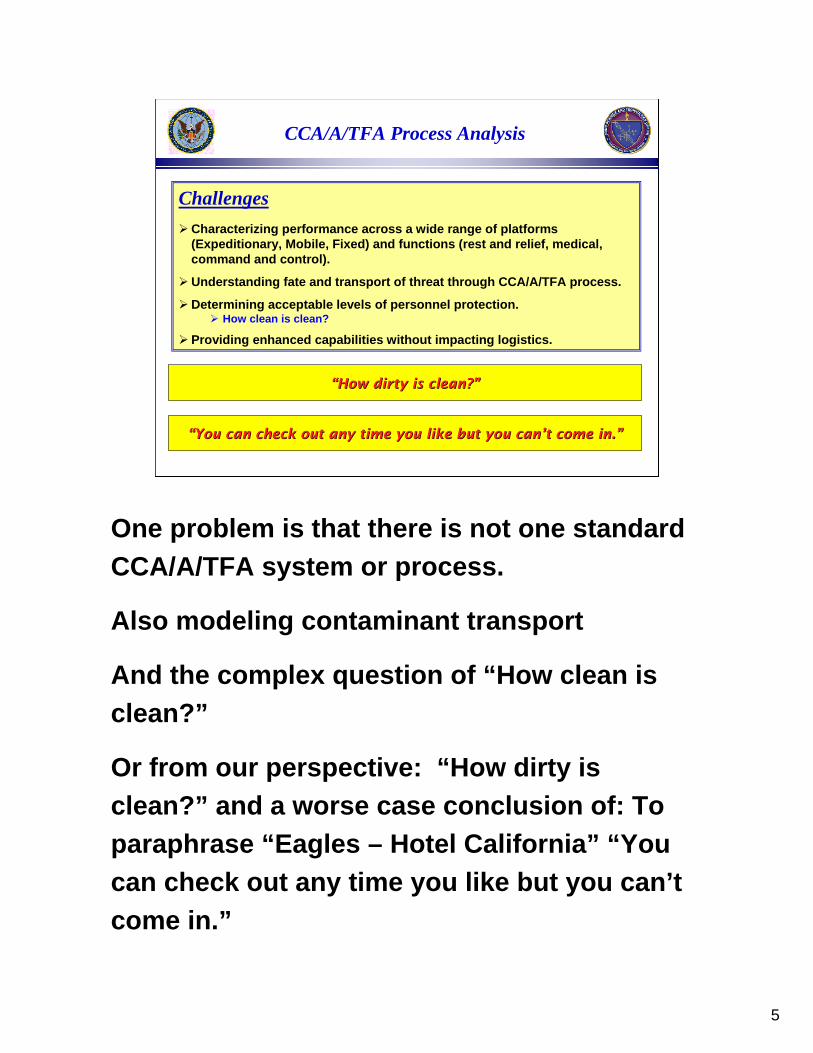
ChallengesCharacterizing performance across a wide range of platforms (Expeditionary, Mobile, Fixed) and functions (rest and relief, medical, command and control).
Understanding fate and transport of threat through CCA/A/TFA process.
Determining acceptable levels of personnel protection.How clean is clean?
Providing enhanced capabilities without impacting logistics.
CCA/A/TFA Process Analysis
““How dirty is clean?How dirty is clean?””
““You can check out any time you like but you canYou can check out any time you like but you can’’t come in.t come in.””
One problem is that there is not one standard CCA/A/TFA system or process.
Also modeling contaminant transport
And the complex question of “How clean is clean?”
Or from our perspective: “How dirty is clean?” and a worse case conclusion of: To paraphrase “Eagles – Hotel California” “You can check out any time you like but you can’t come in.”
6
PASS
Sensor1
PurgeDecon
RFU Sensor4
DeconProcess
Sensor2
Toxic Free Area(TFA)
Threat Environment
Airlock
Contamination Control Area(CCA)
FAIL
Recirculating Filter Unit
None
ConfirmedExposure
Presumptive
FAIL
Sensor Systemand/or Intel
PersonnelRe-Equipped
ReturnedTo Duty
PASS
PASS
Sensor3
Fail
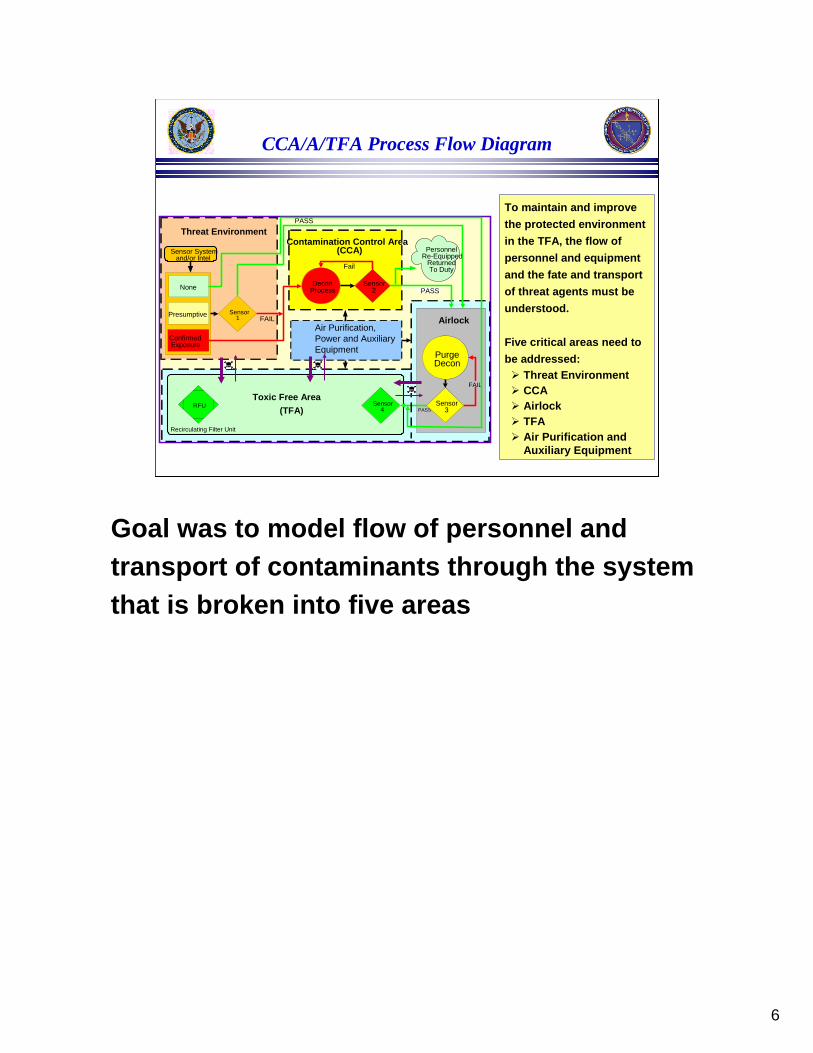
To maintain and improve the protected environmentin the TFA, the flow of personnel and equipment and the fate and transport of threat agents must be understood.
Five critical areas need to be addressed:
Threat EnvironmentCCAAirlockTFAAir Purification and Auxiliary Equipment
CCA/A/TFA Process Flow Diagram
Air Purification,Power and Auxiliary Equipment
Goal was to model flow of personnel and transport of contaminants through the system that is broken into five areas
7
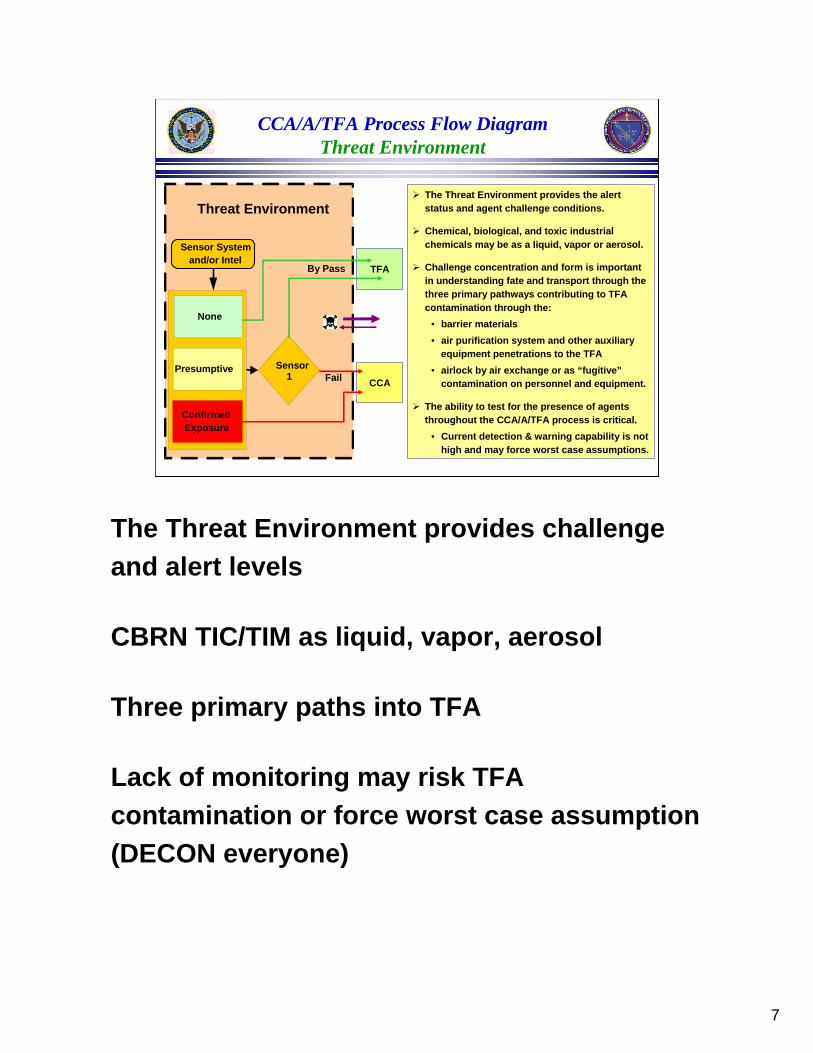
The Threat Environment provides the alert status and agent challenge conditions.
Chemical, biological, and toxic industrial chemicals may be as a liquid, vapor or aerosol.
Challenge concentration and form is important in understanding fate and transport through the three primary pathways contributing to TFA contamination through the:
• barrier materials• air purification system and other auxiliary
equipment penetrations to the TFA• airlock by air exchange or as “fugitive”
contamination on personnel and equipment.
The ability to test for the presence of agents throughout the CCA/A/TFA process is critical.
• Current detection & warning capability is not high and may force worst case assumptions.
CCA/A/TFA Process Flow DiagramThreat Environment
TFA
CCA
Sensor1
Threat Environment
Fail
None
ConfirmedExposure
Presumptive
Sensor Systemand/or Intel
By Pass
The Threat Environment provides challenge and alert levels
CBRN TIC/TIM as liquid, vapor, aerosol
Three primary paths into TFA
Lack of monitoring may risk TFA contamination or force worst case assumption (DECON everyone)
8
0
10
20
30
40
50
60
70
80
90
100P
erce
ntag
e Re
leas
ed (%
)
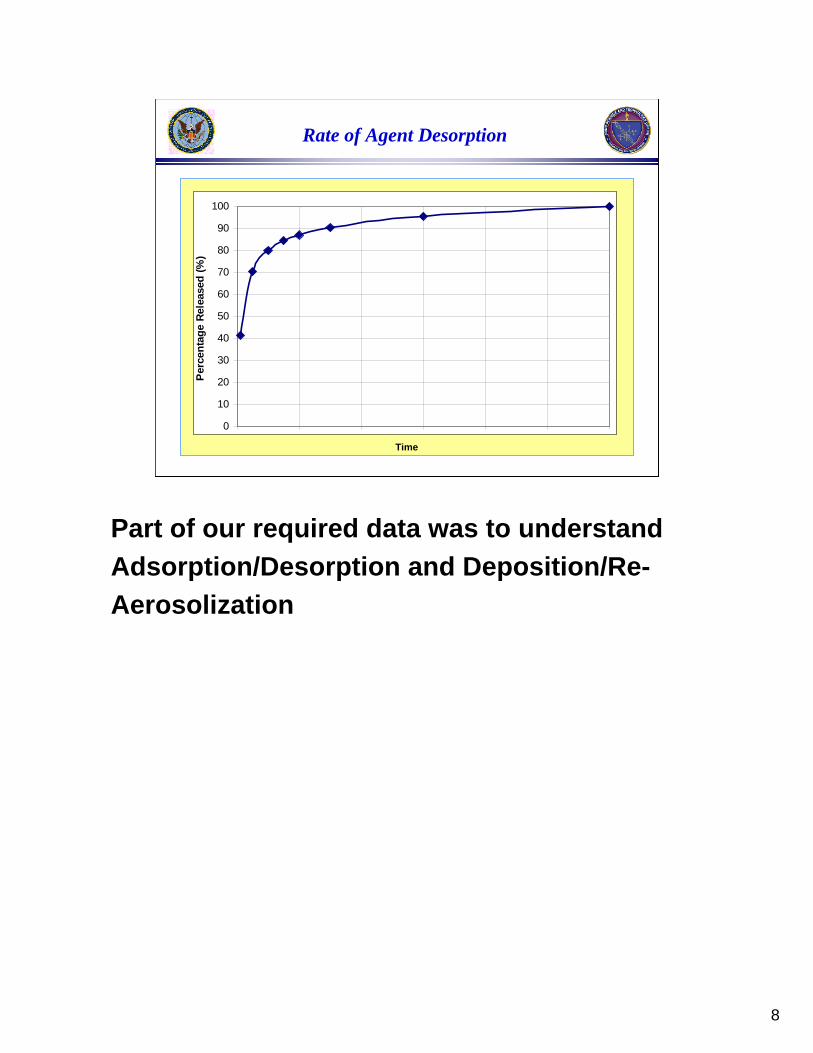
Rate of Agent Desorption
Time
Part of our required data was to understand Adsorption/Desorption and Deposition/Re-Aerosolization
9
DECONProcess
Sensor2
Contamination Control Area
Fail
PersonnelRe-Equipped& Returned
To Duty
Fail
Airlock &
TFA
Auxiliary Equipment
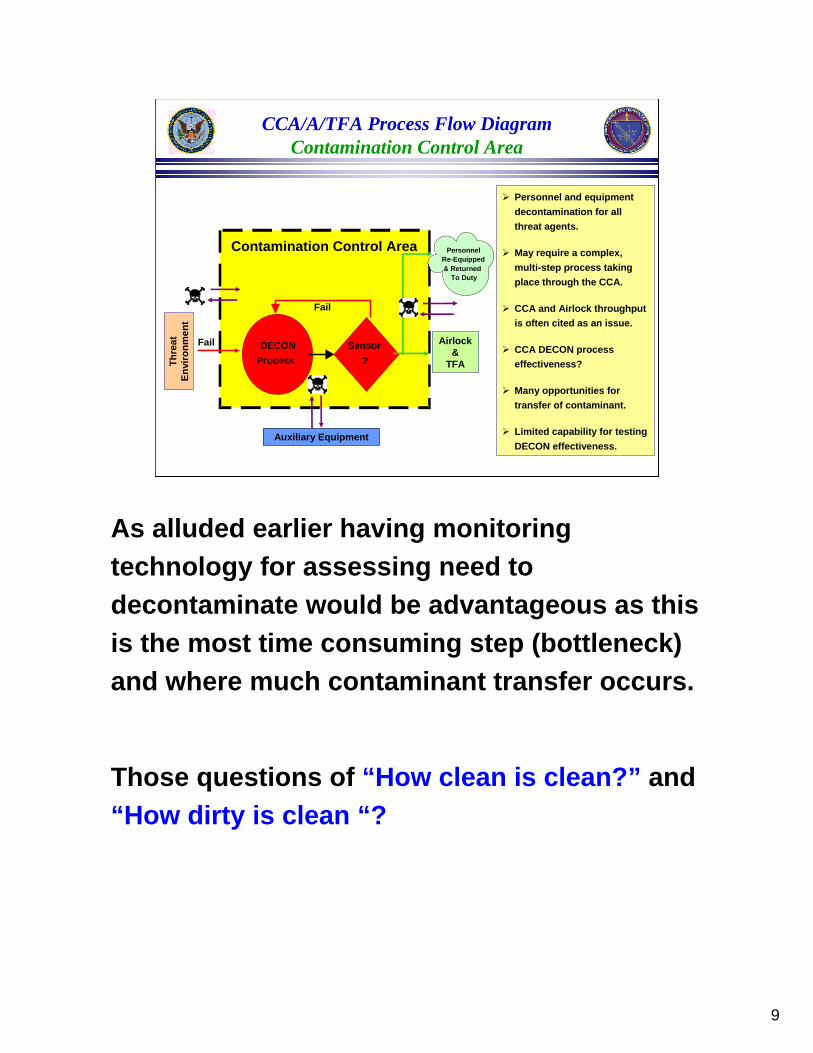
CCA/A/TFA Process Flow DiagramContamination Control Area
Personnel and equipment decontamination for all threat agents.
May require a complex, multi-step process taking place through the CCA.
CCA and Airlock throughput is often cited as an issue.
CCA DECON process effectiveness?
Many opportunities for transfer of contaminant.
Limited capability for testing DECON effectiveness.
Thre
atEn
viro
nmen
t
As alluded earlier having monitoring technology for assessing need to decontaminate would be advantageous as this is the most time consuming step (bottleneck) and where much contaminant transfer occurs.
Those questions of “How clean is clean?” and “How dirty is clean “?
10
Station 1
Wind Direction
Station 2
Station 4
Mask Monitoring and Removal Area
Overboot and Protective
Overgarment Removal Areas
Hood, Helmet, Mask, Filter,
and Glove Wash Area
CCA Entry
Glove Removal Area
CCA ExitTo TFA
Arrival Point and Initial Decon and
External Equipment Removal Areas
Station Boundary
Station Boundary
Station 3
Station Boundary
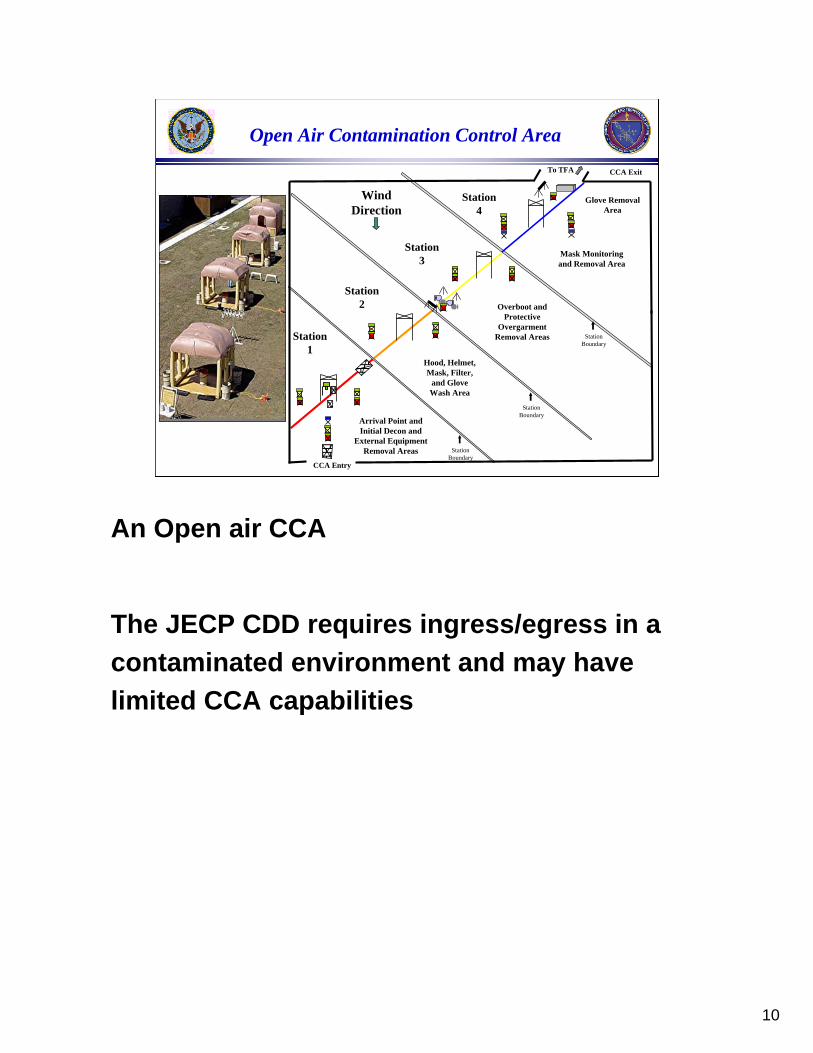
Open Air Contamination Control Area
An Open air CCA
The JECP CDD requires ingress/egress in a contaminated environment and may have limited CCA capabilities
11
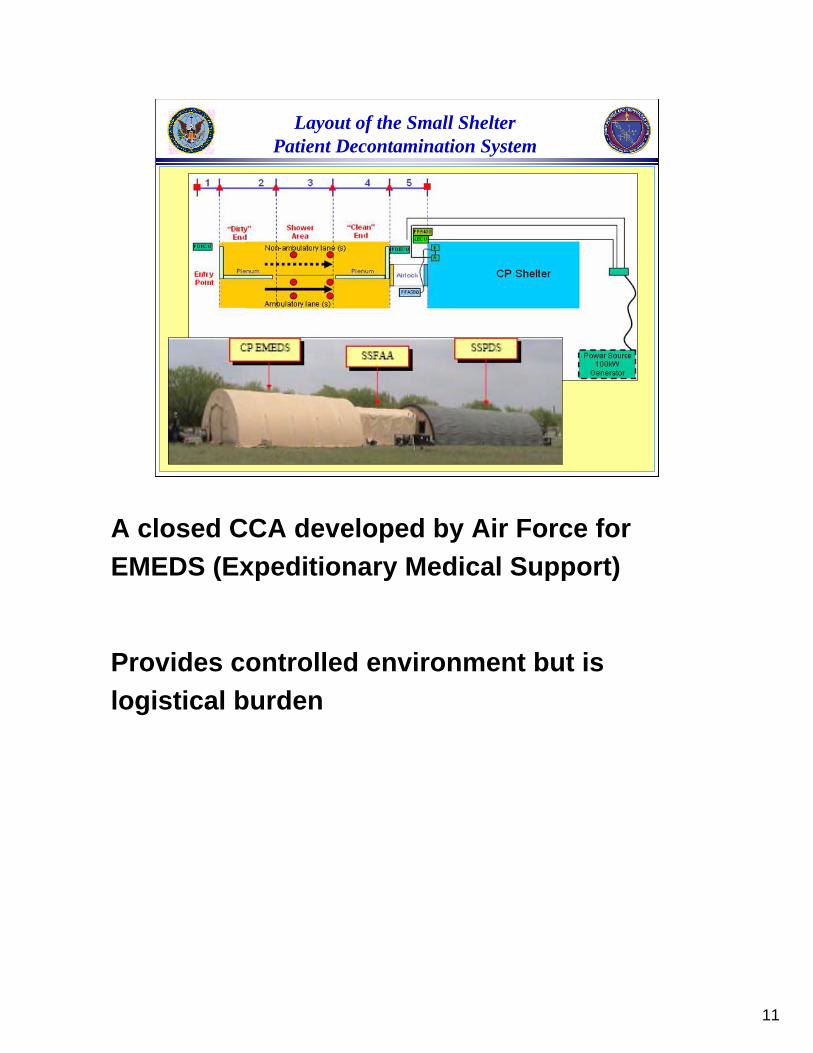
Layout of the Small Shelter Patient Decontamination System
A closed CCA developed by Air Force for EMEDS (Expeditionary Medical Support)
Provides controlled environment but is logistical burden

12
Swedish DemonstrationToxic Trip 2005, Zaragosa Air Base, Spain
CW Agent Contamination Test CabinetAircrew Processing System
Infrared heaters that rapidly heat the enclosure to ~70°C90 second processing/sample timeCW agent detector (AP2C monitor)
An approach for assessing whether to DECON or not (CCA Triage).
13
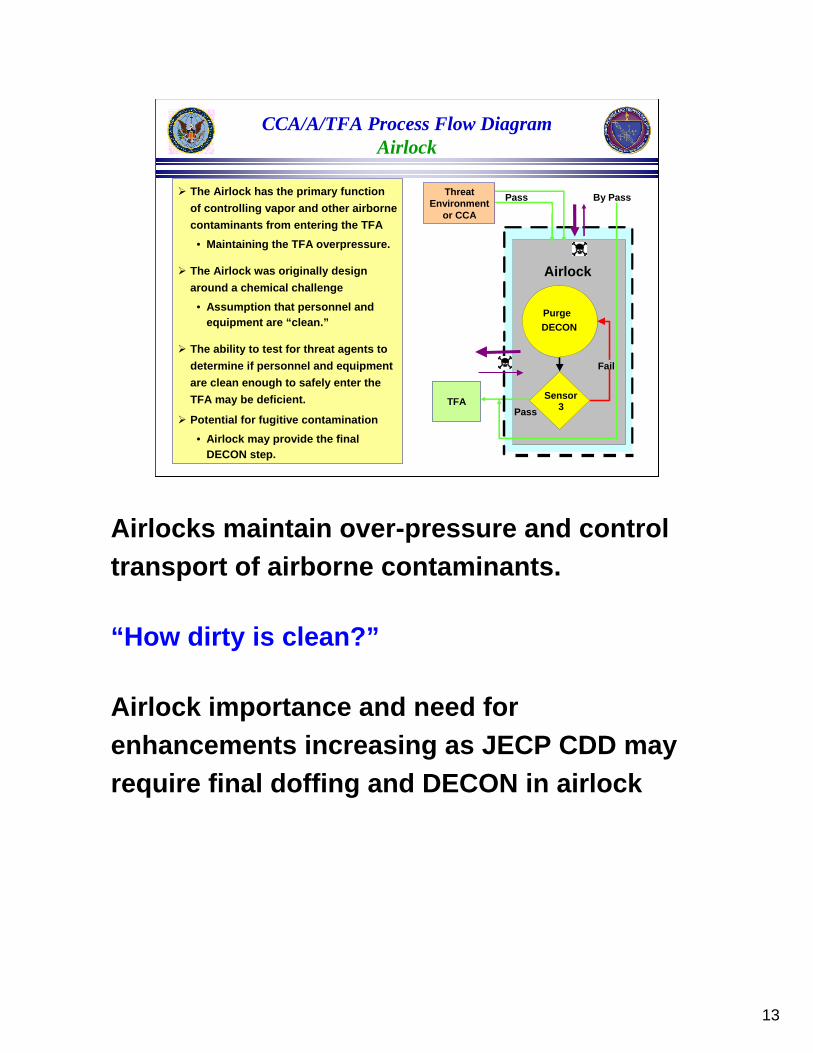
CCA/A/TFA Process Flow DiagramAirlock
PurgeDECON
Airlock
Fail
Pass
Pass
Sensor3
By PassThe Airlock has the primary function of controlling vapor and other airborne contaminants from entering the TFA
• Maintaining the TFA overpressure.
The Airlock was originally design around a chemical challenge
• Assumption that personnel and equipment are “clean.”
The ability to test for threat agents to determine if personnel and equipment are clean enough to safely enter the TFA may be deficient.
Potential for fugitive contamination • Airlock may provide the final
DECON step.
TFA
ThreatEnvironment
or CCA
Airlocks maintain over-pressure and control transport of airborne contaminants.
“How dirty is clean?”
Airlock importance and need for enhancements increasing as JECP CDD may require final doffing and DECON in airlock
14
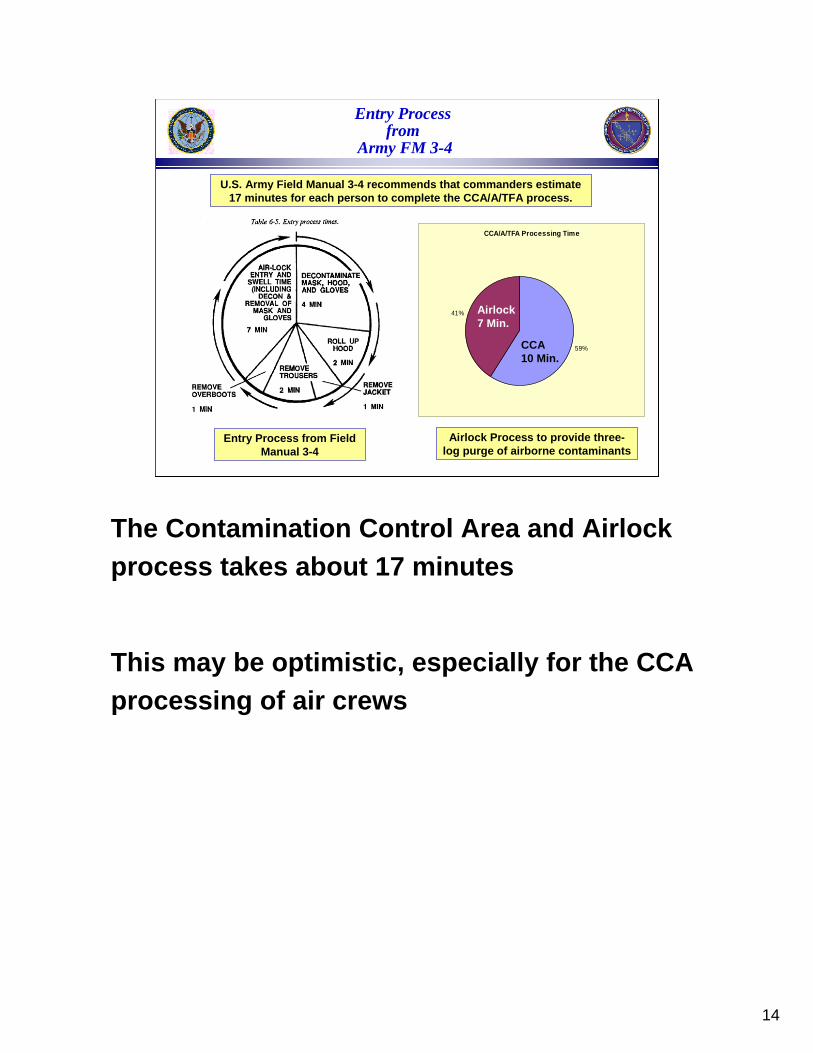
Entry Process from Field Manual 3-4
U.S. Army Field Manual 3-4 recommends that commanders estimate 17 minutes for each person to complete the CCA/A/TFA process.
Airlock Process to provide three-log purge of airborne contaminants
CCA/A/TFA Processing Time
59%
41%
CCA10 Min.
Airlock7 Min.
Entry Process from
Army FM 3-4
The Contamination Control Area and Airlock process takes about 17 minutes
This may be optimistic, especially for the CCA processing of air crews
15
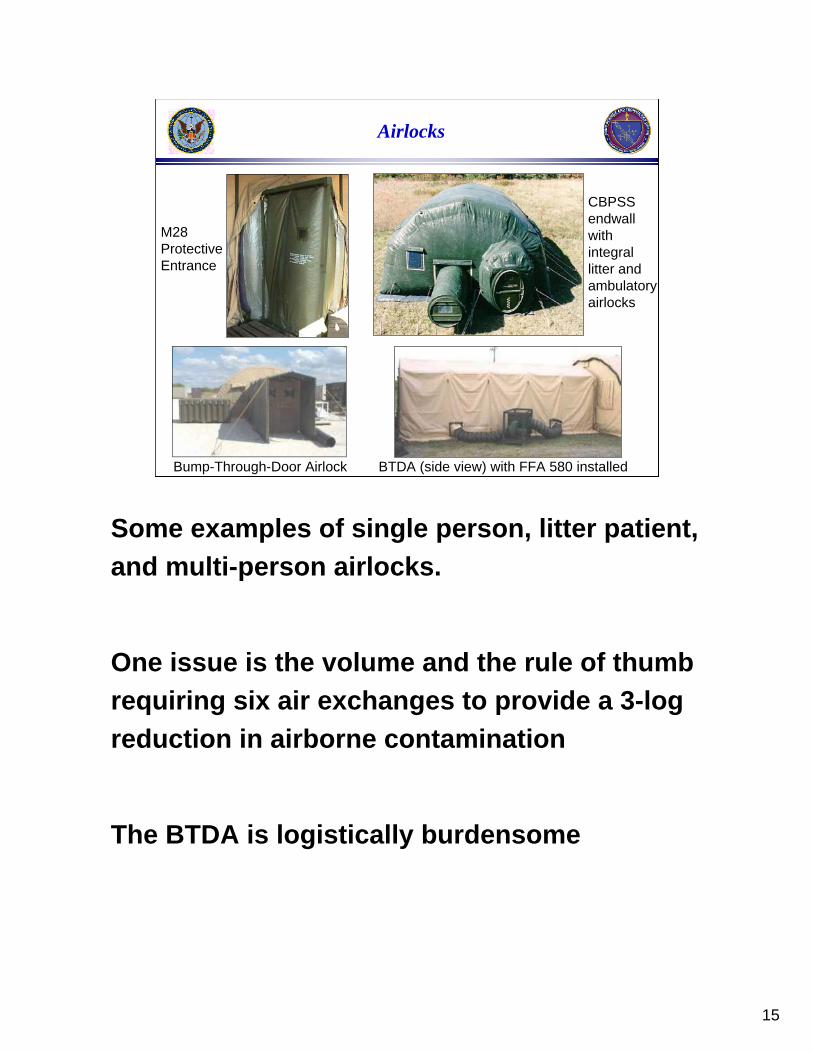
M28 Protective Entrance
BTDA (side view) with FFA 580 installed Bump-Through-Door Airlock
CBPSS endwall with integral litter and ambulatory airlocks
Airlocks
Some examples of single person, litter patient, and multi-person airlocks.
One issue is the volume and the rule of thumb requiring six air exchanges to provide a 3-log reduction in airborne contamination
The BTDA is logistically burdensome
16
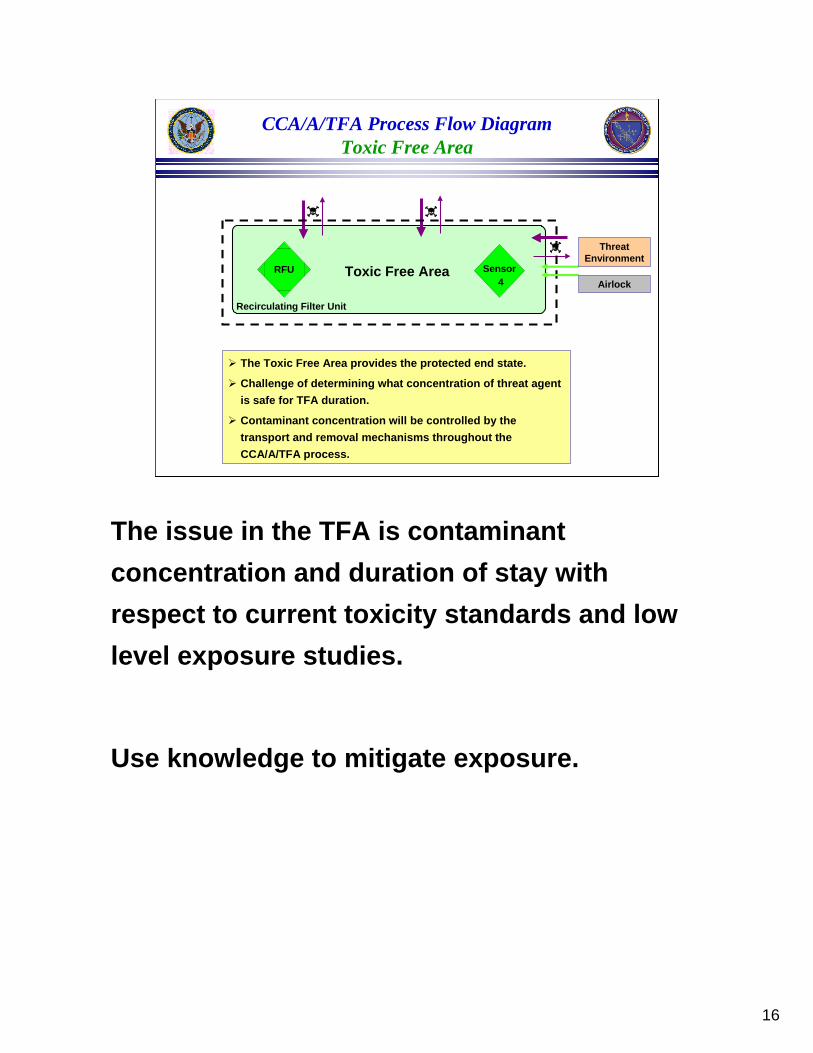
CCA/A/TFA Process Flow DiagramToxic Free Area
RFU Sensor4
Toxic Free Area
Recirculating Filter Unit
The Toxic Free Area provides the protected end state.
Challenge of determining what concentration of threat agent is safe for TFA duration.
Contaminant concentration will be controlled by the transport and removal mechanisms throughout the CCA/A/TFA process.
ThreatEnvironment
Airlock
The issue in the TFA is contaminant concentration and duration of stay with respect to current toxicity standards and low level exposure studies.
Use knowledge to mitigate exposure.
17
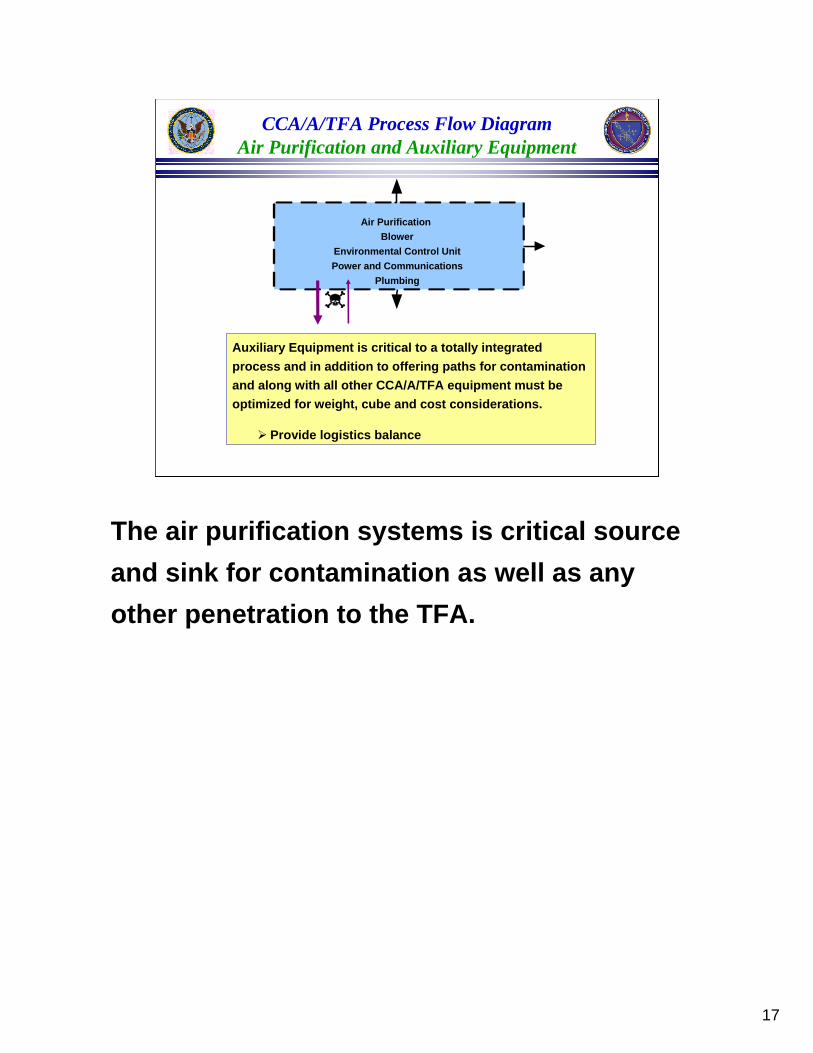
CCA/A/TFA Process Flow DiagramAir Purification and Auxiliary Equipment
Auxiliary Equipment is critical to a totally integrated process and in addition to offering paths for contamination and along with all other CCA/A/TFA equipment must be optimized for weight, cube and cost considerations.
Provide logistics balance
Air Purification Blower
Environmental Control UnitPower and Communications
Plumbing
The air purification systems is critical source and sink for contamination as well as any other penetration to the TFA.

18
Benefits
Comprehensive knowledge of CCA/A/TFA processing will enable researchers to develop enhance systems.
These enhanced systems will allow the most expeditious transition from an unprotected state or from individual protection into collective protection while maintaining highest protection factor in the toxic free area.
CCA/A/TFA Process Analysis
The analysis focusing on identifying “weak links” will help direct system improvements.
19
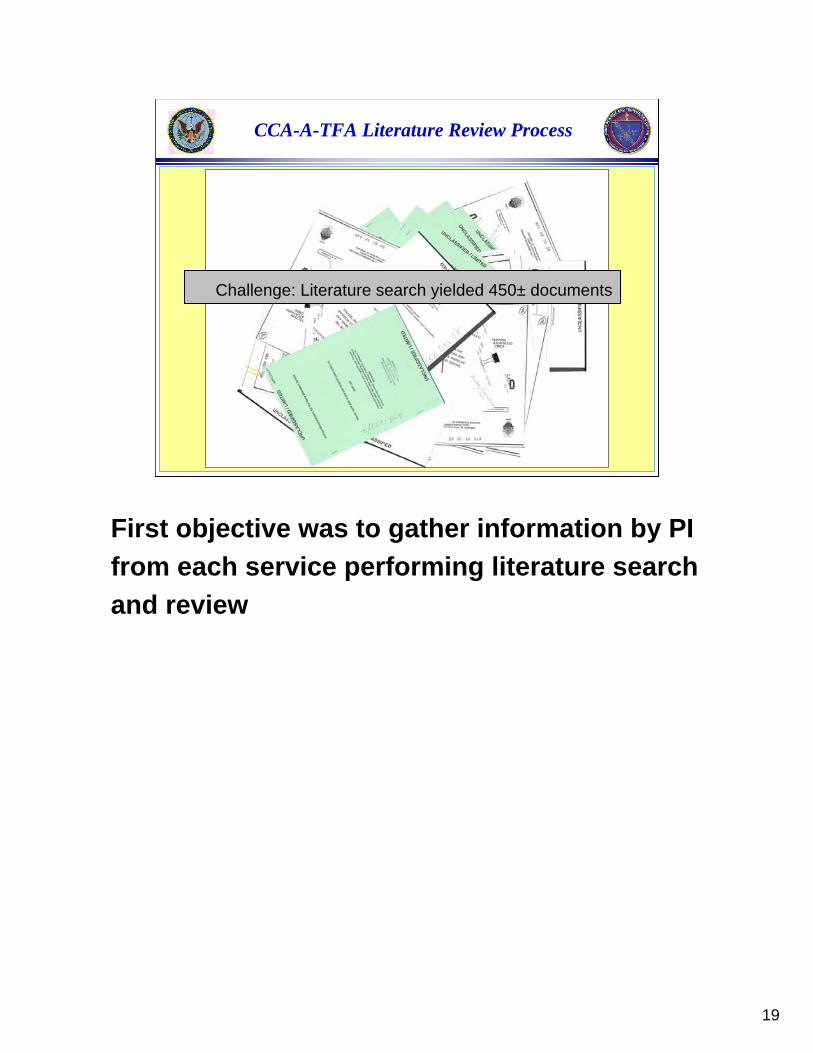
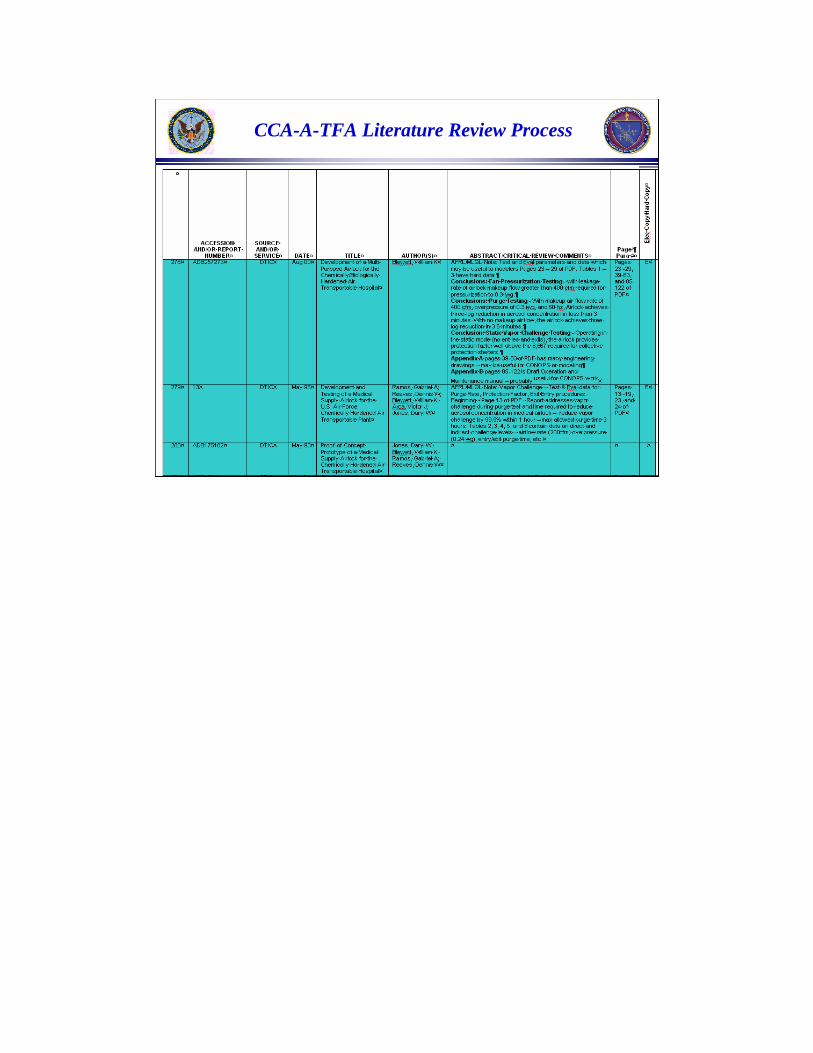
CCA-A-TFA Literature Review Process
Challenge: Literature search yielded 450± documents
First objective was to gather information by PI from each service performing literature search and review
20
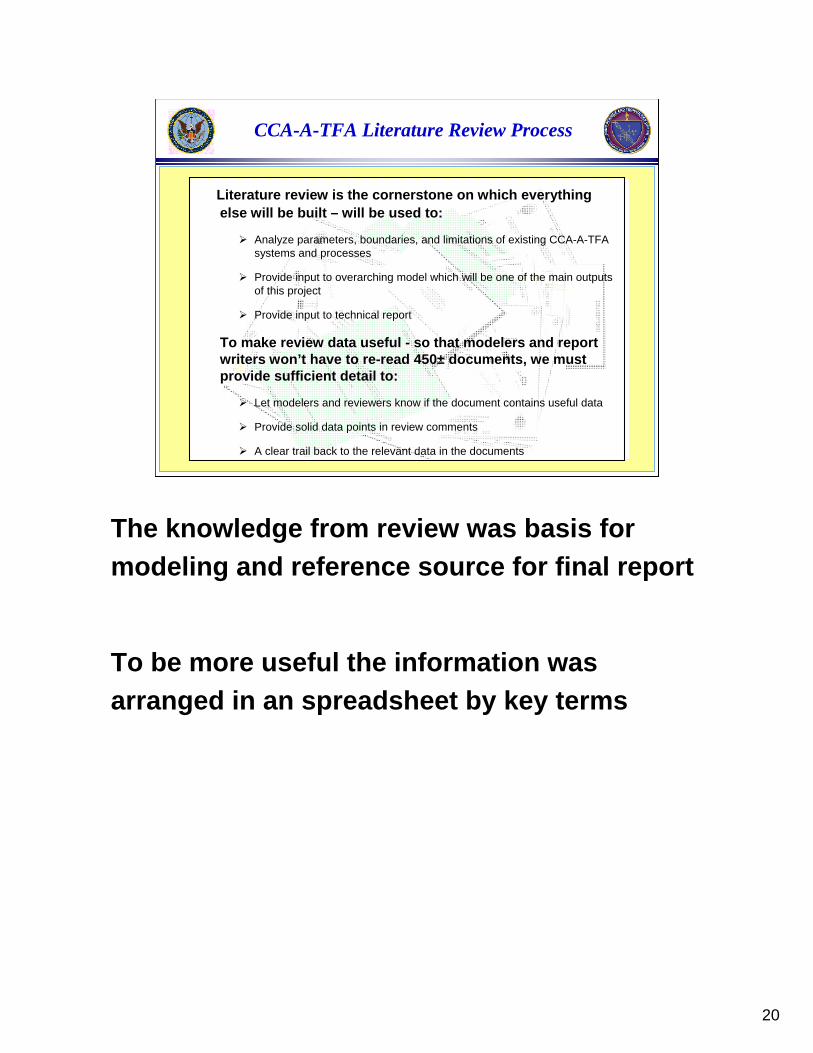
CCA-A-TFA Literature Review Process
Literature review is the cornerstone on which everything else will be built – will be used to:
Analyze parameters, boundaries, and limitations of existing CCA-A-TFA systems and processes
Provide input to overarching model which will be one of the main outputs of this project
Provide input to technical report
To make review data useful - so that modelers and report writers won’t have to re-read 450± documents, we must provide sufficient detail to:
Let modelers and reviewers know if the document contains useful data
Provide solid data points in review comments
A clear trail back to the relevant data in the documents
The knowledge from review was basis for modeling and reference source for final report
To be more useful the information was arranged in an spreadsheet by key terms
21
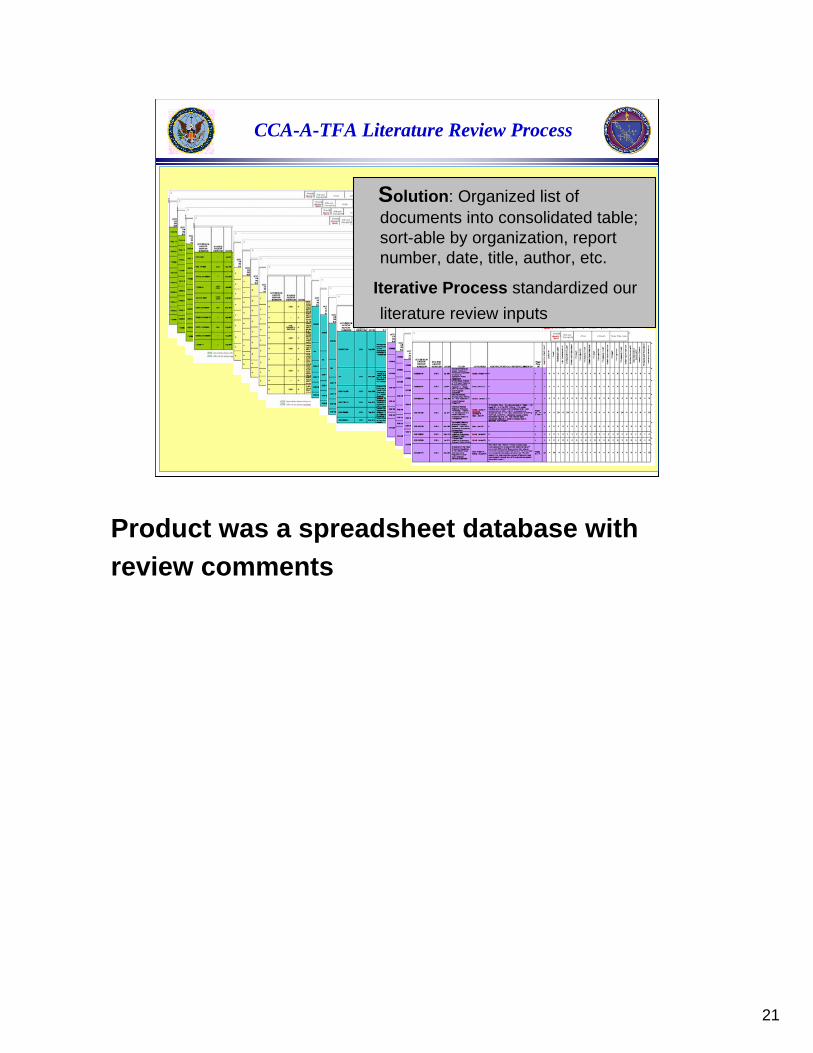
CCA-A-TFA Literature Review Process
Solution: Organized list of documents into consolidated table; sort-able by organization, report number, date, title, author, etc.
Iterative Process standardized our literature review inputs
Product was a spreadsheet database with review comments
CCA-A-TFA Literature Review Process
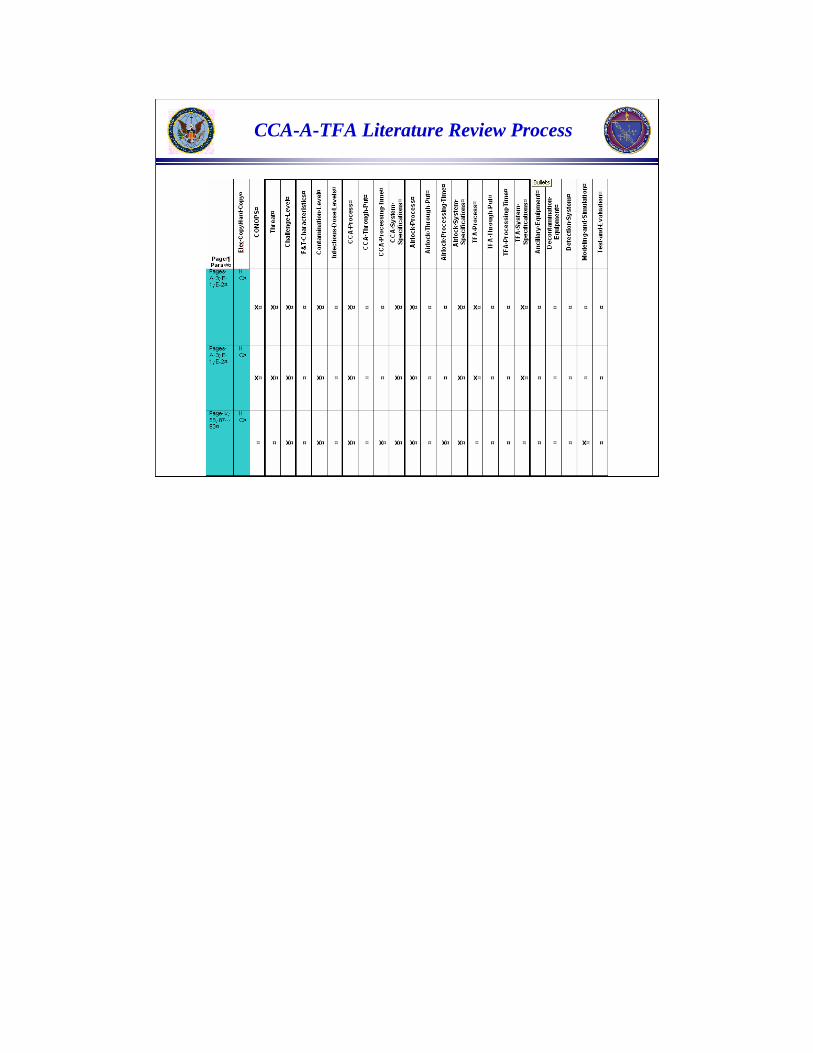
CCA-A-TFA Literature Review Process
24
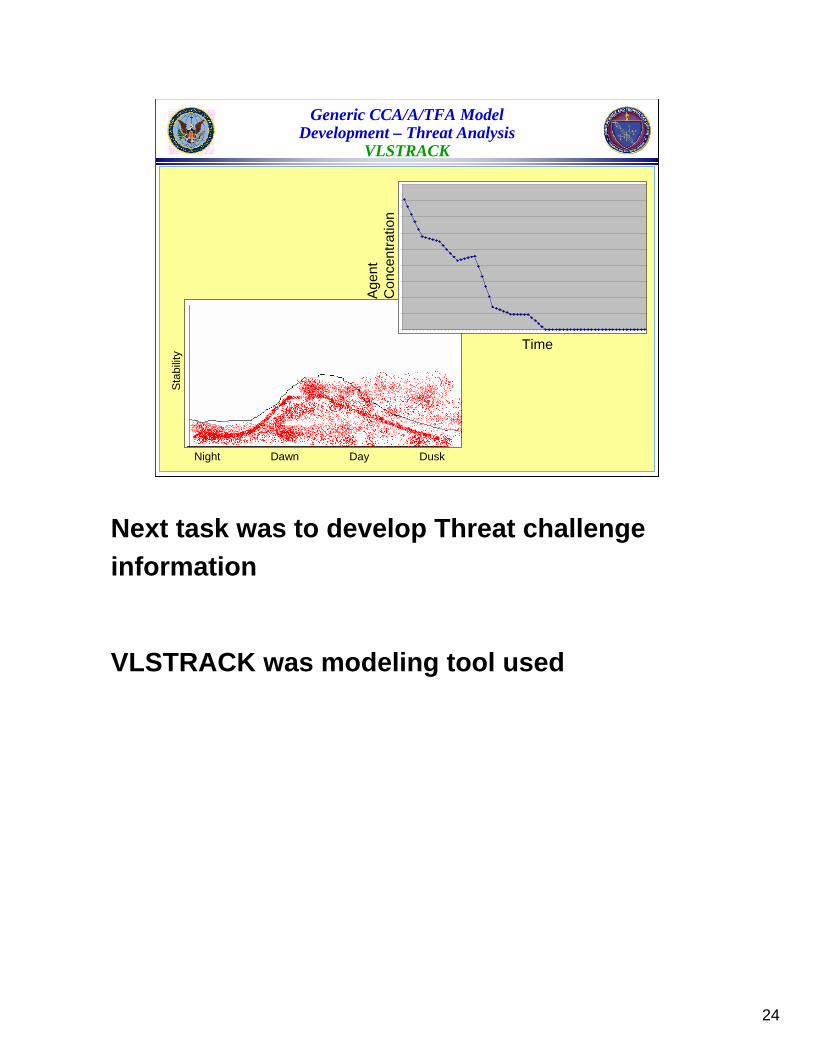
Generic CCA/A/TFA Model Development – Threat Analysis
VLSTRACK
Age
ntC
once
ntra
tion
Time
Sta
bilit
y
Night Dawn Day Dusk
Next task was to develop Threat challenge information
VLSTRACK was modeling tool used
25
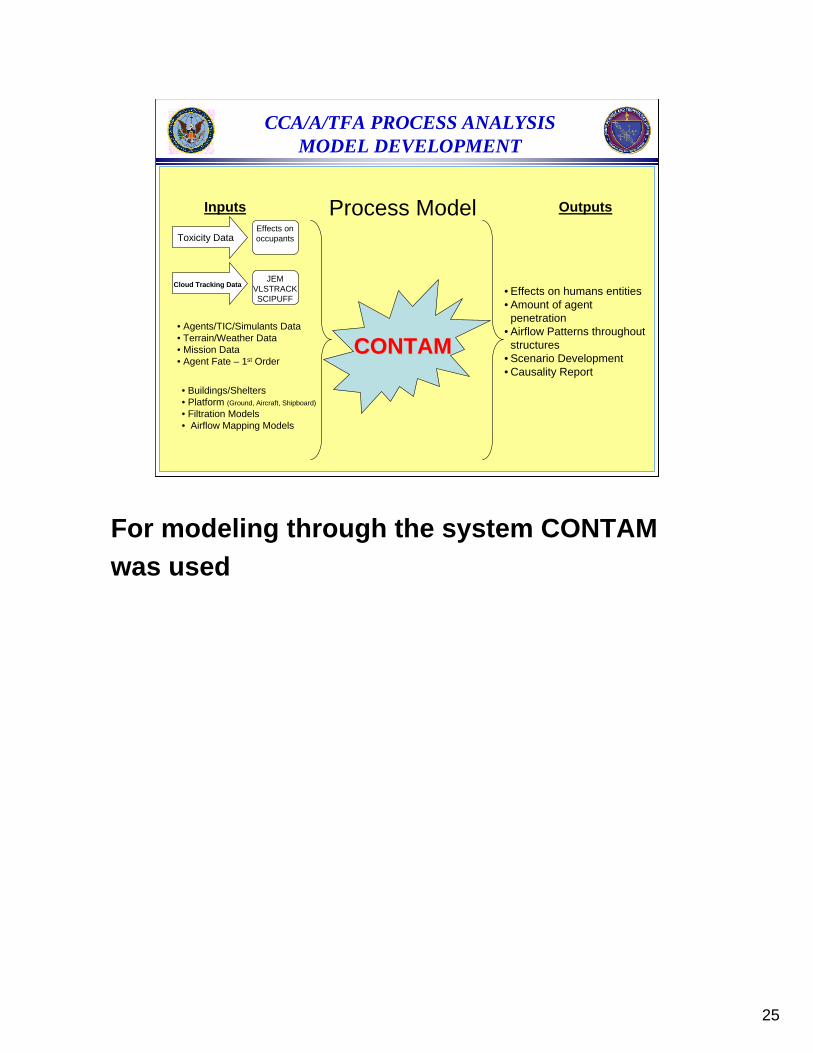
Process Model OutputsEffects on occupantsToxicity Data
Cloud Tracking DataJEM
VLSTRACKSCIPUFF
• Agents/TIC/Simulants Data• Terrain/Weather Data• Mission Data• Agent Fate – 1st Order
• Buildings/Shelters• Platform (Ground, Aircraft, Shipboard)
• Filtration Models• Airflow Mapping Models
Inputs
CCA/A/TFA PROCESS ANALYSISMODEL DEVELOPMENT
• Effects on humans entities• Amount of agent
penetration• Airflow Patterns throughout
structures• Scenario Development• Causality Report
CONTAMCONTAM
For modeling through the system CONTAM was used
26
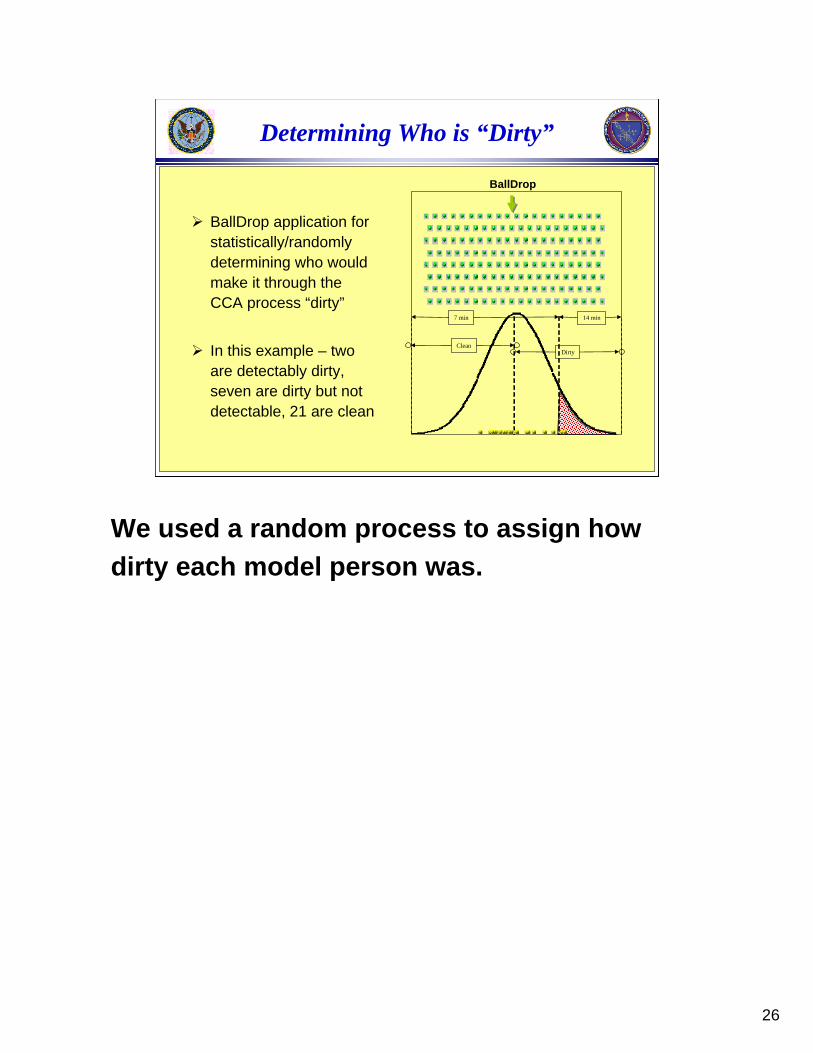
Determining Who is “Dirty”
BallDrop application for statistically/randomly determining who would make it through the CCA process “dirty”
In this example – two are detectably dirty, seven are dirty but not detectable, 21 are clean
14 min7 min
CleanDirty
BallDrop
We used a random process to assign how dirty each model person was.
27
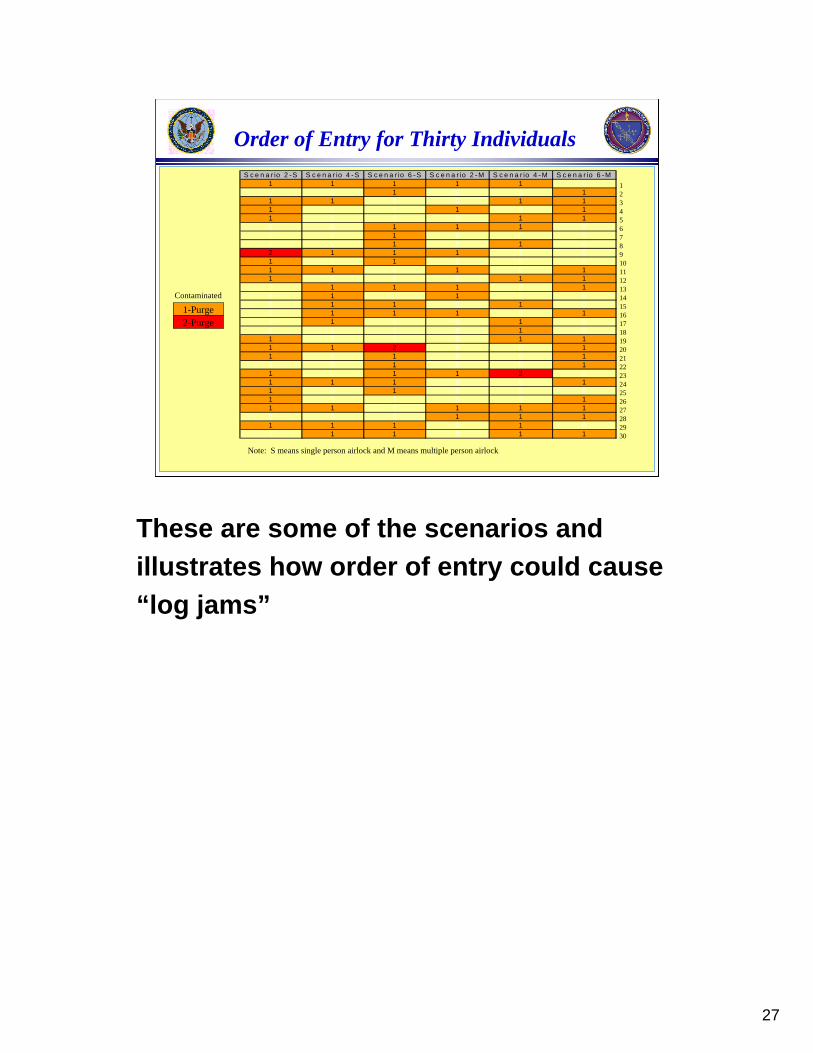
Order of Entry for Thirty IndividualsS c e n a r io 2 -S S c e n a r io 4 -S S c e n a r io 6 -S S c e n a r io 2 -M S c e n a r io 4 -M S c e n a r io 6 -M
1 1 1 1 1 00 0 1 0 0 11 1 0 0 1 11 0 0 1 0 11 0 0 0 1 10 0 1 1 1 00 0 1 0 0 00 0 1 0 1 02 1 1 1 0 01 0 1 0 0 01 1 0 1 0 11 0 0 0 1 10 1 1 1 0 10 1 0 1 0 00 1 1 0 1 00 1 1 1 0 10 1 0 0 1 00 0 0 0 1 01 0 0 0 1 11 1 2 0 0 11 0 1 0 0 10 0 1 0 0 11 0 1 1 2 01 1 1 0 0 11 0 1 0 0 01 0 0 0 0 11 1 0 1 1 10 0 0 1 1 11 1 1 0 1 00 1 1 0 1 1
1-Purge2-Purge
Contaminated
123456789101112131415161718192021222324252627282930
Note: S means single person airlock and M means multiple person airlock
These are some of the scenarios and illustrates how order of entry could cause “log jams”

28
Model Results – ExampleSingle Person Scenario 2
0.00E+00
2.00E-02
4.00E-02
6.00E-02
8.00E-02
1.00E-01
1.20E-01
0:00:0
0
0:09:0
0
0:18:00
0:27:0
0
0:36:0
0
0:45:0
0
0:54:0
0
1:03:0
0
1:12:0
0
1:21:0
0
1:30:0
0
1:39:00
1:48:0
0
1:57:0
0
2:06:0
0
2:15:0
0
2:24:0
0
2:33:0
0
2:42:0
0
2:51:0
0
3:00:0
0
3:09:0
0
3:18:0
0
3:27:0
0
3:36:00
3:45:0
0
3:54:0
0
4:03:0
0
4:12:0
0
4:21:0
0
4:30:0
0
4:39:0
0
4:48:0
0
4:57:00
(g
)
Airlock TFA
On left animation shows contamination concentration in CCA/A/TFA and graph on right shows concentration spikes from individuals processing through single person airlock over time.
Single person airlock maintains low concentrations in TFA but required almost four hours to process 30 individuals.
29
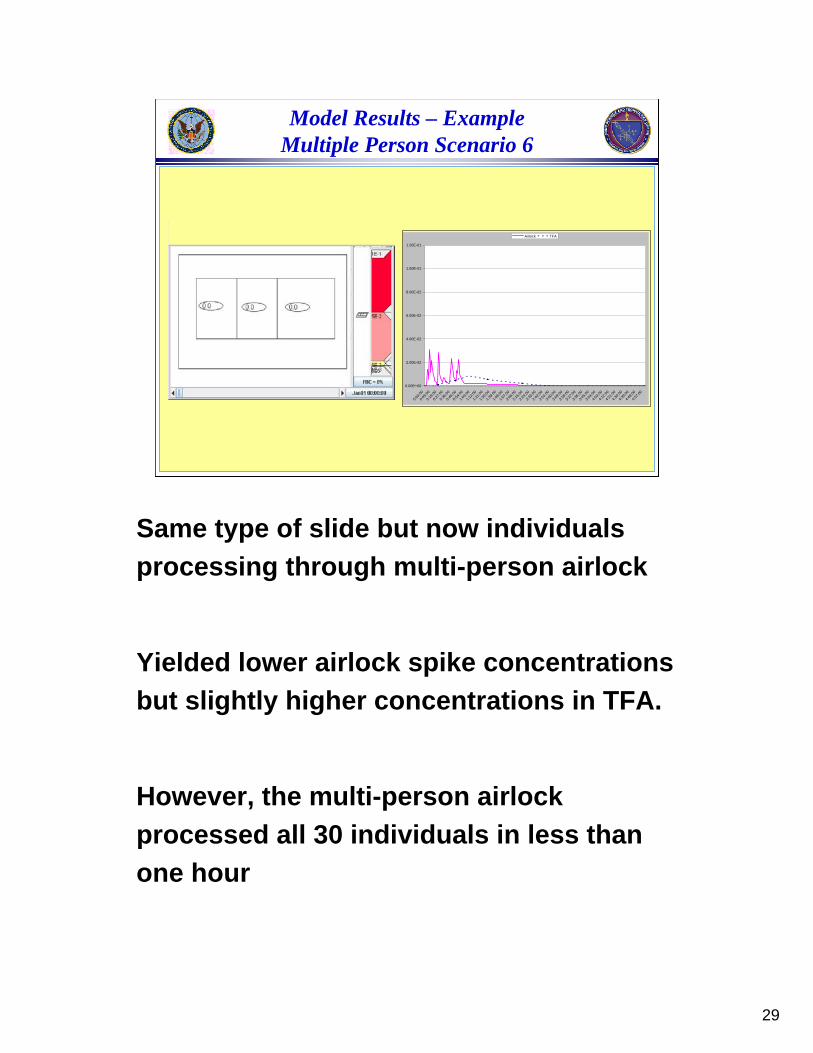
Model Results – ExampleMultiple Person Scenario 6
0.00E+00
2.00E-02
4.00E-02
6.00E-02
8.00E-02
1.00E-01
1.20E-01
0:00:0
0
0:09:0
0
0:18:0
0
0:27:0
0
0:36:0
0
0:45:0
0
0:54:0
0
1:03:0
0
1:12:0
0
1:21:0
0
1:30:0
0
1:39:0
0
1:48:0
0
1:57:0
0
2:06:0
0
2:15:0
0
2:24:0
0
2:33:0
0
2:42:0
0
2:51:0
0
3:00:0
0
3:09:0
0
3:18:0
0
3:27:0
0
3:36:0
0
3:45:0
0
3:54:0
0
4:03:0
0
4:12:0
0
4:21:0
0
4:30:0
0
4:39:0
0
4:48:0
0
4:57:0
0
(g
)
Airlock TFA
Same type of slide but now individuals processing through multi-person airlock
Yielded lower airlock spike concentrations but slightly higher concentrations in TFA.
However, the multi-person airlock processed all 30 individuals in less than one hour
30
Person2 - contaminated
Person3 - contaminated
Person4 - contaminated
Person5 - contaminated
Person11 - contaminated
Person12 - contaminated
Person13 - contaminated
Person16 - contaminated
Person19 - contaminated
Person20 - contaminated
Person21 - contaminated
Person22 - contaminated
Person24 - contaminated
Person26 - contaminated
Person27 - contaminated
Person28 - contaminated
Person30 - contaminated
Concentration [mg/m³]
Dosage [(mg·min)/m³]
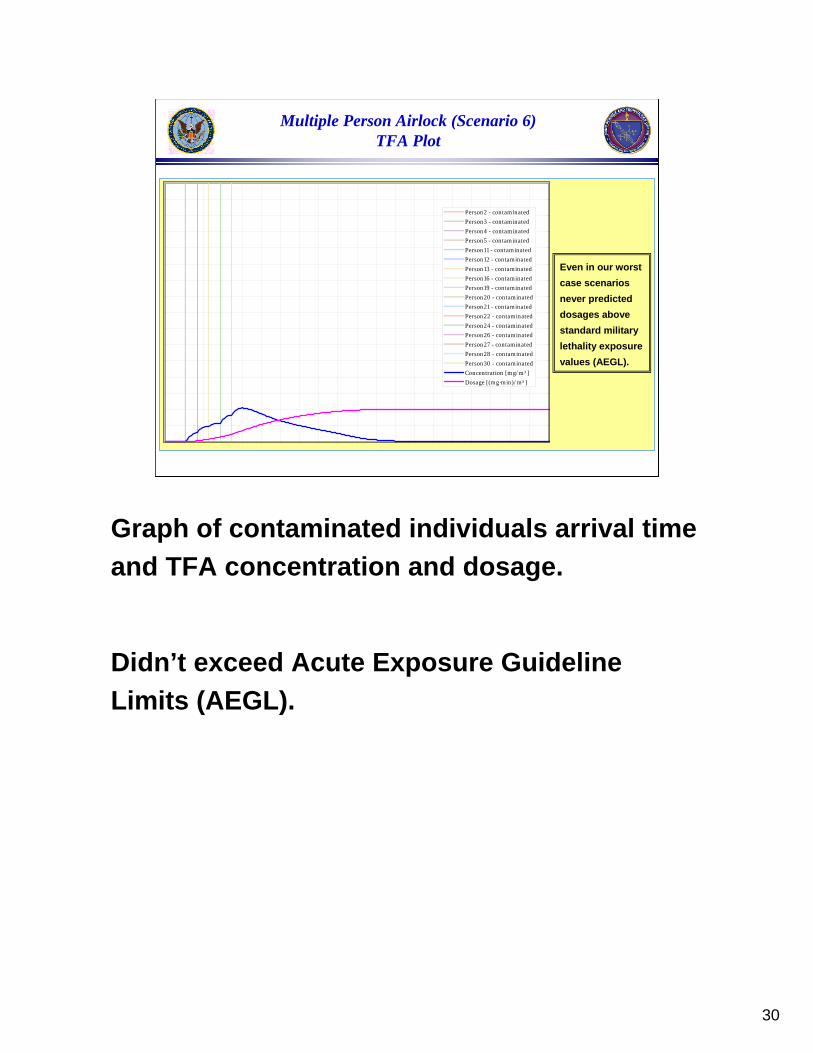
Multiple Person Airlock (Scenario 6)TFA Plot
Even in our worst case scenarios never predicted dosages above standard military lethality exposure values (AEGL).
Graph of contaminated individuals arrival time and TFA concentration and dosage.
Didn’t exceed Acute Exposure Guideline Limits (AEGL).
31
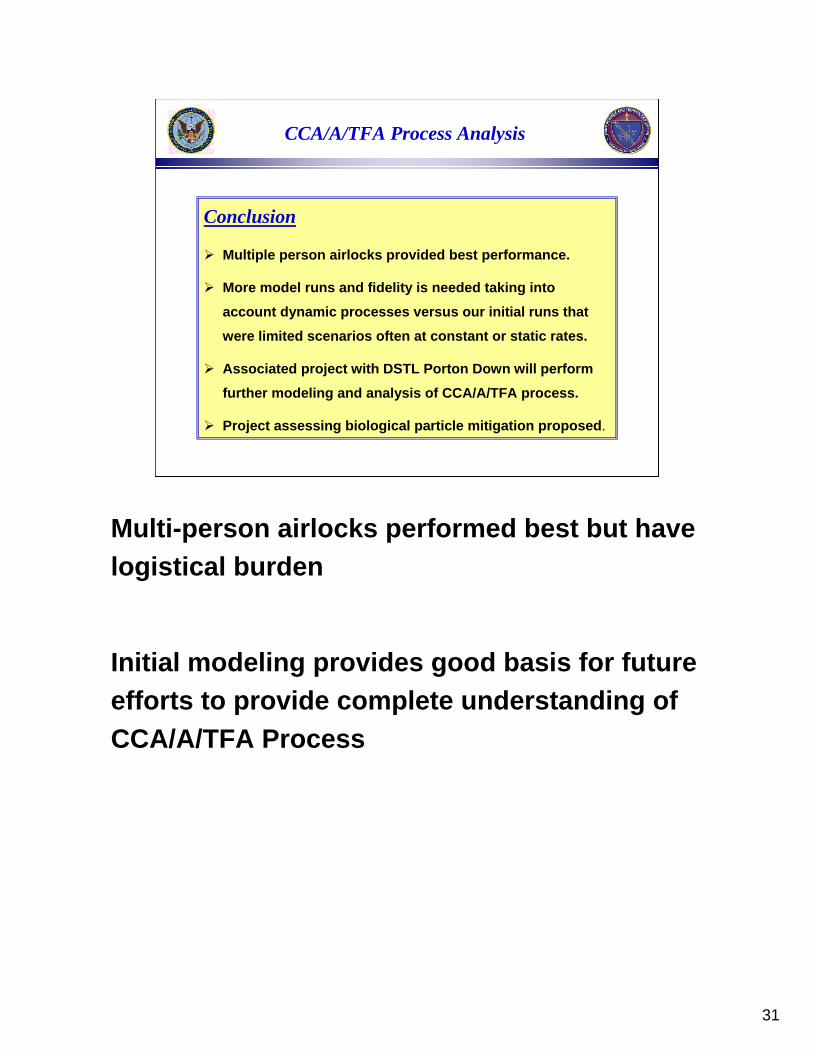
Conclusion
Multiple person airlocks provided best performance.
More model runs and fidelity is needed taking into
account dynamic processes versus our initial runs that
were limited scenarios often at constant or static rates.
Associated project with DSTL Porton Down will perform
further modeling and analysis of CCA/A/TFA process.
Project assessing biological particle mitigation proposed.
CCA/A/TFA Process Analysis
Multi-person airlocks performed best but have logistical burden
Initial modeling provides good basis for future efforts to provide complete understanding of CCA/A/TFA Process
32
Thank You!

![Investigation of Purging and Airlock Contamination of ... · NIOSH [2014]. Investigation of Purging and Airlock Contamination of Mobile Refuge Alternatives. By Bauer ER, Matty TJ,](https://img.dokumen.tips/doc/110x75/5ed07f145eaa90553a7cafb9/investigation-of-purging-and-airlock-contamination-of-niosh-2014-investigation.jpg)