Embed Size (px)
Citation preview
1 | P a g e
Consumer Satisfaction Survey
2010
Summary Report
2 | P a g e
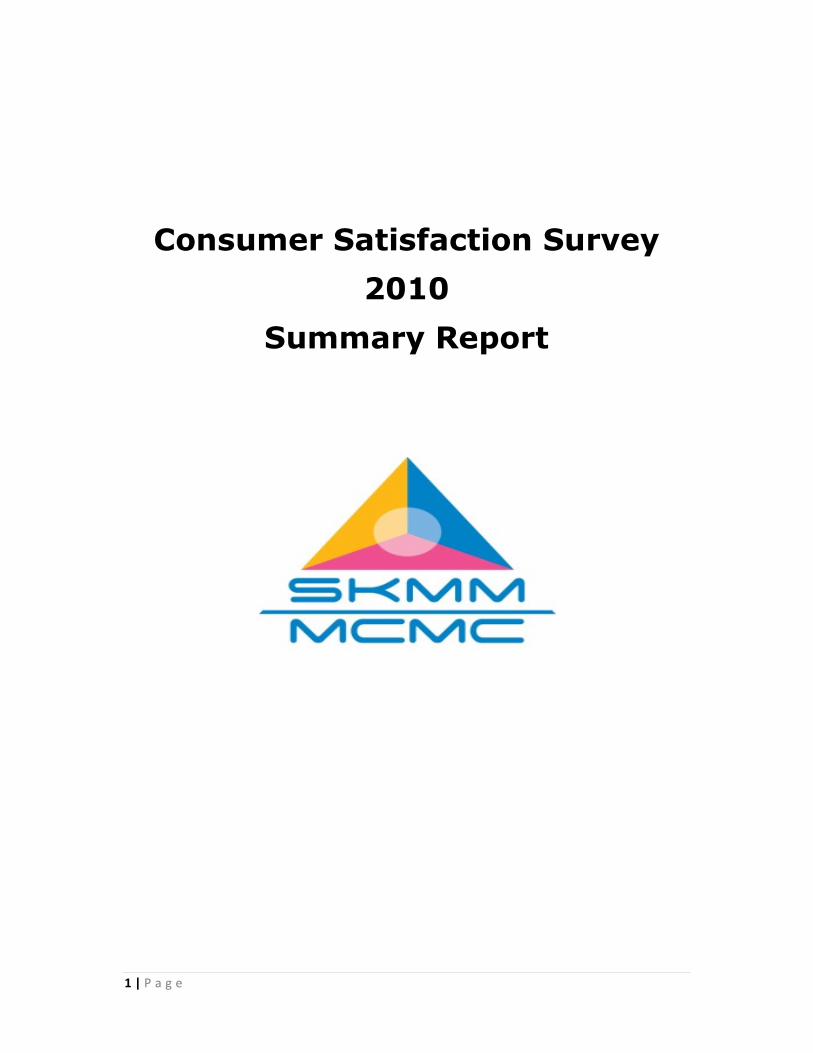
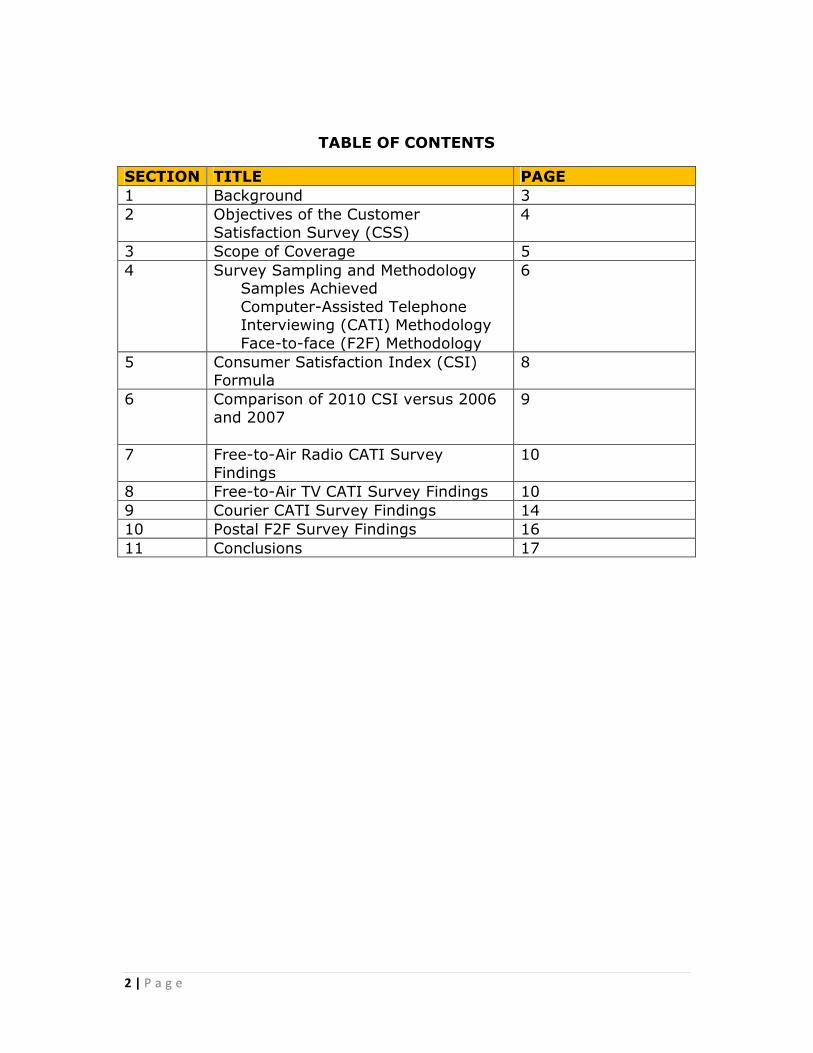
TABLE OF CONTENTS
SECTION TITLE PAGE
1 Background 3
2 Objectives of the Customer
Satisfaction Survey (CSS)
4
3 Scope of Coverage 5
4 Survey Sampling and Methodology Samples Achieved
Computer-Assisted Telephone
Interviewing (CATI) Methodology
Face-to-face (F2F) Methodology
6
5 Consumer Satisfaction Index (CSI)
Formula
8
6 Comparison of 2010 CSI versus 2006 and 2007
9
7 Free-to-Air Radio CATI Survey
Findings
10
8 Free-to-Air TV CATI Survey Findings 10
9 Courier CATI Survey Findings 14
10 Postal F2F Survey Findings 16
11 Conclusions 17
3 | P a g e
1. Background
Consumer Satisfaction is a measure of how products and services supplied by a
company meet or exceed customer expectations. Customer satisfaction is
defined as the number of customers or percentage of total customers, whose
reported experience with a firm, its products or its services exceeds specified
satisfaction goals.
The Consumer Satisfaction Survey (CSS) forms a major part of SKMM’s quality
of service monitoring and is considered one of the benchmark (consumer’s
perspective) on the level of satisfaction of the various services provided to them.
The results of the survey presents an insight into the consumers’ perceived
performance level of the services offered by the various service providers and
the importance of the services. These results thus allowed all parties (SKMM
and service providers) to prioritize relevant issues to be addressed strategically
and tactically.
Since 2001, the Malaysian Communications and Multimedia Commission (SKMM)
has been conducting the Consumer Satisfaction Survey (CSS) once every six
months. By end of 2010, the SKMM had conducted a total of NINE (9) surveys
over the 10 year period. The last survey before the 2010 CSS described in this
report was conducted at the end of 2007, which covered ELEVEN (11) types of
services. The following Table 1 and Table 2 show a summary of these surveys:
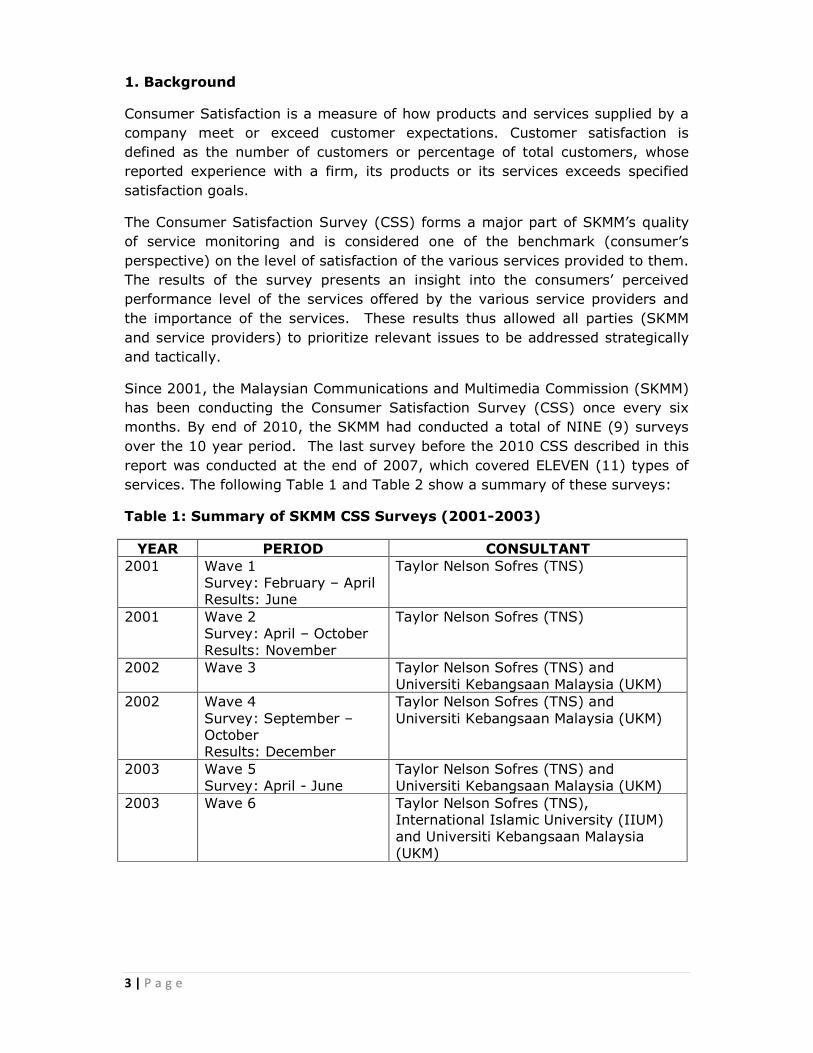
Table 1: Summary of SKMM CSS Surveys (2001-2003)
YEAR PERIOD CONSULTANT
2001 Wave 1
Survey: February – April Results: June
Taylor Nelson Sofres (TNS)
2001 Wave 2
Survey: April – October
Results: November
Taylor Nelson Sofres (TNS)
2002 Wave 3 Taylor Nelson Sofres (TNS) and
Universiti Kebangsaan Malaysia (UKM)
2002 Wave 4
Survey: September – October Results: December
Taylor Nelson Sofres (TNS) and
Universiti Kebangsaan Malaysia (UKM)
2003 Wave 5
Survey: April - June
Taylor Nelson Sofres (TNS) and
Universiti Kebangsaan Malaysia (UKM)
2003 Wave 6
Taylor Nelson Sofres (TNS), International Islamic University (IIUM)
and Universiti Kebangsaan Malaysia
(UKM)
4 | P a g e
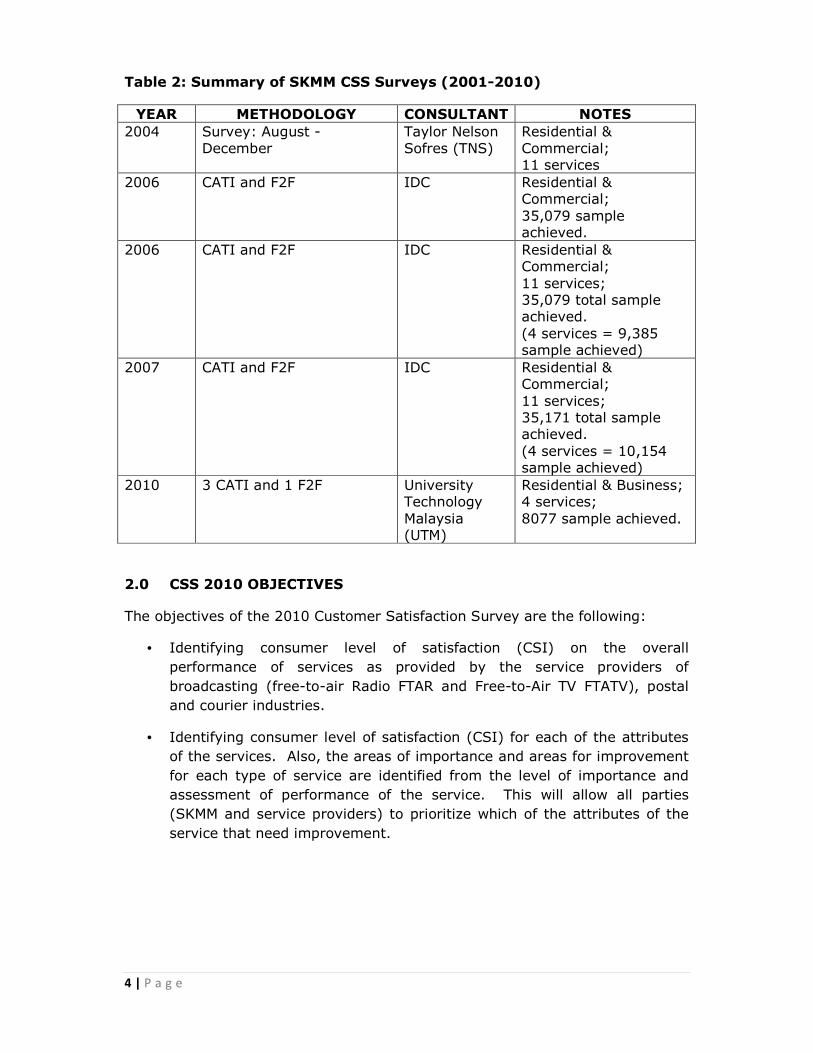
Table 2: Summary of SKMM CSS Surveys (2001-2010)
YEAR METHODOLOGY CONSULTANT NOTES
2004 Survey: August -
December
Taylor Nelson
Sofres (TNS)
Residential &
Commercial; 11 services
2006 CATI and F2F IDC Residential & Commercial;
35,079 sample achieved.
2006 CATI and F2F IDC Residential & Commercial;
11 services; 35,079 total sample achieved.
(4 services = 9,385 sample achieved)
2007 CATI and F2F IDC Residential & Commercial;
11 services; 35,171 total sample achieved.
(4 services = 10,154 sample achieved)
2010 3 CATI and 1 F2F University Technology
Malaysia (UTM)
Residential & Business; 4 services;
8077 sample achieved.
2.0 CSS 2010 OBJECTIVES
The objectives of the 2010 Customer Satisfaction Survey are the following:
• Identifying consumer level of satisfaction (CSI) on the overall
performance of services as provided by the service providers of
broadcasting (free-to-air Radio FTAR and Free-to-Air TV FTATV), postal
and courier industries.
• Identifying consumer level of satisfaction (CSI) for each of the attributes
of the services. Also, the areas of importance and areas for improvement
for each type of service are identified from the level of importance and
assessment of performance of the service. This will allow all parties
(SKMM and service providers) to prioritize which of the attributes of the
service that need improvement.
5 | P a g e
3.0 SCOPE OF COVERAGE
In 2010 SKMM organised another CSS survey after an almost three-year lapse
from the 2007 survey. The 2010 CSS survey was conducted by a team from
Universiti Teknologi Malaysia (UTM) and encompassed only four (4) services i.e.
free to air television (FTATV), free to air radio (FTAR), postal and courier
services involving a total of 8077 number of respondents. Like the previous
surveys conducted in 2006 and 2007 (conducted by IDC and spanning over 11
services), this latest survey also utilised Computer Assisted Telephone
Interviews (CATI) for the FTAR, FTATV and courier service whilst the postal
service survey utilised Face to Face (F2F) interviews.
The target respondents for the CATI survey are adult user/viewers/listeners
aged 15 years old and above whilst the respondents for F2F are commercial
courier users. Analysis of CSI of all service providers are provided for FTAR,
FTATV and courier services.
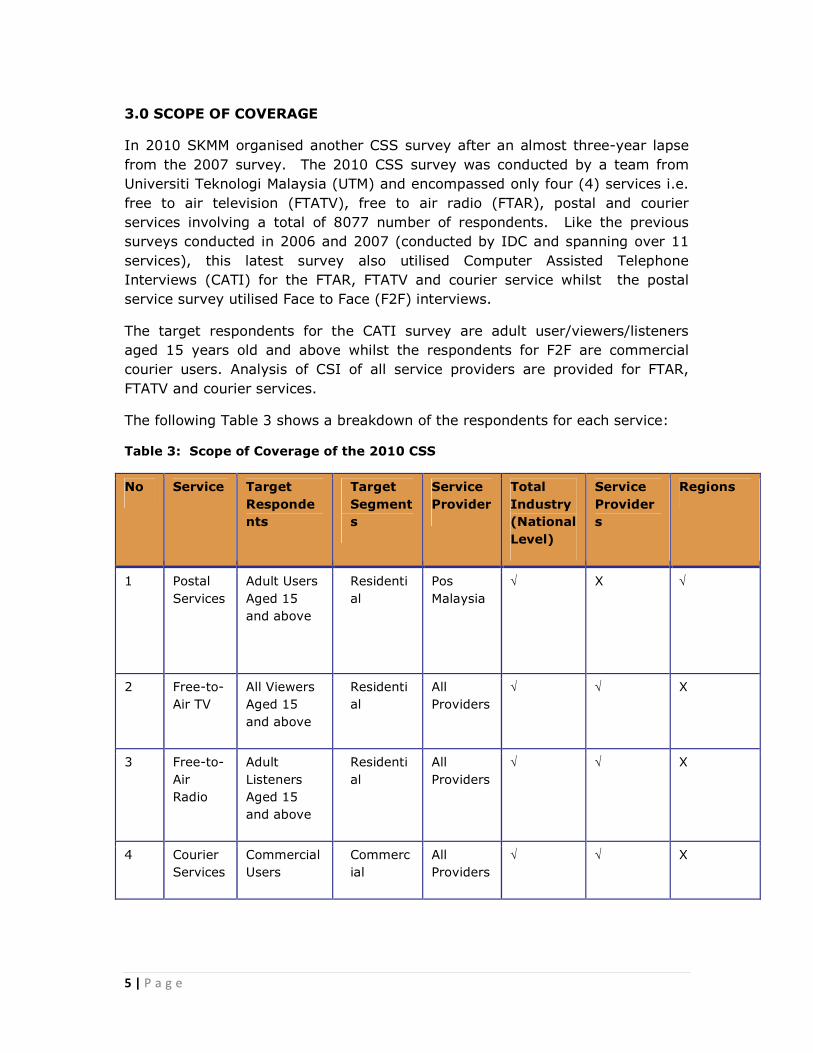
The following Table 3 shows a breakdown of the respondents for each service:
Table 3: Scope of Coverage of the 2010 CSS
No Service Target
Responde
nts
Target
Segment
s
Service
Provider
Total
Industry
(National
Level)
Service
Provider
s
Regions
1 Postal
Services
Adult Users
Aged 15
and above
Residenti
al
Pos
Malaysia
√ X √
2 Free-to-
Air TV
All Viewers
Aged 15
and above
Residenti
al
All
Providers
√ √ X
3 Free-to-
Air
Radio
Adult
Listeners
Aged 15
and above
Residenti
al
All
Providers
√ √ X
4 Courier
Services
Commercial
Users
Commerc
ial
All
Providers
√ √ X
6 | P a g e
4.0 Sampling and Methodology
The population group of the surveys were all users aged 15 years and above
while the population segment was residential mobile phone users (for FTAR,
FTATV and postal) and commercial courier users. Details of the sampling and
methodology used are as follows.
4.1 Sampling
In order to achieve a confidence Interval based on 95% with at least +/- 4% at
the national level and +/- 5% at the regional level the following strategy of
sample selection was utilised.
The sample size was calculated based on a large unknown population (for users
of postal services, FTATV and FTAR) and business directory of the Malaysia
Online Yellow Pages (the courier services). Derivations of the samples were
based on the following:
• For FTATV and FTAR services samples were derived at random from
Computer Generated Random Digit numbers of those accessible from
mobile phone as of November 30, 2010
• For Courier Services samples were derived at random from business users
accessible through fixed line numbers found in the online Yellow Pages as
of November 30, 2010
• For Postal Services samples were derived at random from users of postal
services at 31 selected locations during 6th-24th December 2010. These
locations were selected proportionately according to the distribution of
post offices in each state and region totalling 699 altogether.
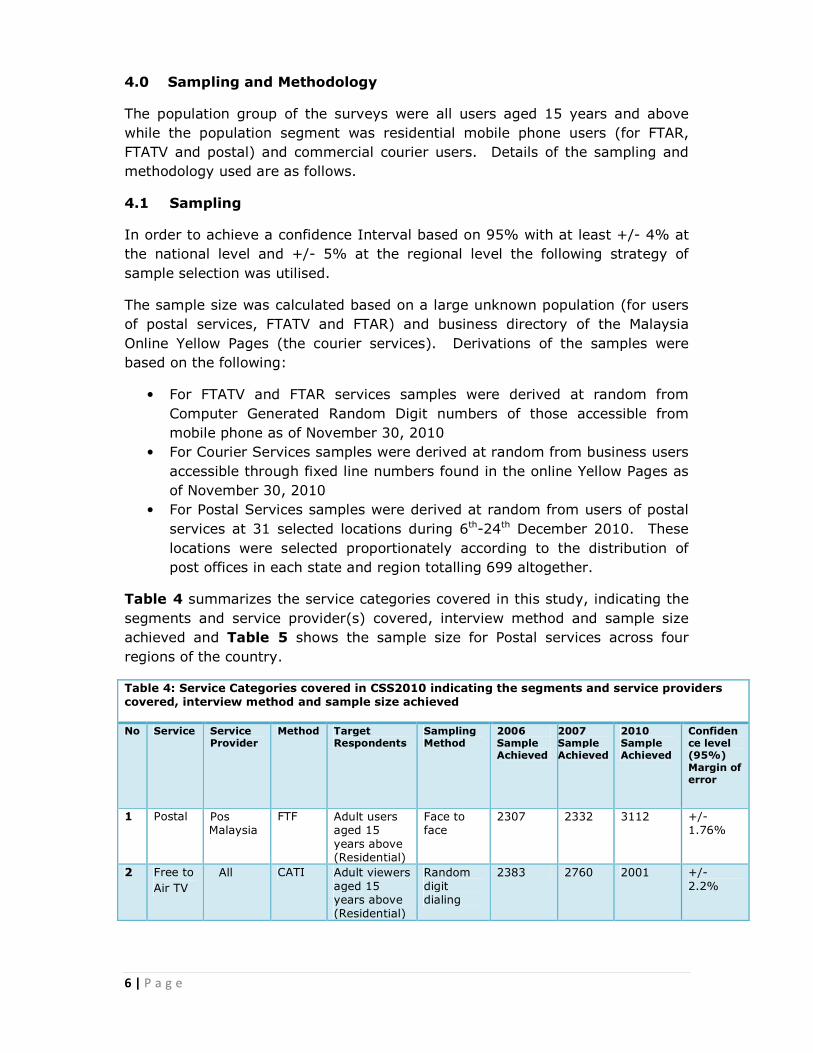
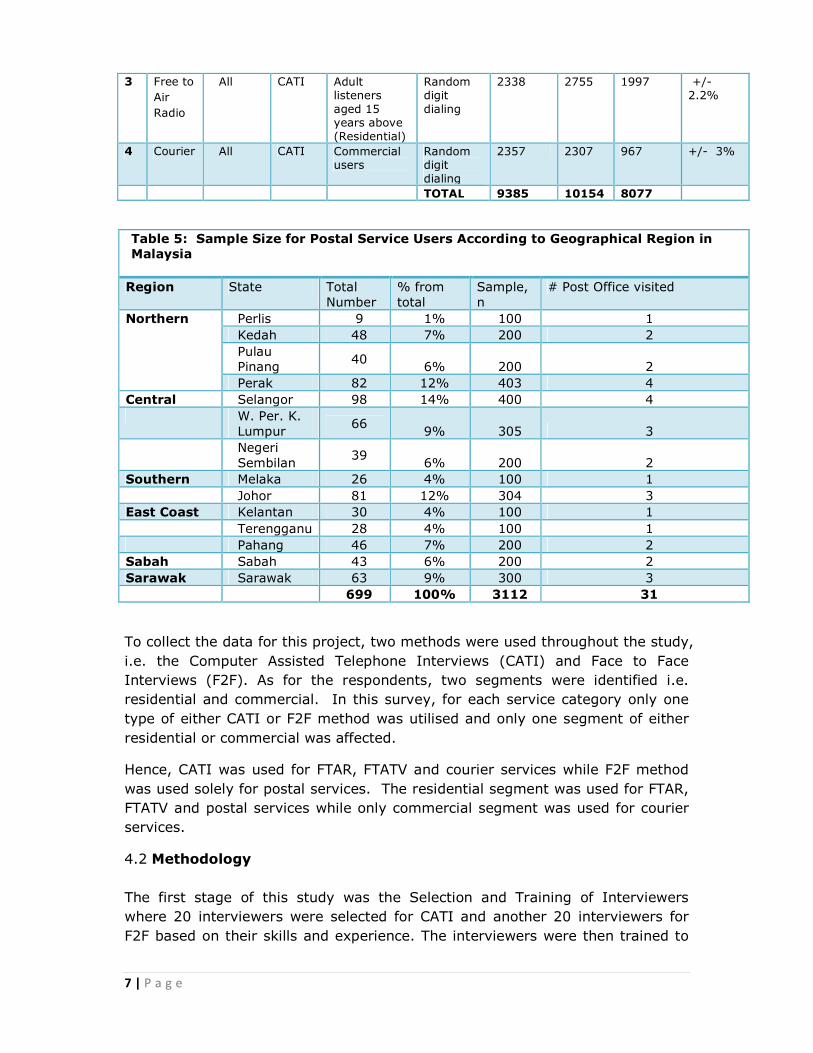
Table 4 summarizes the service categories covered in this study, indicating the
segments and service provider(s) covered, interview method and sample size
achieved and Table 5 shows the sample size for Postal services across four
regions of the country.
Table 4: Service Categories covered in CSS2010 indicating the segments and service providers
covered, interview method and sample size achieved
No Service Service Provider
Method Target Respondents
Sampling Method
2006 Sample Achieved
2007 Sample Achieved
2010 Sample Achieved
Confidence level (95%)
Margin of error
1 Postal Pos Malaysia
FTF Adult users aged 15
years above (Residential)
Face to face
2307 2332 3112 +/-1.76%
2 Free to
Air TV
All CATI Adult viewers
aged 15 years above
(Residential)
Random
digit dialing
2383 2760 2001 +/-
2.2%
7 | P a g e
3 Free to
Air
Radio
All CATI Adult listeners
aged 15 years above
(Residential)
Random digit
dialing
2338 2755 1997 +/- 2.2%
4 Courier All CATI Commercial users
Random digit
dialing
2357 2307 967 +/- 3%
TOTAL 9385 10154 8077
Table 5: Sample Size for Postal Service Users According to Geographical Region in
Malaysia
Region State Total
Number
% from
total
Sample,
n
# Post Office visited
Northern Perlis 9 1% 100 1
Kedah 48 7% 200 2
Pulau
Pinang 40
6% 200 2
Perak 82 12% 403 4
Central Selangor 98 14% 400 4
W. Per. K.
Lumpur 66
9% 305 3
Negeri
Sembilan 39
6% 200 2
Southern Melaka 26 4% 100 1
Johor 81 12% 304 3
East Coast Kelantan 30 4% 100 1
Terengganu 28 4% 100 1
Pahang 46 7% 200 2
Sabah Sabah 43 6% 200 2
Sarawak Sarawak 63 9% 300 3
699 100% 3112 31
To collect the data for this project, two methods were used throughout the study,
i.e. the Computer Assisted Telephone Interviews (CATI) and Face to Face
Interviews (F2F). As for the respondents, two segments were identified i.e.
residential and commercial. In this survey, for each service category only one
type of either CATI or F2F method was utilised and only one segment of either
residential or commercial was affected.
Hence, CATI was used for FTAR, FTATV and courier services while F2F method
was used solely for postal services. The residential segment was used for FTAR,
FTATV and postal services while only commercial segment was used for courier
services.
4.2 Methodology
The first stage of this study was the Selection and Training of Interviewers
where 20 interviewers were selected for CATI and another 20 interviewers for
F2F based on their skills and experience. The interviewers were then trained to
8 | P a g e
understand the context, background and content of the study. CATI Interviewers
were trained on appropriate skills and ethics of conducting the telephone
interview while F2F interviewers were trained on appropriate skills and ethics of
conducting Face-To-Face interview. The 20 F2F interviewers were then trained on
how to key in the data into a standardized MS Excel format spreadsheet so that they can
do data entry and data cleaning. CATI surveys were conducted in parallel over the
period from 1 December to 30 December 2010 whilst the F2F surveys were conducted
from 6 December to 23 December 2010.
Original questionnaires were adopted from the previous Customer Satisfaction for all four
surveys (FTAR, FTATV, Courier and Postal). None of the questions were changed. These
CSS 2007 questions were based on the feedback given by service providers to SKMM.
The questionnaires contained questions related to service attributes unique to the
service type. These attributes are then asked to be rated against two (2) main criteria
i.e. Performance and Importance using a Likert scale of 1 to 5 (1 being the least and 5
the highest score). These will then allow the identification of Mean Importance and
Mean Performance of each service attribute.
Two main outputs are derived from this study. One is the Customer Satisfaction Index
(CSI) on each service provider and the other is the Service Quality Gap on each attribute
for each service type.
5.0 Consumer Satisfaction Index (CSI) and Service Quality Gap
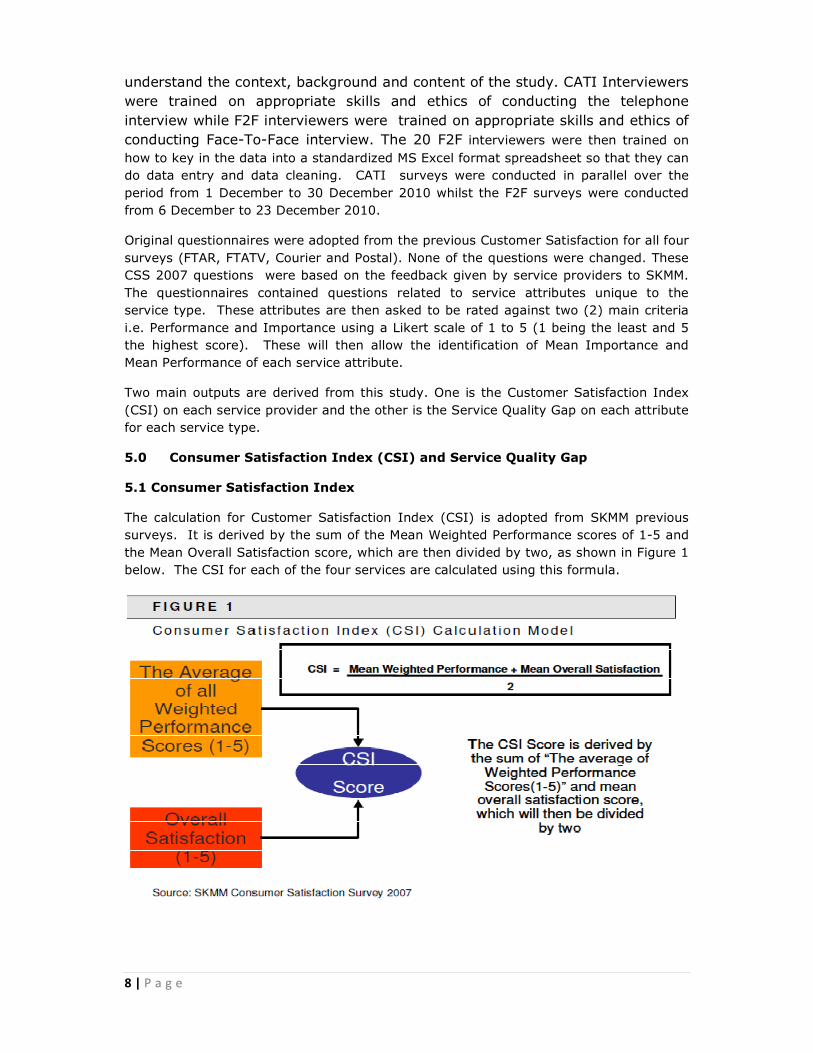
5.1 Consumer Satisfaction Index
The calculation for Customer Satisfaction Index (CSI) is adopted from SKMM previous
surveys. It is derived by the sum of the Mean Weighted Performance scores of 1-5 and
the Mean Overall Satisfaction score, which are then divided by two, as shown in Figure 1
below. The CSI for each of the four services are calculated using this formula.
9 | P a g e
5.2 Service Quality Gap
The Service Quality Gap (SQG) is the gap between a customer's perception of
the experience and the customer's expectation of the service. The Service
Quality Gap (SQG) used in this study is calculated on each attribute for a service
type. It is derived by taking the difference between the Mean Performance (Pk)
and Mean Importance (Ik) for a particular attribute (k) as shown in the formula
below:
SQGk = Pk - Ik where SQG =[>0, 0, <0] and P is Mean performance and I is
Mean Importance,
The gap value is either positive, zero or negative. A positive value means that
Mean Performance exceeds the Mean Importance of a particular attribute, which
indicates that the attribute is above the expectations of the respondents. On the
other hand, a negative value means that Mean Performance is below the Mean
Importance of a particular attribute, which indicates that the attribute has not
met the expectations of the customer and thus should be improved.
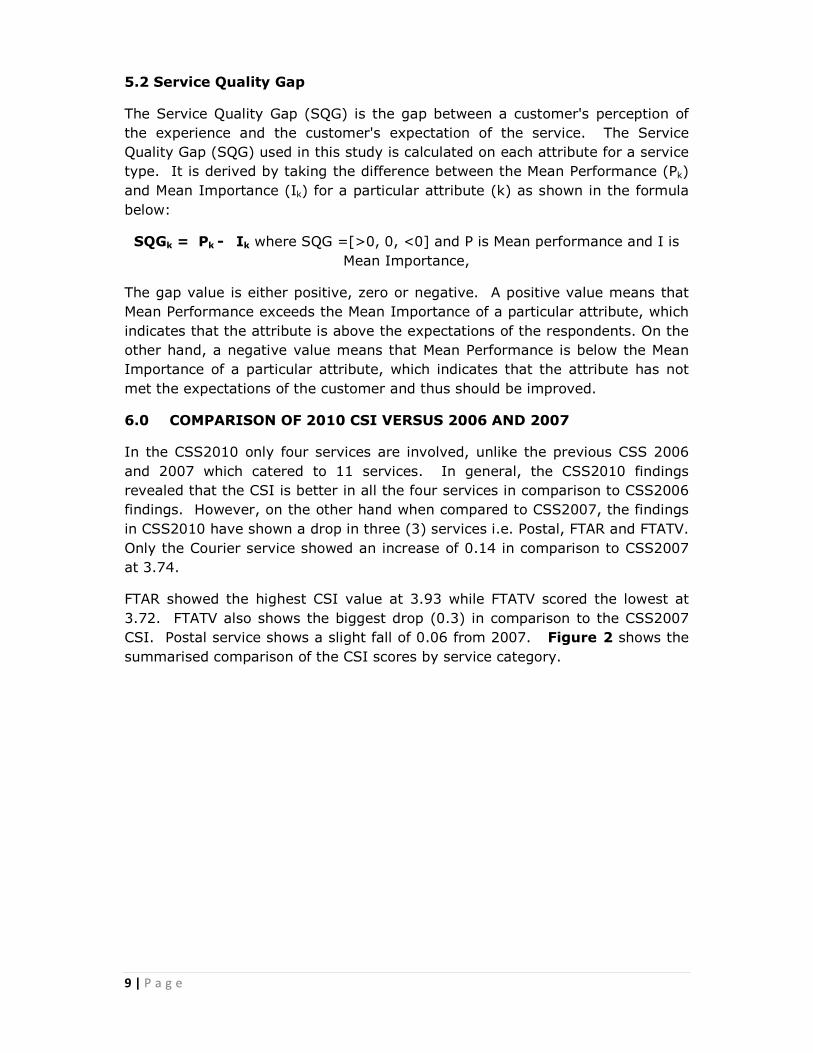
6.0 COMPARISON OF 2010 CSI VERSUS 2006 AND 2007
In the CSS2010 only four services are involved, unlike the previous CSS 2006
and 2007 which catered to 11 services. In general, the CSS2010 findings
revealed that the CSI is better in all the four services in comparison to CSS2006
findings. However, on the other hand when compared to CSS2007, the findings
in CSS2010 have shown a drop in three (3) services i.e. Postal, FTAR and FTATV.
Only the Courier service showed an increase of 0.14 in comparison to CSS2007
at 3.74.
FTAR showed the highest CSI value at 3.93 while FTATV scored the lowest at
3.72. FTATV also shows the biggest drop (0.3) in comparison to the CSS2007
CSI. Postal service shows a slight fall of 0.06 from 2007. Figure 2 shows the
summarised comparison of the CSI scores by service category.
10 | P a g e
7. 0 Detailed Findings of CSS2010
7.1 Free-To-Air Radio Services (FTAR)
11 | P a g e
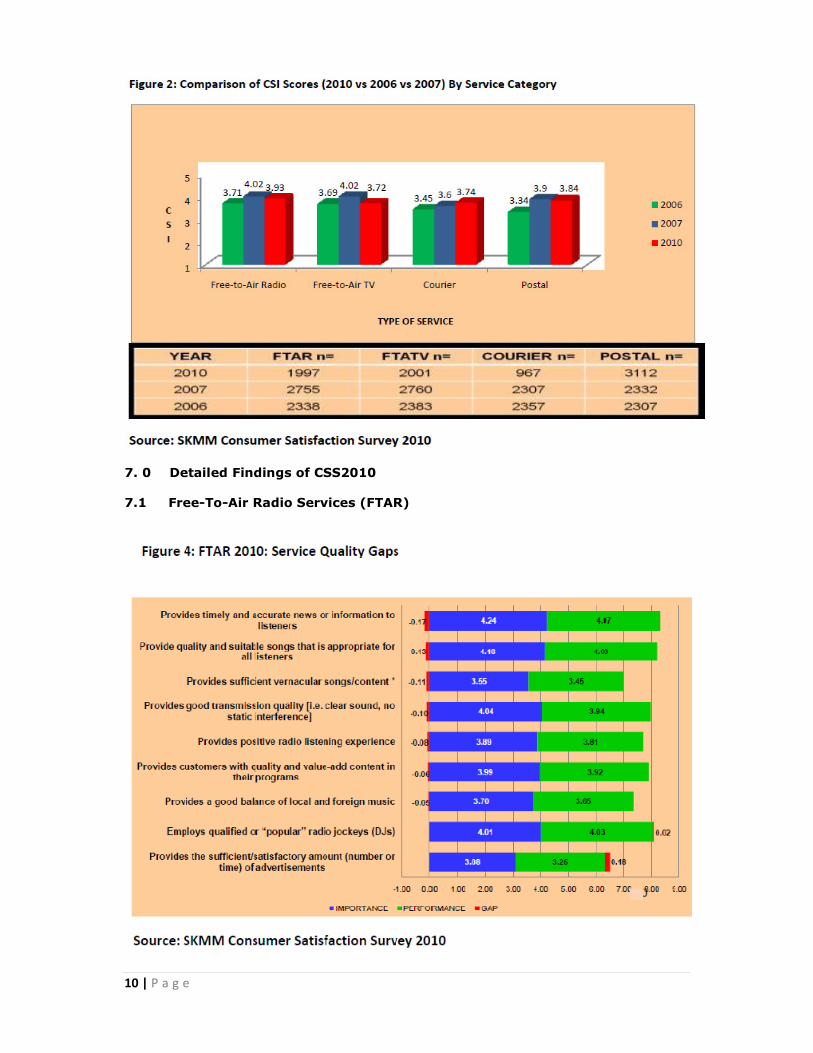
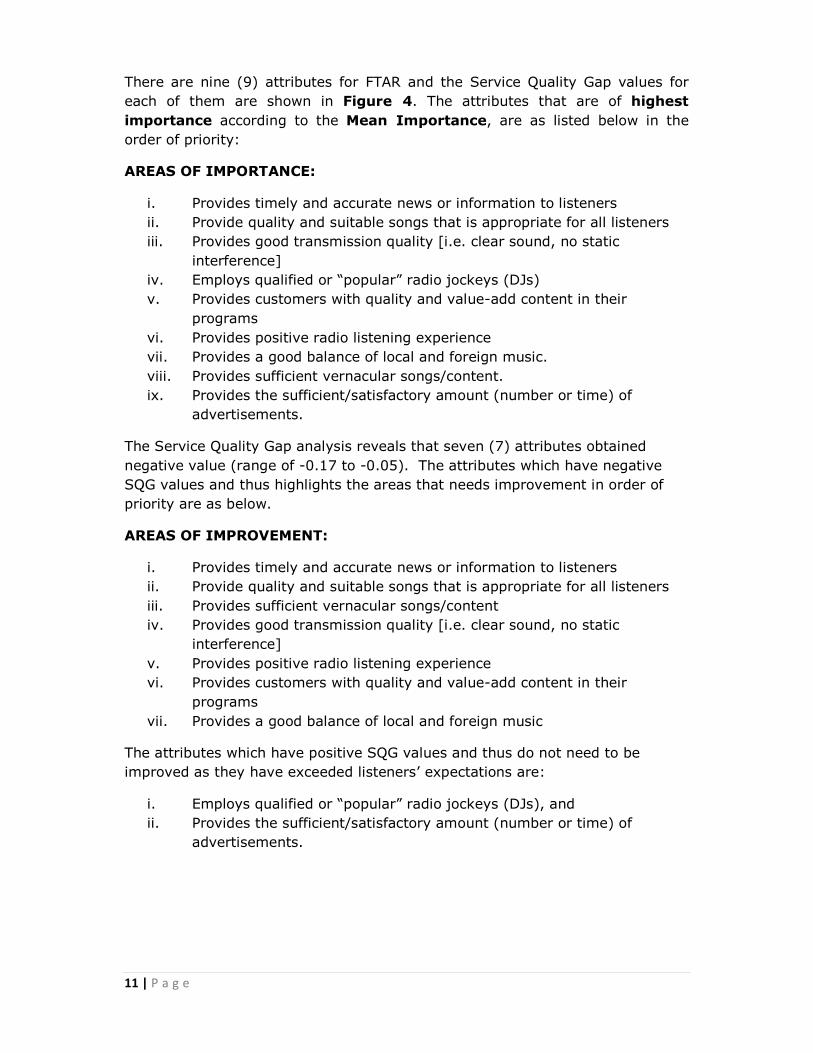
There are nine (9) attributes for FTAR and the Service Quality Gap values for
each of them are shown in Figure 4. The attributes that are of highest
importance according to the Mean Importance, are as listed below in the
order of priority:
AREAS OF IMPORTANCE:
i. Provides timely and accurate news or information to listeners
ii. Provide quality and suitable songs that is appropriate for all listeners
iii. Provides good transmission quality [i.e. clear sound, no static
interference]
iv. Employs qualified or “popular” radio jockeys (DJs)
v. Provides customers with quality and value-add content in their
programs
vi. Provides positive radio listening experience
vii. Provides a good balance of local and foreign music.
viii. Provides sufficient vernacular songs/content.
ix. Provides the sufficient/satisfactory amount (number or time) of
advertisements.
The Service Quality Gap analysis reveals that seven (7) attributes obtained
negative value (range of -0.17 to -0.05). The attributes which have negative
SQG values and thus highlights the areas that needs improvement in order of
priority are as below.
AREAS OF IMPROVEMENT:
i. Provides timely and accurate news or information to listeners
ii. Provide quality and suitable songs that is appropriate for all listeners
iii. Provides sufficient vernacular songs/content
iv. Provides good transmission quality [i.e. clear sound, no static
interference]
v. Provides positive radio listening experience
vi. Provides customers with quality and value-add content in their
programs
vii. Provides a good balance of local and foreign music
The attributes which have positive SQG values and thus do not need to be
improved as they have exceeded listeners’ expectations are:
i. Employs qualified or “popular” radio jockeys (DJs), and
ii. Provides the sufficient/satisfactory amount (number or time) of
advertisements.
12 | P a g e
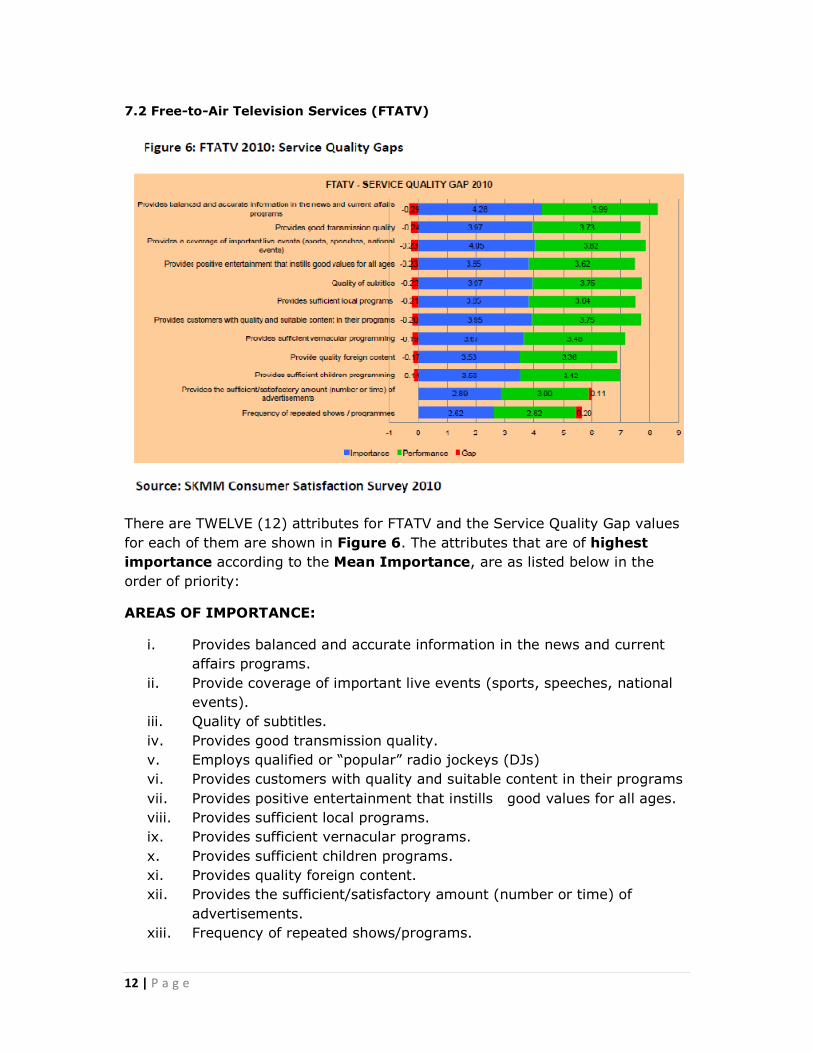
7.2 Free-to-Air Television Services (FTATV)
There are TWELVE (12) attributes for FTATV and the Service Quality Gap values
for each of them are shown in Figure 6. The attributes that are of highest
importance according to the Mean Importance, are as listed below in the
order of priority:
AREAS OF IMPORTANCE:
i. Provides balanced and accurate information in the news and current
affairs programs.
ii. Provide coverage of important live events (sports, speeches, national
events).
iii. Quality of subtitles.
iv. Provides good transmission quality.
v. Employs qualified or “popular” radio jockeys (DJs)
vi. Provides customers with quality and suitable content in their programs
vii. Provides positive entertainment that instills good values for all ages.
viii. Provides sufficient local programs.
ix. Provides sufficient vernacular programs.
x. Provides sufficient children programs.
xi. Provides quality foreign content.
xii. Provides the sufficient/satisfactory amount (number or time) of
advertisements.
xiii. Frequency of repeated shows/programs.
13 | P a g e
The Service Quality Gap analysis reveals that ten (10) attributes obtained
negative value (range of -0.29 to -0.14). The attributes which have negative
SQG values and thus highlights the areas that needs improvement in order of
priority are as below.
AREAS OF IMPROVEMENT:
i. Provides balanced and accurate information in the news and current
affairs programs.
ii. Provides good transmission quality.
iii. Provide coverage of important live events (sports, speeches, national
events).
iv. Provides positive entertainment that instils good values for all ages.
v. Quality of subtitles.
vi. Provides sufficient local programs.
vii. Provides customers with quality and suitable content in their programs
viii. Provides sufficient vernacular programs.
ix. Provides quality foreign content.
x. Provides sufficient children programs.
The attributes which have positive SQG values and thus do not need to be
improved as they have exceeded listeners’ expectations are:
i. Provides the sufficient/satisfactory amount (number or time) of
advertisements.
ii. Frequency of repeated shows/programs.
14 | P a g e
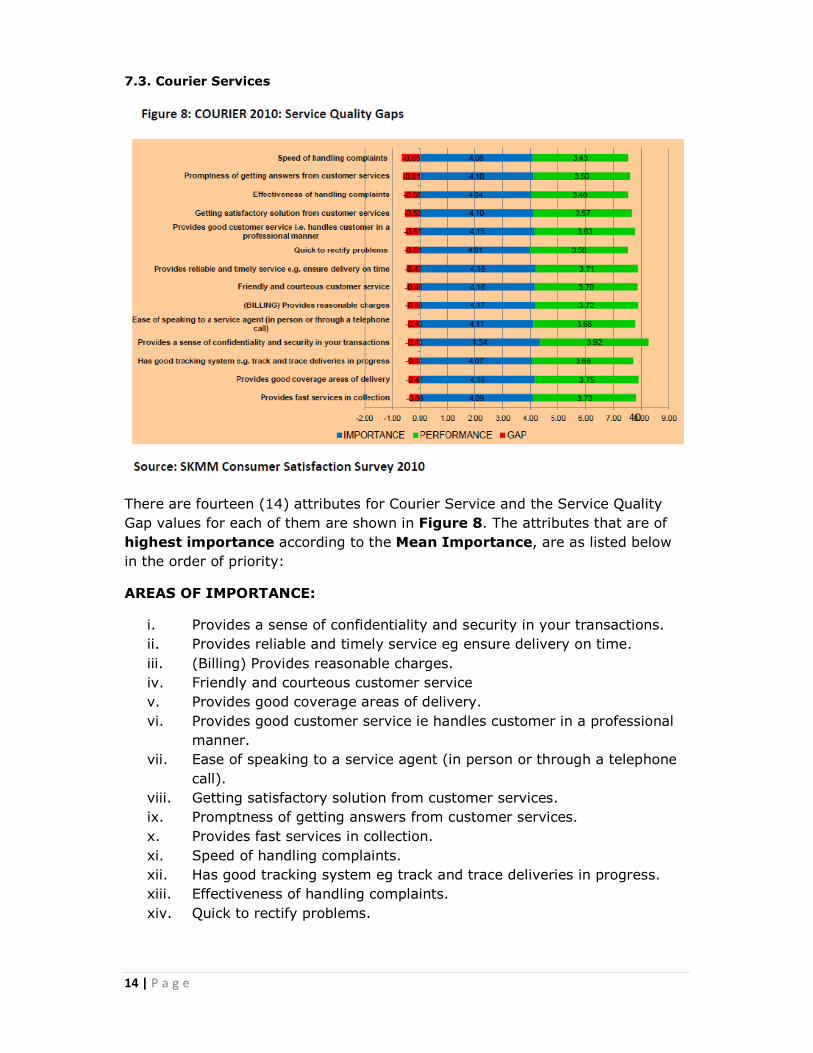
7.3. Courier Services
There are fourteen (14) attributes for Courier Service and the Service Quality
Gap values for each of them are shown in Figure 8. The attributes that are of
highest importance according to the Mean Importance, are as listed below
in the order of priority:
AREAS OF IMPORTANCE:
i. Provides a sense of confidentiality and security in your transactions.
ii. Provides reliable and timely service eg ensure delivery on time.
iii. (Billing) Provides reasonable charges.
iv. Friendly and courteous customer service
v. Provides good coverage areas of delivery.
vi. Provides good customer service ie handles customer in a professional
manner.
vii. Ease of speaking to a service agent (in person or through a telephone
call).
viii. Getting satisfactory solution from customer services.
ix. Promptness of getting answers from customer services.
x. Provides fast services in collection.
xi. Speed of handling complaints.
xii. Has good tracking system eg track and trace deliveries in progress.
xiii. Effectiveness of handling complaints.
xiv. Quick to rectify problems.
15 | P a g e
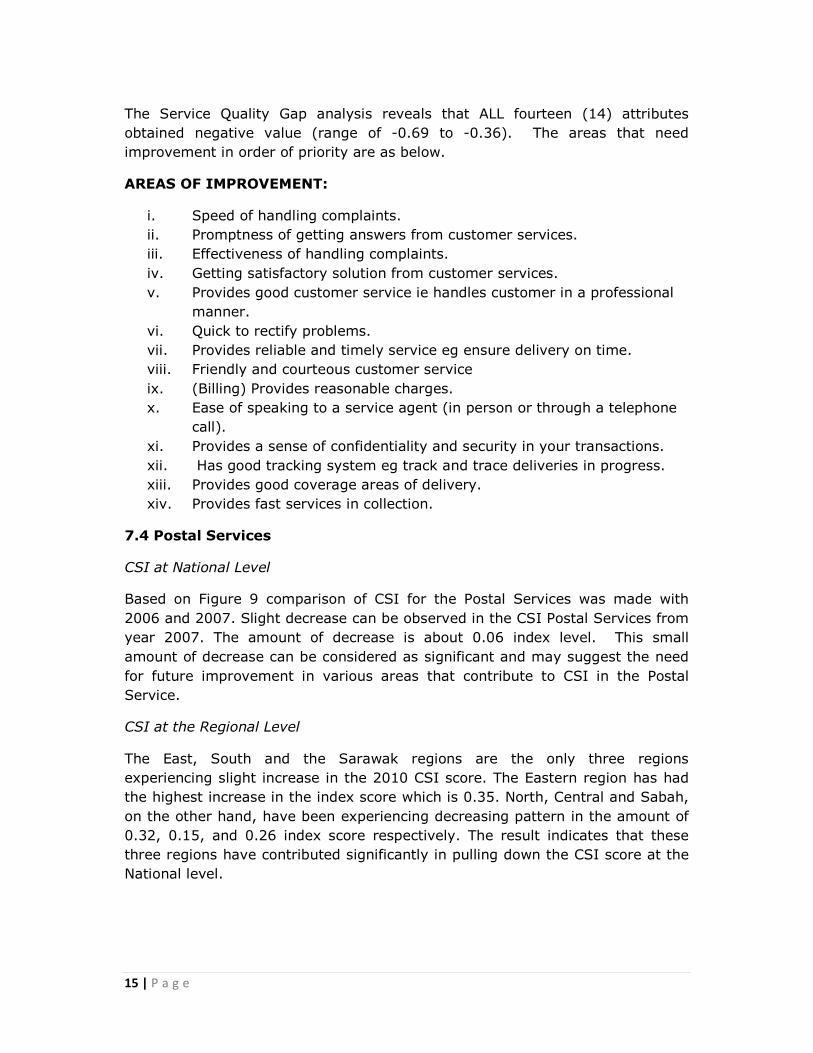
The Service Quality Gap analysis reveals that ALL fourteen (14) attributes
obtained negative value (range of -0.69 to -0.36). The areas that need
improvement in order of priority are as below.
AREAS OF IMPROVEMENT:
i. Speed of handling complaints.
ii. Promptness of getting answers from customer services.
iii. Effectiveness of handling complaints.
iv. Getting satisfactory solution from customer services.
v. Provides good customer service ie handles customer in a professional
manner.
vi. Quick to rectify problems.
vii. Provides reliable and timely service eg ensure delivery on time.
viii. Friendly and courteous customer service
ix. (Billing) Provides reasonable charges.
x. Ease of speaking to a service agent (in person or through a telephone
call).
xi. Provides a sense of confidentiality and security in your transactions.
xii. Has good tracking system eg track and trace deliveries in progress.
xiii. Provides good coverage areas of delivery.
xiv. Provides fast services in collection.
7.4 Postal Services
CSI at National Level
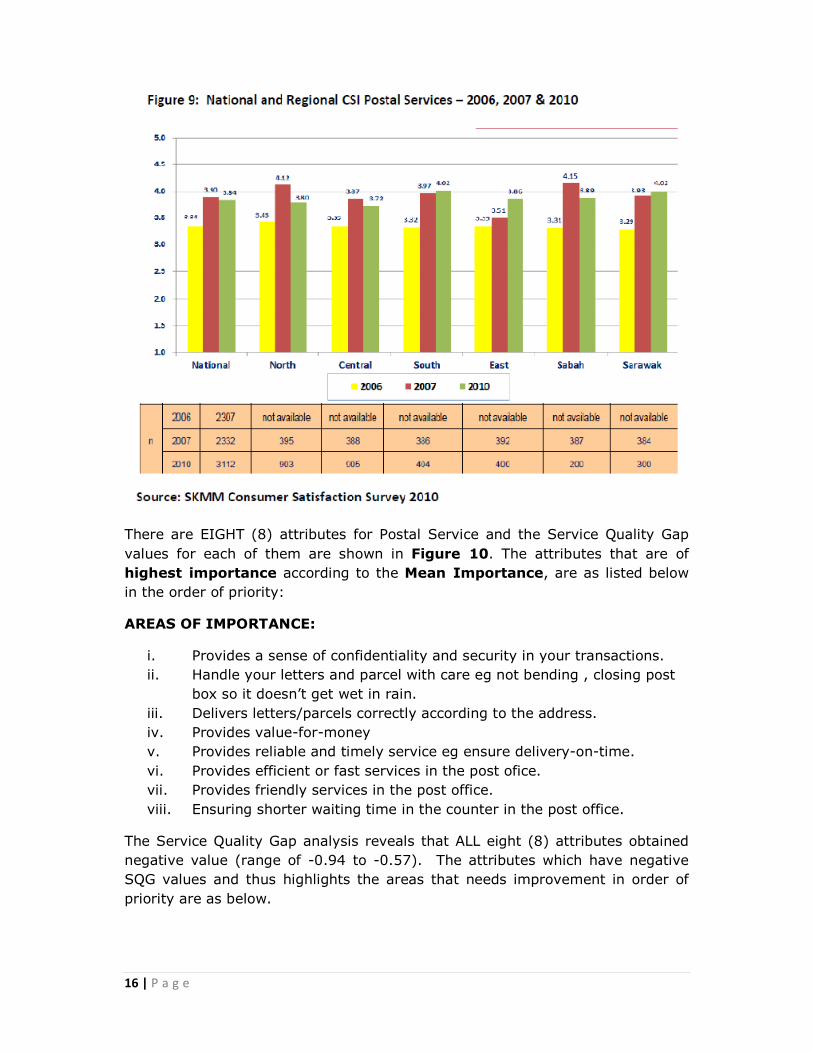
Based on Figure 9 comparison of CSI for the Postal Services was made with
2006 and 2007. Slight decrease can be observed in the CSI Postal Services from
year 2007. The amount of decrease is about 0.06 index level. This small
amount of decrease can be considered as significant and may suggest the need
for future improvement in various areas that contribute to CSI in the Postal
Service.
CSI at the Regional Level
The East, South and the Sarawak regions are the only three regions
experiencing slight increase in the 2010 CSI score. The Eastern region has had
the highest increase in the index score which is 0.35. North, Central and Sabah,
on the other hand, have been experiencing decreasing pattern in the amount of
0.32, 0.15, and 0.26 index score respectively. The result indicates that these
three regions have contributed significantly in pulling down the CSI score at the
National level.
16 | P a g e
There are EIGHT (8) attributes for Postal Service and the Service Quality Gap
values for each of them are shown in Figure 10. The attributes that are of
highest importance according to the Mean Importance, are as listed below
in the order of priority:
AREAS OF IMPORTANCE:
i. Provides a sense of confidentiality and security in your transactions.
ii. Handle your letters and parcel with care eg not bending , closing post
box so it doesn’t get wet in rain.
iii. Delivers letters/parcels correctly according to the address.
iv. Provides value-for-money
v. Provides reliable and timely service eg ensure delivery-on-time.
vi. Provides efficient or fast services in the post ofice.
vii. Provides friendly services in the post office.
viii. Ensuring shorter waiting time in the counter in the post office.
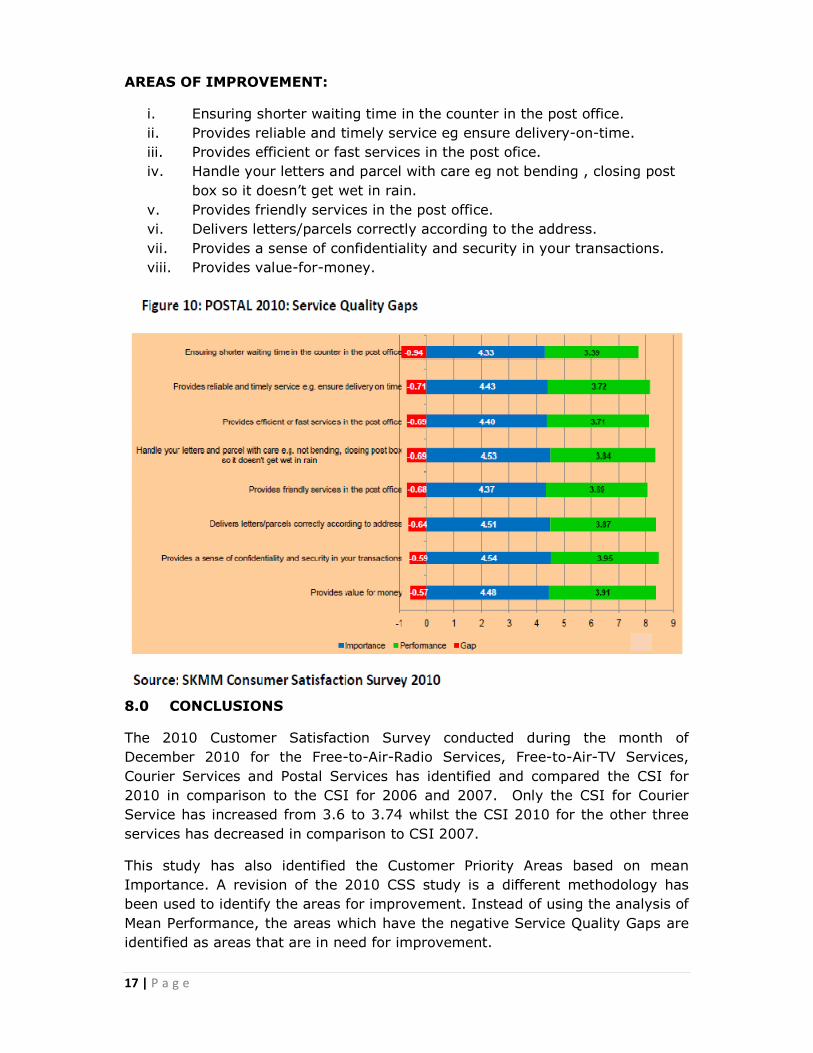
The Service Quality Gap analysis reveals that ALL eight (8) attributes obtained
negative value (range of -0.94 to -0.57). The attributes which have negative
SQG values and thus highlights the areas that needs improvement in order of
priority are as below.
17 | P a g e
AREAS OF IMPROVEMENT:
i. Ensuring shorter waiting time in the counter in the post office.
ii. Provides reliable and timely service eg ensure delivery-on-time.
iii. Provides efficient or fast services in the post ofice.
iv. Handle your letters and parcel with care eg not bending , closing post
box so it doesn’t get wet in rain.
v. Provides friendly services in the post office.
vi. Delivers letters/parcels correctly according to the address.
vii. Provides a sense of confidentiality and security in your transactions.
viii. Provides value-for-money.
8.0 CONCLUSIONS
The 2010 Customer Satisfaction Survey conducted during the month of
December 2010 for the Free-to-Air-Radio Services, Free-to-Air-TV Services,
Courier Services and Postal Services has identified and compared the CSI for
2010 in comparison to the CSI for 2006 and 2007. Only the CSI for Courier
Service has increased from 3.6 to 3.74 whilst the CSI 2010 for the other three
services has decreased in comparison to CSI 2007.
This study has also identified the Customer Priority Areas based on mean
Importance. A revision of the 2010 CSS study is a different methodology has
been used to identify the areas for improvement. Instead of using the analysis of
Mean Performance, the areas which have the negative Service Quality Gaps are
identified as areas that are in need for improvement.