Embed Size (px)
Citation preview
EuropeanJournal ofMarketing32,11/12
1008
Consumer response to thepreferred brand out-of-stock
situationWillem Verbeke
Erasmus University, Rotterdam, The NetherlandsPaul Farris
University of Virginia, Charlottesville, Virginia, USA andRoy Thurik
Erasmus University, Rotterdam, The Netherlands
My acid test on the issue [of brand loyalty] is whether a housewife intending to buy HeinzTomato Ketchup in a store, finding it to be out of stock, will walk out of the store to buy itelsewhere or switch to an alternative product (A.J. O’Reilly, CEO, H.J. Heinz Company).
IntroductionThe consumer-products industry has introduced a growing number of brandextensions in the last few years. At the same time, retailers who set out to cutslower-selling brands allowed more shelf space to their private-label brands(Corstjens et al. 1994; Weinstein, 1993). Although brand extensions gave rise toa greater variety within brand product lines, it has been argued that consumersnow perceive fewer differences between brands (Aaker, 1991; Sloot et al., 1997).In the face of perceived parity between brands by consumers, and perhapsprecisely because of the overlapping lines and numerous extensions,manufacturers had to worry whether retailers obtained more freedom to choosewhich brands to stock and which to delete from their assortment. Ultimately, itis this freedom of choice that enhances retailer power. The purpose of this studywas to design an experiment which simulated O’Reilly’s acid test of brandloyalty mentioned in the opening quote to this paper. By organizing a true out-of-stock experiment (OOS) of the consumer’s preferred brand, we determinedwhether consumers were willing to “walk out of the store to buy [their preferredbrand] elsewhere or switch to an alternative product”. Insights into thesebehaviors might provide arguments that retailers use during negotiations withthe manufacturer about shelf allocations.
One would expect many OOS experiments to have been undertaken to date;however, there were only a few OOS studies prior to this current study, fromwhich some insights were gained. For instance, during an OOS experiment, asubstantial number of consumers (32 percent) switched brands, but another 14
European Journal of Marketing, Vol. 32 No. 11/12, 1998, pp. 1008-1028, © MCB UniversityPress, 0309-0566
Received October 1996Revised July 1997
The authors are thankful for the statistical assistance of Cok Ouwerkerk, Erasmus University,Rotterdam and the helpful comments of Dayle Thorpe, University of Tennessee, Knoxville.

Preferred brandout-of-stock
1009
percent was willing to switch stores (Emmelheinz et al., 1991). Retailers,however, might be interested in more detailed and substantial questions. Theymight be particularly interested in questions of managerial relevance. One areain which retailers would like to focus is the way that some store loyals respondto OOS situations. They also would like to know whether their competitiveconditions, such as having competitor retailers with a similar assortmentnearby, can affect OOS responses. The low number of OOS experimentalstudies has left several questions unanswered. Consider, for instance, thefollowing:
(1) Is the response to an OOS situation affected by the intensity of retailcompetition?
(2) Are the effects of a temporary OOS (where the shelf of the OOS brand isleft empty) different from a permanent change (where the shelf of theOOS brand is filled with a competitor’s brand) in the assortment?
(3) Will OOS responses depend on the degree of store loyalty?(4) Is the OOS response affected by the shopping patterns of the consumer –
whether the consumers spend a large or small amount of money on atypical store visit?
(5) Will consumers spend less in a store because of an OOS situation, or willthe effects of an OOS be confined to the brand and category that arebeing manipulated?
The present paper addresses these managerial questions. In general, our resultsshow strong differences in OOS responses of brand loyal consumers because ofthe shopping patterns and the store loyalty that are due to situational effects(temporary versus permanent OOS, intensity of retail competition). Weobtained these results from a unique OOS experiment conducted with the fullcooperation of the third largest retail grocery chain in The Netherlands. In ourexperiment the complete product lines (all SKUs) of five leading brands in fivedifferent product categories were removed from selected stores of the leadinggrocery chain and the OOS responses of the brand loyal consumers werestudied.
In the following pages we present a further discussion of a preferred-brand-OOS, our hypotheses regarding consumer response to the preferred-brand-OOSsituation, the experimental design, the results and conclusions, and somesuggestions for further research.
Consumer response to OOS: consequences and moderatorsThe consumer’s response to “out-of-stock” situations has implications for retailassortment, shelf space allotment, pricing, and logistics. In fact, a great numberof scientific literature focuses on the optimal assortment of optimizing projects(Rebstein and Gatignon, 1984) or focuses on the costs of OOS situations (Borinet al., 1994; Chang and Niland, 1967; Elton and Mercer, 1969; Ernst and Cohen,1992; Hill, 1990, 1992; Karman and Ingene, 1993; Moinzadeh and Ingene, 1993;

EuropeanJournal ofMarketing32,11/12
1010
Walter and Grabner, 1975). Although there is a need for an increasedunderstanding of consumer response, in particular to the brand-OOS situation,only a few scientific experiments have been undertaken in this area. Withnotable exceptions (e.g. Emmelheinz et al., 1991; Progressive Grocer, 1968), mostscientific experiments on the OOS consumer response have been based onlaboratory experiments or idealized situations, such as gauging OOS responsesusing self-administered questionnaires. For instance, by using a simulated OOSsituation, McAllister and Pessemier (1990) and Hoyer et al. (1996) found arelationship between variety-seeking tendencies of consumers and OOSresponses. By using self-administered questionnaires to produce a frequencydistribution of “intended” OOS responses, Walter and Grabner (1975) andWaltner and LaLonde (1975) discovered that a certain number of people (14percent) would switch stores if their brand was out of stock for a longer periodof time. In addition, using self-administered questionnaires in order to estimatethe consumer’s brand commitment, researchers found that consumers wereprepared to switch stores (Beatty et al., 1988, Lastovickla and Gardner, 1977;Mittal and Lee, 1988).
True field OOS experiments are rare, because they are expensive andpotentially very risky for the retailer; but perhaps precisely these experimentshave provided us with interesting information. Previous OOS experiments haveidentified a variety of OOS responses to the removal of one SKU within theproduct’s line of a brand: postponement of buying, brand switching (at a lowerprice, the same, or at a higher price), switching stores in order to get the brand,seeking the same brand in a different variety (switching of SKU), and otherbehaviors, such as complaining to managers, returning to check on availability,or dropping – not bothering with the purchase at all (Charlton and Ehrenberg,1976; Emmelheinz et al., 1991; Gattorna, 1988; Moinzadeh and Ingene, 1993;Progressive Grocer, 1968; Schary and Christopher, 1979; Walter and Grabner,1975). It is characteristic of these studies that postponement of buying (alsocalled “defer” (Corstjens and Corstjens, 1995)), switching brands, switchingSKUs within the same brand, and switching stores to get the preferred brandwere the most frequently occurring OOS responses. Some of the essentialfindings of the true OOS will be discussed next.
A substantial percentage of consumers (32 percent) have been reported toswitch brands in response to an OOS situation (Emmelheinz et al., 1991).Switching to different SKUs within the same brand has also been studied: 21percent of the consumers did so according to Weinstein (1993) and 17.5 percentaccording to Emmelheinz et al. (1991). A smaller percentage of consumersswitched stores to purchase the desired brand (14 percent, (Emmelheinz et al.,1991)). Delays or postponements of purchases also occured with a lowerpercentage (12.3 percent (Emmelheinz et al., 1991)). Fill-in trips accounted for asmall percentage (0.08 percent (Emmelheinz et al., 1991)). Finally, Charlton andEhrenberg (1976) reported no long-term effects on sales.
Several factors have been reported to moderate OOS responses. One studyshowed that OOS responses differ by product (Progressive Grocer, 1968) but

Preferred brandout-of-stock
1011
Emmelheinz et al. (1991) found no differences among the products they studied.Consumer characteristics also affected the OOS responses: Emmelheinz et al.(1991) reported that customers who were loyal to a store were more likely todelay purchase than non-loyal customers. The perceived risk of the product –“the risk of purchasing a brand other than the preferred brand” (Emmelheinz etal., 1991, p. 142) – has been shown to reduce brand switching, while the urgencyto buy the brand had the opposite effect – that is, it increased the likelihood ofconsumers’ switching brands (Emmelheinz et al., 1991).
The added value of our research to the current knowledge in this area was tofocus on a brand’s complete line of SKUs rather than on one SKU within aproduct line. Moreover, it distinguished between temporary OOS andpermanent assortment changes, and it investigated the effects of retailcompetition, consumer purchasing habits, and store loyalty on the OOSresponse. As the whole product line was removed from the shelves, there weremainly three OOS responses left to study:
(1) postponement of buying; (2) brand switching; and (3) switching stores to get the brand.
Switching SKUs within the same brand was not an option in our experiment,because the design of the experiment did not allow this behavior – the study’sfocus was brand loyalty, not SKU loyalty. That did not mean, however, thatother OOS responses would not be possible; consumers could switch to adjacentcategories. Although possible, earlier OOS research has shown that this was arare response. Therefore, this response was not considered in the followinghypotheses. Its occurence was checked, however, during data analysis. Specifichypotheses for the present research are given below.
HypothesesThe basic premise of the following hypotheses is that consumers who areconfronted by their preferred brand incur two different kinds of psychologicalresponses:
(1) There are the feelings of frustration, irritation, or feelings of inequity(brand loyal consumers should be rewarded for their loyalty, notpunished) and feelings of not finding their favored brand SKU and/or ofnot finding their alternative SKUs within their favorite brand (e.g.Corstjens and Cortsjens, 1995). These frustrations might be amplified bythe fact that many consumers find shopping irritating (Clemmer andSchneider, 1989).
(2) There are the behavioral efforts that consumers are willing to invest, inorder to attain their preferred brand and so become satisfied with theirpurchases. These efforts range from visiting another store in order to getthe brand, to switching brands within this store. These behavioralefforts, especially the willingness to switch stores, come at a “price.” The
EuropeanJournal ofMarketing32,11/12
1012
more behavioral efforts a consumer has to undertake to compensate forthe frustrations of not finding the preferred brand, the less willing theconsumer will be to make these physical efforts. At some point,consumers come to a breaking point and are then willing to settle for aless desirable solution. Based on this decision, consumers in an OOSsituation will either have to seek a different brand within the store, orwill postpone buying and come back for a “fill-in” (Lesser and Hughes,1986; Robinson and Nicosia, 1991).
Effects of competing stores When consumers are confronted with OOS situations of their favorite brand,they might be willing to invest behavioral efforts in going to another store inorder to find their preferred brand. However, visiting another store that carriesthe same assortment of brands requires time, especially when this other store isfar away. Somewhere along the line, consumers make a pay-off decisionbetween the distance they are willing to travel and the satisfaction they mightattain by getting their preferred brand (Corstjens and Corstjens, 1995). Thefarther away this store is, the higher the likelihood that consumers are willingto switch brands. Therefore, we make the following hypothesis:
H1: if the intended brand choice is OOS and if there are stores with similarassortments nearby, consumers are:
(a) less likely to switch to competing brands;
(b) more likely to switch stores to get the brand; and
(c) less likely to postpone buying the brand.
Temporary-OOS versus changes in assortmentsRetailers distinguish between two kinds of OOS:
(1) the brand is temporarily OOS (such as during peak hours on theweekend), which might suggest that the brand will become available at alater time; and
(2) the brand is exchanged for another brand, owing to changes in retailassortment, suggesting that the brand will not be available at a latertime.
A temporary OOS can be made recognizable to consumers through the emptyshelves and the labels remaining on the shelves. Assortment changes, on theother hand, draw the attention of the consumers through shelves that are filledwith competing brands (Borin and Farris, 1992) and through removal of labels.When a consumer is loyal to the brand and notices that his/her brand isremoved from the shelf, and s/he cannot even switch SKUs within the preferredbrand anymore, the irritation and frustration will rise. In order to compensatefor these frustrations, the consumer will go to another store to get his/herpreferred brand. Or else, some consumers might find switching stores too costly

Preferred brandout-of-stock
1013
and thus might decide to switch brands. Postponement of buying the brand isthe least obvious choice, because the context indicates that this would not be aworthy option. This reasoning leads to the following hypothesis:
H2: if the intended brand choice is OOS and if the shelf is filled with acompeting brand as opposed to an empty shelf, then consumers are:
(a) more likely to switch to competing brands;
(b) more likely to switch stores to get the brand; and
(c) less likely to postpone buying the brand.
Store loyaltyReynolds et al. (1974/75) have suggested that store loyals tend to be lessventuresome, suggesting they would be more likely to switch brands. Theseconsumers, in other words, adopt their brand preferences according to the timethey prefer to shop. Confronted with an OOS, they will experience lower degreesof irritation due to their brand OOS, but the behavioral efforts of going toanother store might be perceived to be higher (too venturesome). Therefore,they would rather stay in the store and switch brands than switch stores orpostpone buying. In fact, Emmelheinz et al. (1991) find that store loyalconsumers would rather postpone buying the brand (or come back to a fill-intrip). Based on this reasoning, we present the following hypothesis:
H3: if the intended brand choice is OOS and if consumers are store loyal, thenthey are:
(a) more likely to switch to competing brands;
(b) less likely to switch stores to get the brand; and
(c) more likely to postpone buying the brand.
Large versus small purchase amounts per shopping tripIf consumers have smaller total purchase amounts (size of “ticket”), they mightfind it easier to switch stores. Consumers who purchase in small amounts mayalso shop more frequently in the same store and/or visit more stores than thosewho buy in large total amounts. It is not exactly clear though, why consumersdo engage in these shopping trips, but they might enjoy shopping more or theyhave more time (e.g. Tranberg and Hansen, 1986). In either case, the morefrequently these people visit their own store, the greater is their ability topostpone. In addition, the more familiar consumers are with other stores, themore likely we believe they are to visit these stores in response to an OOS.Consequently, when confronted with an OOS of their preferred brand, theconsumers might incur substantial psychological effects like irritation, but theycan more easily compensate for this because of their shopping habits.
Therefore, we present the following hypothesis:
EuropeanJournal ofMarketing32,11/12
1014
H4: if the intended brand choice is out of stock and if consumers have a smalltotal purchase amount per trip as opposed to a large purchase amount,they are:
(a) less likely to switch to competing brands;
(b) more likely to switch stores to get the brand; and
(c) more likely to postpone buying the brand.
Total household spending in the storePerhaps the greatest fear for a retailer is that the consequence of an OOS wouldcause a decrease in visits of the consumer to the store or a smaller amount ofpurchase per visit. Either of these effects would decrease the spending of theconsumer in a store. These consequences could be far more severe than the lostrevenue for the individual OOS item. Without strong previous research (exceptCorstjens and Corstjens, 1995), we believe that OOS situations might impelconsumers to visit other stores and change their shopping patterns, resulting ina low revenue for the test-store.
H5: consumers spend less money in the test stores during the OOS period.
MethodologyBefore going into the discussion of how the OOS experiment was designed, it isimportant to outline in depth the competitive environment of the retailers inThe Netherlands. First, this outline gives us more insight into the reason whyretailers in The Netherlands were interested in the answers of the researchquestions addressed in this study. Second, because the retail environment inThe Netherlands is so unique, this outline places the OOS responses of theconsumers in a proper perspective.
The retail contextIn The Netherlands, as well as in any European country, the amount ofshopkeepers (those who own up to six smaller stores) decreased and they werereplaced by a group of “Large stores I & II” (consisting of more than sevenlarger stores). As a consequence, the amount of stores had been reduced from9,632 in 1988 to 7,248 in 1995. According to Nielsen (1995), the group “Largestores I” consisted of Albert Heijn, Edah, Aldi, and the Hermans-group, and allthe other large stores. The group of “Large stores I” made up 42 percent of themarket and the group of “Large stores II”, 24 percent. The rest of the marketshares belonged to the small stores, which did not have the broad assortmentsof brands that belonged to the large stores, particularly the “Large stores I andII”. There was a growing differentiation among the group “Large stores I”,particularly around the ability to carry private brands and around the priceimage of the stores.
While the total amount of stores in general was decreasing, especially theamount of the small stores, the amount of stores belonging to the group of

Preferred brandout-of-stock
1015
“Large stores I”, and to some extent to the group of “Large stores II”, wasincreasing. This trend is not surprising, because consumer satisfaction withretail stores is affected by the accessibility, the assortment, and parkingavailability (Olson and Peter, 1990). This is why when new towns and villagesare built, retailers “rush in”[1] to become the first retailer in the area. The newstores were usually large and therefore, over time, most stores in TheNetherlands came to belong to owners within the “Large stores I and II”segment. These stores either had a size from 1,000-2,500m2 or 400-1,000m2.Please notice that, as the shopper nowadays gained more convenience,shopping in The Netherlands only took place between 9 a.m. and 6 p.m. onweekdays and on Saturday[2]. Shopping trips, therefore, had to be plannedcarefully. In addition, the retail branch – especially the food chains – remainedhighly competitive as the spending of the consumers was not rising in that area(Nielsen, 1995).
The OOS experiment described in this paper took place within one of thelow-priced stores of the “Large store I” segment. The stores were all placed invillages inhabiting 5,000 to 10,000 people in a rural area of The Netherlands.
Design of the experimentOOS experiments have been relatively rare, because they were perceived byretailers as risky and potentially very costly. The above-described intensecompetition among the group “Large stores I” in The Netherlands makes this allthe more clear. Indeed, many aspects of our study were constrained because ofconsiderations of expense and permanent loss of customers. For example, thecategories that have been selected for this study had high purchase frequencies,which made it expensive to study the effects of multiple exposures to OOSconditions and the loss of loyal customers due to the “Large Store I”competition.
In order to measure brand loyalty and not SKU loyalty, the brands selectedhad to have clear substitutes within the category, and because the brand’s entireline was temporarily deleted from the assortment and no switching could occurwithin brand SKUs, the OOS response had been limited to three options:
(1) switching to competing brands;
(2) switching stores to get the preferred brand; and
(3) postponing purchase in the category.
The other OOS responses, although less likely expected to occur, are not thefocus of this study. They will, however, be briefly explored later on in the paper.
Potential determinants of the above-mentioned responses that had beenstudied were whether the shelves were left empty or were filled up, whether aconsumer was loyal to a store, or what the amount of purchase was pershopping trip. Furthermore, the difference in amount of spending before andduring the OOS period per individual was estimated.
EuropeanJournal ofMarketing32,11/12
1016
The design of the experiment was constrained by aspects such as thefollowing:
(1) stores often had contracts with suppliers that demand that the brandsmust be on the shelves;
(2) store managers had to give special instructions to remove the brands andreplace them at the proper time;
(3) the motivation of the store managers who had to keep the brands off theshelf was being put under pressure, when they received complaints fromthe customers;
(4) there was a potential loss in sales, visits, and image as well as in storeloyalty.
From these stores, the effects of OOS on actual purchase behavior weremeasured with a telephone survey.
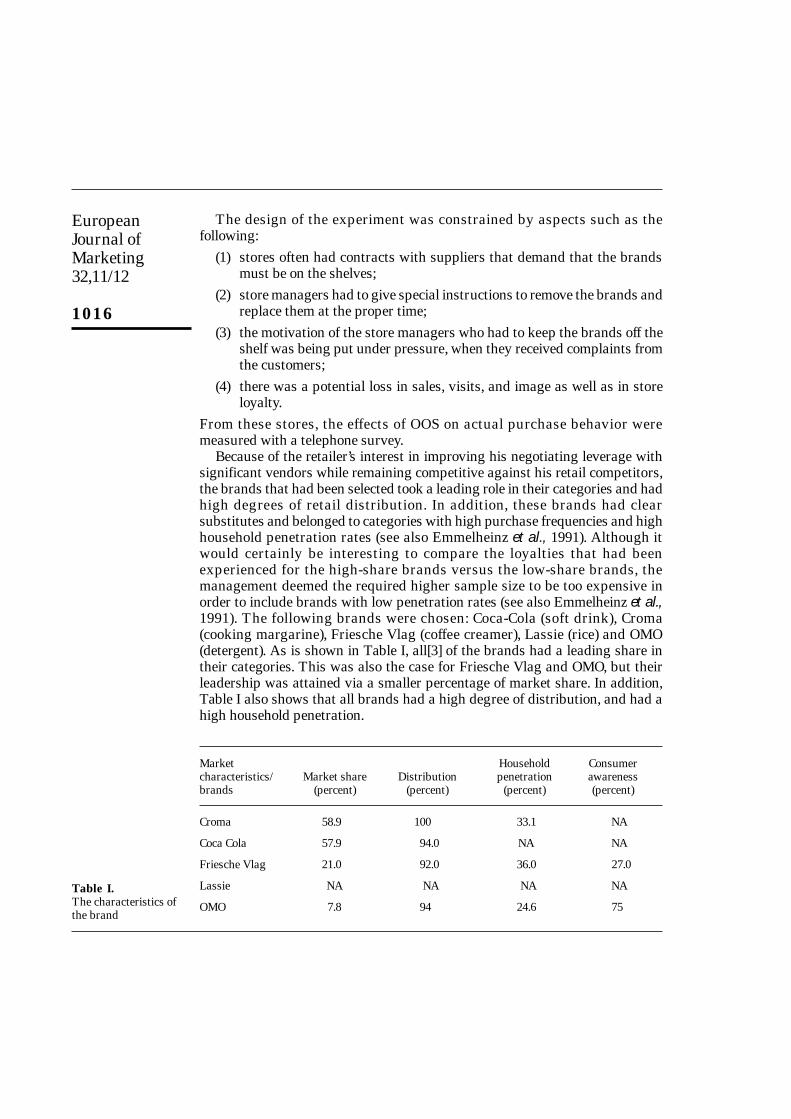
Because of the retailer’s interest in improving his negotiating leverage withsignificant vendors while remaining competitive against his retail competitors,the brands that had been selected took a leading role in their categories and hadhigh degrees of retail distribution. In addition, these brands had clearsubstitutes and belonged to categories with high purchase frequencies and highhousehold penetration rates (see also Emmelheinz et al., 1991). Although itwould certainly be interesting to compare the loyalties that had beenexperienced for the high-share brands versus the low-share brands, themanagement deemed the required higher sample size to be too expensive inorder to include brands with low penetration rates (see also Emmelheinz et al.,1991). The following brands were chosen: Coca-Cola (soft drink), Croma(cooking margarine), Friesche Vlag (coffee creamer), Lassie (rice) and OMO(detergent). As is shown in Table I, all[3] of the brands had a leading share intheir categories. This was also the case for Friesche Vlag and OMO, but theirleadership was attained via a smaller percentage of market share. In addition,Table I also shows that all brands had a high degree of distribution, and had ahigh household penetration.
Market Household Consumercharacteristics/ Market share Distribution penetration awarenessbrands (percent) (percent) (percent) (percent)
Croma 58.9 100 33.1 NA
Coca Cola 57.9 94.0 NA NA
Friesche Vlag 21.0 92.0 36.0 27.0
Lassie NA NA NA NA
OMO 7.8 94 24.6 75
Table I.The characteristics ofthe brand
Preferred brandout-of-stock
1017
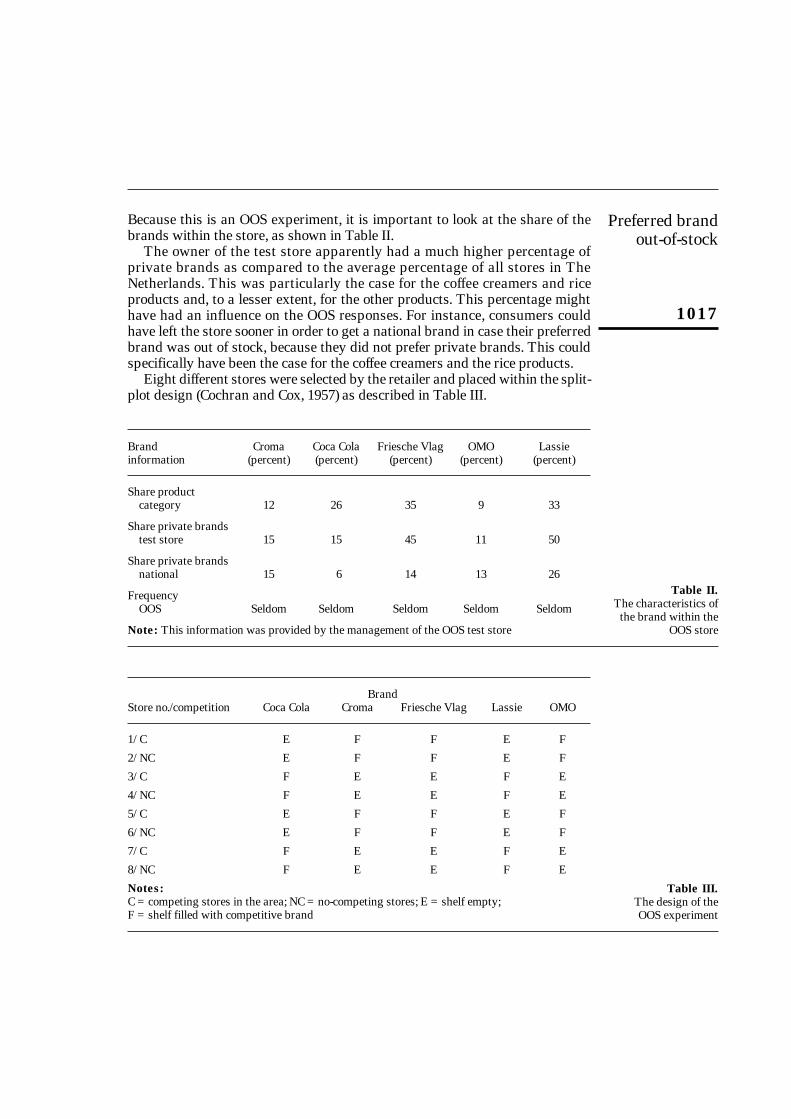
Because this is an OOS experiment, it is important to look at the share of thebrands within the store, as shown in Table II.
The owner of the test store apparently had a much higher percentage ofprivate brands as compared to the average percentage of all stores in TheNetherlands. This was particularly the case for the coffee creamers and riceproducts and, to a lesser extent, for the other products. This percentage mighthave had an influence on the OOS responses. For instance, consumers couldhave left the store sooner in order to get a national brand in case their preferredbrand was out of stock, because they did not prefer private brands. This couldspecifically have been the case for the coffee creamers and the rice products.
Eight different stores were selected by the retailer and placed within the split-plot design (Cochran and Cox, 1957) as described in Table III.
Brand Croma Coca Cola Friesche Vlag OMO Lassieinformation (percent) (percent) (percent) (percent) (percent)
Share product category 12 26 35 9 33
Share private brandstest store 15 15 45 11 50
Share private brandsnational 15 6 14 13 26
FrequencyOOS Seldom Seldom Seldom Seldom Seldom
Note: This information was provided by the management of the OOS test store
Table II.The characteristics of
the brand within theOOS store
BrandStore no./competition Coca Cola Croma Friesche Vlag Lassie OMO
1/ C E F F E F
2/ NC E F F E F
3/ C F E E F E
4/ NC F E E F E
5/ C E F F E F
6/ NC E F F E F
7/ C F E E F E
8/ NC F E E F E
Notes: C = competing stores in the area; NC = no-competing stores; E = shelf empty;F = shelf filled with competitive brand
Table III.The design of theOOS experiment
EuropeanJournal ofMarketing32,11/12
1018
Shelf empty referred to a situation where the brand was taken from the shelf andthe shelf was left empty. This condition suggested to the consumer an OOSsituation. “Shelf filled” meant that the retailer had to fill the shelf with acompetitive brand, thus hiking the visibility of the competitor’s brand. Thissituation suggested to the consumer an assortment deletion.
Competing stores referred to a village or neighborhood of competitive storeswith a similar assortment (mostly from the group “Large stores I or II”). The“no-competing” stores meant that there were no competing stores with a similarassortment (mostly from the group “Large stores I or II”). If the consumerswanted to find their brand in a similar store that carried a particularassortment, they had to switch neighborhoods or villages.
SamplingDuring the pretest period, we confirmed that:
(1) store managers cooperated;
(2) competing stores carried similar brand assortments; and (3) consumers agreed to provide telephone numbers and respond to a
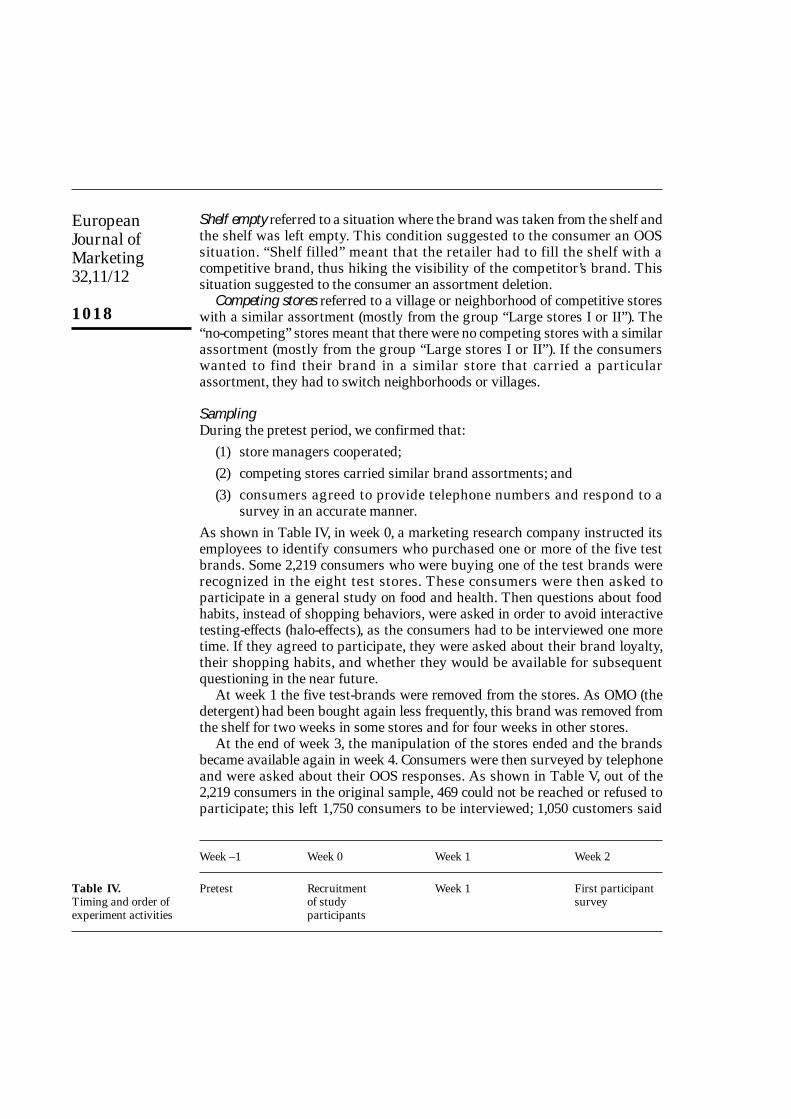
survey in an accurate manner. As shown in Table IV, in week 0, a marketing research company instructed itsemployees to identify consumers who purchased one or more of the five testbrands. Some 2,219 consumers who were buying one of the test brands wererecognized in the eight test stores. These consumers were then asked toparticipate in a general study on food and health. Then questions about foodhabits, instead of shopping behaviors, were asked in order to avoid interactivetesting-effects (halo-effects), as the consumers had to be interviewed one moretime. If they agreed to participate, they were asked about their brand loyalty,their shopping habits, and whether they would be available for subsequentquestioning in the near future.
At week 1 the five test-brands were removed from the stores. As OMO (thedetergent) had been bought again less frequently, this brand was removed fromthe shelf for two weeks in some stores and for four weeks in other stores.
At the end of week 3, the manipulation of the stores ended and the brandsbecame available again in week 4. Consumers were then surveyed by telephoneand were asked about their OOS responses. As shown in Table V, out of the2,219 consumers in the original sample, 469 could not be reached or refused toparticipate; this left 1,750 consumers to be interviewed; 1,050 customers said
Week –1 Week 0 Week 1 Week 2
Pretest Recruitment Week 1 First participantof study surveyparticipants
Table IV.Timing and order ofexperiment activities

Preferred brandout-of-stock
1019
“no” to the question whether they had “the intention to buy one out of the fivetest-brands during the OOS-period”, which left 700 consumers who bought oneout of the five test-brands in the test-stores. The 1,050 consumers were notquestioned any further. Out of the 700 consumers, 110 bought more than one ofthe five brands and these consumers were eliminated from further questioning;590 consumers who had experienced one OOS were used for subsequentanalysis. In other words, this study only gave the consumers’ response to onebrand out of stock and not to more brands that were out of stock. This lastquestion, although interesting, was beyond the scope of this study.
As shown in Table VI, the number of OOS experiences was spread unequallyover the test brands. This might have been caused by the purchase frequency,which was higher for soft drinks, followed by milk products and butter, andfinally, rice and detergent that were purchased more slowly.
Demographic characteristics of the consumersThe average age of the 650 consumers was 41.6 years; 9 percent were between10 and 30 years of age; 44 percent were between 30 and 40 years of age; 24percent were between 40 and 50 years of age, the remainder, 33 percent wereolder than 50 years. The majority (80 percent) of the consumers were female.
Operationalizations of the measures(1) Brand preference: the consumers who were engaged in the experiment
were all brand-loyal, hence the term “preferred brand”. The brandpreference was measured by using the measure of Jacoby and Chestnut
2, 219 Number of consumers in the original sample
–469 Not reached or refused
1,750 Consumers surveyed
–1,050 No attempt to purchase test brand in test stores during test period
= 700 At least one preferred brand OOS experience in test stores period
–110 Two or more preferred brand OOS experiences
= 590 One preferred brand OOS experience
Cola 240
Friesche Vlag 175
Lassie 41
Croma 119
OMO 15
Total 590
Table VI.Consumers encountering
OOS by brand
Table V.Survey population size
at each stage of theexperiment
EuropeanJournal ofMarketing32,11/12
1020
(1978). The two questions “Do you prefer brand x” and “Did you buybrand x lately” were combined into one scale.
(2) Store loyalty: the store loyalty was measured by asking “How much ofyour shopping-trips do you make to this store in one week”. Based on theanswers, the operationalizations of store loyalty were laid down in apercentage of shopping-trips that had been made to a particular store.From these, three degrees of store loyalty were identified. Consumerswho made more than half of their weekly shopping-trips to the test-storewere classified as “store loyals”. Consumers who divided their tripsequally between the test-store and other stores were classified as“opportunists” and consumers reported to do more shopping-trips tocompeting stores were classified as “competitor loyal”.
(3) Amount of purchases: the number of purchase trips were measured byasking “How many Dutch guilders do you spend in one week and howmany shopping trips do you make in one week?” The “small amount ofpurchase per shopping trip” was defined by those consumers who spentless than 70 guilders per visit. The “large amount of purchase pershopping trip” was defined by the ones who spent more than 70 guildersper visit.
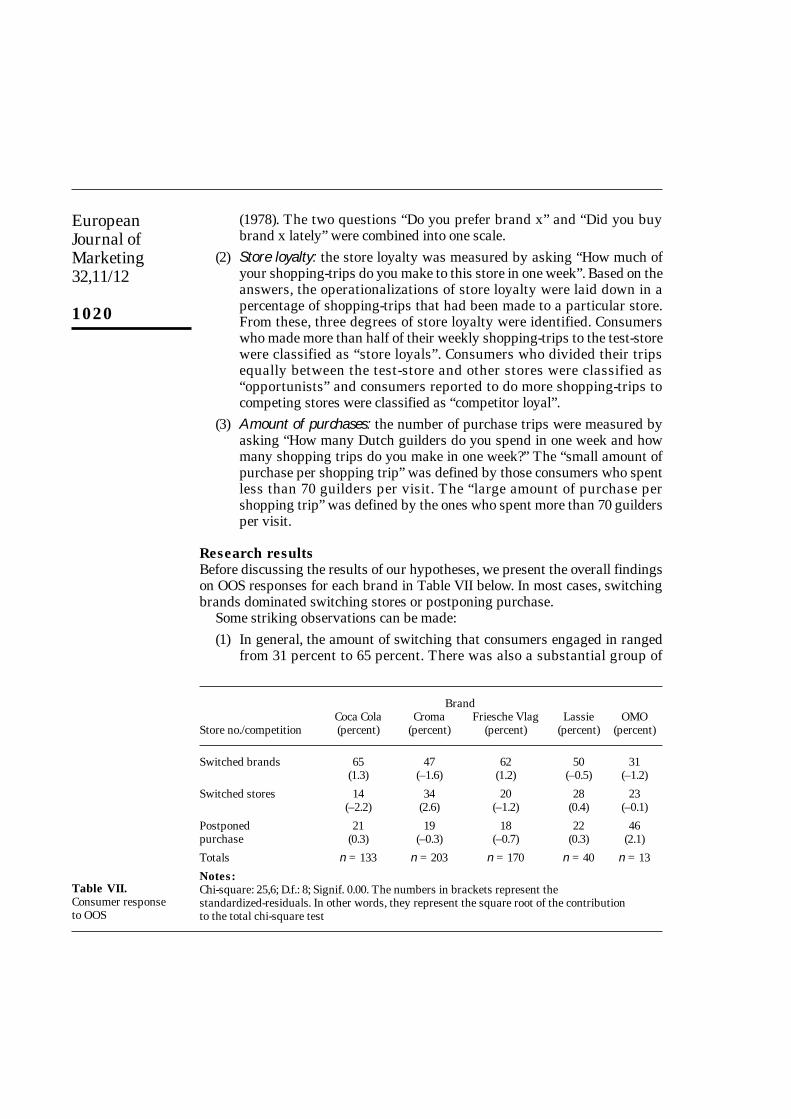
Research resultsBefore discussing the results of our hypotheses, we present the overall findingson OOS responses for each brand in Table VII below. In most cases, switchingbrands dominated switching stores or postponing purchase.
Some striking observations can be made:(1) In general, the amount of switching that consumers engaged in ranged
from 31 percent to 65 percent. There was also a substantial group of
BrandCoca Cola Croma Friesche Vlag Lassie OMO
Store no./competition (percent) (percent) (percent) (percent) (percent)
Switched brands 65 47 62 50 31(1.3) (–1.6) (1.2) (–0.5) (–1.2)
Switched stores 14 34 20 28 23(–2.2) (2.6) (–1.2) (0.4) (–0.1)
Postponed 21 19 18 22 46purchase (0.3) (–0.3) (–0.7) (0.3) (2.1)
Totals n = 133 n = 203 n = 170 n = 40 n = 13
Notes: Chi-square: 25,6; D.f.: 8; Signif. 0.00. The numbers in brackets represent the standardized-residuals. In other words, they represent the square root of the contributionto the total chi-square test
Table VII.Consumer responseto OOS

Preferred brandout-of-stock
1021
consumers who switched stores (this ranged from 14 percent to 34percent).
(2) There were large differences of OOS responses among the brands. CocaCola had the most salient OOS response, as 34 percent of the consumerswere willing to walk out of the store to get their preferred brand; Cromahad the lowest percentage. It was difficult to trace the real reasons forsuch a difference, given the small amount of brands used in this study.For instance, as Croma and Coke both had large market shares and ahigh distribution, there was still a large difference in the willingness ofconsumers to switch stores. This difference was due to the urgency ofbuying the brand (thirsty consumers cannot wait to get their Coca Cola)or it was due to a different degree of brand parity (Coke was betterpositioned compared to the other brands).
(3) Note in Table VII that not all consumers are listed: some consumersprovided incomplete information; but more important, about 1 percent ofthe consumers responded differently to the OOS situation than the threealternatives we have investigated. Indeed, about four or five consumersresponded and said that they switched categories. However, theseobservations had a low frequency of occurrence and, therefore, they werenot further analyzed in this paper.
Competing storesH1 was about the posited effects from competing stores (a competing group“Large store I” with similar assortments in the same village or neighborhood)on OOS behavior. As shown in Table VIII, the effects of this condition were notsupported. H1a, that consumers would be less likely to switch to competingbrands when the competing stores were nearby, was not supported. H1b and 1c(consumers would be more likely to switch stores and less likely to postpone)were not supported either.
Store competitionNo store competition Store competition
OOS response (percent) (percent)
Switched brands 55.2 (–0.1) 56.6 (0.2)
Switched stores 24.5 (0.2) 23.4 (–0.2)
Postponed purchase 20.3 (0.0) 20.1 (0.0)
Totals n = 306 n = 274
Notes:Chi-square 0.13; D.f.:2; Signif: 0.94
Table VIII.Effects of nearby store
competition
EuropeanJournal ofMarketing32,11/12
1022
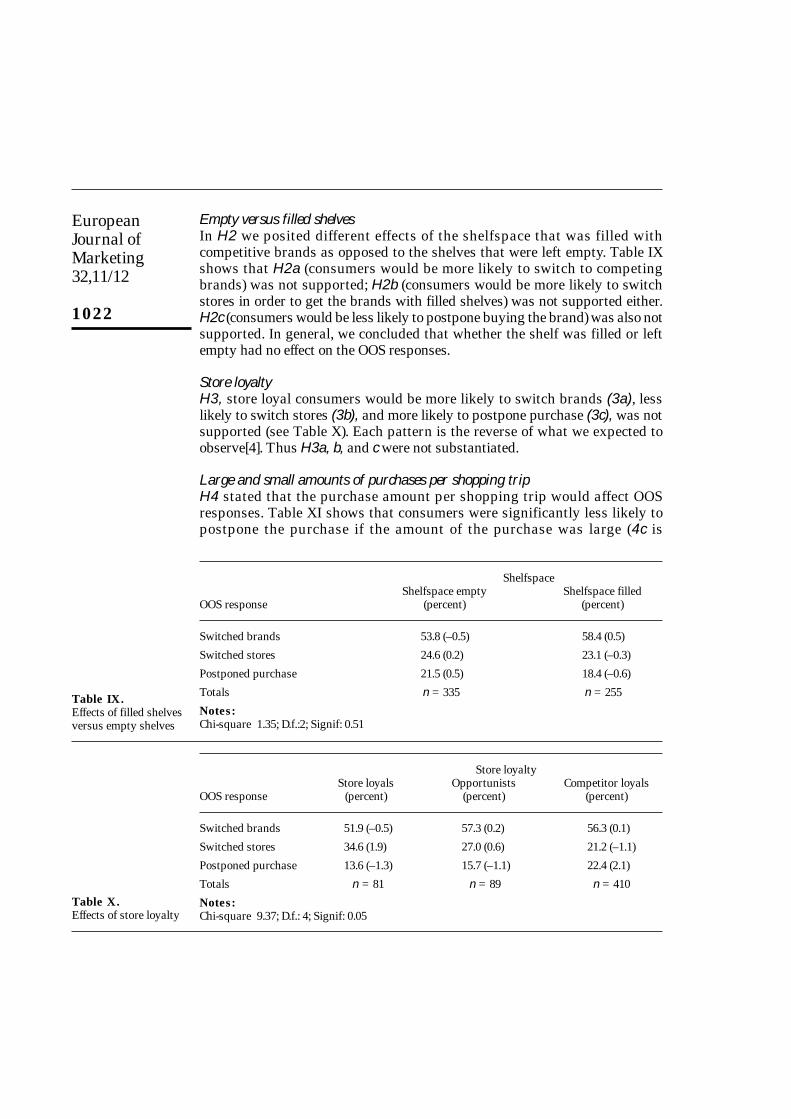
Empty versus filled shelvesIn H2 we posited different effects of the shelfspace that was filled withcompetitive brands as opposed to the shelves that were left empty. Table IXshows that H2a (consumers would be more likely to switch to competingbrands) was not supported; H2b (consumers would be more likely to switchstores in order to get the brands with filled shelves) was not supported either.H2c (consumers would be less likely to postpone buying the brand) was also notsupported. In general, we concluded that whether the shelf was filled or leftempty had no effect on the OOS responses.
Store loyaltyH3, store loyal consumers would be more likely to switch brands (3a), lesslikely to switch stores (3b), and more likely to postpone purchase (3c), was notsupported (see Table X). Each pattern is the reverse of what we expected toobserve[4]. Thus H3a, b, and c were not substantiated.
Large and small amounts of purchases per shopping tripH4 stated that the purchase amount per shopping trip would affect OOSresponses. Table XI shows that consumers were significantly less likely topostpone the purchase if the amount of the purchase was large (4c is
ShelfspaceShelfspace empty Shelfspace filled
OOS response (percent) (percent)
Switched brands 53.8 (–0.5) 58.4 (0.5)
Switched stores 24.6 (0.2) 23.1 (–0.3)
Postponed purchase 21.5 (0.5) 18.4 (–0.6)
Totals n = 335 n = 255
Notes:Chi-square 1.35; D.f.:2; Signif: 0.51
Store loyaltyStore loyals Opportunists Competitor loyals
OOS response (percent) (percent) (percent)
Switched brands 51.9 (–0.5) 57.3 (0.2) 56.3 (0.1)
Switched stores 34.6 (1.9) 27.0 (0.6) 21.2 (–1.1)
Postponed purchase 13.6 (–1.3) 15.7 (–1.1) 22.4 (2.1)
Totals n = 81 n = 89 n = 410
Notes:Chi-square 9.37; D.f.: 4; Signif: 0.05
Table X.Effects of store loyalty
Table IX.Effects of filled shelvesversus empty shelves

Preferred brandout-of-stock
1023
substantiated). While a decrease in purchase postponement translated into anincrease in brand switching and store switching, the increase was notindividually statistically significant (4a and 4b were not substantiated). Itappeared, however, that switching brands is the most frequent response.
Effect of OOS on consumer spending in test storesH5 stated that OOS experiences would decrease the weekly consumer spendingin the test-stores. On average, consumers were reported to spend 3.2 guilders(one US dollar is about 1.8 Dutch guilders) less each week in the test-stores afterthe OOS experience. The difference between pre-OOS and post-OOS of weeklyspending levels was not significant, however, and was entirely due to lost anddelayed sales of the OOS items.
Summary of findings, limitations and directions for futureresearchAlthough academics and trade specialists have been speculating that brandloyalty had eroded and that most of these opinions had been based onbehavioral data and speculation, acid tests have been lacking. The acid test forthis study took place in a low-priced store that belonged to one of the largestretailers in a rural area in The Netherlands. The data from this study showedthat almost 45 percent of the consumers were not willing to switch brands whentheir preferred brand was OOS: they either switched stores or postponed thepurchase. These OOS responses differed substantially per brand. It seemed thatconsumers were willing to undertake behavioral efforts in order to obtain theirpreferred brand. The experimental design and the consumer shoppingcharacteristics allowed us to investigate in depth the way in which consumerswere willing to undertake efforts in order to obtain their preferred brand. To oursurprise, it was striking that in the present experiment, OOS response seemedto be remarkably stable under a variety of experimental treatments. Thepresence of nearby competing stores did not influence the percentage of storeswitchers versus brand switchers. Nor did the sign of an assortment change(shelves filled) versus a temporary OOS (empty shelves) make a difference in the
Size purchaseSmall amount of Large amount of
purchase/trip purchase/tripOOS response (percent) (percent)
Switched brands 51.0 (–0.9) 58.2 (0.6)
Switched stores 22.9 (–0.3) 24.5 (0.2)
Postponed purchase 26.0 (1.8) 17.3 (–1.3)
Totals n = 192 n = 388
Notes:Chi-square 6.23; D.f.: 2; Signif: 0.04
Table XI.Effects of consumer
purchase amount per trip

EuropeanJournal ofMarketing32,11/12
1024
OOS response. However, consumer shopping characteristics did have an effecton the OOS response:
(1) Consumers classified as “store loyal” were more likely to switch stores.
(2) Consumers purchasing small amounts per shopping trip were less likelyto switch brands and more likely to postpone purchases.
(3) Finally, a surprising finding was that a total amount of the spending ofthe consumers was only slightly affected by the OOS (only marginallymore than the lost sales of the test-items).
The basic intention of this OOS experiment was to study the consumers’ OOSresponses to a whole product line of a preferred brand that was taken from theshelves. Earlier research mainly focused on the OOS response to one SKU of abrand removed from the shelves (Emmelhainz et al., 1991). Differences inresearch goals and experimental designs made it difficult to compare them.Still, earlier work referred to a large willingness of the consumer to undertakebehavioral efforts in order to get the brand they preferred (by either switchingto SKUs within the brand, being willing to switch stores, or to postpone thepurchase). Earlier work showed that about 14 percent were willing to switchstores, while in this study it was 24 percent. This difference is understandable,because the whole brand was removed from the shelf. In addition, the highshares of private brands on the OOS store as well as the fact that consumerswere mainly competitor-loyal rather than loyal to the OOS store might havecontributed to this, too.
The competitive retail environment did not have an effect on the willingnessof consumers to switch stores. In other words, consumers were willing toengage in large distances to get their favorite brand, in order to make the tripto the stores. It must be noted also that the positioning of the store was suchthat many consumers were cherry pickers, seeking some of the preferredbrands priced a bit cheaper. Visiting the different stores in order to get thepreferred brand cheaper was a salient characteristic of the shopping behavior ofthe consumers of the OOS store.
A counterintuitive finding in this study was that consumers who wereclassified as “store loyals” were more likely to switch stores in response to theOOS. This observation was not in accordance with the findings of Emmelheinzet al. (1991) or with the expectations from the literature which depicted storeloyal consumers to be less venturesome (and thus would not switch brands).However, we interpreted this finding to be the willingness of the consumers topunish the retailer to whom they were loyal and who refused to carry theirbrand.
ImplicationsThe design of this OOS experiment fits well with the many questions thatretailers have about whether they or the manufacturer have power (Quelch andHarding, 1996). Recently, many authors have been suggesting that retail power

Preferred brandout-of-stock
1025
is rising. Retail power implies that the retailer has a large amount of freedom tostock their private brands at the cost of national brands.[5] The ability to stockprivate brands is caused by the large amount of parity that consumers mightperceive among the brand and so, consumers might be willing to investbehavioral efforts in the brands. However, if consumers would be willing toinvest behavioral efforts in the brand, retailers would like to know if their owncompetitive environment would have any effect. This study shows thatconsumers were willing to invest much in getting their preferred brand andretailers should perceive the results of this experiment as a warning. Quelch andHarding (1996) recently suggested that, rather than using abstract language toinvestigate whether the retailer has power or the manufacturer, jointexperiments involving both manufacturer and retailer should be undertaken, soas to define what consumers are willing to do to get the brand. Experiments likethese show the power of the manufacturer for at least in the short term. Threemain findings emerge for retailers:
(1) Retailers, but specifically the retailer described in this paper, should keepin mind that abruptly taking a brand out of store is simply disastrous fortheir own retail chain because a large percentage of consumers arewalking out of the store.
(2) When retailers change their assortment abruptly, they specifically losetheir own, and perhaps most important segment of consumers, namelythe store loyals.
(3) Retail competition as outlined in this study did not have a large impacton the strategic policies of the retailers’ assortment. Consumers, at leastthose who were studied in this paper, were quite flexible and mobile andtherefore were willing to create a portfolio of stores from which theycould choose. Thus, being a single retailer in one specific area will not bea substantial competitive advantage these days.
But what about the long term? This experiment is clearly a short-term one.Many marketing experts expect that over a long period of time retailers will bemore willing to invest in private brands (Quelch and Harding, 1996). At least inthis experiment, the consumer’s commitment might explain why this trend ofintroducing private brands did not take place in The Netherlands. Limitationsof the experimental design, though, might have prevented some of thehypothesized responses from occurring or being observed, particularlythe switching of brands. For example, it might take a long time for consumersto equate OOS with assortment decisions. Similarly, it might take longer forconsumers to change their shopping patterns in order to favor competingstores, or the distances gauged by the managers might be inadequate tostimulate the responses hypothesized. Currently, some retailers were quitesuccessfully able to change the behaviors of the consumers in favor of theirprivate brands, and data showed that this expansion was even more successfulin countries like Great Britain.

EuropeanJournal ofMarketing32,11/12
1026
Limitations of the study and further researchAlthough this large experimental undertaking has provided us with newinformation about the consumer’s responses to OOS situations, somelimitations in the study can be avoided in future OOS experiments.
First, there might have been problems with the abilities of consumers torecall purchasing behaviors over the previous four weeks. Perhaps keeping adiary in which consumers note their responses would be more suitable thandoing a telephone survey. However, owing to the costs of this already largeundertaking, collecting dairies was not feasible. In addition, the diary couldhave caused interactive testing effects (e.g. consumers might become overlyattentive to the OOS situations and so display artificial responses). Or else, theOOS responses of consumers could have been observed in the store(Emmelheinz et al. 1991). This undertaking would be rather expensive, for theOOS period of the detergent took about two weeks.
The long-term consequences of the OOS could have been studied bychanging the length of the OOS situation or by tracking the sales of theconsumer in the course of time.
Although we made a distinction between temporary OOS versus changes inassortment – which is made recognizable to the consumer through the emptyshelves and the labels remaining on the shelves – we did not validate thatconsumers actually perceived this situation to be so. In a future experiment, thisshould be further validated.[6]
This study was focused on brand loyalty, not SKU-loyalty. Although brandloyalty is a better measure of the overall strength of the brand than SKU loyalty,a model that relates to the two concepts is needed. One might feel relativelyindifferent between the 250ml size of Coke and the 1 litre size, but one might stillbe fiercely loyal to Coke. In other words, simply summing up the loyalty todifferent SKUs will not necessarily be a good indicator of brand loyalty.
This experiment was executed on a lower-priced retailer and could thereforehave biased the data findings of this paper. In another experiment, differentretailers should be participating. However, because of the large undertaking ofsuch an experiment, this might not be easy.
Furthermore, instead of questioning consumers about their spending pattern(which could be unreliable), cash register data could be used. Recently, scanningabilities[7] which were not available at the time of the experiment have beenrising and could be used to better estimate the OOS responses.
Finally, in this paper psychological effects such as irritation and frustrationof consumers have been frequently mentioned. These psychological effects canbe measured indirectly. For instance, the degree of frustration of the consumerscan be measured by using scales which measures the autonomic reactivity.
Notes1. “Rushing in” is perhaps a bad term as retailers need to obtain permission from city
planning to build a store within a neighborhood. Usually, only a few slots are madeavailable for the retailers, therefore governmental lobbying is important here.

Preferred brandout-of-stock
1027
2. While now the hours of opening of the stores have expanded, during the OOS experiment,these were the hours of opening of the stores then.
3. The manufacturers of the brand Lassie were not willing to provide us with their marketinformation.
4. Please note in Table IX that the majority of the consumers were competitor loyal ratherthan store loyal. Depth interviews with some of the consumers and discussion with themanagement made us aware of the fact that this store had a low price image, and most ofthe consumers were indeed only doing part of their shopping in the store, specifically forthe cheap priced brands (cherry picking).
5. Retailers in The Netherlands apparently have been cautious though in introducing privatebrands. Within the product categories, the share of the private brands as well as the rise inthe share of these private brands was quite low. The brands under investigation were asfollows: for detergent it ranged from 12.9 percent in 1991 to 12.4 percent in 1994; the shareof soft drinks ranged from 3.2 percent in 1991 to 5.5 percent in 1994; for milk it ranged from13.6 percent to 12.7 percent. For butter products it ranged from 10.6 percent to 15.1 percent,for rice it ranged from 21.5 percent to 26.3 percent (Nielsen, 1995).
6. We are thankful to an anonymous reviewer for this comment.7. In The Netherlands there were only 483 stores with scanning technology in 1988; now there
are 2,000 stores with scanning technology from a total of 7,248 stores (Nielsen, 1995).8. This information was provided by the management of the OOS test store.
ReferencesAaker, D. (1991), Managing Brand Equity, The Free Press, New York, NY.Beatty, S.E., Homer, P. and Kahle, L.R. (1988), “The involvement-commitment model; theory and
implication”, Journal of Business Research, Vol. 16, pp. 149-67.Borin, N., Farris, P. and Freeland, J. (1994), “A model for determining retail product category
assortment and shelf space allocation”, Decision Sciences, Vol. 25 No. 3, pp. 359-83.Chang, Y.S. and Niland, P.A. (1967), “A model for measuring stock depletion costs”, Operations
Research, Vol. 15, pp. 427-47.Charlton, P. and Ehrenberg, A. (1976), “An experiment in brand choice”, Journal of Marketing
Research, Vol. 13, May, pp. 152-60.Clemmer, E. and Schneider, B. (1989), Towards Understanding and Controll ing Customer
Dissatisfaction with Waiting, Report nr. 89-115, The Marketing Science Institute, Cambridge,MA.
Cochran, W. and Cox, G. (1957), Experimental Designs, John Wiley & Sons, Inc, New York, NY.Corstjens, M. and Corstjens, J. (1995), Store Wars: The Battle for Mindspace and Shelfspace,
J. Wiley & Sons, London.Corstjens, M., Lal, R. and Corstjens, J. (1994), “Shelf space allocation for store brands”,
unpublished working paper. Elton, M.C. and Mercer, A. (1969), “Estimating the effect of variety on sales”, Operational Research
Quarterly, Vol. 20, pp. 351-60. Emmelheinz, M., Stock, J. and Emmelheinz, L. (1991), “Consumer response to retail stock-outs”,
Journal of Retailing, Vol. 67 No. 2, pp. 138-46. Ernst, R. and Cohen, M. (1992), “Customer prioritization strategies of distribution management”,
International Journal of Operations and Production Management, Vol. 12 No. 3, pp. 25-37.Gattorna, J. (1988), “Effective logistics management”, International Journal of Physical
Distribution and Materials Management, Vol. 18, pp. 4-92. Hill, R. (1990), “Using inter-branch stock transfer to meet demand during a stockout”,
International Journal of Retail and Distribution Management, Vol. 20 No. 3, pp. 27-32.
EuropeanJournal ofMarketing32,11/12
1028
Hill, R. (1992), “Parameter estimation and performance measurement in lost sales inventorysystems”, International Journal of Production Economics, Vol. 28 No. 2, pp. 211-15.
Hoyer, W.D., Van Trijp, J.C.M. and Inman, J.J. (1996), “Why switch? Variety seeking behavior as aproduct x individual interaction”, Journal of Marketing Research, Vol 33 No. 8, pp. 281-92.
Jacoby, J. and Chesnut, R. (1978), Brand Loyalty Measurement and Management, John Wiley andSons, New York, NY.
Karman, M. and Ingene, C. (1993), “An inventory model of immediate and delayed delivery”,Management Science, Vol. 39 No. 5, pp. 536-48.
Lastovichla, J.L. and Gardner, D.M. (1977), “Components of involvement”, in Maloney J.C. andSilverman, B. (Eds), Attitudes Research Plays for High Stokes, American MarketingAssociation, pp. 53-73.
Lesser, J. and Hughes, M. (1986), “Towards a typology of shoppers”, Business Horizons, Vol. 29,pp. 56-62.
McAlister, L. and Pessemier, E. (1990), “An inventory model of immediate and delayed delivery”,Management Science, Vol. 39 No. 5, pp. 536-48.
Mittal, B. and Lee, M.S. (1988), “Separating brand choice involvement from producer involvementvia consumer involvement profiles”, Advances in Consumer Research, Vol. 15, pp. 36-40.
Moinzadeh, K. and Ingene, C. (1993), “An inventory model of immediate and delayed delivery”,Management Science, Vol. 39 No. 5, pp. 536-48.
Nielsen, A.C. (1995), JaarOverzicht + Productgroepen, A.C. Nielsen, Diemen.Peter, J.P. and Olson, J.C. (1990), Consumer Behavior and Marketing Strategy, Irwin, Homewood,
IL.Progressive Grocer (1968), “The out-of-stock study”, October, S4-5.Quelch, J.A. and Harding, D. (1996), “Brands versus private labels”, Harvard Business Review,
January-February, pp. 99-109.Rebstein, D.J. and Gattignon, H. (1984), “Optimal product line pricing: the influence of elasticities
and cross elasticities”, Journal of Marketing Research, Vol. 21, pp. 259-67.Reynolds, F., Darden, W. and Martin, W. (1974/75), “Developing an image of the store-loyal
customer”, Journal of Retailing, Vol. 50, pp. 73-84.Robinson, J. and Nicosia, F. (1991), “Of time, activity, and consumer behavior: an essay on
findings, interpretations, and needed research”, Journal of Business Research, Vol. 22, pp. 171-86.
Schary, P. and Christopher, M. (1979), “The anatomy of a stock-out”, Journal of Retailing, Vol. 55,Summer, pp. 59-67.
Tranberg, H. and Hansen, F. (1986), “Patterns of brand loyalty: their determinants and their rolefor leading brands”, European Journal of Marketing, Vol. 30, pp. 81-109.
Walter, C.K. and Grabner, J. (1975), “Stockout cost models: empirical tests in a retail situation”,Journal of Marketing, Vol. 39, pp. 56-68.
Walter, C.K. and LaLonde, B.J. (1975). “Development and tests of two stockout cost models”,International Journal of Physical Distribution, Vol. 5 No 3, pp. 121-32.
Weinstein, S. (1993), “How to avoid product duplication”, Progressive Grocer, July, pp. 103-4.