Embed Size (px)
Citation preview

Consumer Research
80
Fieldwork conducted by TNS
2009 Report
Financial Services Authority
Consumer awareness of
the FSA and financial
regulation

Financial Services Authority Consumer awareness of the FSA and financial regulation
Fieldwork conducted by TNS
2009 Report

1
Acknowledgments
We wish to thank TNS who carried out the field work on our behalf in 2009, 2008 and 2007,
GfK NOP who carried out the research in 2006 and 2005 and BMRB who carried out the
fieldwork in 2004 and 2003.
This report was managed and written by Tim Burrell at the FSA. Tel: 020 7066 4322, email: [email protected]
You can download copies of the report from the publications section of the FSA website:
www.fsa.gov.uk/Pages/Library/research/Consumer/index.shtml
2
Contents
1. Background 1
2. Methodology 2
3. Summary 3
4. Awareness of regulation 4
4.1 Overall levels of awareness of financial regulation and the FSA 4 4.2 Which groups are most and least aware that financial regulation exists? 6 4.3 What people think are the main activities of the FSA 10 4.4 Awareness of various aspects of the regulatory regime 11 4.5 Awareness of the FSA role in providing information to consumers 12 4.6 FSA independence 14
5. Confidence in financial regulation 16
5.1 How confident are consumers that firms meet FSA standards? 16 5.2 How confident are people that the FSA is effectively regulating the
financial services industry? 20
6. Non-zero failure 23
6.1 Do people believe firms are allowed to go bankrupt? 23 6.2 Can consumers lose money from a firm going bankrupt? 27
7. Product risk 30
7.1 Consumer attitude to risk 30 7.2 Consumer product holdings and stated attitude to risk 31 7.3 Consumer attitude to product risk 32 7.4 Risk profile of consumers responsible for financial decisions 35
8. Treating customers fairly 37
8.1 Consumer confidence in financial firms treating customers fairly 37 8.2 Consumers’ confidence in being treated fairly by the financial firms they
deal with 39 8.3 Consumer experience when dealing with financial firms 43
3
9. Financial fraud 47
9.1 Consumer exposure to financial fraud 47 9.2 Information to avoid being a victim of financial crime 50 9.3 Responsibility for the prevention of financial crime 54 9.4 Likelihood of becoming a victim of financial fraud 56 9.5 Actions taken to prevent financial fraud 59 9.6 Consequences of being a victim of financial crime 62 9.7 Causes of identity fraud 63
10. Appendix A: 2009 Questionnaire 66

1. Background
Consumers’ knowledge of financial regulation varies enormously. It can range from familiarity with
some quite precise knowledge about what the Financial Services Authority (FSA) requires from firms
and the protections to consumers that are in place, to a more vague understanding that some form of
‘watchdog’ safeguards consumer interests, or no knowledge at all of the FSA.
The FSA is keen to know the extent of consumers’ knowledge of regulation and their confidence in
the financial system. It has tracked its recognition levels over a number of years and refined and
extended the analysis over this time. While it is not especially important that consumers are aware of
all the different aspects of the FSA’s work, knowledge of that work in relation to consumer protection
and consumer information may help consumers make more informed decisions and increase their
financial capability and confidence.
Many consumers benefit from the work of the FSA indirectly through the actions of firms, and may be
unaware of the direct role of regulation. But in other cases, an awareness of some elements of
regulation, in its widest sense, is likely to help consumers in making informed decisions. Conversely,
if consumers have unrealistic expectations of what the regulatory regime can provide, this may shape
their behaviour inappropriately.
Analysis of the data has enabled us to monitor awareness levels amongst the holders of regulated
products as well as those who have limited interaction with financial services. The study provides
measures of confidence that consumers have in financial services and regulation, specifically:
• the perceived confidence that firms follow the regulatory regime; and
• consumer confidence that they will be dealt with in a fair manner by firms.
In addition, the study provides information on consumers’ attitudes and behaviour related to financial
crime.

2
2. Methodology
The research presented in this paper is based primarily on results from an omnibus survey TNS carried
out during February 2009. It interviewed a representative sample of 1,997 adults face to face in their
own home throughout Great Britain. The sample is based on 149 sampling points. TNS applied a
limited amount of corrective weighting in order to ensure that the sample is representative of the
British population in terms of known population data on age, sex, social class and region.
The questionnaire has evolved over a number of years and the content is broadly similar to the
previous surveys. In order to track change over time, most of this survey has remained consistent with
the 2008 survey. However, there have been some changes and additions. With input from the FSA’s
financial crime team, the financial crime section of questions has been revised. This is to provide a
more useful measure of consumer exposure to financial fraud, actions taken to prevent financial
fraud and consumer knowledge of different types of financial crime.
Where appropriate, the previous years’ results have been incorporated into the tables and charts
within this document for ease of comparison. The 2009 questionnaire is attached in the Appendix and
previous questionnaires are on the FSA website within the library of publications.1 The analysis in this
report was carried out by the FSA.
1 2008 survey: www.fsa.gov.uk/pubs/consumer-research/crpr67.pdf
2007: www.fsa.gov.uk/pubs/consumer-research/crpr62.pdf
2006: www.fsa.gov.uk/pubs/consumer-research/crpr57.pdf
2005: www.fsa.gov.uk/pubs/consumer-research/crpr39.pdf
2004: www.fsa.gov.uk/pubs/consumer-research/crpr29.pdf
2003: www.fsa.gov.uk/pubs/annual/ar02_03/consumer_awareness_survey03.pdf

3
3. Summary
No change in awareness of the FSA since 2008
32% of consumers are aware of the FSA — the same as the 2008 figure. This is less than the
awareness level shown in 2006 (34%). The results show the highest level of spontaneous awareness –
Respondents could name the FSA without prompting - (21%) since the survey began, an increase
from 18% the previous year.
Significant drop, among those aware of the FSA, in consumer confidence that firms
follow FSA rules
Only 40% of consumers, who are aware of the FSA, are very or fairly confident that firms follow FSA
rules — a drop from 67% in 2008. Over a third (34%) of consumers who are aware of the FSA are
unconfident that firms follow FSA rules.
Consumers are significantly more risk averse
67% of consumers are not willing to take any risk with investments compared with 56% in 2008.
Mixed messages reported that firms treat customers fairly
In general, consumers are less confident that firms treat their customers fairly. 50% are confident
that firms treat their customers fairly, compared with 56% in 2008. 20% of consumers believe that
firms have become worse at treating them fairly, up from 9% in 2008. However, consumer
confidence that they are treated fairly in their own experience has remained stable — falling from
62% to 58%.
Exposure to financial fraud greater through use of the internet
Overall, 31% of adults have been exposed to some sort of financial fraud over the past 12 months.
Interestingly, it is those with internet access who are most exposed - 36% of adults with access to
the internet have been exposed to financial fraud, as opposed to only 18% of people who do not
have internet access. Types of fraud most commonly committed over the internet include a request
from a bank to confirm personal details or password, requests to transfer money from a foreign
country, or notification of winning a lottery or prize draw which the respondent did not recall
entering.

4
4. Awareness of regulation
2008 was a significant year for the UK economy and the FSA. The credit crunch and a number of
events since the Northern Rock crisis in September 2007 have led to greater exposure of the FSA and
its function within the UK. Since the 2008 survey there has been a continued downturn in the UK
mortgage market and interest rates have been cut from 5% in April 2008 to 1% in Feb 2009. In
September 2008 Lehman Bros. failed, Lloyds TSB took over HBOS, and mortgage lender Bradford and
Bingley was nationalised with its retail deposits transferred to Abbey. All these events have been
widely publicised and the FSA has been widely quoted, and had involvement in, seeking resolutions to
the crisis and adapting the regulatory regime to fit current markets. As financial markets change,
knowing that there is some framework in place for the regulation of financial institutions and
products can be reassuring for the public.
In addition to being widely reported in the press, the FSA has many potential touch points with the
public, for example consumer information published on fact sheets and the web, and consumer
campaigns such as ‘Moneymadeclear’ and The Parent’s Guide to Money, which provide information
specific to consumer needs. Awareness of the FSA and financial regulation may be more meaningful
for many when it is in context, for example when they are buying a product or have some financial
query. Consumers may see the FSA mentioned within financial promotions or documentation they
receive when purchasing a financial product. A range of accessible sources of information which
enable consumers to look into in more detail at the appropriate time, may be an important method of
delivering information about the extent of financial regulation. It can also lead consumers to access
specific information such as the comparative tables on the FSA website.
4.1 Overall levels of awareness of financial regulation and the FSA
Consumers have various levels of knowledge about financial regulation. This may reflect varying
levels of knowledge about financial services in general and more specifically about the nature of
regulation in the sector itself. Consumers with an interest in — and a need for — a wide range of
financial products are likely to have more exposure to information about regulation through financial
promotions and documents related to the purchase of specific products. With the increased amount
of press coverage that the UK economy and the FSA have been exposed to during 2008, you could
expect the level of awareness of the FSA would increase. In particular, among those most affected by
the crisis — deposit holders with failed or taken-over banks, shareholders, existing mortgage holders
and first time buyers, and people reaching retirement age.

5
There are various levels at which we can measure knowledge of financial regulation. Our research
allows us to measure the public’s knowledge of financial services regulation in general and also
knowledge of the FSA as a regulator.
Although the overall level of awareness of the FSA has remained relatively constant over the past five
years, the 2009 figure (32%), is less than the awareness level shown in 2006 (34%). However,
spontaneous awareness (21%) is at its highest level since the survey began, an increase from 18% the
previous year. Figure 1 shows how overall awareness of the FSA has changed since 2003.
Figure 1
Overall, just over half (54%) of people assumed that some form of financial regulation was being
carried out, and just under a third (32%) of all people were aware that the FSA regulates the industry.
Awareness has shown little increase in 2008 despite the increased exposure of the FSA due to the
economic crisis. These figures beg the question — despite the increase in FSA exposure through the
media, is there a large section of the population that is not willing to engage with in the financial
system, financial products and the FSA? This reflects previous research that there needs to be a point
of interest for people to be aware of an organisation.
15% 15% 13% 18% 21%18% 16% 19% 15% 14% 11%14% 14% 10%
8% 7% 7%14% 16%
17% 14% 16%
37% 37% 47% 41% 46% 47% 44%
14%12%
15%9%
18% 19%
0%
20%
40%
60%
80%
100%
2003 2004 2005 2006 2007 2008 2009Aware of FSA without prompting Aware of FSA with promptingAware of other financial regulators Assume a regulator existsNo knowledge of a regulator
2003 n=1969
2004 n=1993
2005 n=1924
2006 n=1940
2007 n=1943
2008 n=1981
2009 n=1997
Awareness of the FSA - overall
Awareness of the FSA as a financial regulator amongst people living in Great Britain aged 16 and over
6
The level of awareness broken down further:
• in addition to the 21% who could remember the organisation without prompting, a further 11%
could remember the organisation when prompted (14% in 2008);
• 7% are aware of a financial regulator (including some of the legacy organisations) but not the
FSA (7% in 2008);
• 16% are not aware of any specific regulator but assume that there is an organisation looking
after financial regulation (14% in 2007); and
• 44% are unaware that there is any type of financial regulation (47% in 2008). Unawareness of
the FSA is at its lowest level since the 2006 survey.
It might be thought that those who are only able to mention the FSA after prompting might be giving
a ‘false-positive answer’. However, when asked to give their spontaneous views on what the main
activities that the FSA carries out are, there is little difference with those who are able to mention
the FSA unprompted. This suggests that this group are indeed aware of the FSA.
4.2 Which groups are most and least aware that financial regulation
exists?
Awareness of regulation may increase consumers’ confidence in choosing and using financial services.
Those unaware of regulation may have less confidence in financial services in general and be less
confident in using financial products to meet their needs. Consumers may also be less aware of the
protection available to them or may be unlikely to seek redress or make complaints through the
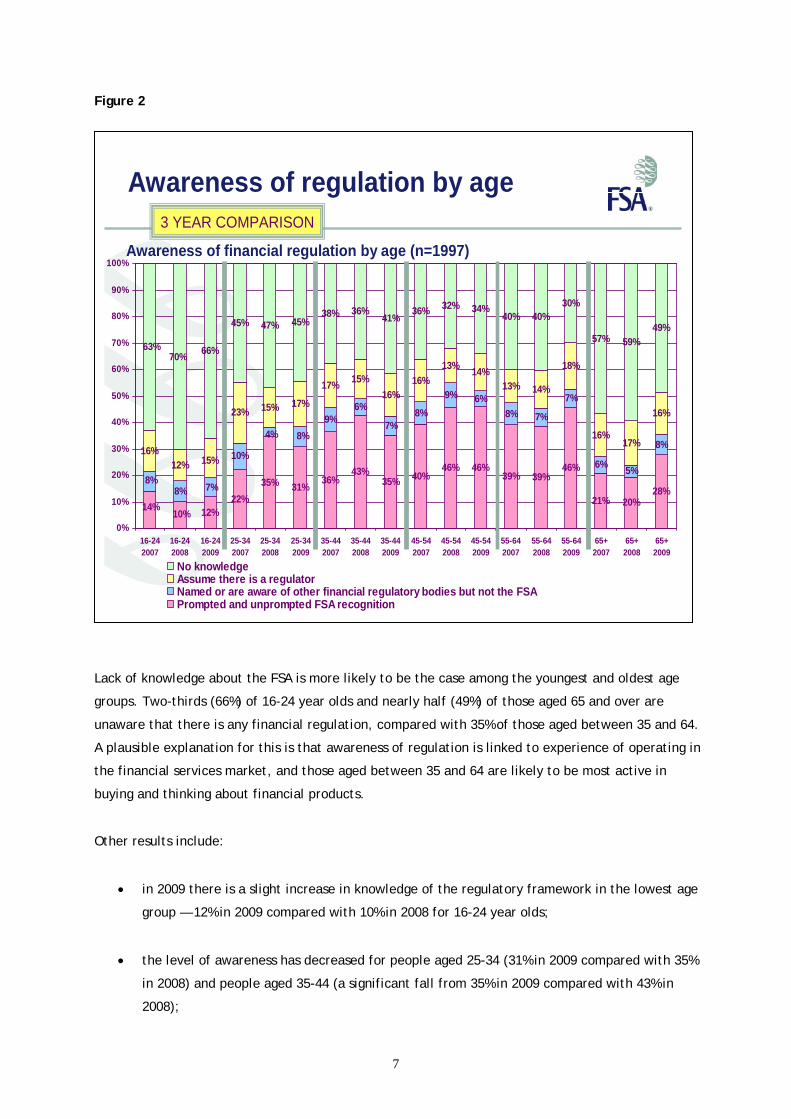
appropriate channels. Figure 2 shows a three-year comparison of awareness of the FSA split by age
group.
7
Figure 2
Lack of knowledge about the FSA is more likely to be the case among the youngest and oldest age
groups. Two-thirds (66%) of 16-24 year olds and nearly half (49%) of those aged 65 and over are
unaware that there is any financial regulation, compared with 35% of those aged between 35 and 64.
A plausible explanation for this is that awareness of regulation is linked to experience of operating in
the financial services market, and those aged between 35 and 64 are likely to be most active in
buying and thinking about financial products.
Other results include:
• in 2009 there is a slight increase in knowledge of the regulatory framework in the lowest age
group — 12% in 2009 compared with 10% in 2008 for 16-24 year olds;
• the level of awareness has decreased for people aged 25-34 (31% in 2009 compared with 35%
in 2008) and people aged 35-44 (a significant fall from 35% in 2009 compared with 43% in
2008);
12%22%
35% 31%36%
43%35% 40%
46% 46%39% 39%
46%
21% 20%28%8%
9%6%
7%8%
9% 6%8% 7%
7%
6% 5%
8%16%12%
23% 15% 17%
17% 15%16%
16%13% 14%
13% 14%
18%
16%17%
16%
66%
45% 47% 45%38% 36%
41%36% 32% 34%
40% 40%30%
57% 59%49%
10%14%
10%
4% 8%
8%7%
15%
63%70%
0%
10%
20%
30%
40%
50%
60%
70%
80%
90%
100%
16-242007
16-242008
16-242009
25-342007
25-342008
25-342009
35-442007
35-442008
35-442009
45-542007
45-542008
45-542009
55-642007
55-642008
55-642009
65+2007
65+2008
65+2009
No knowledgeAssume there is a regulatorNamed or are aware of other financial regulatory bodies but not the FSAPrompted and unprompted FSA recognition
Awareness of financial regulation by age (n=1997)
Awareness of regulation by age3 YEAR COMPARISON

8
• Prompted and unprompted awareness of the FSA has stayed the same in the 45-54 age range
(46%);
• the biggest increase in awareness can be seen in those aged over 55 — awareness amongst 55-
64 year olds has increased from 39% to 46% between 2008 and 2009; and
• there has been a significant increase in awareness amongst those aged over 65 — 20% in 2008
compared with 28% in 2009. This is consistent with the view that people approaching, and of
retirement age would have had more concern about their financial situation and greater
exposure to the FSA during the ongoing credit crunch. However, awareness of the FSA is still
at only 28% among over 65s, below the average for all age groups (32%).
Table 1 shows the level of awareness of the FSA broken down by the types of product(s) that
consumers hold. Knowledge of financial regulation varies depending on whether people have
shopped for financial products and the types of products they own.
Table 1: Awareness of regulation by type of product held
FSA prompted
and unprompted
Name or aware of
other financial
regulators
Assume there is a regulator
No knowledge Base
Unit trusts, equity ISAs or PEPs % 62 (55) 7 (6) 9 (17) 22 (22) 240 (268)
Personal pension/FSAVC % 65 (56) 8 (7) 10 (13) 17 (24) 336 (407)
Direct share ownership % 66 (62) 6 (6) 11 (13) 18 (19) 189 (234)
Bonds or gilts % 63 (48) 9 (9) 7 (21) 21 (23) 81 (71)
Mortgage (endowment) % 59 (60) 9 (9) 12 (11) 20 (20) 93 (137)
Mortgage (repayment) % 56 (57) 7 (6) 14(17) 24 (20) 370 (391)
Mortgage (interest only) % 52 (64) 4 (5) 19 (11) 26 (21) 106 (111)
Second home/buy-to-let property** % 58 10 10 23 83
Own a low-risk financial product (e.g. current or savings accounts) but none of the other categories
% 24 (22) 7 (6) 18 (16) 51 (57) 1202 (1083)
Own no financial product % 10 (14) 7 (6) 13 (9) 71 (71) 200 (207)
* Respondents can be in more than one of these categories. 2008 figures shown in brackets.
** ‘Second property / buy-to-let property’ is a new category for 2009.

9
The most informed type of product holder has changed from the previous year. In 2009 the most
informed were those with direct share ownership (66%), closely followed by consumers with a
personal pension or FSAVC (65%). All types of mortgage holders show a decrease in their level of
awareness. The level of awareness amongst people with a second home or buy-to-let property, a new
category added in 2009, was 58%. There was an increased level of awareness for the owners of unit
trusts, equity ISA or PEPs — 62% compared with 48% in 2008, and among consumers who own bonds or
gilts — 63% compared with 48% in 2008.
The level of awareness amongst people with higher-risk products (as opposed to savings or current
accounts, or no product at all) is high as it reflects the people who are most exposed to Conduct-of-
Business rules and point-of-sale literature that mentions the FSA. It may also indicate a greater
financial sophistication, engagement and interest in the subject matter.
The figures for those who own no financial product have remained stable since 2008 - 71% have no
knowledge of the FSA and there has been a slight fall in those who are aware from 14% to 10%. Among
people with a low-risk financial product (e.g. a current or savings account) and no other financial
product, over half (51%) have no knowledge of the FSA. This is a fall from 57% the previous year.
10
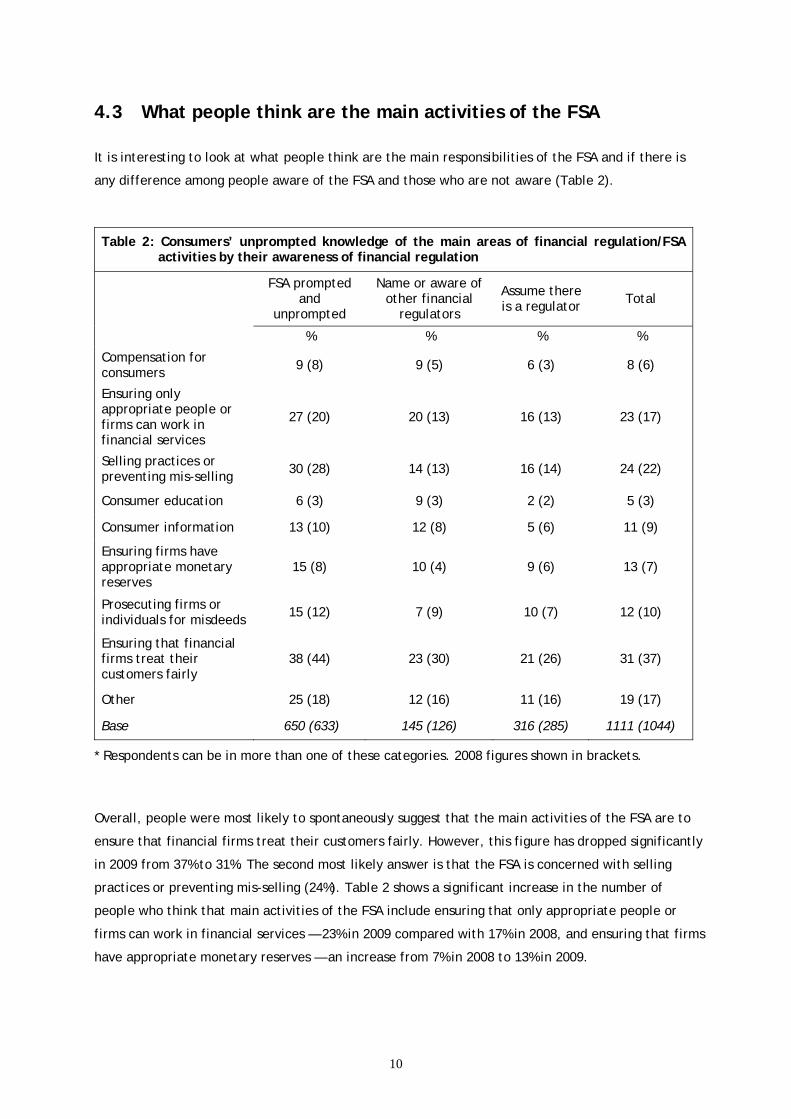
4.3 What people think are the main activities of the FSA
It is interesting to look at what people think are the main responsibilities of the FSA and if there is
any difference among people aware of the FSA and those who are not aware (Table 2).
Table 2: Consumers’ unprompted knowledge of the main areas of financial regulation/FSA activities by their awareness of financial regulation
FSA prompted
and unprompted
Name or aware of other financial
regulators
Assume there is a regulator Total
% % % %
Compensation for consumers 9 (8) 9 (5) 6 (3) 8 (6)
Ensuring only appropriate people or firms can work in financial services
27 (20) 20 (13) 16 (13) 23 (17)
Selling practices or preventing mis-selling 30 (28) 14 (13) 16 (14) 24 (22)
Consumer education 6 (3) 9 (3) 2 (2) 5 (3)
Consumer information 13 (10) 12 (8) 5 (6) 11 (9)
Ensuring firms have appropriate monetary reserves
15 (8) 10 (4) 9 (6) 13 (7)
Prosecuting firms or individuals for misdeeds 15 (12) 7 (9) 10 (7) 12 (10)
Ensuring that financial firms treat their customers fairly
38 (44) 23 (30) 21 (26) 31 (37)
Other 25 (18) 12 (16) 11 (16) 19 (17)
Base 650 (633) 145 (126) 316 (285) 1111 (1044)
* Respondents can be in more than one of these categories. 2008 figures shown in brackets.
Overall, people were most likely to spontaneously suggest that the main activities of the FSA are to
ensure that financial firms treat their customers fairly. However, this figure has dropped significantly
in 2009 from 37% to 31%. The second most likely answer is that the FSA is concerned with selling
practices or preventing mis-selling (24%). Table 2 shows a significant increase in the number of
people who think that main activities of the FSA include ensuring that only appropriate people or
firms can work in financial services — 23% in 2009 compared with 17% in 2008, and ensuring that firms
have appropriate monetary reserves — an increase from 7% in 2008 to 13% in 2009.

11
Further breakdown of the results show:
• consumers aware of the FSA are most likely to think spontaneously that its main activities
were about ensuring that financial firms treat their customers fairly (38%), this shows a
significant decrease from 44% in 2008;
• 30% of adults aware of the FSA spontaneously named the FSA as concerned with selling
practices and preventing mis-selling; and
Other unprompted responses of FSA activities include prosecuting firms or individuals for misdeeds
(overall 12%), providing consumer information (11%), compensation for consumers (8%) and consumer
education (5%). Other FSA duties mentioned by consumers include preventing fraud, checking interest
rates and dealing with complaints.
4.4 Awareness of various aspects of the regulatory regime
Spontaneous exploration of what consumers think a regulator might do is a useful gauge of what is
uppermost in people’s minds; however, we also probed people who said they were aware of the FSA
in more detail about various aspects of regulation. Four main areas were asked about (respondents
were read out the explanation outlined in brackets below):
• authorisation (the FSA checks firms and individuals to make sure they meet certain standards to
work in financial services, including whether individuals are qualified and companies have
enough money to operate);
• prudential protection (the FSA makes sure that banks, building societies, insurance companies
and other financial institutions hold enough funds to pay out to their customers in normal
circumstances);
• enforcement (the FSA fines and sanctions firms for breaking its rules); and
• Conduct-of-Business (CoB) suitability rules (when people buy investment products, the FSA
requires that salespeople and financial advisers ensure that the product is suitable for the
consumer).

12
Table 3: Consumers’ level of knowledge about the FSA's activities amongst those consumers who had heard of the FSA (prompted and unprompted)
Authorisation Prudential Enforcement CoB suitability
% % % %
I definitely knew the FSA did this 48 (51) 30 (29) 43 (47) 42 (46)
I thought they must do this 31 (29) 38 (43) 33 (34) 31 (34)
I thought some organisation must be doing something like this but did not know who
12 (9) 15 (11) 12 (7) 14 (9)
I didn't know this was done by anyone/I hadn't thought about it before
9 (11) 12 (17) 9 (13) 10 (10)
Base 650 (633) 650 (633) 650 (633) 650 (633)
* 2008 figures shown in brackets.
Consumers who know of the FSA are most likely to be aware of the FSA for its role in Authorisation —
48% — down from 51% in 2008. 43% of consumers definitely knew about the FSA’s enforcement
function (down from 47% in 2008) and 42% of people definitely knew that the FSA ensures CoB
suitability. Under a third of consumers (30%) aware of the FSA definitely know that the FSA ensures
financial firms hold enough money. Only around one in ten people did not know anyone carried out
these activities.
4.5 Awareness of the FSA role in providing information to consumers
Consumers may see the name of the FSA in documents when financial services and products are
purchased. Increasingly, as part of the FSA financial Capability programme and other FSA initiatives,
the FSA is attempting to reach a wider audience through providing publications aimed at the general
population and for specific groups of people. For example, ‘Moneymadeclear’, comparison tables and
The Parent’s Guide to Money.

13
When investigating awareness of the FSA, it was decided that the 2009 survey would include
questions on whether respondents are aware of specific types of FSA literature and sources of FSA
information.
Table 4 looks at consumers who are aware of the FSA by their knowledge of whether the FSA provides
financial services information for the public. It is expected that those adults more engaged with the
financial industry and who own financial products are more likely to know of FSA published materials.
Table 4: Consumers’ knowledge of FSA providing information by types of products owned — those aware of the FSA
I definitely knew the FSA did
this
I thought they
must do this
I thought some
organisation must do this
I didn’t know this was done by anyone
Base
Adults aware of the FSA % 36 (32) 24 (34) 18 (13) 22 (21) 650 (633)
Unit trusts, equity ISAs or PEPs % 42 (38) 23 (30) 20 (15) 15 (17) 149 (146)
Personal pension or FSAVC % 43 (34) 23 (35) 14 (13) 19 (18) 219 (229)
Direct share ownership % 36 (30) 28 (35) 18 (12) 18 (23) 125 (145)
Bonds or gilts % 49 (37) 16 (20) 26 (26) 10 (17) 51 (35)
Own a low-risk financial product (e.g. current or savings accounts) but none of the other categories
% 31 (30) 26 (37) 20 (15) 23 (19) 283 (232)
Own no financial product % 6 (36) 17 (32) 22 (11) 56 (21) 18 (28)**
* Respondents can be in more than one of these categories. 2008 figures shown in brackets.
** Treat with caution due to low base
Over a third (36%) of adults who are aware of the FSA definitely know that the FSA provides consumer
information. 22% do not know that anyone provides this type of information.
When looking by product, those who own financial products are more likely to be aware that the FSA
provides information than those with only a low-risk account or with no product at all. The level of
people who knew that the FSA provides information increased for all groups of the different types of
product holdings.
Table 5 looks at awareness of specific FSA publications. This excludes being aware of the FSA through
more commonly used sources such as documents provided when financial products are purchased
(such as key facts documents) or the national press.

14
Table 5: Awareness of FSA publications
%
Moneymadeclear 5
What About Money? 2
The Parent’s Guide to Money 3
Another FSA publication 1
None 92
Base 1997
* Respondents can be in more than one of these categories. No figures available for 2008.
5% of consumers have either heard of, or seen the ‘Moneymadeclear’ initiative, 3% are aware of The
Parent’s Guide to Money and 2% ‘What About Money?’
4.6 FSA independence
FSA independence from government and how it is funded can shape people’s perception of the FSA.
Table 6 shows whether consumers know that the FSA is independent from government.
Table 6 Awareness that the FSA is independent from government by awareness of the FSA
FSA prompted
and unprompted
Name or aware of other financial
regulators
Assume there is a regulator
No knowledge Total
% % % % %
I definitely knew this 53 21 21 12 27
I thought that the FSA is independent from the government
15 12 11 8 11
I didn’t know the FSA is independent from the government
33 67 68 81 62
Base 650 145 316 887 1998
* No figures available for 2008.

15
Just over a quarter of consumers (27%) definitely know that the FSA is independent from the
government. Of those aware of the FSA, this figure increased to 53%. Sixty-two per cent of adults
were unaware of the FSA’s is independence from the government.
Table 7 shows whether people are aware of how the FSA is funded.
Table 7: Awareness of how the FSA is funded by awareness of the FSA
FSA prompted
and unprompted
Name or aware of other financial
regulators
Assume there is a regulator
No knowledge Total
% % % % %
I definitely knew this 28 10 8 6 14
I thought the FSA receives funding from the firms it regulates
9 10 9 5 7
I didn’t know how the FSA is funded
64 80 83 89 79
Base 650 145 316 887 1998
* No figures available for 2008.
Only 14% of consumers know that the FSA is funded by the firms that it regulates, and 79% of adults
are unaware how the FSA is funded. Of adults aware of the FSA, 28% know how it is funded compared
with 6% of adults who have no knowledge of the FSA.

16
5. Confidence in financial regulation
There are many aspects of consumer confidence in the financial services industry, for example views
on the economy, confidence in the products and services provided by firms, and specific examples of
regulatory failure. Consumers’ views are likely to be driven not only by what is happening in the
industry as a whole (which they are often made aware of through the media) but also through their
own, and friends’ and relatives’, experiences. Many of these factors will be inter-related, but for this
particular piece of research we concentrated on consumers’ overall confidence in the regulatory
regime.
To measure whether consumers are confident in the amount of regulation afforded them by the FSA
the survey asked all respondents how confident they were that firms followed FSA standards for
authorisation, CoB suitability and prudential rules. Results are broken down into those who are aware
of the FSA and of the activity, and those who are not aware of the activity (Figure 3, table 8 and
table 9).
It is hardly surprising that consumer confidence has diminished amongst those aware of the FSA and
its function, as shown in this chapter.
5.1 How confident are consumers that firms meet FSA standards?
The first topic covered in this section is whether consumers who are aware of the FSA think that
financial firms follow FSA rules. Figure 3 shows a sharp drop in confidence from 2008.

17
Figure 3
• Only 3% of consumers, who are aware of the FSA, were very confident that firms follow FSA
rules;
• the group of people who were fairly confident that firms follow FSA rules has seen the most
significant fall - from 61% to 37%;
• the number of people who were neither confident nor unconfident has risen from 20%; and
• over a third of consumers are unconfident that firms follow rules. 13% are very unconfident.
There are significant shifts in confidence shown by consumers who were aware of certain FSA
responsibilities that firms meet the FSA standards. Table 8 shows significant decreases in consumer
confidence that all or most firms meet the required FSA standards for authorisation, prudential and
CoB suitability.
8% 9% 5% 6% 3%
62% 52%63% 62% 61%
37%
21% 26%18% 22% 20%
25%
10% 8% 9% 9%
21%
3% 3% 3% 2% 2% 4% 13%
6%4%
57%
23%
10% 12%
0%
20%
40%
60%
80%
100%
2003 2004 2005 2006 2007 2008 2009Very confident Fairly confidentNeither confident nor unconfident Fairly unconfidentVery unconfident
Amongst consumers aware
of the FSA:
2003 n=599
2004 n=524
2005 n=577
2006 n=626
2007 n=551
2008 n=626
2009 n=650
Do consumers think that firms follow FSA rules?
Confidence that UK financial firms follow FSA rules

18
Table 8: : Level of confidence that consumers have of firms meeting the required standards — amongst consumers who are aware of the FSA and know about the activity
Authorisation Prudential CoB suitability
% % %
All firms reach these standards 4 (5) 3 (12) 4 (6)
Most firms reach these standards 35 (58) 30 (61) 37 (51)
Some firms reach these standards 28 (27) 30 (19) 34 (31)
Few/no firms reach these standards 33 (10) 37 (9) 25 (12)
Base 496 (485) 434 (442) 465 (495)
* 2008 figures shown in brackets.
Authorisation
Among respondents aware of authorisation the percentage of people who believe that all firms reach
these standards has remained fairly consistent. The number of people who believe that some firms
reach the required authorisation standards has also remained consistent from 2008 with a shift of just
one point. The significant shifts have taken place in the number of people who think that most firms
reach FSA authorisation standards and those who think few or no firms reach the standards.
Consumers who believe that most firms reach the standards has decreased from 58% to 35% while the
number who believe few or no firms reach the standard has increased from 10% to 33%.
Prudential
In the prudential category there has been a similar fall in consumer confidence. A significant change
is shown in all categories. The percentage of consumers who believe all firms meet prudential
standards has fallen to 3% in 2009 from 12% in 2008. The number of consumers who think that most
firms reach the standards has dropped 31 percentage points (30% in 2009 — down from 61% in 2008).
30% of consumers believe that some firms reach FSA standards for prudential and the percentage of
people who believe that few or no firms reach the standard has increased from 9% to 37%.

19
CoB suitability
Only 4% of consumers aware of CoB suitability think that all firms reach the FSA’s required standard.
Table 8 shows a significant drop from 51% in 2008 to 37% in 2009 in people who think that some firms
reach FSA standards. Like the other activities, these drops are reflected in a rise in consumers who
believe most firms reach required standards and, significantly, those who think that few or no firms
reach these standards — 25% — up from 12%.
Table 9 looks at the level of confidence that consumers who are unaware of a particular activity have
that the activity is carried out.
Table 9: Level of confidence that consumers who are unaware of the activity have of firms meeting the required standards
Authorisation Prudential CoB suitability
% % %
All firms reach these standards 5 (8) 4 (8) 3 (6)
Most firms reach these standards 24 (44) 16 (46) 18 (37)
Some firms reach these standards 30 (37) 30 (34) 34 (40)
Few/no firms reach these standards 42 (25) 50 (24) 46 (29)
Base 844 (799) 868 (832) 863 (965)
* 2008 figures shown in brackets.
The results show a similar trend to those who are aware of the activity with a fall in consumer
confidence for each of the FSA activities.

20
Authorisation
In terms of authorisation only 29% of consumers believe that all or most firms reach the required
standard compared with 52% the previous year. The number of people who believe that some firms
reach the standard has fallen seven points from 37% in 2008; and the number of people who believe
that few or no firms reach the standards has risen from a quarter to 42%.
Prudential
Just one-fifth (20%) of consumers unaware of prudential requirements believe that all or most firms
reach the required standard - down from 54% in 2008. The proportion of people who believe that few
or no firms reach the required standard has more than doubled from 24% to exactly half of people
unaware of the activity.
CoB suitability
Once again, the CoB suitability category shows the same pattern as the other activities. There is a
fall in those that believe all or most firms reach the standard (21% in 2009 — down from 43% in 2008).
There is a significant increase in the number who believe that few or no firms reach the required
standard — 46% in 2009 compared with 29% in 2008.
These shifts in consumer confidence show that although a large proportion of the population are not
engaged with the industry to be aware of particular roles of the FSA, these people do have a changing
opinion on how effectively the industry is regulated. This could potentially affect how consumers
engage with the industry.
5.2 Confidence in the effectiveness of FSA regulation
This section looks at how confident those who are aware of the FSA are that the FSA is effectively
regulating firms and, of those unaware of the FSA, how confident they are that firms follow FSA rules.
Among those aware of the FSA, figure 4 shows a fall in confidence that the FSA is effectively
regulating firms.
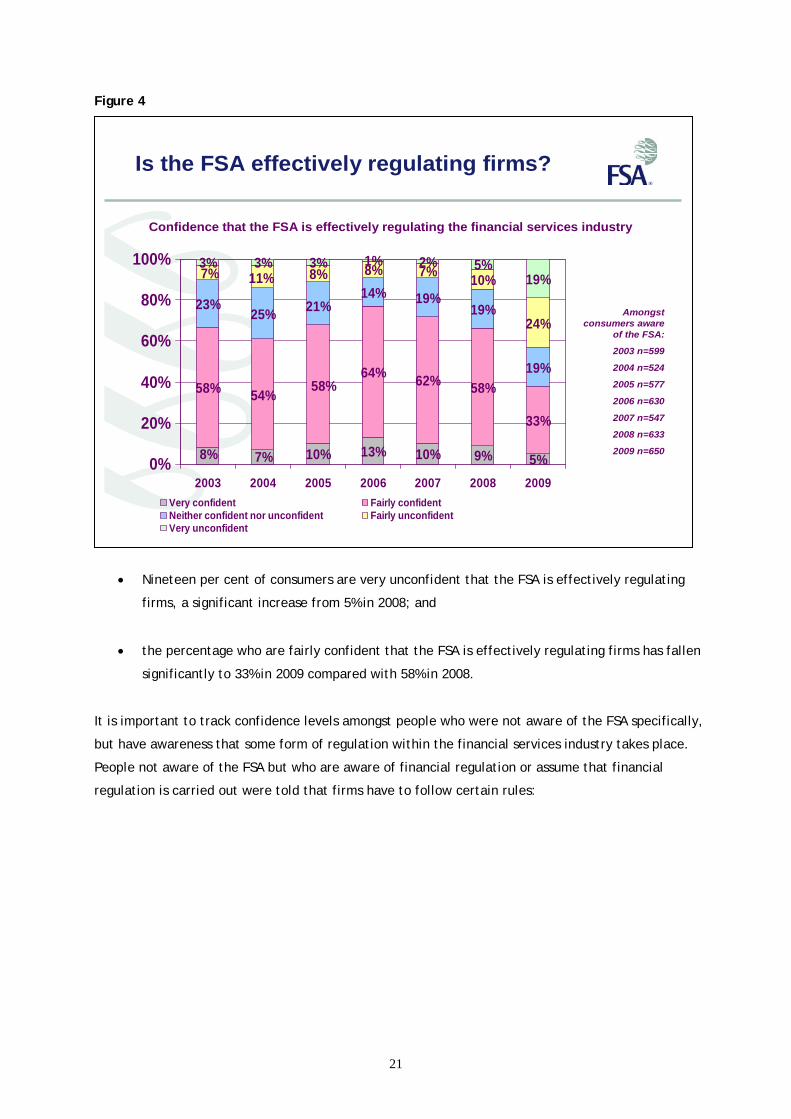
21
Figure 4
• Nineteen per cent of consumers are very unconfident that the FSA is effectively regulating
firms, a significant increase from 5% in 2008; and
• the percentage who are fairly confident that the FSA is effectively regulating firms has fallen
significantly to 33% in 2009 compared with 58% in 2008.
It is important to track confidence levels amongst people who were not aware of the FSA specifically,
but have awareness that some form of regulation within the financial services industry takes place.
People not aware of the FSA but who are aware of financial regulation or assume that financial
regulation is carried out were told that firms have to follow certain rules:
10% 13% 10% 9% 5%
58% 54%64% 62% 58%
33%
23%25%
14% 19%19%
19%
8% 8% 7% 10%
24%
3% 3% 3% 1% 2% 5%19%
7%8%
58%
21%
7% 11%
0%
20%
40%
60%
80%
100%
2003 2004 2005 2006 2007 2008 2009Very confident Fairly confidentNeither confident nor unconfident Fairly unconfidentVery unconfident
Amongst consumers aware
of the FSA:
2003 n=599
2004 n=524
2005 n=577
2006 n=630
2007 n=547
2008 n=633
2009 n=650
Is the FSA effectively regulating firms?
Confidence that the FSA is effectively regulating the financial services industry
22
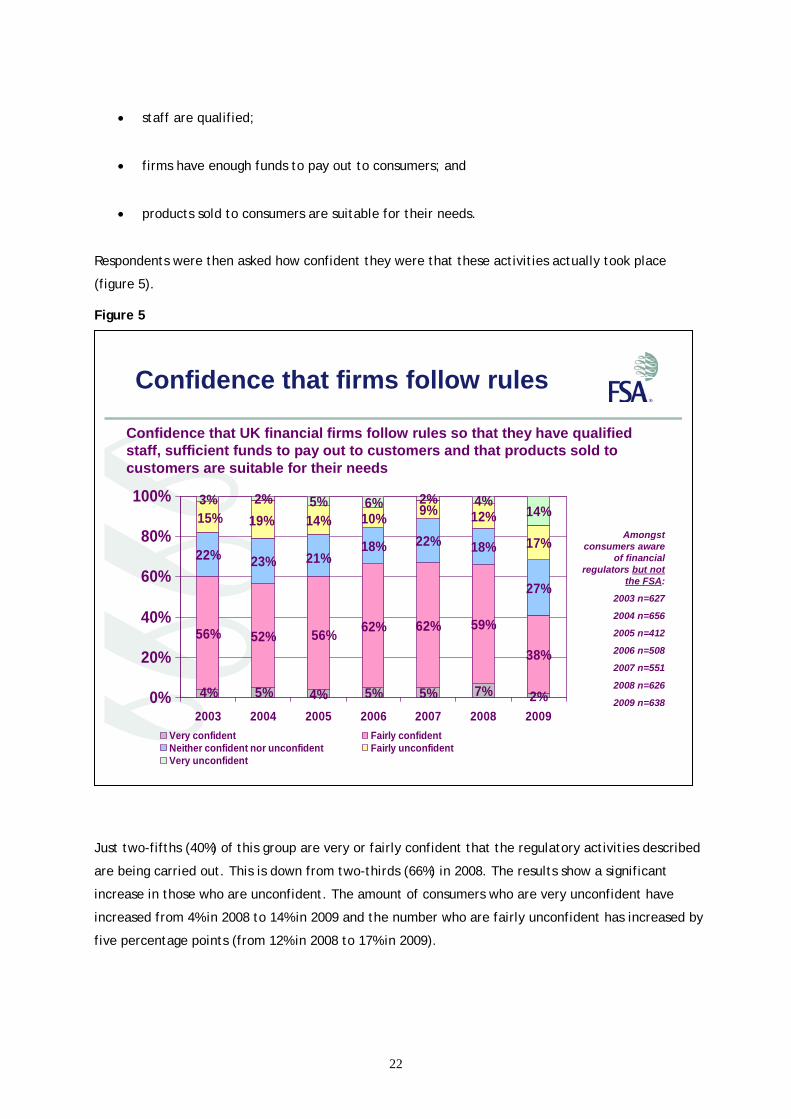
• staff are qualified;
• firms have enough funds to pay out to consumers; and
• products sold to consumers are suitable for their needs.
Respondents were then asked how confident they were that these activities actually took place
(figure 5).
Figure 5
Just two-fifths (40%) of this group are very or fairly confident that the regulatory activities described
are being carried out. This is down from two-thirds (66%) in 2008. The results show a significant
increase in those who are unconfident. The amount of consumers who are very unconfident have
increased from 4% in 2008 to 14% in 2009 and the number who are fairly unconfident has increased by
five percentage points (from 12% in 2008 to 17% in 2009).
4% 5% 5% 7% 2%
56% 52%62% 62% 59%
38%
22% 23%18% 22% 18%
27%
14% 10% 9% 12%
17%
3% 2% 5% 6% 2% 4%14%
5%4%
56%
21%
15% 19%
0%
20%
40%
60%
80%
100%
2003 2004 2005 2006 2007 2008 2009Very confident Fairly confidentNeither confident nor unconfident Fairly unconfidentVery unconfident
Amongst consumers aware
of financial regulators but not
the FSA:
2003 n=627
2004 n=656
2005 n=412
2006 n=508
2007 n=551
2008 n=626
2009 n=638
Confidence that firms follow rules
Confidence that UK financial firms follow rules so that they have qualified staff, sufficient funds to pay out to customers and that products sold to customers are suitable for their needs

23
6. Non-zero failure
Although the idea that regulation should seek to eliminate all failures may look superficially
appealing, the FSA can never eliminate risk entirely and in practice this would impose prohibitive
costs on the industry and on consumers. Consumers benefit from healthy, competitive markets where
different firms try to meet their needs, compete actively and innovate — even if that means that not
all succeed. This is called "non-zero failure".
2008 saw the collapse of firms in the financial sector; the government stepped in to rescue, by
providing financial assistance to, a number of firms and there have been mergers among firms. This
behaviour may have had an influence on how consumers view a regime of non-zero failure or whether
one exists at all. The failure of regulated firms has the potential to affect public confidence in
financial markets and services. The FSA has an interest in measuring the public’s awareness of a non-
zero failure regime, which picks up elements of confidence in firms as well as an awareness of the
potential risk of firm failure and the subsequent possibility of detriment to the consumer.
6.1 Do people believe firms are allowed to go bankrupt?
To test public awareness of a non-zero-failure regime we asked respondents whether firms that are
regulated are ever allowed to go bankrupt or go out of business (Figure 6).
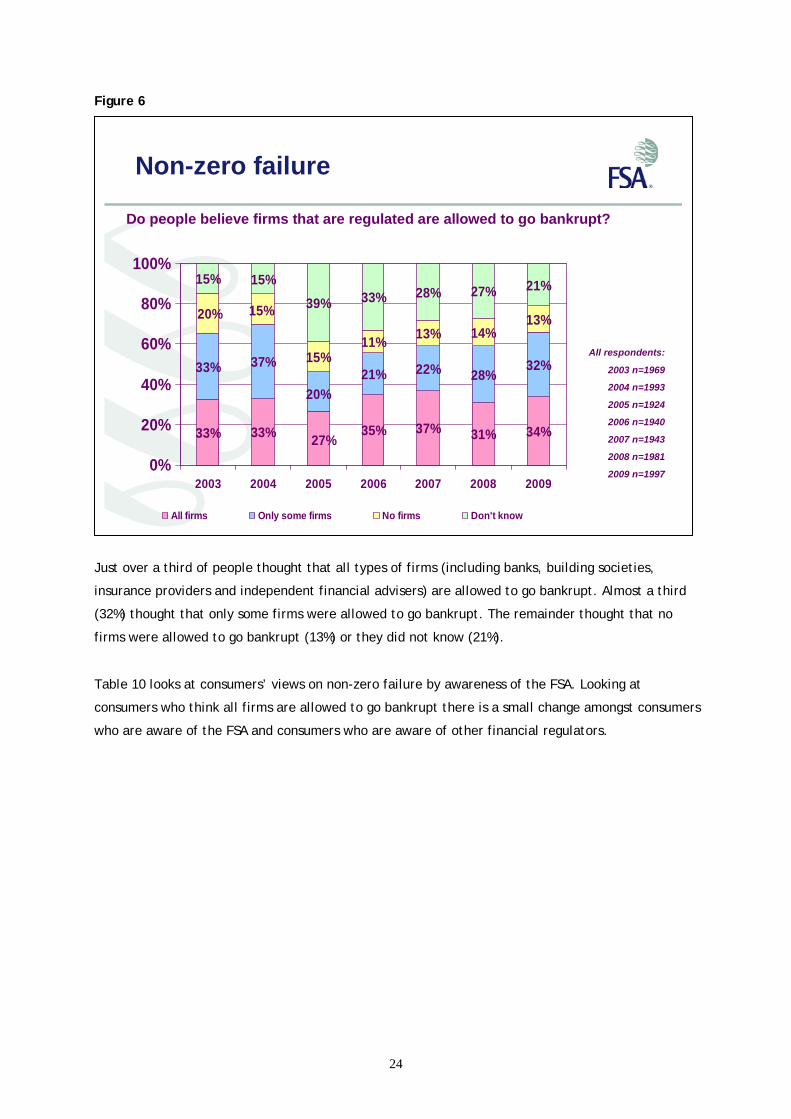
24
Figure 6
Just over a third of people thought that all types of firms (including banks, building societies,
insurance providers and independent financial advisers) are allowed to go bankrupt. Almost a third
(32%) thought that only some firms were allowed to go bankrupt. The remainder thought that no
firms were allowed to go bankrupt (13%) or they did not know (21%).
Table 10 looks at consumers’ views on non-zero failure by awareness of the FSA. Looking at
consumers who think all firms are allowed to go bankrupt there is a small change amongst consumers
who are aware of the FSA and consumers who are aware of other financial regulators.
33% 33% 35% 37% 31% 34%
33% 37%21% 22% 28%
32%15%11% 13% 14%
13%
15% 15%39% 33% 28% 27% 21%
27%
20%
20% 15%
0%
20%
40%
60%
80%
100%
2003 2004 2005 2006 2007 2008 2009
All firms Only some firms No firms Don't know
All respondents:
2003 n=1969
2004 n=1993
2005 n=1924
2006 n=1940
2007 n=1943
2008 n=1981
2009 n=1997
Non-zero failure
Do people believe firms that are regulated are allowed to go bankrupt?

25
* 2008 figures shown in brackets.
The results show:
• There has been a significant increase amongst consumers who assume there is a regulator
who think that all firms are allowed to go bankrupt — from 31% in 2008 to 41% in 2009;
• there are significant increases in the number of adults who think some firms can go
bankrupt in the group of adults who are aware of the FSA (40% from 32% in 2008) and those
adults who are aware of other financial regulators (46% from 33% in 2008);
Table 11 looks at people's opinions of whether all firms are allowed to go bankrupt by the types of
products people own.
Table 10: Consumers’ views on whether or not they believe that regulated firms are ever allowed to go bankrupt by awareness of financial regulation
FSA prompted
and unprompted
Name or aware of other financial
regulators
Assume there is a regulator
No knowledge Total
% % % % %
All firms allowed to go bankrupt 42 (46) 29 (30) 41 (31) 25 (21) 34 (31)
Only some firms allowed to go bankrupt
40 (32) 46 (33) 31 (36) 25 (22) 32 (28)
No firms allowed to go bankrupt 10 (10) 11 (13) 13 (14) 16 (17) 13 (14)
Don’t know 8 (13) 15 (24) 15 (19) 34 (40) 21 (27)
Base 650 (633) 144 (126) 315 (286) 887 (937) 1996 (1981)

26
Table 11: Consumers’ views on whether they believe that regulated firms are ever allowed to go bankrupt by types of products owned
All firms Only some
firms No
firms Don’t know Base
Unit trusts, equity ISAs or PEPs % 37 (47) 40 (28) 12 (12) 10 (14) 241 (267)
Personal pension or FSAVC % 40 (41) 39 (32) 11 (11) 10 (16) 336 (407)
Direct share ownership % 40 (48) 39 (27) 15 (11) 7 (14) 190 (234)
Bonds or gilts % 42 (32) 40 (31) 9 (13) 9 (24) 81 (71)
Own a low-risk financial product (e.g. current or savings accounts) but none of the other categories
% 33 (28) 31 (28) 13 (13) 23 (31) 1201 (1083)
Own no financial product % 22 (17) 23 (20) 17 (19) 40 (44) 200 (208)
* Respondents can be in more than one of these categories. 2008 figures shown in brackets.
Among the different products owned, with the exception of low risk financial products and those who
own no financial product, the figures are fairly consistent across the different product ownership
categories. There are significant falls in the percentage of people who believe all firms can go
bankrupt. Namely the owners of unit trusts, equity ISAs or PEPs (37% from 47% in 2008) and those who
have direct share ownership (48% from 40% in 2008). Perhaps surprisingly, there is not a similar shift
for those with a personal pension or FSAVC. This could be because they are not necessarily active in
the market having taken out the product many years ago.
There have been slight increases in the percentages of people with a low risk financial product and
those with no financial product who believe that all firms are allowed to go bankrupt. Only 33% of
consumers with a low risk financial product and 22% of people who own no financial product think all
firms can go bankrupt.
Consumers who answered that only some or that no firms are allowed to bankrupt were asked why
they believed this to be the case (table 12).

27
Table 12: Why do consumers who answered only some or no firms can go bankrupt think
firms are not allowed to go bankrupt?
FSA prompted
and unprompted
Name or aware of other financial
regulators
Assume there is a regulator
No knowledge Total
% % % % % Government/ regulator will always bail them out
30 (23) 39 (18) 31 (24) 26 (20) 29 (22)
Too many consumers would be affected
22 (20) 15 (5) 19 (21) 17 (11) 19 (15)
People would lose confidence in the financial system
25 (21) 20 (7) 11 (16) 8 (7) 16 (13)
Some firms are too important to be allowed to go bankrupt
21 (18) 18 (28) 19 (8) 8 (8) 15 (12)
Government would never allow consumers to lose money
8 (13) 6 (12) 6 (11) 8 (6) 8 (9)
Base 322 (262) 82 (58) 140 (142) 365 (366) 908 (828)
* Respondents can be in more than one of these categories. 2008 figures shown in brackets.
Most consumers who do not believe that all or some firms are allowed to go bankrupt gave the
reason that the government or regulator would always bail them out . The second most common
answer is that too many customers would be affected.
Consumers aware of the FSA and those who are aware of other financial regulators are more likely
to name loss of confidence in the financial system, rather than that too many consumers would be
affected as reasons firms are not permitted to go bankrupt. Respondents were allowed to give more
than one answer to this question and those aware of the FSA gave more reasons than those who are
unaware of the FSA, perhaps giving an indication of their financial sophistication.
6.2 Can consumers lose money from a firm going bankrupt?
Before investigating whether consumers can lose money from firms going bankrupt, consumers who
thought that all or some firms are allowed to bankrupt were asked which types of firms these are.
Figure 7

28
21% of consumers think that all firms can go bankrupt. Of those that do not believe all firms can go
bankrupt, over half (58%) believe banks can go bankrupt. The amount of consumers that think
building societies can go bankrupt shows a similar decrease.
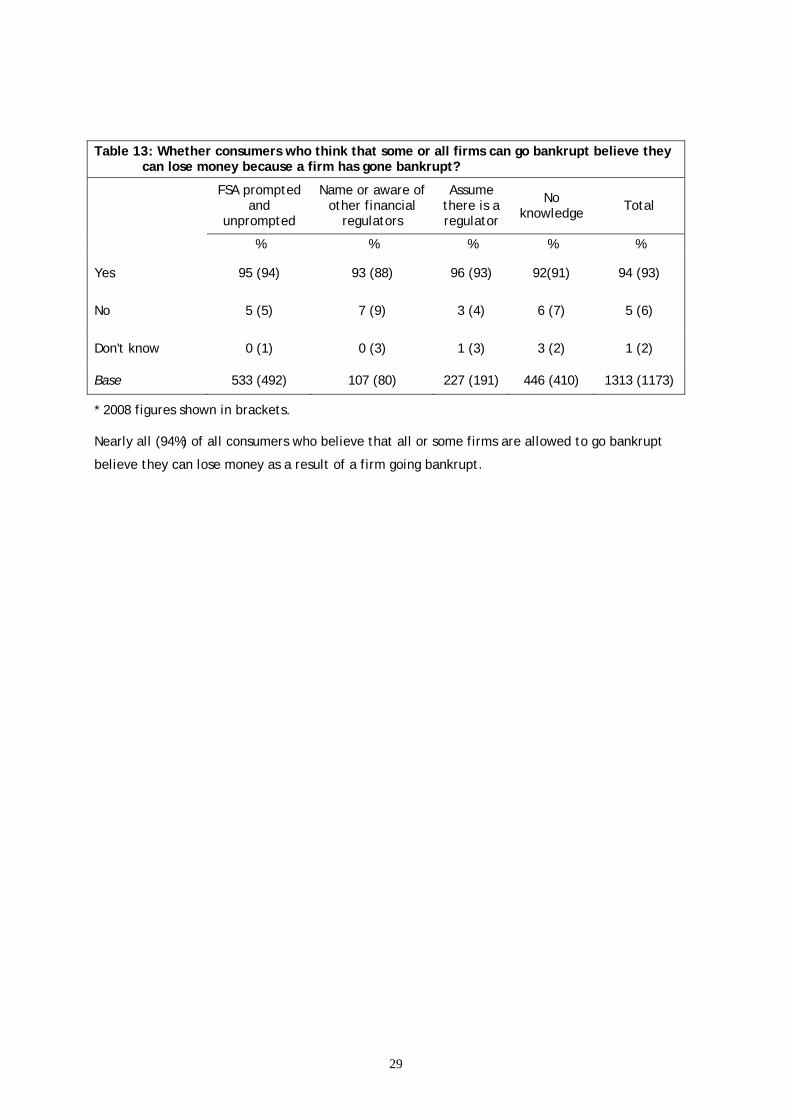
Table 13 shows whether adults who answered that all or some firms can go bankrupt think that they
can lose money as a result of the firm’s bankruptcy.
Types of firms not allowed to go bankrupt(respondents can answer more than one category)
21%
58%
37%
16%
7%12%
6%
21%
48%
27%
14%
7%11%
6%
0%
10%
20%
30%
40%
50%
60%
70%
All firms Banks Buildingsocieties
Insurancecompanies
IFAs Mortgagebrokers
GeneralInsuranceBrokers
2009 2008
Respondents who think some or all
firms can go bankrupt
2008 n=1425
2009 n=1352
29
Table 13: Whether consumers who think that some or all firms can go bankrupt believe they can lose money because a firm has gone bankrupt?
FSA prompted
and unprompted
Name or aware of other financial
regulators
Assume there is a regulator
No knowledge Total
% % % % %
Yes 95 (94) 93 (88) 96 (93) 92(91) 94 (93)
No 5 (5) 7 (9) 3 (4) 6 (7) 5 (6)
Don't know 0 (1) 0 (3) 1 (3) 3 (2) 1 (2)
Base 533 (492) 107 (80) 227 (191) 446 (410) 1313 (1173)
* 2008 figures shown in brackets.
Nearly all (94%) of all consumers who believe that all or some firms are allowed to go bankrupt
believe they can lose money as a result of a firm going bankrupt.
30
7. Product risk
Without a good understanding of the risk associated with products, consumers may purchase products
that are unsuitable for their financial needs and goals. This is particularly important when the market
for riskier products is more volatile. So the questionnaire was extended to seek out a more in-depth
knowledge of consumers’ attitude and knowledge of risk. Although attitude to risk is a matter of
personal opinion, it is useful to compare the range of views across different people.
7.1 Consumer attitude to risk
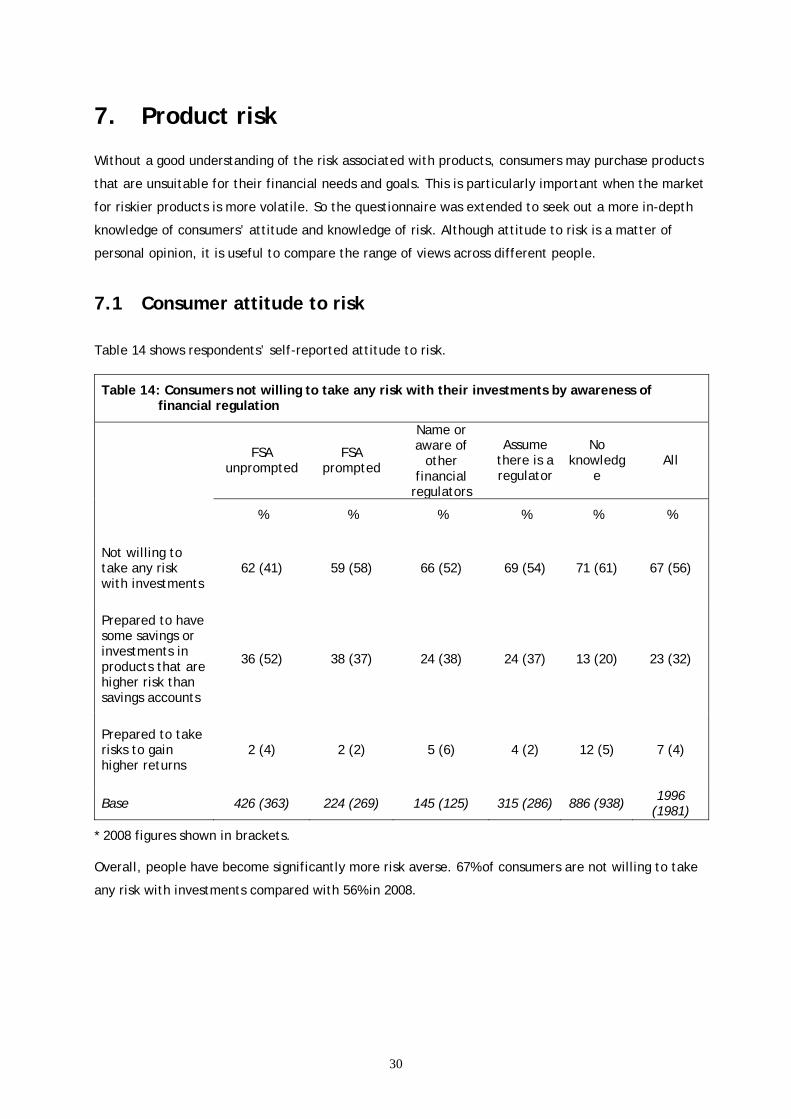
Table 14 shows respondents’ self-reported attitude to risk.
Table 14: Consumers not willing to take any risk with their investments by awareness of financial regulation
FSA unprompted
FSA prompted
Name or aware of
other financial
regulators
Assume there is a regulator
No knowledg
e All
% % % % % %
Not willing to take any risk with investments
62 (41) 59 (58) 66 (52) 69 (54) 71 (61) 67 (56)
Prepared to have some savings or investments in products that are higher risk than savings accounts
36 (52) 38 (37) 24 (38) 24 (37) 13 (20) 23 (32)
Prepared to take risks to gain higher returns
2 (4) 2 (2) 5 (6) 4 (2) 12 (5) 7 (4)
Base 426 (363) 224 (269) 145 (125) 315 (286) 886 (938) 1996 (1981)
* 2008 figures shown in brackets.
Overall, people have become significantly more risk averse. 67% of consumers are not willing to take
any risk with investments compared with 56% in 2008.

31
People with no knowledge of a regulator are the group most likely to be willing to take higher risk.
Those with no knowledge of a regulator are also the most likely not to take any risk (71%). People
aware of the FSA are most likely to be prepared to have some savings or investments in products that
are higher risk than savings.
7.2 Consumer product holdings and stated attitude to risk
Table 15 shows the risk profile of consumers by products owned. The setting in which consumers are
interviewed is disassociated from consumers thinking about products fulfilling certain needs. For
some products, such as personal pensions, there may be little choice for consumers to balance their
risk profile against their desire and need to have a pension for the future. Also, some of the people
who have direct shares will have obtained them through demutualisation or did not purchase the
product themselves (for example inheritances or company share schemes). For other areas, such as
unit trusts, equity ISAs or PEPs, there may be a range of explanations — consumers were not aware of
the riskiness of the product they were buying, they mis-bought the product, their risk profile has
changed, or the salespeople did not match the product to the customers’ risk profile.
* Respondents can be in more than one of these categories. 2008 figures shown in brackets.
Table 15: Risk profile of consumers by the products they own
Not willing to take any risks with savings or investment
Prepared to have some savings or investments in
products that are higher risk than savings accounts
Prepared to take risks to
gain higher returns
Don’t know Base
Unit trusts, equity ISAs or PEPs % 45 (32) 49 (63) 4 (6) 3 (0) 241 (267)
Personal pension or FSAVC % 57 (46) 39 (49) 2 (4) 2 (0) 336 (407)
Direct share ownership % 48 (36) 50 (58) 2 (6) 0 (0) 190 (234)
Bonds or gilts % 51 (45) 44 (54) 5 (1) 0 (0) 81 (71)
Own a low-risk financial product (e.g. current or savings accounts) but none of the other categories
% 73 (65) 18 (20) 4 (5) 6 (10) 1201 (1083)
Own no financial product % 60 (50) 11 (9) 3 (5) 26 (36) 200 (208)

32
All groups show that they have become more risk averse than the previous year:
• Nearly three-quarters (73%) of consumers who own a low-risk financial product (and no other)
are not willing to take any risk;
• half of consumers with unit trusts, equity ISAs or PEPs (49%, a significant fall from 63% in
2008) are willing to take some risk; and
• only 39% of consumers with a personal pension or FSAVC are willing to take some risk, a
significant fall from 49% in 2008.
7.3 Consumer attitude to product risk
While it is interesting to look at consumer’s opinion on how risky they perceive themselves to be, the
2009 survey sought to investigate how risky consumers think some products are. The products looked
at in tables 16 to 19 are:
• savings accounts;
• direct investment in shares;
• equity ISAs and savings; and
• investments with profits bonds.
Although there is no right answer to whether these products are low risk or high risk (although some
products are more risky than others), it is interesting to look at whether views differ depending on
the type of consumer.

33
Table 16: Risks that types of savings and investments are to money by awareness of FSA — savings accounts
FSA prompted
and unprompted
Name or aware of other financial
regulators
Assume there is a regulator
No knowledge Total
% % % % %
Low risk
76
56 54 41 55
Medium risk 19 28 32 31 27
High risk 4 8 7 10 8
Don't know 1 8 7 18 10
Base 649 145 316 886 1996
* No figures available for 2008.
Over three-quarters (76%) of consumers who are aware of the FSA named savings accounts as low risk.
Those not aware of the FSA are more likely to view savings accounts as a medium risk product. People
with no knowledge of the regulator are most likely to be of the opinion that savings accounts are high
risk (18%).
Table 17: Risks that types of savings and investments are to money by awareness of FSA — Direct investment in shares
FSA prompted
and unprompted
Name or aware of other financial
regulators
Assume there is a regulator
No knowledge Total
% % % % %
Low risk 3 3 4 7 5
Medium risk 22 33 23 20 22
High risk 73 53 60 43 56
Don't know 3 12 13 30 17
Base 649 144 316 887 1996
* No figures available for 2008.
Very few (5%) people named direct investment in shares as low risk. Consumers aware of the FSA are
most likely to name direct investment in shares as a high risk activity (73%). This compares with 53%
of those who are aware of other regulators and 60% who assume there is a regulator. Nearly a third of
consumers unaware of the FSA did not know how to categorise the risk of direct ownership in shares.

34
Table 18: Risks that types of savings and investments are to money by awareness of FSA – Equity ISAs
FSA prompted
and unprompted
Name or aware of other financial
regulators
Assume there is a regulator
No knowledge Total
% % % % %
Low risk 37 27 29 20 27
Medium risk 40 35 38 29 34
High risk 15 19 14 15 15
Don't know 9 19 20 36 23
Base 649 144 315 887 1995
* No figures available for 2008.
Consumers are most likely to name equity ISAs as medium-risk products (34%). Consumers aware of
the FSA are most likely to view them as low risk (37%) or medium risk (40%).
Table 19: Risks that types of savings and investments are to money by awareness of FSA — savings and investments with profits bonds
FSA prompted
and unprompted
Name or aware of other financial
regulators
Assume there is a regulator
No knowledge Total
% % % % %
Low risk 16 24 12 12 14
Medium risk 53 43 42 30 40
High risk 18 17 21 20 19
Don't know 14 16 24 38 26
Base 651 145 316 886 1998
* No figures available for 2008.
Savings and investments with profits bonds are most likely to be seen as medium-risk products (40%).
Over half of consumers who are aware of the FSA (53%) named this product as medium risk compared
with 30% of consumers with no knowledge of the FSA.

35
7.4 Risk profile of consumers responsible for financial decisions
The 2009 questionnaire asked respondents if they are responsible for taking financial decisions (either
solely or jointly) within their household. A determining factor of whether a respondent is responsible
for financial decisions is household structure; for example, lone adults will have no choice.
Nonetheless, it is interesting to look at people’s knowledge of the FSA and risk profile by whether
they are responsible for making financial decisions.
Table 20 shows awareness of the FSA by whether the respondent is responsible for taking the
financial decisions in their household.
Table 20: Is the respondent responsible for taking financial decisions in household by awareness of the FSA?
FSA prompted
and unprompted
Name or aware of other financial
regulators
Assume there is a regulator
No knowledge Total
% % % % %
Responsible for taking financial decisions
95 82 84 76 84
Base 650 144 315 887 1996
* No figures available for 2008.
Overall, 84% of respondents are either solely or jointly responsible for taking financial decisions in
their household. 95% of consumers aware of the FSA are responsible for making financial decisions
compared with just over three-quarters (76%) of consumers with no knowledge of the FSA.
Table 21 shows whether the respondent is responsible for taking financial decisions for the household
and their attitude to risk.
Table 21: Is the respondent responsible for taking financial decisions in household by
attitude to risk?
Not willing to take any risk
with investments
Prepared to have some savings or investments in
products that are higher risk than savings accounts
Prepared to take risks to
gain higher returns
Don’t know Total
% % % % %
Responsible for taking financial decisions
86 87 81 58 84
Base 1333 462 68 134 1997
* No figures available for 2008.

36
86% of consumers who are not willing to take any risk with their investments are responsible for
taking financial decisions in their household.

37
8. Treating customers fairly
The principle of treating customers fairly (TCF) has existed since the implementation of the Financial
Services and Markets Act 2000 (FSMA) in 2001. The questions in this survey are not intended to be a
definitive measure of whether they have been treated fairly by firms, but they are useful in tracking
general consumers’ confidence in being treated fairly by the firms they deal with.
Consumers’ perceptions of whether they have been treated fairly by firms may vary according to
whether they are reflecting on financial firms in general, perhaps through issues they have read
about in the media or the experiences of friends or family, or whether they are commenting on their
own personal experience of the financial firms they actually deal with. The survey asked respondents
to comment on general perceptions separately from their own experiences.
8.1 Consumer confidence in financial firms treating customers fairly
Respondents were asked how confident they are, in general, that financial firms treat their
customers fairly (figure 8).
Figure 8
7%
47%
12%
5% 5%6%
50%
11%
4%7%
25%
14%
6% 6%
24%22%
6%
44%
0%
10%
20%
30%
40%
50%
60%
Veryconfident
Fairlyconfident
Neitherconfident norunconfident
Fairlyunconfident
Veryunconfident
Don't know
2007 2008 2009
All respondents:
2007 n=1943
2008 n=1981
2009 n=1997
Treating customers fairly - general
In general, how confident are you that financial firms treat their customers fairly?
38
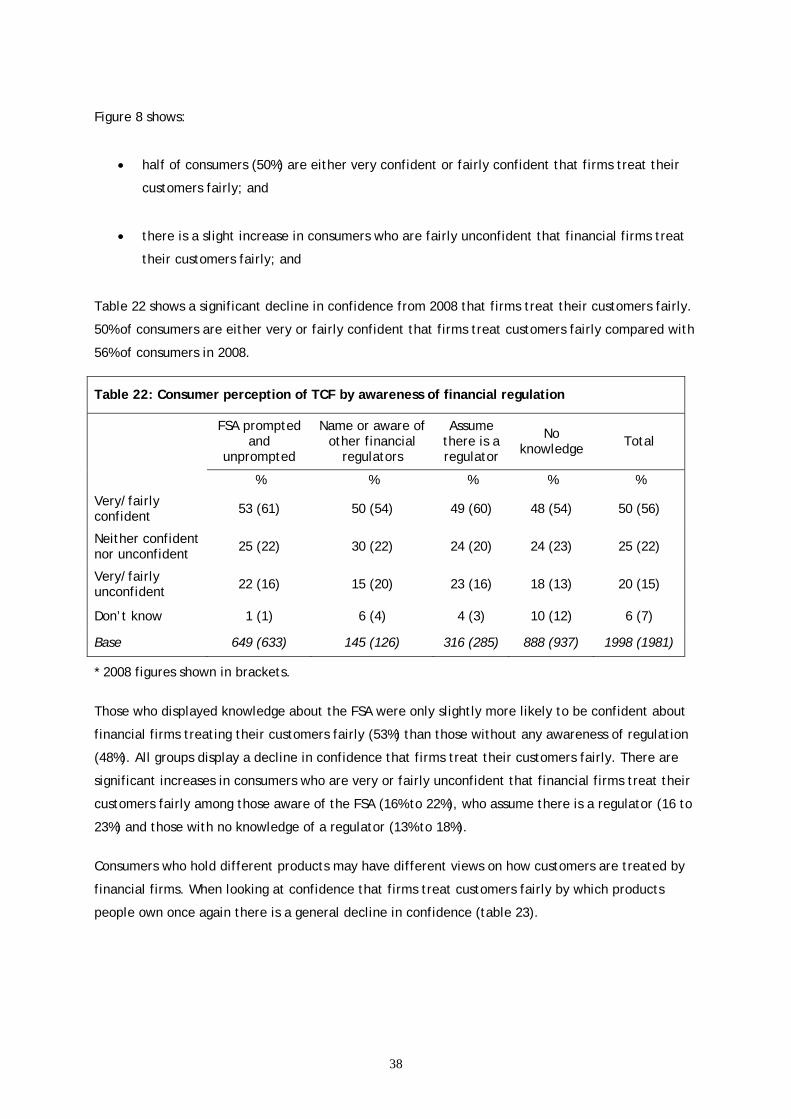
Figure 8 shows:
• half of consumers (50%) are either very confident or fairly confident that firms treat their
customers fairly; and
• there is a slight increase in consumers who are fairly unconfident that financial firms treat
their customers fairly; and
Table 22 shows a significant decline in confidence from 2008 that firms treat their customers fairly.
50% of consumers are either very or fairly confident that firms treat customers fairly compared with
56% of consumers in 2008.
Table 22: Consumer perception of TCF by awareness of financial regulation
FSA prompted
and unprompted
Name or aware of other financial
regulators
Assume there is a regulator
No knowledge Total
% % % % %
Very/fairly confident 53 (61) 50 (54) 49 (60) 48 (54) 50 (56)
Neither confident nor unconfident 25 (22) 30 (22) 24 (20) 24 (23) 25 (22)
Very/fairly unconfident 22 (16) 15 (20) 23 (16) 18 (13) 20 (15)
Don’t know 1 (1) 6 (4) 4 (3) 10 (12) 6 (7)
Base 649 (633) 145 (126) 316 (285) 888 (937) 1998 (1981)
* 2008 figures shown in brackets.
Those who displayed knowledge about the FSA were only slightly more likely to be confident about
financial firms treating their customers fairly (53%) than those without any awareness of regulation
(48%). All groups display a decline in confidence that firms treat their customers fairly. There are
significant increases in consumers who are very or fairly unconfident that financial firms treat their
customers fairly among those aware of the FSA (16% to 22%), who assume there is a regulator (16 to
23%) and those with no knowledge of a regulator (13% to 18%).
Consumers who hold different products may have different views on how customers are treated by
financial firms. When looking at confidence that firms treat customers fairly by which products
people own once again there is a general decline in confidence (table 23).

39
* Respondents can be in more than one of these categories. 2008 figures shown in brackets.
As in 2008, those with no financial products had less confidence in financial firms than those who own
financial products, perhaps explaining why they have no financial products.
8.2 Consumers’ confidence in being treated fairly by the financial firms they deal with
In addition to being asked about general opinion of whether firms treat their customers fairly,
respondents were asked to draw on their own personal experience on how fairly they have been
treated over the past 12 months. Consumer views of an industry as a whole may differ from that of
their own experience.
Figure 9 shows a three-year comparison of consumer confidence of how they are treated as an
individual.
Table 23: Consumer perception of TCF by the products they own
Unit trusts, equity ISAs or PEPs
Personal pension
or FSAVC
Direct share
ownership
Bonds or gilts
Own a low-risk financial product (e.g. current or
savings accounts) but none of the other categories
Own no financial product
Very/fairly confident % 52 (66) 50 (64) 51 (64) 48 (58) 54 (56) 26 (29)
Neither confident nor unconfident
% 25 (21) 27 (20) 21 (21) 26 (31) 23 (23) 31 (24)
Very/fairly unconfident
% 23 (14) 21 (14) 28 (14) 26 (20) 18 (14) 20 (21)
Don’t know % - (2) 2 (2) - (1) - (1) 5 (8) 24 (27)
Base 241 (267) 337 (407) 189 (236) 81 (71) 1202 (1083) 200 (208)

40
Figure 9
Although there has been a clear drop in confidence when consumers talk about the industry as a
whole, this is not shown to such a large degree when looking at own experience. There is only a
slight fall in the number of people who are very or fairly confident that financial firms treat them
fairly (62% in 2008 to 58% in 2009), which is offset by a slight increase in those who are very or fairly
unconfident that financial firms treat the individual consumer fairly (12% in 2008 to 16% in 2009).
Figure 10 shows whether consumers feel that the level of service from financial firms has got better
or worse over the past 12 months.
6%
50%
13%
3%6%
11%
51%
10%
2%7%
22%
13%
3% 5%
21%20%
10%
48%
0%
10%
20%
30%
40%
50%
60%
Veryconfident
Fairlyconfident
Neitherconfident norunconfident
Fairlyunconfident
Veryunconfident
Don't know
2007 2008 2009
All respondents:
2007 n=1943
2008 n=1981
2009 n=1997
Treating customers fairly – own experience
In general, how confident are you that financial firms treat you fairly?

41
Figure 10
Most consumers (66%) felt that firms had become no better or worse at treating their customers fairly
in the last 12 months; this is a significant seven-point fall since 2008. There is a significant increase in
consumers who believe that they are treated worse by their financial firm than at the same time a
year previously — 20% compared with 9% in 2008.
Analysis of respondents’ own experience by knowledge of regulation shows a similar trend of a fall in
confidence that firms treat customers fairly (Table 24).
9%
72%
8%9%
73%
9%7% 7%11%9%
20%
66%
0%10%20%30%40%50%60%70%80%
Worse No change Better Don't know
2007 2008 2009
All respondents:
2007 n=1943
2008 n=1981
2009 n=1997
Treating customers fairly – own experience
And thinking about the past 12 months, in general, would you say that financial firms have become better or worse at treating you fairly?
42
Table 24: Consumer perception of TCF by awareness of financial regulation – own experience
FSA prompted
and unprompted
Name or aware of other financial
regulators
Assume there is a regulator
No knowledge Total
% % % % %
Very/fairly confident 62 (68) 56 (59) 57 (64) 55 (57) 58 (62)
Neither confident nor unconfident 21 (19) 24 (19) 22 (20) 22 (21) 22 (20)
Very/fairly unconfident 16 (13) 16 (13) 18 (12) 14 (11) 15 (12)
Don’t know 1 (1) 4 (9) 4 (4) 9 (11) 5 (7)
Base 650 (632) 145 (127) 316 (285) 887 (937) 1998 (1981)
* 2008 figures shown in brackets.
All levels of awareness of the FSA show a fall in the percentage of people who are either very or fairly
confident that they are treated fairly by firms. Overall there is a significant fall in confidence from
62% to 58%.
Table 25 looks at consumers own experience of fairness by the types of products they own.
* Respondents can be in more than one of these categories. 2008 figures shown in brackets.
Table 25: Consumer perception of TCF by the products they own — own experience
Unit trusts, equity ISAs or PEPs
Personal pension
or FSAVC
Direct share
ownership
Bonds or gilts
Own a low-risk financial product (e.g. current or
savings accounts) but none of the other categories
Own no financial product
Very/fairly confident % 65 (73) 61 (71) 61 (70) 63 (69) 61 (61) 31 (33)
Neither confident nor unconfident
% 18 (18) 22 (16) 19 (17) 14 (14) 21 (21) 33 (27)
Very/fairly unconfident
% 17 (9) 16 (12) 20 (13) 23 (16) 14 (11) 16 (13)
Don’t know % - (2) 1 (2) 1 (1) 1 (1) 5 (7) 21 (28)
Base 240 (267) 336 (407) 190 (234) 80 (71) 1202 (1083) 200 (208)
43
A breakdown of the results in table 25 show:
• the largest fall in confidence are shown in consumers with a personal pension or FSAVC - 61%
in 2009 compared with 71% in 2008 — a significant drop;
• the level of confidence for consumers who own a low-risk financial product and no other, and
those who own no financial product sees no change since 2008.
8.3 Consumer experience when dealing with financial firms
In order to look at TCF in more detail, the survey attempts to separate out consumers who may have
had more contact with their financial firm than those who are not as engaged with financial services.
To do this, the survey asks whether consumers have changed a financial product, whether they have
sought advice and did respondents feel this advice was appropriate to their needs. In addition, it asks
for their perception of how fairly financial firms would resolve complaints.
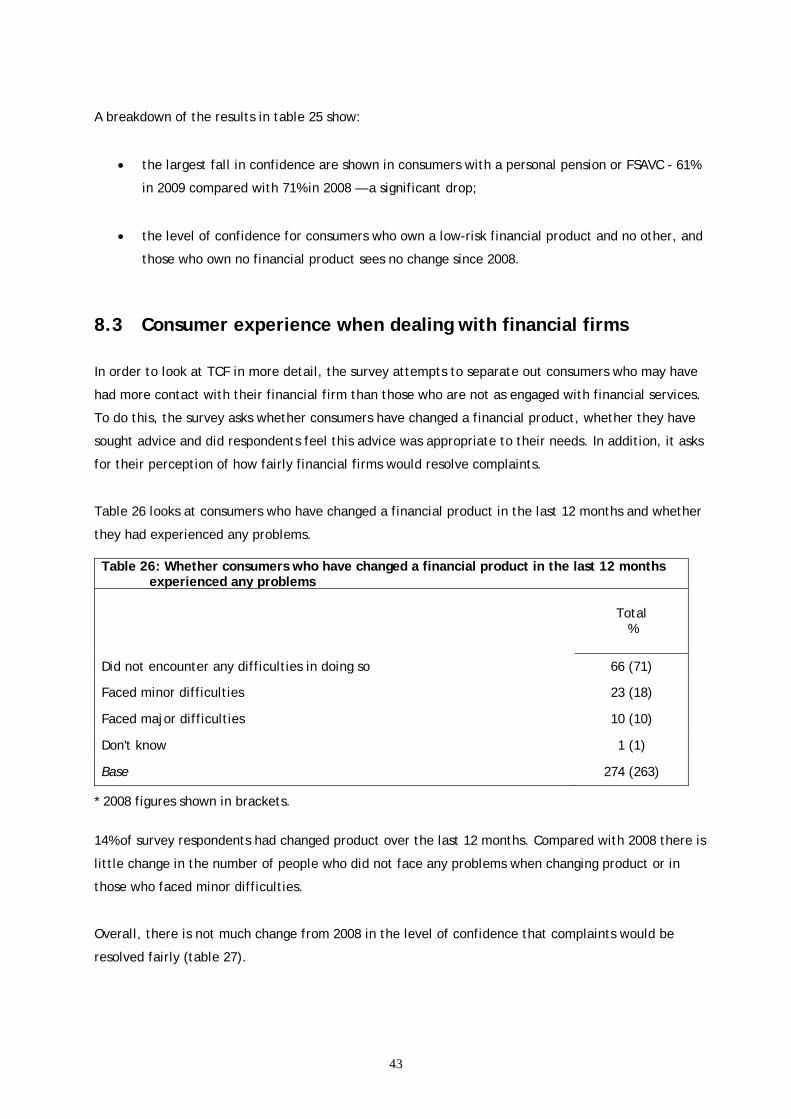
Table 26 looks at consumers who have changed a financial product in the last 12 months and whether
they had experienced any problems.
Table 26: Whether consumers who have changed a financial product in the last 12 months experienced any problems
Total %
Did not encounter any difficulties in doing so 66 (71)
Faced minor difficulties 23 (18)
Faced major difficulties 10 (10)
Don't know 1 (1)
Base 274 (263)
* 2008 figures shown in brackets.
14% of survey respondents had changed product over the last 12 months. Compared with 2008 there is
little change in the number of people who did not face any problems when changing product or in
those who faced minor difficulties.
Overall, there is not much change from 2008 in the level of confidence that complaints would be
resolved fairly (table 27).

44
Table 27: Confidence that complaints would be resolved fairly by awareness of FSA
FSA prompted
and unprompted
Name or aware of other financial
regulators
Assume there is a regulator
No knowledge Total
% % % % %
Very/fairly confident 54 (56) 54 (49) 46 (52) 47 (48) 50 (51)
Neither confident no unconfident 22 (24) 16 (18) 23 (26) 21 (21) 21 (23)
Very/fairly unconfident 23 (19) 25 (29) 27 (17) 20 (17) 22 (18)
Don't know 2(1) 6 (5) 5 (4) 12 (14) 7 (8)
Base 650 (633) 145 (125) 316 (286) 816 (938) 1997 (1982)
* 2008 figures shown in brackets.
Table 27 shows:
• half of all respondents (50%) are very or fairly confident that complaints would be resolved
fairly; and
• as with the 2008 survey, there is little difference amongst consumers aware of the FSA
compared to those who are not.
In addition to asking whether consumers have changed a financial product in the past 12 months,
respondents were asked whether they have used financial advice in the past 12 months (table 28).
They were asked the source of the advice used and whether they felt that the advice was appropriate
to their circumstances (table 29).

45
Table 28: Source of advice by those who have had financial advice in past 12 months
%
A financial adviser 42 (46)
An adviser at a bank or building society 44 (43)
An adviser at Citizens Advice 3 (2)
An accountant 4 (3)
A solicitor 2 (3)
Other 4 (4)
Base 428 (436)
* 2008 figures shown in brackets.
Just over a fifth (21%) of respondents had received financial advice about a financial product in the
past 12 months. As with the 2008 survey, most of these consumers had spoken to a financial adviser
or they had spoken to an adviser at a bank or building society.
Table 29: Confidence that advice was appropriate to circumstances
A financial adviser
Adviser at bank or building society
Citizens Advice, accountant, solicitor or
other
Total
% % % %
Confident 91 (92) 86 (88) 85 (81) 88 (89)
Neither confident no unconfident 3 (3) 4 (5) 7 (4) 4 (4)
Unconfident 7 (6) 10 (6) 9 (6) 8 (6)
Don't know - (0) - (0) - (8) 0 (1)
Base 181 (199) 189 (188) 59 (45) 431 (436)
* 2008 figures shown in brackets.

46
Overall 89% of respondents were either very or fairly confident of advice received being appropriate
to their needs. This is not surprising as individuals who choose to seek financial advice have a
requirement for advice and are unlikely to report that advice was not appropriate to their needs.
47
9. Financial fraud
Consumers’ awareness of their own vulnerability to financial fraud and their awareness of measures
they can take to reduce exposure to the risk of financial fraud is an important part of providing a
robust defence against financial crime.
The 2007 and 2008 surveys included questions which sought to identify how likely people felt they
would become a victim of financial crime, who is responsible for preventing financial crime and the
steps taken by individuals to prevent themselves becoming a victim of financial crime. The 2009
survey refined these questions to provide a more robust measure of exposure to financial fraud. The
attention of the questions has switched from whether consumers feel exposed to financial crime to
whether they have actually been affected by financial fraud or identity fraud. There is more focus on
information sources available to protect against financial fraud and the causes of identity fraud. Due
to the change in this section of questions, there is very little comparable data with previous years.
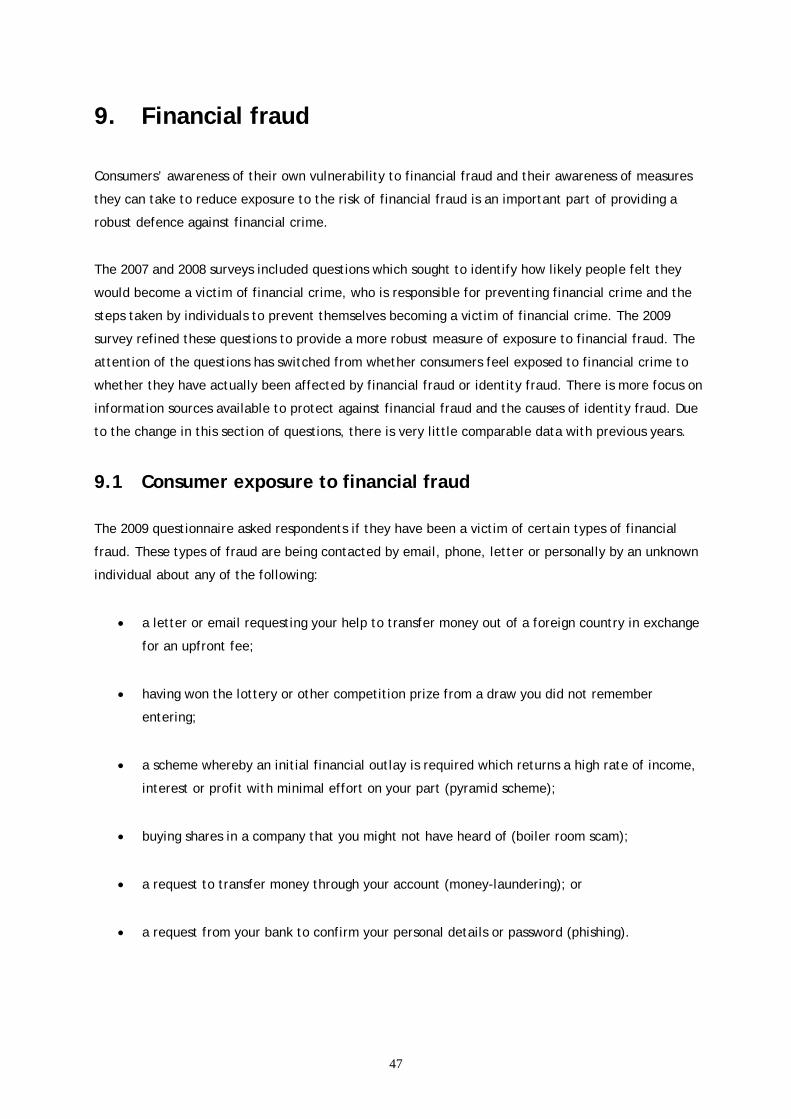
9.1 Consumer exposure to financial fraud
The 2009 questionnaire asked respondents if they have been a victim of certain types of financial
fraud. These types of fraud are being contacted by email, phone, letter or personally by an unknown
individual about any of the following:
• a letter or email requesting your help to transfer money out of a foreign country in exchange
for an upfront fee;
• having won the lottery or other competition prize from a draw you did not remember
entering;
• a scheme whereby an initial financial outlay is required which returns a high rate of income,
interest or profit with minimal effort on your part (pyramid scheme);
• buying shares in a company that you might not have heard of (boiler room scam);
• a request to transfer money through your account (money-laundering); or
• a request from your bank to confirm your personal details or password (phishing).
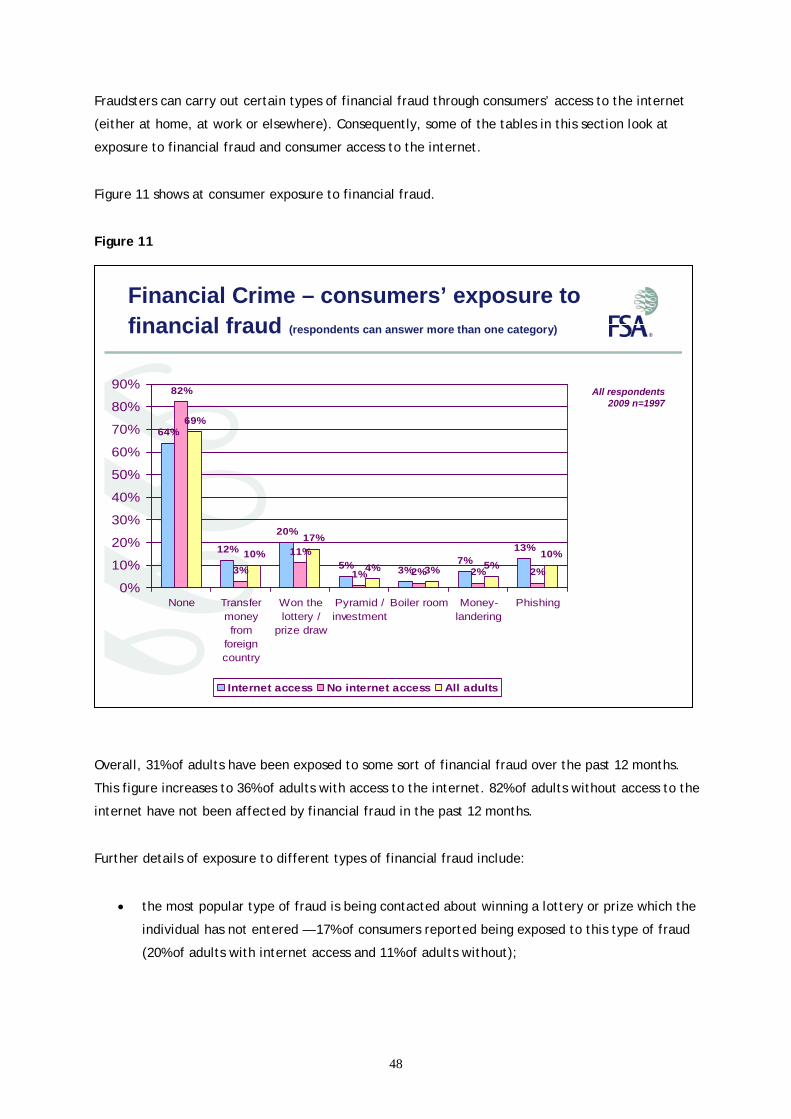
48
Fraudsters can carry out certain types of financial fraud through consumers’ access to the internet
(either at home, at work or elsewhere). Consequently, some of the tables in this section look at
exposure to financial fraud and consumer access to the internet.
Figure 11 shows at consumer exposure to financial fraud.
Figure 11
Overall, 31% of adults have been exposed to some sort of financial fraud over the past 12 months.
This figure increases to 36% of adults with access to the internet. 82% of adults without access to the
internet have not been affected by financial fraud in the past 12 months.
Further details of exposure to different types of financial fraud include:
• the most popular type of fraud is being contacted about winning a lottery or prize which the
individual has not entered — 17% of consumers reported being exposed to this type of fraud
(20% of adults with internet access and 11% of adults without);
64%
12%
20%
5% 3%7%
13%
82%
3%
11%
1% 2% 2% 2%
69%
10%17%
4% 3% 5%10%
0%
10%
20%
30%
40%
50%
60%
70%
80%
90%
None Transfermoneyfrom
foreigncountry
Won thelottery /
prize draw
Pyramid /investment
Boiler room Money-landering
Phishing
Internet access No internet access All adults
Financial Crime – consumers’ exposure to financial fraud (respondents can answer more than one category)
All respondents 2009 n=1997

49
• 10% of consumers reported being contacted regarding transferring money out of a foreign
country and 10% reported being contacted about phishing; and
• in all categories consumers with no access to the internet are less likely to have been
exposed to financial fraud.
While exposure to different types financial fraud is an important measure, of equal importance is to
look at how people respond to this exposure. Are people receptive to these approaches and what is
the likelihood that consumers will lose money as a result of financial fraud.
Table 30: Exposure to types of financial fraud by action taken
Replied and lost money
Replied to investigate
Ignored request
Reported request
Something else Base
Transfer money from a foreign
country % 0 7 79 10 7 190
Won the lottery / prize draw % - 4 79 2 3 341
Pyramid / investment
scheme % 2 6 54 2 - 84
Boiler room % 2 6 59 - 5 57
Money Laundering % 3 1 45 4 - 105
Phishing % 1 5 52 9 3 202
* Respondents can be in more than one of these categories. No figures available for 2008.
**note low base for some categories — treat with caution.
***Due to a questionnaire programming error, not all respondents were able to record multiple
answers to this question.
The most common course of action is to ignore the request (including hanging up telephone, deleting
email or throwing away paper correspondence). In particular with requests to transfer money from a
foreign country (79%) and notification of winning a lottery or prize draw the respondent could not
recall entering (79%). While nobody reported losing any money as a result of transferring money from
a foreign country or a letter claiming to have won the lottery or prize draw, there are reported
incidents of consumers losing money from the other types of fraud — pyramid schemes, boiler room
scams, money laundering and phishing. Consumers are most likely to report requests to transfer

50
money from a foreign country and phishing to either the police, an official body (such as FSA) or to a
financial institution.
Consumers were also asked about the following types of identity fraud:
• bank or building society account (or savings) taken over by a fraudster by changing the
address;
• criminals used false data to open an account or financial product (including credit\debit
cards, bank account loans) in your name; or
• your credit\debit card or bank account has been billed for a product or service that you did
not agree to purchase.
Table 31: Consumers affected by identity fraud
%
Account takeover 1
False data used to open account 1
Bank account billed for product not purchased 2
None 97
Base 1997
* Respondents can be in more than one of these categories. No figures available for 2008.
97% or respondents reported that they have not been affected by these types of identity fraud.
9.2 Information to avoid being a victim of financial crime
In order for consumers to avoid becoming a victim of financial fraud it is important for them to have
the tools available to confidently protect themselves. The survey sought to measure whether
consumers feel there is enough information available to protect against financial fraud and where
they would go for information.

51
Table 32: Is there enough information to protect yourself from becoming a victim of financial
fraud?
FSA prompted
and unprompted
Name or aware of other financial
regulators
Assume there is a regulator
No knowledge Total
% % % % %
Enough information 64 50 51 50 54
Base 650 144 315 887 1996
* No figures available for 2008.
54% of all adults feel that there is enough information available to protect themselves from
becoming a victim of financial fraud. However, when looking at whether consumers feel there is
enough information by their awareness of the FSA, 64% of adults aware of the FSA feel there is
enough information. This compares with around 50% of adults who are not aware of the FSA.
As well as establishing whether consumers feel there is enough information available, we also
sought to find out where people would go in search of information. First, asking respondents to
name sources of information without prompting (figure 12).
Figure 12
39%
9% 10%
15%
21%
7%
16%
7% 6%
12%
22%
12% 13%
30%29%
8%10%
17%19%
9%
20%
0%
5%
10%
15%
20%
25%
30%
35%
40%
45%
Internet Government/ public body
Lawenforcement
/ police
Friends /family
Financialservices
institution
CitizensAdvice
Don't know
Internet access No internet access All adults
Where to go for information on financial fraud (unprompted) (respondents can answer more than one category)
All respondents 2009 n=1997

52
Overall, 20% of adults do not know where to go for information to protect themselves from financial
fraud. Consumers with internet access have a greater probability of finding information. The results
show:
• the most common source of information source is to use an internet search engine (29% of all
adults);
• 19% of consumers use information from a financial services institution;
• 17% would approach friends or family;
• consumers with internet access are more likely to use information from a financial services
institution — 21% compared with 12% without internet access; and
• consumers with no access to the internet are most likely to speak to friends and family for
information and advice (22%).
Table 33 shows whether there is any difference in the type of information sources used to find out
about protection from financial fraud by awareness of the FSA.

53
Table 33: Unprompted – sources of advice to protect yourself from becoming a victim of financial fraud by awareness of the FSA
FSA prompted
and unprompted
Name or aware of other financial
regulators
Assume there is a regulator
No knowledge Total
% % % % %
Internet 42 35 34 18 29
Government\ public body 11 10 10 6 8
Law enforcement\ police
10 7 12 10 10
Friends\ family 13 18 18 20 17
Financial services institution 27 20 16 13 19
Citizens advice bureau 10 10 9 7 9
Base 650 145 316 887 1998
* No figures available for 2008.
Consumers aware of the FSA or other financial regulators are for more likely to be able to
spontaneously name where they will go to search for information to protect themselves from
becoming a victim of financial fraud. Further results show:
• Those aware of the FSA are most likely to use the internet (42%) to find advice followed by
approaching a financial services institution (27%).
• Consumers who assume there is a regulator are also most likely to look for information using
an internet search engine (34%). The second most common method is to approach friends or
family (18%).
• Consumers with no knowledge of the FSA or regulation are most likely to speak to friends
and family for information (20%).
After asking respondents to spontaneously name information sources, they were provided with a list
of possible information sources and asked to name which of the listed sources they would consider
going to for information (figure 13).

54
Figure 13
When provided with a list, the most common source of information for consumers to approach their
bank or building society (41%). There were very few consumers who would directly approach
specialist facilities set up to aid protection against financial fraud — fraud alert (5%), cardwatch (3%),
bank safe online (3%) and get safe online (3%).
9.3 Responsibility for the prevention of financial crime
One of the few questions kept from the 2007 and 2008 surveys was ‘who consumers feel has the main
responsibility for protecting consumers from financial fraud?’ (figure 14).
39%
41%
4%32%
3%
7%
6%3%
3%
3%
5%8%
5%
6%
7%23%
4%
0% 5% 10% 15% 20% 25% 30% 35% 40% 45%
Use internet search engine
Bank/building society
Library
Friends / family
Yellow pages
FSA (MoneyMadeClear)
Directgov
Get safe online
Bank safe online
Cardw atch
Fraud alert
OFT
Consumer direct
Professional services
New spaper
Local police
Post Off ice
Where to go for information on financial fraud (prompted) (respondents can answer more than one category)
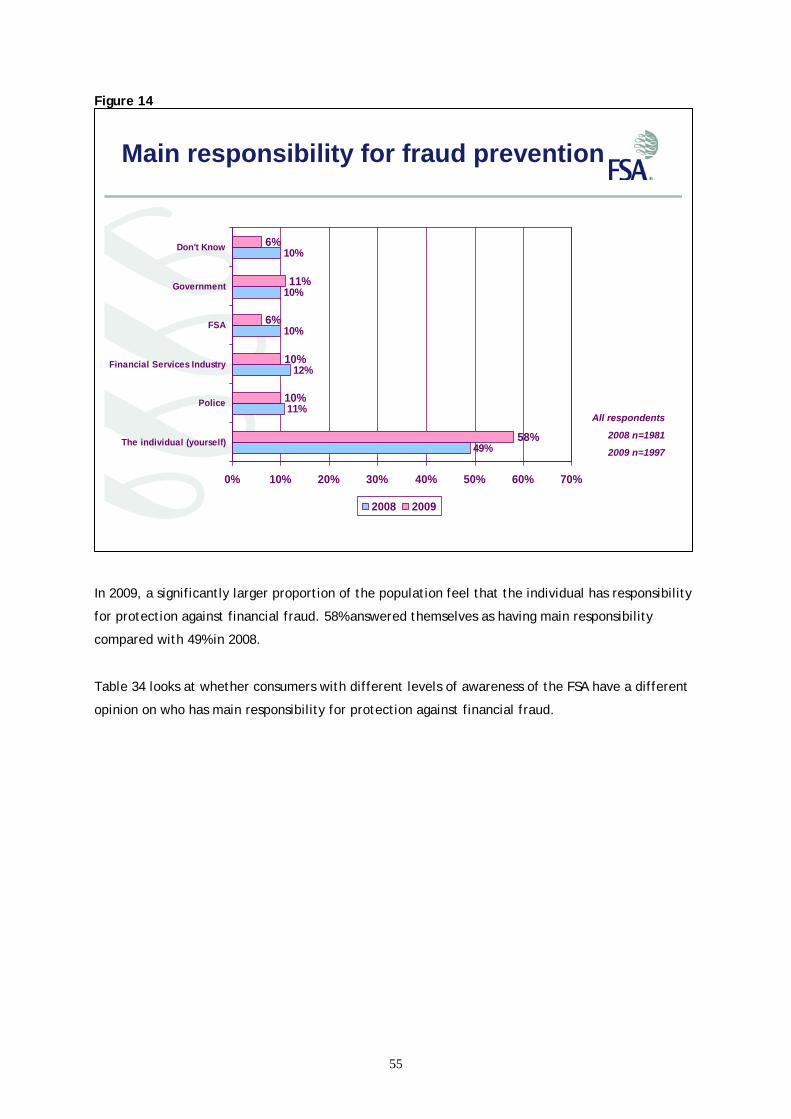
55
Figure 14
In 2009, a significantly larger proportion of the population feel that the individual has responsibility
for protection against financial fraud. 58% answered themselves as having main responsibility
compared with 49% in 2008.
Table 34 looks at whether consumers with different levels of awareness of the FSA have a different
opinion on who has main responsibility for protection against financial fraud.
Main responsibility for fraud prevention
49%
11%
12%
10%
10%
10%
58%
10%
10%
6%
11%
6%
0% 10% 20% 30% 40% 50% 60% 70%
The individual (yourself)
Police
Financial Services Industry
FSA
Government
Don't Know
2008 2009
All respondents
2008 n=1981
2009 n=1997

56
Table 34: Main responsibility for prevention of financial crime by awareness of financial
regulation
FSA prompted
and unprompted
Name or aware of other
financial regulators
Assume there is a regulator
No knowledge Total
% % % % %
Government 7 (8) 5 (13) 8 (8) 16 (12) 11 (10)
Police 4 (6) 10 (6) 9 (8) 14 (11) 10 (9)
The individual (yourself) 73 (55) 61 (51) 63 (52) 46 (43) 58 (49)
The financial services industry 10 (13) 10 (11) 9 (12) 10 (12) 10 (12)
The FSA 5 (15) 8 (12) 7 (13) 5 (8) 6 (10)
Don’t know 2 (3) 6 (6) 4 (8) 10 (15) 6 (10)
Base 649 (633) 144 (126) 317 (285) 887 (937) 1997 (1981)
* 2008 figures shown in brackets.
Amongst consumers aware of the FSA the percentage of consumers who believe that they (the
individual) have main responsibility for fraud protection has increased significantly from 55% in 2008
to 73% in 2009.
Consumers with no knowledge of regulation are least likely to name the individual as having the main
responsibility (46%).
9.4 Likelihood of becoming a victim of financial fraud
It is important to measure how likely consumers feel it is that they will become a victim of financial
fraud. This opinion may shape the actions they take in order to protect themselves from becoming a
victim or it may reflect the actions which they currently take.

57
Table 35: In comparison to last year, how vulnerable do you think you will be to financial fraud in the next year by internet access?
Has internet access No internet access Total
% % %
More 29 22 27
Less 13 11 12
The same 54 56 54
Don’t know 5 11 7
Base 1424 573 1997
* No figures available for 2008.
Table 35 shows:
• over a quarter of adults interviewed (27%) believe that they will be more vulnerable to
financial fraud in the next 12 months;
• adults with internet access are more likely to feel more vulnerable (29%) than those without
internet access (22%); and
To indicate why consumers feel they will be more or less vulnerable, table 36 shows perceived future
vulnerability by whether consumers feel there is enough information available to protect themselves
from financial fraud.

58
Table 36: In comparison to last year, how vulnerable do you think you will be to financial fraud in the next year by does the individual know where to go for information?
Knows where to go for information
Does not know where to go for information Total
% %
More 26 29 27
Less 12 12 12
The same 58 50 54
Don’t know 4 9 7
Base 1082 915 1997
* No figures available for 2008.
Table 37 shows little difference between consumers who know where to go for information and
consumers who do not. Adults without any knowledge on where to search for more information are
slightly more likely to feel they will be more vulnerable in the next 12 months (29% compared with
26%) and are less likely to believe that the situation will stay the same (50% compared with 58%).
Table 37: In comparison to last year, how vulnerable do you think you will be to financial fraud in the next year (by awareness of the FSA)?
FSA prompted
and unprompted
Name or aware of other financial
regulators
Assume there is a regulator
No knowledge Total
% % % % %
More 31 32 28 23 27
Less 14 15 11 11 12
The same 53 51 57 55 54
Don’t know 2 3 4 12 7
Base 650 145 316 887 1998
* No figures available for 2008.
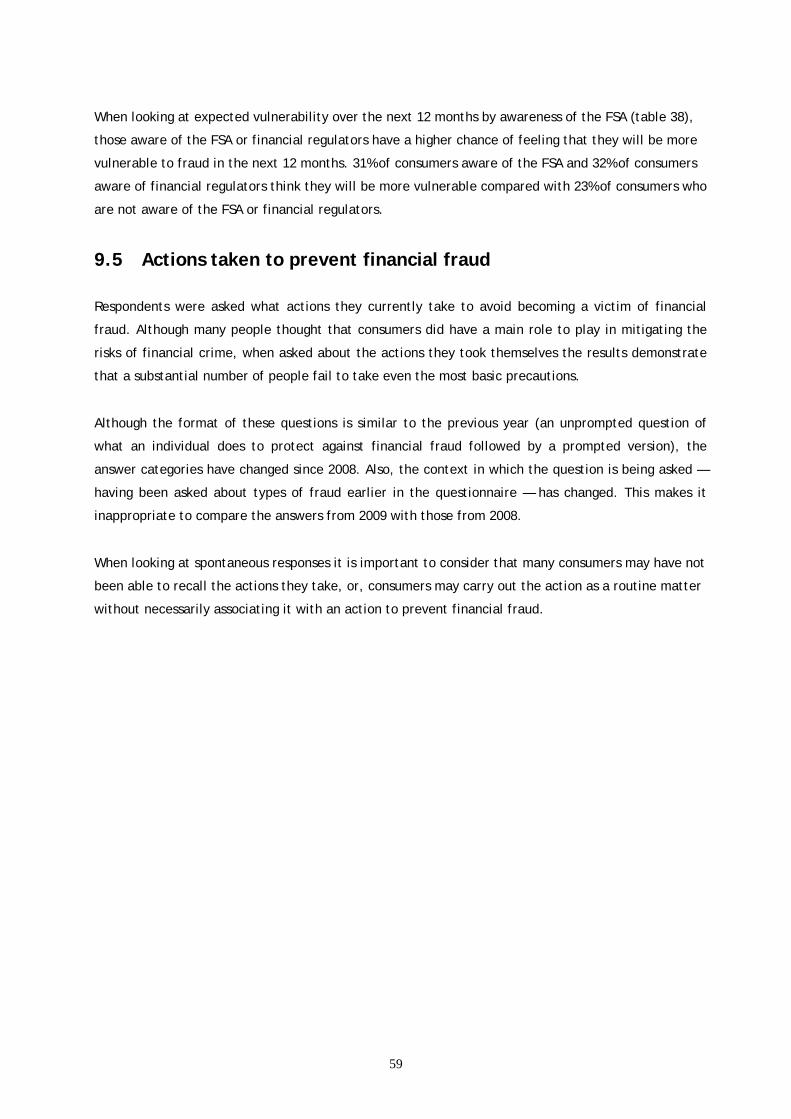
59
When looking at expected vulnerability over the next 12 months by awareness of the FSA (table 38),
those aware of the FSA or financial regulators have a higher chance of feeling that they will be more
vulnerable to fraud in the next 12 months. 31% of consumers aware of the FSA and 32% of consumers
aware of financial regulators think they will be more vulnerable compared with 23% of consumers who
are not aware of the FSA or financial regulators.
9.5 Actions taken to prevent financial fraud
Respondents were asked what actions they currently take to avoid becoming a victim of financial
fraud. Although many people thought that consumers did have a main role to play in mitigating the
risks of financial crime, when asked about the actions they took themselves the results demonstrate
that a substantial number of people fail to take even the most basic precautions.
Although the format of these questions is similar to the previous year (an unprompted question of
what an individual does to protect against financial fraud followed by a prompted version), the
answer categories have changed since 2008. Also, the context in which the question is being asked —
having been asked about types of fraud earlier in the questionnaire — has changed. This makes it
inappropriate to compare the answers from 2009 with those from 2008.
When looking at spontaneous responses it is important to consider that many consumers may have not
been able to recall the actions they take, or, consumers may carry out the action as a routine matter
without necessarily associating it with an action to prevent financial fraud.

60
Figure 15
Figure 15 shows:
• unprompted, the most common action taken was to shred unwanted financial correspondence
(36%); and
• other common top-of-mind responses include avoiding giving out personal details on the
phone (24)% and the internet (19%), never writing down PIN numbers (23%) and checking bank
statements (18%).
Figure 16 shows individual responses when given a selection of responses.
Actions taken to prevent financial fraud –Unprompted (respondents can answer more than one category)
36%
18%16%
23% 24%
17%15%
19%
11%9%
13% 14%
9% 10%
0%
5%
10%
15%
20%
25%
30%
35%
40%
Shre
dco
rresp
onde
nce
Che
ck b
alan
ceon
ban
k\cr
edit
card
sta
tem
ents
Che
ckst
atem
ents
inde
tail
Nev
er w
rite
dow
n yo
u pi
nnu
mbe
rsAv
oid
givi
ngde
tails
on
phon
eKe
ep y
our p
inno
s an
d ca
rds
sepa
rate
Nev
er w
rite
dow
npa
ssw
ords
Avoi
d de
tails
on
the
inte
rnet
Reg
ular
ly u
pdat
ean
ti-vi
rus
Avoi
d cl
icki
ng o
nw
ebsi
te li
nks
inem
ails
care
at A
TM
Car
eful
ly s
tore
corre
spon
denc
eN
o pe
rson
alde
tails
on
asu
rvey
Avoi
d pu
tting
bank
car
dbe
hind
bar
All respondents
2009 n=1997

61
Figure 16
When respondents were given a list of possible actions they may take there is a wide range of
precautions taken:
• the leading action taken is to never write down PIN numbers (40%); and
• other common actions include checking bank statements (38%), not writing down passwords
(35%), avoiding to give personal details over the phone (33%) and keeping PIN numbers and
cards separate (33%).
Table 38 focuses more on possible internet-specific actions taken by respondents with access to the
internet.
Actions taken to prevent financial fraud -Prompted (respondents can answer more than one category)
27%
38%
34%
40%
33%
33%
35%
25%
23%
24%
17%
21%
30%
29%
9%
24%
27%
14%
20%
10%
0% 5% 10% 15% 20% 25% 30% 35% 40% 45%
Shred all unwanted financial correspondence
Check balance on bank\credit card statements
Check statements in detail
Never write down you pin numbers
Avoid giving personal details on phone
Keep your pin nos and cards separate
Never write down passwords
Avoid giving details on the internet
Regularly update anti-virus
Have diff passwords for different accounts
Check the id of a company before internet transaction
Avoid clicking on website links in emails
care at ATM/cover/hide pin num
Carefully store financial correspondence in a safe place
Obtain your credit ref file on reg basis
do not divulge personal details on a survey
Avoid putting bank card begind bar/restaurant
Check post isn't going missing
Ensure no one can hear when giving details on phone
Separate credit card for on-lione purchases
All respondents2009 n=1997

62
Table 38: Actions taken (spontaneous and prompted)
Respondents with access to the internet
%
Never write down passwords 57
Avoid giving personal details out on the internet 55
Regularly update anti-virus software 45
Avoid website links in emails that take you to a financial institution 39
Check the identity of a company before making an internet-based transaction 31
Base 1424
* No figures available for 2008.
Over half of consumers with access to the internet said that they didn’t write down passwords (57%),
and avoid giving personal details out over the internet (55%). Less than half (45%) regularly update
anti virus software.
Also included in the 2009 survey was a question asked to all consumers who own any type of financial
product, whether they use the internet to manage any of their accounts (table 39).
Table 39: Do you use the internet to manage your accounts \ investment products
%
Yes 37
No 63
Base 1797
* No figures available for 2008.
Just over a third (37%) of consumers use the internet to manage a financial product.
9.6 Consequences of being a victim of financial crime
The consequences of becoming a victim of financial crime may shape consumer behaviour in what
precautions they take to protect themselves against financial fraud. If an individual feels that there
will be little consequence to being a victim (more than just inconvenience) they may be less likely to
take precautions against financial fraud.
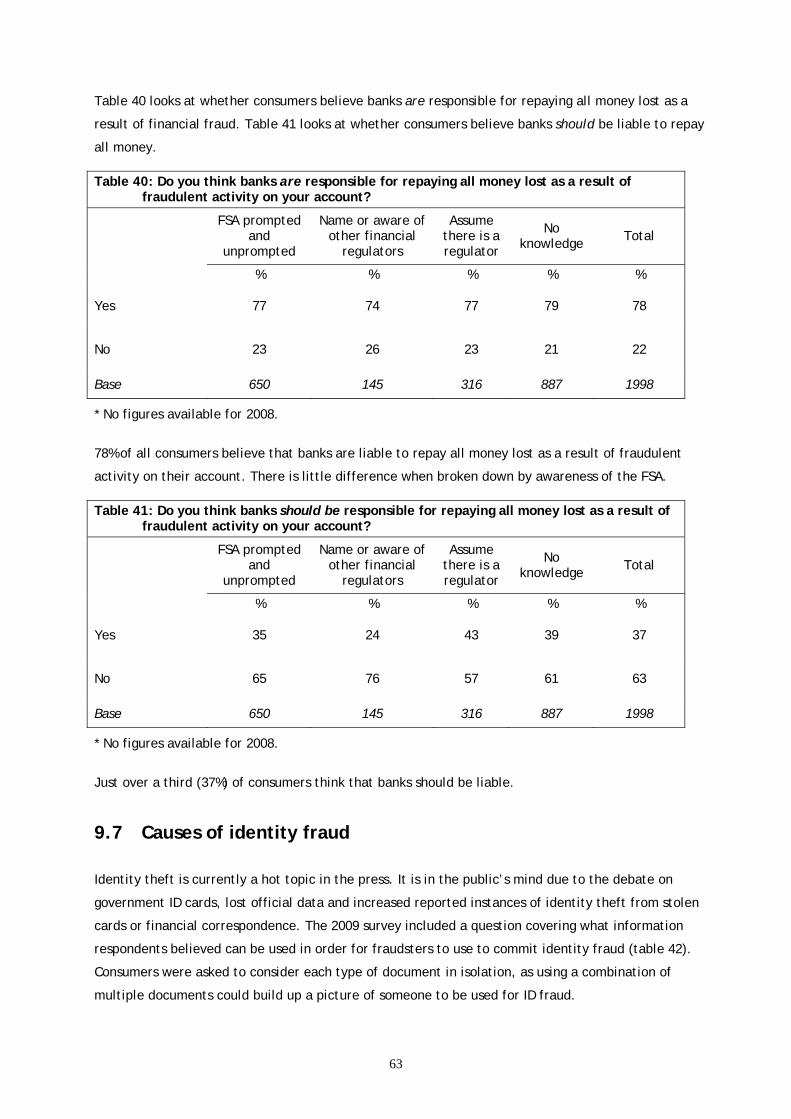
63
Table 40 looks at whether consumers believe banks are responsible for repaying all money lost as a
result of financial fraud. Table 41 looks at whether consumers believe banks should be liable to repay
all money.
Table 40: Do you think banks are responsible for repaying all money lost as a result of fraudulent activity on your account?
FSA prompted
and unprompted
Name or aware of other financial
regulators
Assume there is a regulator
No knowledge Total
% % % % %
Yes 77 74 77 79 78
No 23 26 23 21 22
Base 650 145 316 887 1998
* No figures available for 2008.
78% of all consumers believe that banks are liable to repay all money lost as a result of fraudulent
activity on their account. There is little difference when broken down by awareness of the FSA.
Table 41: Do you think banks should be responsible for repaying all money lost as a result of fraudulent activity on your account?
FSA prompted
and unprompted
Name or aware of other financial
regulators
Assume there is a regulator
No knowledge Total
% % % % %
Yes 35 24 43 39 37
No 65 76 57 61 63
Base 650 145 316 887 1998
* No figures available for 2008.
Just over a third (37%) of consumers think that banks should be liable.
9.7 Causes of identity fraud
Identity theft is currently a hot topic in the press. It is in the public’s mind due to the debate on
government ID cards, lost official data and increased reported instances of identity theft from stolen
cards or financial correspondence. The 2009 survey included a question covering what information
respondents believed can be used in order for fraudsters to use to commit identity fraud (table 42).
Consumers were asked to consider each type of document in isolation, as using a combination of
multiple documents could build up a picture of someone to be used for ID fraud.
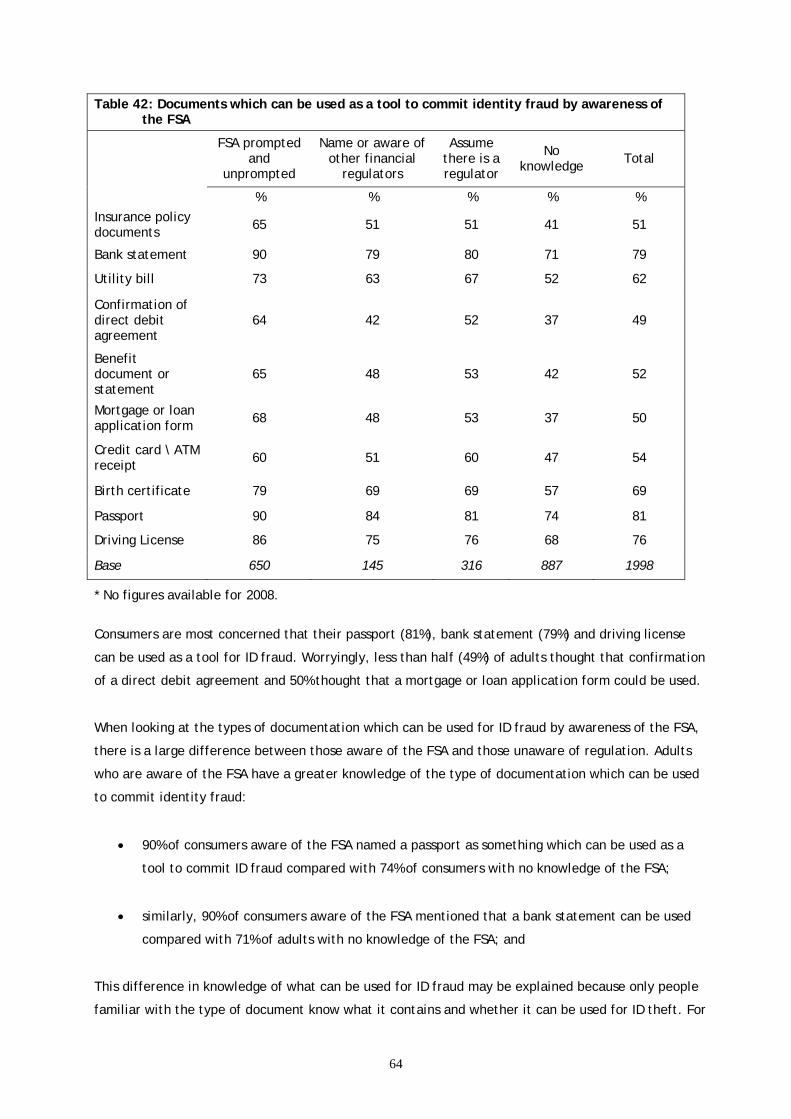
64
Table 42: Documents which can be used as a tool to commit identity fraud by awareness of the FSA
FSA prompted
and unprompted
Name or aware of other financial
regulators
Assume there is a regulator
No knowledge Total
% % % % % Insurance policy documents 65 51 51 41 51
Bank statement 90 79 80 71 79
Utility bill 73 63 67 52 62
Confirmation of direct debit agreement
64 42 52 37 49
Benefit document or statement
65 48 53 42 52
Mortgage or loan application form 68 48 53 37 50
Credit card \ ATM receipt 60 51 60 47 54
Birth certificate 79 69 69 57 69
Passport 90 84 81 74 81
Driving License 86 75 76 68 76
Base 650 145 316 887 1998
* No figures available for 2008.
Consumers are most concerned that their passport (81%), bank statement (79%) and driving license
can be used as a tool for ID fraud. Worryingly, less than half (49%) of adults thought that confirmation
of a direct debit agreement and 50% thought that a mortgage or loan application form could be used.
When looking at the types of documentation which can be used for ID fraud by awareness of the FSA,
there is a large difference between those aware of the FSA and those unaware of regulation. Adults
who are aware of the FSA have a greater knowledge of the type of documentation which can be used
to commit identity fraud:
• 90% of consumers aware of the FSA named a passport as something which can be used as a
tool to commit ID fraud compared with 74% of consumers with no knowledge of the FSA;
• similarly, 90% of consumers aware of the FSA mentioned that a bank statement can be used
compared with 71% of adults with no knowledge of the FSA; and
This difference in knowledge of what can be used for ID fraud may be explained because only people
familiar with the type of document know what it contains and whether it can be used for ID theft. For
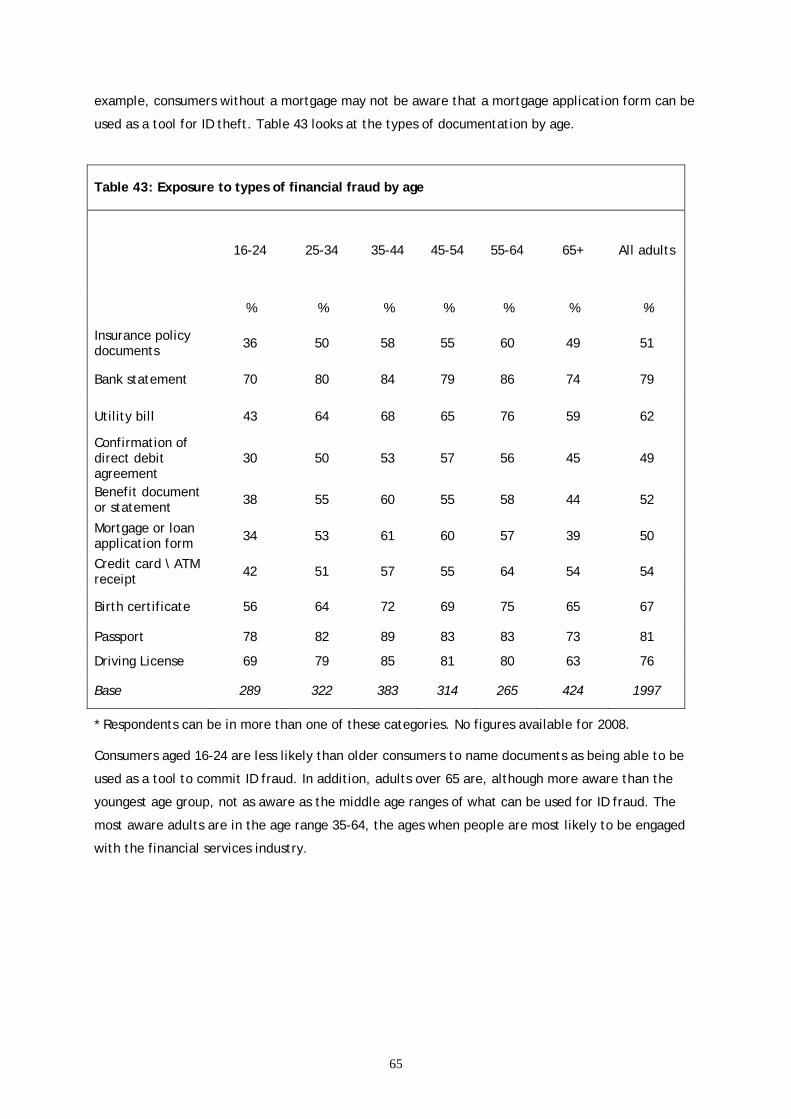
65
example, consumers without a mortgage may not be aware that a mortgage application form can be
used as a tool for ID theft. Table 43 looks at the types of documentation by age.
Table 43: Exposure to types of financial fraud by age
16-24 25-34 35-44 45-54 55-64 65+ All adults
% % % % % % %
Insurance policy documents 36 50 58 55 60 49 51
Bank statement 70 80 84 79 86 74 79
Utility bill 43 64 68 65 76 59 62
Confirmation of direct debit agreement
30 50 53 57 56 45 49
Benefit document or statement 38 55 60 55 58 44 52
Mortgage or loan application form 34 53 61 60 57 39 50
Credit card \ ATM receipt 42 51 57 55 64 54 54
Birth certificate 56 64 72 69 75 65 67
Passport 78 82 89 83 83 73 81
Driving License 69 79 85 81 80 63 76
Base 289 322 383 314 265 424 1997
* Respondents can be in more than one of these categories. No figures available for 2008.
Consumers aged 16-24 are less likely than older consumers to name documents as being able to be
used as a tool to commit ID fraud. In addition, adults over 65 are, although more aware than the
youngest age group, not as aware as the middle age ranges of what can be used for ID fraud. The
most aware adults are in the age range 35-64, the ages when people are most likely to be engaged
with the financial services industry.

66
10. Appendix A: 2009 Questionnaire
FINANCIAL REGULATION ALL ADULTS 16+
Q.1 Do you know of any official bodies or watchdogs regulating the activities of people and companies which sell financial products? 1 Yes 2 No 3 Don't know If [ Q1 , 1 ] otherwise continue at question 7 MULTI CHOICE Q.2 Which official bodies have you heard of who regulate the people and companies which sell financial products ? DO NOT PROMPT. CODE ALL THAT APPLY 1 Bank of England 2 FSA (Financial Services Authority) 3 Financial Ombudsman Service (FOS) 4 Stock Exchange 5 PIA (Personal Investment Authority) 6 SFA (Securities and Futures Association) 7 SIB (Securities and Investment Board) 8 LAUTRO (Life Assurance and Unit Trust Regulatory Organisation) 9 IMRO (Investment Management Regulatory Organisation) 10 FIMBRA (Financial Intermediaries, Managers and Brokers Regulatory Association) 11 The Pensions Regulator 14 The Financial Services Compensation Scheme (FSCS) SHOW SCREEN AND READ OUT Q.3 May I just check, do you... 1 Know that there is an organisation that regulates people and firms in financial services, but you don't know or cannot remember its name 2 Assume that there is an organisation that oversees this area but are not sure 3 Or have you never thought about it? SHOW SCREEN Q.4 The FSA, or the Financial Services Authority is the body that regulates the financial services industry. Which one of the following best applies to you ? 1 The FSA was the organisation you were thinking of but could not remember 2 You were thinking of a different organisation 3 You're not sure If [ Q1 , 1 and not Q2 , 2 , 12 , 13 ] otherwise continue at question 6

67
SHOW SCREEN Q.5 The FSA, or the Financial Services Authority is the body that regulates the financial services industry. Before this survey which one of the following best applies to you? 1 You had heard of the FSA but couldn't remember the name 2 You think you might have heard of it 3 You haven't heard of it at all MULTI CHOICE Q.6 What do you think are the main activities of a financial watchdog? DO NOT PROMPT. CODE CAREFULLY AGAINST LIST BELOW 1 Compensation for consumers 2 Ensuring only appropriate people\firms can work in financial services 3 Selling practices\prevent mis-selling 4 Consumer education 5 Consumer information 6 Ensuring firms have appropriate monetary reserves\pay out money 7 Prosecuting firms\individuals for misdeeds 10 Ensuring that financial firms treat their customers fairly 8 Other If Aware of FSA SHOW SCREEN AND READ OUT Q.7 I'm now going to read you statements about what the FSA does and I would like you to tell me whether you knew this before this interview... ...The FSA checks firms and individuals to make sure they meet certain standards in order to work in financial services including whether individuals are qualified and companies have enough money to operate. Which of the following best applies to you? 1 I definitely knew the FSA did this 2 I thought they must do this 3 I thought some organisation must be doing something like this but didn't know who 4 I didn't know this was done by anyone 5 I haven't thought about it before SHOW SCREEN Q.8 How confident are you that financial firms in the UK have adequately qualified staff and enough money to operate? You're confident that... 1 All firms reach these standards 2 Most firms reach these standards 3 Some firms reach these standards 4 Few firms reach these standards 5 I'm not confident that any firms reach these standards 6 I don't know SHOW SCREEN Q.9 The FSA makes sure that banks, building societies, insurance companies and other financial institutions hold enough funds to pay out their customers in current circumstances. Which of the following applies to you?

68
1 I definitely knew the FSA did this 2 I thought they must do this 3 I thought some organisation must be doing something like this but didn't know who 4 I didn't know this was done by anyone 5 I haven't thought about it before SHOW SCREEN Q.10 How confident are you that financial firms in the UK hold enough funds to pay out their customers in current circumstances? You're confident that... 1 All firms reach these standards 2 Most firms reach these standards 3 Some firms reach these standards 4 Few firms reach these standards 5 I'm not confident that any firms reach these standards 6 I don't know If aware of FSA SHOW SCREEN Q.11 The FSA fines and sanctions firms for breaking its rules. Which of the following best applies to you? 1 I definitely knew the FSA did this 2 I thought they must do this 3 I thought some organisation must be doing something like this but didn't know who 4 I didn't know this was done by anyone 5 I haven't thought about it before SHOW SCREEN Q.12 When people buy investment products the FSA requires that salespeople and financial advisers ensure that the product is suitable for the consumer. Which of the following best applies to you? 1 I definitely knew the FSA did this 2 I thought they must do this 3 I thought some organisation must be doing something like this but didn't know who 4 I didn't know this was done by anyone 5 I haven't thought about it before SHOW SCREEN Q.13 How confident are you that financial firms in the UK ensure that investment products they sell are suitable for the needs of the consumers? You're confident that... 1 All firms reach these standards 2 Most firms reach these standards 3 Some firms reach these standards 4 Few firms reach these standards 5 I'm not confident that any firms reach these standards 6 I don't know If aware of FSA SHOW SCREEN Q.14 Overall how confident are you that the FSA is effectively regulating the financial services industry?

69
1 Very confident 2 Fairly confident 3 Neither confident nor unconfident 4 Fairly unconfident 5 Very unconfident SHOW SCREEN Q.15 And overall how confident are you that UK firms follow the FSA's rules? 1 Very confident 2 Fairly confident 3 Neither confident nor unconfident 4 Fairly unconfident 5 Very unconfident SHOW SCREEN Q.16 When firms operate they have to follow certain rules. These include that their staff are qualified, that they have enough funds to pay out to customers and that products sold to consumers are suitable for their needs. Overall how confident are you that this actually takes place? 1 Very confident 2 Fairly confident 3 Neither confident nor unconfident 4 Fairly unconfident 5 Very unconfident SHOW SCREEN Q.17 The FSA regulates a wide range of different types of financial firms including banks, building societies, insurance providers and independent financial advisers. Do you think firms that are regulated are ever allowed to go bankrupt - that is go out of business? 1 Yes, all types of firms 2 Only some types of firms 3 No firms If [ Q17 , 2 TO 3 ] MULTI CHOICE Q.18a Why do you think <?> are not allowed to go bankrupt? CODE ALL THAT APPLY. DO NOT PROMPT. 1 Government\regulator will always bail them out 2 Large firms never go bankrupt 3 Some firms are too important to be allowed to go bankrupt 4 Too many consumers would be affected 5 Government would never allow consumers to lose money 6 Don't know any firm that has ever gone bankrupt 7 Only know of a small number of firms that have ever gone bankrupt 8 People would lose confidence in financial system 9 Other If [ Q1700 , 2 SHOW SCREEN - MULTI CHOICE Q.18 Are there particular types of firms which are not allowed to go bankrupt or are all types of firm allowed to go bankrupt?

70
1 All firms are allowed to go bankrupt 2 Banks 3 Building societies 4 Insurance companies 5 Independent financial advisers 6 Mortgage brokers 7 General insurance brokers If [ Q1700 , 1 TO 2 ] Q.19 Do you think that consumers can lose money because a firm has become bankrupt? 1 Yes 2 No If [ Q1900 , 2 MULTI CHOICE Q.20 Why do you think consumers will not lose money as a result of a firm going bankrupt? DO NOT PROMPT. CODE ALL THAT APPLY 1 The Financial Services Compensation Scheme \ A compensation scheme will pay out to cover all or some of the losses 6 Ombudsman\regulator\FSA will pay out to cover all or some of the losses 2 The government will pay out 3 Other firms will be asked to pay out 4 Other SHOW SCREEN Q20B How much money do you think you are entitled to get back if your bank goes bankrupt? IF UNSURE PLEASE ASK FOR BEST ESTIMATE. 1 Nothing 2 £15,000 3 £35,000 4 £50,000 5 £70,000 6 £100,000 7 All of it SHOW SCREEN Q.21 Which of the following statements best describes your attitude to savings and investment risk? 1 I am not willing to take any risk with my savings or investments 2 I am prepared to have some of my savings or investments in higher risk products than in the building society\bank savings accounts 3 I am prepared to take higher risks to get higher returns

71
Q.22 For each of the following types of savings and investment I am going to read out, can you please tell me how risky you think they are to your money? SHOW SCREEN AND READ OUT STATEMENT So how risky do you think ... Savings Accounts are to your money? Direct Investment in shares is to your money? Equity ISAs are to your money? Savings and investments and with-profits bonds? 1 Low risk 2 Medium risk 3 High risk Q.23 Are you responsible for taking financial decisions in your household, either solely or jointly? 1 Yes 2 No SHOW SCREEN - MULTI CHOICE Q.24 Please have a look at this screen and tell me which, if any, of the following financial products do you currently have (including owned jointly) ? CODE ALL THAT APPLY 1 Current\cheque account at a bank\building society 2 Savings account 3 National Savings Accounts or certificates 4 Premium Bonds 5 TESSA or Cash ISA 6 Bonds and Gilts (Government or corporate) 7 Personal Equity Plan (PEP) 8 Equity, share or unit trust ISA 9 Unit trust or Investment trust or OEIC 10 Mortgage endowment 11 Repayment mortgage 12 Interest-only mortgage 13 Personal pension \ Free Standing AVCs 14 Direct ownership of Shares 17 Second property \ buy-to-let property 15 Other investments If [ not Q24 , 16 ] otherwise continue at question 2403 Q.24A Do you access or manage any of your accounts or investment products using the internet? 1 Yes 2 No Q.24B Have you attempted to change any of your financial products to a product from a different firm in the last 12 months? 1 Yes 2 No
72
If [ Q2401 , 1 ] SHOW SCREEN Q.24C And when you changed your financial product to a product from another firm, would you say you... ? 1 Did not encounter any difficulties doing so 2 Faced minor difficulties 3 Faced major difficulties SHOW SCREEN Q.24D If you needed to make a complaint to a financial firm, how confident would you be that the firm would resolve your complaint fairly? 1 Very confident 2 Fairly confident 3 Neither confident nor unconfident 4 Fairly unconfident 5 Very unconfident If [ not Q2400 , 16 ] Q.24E Have you received professional financial advice about a financial product in the past 12 months? 1 Yes 2 No If [ Q2404 , 1 ] SHOW SCREEN Q.24F Thinking about the last time you received such advice, did it come from... ? 1 A Financial Adviser 2 An adviser at a bank or building society 3 An adviser at Citizens Advice or Council advice agency 4 An accountant 5 A solicitor 7 Other SHOW SCREEN Q.24G Thinking about the advice you received, how confident are you that the advice was appropriate to your circumstances? 1 Very confident 2 Fairly confident 3 Neither confident nor unconfident 4 Fairly unconfident 5 Very unconfident SHOW SCREEN Q.25 IN GENERAL, how confident are you that financial firms treat their customers fairly? 1 Very confident 2 Fairly confident 3 Neither confident nor unconfident 4 Fairly unconfident 5 Very unconfident

73
SHOW SCREEN Q.27 Now thinking about YOUR OWN EXPERIENCE, how confident are you that financial firms will treat YOU fairly? 1 Very confident 2 Fairly confident 3 Neither confident nor unconfident 4 Fairly unconfident 5 Very confident Q.27A And why do you feel unconfident that you will be treated unfairly? PROBE : Any other reason ? SHOW SCREEN Q.28 And thinking about YOUR OWN EXPERIENCE over the past 12 months, would you say that financial firms have become worse or better better or worse at treating YOU fairly, or has there been no change ? 1 Worse 2 Better 3 No change Q.28A Have you personally been treated unfairly by a financial firm in the last 12 months? 1 Yes 2 No SHOW SCREEN - MULTI CHOICE Q.28B And what type of financial product or products did this unfair treatment relate to? CODE ALL THAT APPLY 1 Current\cheque account at a bank\building society 2 Savings account 3 National Savings Accounts or certificates 4 Premium Bonds 5 TESSA or Cash ISA 6 Bonds and Gilts (Government or corporate) 7 Personal Equity Plan (PEP) 8 Equity, share or unit trust ISA 9 Unit trust or Investment trust or OEIC 10 Mortgage endowment on my own property 11 Repayment mortgage on my own property 12 Interest only mortgage on my own property 13 Personal pension \ Free Standing AVCs 14 Direct ownership of Shares 15 Second property \ buy-to-let property 16 Other investments If aware of FSA SHOW SCREEN Q.29 The Financial Services Authority provides impartial information to consumers to help them make financial decisions. Which of the following best applies to you?

74
1 I definitely knew the FSA did this 2 I thought they must do this 3 I thought some organisation must be doing something like this but didn't know who 4 I didn't know this was done by anyone SHOW SCREEN - MULTI CHOICE Q.29A Have you heard about or seen any of these FSA information sources? 1 Moneymadeclear 2 What about Money? 3 The Parent's Guide to Money 4 Seen another source of FSA information SHOW SCREEN Q.29B Before today did you know that the Financial Services Authority is independent from the government? 1 I definitely knew this 2 I thought that the FSA is independent from the government 3 I didn't know the FSA is independent from the government SHOW SCREEN Q.29C Before today did you know that the Financial Services Authority receives its funding from the firms it regulates? 1 I definitely knew this 2 I thought that the FSA receives funding from the firms it regulates 3 I didn't know how the FSA is funded SHOW SCREEN - MULTI CHOICE Q.30a Which, if any, of these things do you personally keep an eye on ? CODE ALL THAT APPLY 1 Changes in the housing market 2 Changes in the stock market 3 Changes in interest rates 4 Changes in inflation 5 Changes in taxation, e.g. income tax, capital gains tax 6 Changes in the job market 7 Changes in state pension, benefits and tax credits 8 Checking I receive the best deal on all my financial products If [ Q30 , 1 TO 8 ] SHOW SCREEN Q.30b And how frequently do you monitor it\them? 1 At least once a week 2 At least once a month, but not once a week 3 Less than once a month SHOW SCREEN Q.31A In the last year, have you been contacted by email, phone, letter or personally by any unknown individual about any of the following? If yes, which ones?

75
1 A request from a bank to confirm your personal details or password 2 A request to transfer money through your account 3 Buying shares in a company that you might not have heard of 4 A scheme whereby an initial financial outlay is required which returns a high rate of income, interest or profit with minimal effort on your part (as part of the scheme you may be asked to recruit new investors) 5 Having won the lottery or other competition prize from a draw you did not remember entering 6 A letter or email requesting your help to transfer money out of a foreign country in exchange for an upfront fee. 7 Any other scam SHOW SCREEN-MULTI CHOICE Q.31B Thinking back to when you were contacted about o A request from a bank to confirm your personal details or password o A request to transfer money through your account o Buying shares in a company that you might not have heard of o A scheme whereby an initial financial outlay is required which returns a high rate of income, interest or profit with minimal effort on your part (as part of the scheme you may be asked to recruit new investors) o Having won the lottery or other competition prize from a draw you did not remember entering o A letter or email requesting your help to transfer money out of a foreign country in exchange for an upfront fee how did you respond? 1 Replied - and lost money as a result 2 Replied - to investigate or request further information. Did not lose any money as a result 3 Ignored request (including binned post, deleted email) 4 Reported the request (to official body e.g. police, bank, FSA, ombudsman 5 Did something else SHOW SCREEN-MULTI CHOICE Q.31B Thinking back to when you were contacted about Any other scam, how did you respond? 1 Replied - and lost money as a result 2 Replied - to investigate or request further information. Did not lose any money as a result 3 Ignored request (including binned post, deleted email) 4 Reported the request (to official body e.g. police, bank, FSA, ombudsman 5 Did something else SHOW SCREEN Q.32 Have you lost out financially as a result of any of these types of fraud in the last 12 months? If yes, which? 1 Bank \ building society account (or savings) taken over by a fraudster by changing the address 2 Criminals used false data to open an account or financial product (including credit \ debit cards, bank account loans) in your name 3 Your credit \ debit card or bank account has been billed for a product or service that you did not agree to purchase

76
SHOW SCREEN Q.33 Do you believe that there is enough information available on how to protect yourself from becoming a victim of the types of fraud we have just been discussing? o A request from a bank to confirm your personal details or password o A request to transfer money through your account o Buying shares in a company that you might not have heard of o A scheme whereby an initial financial outlay is required which returns a high rate of income, interest or profit with minimal effort on your part (as part of the scheme you may be asked to recruit new investors) o Having won the lottery or other competition prize from a draw you did not remember entering o A letter or email requesting your help to transfer money out of a foreign country in exchange for an upfront fee. o Any other scams o Bank \ building society account (or savings) taken over by a fraudster by changing the address o Criminals used false data to open an account or financial product (including credit \ debit cards, bank account loans) in your name o Your credit \ debit card or bank account has been billed for a product or service that you did not agree to purchase 1 Yes 2 No SHOW SCREEN AND MULTICHOICE Q.34 And which of the following activities, if any, do you use the Internet for regularly nowadays? 1 Banking 2 Booking Travel 3 Downloading Music or Videos 4 E-mail 5 Reading News 6 Shopping DO NOT SHOW SCREEN UNTIL TOLD TO DO SO MULTI CHOICE Q.34a Where would you go to find out information on how to protect yourself from being a victim of the types of fraud we have just discussed? DO NOT PROMPT 1 Use an internet search engine 2 Government\public body (website\phone\in person) 3 Law enforcement \ police (website\phone\in person) 4 Friends \ family 5 Financial services institution (website\phone\in person) 6 Somewhere else SHOW SCREEN-MULTI CHOICE Q.34B Where would you go to find out information on how to protect yourself from being a victim of the types of fraud we have just discussed? PROBE : Anywhere else ?

77
1 Use an internet search engine 2 My bank \ building society 3 Library 4 Friends \ family 5 Yellow pages 6 FSA - money made clear website 7 Directgov 8 Get safe online 9 bank safe online 10 Cardwatch 11 Fraud alert 12 Office for fair Trading (OFT) 13 Consumer Direct 14 Professional services contact (e.g. solicitor, accountant) 15 Newspaper (print or online) 16 Local police 17 Post office 18 Somewhere else SHOW SCREEN Q.35 Who has the main responsibility in preventing you from being a victim of fraud? 1 Government 2 Police 3 The individual (yourself) 4 Financial Services industry (e.g. banks, trade bodies, insurance companies etc.) 5 The financial services regulator SHOW SCREEN Q.35a And who would you place next in order of having responsibility in preventing you from being a victim of fraud? 1 Government 2 Police 3 The individual (yourself) 4 Financial Services industry (e.g. banks, trade bodies, insurance companies etc.) 5 The financial services regulator SHOW SCREEN Q.35B And who would you place next in order of having responsibility in preventing you from being a victim of fraud? 1 Government 2 Police 3 The individual (yourself) 4 Financial services industry (e.g. banks, trade bodies, insurance companies etc.) 5 The financial services regulator SHOW SCREEN Q.35C And who would you place next in order of having responsibility in preventing you from being a victim of fraud? 1 Government 2 Police 3 The individual (yourself) 4 Financial services industry (e.g. banks, trade bodies, insurance companies etc.) 5 The financial services regulator

78
SHOW SCREEN Q.35D And who would you place next in order of having responsibility in preventing you from being a victim of fraud? 1 Government 2 Police 3 The individual (yourself) 4 Financial services industry (e.g. banks, trade bodies, insurance companies etc.) 5 The financial services regulator SHOW SCREEN Q.36 In comparison to last year, how vulnerable do you think you will be to the types of financial fraud mentioned in this questionnaire in the next year? 1 More 2 Less 3 The same MULTI CHOICE Q.37A What do you currently do, if anything, to avoid becoming a victim of financial fraud? DO NOT PROMPT 1 Shred all unwanted financial correspondence (e.g. bank statements \letters, credit card bills, etc.) 2 Carefully store all financial correspondence in a safe place 3 Avoid giving personal details over the telephone 4 Avoid giving personal details over the internet 5 Never write down your PIN numbers 6 Keep your PIN numbers and credit \ debit cards separate 7 Avoid putting a bank card behind the bar \ restaurant 8 Obtain a copy of your credit reference file on a regular basis 9 Check balance on bank\credit card statements 21 Regularly check bank\credit card statements in detail and check all activity on my account(s) 10 Regularly update anti virus software on a personal computer 11 Avoid clicking on website links contained in e-mails that take you to the website of a financial institution 12 Check the identity of a company before making an internet-based or over the phone transaction 13 Avoid filling in personal details on a survey 14 Never write down passwords 15 Have different passwords for different accounts 16 shield entering of pin number when accessing an ATM \ cash machine \ paying for goods 17 Check that post isn't going missing 18 Ensure that no one can hear when giving personal details on the phone 19 Keep a separate credit card for online purchases 20 Other SHOW SCREEN - MULTI CHOICE Q.37B And looking at the following list, what else do you currently do, if anything, to avoid becoming a victim of financial fraud? CODE ALL THAT APPLY

79
1 Shred all unwanted financial correspondence (e.g. bank statements \letters, credit card bills, etc.) 2 Carefully store all financial correspondence in a safe place 3 Avoid giving personal details over the telephone 4 Avoid giving personal details over the internet 5 Never write down your PIN numbers 6 Keep your PIN numbers and credit \ debit cards separate 7 Avoid putting a bank card behind the bar \ restaurant 8 Obtain a copy of your credit reference file on a regular basis 9 Check balance on bank\credit card statements 21 Regularly check bank\credit card statements in detail and check all activity on my account(s) 10 Regularly update anti virus software on a personal computer 11 Avoid clicking on website links contained in e-mails that take you to the website of a financial institution 12 Check the identity of a company before making an internet-based or over the phone transaction 13 Avoid filling in personal details on a survey 14 Never write down passwords 15 Have different passwords for different accounts 16 shield entering of pin number when accessing an ATM \ cash machine \ paying for goods 17 Check that post isn't going missing 18 Ensure that no one can hear when giving personal details on the phone 19 Keep a separate credit card for online purchases 20 Other Q.38 Do you think banks are responsible to repay all money lost as a result of any fraudulent activity which takes place on your account? 1 Yes 2 No Q.39 Do you think banks should be responsible to repay all money lost as a result of any fraudulent activity which takes place on your account? 1 Yes 2 No SHOW SCREEN - MULTI CHOICE Q.40 Which of these documents do you believe contain enough information that it can be used as a tool to commit identity theft? PROBE : Which others? 1 Insurance policy documents 2 Bank statement 3 Utility bill 4 Confirmation of direct debit agreement 5 Benefit document or statement 6 Mortgage or loan application form 7 Credit card receipt \ ATM or cash point receipt 8 Birth certificate \ Death certificate 9 Passport 10 Driving licence

The Financial Services Authority 25 The North Colonnade Canary Wharf London E14 5HS Telephone: +44 (0)20 7066 1000 Fax: +44 (0)20 7066 1099 Website: http://www.fsa.gov.uk
Registered as a Limited Company in England and Wales No. 1920623. Registered Office as above.


![Regulatory reform – understanding the impact€¦ · Enforcement]FSA gets tough]Credible deterrence ... – Boost for external hedge funds? 22752089 v1 Financial regulation*]More](https://img.dokumen.tips/doc/110x75/5f58b32292efb55c4a1fb5c4/regulatory-reform-a-understanding-the-impact-enforcementfsa-gets-toughcredible.jpg)