Embed Size (px)
Citation preview

Consumer Discretionary
November 2, 2010
Jonathan Barkan
Chris Cameron
Yixiong Chen
Amanda Grant

Agenda
• Sector Overview
• Economic Analysis
• Business Analysis
• Financial Analysis
• Valuation Analysis
• Recommendation

Sector OverviewS&P 500 vs SIM
Consumer Discretionary
10%
Consumer Staples
11%
Energy11%
Financials15%Healthcare
12%
Industrials11%
Information Technology
19%
Materials4%
Telecommunication
Services3%
Utilities4% Cash
0%
Dividends Receivables
0%
S&P 500 Weight
Consumer Discretionary
10%
Consumer Staples
10%
Energy11%
Financials12%
Healthcare12%
Industrials13%
Information Technology
19%
Materials4%
Telecommunication Services
4%
Utilities2%
Cash 3%
Dividends Receivables
0%
SIM Weight
As of September 30, 2010
Currently, Consumer Discretionary is 10.42% of the
S&P 500 and 10.14% of the SIM Portfolio.
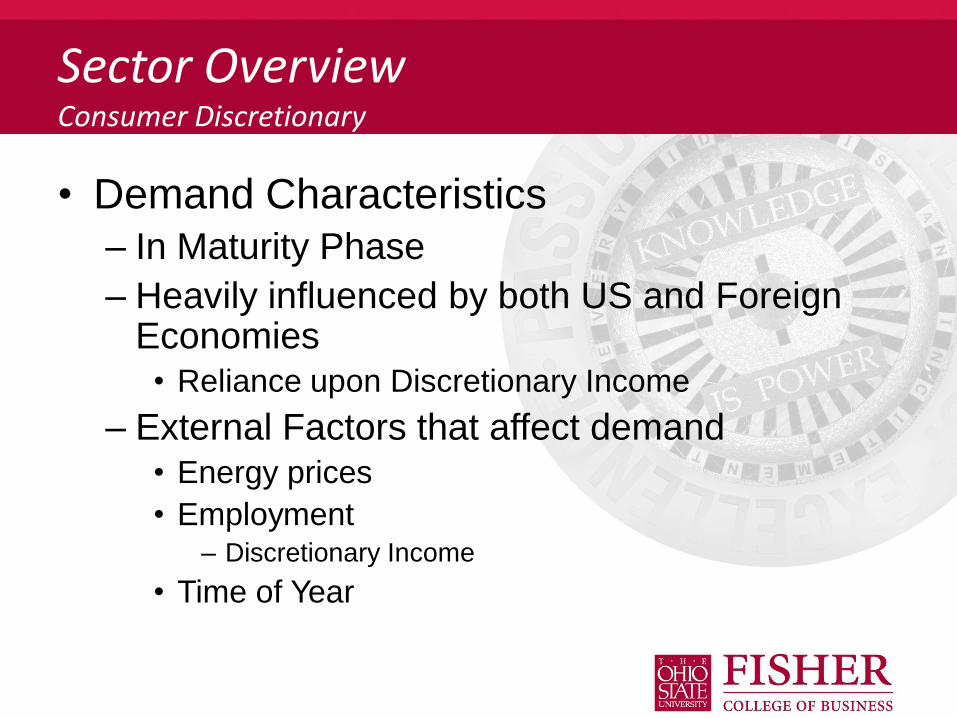
Sector OverviewConsumer Discretionary
• Demand Characteristics
– In Maturity Phase
– Heavily influenced by both US and Foreign Economies• Reliance upon Discretionary Income
– External Factors that affect demand• Energy prices
• Employment– Discretionary Income
• Time of Year

Sector OverviewConsumer Discretionary
• Supply Characteristics
– Forecasted
– Externally Driven
• Development of new products
– Expansion
• New Markets
– Domestically and Abroad
– Branch Openings

• 10.58% of S&P 500
• Industries include:
Sector Breakdown

Sector Breakdown
Industry Index Value % of Sector
Cable & Satellite 111.11 9.84%
Home Improvement Retail 339.74 7.8%
Movies & Entertainment 145.26 13.88%
Restaurants 598.91 11.66%
Internet Retail 760.97 7.27%
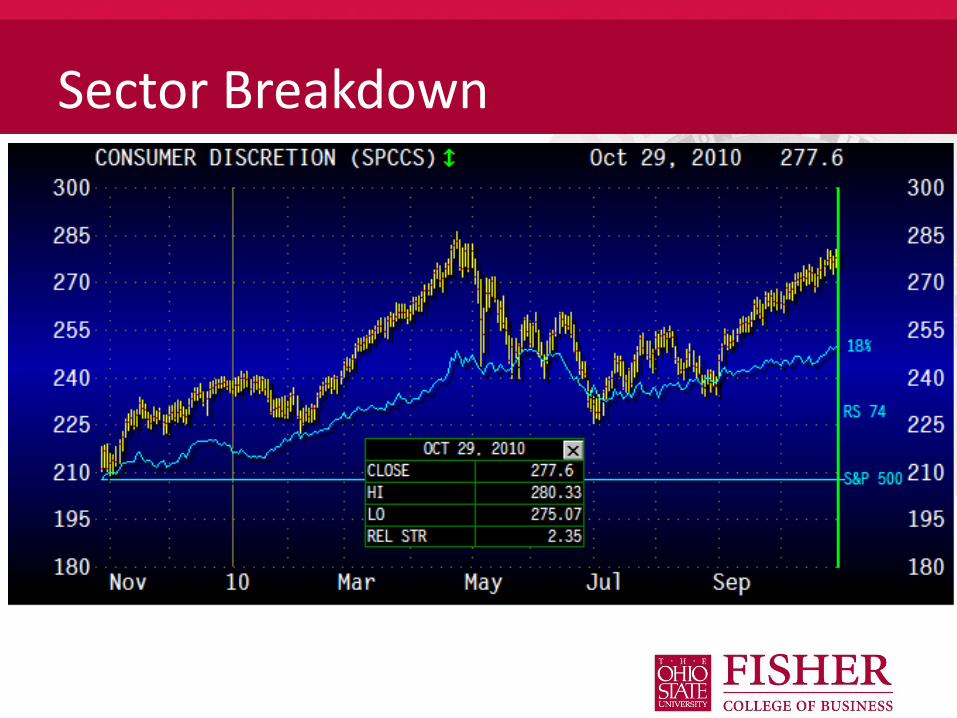
Sector Breakdown

Sector Breakdown
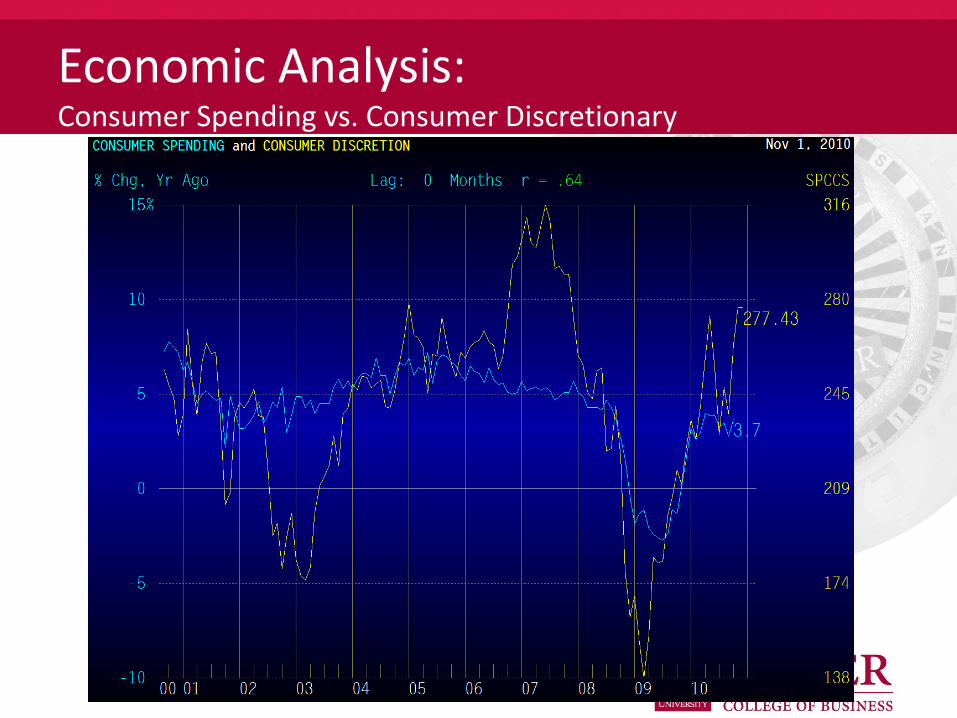
Economic Analysis:Consumer Spending vs. Consumer Discretionary
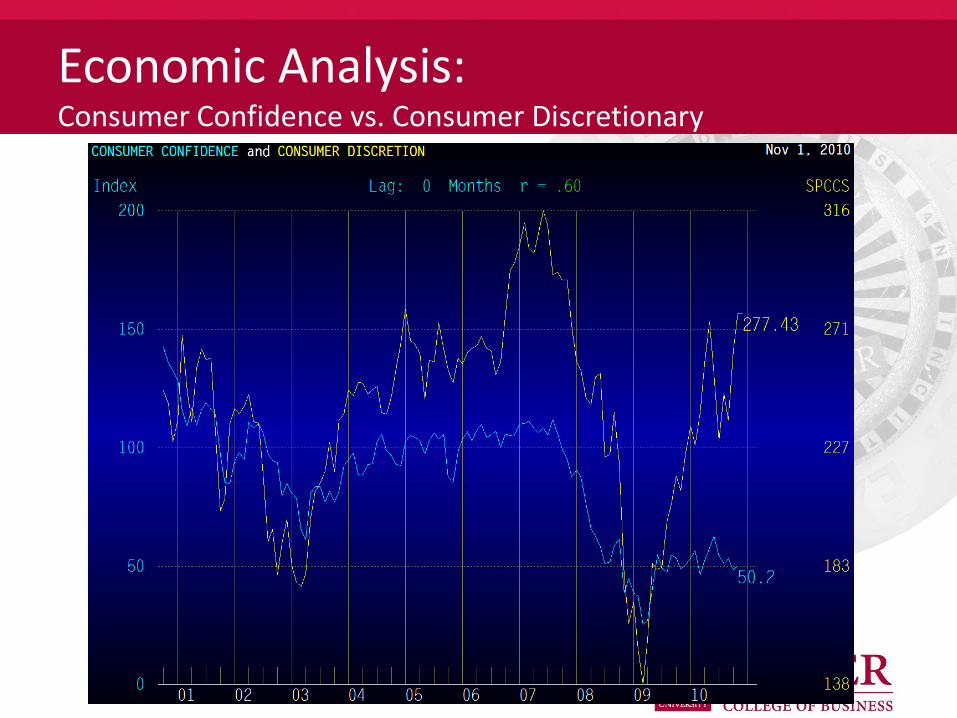
Economic Analysis:Consumer Confidence vs. Consumer Discretionary

Economic Analysis:Unemployment vs. Consumer Discretionary

Porters 5 Forces:Entry Threshold For the Consumer Discretionary
• High capital expenditures in certain industries
– i.e Carnival Corporation and Royal Caribbean Cruise Line
• Intense competition in certain industries
– i.e the restaurant section. Mom and pop restaurants and McDonald are existing together.

Porters 5 Forces:Numerous Substituting Products & Competition
• Some businesses offer similar products or even homogenous products
– i.e Comcast / Time Warner
• For businesses such as Comcast, price seems the most important factor to the business

Porter’s 5 Forces:Intense Competition
• Competition is quite intense!
• There are numerous rivalries in each business field
• Companies in this sector need to have high competitive advantages in order to achieve superior performance

Porter’s 5 Forces:Suppliers Power & Buyer’s Power
• The Suppliers’ Power to this business sector is weak with multiple vendors and distribution lines , except the cruise line and cable satellite business
• Buyers’ Power is significant. Buyers’ power is highly correlated to the following Economic indicators
1. Employment Rate
2. Personal Saving rate (negative related)
3. Consumer Spending Rate
4. Crude Oil Price
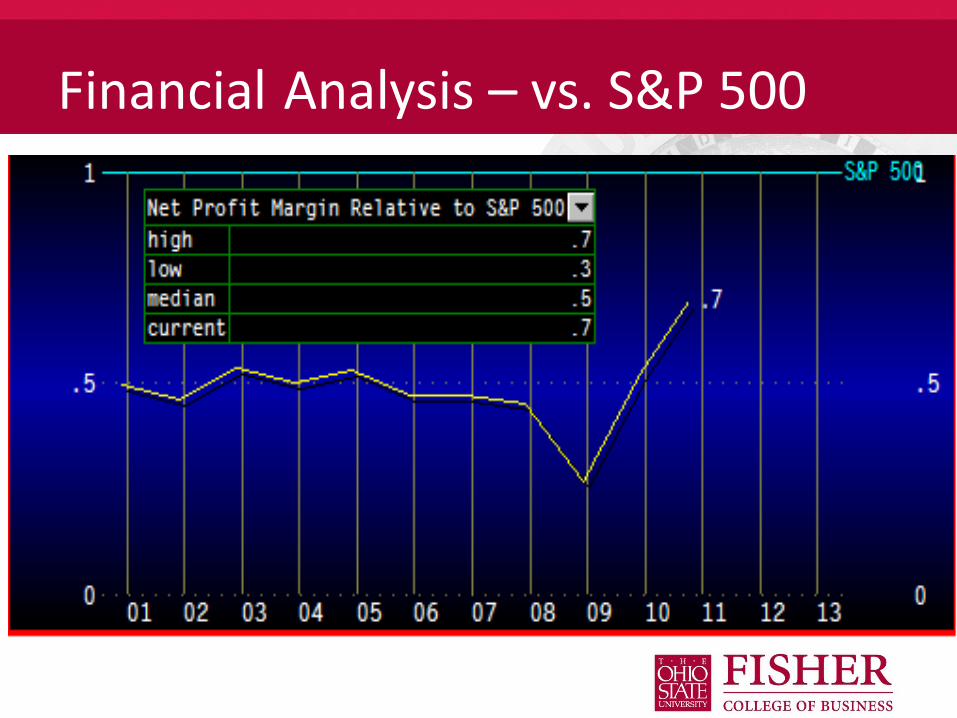
Financial Analysis – vs. S&P 500

Financial Analysis – vs. S&P 500

Financial Analysis – vs. S&P 500
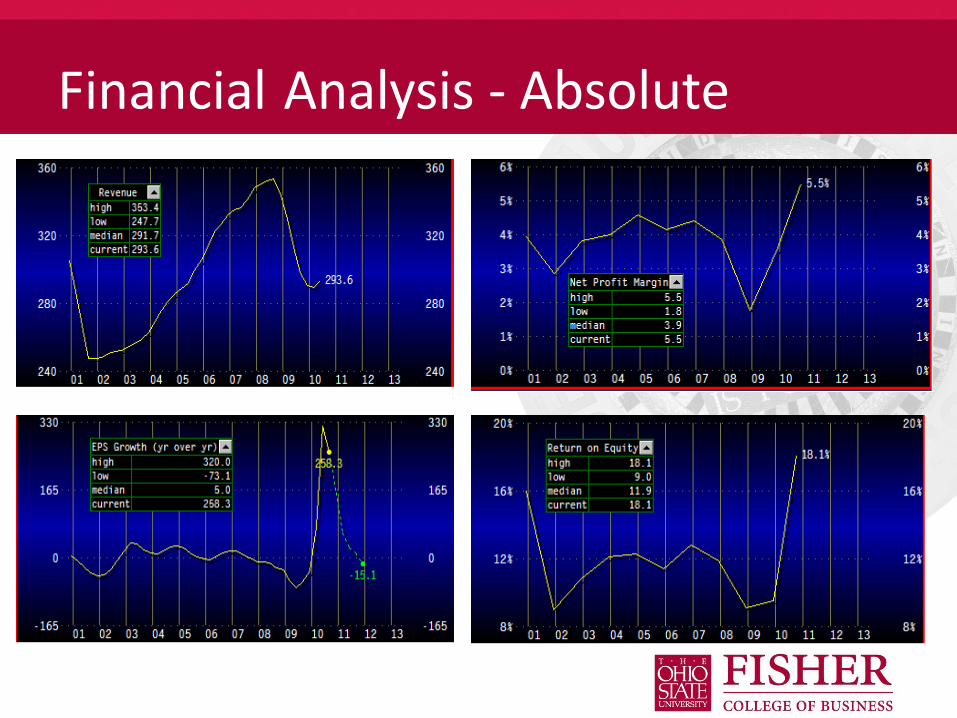
Financial Analysis - Absolute
Revenue
EPS Growth yr. over yr.
Net Profit Margins (relative to S&P 500)
EPS Growth yr. over yr. (relative to S&P 500)

Financial AnalysisIndustry Ticker Price YTD Performance 5 Yr. Performance EPS - 5 Yr. Hist. Growth
Cable & Satellite
Comcast CMCSA $
20.62 21.8% 13.4% 27%
Direct TV DTV $
43.85 31.5% 210.2% 28%
Home Improvement Retail
Home Depot HD $
31.18 7.8% -23.0% -13%
Lowes LOW $
21.46 -8.2% -28.5% -10%
Movies & Entertainment
Disney DIS $
36.30 4.1% 53.3% 8%
Dreamworks DWA $
36.42 -8.8% 42.0% 11%
Restaurants
Bob Evans BOBE $
28.98 0.1% 31.7% 16%
McDonald's MCD $
78.46 15.44% 140.0% 18%
Internet Retail
Amazon AMZN $
163.12 21.3% -1.3% 35%
$

0.00%
5.00%
10.00%
15.00%
20.00%
25.00%
9.58%
6.27%4.39% 3.87%
10.54%
18.34%
6.47%
20.65%
3.64%
7.19%
0.00%
10.00%
20.00%
30.00%
40.00%
50.00%
60.00%
70.00%
8.30%
47.42%
15.06%9.74% 11.14%11.37% 10.62%
0.00%
22.44%
68.21%
Financial Analysis
Profit Margin
Return on Equity

Valuation Analysis – vs. S&P 500

Valuation AnalysisIndustry Ticker P/E - Forward P/B P/S P/CF
Cable & Satellite 15.3 2.1 1.4 6.2
Comcast CMCSA 14.6 1.3 1.53 5.8
Direct TV DTV 15.9 13.6 1.64 8.8
Home Improvement Retail 14.6 2.0 .73 9.8
Home Depot HD 15.2 2.5 0.77 10.7
Lowes LOW 13.8 1.5 0.62 8.5
Movies & Entertainment 14.3 1.6 1.46 8.1
Disney DIS 15.8 1.9 1.8 12.2
Dreamworks DWA 15.5 2.6 4.24 9.4
Restaurants 17.2 6.5 2.59 13.7
Bob Evans BOBE 13.2 1.4 0.51 5.7
McDonald's MCD 15.8 5.9 3.46 14.1
Internet Retail 41.1 10.8 2.28 43.6
Amazon AMZN 56.2 13.3 2.44 66.0
Netflix NFLX 49.2 63.6 4.65 21.4

Valuation Analysis
Forward P/E
0
10
20
30
40
50
60
70
1.3
13.6
2.5 1.5 1.9 2.6 1.45.9
13.3
63.6
0
10
20
30
40
50
60
14.6 15.9 15.2 13.8 15.8 15.5 13.215.8
56.2
49.2Forward P/E Sector – 15.3
P/BSector – 2.8
00.5
11.5
22.5
33.5
44.5
5
1.53 1.64
0.77 0.62
1.8
4.24
0.51
3.46
2.44
4.65
P/SSector – .9
0
10
20
30
40
50
60
70
5.88.8 10.7 8.5
12.2 9.45.7
14.1
66
21.4
Price C/F Sector – 43.6
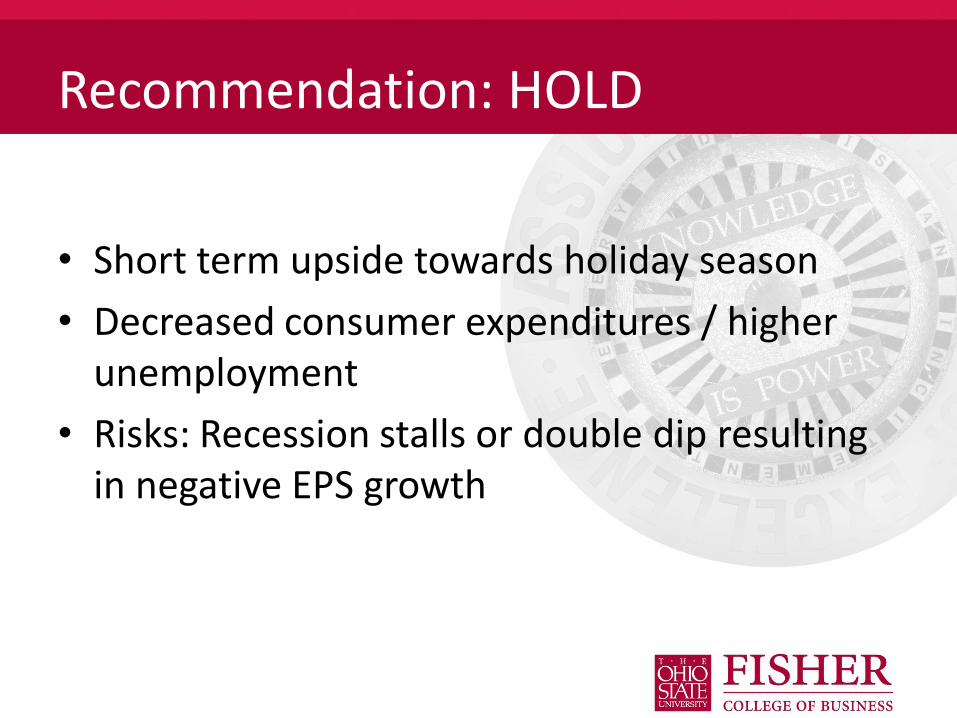
Recommendation: HOLD
• Short term upside towards holiday season
• Decreased consumer expenditures / higher unemployment
• Risks: Recession stalls or double dip resulting in negative EPS growth
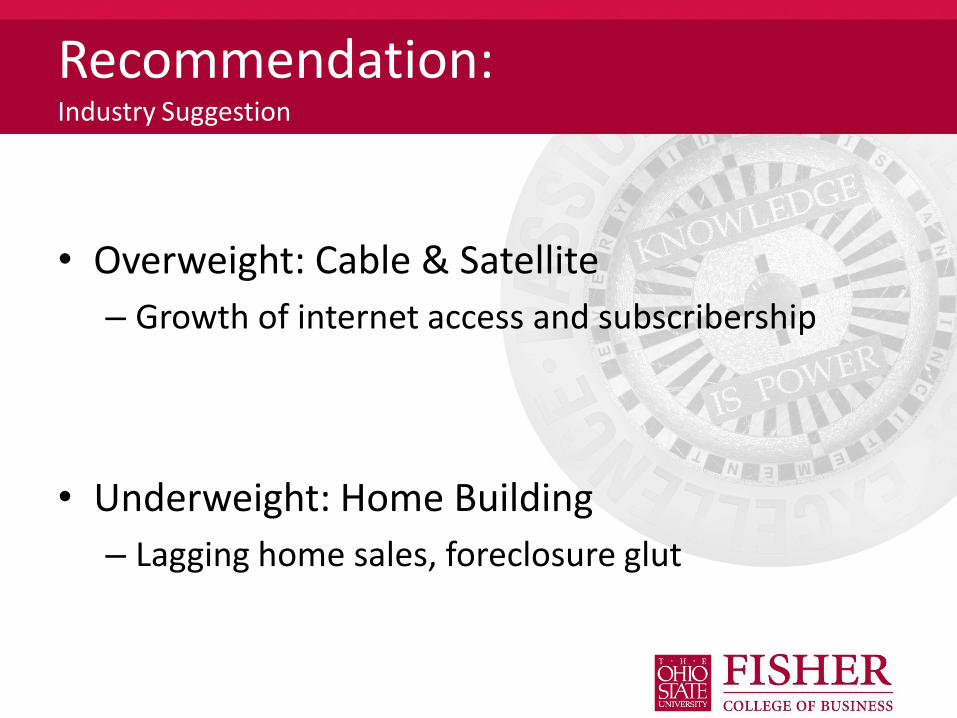
Recommendation:Industry Suggestion
• Overweight: Cable & Satellite
– Growth of internet access and subscribership
• Underweight: Home Building
– Lagging home sales, foreclosure glut