Embed Size (px)
Citation preview
High revenues and unit
sales
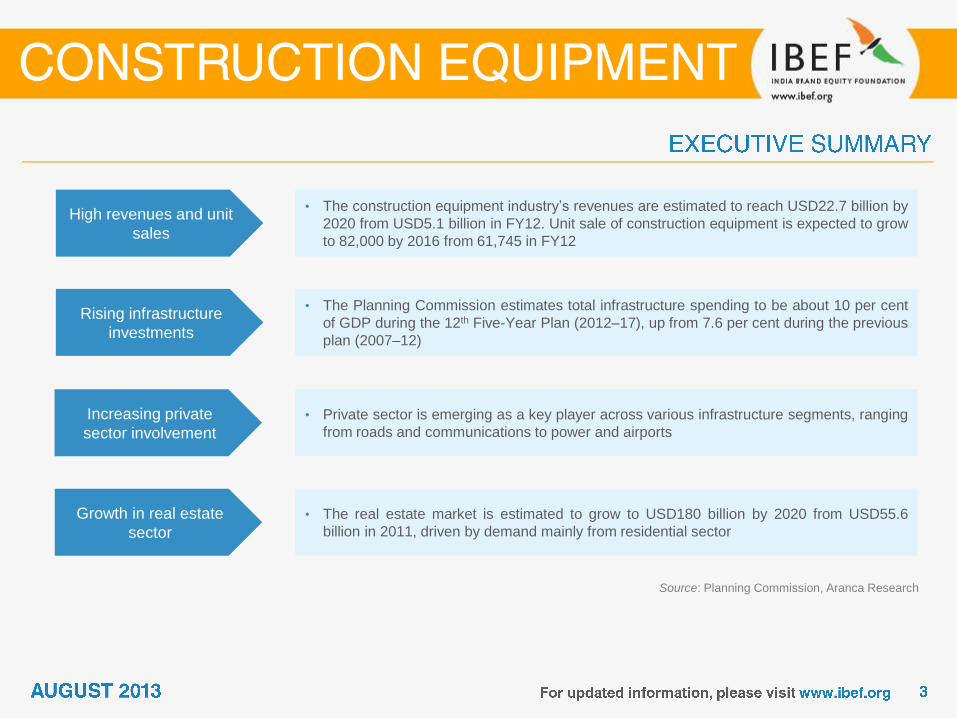
• The construction equipment industry’s revenues are estimated to reach USD22.7 billion by
2020 from USD5.1 billion in FY12. Unit sale of construction equipment is expected to grow
to 82,000 by 2016 from 61,745 in FY12
Rising infrastructure
investments
• The Planning Commission estimates total infrastructure spending to be about 10 per cent
of GDP during the 12th Five-Year Plan (2012–17), up from 7.6 per cent during the previous
plan (2007–12)
Increasing private
sector involvement
• Private sector is emerging as a key player across various infrastructure segments, ranging
from roads and communications to power and airports
Growth in real estate
sector
• The real estate market is estimated to grow to USD180 billion by 2020 from USD55.6
billion in 2011, driven by demand mainly from residential sector
Source: Planning Commission, Aranca Research
• The engineering sector is delicensed; 100 per cent FDI is allowed in the sector
• Due to policy support, there was cumulative FDI of USD14.0 billion into the sector over April 2000 – February 2012, making up 8.6 per cent of total FDI into the country in that period
Growing demand
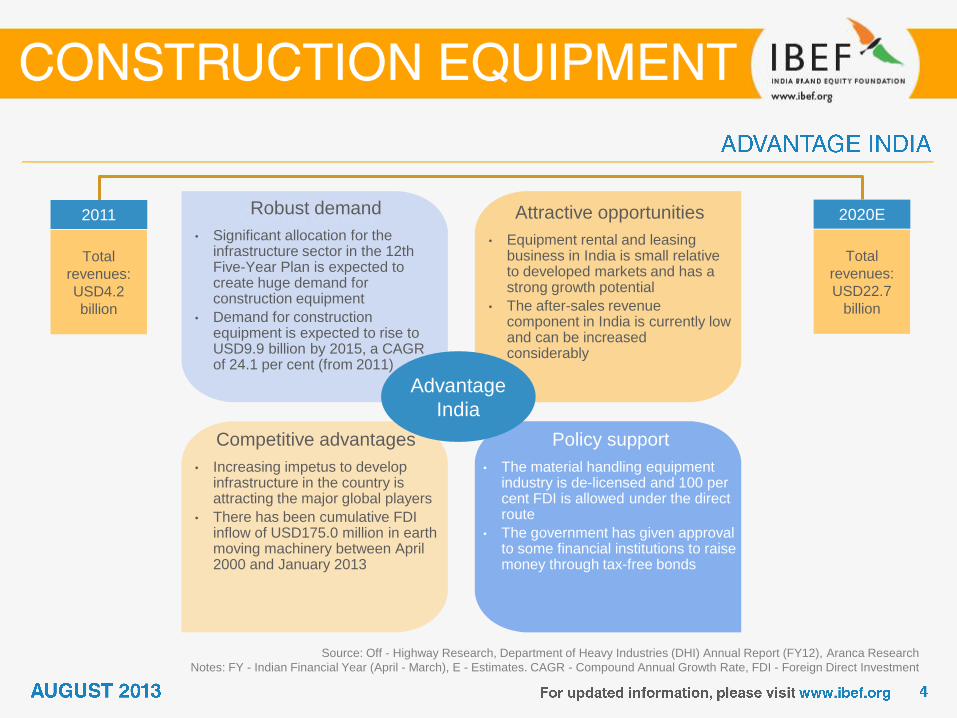
Source: Off - Highway Research, Department of Heavy Industries (DHI) Annual Report (FY12), Aranca Research
Notes: FY - Indian Financial Year (April - March), E - Estimates. CAGR - Compound Annual Growth Rate, FDI - Foreign Direct Investment
Robust demand
• Significant allocation for the infrastructure sector in the 12th Five-Year Plan is expected to create huge demand for construction equipment
• Demand for construction equipment is expected to rise to USD9.9 billion by 2015, a CAGR of 24.1 per cent (from 2011)
Attractive opportunities
• Equipment rental and leasing business in India is small relative to developed markets and has a strong growth potential
• The after-sales revenue component in India is currently low and can be increased considerably
Policy support
• The material handling equipment industry is de-licensed and 100 per cent FDI is allowed under the direct route
• The government has given approval to some financial institutions to raise money through tax-free bonds
Competitive advantages
• Increasing impetus to develop infrastructure in the country is attracting the major global players
• There has been cumulative FDI inflow of USD175.0 million in earth moving machinery between April 2000 and January 2013
2011
Total
revenues:
USD4.2
billion
2020E
Total
revenues:
USD22.7
billion
Advantage
India
Source: Department of Heavy Industry (DHI),
Aranca Research
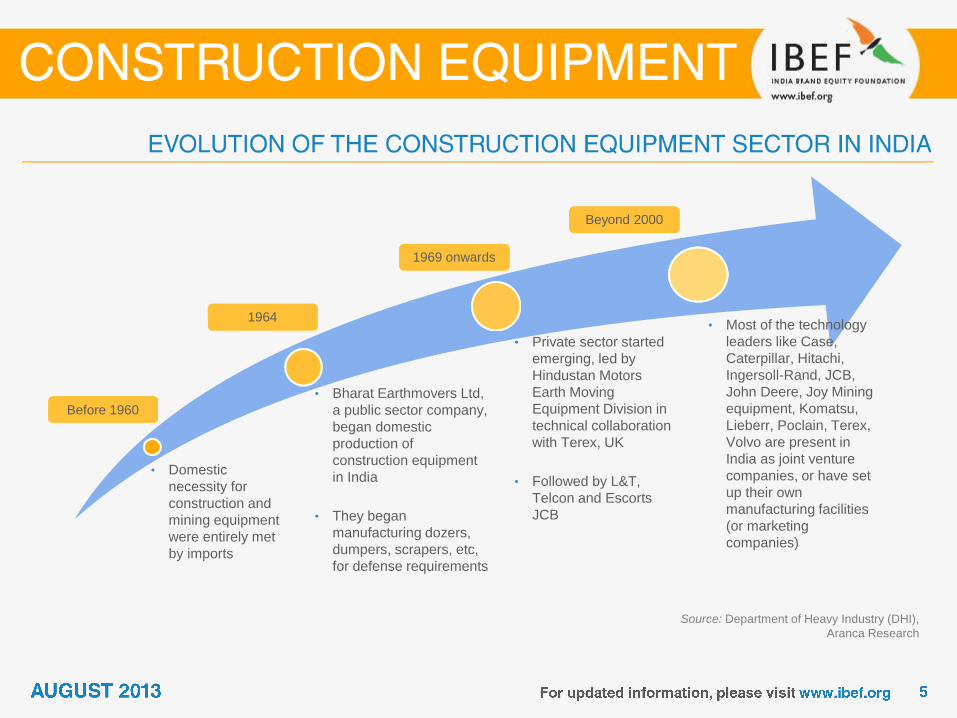
• Domestic
necessity for
construction and
mining equipment
were entirely met
by imports
• Bharat Earthmovers Ltd,
a public sector company,
began domestic
production of
construction equipment
in India
• They began
manufacturing dozers,
dumpers, scrapers, etc,
for defense requirements
• Private sector started
emerging, led by
Hindustan Motors
Earth Moving
Equipment Division in
technical collaboration
with Terex, UK
• Followed by L&T,
Telcon and Escorts
JCB
• Most of the technology
leaders like Case,
Caterpillar, Hitachi,
Ingersoll-Rand, JCB,
John Deere, Joy Mining
equipment, Komatsu,
Lieberr, Poclain, Terex,
Volvo are present in
India as joint venture
companies, or have set
up their own
manufacturing facilities
(or marketing
companies)
Before 1960
1964
1969 onwards
Beyond 2000
Source: Department of Heavy Industry (DHI),
Aranca Research
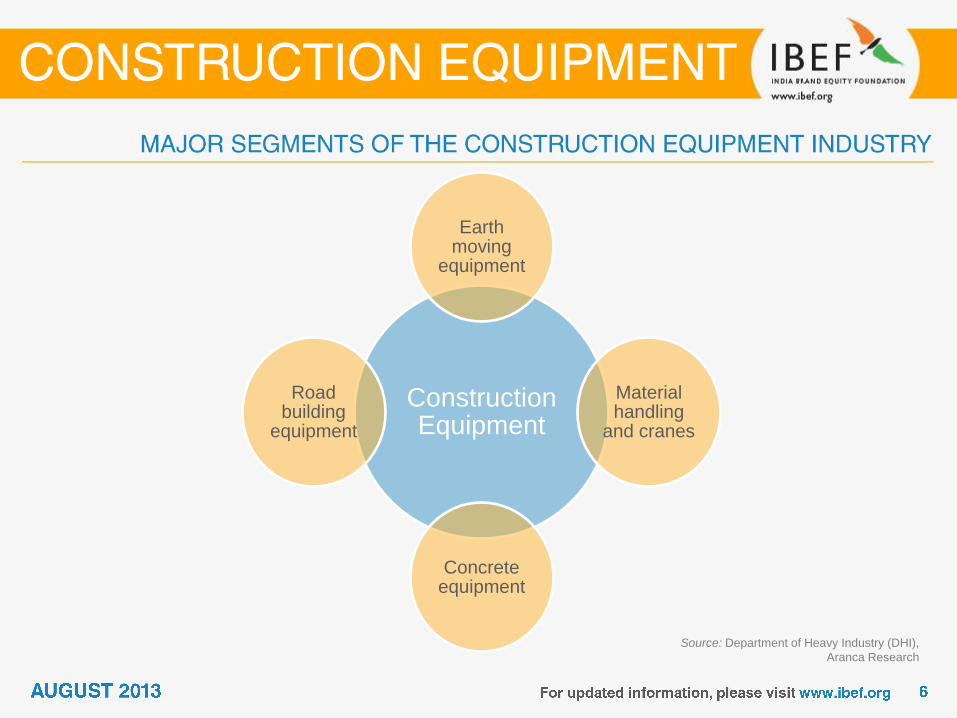
Construction Equipment
Earth moving
equipment
Material handling
and cranes
Concrete equipment
Road building
equipment
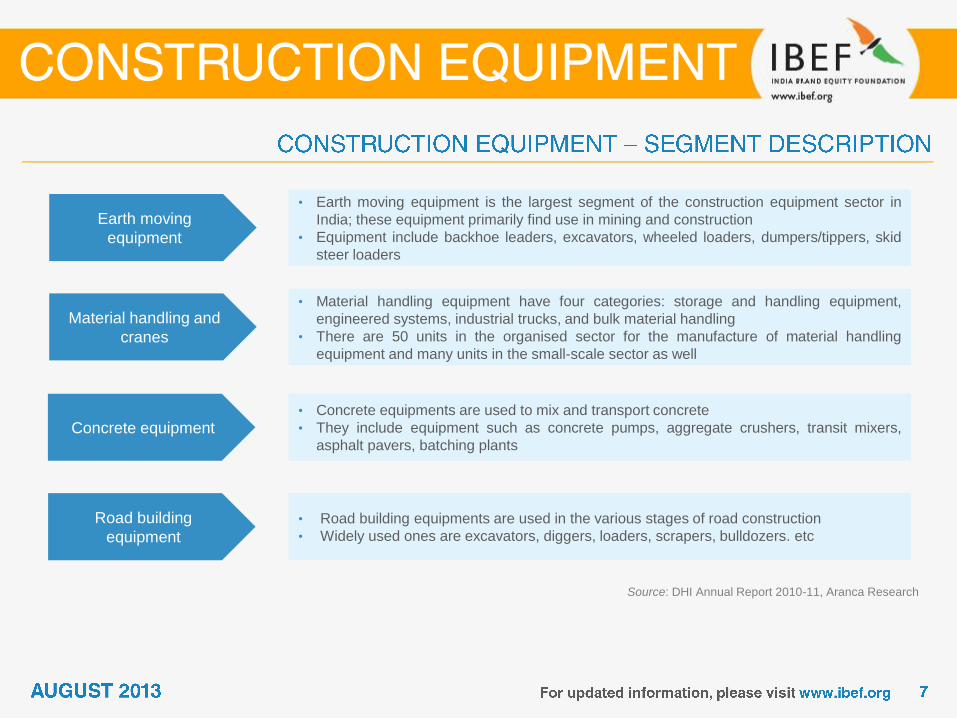
Earth moving
equipment
• Earth moving equipment is the largest segment of the construction equipment sector in
India; these equipment primarily find use in mining and construction
• Equipment include backhoe leaders, excavators, wheeled loaders, dumpers/tippers, skid
steer loaders
Material handling and
cranes
• Material handling equipment have four categories: storage and handling equipment,
engineered systems, industrial trucks, and bulk material handling
• There are 50 units in the organised sector for the manufacture of material handling
equipment and many units in the small-scale sector as well
Concrete equipment • Concrete equipments are used to mix and transport concrete
• They include equipment such as concrete pumps, aggregate crushers, transit mixers,
asphalt pavers, batching plants
Road building
equipment
• Road building equipments are used in the various stages of road construction
• Widely used ones are excavators, diggers, loaders, scrapers, bulldozers. etc
Source: DHI Annual Report 2010-11, Aranca Research
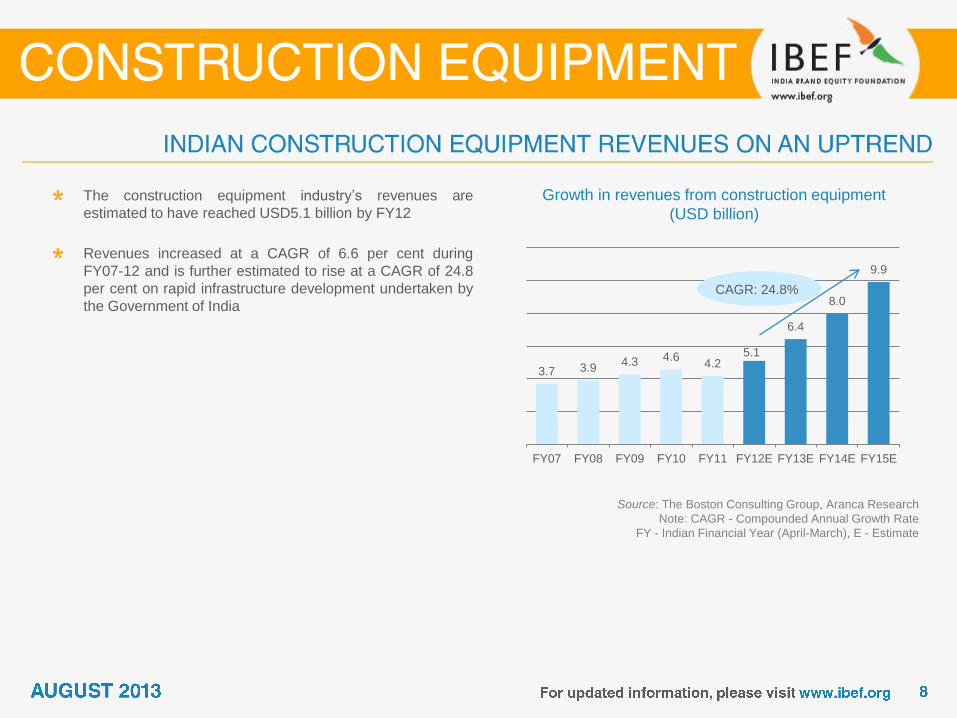
Growth in revenues from construction equipment
(USD billion)
Source: The Boston Consulting Group, Aranca Research
Note: CAGR - Compounded Annual Growth Rate
FY - Indian Financial Year (April-March), E - Estimate
The construction equipment industry’s revenues are
estimated to have reached USD5.1 billion by FY12
Revenues increased at a CAGR of 6.6 per cent during
FY07-12 and is further estimated to rise at a CAGR of 24.8
per cent on rapid infrastructure development undertaken by
the Government of India
3.7 3.9 4.3 4.6
4.2 5.1
6.4
8.0
9.9
FY07 FY08 FY09 FY10 FY11 FY12E FY13E FY14E FY15E
CAGR: 24.8%
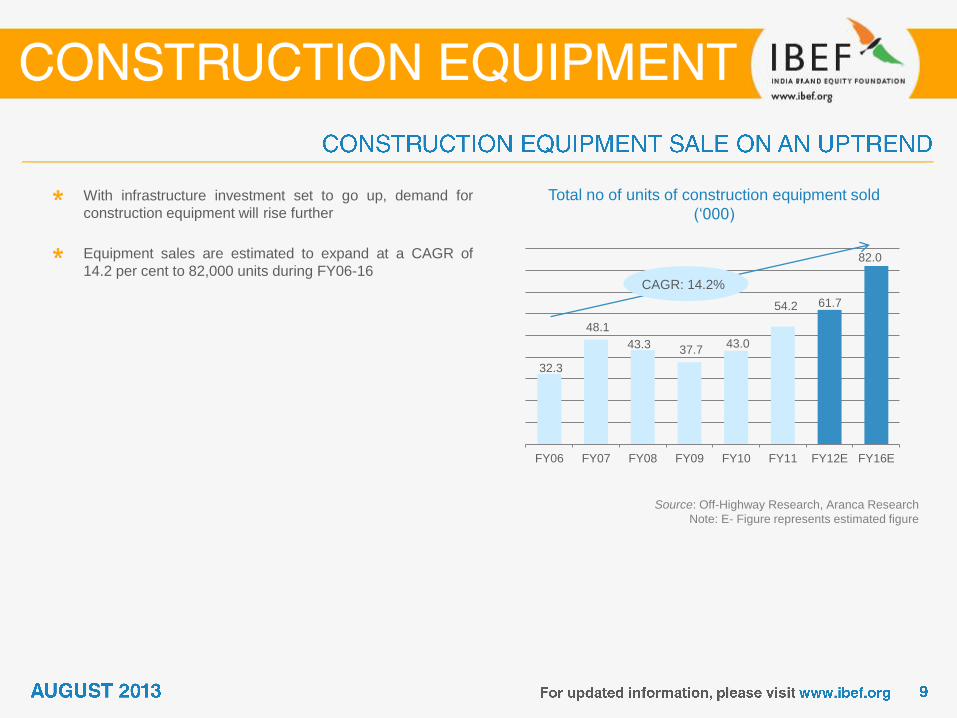
32.3
48.1
43.3 37.7 43.0
54.2 61.7
82.0
FY06 FY07 FY08 FY09 FY10 FY11 FY12E FY16E
Total no of units of construction equipment sold
(‘000)
Source: Off-Highway Research, Aranca Research
Note: E- Figure represents estimated figure
With infrastructure investment set to go up, demand for
construction equipment will rise further
Equipment sales are estimated to expand at a CAGR of
14.2 per cent to 82,000 units during FY06-16 CAGR: 14.2%
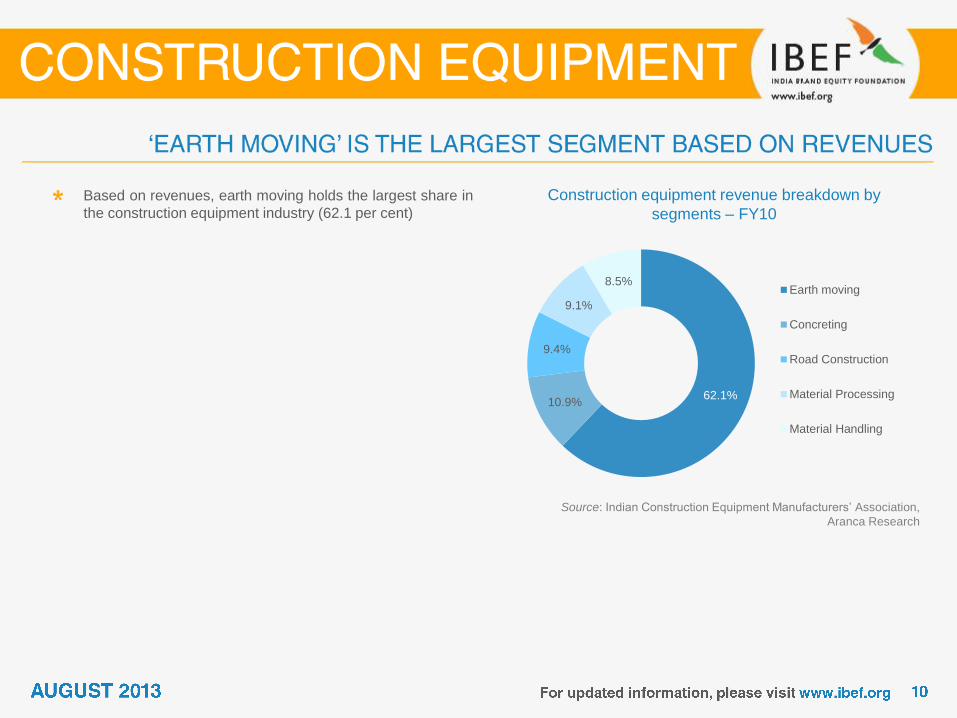
Construction equipment revenue breakdown by
segments – FY10
Source: Indian Construction Equipment Manufacturers’ Association,
Aranca Research
Based on revenues, earth moving holds the largest share in
the construction equipment industry (62.1 per cent)
62.1% 10.9%
9.4%
9.1%
8.5% Earth moving
Concreting
Road Construction
Material Processing
Material Handling
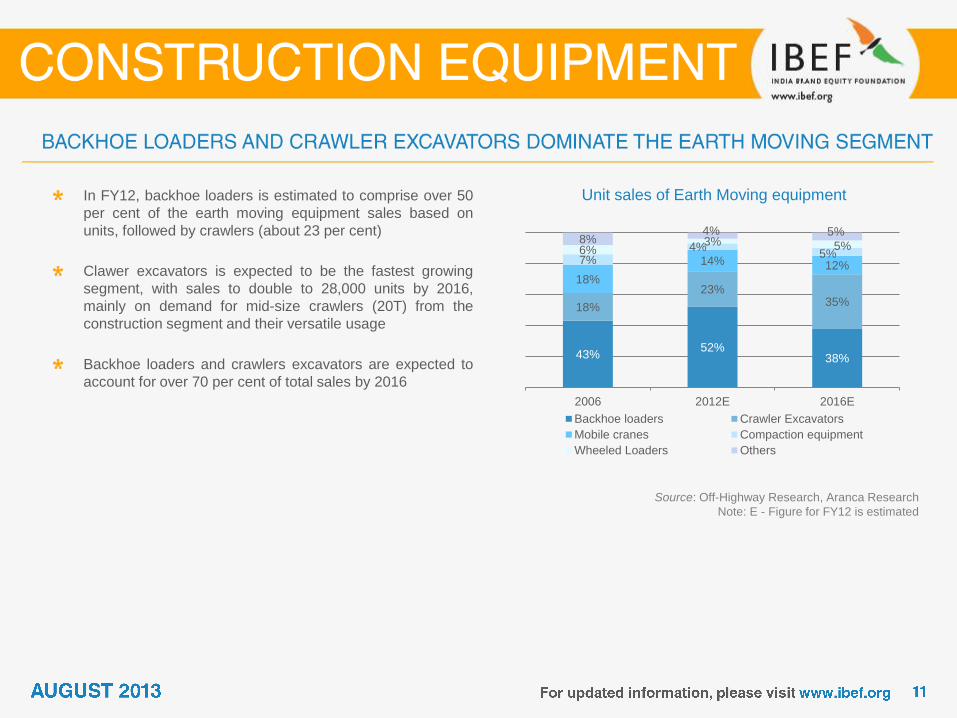
Unit sales of Earth Moving equipment
Source: Off-Highway Research, Aranca Research
Note: E - Figure for FY12 is estimated
In FY12, backhoe loaders is estimated to comprise over 50
per cent of the earth moving equipment sales based on
units, followed by crawlers (about 23 per cent)
Clawer excavators is expected to be the fastest growing
segment, with sales to double to 28,000 units by 2016,
mainly on demand for mid-size crawlers (20T) from the
construction segment and their versatile usage
Backhoe loaders and crawlers excavators are expected to
account for over 70 per cent of total sales by 2016
43% 52%
38%
18%
23% 35%
18%
14% 12% 7% 4%
5% 6% 3% 5%
8% 4% 5%
2006 2012E 2016E
Backhoe loaders Crawler Excavators
Mobile cranes Compaction equipment
Wheeled Loaders Others
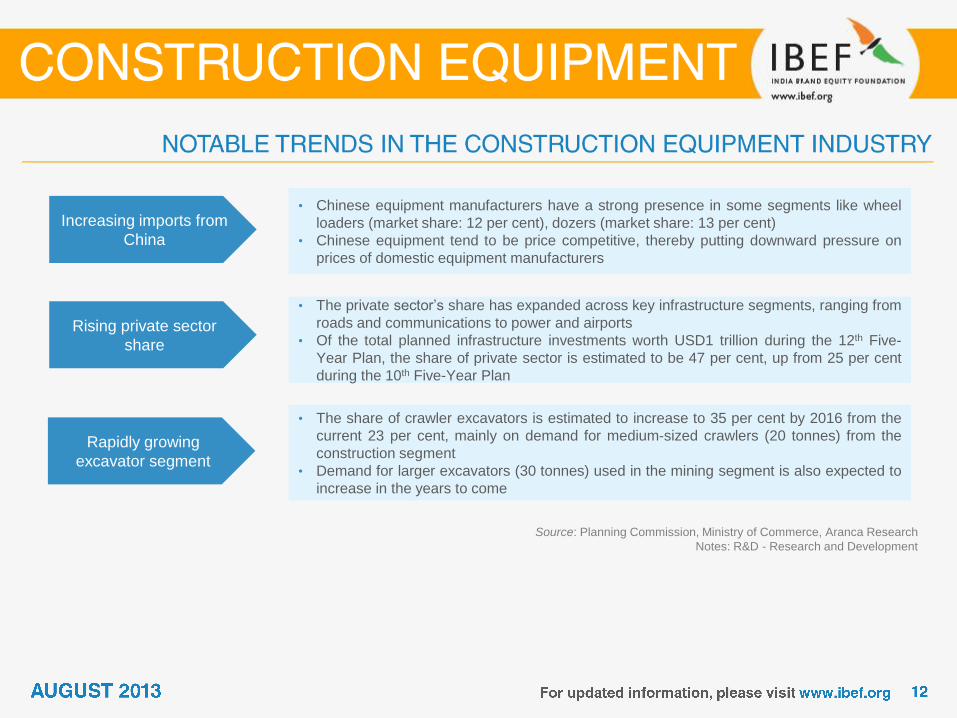
Increasing imports from
China
• Chinese equipment manufacturers have a strong presence in some segments like wheel
loaders (market share: 12 per cent), dozers (market share: 13 per cent)
• Chinese equipment tend to be price competitive, thereby putting downward pressure on
prices of domestic equipment manufacturers
Rising private sector
share
• The private sector’s share has expanded across key infrastructure segments, ranging from
roads and communications to power and airports
• Of the total planned infrastructure investments worth USD1 trillion during the 12th Five-
Year Plan, the share of private sector is estimated to be 47 per cent, up from 25 per cent
during the 10th Five-Year Plan
Rapidly growing
excavator segment
• The share of crawler excavators is estimated to increase to 35 per cent by 2016 from the
current 23 per cent, mainly on demand for medium-sized crawlers (20 tonnes) from the
construction segment
• Demand for larger excavators (30 tonnes) used in the mining segment is also expected to
increase in the years to come
Source: Planning Commission, Ministry of Commerce, Aranca Research
Notes: R&D - Research and Development
Source: DHI Annual Report 2010-11, Aranca Research
Notes: R&D - Research and Development
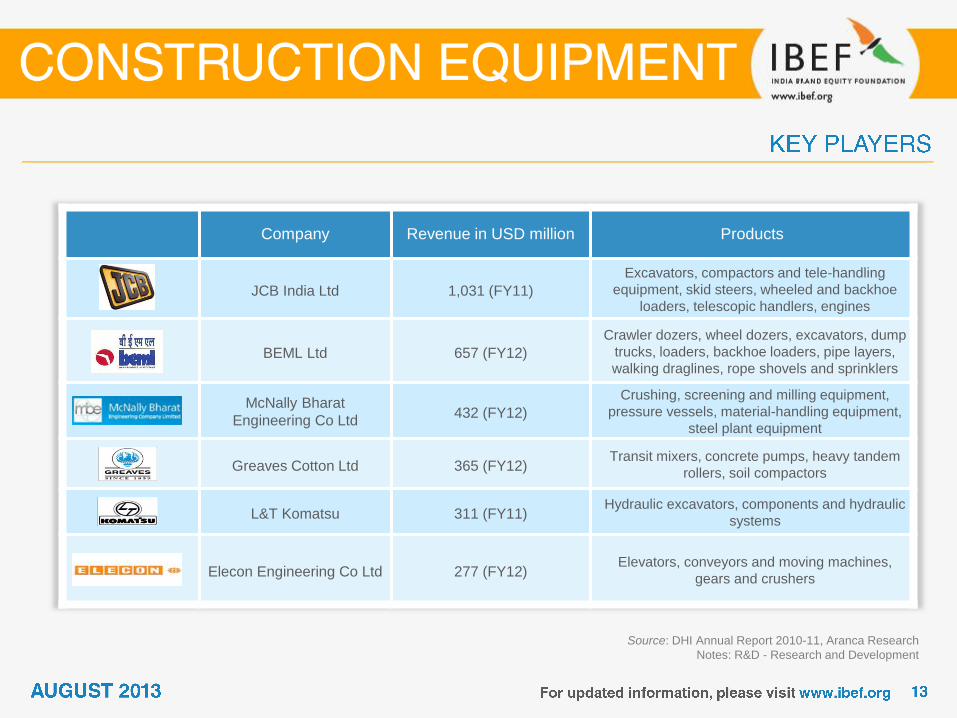
Company Revenue in USD million Products
JCB India Ltd 1,031 (FY11)
Excavators, compactors and tele-handling
equipment, skid steers, wheeled and backhoe
loaders, telescopic handlers, engines
BEML Ltd 657 (FY12)
Crawler dozers, wheel dozers, excavators, dump
trucks, loaders, backhoe loaders, pipe layers,
walking draglines, rope shovels and sprinklers
McNally Bharat
Engineering Co Ltd 432 (FY12)
Crushing, screening and milling equipment,
pressure vessels, material-handling equipment,
steel plant equipment
Greaves Cotton Ltd 365 (FY12) Transit mixers, concrete pumps, heavy tandem
rollers, soil compactors
L&T Komatsu 311 (FY11) Hydraulic excavators, components and hydraulic
systems
Elecon Engineering Co Ltd 277 (FY12) Elevators, conveyors and moving machines,
gears and crushers
Source: Planning Commission, Aranca Research
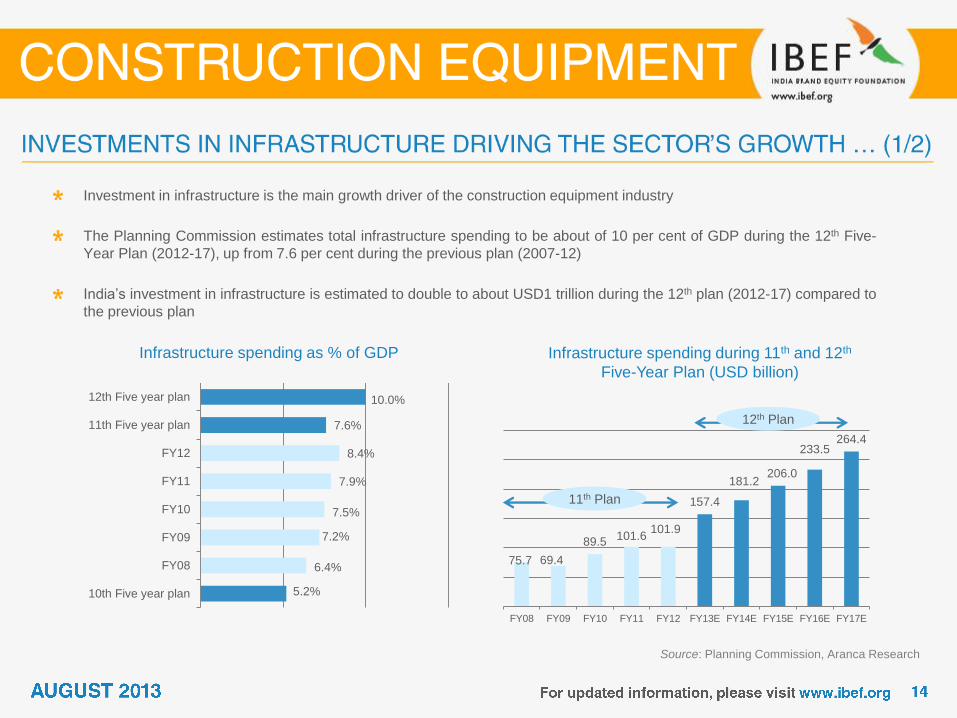
Investment in infrastructure is the main growth driver of the construction equipment industry
The Planning Commission estimates total infrastructure spending to be about of 10 per cent of GDP during the 12th Five-
Year Plan (2012-17), up from 7.6 per cent during the previous plan (2007-12)
India’s investment in infrastructure is estimated to double to about USD1 trillion during the 12th plan (2012-17) compared to
the previous plan
Infrastructure spending as % of GDP Infrastructure spending during 11th and 12th
Five-Year Plan (USD billion)
75.7 69.4
89.5 101.6
101.9
157.4
181.2 206.0
233.5 264.4
FY08 FY09 FY10 FY11 FY12 FY13E FY14E FY15E FY16E FY17E
5.2%
6.4%
7.2%
7.5%
7.9%
8.4%
7.6%
10.0%
10th Five year plan
FY08
FY09
FY10
FY11
FY12
11th Five year plan
12th Five year plan
12th Plan
11th Plan
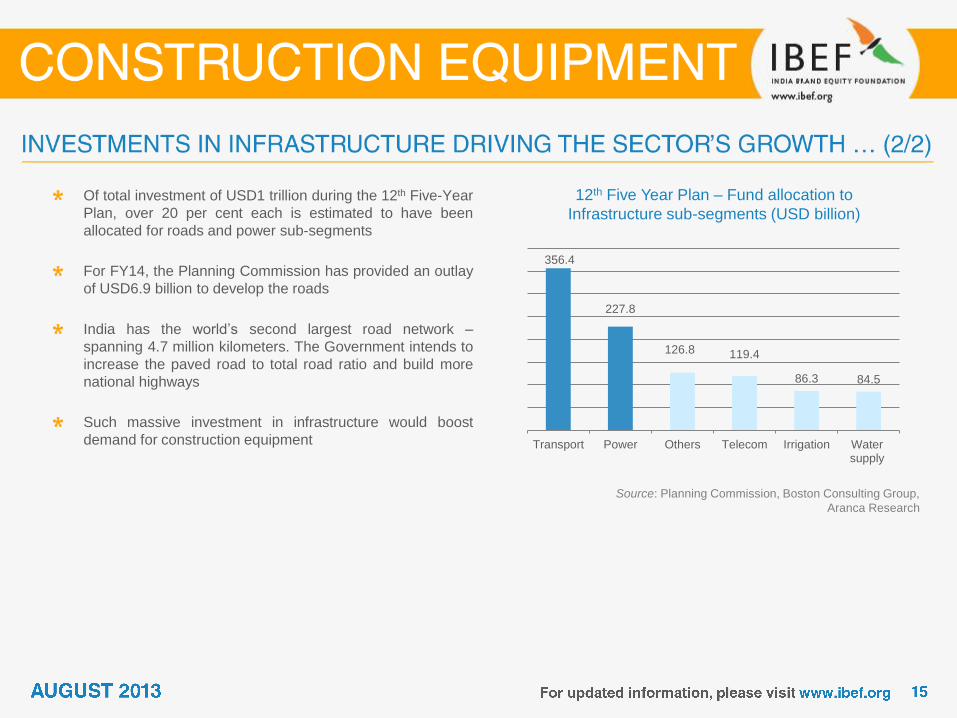
12th Five Year Plan – Fund allocation to
Infrastructure sub-segments (USD billion)
Source: Planning Commission, Boston Consulting Group,
Aranca Research
Of total investment of USD1 trillion during the 12th Five-Year
Plan, over 20 per cent each is estimated to have been
allocated for roads and power sub-segments
For FY14, the Planning Commission has provided an outlay
of USD6.9 billion to develop the roads
India has the world’s second largest road network –
spanning 4.7 million kilometers. The Government intends to
increase the paved road to total road ratio and build more
national highways
Such massive investment in infrastructure would boost
demand for construction equipment
356.4
227.8
126.8 119.4
86.3 84.5
Transport Power Others Telecom Irrigation Watersupply
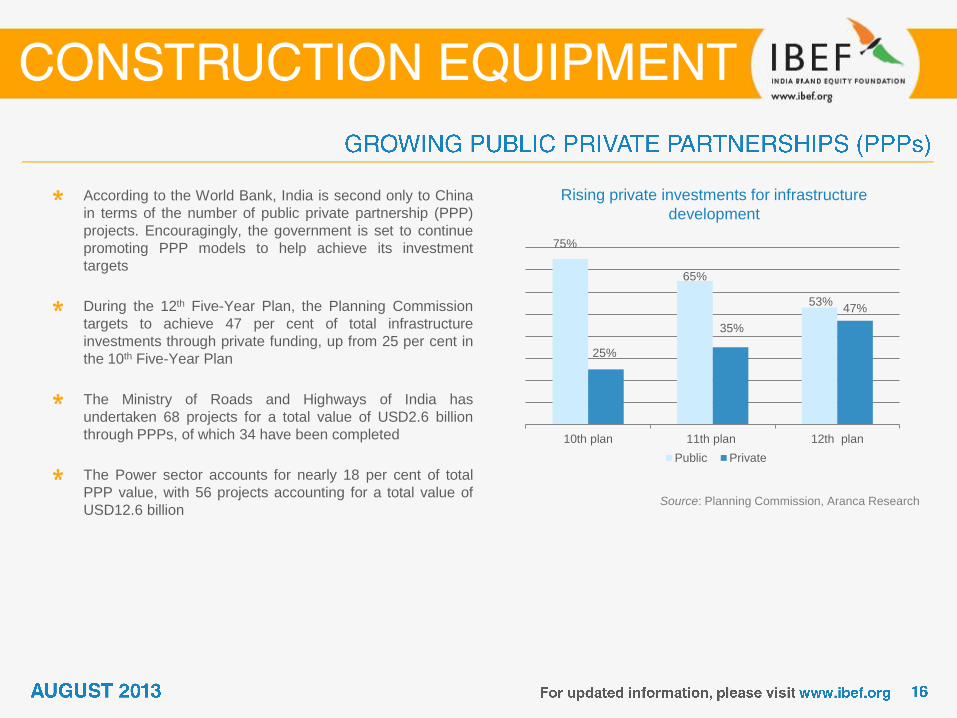
Rising private investments for infrastructure
development
Source: Planning Commission, Aranca Research
According to the World Bank, India is second only to China
in terms of the number of public private partnership (PPP)
projects. Encouragingly, the government is set to continue
promoting PPP models to help achieve its investment
targets
During the 12th Five-Year Plan, the Planning Commission
targets to achieve 47 per cent of total infrastructure
investments through private funding, up from 25 per cent in
the 10th Five-Year Plan
The Ministry of Roads and Highways of India has
undertaken 68 projects for a total value of USD2.6 billion
through PPPs, of which 34 have been completed
The Power sector accounts for nearly 18 per cent of total
PPP value, with 56 projects accounting for a total value of
USD12.6 billion
75%
65%
53%
25%
35%
47%
10th plan 11th plan 12th plan
Public Private
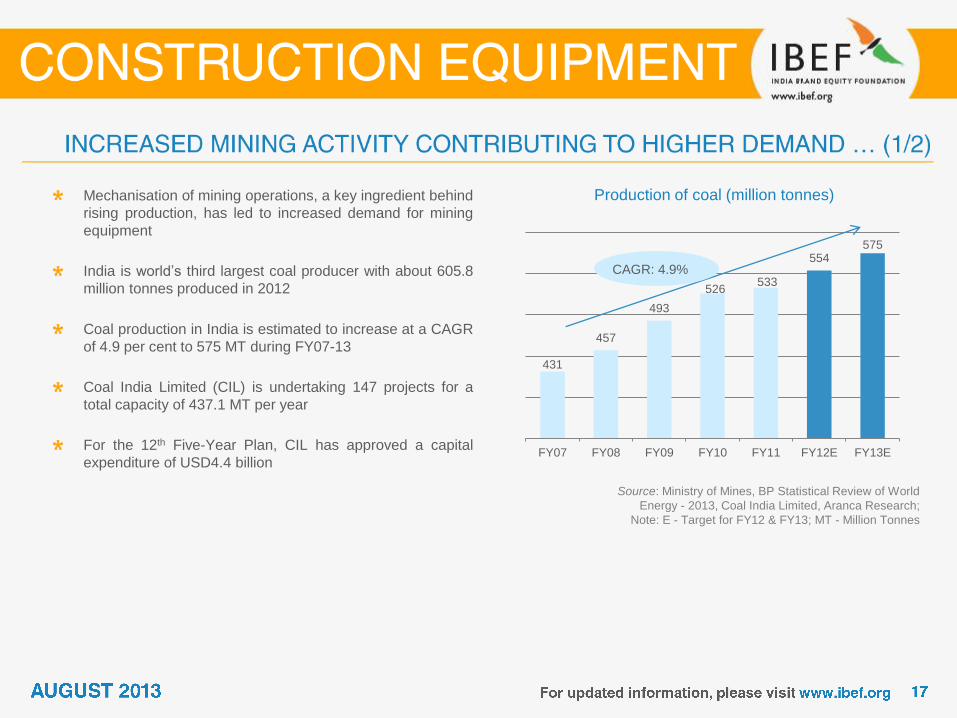
Production of coal (million tonnes)
Source: Ministry of Mines, BP Statistical Review of World
Energy - 2013, Coal India Limited, Aranca Research;
Note: E - Target for FY12 & FY13; MT - Million Tonnes
Mechanisation of mining operations, a key ingredient behind
rising production, has led to increased demand for mining
equipment
India is world’s third largest coal producer with about 605.8
million tonnes produced in 2012
Coal production in India is estimated to increase at a CAGR
of 4.9 per cent to 575 MT during FY07-13
Coal India Limited (CIL) is undertaking 147 projects for a
total capacity of 437.1 MT per year
For the 12th Five-Year Plan, CIL has approved a capital
expenditure of USD4.4 billion
431
457
493
526 533
554 575
FY07 FY08 FY09 FY10 FY11 FY12E FY13E
CAGR: 4.9%
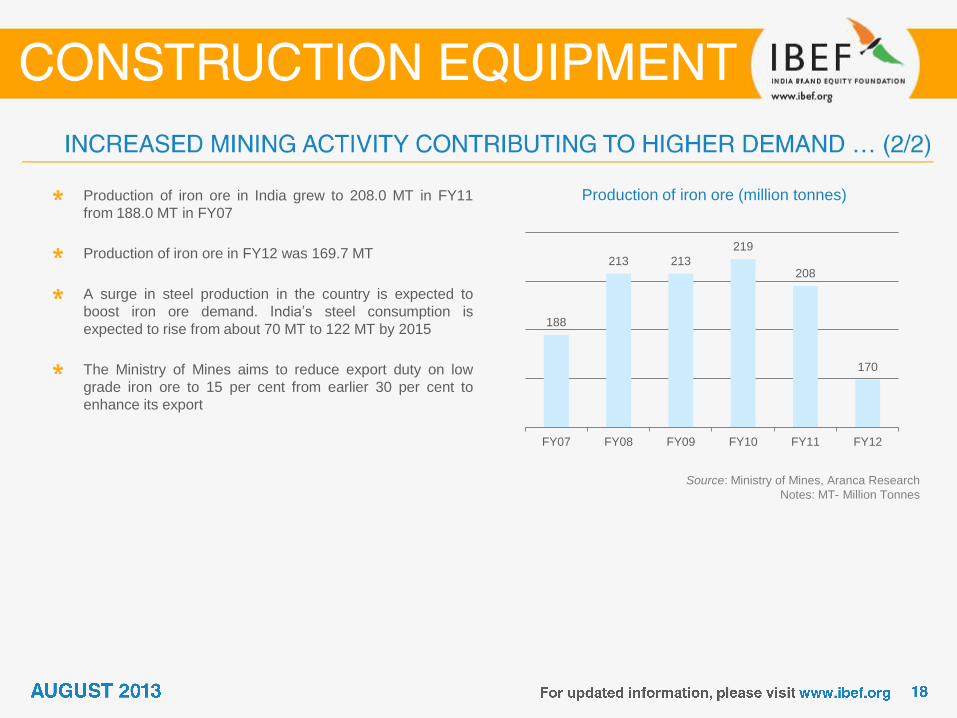
Production of iron ore (million tonnes)
Source: Ministry of Mines, Aranca Research
Notes: MT- Million Tonnes
Production of iron ore in India grew to 208.0 MT in FY11
from 188.0 MT in FY07
Production of iron ore in FY12 was 169.7 MT
A surge in steel production in the country is expected to
boost iron ore demand. India’s steel consumption is
expected to rise from about 70 MT to 122 MT by 2015
The Ministry of Mines aims to reduce export duty on low
grade iron ore to 15 per cent from earlier 30 per cent to
enhance its export
188
213 213
219
208
170
FY07 FY08 FY09 FY10 FY11 FY12
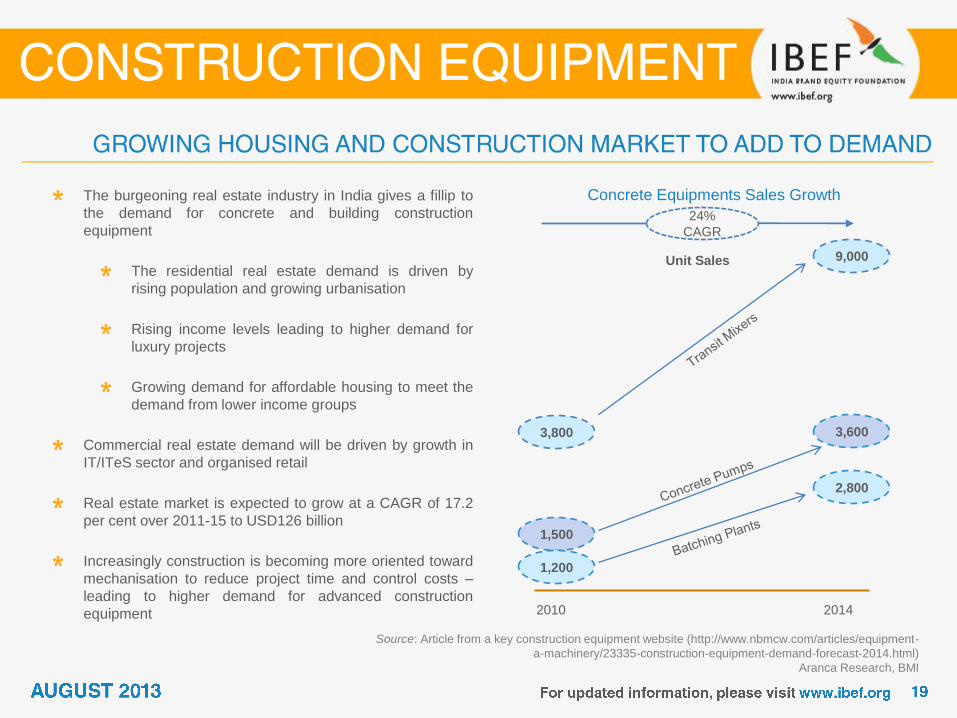
Concrete Equipments Sales Growth
Source: Article from a key construction equipment website (http://www.nbmcw.com/articles/equipment-
a-machinery/23335-construction-equipment-demand-forecast-2014.html)
Aranca Research, BMI
The burgeoning real estate industry in India gives a fillip to
the demand for concrete and building construction
equipment
The residential real estate demand is driven by
rising population and growing urbanisation
Rising income levels leading to higher demand for
luxury projects
Growing demand for affordable housing to meet the
demand from lower income groups
Commercial real estate demand will be driven by growth in
IT/ITeS sector and organised retail
Real estate market is expected to grow at a CAGR of 17.2
per cent over 2011-15 to USD126 billion
Increasingly construction is becoming more oriented toward
mechanisation to reduce project time and control costs –
leading to higher demand for advanced construction
equipment 2010 2014
1,500
3,600 3,800
9,000
1,200
2,800
Unit Sales
24%
CAGR
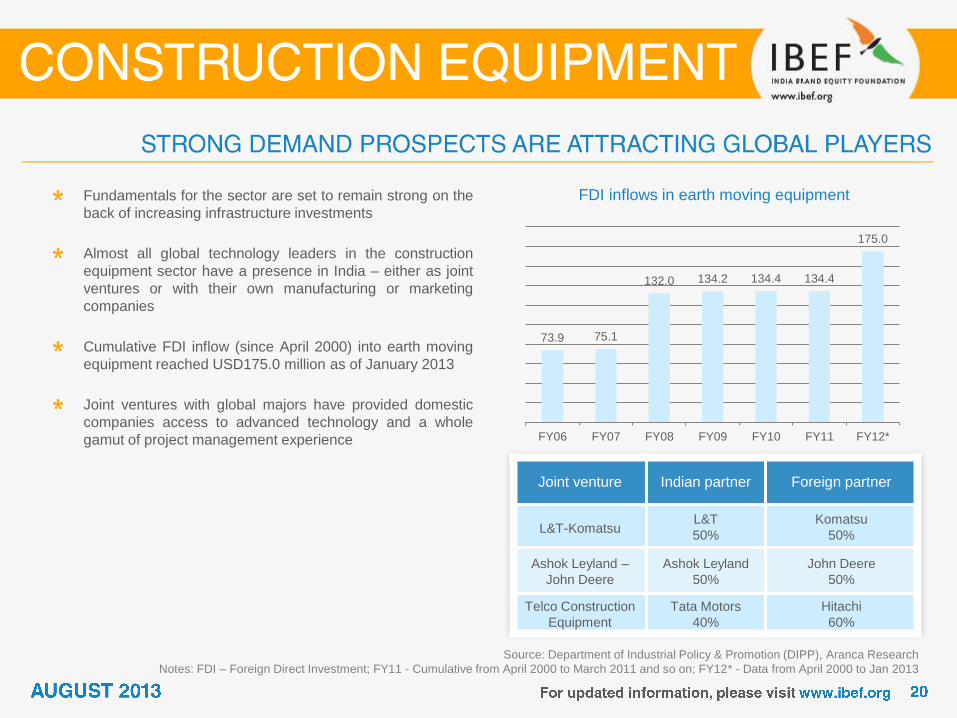
FDI inflows in earth moving equipment
Source: Department of Industrial Policy & Promotion (DIPP), Aranca Research
Notes: FDI – Foreign Direct Investment; FY11 - Cumulative from April 2000 to March 2011 and so on; FY12* - Data from April 2000 to Jan 2013
Fundamentals for the sector are set to remain strong on the
back of increasing infrastructure investments
Almost all global technology leaders in the construction
equipment sector have a presence in India – either as joint
ventures or with their own manufacturing or marketing
companies
Cumulative FDI inflow (since April 2000) into earth moving
equipment reached USD175.0 million as of January 2013
Joint ventures with global majors have provided domestic
companies access to advanced technology and a whole
gamut of project management experience
73.9 75.1
132.0 134.2 134.4 134.4
175.0
FY06 FY07 FY08 FY09 FY10 FY11 FY12*
Joint venture Indian partner Foreign partner
L&T-Komatsu L&T
50%
Komatsu
50%
Ashok Leyland –
John Deere
Ashok Leyland
50%
John Deere
50%
Telco Construction
Equipment
Tata Motors
40%
Hitachi
60%
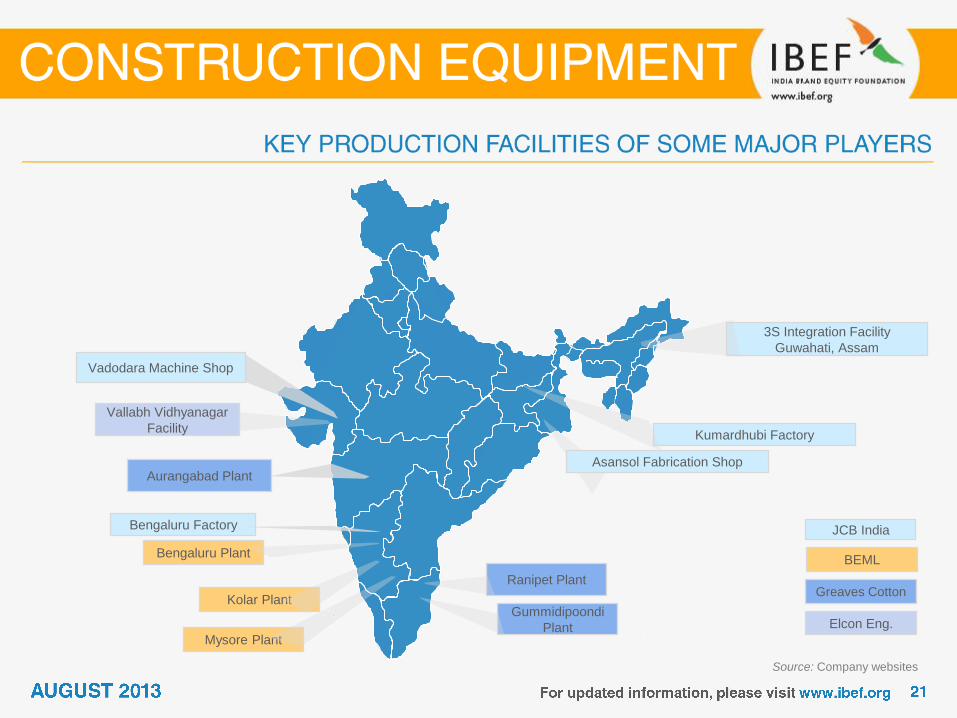
Mysore Plant
Aurangabad Plant
Source: Company websites
Vadodara Machine Shop
Vallabh Vidhyanagar
Facility
Bengaluru Plant
Kolar Plant
Bengaluru Factory
Gummidipoondi
Plant
Ranipet Plant
3S Integration Facility
Guwahati, Assam
Kumardhubi Factory
JCB India
BEML
Greaves Cotton
Elcon Eng.
Asansol Fabrication Shop
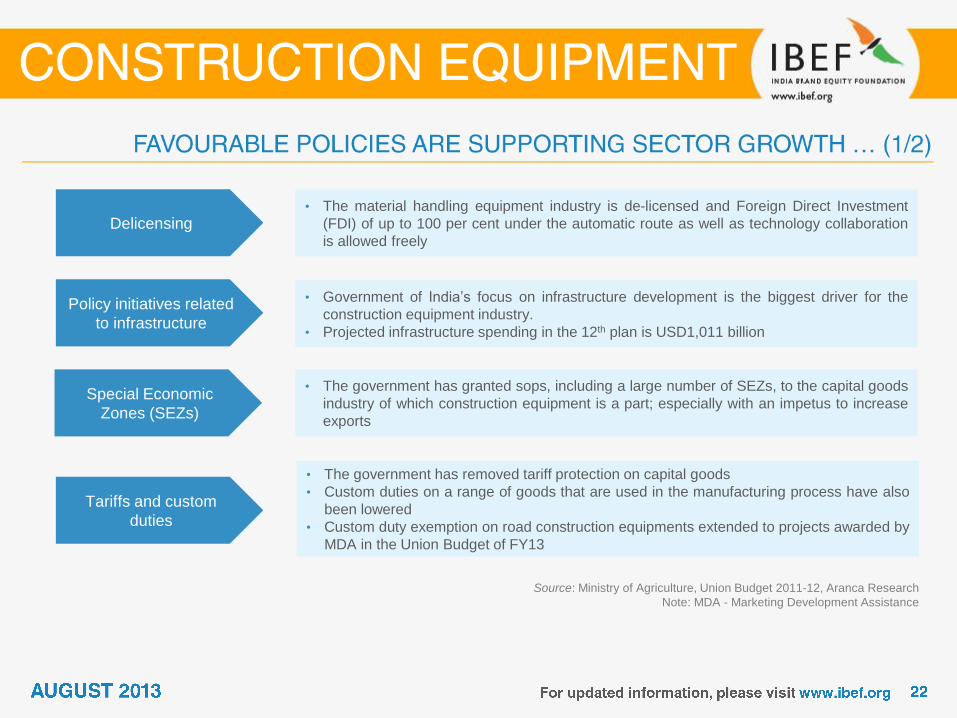
Delicensing • The material handling equipment industry is de-licensed and Foreign Direct Investment
(FDI) of up to 100 per cent under the automatic route as well as technology collaboration
is allowed freely
Policy initiatives related
to infrastructure
• Government of India’s focus on infrastructure development is the biggest driver for the
construction equipment industry.
• Projected infrastructure spending in the 12th plan is USD1,011 billion
Special Economic
Zones (SEZs)
• The government has granted sops, including a large number of SEZs, to the capital goods
industry of which construction equipment is a part; especially with an impetus to increase
exports
Source: Ministry of Agriculture, Union Budget 2011-12, Aranca Research
Note: MDA - Marketing Development Assistance
Tariffs and custom
duties
• The government has removed tariff protection on capital goods
• Custom duties on a range of goods that are used in the manufacturing process have also
been lowered
• Custom duty exemption on road construction equipments extended to projects awarded by
MDA in the Union Budget of FY13
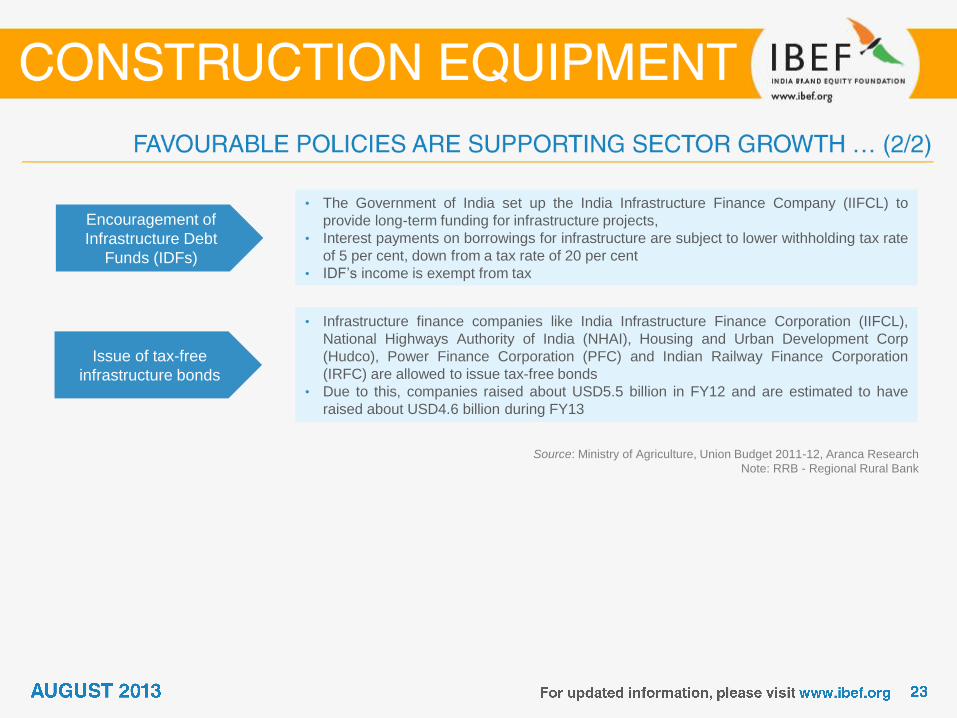
Issue of tax-free
infrastructure bonds
• Infrastructure finance companies like India Infrastructure Finance Corporation (IIFCL),
National Highways Authority of India (NHAI), Housing and Urban Development Corp
(Hudco), Power Finance Corporation (PFC) and Indian Railway Finance Corporation
(IRFC) are allowed to issue tax-free bonds
• Due to this, companies raised about USD5.5 billion in FY12 and are estimated to have
raised about USD4.6 billion during FY13
Source: Ministry of Agriculture, Union Budget 2011-12, Aranca Research
Note: RRB - Regional Rural Bank
Encouragement of
Infrastructure Debt
Funds (IDFs)
• The Government of India set up the India Infrastructure Finance Company (IIFCL) to
provide long-term funding for infrastructure projects,
• Interest payments on borrowings for infrastructure are subject to lower withholding tax rate
of 5 per cent, down from a tax rate of 20 per cent
• IDF’s income is exempt from tax
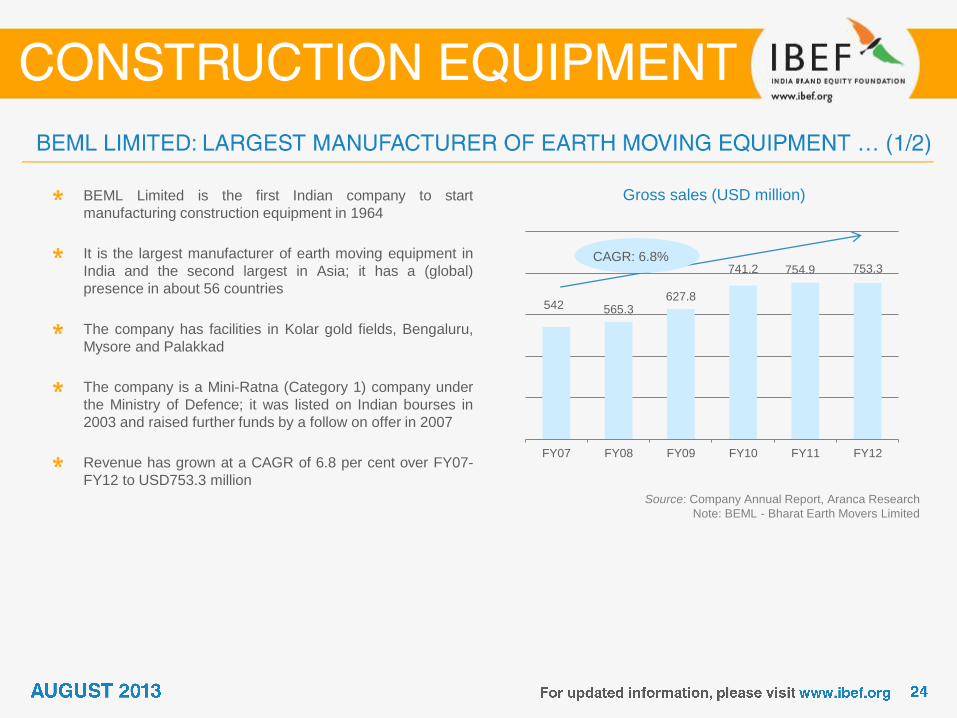
Gross sales (USD million)
Source: Company Annual Report, Aranca Research
Note: BEML - Bharat Earth Movers Limited
BEML Limited is the first Indian company to start
manufacturing construction equipment in 1964
It is the largest manufacturer of earth moving equipment in
India and the second largest in Asia; it has a (global)
presence in about 56 countries
The company has facilities in Kolar gold fields, Bengaluru,
Mysore and Palakkad
The company is a Mini-Ratna (Category 1) company under
the Ministry of Defence; it was listed on Indian bourses in
2003 and raised further funds by a follow on offer in 2007
Revenue has grown at a CAGR of 6.8 per cent over FY07-
FY12 to USD753.3 million
542 565.3 627.8
741.2 754.9 753.3
FY07 FY08 FY09 FY10 FY11 FY12
CAGR: 6.8%
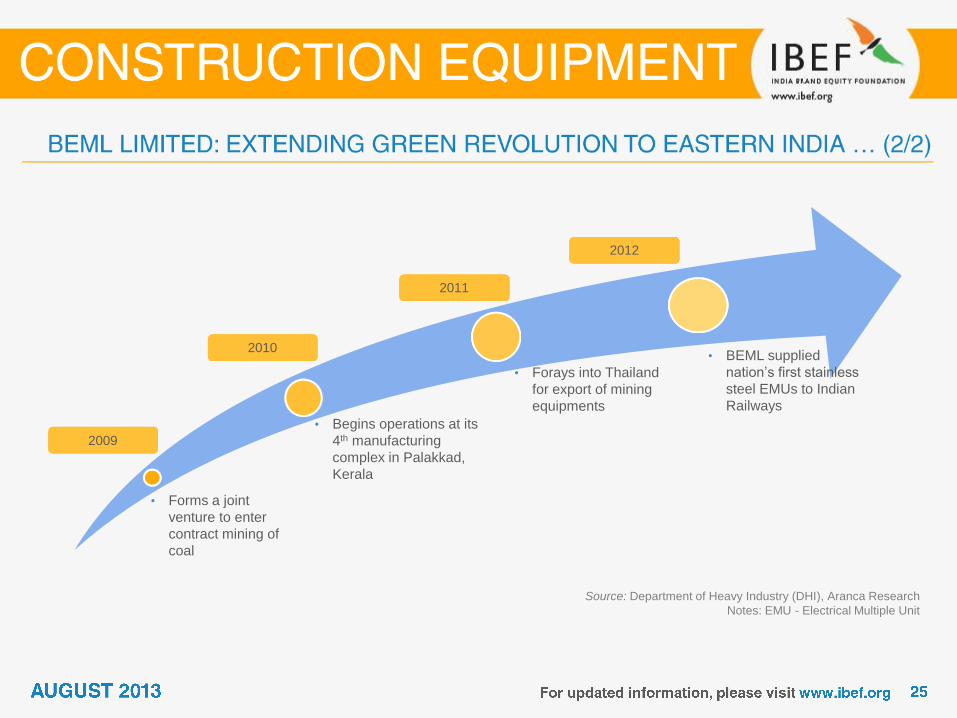
Source: Department of Heavy Industry (DHI), Aranca Research
Notes: EMU - Electrical Multiple Unit
• Forms a joint
venture to enter
contract mining of
coal
• Begins operations at its
4th manufacturing
complex in Palakkad,
Kerala
• Forays into Thailand
for export of mining
equipments
• BEML supplied
nation’s first stainless
steel EMUs to Indian
Railways
2009
2010
2011
2012
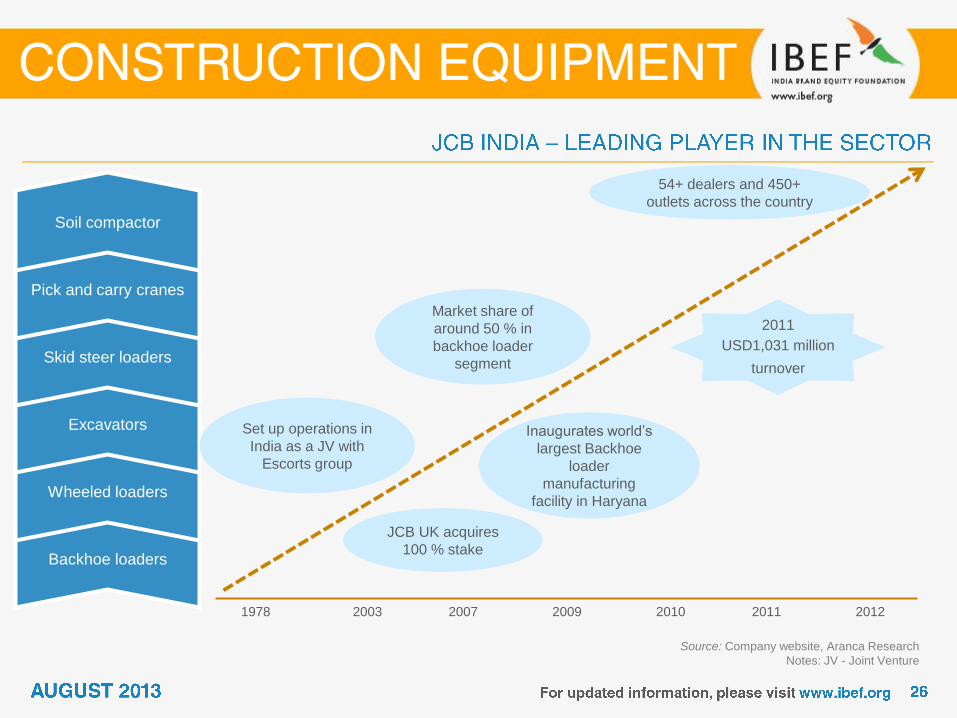
Source: Company website, Aranca Research
Notes: JV - Joint Venture
Backhoe loaders
Wheeled loaders
Excavators
Skid steer loaders
Pick and carry cranes
Soil compactor
Set up operations in
India as a JV with
Escorts group
Market share of
around 50 % in
backhoe loader
segment
54+ dealers and 450+
outlets across the country
JCB UK acquires
100 % stake
Inaugurates world’s
largest Backhoe
loader
manufacturing
facility in Haryana
2011
USD1,031 million
turnover
1978 2003 2007 2009 2010 2011 2012
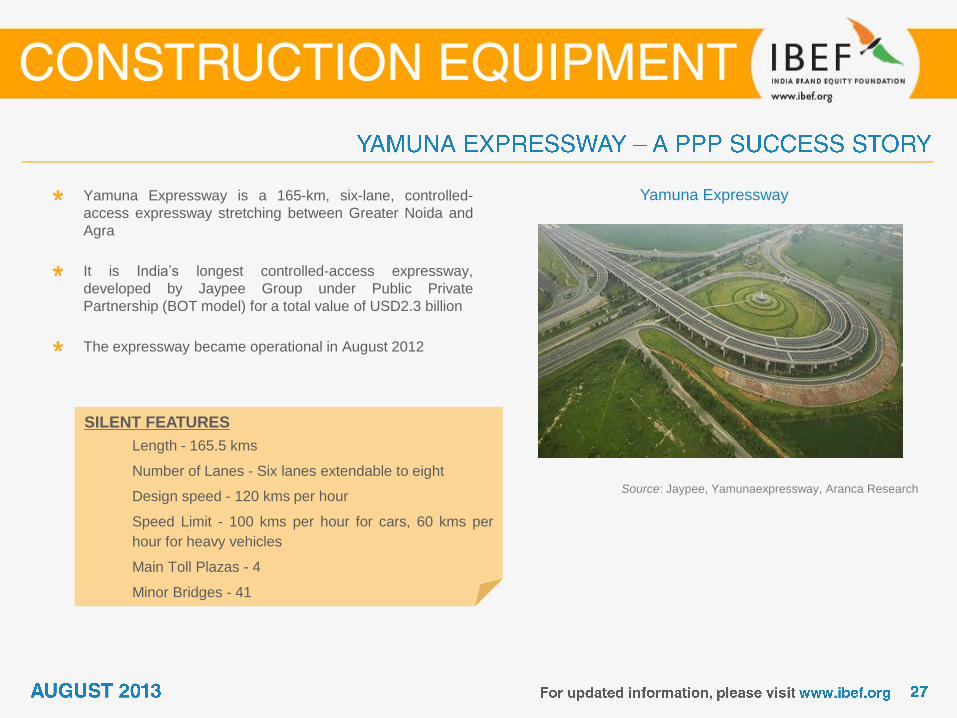
Yamuna Expressway
Source: Jaypee, Yamunaexpressway, Aranca Research
Yamuna Expressway is a 165-km, six-lane, controlled-
access expressway stretching between Greater Noida and
Agra
It is India’s longest controlled-access expressway,
developed by Jaypee Group under Public Private
Partnership (BOT model) for a total value of USD2.3 billion
The expressway became operational in August 2012
SILENT FEATURES
Length - 165.5 kms
Number of Lanes - Six lanes extendable to eight
Design speed - 120 kms per hour
Speed Limit - 100 kms per hour for cars, 60 kms per
hour for heavy vehicles
Main Toll Plazas - 4
Minor Bridges - 41
Source: Indian Earthmoving & Construction Industry Association Ltd (IECIAL),
Indian Brand Equity Foundation (IBEF), Aranca Research
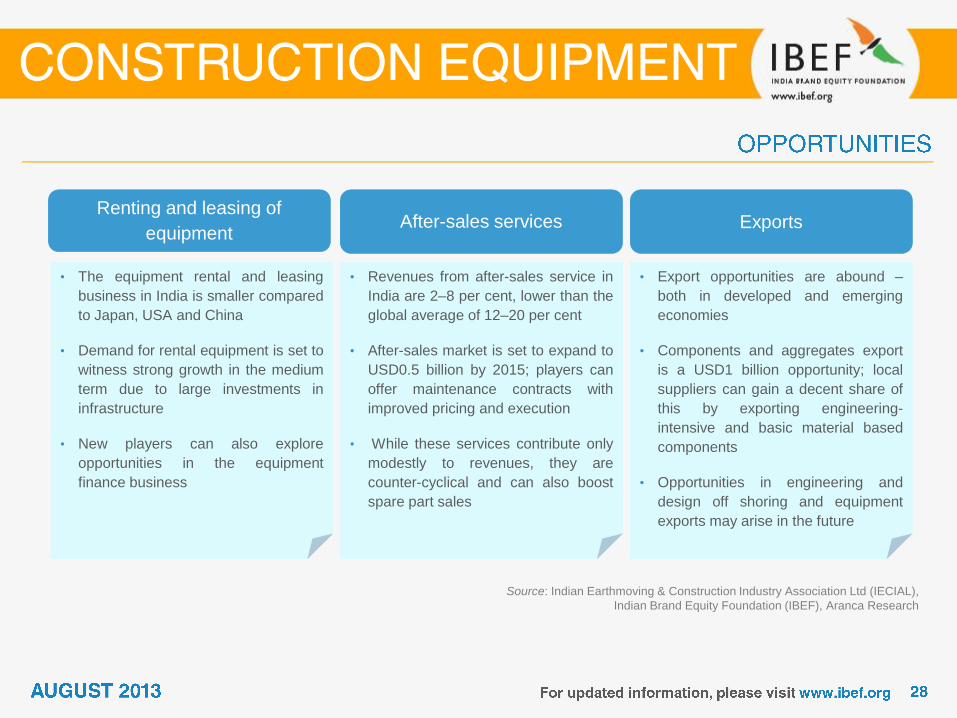
Renting and leasing of
equipment After-sales services Exports
• The equipment rental and leasing
business in India is smaller compared
to Japan, USA and China
• Demand for rental equipment is set to
witness strong growth in the medium
term due to large investments in
infrastructure
• New players can also explore
opportunities in the equipment
finance business
• Revenues from after-sales service in
India are 2–8 per cent, lower than the
global average of 12–20 per cent
• After-sales market is set to expand to
USD0.5 billion by 2015; players can
offer maintenance contracts with
improved pricing and execution
• While these services contribute only
modestly to revenues, they are
counter-cyclical and can also boost
spare part sales
• Export opportunities are abound –
both in developed and emerging
economies
• Components and aggregates export
is a USD1 billion opportunity; local
suppliers can gain a decent share of
this by exporting engineering-
intensive and basic material based
components
• Opportunities in engineering and
design off shoring and equipment
exports may arise in the future
Indian Earthmoving & Construction Industry Association Ltd
( IECIAL )
C/O Confederation of Indian Industry
The Mantosh Sondhi Centre
23 Institutional Area,Lodhi Road
New Delhi – 110 003
Tel: 011- 24629994-7, 011-45772032
Email: [email protected]
Engineering Export Promotion Council (EEPC)
‘Vanijya Bhawan’, 1st Floor
International Trade Facilitation Centre,
1/1, Wood Street,
Kolkata, West Bengal–700016.
Phone: 91-33-22890651, 22890652
E-mail: [email protected]
FY: Indian Financial Year (April to March) – So FY11 implies April 2010 to March 2011
USD: US Dollar– Conversion rate used: USD1= INR54.43
FDI: Foreign Direct Investment
CAGR: Compounded Annual Growth Rate
GOI: Government of India
IECIAL: Indian Earthmoving & Construction Industry Association Ltd
DHI: Department of Heavy Industries
R&D: Research and Development
JV: Joint Venture
SEZ: Special Economic Zone
IBEF: Indian brand Equity Foundation
Wherever applicable, numbers have been rounded off to the nearest whole number
List of top six listed companies used in slide No 8: BEML, McNally Bharat, Greaves Cotton(for FY11, considered only first nine
months), Elecon Engineering, ACE, TRF
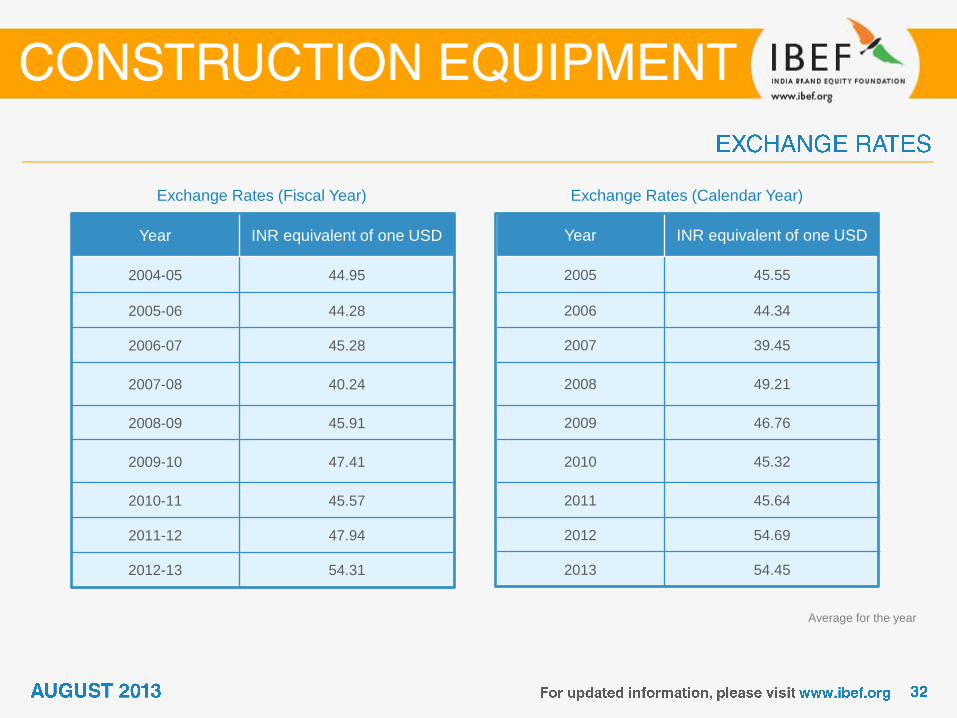
Year INR equivalent of one USD
2004-05 44.95
2005-06 44.28
2006-07 45.28
2007-08 40.24
2008-09 45.91
2009-10 47.41
2010-11 45.57
2011-12 47.94
2012-13 54.31
Exchange Rates (Fiscal Year)
Year INR equivalent of one USD
2005 45.55
2006 44.34
2007 39.45
2008 49.21
2009 46.76
2010 45.32
2011 45.64
2012 54.69
2013 54.45
Exchange Rates (Calendar Year)
Average for the year
India Brand Equity Foundation (IBEF) engaged Aranca to prepare this presentation and the same has been prepared by
Aranca in consultation with IBEF.
All rights reserved. All copyright in this presentation and related works is solely and exclusively owned by IBEF. The
same may not be reproduced, wholly or in part in any material form (including photocopying or storing it in any medium
by electronic means and whether or not transiently or incidentally to some other use of this presentation), modified or in
any manner communicated to any third party except with the written approval of IBEF.
This presentation is for information purposes only. While due care has been taken during the compilation of this
presentation to ensure that the information is accurate to the best of Aranca and IBEF’s knowledge and belief, the
content is not to be construed in any manner whatsoever as a substitute for professional advice.
Aranca and IBEF neither recommend nor endorse any specific products or services that may have been mentioned in
this presentation and nor do they assume any liability or responsibility for the outcome of decisions taken as a result of
any reliance placed on this presentation.
Neither Aranca nor IBEF shall be liable for any direct or indirect damages that may arise due to any act or omission on
the part of the user due to any reliance placed or guidance taken from any portion of this presentation.


![Applying Leases August2013[1]](https://img.dokumen.tips/doc/110x75/577cd9511a28ab9e78a33948/applying-leases-august20131.jpg)