Embed Size (px)
DESCRIPTION
Construction & Materials Outlook. Willis Risk Management Conference San Antonio, September 20, 2012 Ken Simonson, Chief Economist AGC of America [email protected]. Current economy; construction outlook. 2. Source: AGC. GDP, personal income, jobs: growing, but slowly - PowerPoint PPT Presentation
Citation preview

Construction & Materials Outlook
Willis Risk Management ConferenceSan Antonio, September 20, 2012Ken Simonson, Chief Economist
AGC of [email protected]

Current economy; construction outlook• GDP, personal income, jobs: growing, but slowly• Office, retail, lodging up due to remodeling, not starts• Power, mfg., warehouse/distribution, hospitals will grow• ‘Shale gale,’ Panama Canal expansion driving new activity• Apartments should boom; single-family still a mystery• Federal, state, local construction cuts will continue• Unemployment dropping but only because workers leave• Materials costs not extreme but will outpace CPI
2Source: AGC

One (or many) bright spot(s): the shale ‘gale’
Haynesville
Fayetteville
New Albany
Floyd-NealWoodford
Barnett-Woodford
Eagle Ford
Barnett
Lewis
Cody
Niobrara
Mulky
Bakken
Antrim
Baxter-Mancos
MowryGammon
Mancos
Pierre
Natural gas productionTrillion cubic feet (TCF)
862 TCF shale
2,543TCF total
67% increase in shale production 2007-10
Source: EIA Annual Energy Outlook, 2008 to 2011
Marcellus/Devonian/Utica
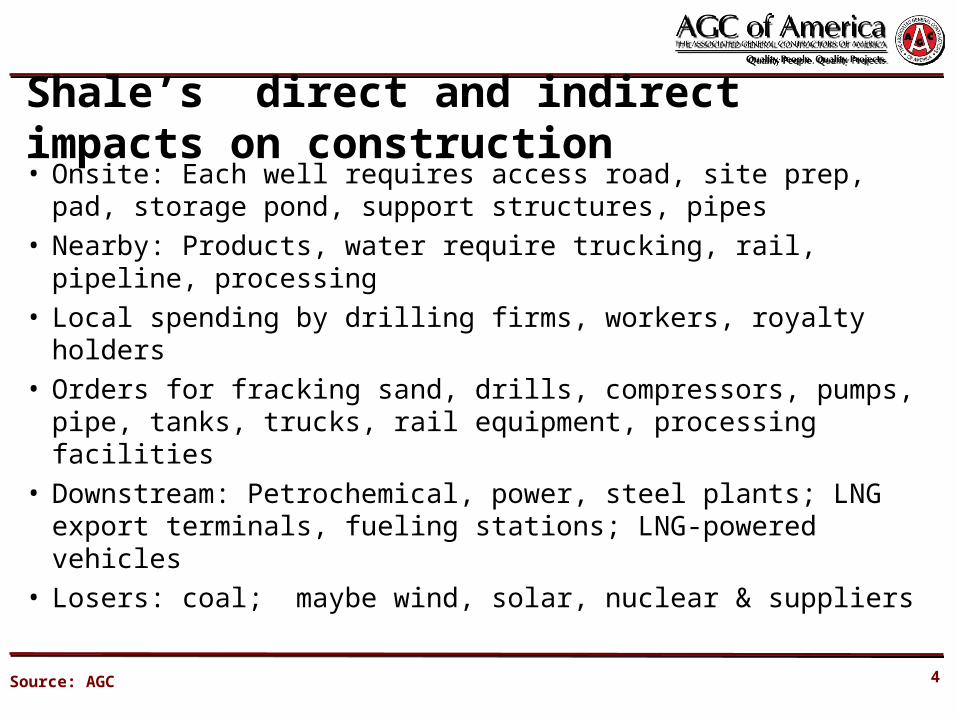
Shale’s direct and indirect impacts on construction• Onsite: Each well requires access road, site prep, pad,
storage pond, support structures, pipes• Nearby: Products, water require trucking, rail, pipeline,
processing• Local spending by drilling firms, workers, royalty holders• Orders for fracking sand, drills, compressors, pumps,
pipe, tanks, trucks, rail equipment, processing facilities • Downstream: Petrochemical, power, steel plants; LNG
export terminals, fueling stations; LNG-powered vehicles• Losers: coal; maybe wind, solar, nuclear & suppliers
4Source: AGC

Source: U.S. Army Corps of Engineers
U.S. Post-Panamax Ready Ports
5
Baltimore
New York-New Jersey
Norfolk
Seattle & Tacoma
Los Angeles/ Long Beach
Charleston (with tide)San Diego (with tide)
Oakland
Columbia River at Mouth, OR & WA
Miami
Savannah Jacksonville

Panama Canal expansion’s impacts on construction• Ports: investing in dredging, piers, cranes, land access• Nearby: Storage, warehouse, trucking, rail facilities• Possible bridge, tunnel, highway improvements• Possible changes in inland distribution, manufacturing
6Source: AGC

Construction spending (seasonally adjusted annual rate—SAAR )
7Source: Census Bureau construction spending reports
Public, private nonres & private res, 1/08-7/12Total construction, 1/08-7/12 (billion $)
Latest 1-month change: -0.9% (-0.9%) (-0.4%) (-1.6%)
Latest 12-month change: 9.3% (11.7%) (-0.7%) (19.0%)
12-month % change, 1/11-7/12 12-month % change, 1/11-7/12

Nonres totals (billion $, SAAR), share & 12-month change7/12 Total Share 7/11-7/12
Nonresidential (priv.+federal+state/local) $563 billion 100% 6%
Power (incl. oil & gas struc., pipelines) 87 15 18 Educational 84 15 -1 Highway and street 81 14 5 Manufacturing 50 9 18 Commercial (retail, warehouse, farm) 46 8 1 Health care 41 7 1 Transportation 38 7 13 Office 36 6 6 Sewage and waste disposal 22 4 -2 Communication 17 3 -4 Amusement and recreation 16 3 -3 Other (water, lodging; public safety; conservation; religious): 8% of total 0
8Source: Census Bureau construction spending report
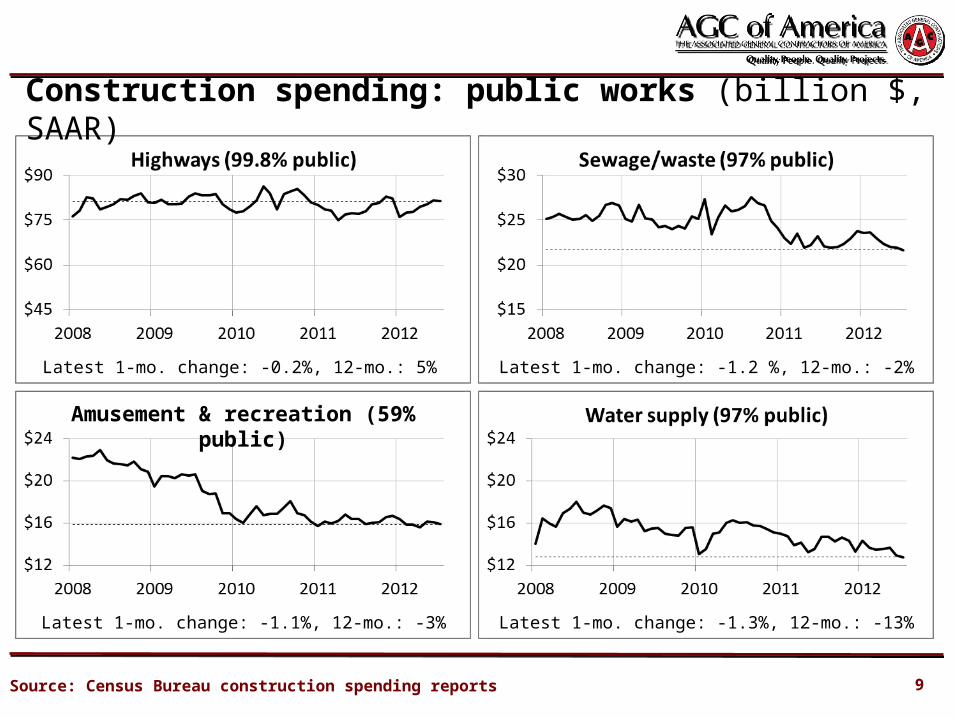
Construction spending: public works (billion $, SAAR)
9
Latest 1-mo. change: -0.2%, 12-mo.: 5% Latest 1-mo. change: -1.2 %, 12-mo.: -2%
Latest 1-mo. change: -1.1%, 12-mo.: -3% Latest 1-mo. change: -1.3%, 12-mo.: -13%
Source: Census Bureau construction spending reports
Amusement & recreation (59% public)

Construction spending: industrial, heavy (billion $, SAAR)
10
Latest 1-mo. change: -1.2%, 12-mo.: 18% Latest 1-mo. change: -2.2%, 12-mo.: 18%
Latest 1-mo. change: 2.8%, 12-mo.: 18% Latest 1-mo. change: 0.7%, 12-mo.: 11%
Source: Census Bureau construction spending reports
Public transportation facilities

Construction spending: institutional (private + state/local)
11
Latest 1-mo. change: 0.0%, 12-mo.: -2%Latest 1-mo. change: 1.8%, 12-mo.: 31%
Latest 1-mo. change: 1.3%, 12-mo.: 1% Latest 1-mo. change: -0.5%, 12-mo.: -7%
Source: Census Bureau construction spending reports

Construction spending: developer-financed (billion $, SAAR)
12
Latest 1-mo. change: -2.1%, 12-mo.: 8% Latest 1-mo. change: -0.1%, 12-mo.: 10%
Latest 1-mo. change: -1.7%, 12-mo.: -9% Latest 1-mo. change: 0.0%, 12-mo.: 36%
Source: Census Bureau construction spending reports

Latest 1-mo. change: 2.8%, 12-mo.: 45%
Priv. residential spending, permits, starts: single- & multi-family, 2008-12Single-family & improvements spending
▬SF: 1-mo 1.5%, 12-mo 19% ▬ Imp:1-mo -5.5%, 12-mo 15%
Multi-family permits & starts
▬ Permits (1-mo -3.0%, 12-mo 35%)
▬ Starts (1-mo -4.9%, 12-mo 35%)
Single-family permits & starts
▬ Permits (1-mo 0.2%, 12-mo 19%)
▬ Starts (1-mo 5.5%, 12-mo 27%)
Source: Census Bureau construction spending, housing starts reports 13

Housing outlook• SF: improvement so far but distressed and ‘shadow’
inventory will depress prices, limit new construction• MF: Upturn should last throughout 2012 and 2013- Vacancy rate is now at 10-year low; rents are up- Rental demand should rise as more people get jobs- But condo market continues to have large overhang- And government-subsidized market likely to worsen
• The big mystery: Have preferences changed to favor renting, close-in locations (=> more MF, less SF)?
14Source: Author

• Private sector has added jobs since 1/10, construction since 1/11• Construction added 0 jobs in 2 years but unemployment is down• Thus, workers are leaving for other sectors, school, retiring
Unemployment rates(August 2010-August 2012)
Construction vs. overall (un)employment, 8/10-8/12
15Source: BLS employment, unemployment reports
Construction vs. private employment, 8/10-8/12(seasonally adjusted, cumulative % change since 8/10)
Construction0.1%, 4,000
Private3.6%3,897,000

Source: BLS state and regional employment report
1%
2%
5%
-0.3%
4%
-3%
-8%
7%
6%
-1%
16%
-5%
10%
1%
-1%
4%
4%
3%
-9%
-0.3%
-8%
-5% 8%
-4%
4%
-11% -8%
1%
-2%
-2%
-1%
-2%
-5%
-5%
-4%
8%
-10%
-1%
-3%
VT1%
CT-6%
RI4%
DE-7%
NJ-6%
MD-0.2%
DC12%
NH-2%
-10% or worse -5.0% to -9.9% -0.1% to -4.9% 0% to 4.9%
MA-4%
State construction employment change (U.S.: 0.1%) 7/11 to 7/12 (seasonally adjusted): 18 + DC up, 31 down, 1 unch
5.0% to 9.9%
16
10% or better

Material & labor costs vs. office & highway bid prices, 3/09-8/12
17Source: Author, based on Bureau of Labor Statistics for Producer Price Indexes (PPIs) and Employment Cost Index (ECI); Federal Highway Administration for National Highway Construction Cost Index (NHCCI)
PPI for materials
PPI for offices
ECI
NHCCI

PPIs for inputs vs. bid prices, 1/11-8/12 (January 2011=100)
18Source: Author, based on BLS reports (PPI), Federal Highway Administration reports (NHCCI)
PPI for inputs to commercial structures PPI for new offices
PPI for inputs for other nonres (highway, heavy) Natl. Highway Construction Cost Index (NHCCI)

Producer price indexes for key inputs, 1/11-8/12 (January 2011=100)
19Source: Author, based on BLS producer price index reports
Steel mill products Copper & brass mill shapes
Gypsum products Lumber & plywood

Producer price indexes for key inputs, 1/11-8/12 (January 2011=100)
20Source: Author, based on BLS producer price index reports
No. 2 diesel fuel Concrete products
Asphalt paving mixtures & blocks Prepared asphalt & tar roofing & siding materials

Outlook for materials• Industry depends on specific materials that:
• are in demand worldwide• have erratic supply growth• are heavy, bulky or hard to transport
• Construction requires physical delivery• Thus, industry is subject to price spurts, transport
bottlenecks, fuel price swings• Expect 3-5% Dec-Dec PPI increase but volatility still a risk
21Source: Author
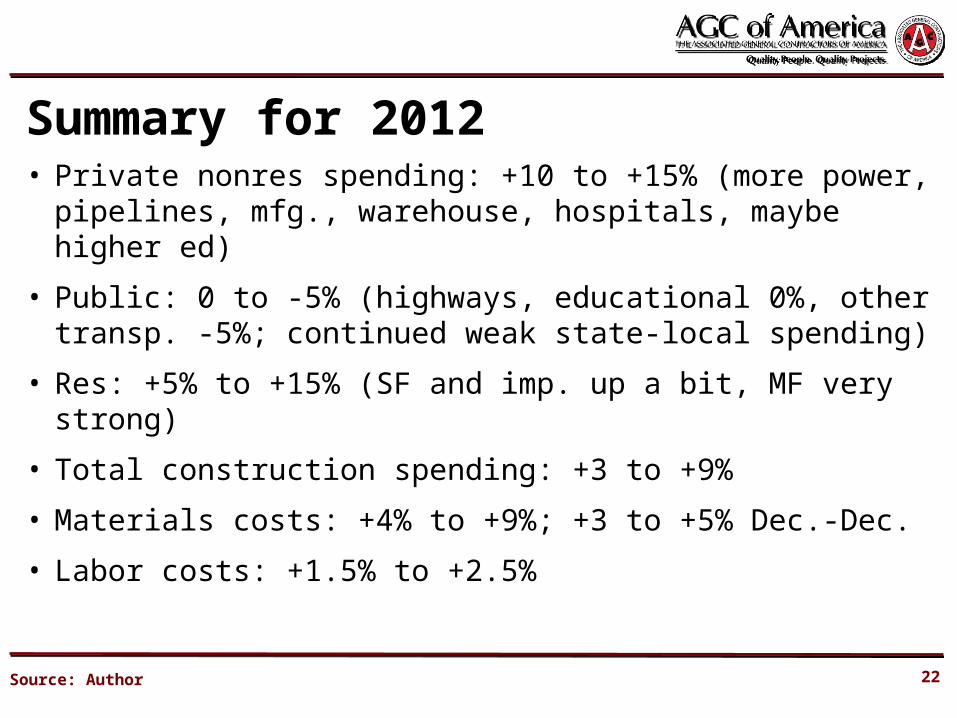
Summary for 2012• Private nonres spending: +10 to +15% (more power,
pipelines, mfg., warehouse, hospitals, maybe higher ed)
• Public: 0 to -5% (highways, educational 0%, other transp. -5%; continued weak state-local spending)
• Res: +5% to +15% (SF and imp. up a bit, MF very strong)
• Total construction spending: +3 to +9%
• Materials costs: +4% to +9%; +3 to +5% Dec.-Dec.
• Labor costs: +1.5% to +2.5%
22Source: Author

Trends: 2013-2017• Total construction spending: +6% to +10% per year
- less housing, retail; declining public spending
- new drivers: shale-based gas & oil; Panama Canal widening; more elderly & kids, fewer young adults
• Materials costs: +3% to +8% (vs. 2% to 3% for CPI)
• Labor costs: +2% to + 4%
• Bid prices: +2% to +5%
23Source: Author

AGC economic resources (email [email protected])
• The Data DIGest: weekly 1-page email (subscribe at: www.agc.org/datadigest)
• 5 monthly press releases: national, state, metro employment; spending; PPI
• State and metro data, fact sheets
• Webinars
• Website: http://www.agc.org/Economics
24