Embed Size (px)
Citation preview

International Journal of Psychology and Psychological Therapy, 2017, 17, 3, 337-348Printed in Spain. All rights reserved. Copyright © 2017 AAC
Construct, Measurement and Assessment of Social Competence in Early Adolescence
Eva M Romera*, José L Fernández Rabanillo, Olga Gómez Ortiz, Rosario Ortega Ruiz, José A Casas Bolaños
Universidad de Córdoba, España
* Correspondence concening this article: Eva M Romera. Departamento de Psicología, Universidad de Córdoba, Avenida San Alberto Magno, s/n. 14071 Córdoba, Espsña. Email: [email protected]. Acknowledgments: This study was sup-ported by the Plan Estatal de Investigación Científica y Técnica y de Innovación, Ministerio de Economía, Industria y Competitividad under grants PSI2016-74871-R and EDU2013-44627-P.
AbstrAct
This study explores differences in the conceptualization of social competence according to the measure used. To do so, the relations of influence of social cognition variables in the development of social competence are analyzed by means of two different scales. The participants included 425 students (49% girls) ranging in age from 10 to 13 years (M= 10.94, SD= .78). Confirmatory factor analysis and structural equation models were performed. The results showed optimal psychometric properties for the Spanish adaptation of the Social Competence Scale (SCS) and the Perceived Social Competence Scale-II (PSCS-II). Development and peer perception goals and popularity and peer support goals were found to have a direct effect on the PSCS-II and the SCS, respectively. The differences observed in the explanatory models are discussed from the perspective of the social competence constructs measured by each scale.Key words: social competence, social goals, peer support, peer perception.
How to cite this paper: Romera EM, Fernández-Rabanillo JL, Gómez-Ortiz O, Ortega-Ruiz R, & Casas-Bolaños JA (2017). Construct, Measurement and Assessment of Social Competence in Early Adolescence. International Journal of Psychology & Psychological Therapy, 17, 337-348.
Social competence involves developing behaviors and skills that students put into practice in their social life taking into account the characteristics of the context in which they operate. The development of this competence involves the ability to successfully create and maintain interactions with peers, and thus has a large impact on the adaptation and psychosocial adjustment of children (Cichetti & Bukowiski, 1995; Parker, Rubin, Price, & DeRosier, 1995).
Various instruments have been used to measure social competence. For young children, the Kohn Social Competence Scale is widely used to measure the socio-emotional functioning of boys and girls aged 3-5 (Kohn & Rosman, 1974) or the Preschool Q-set (Waters, Noyes, Vaughn, & Ricks, 1985). In adolescents, the Adolescent Social Self-Efficacy Scale (S-EFF), developed by Connolly (1989), is used to assess self-efficacy as a function of expectations regarding social skills in interpersonal relationships.
Novelty and SignificanceWhat is already known about the topic?
• Social competence is a multidimensional construct difficult to measure. • Social competence is influenced by several personal and contextual variables.
What this paper adds?
• Depending on the measure of social competence used, differences in pre-adolescent behavior may be observed.• The analysis of two widely employed scales and its results might help researchers in identifying what sort of
concept they are measuring depending on the instrument used.
338
© InternatIonal Journal of Psychology & PsychologIcal theraPy, 2017, 17, 3 http://www. ijpsy. com
RomeRa, FeRnández Rabanillo, Gómez oRtiz, oRteGa Ruiz, & Casas bolaños
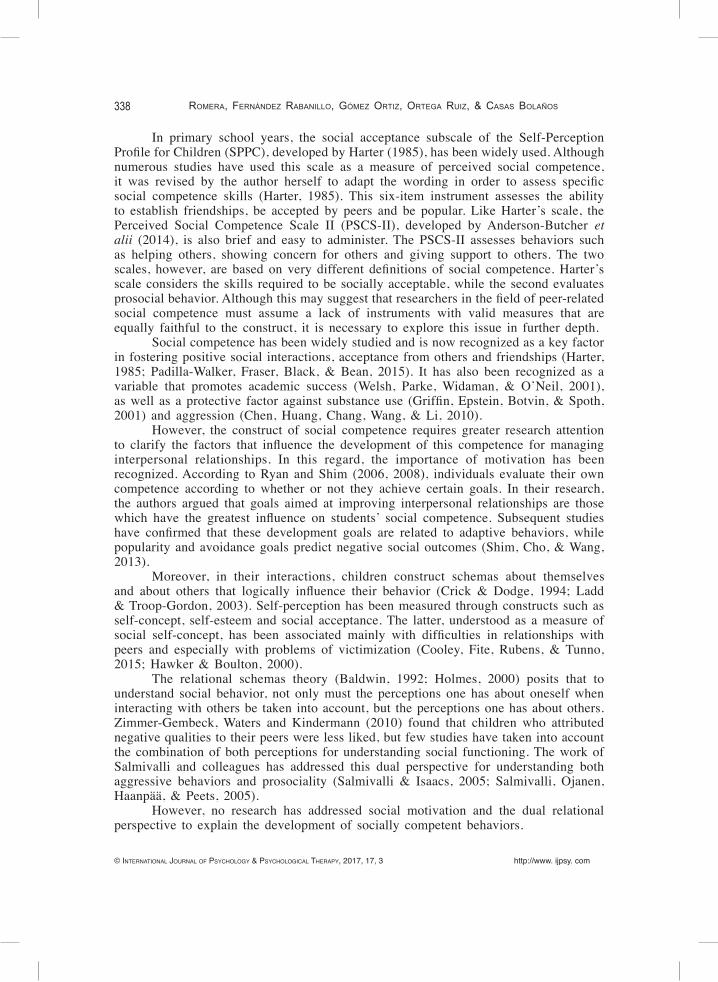
In primary school years, the social acceptance subscale of the Self-Perception Profile for Children (SPPC), developed by Harter (1985), has been widely used. Although numerous studies have used this scale as a measure of perceived social competence, it was revised by the author herself to adapt the wording in order to assess specific social competence skills (Harter, 1985). This six-item instrument assesses the ability to establish friendships, be accepted by peers and be popular. Like Harter’s scale, the Perceived Social Competence Scale II (PSCS-II), developed by Anderson-Butcher et alii (2014), is also brief and easy to administer. The PSCS-II assesses behaviors such as helping others, showing concern for others and giving support to others. The two scales, however, are based on very different definitions of social competence. Harter’s scale considers the skills required to be socially acceptable, while the second evaluates prosocial behavior. Although this may suggest that researchers in the field of peer-related social competence must assume a lack of instruments with valid measures that are equally faithful to the construct, it is necessary to explore this issue in further depth.
Social competence has been widely studied and is now recognized as a key factor in fostering positive social interactions, acceptance from others and friendships (Harter, 1985; Padilla-Walker, Fraser, Black, & Bean, 2015). It has also been recognized as a variable that promotes academic success (Welsh, Parke, Widaman, & O’Neil, 2001), as well as a protective factor against substance use (Griffin, Epstein, Botvin, & Spoth, 2001) and aggression (Chen, Huang, Chang, Wang, & Li, 2010).
However, the construct of social competence requires greater research attention to clarify the factors that influence the development of this competence for managing interpersonal relationships. In this regard, the importance of motivation has been recognized. According to Ryan and Shim (2006, 2008), individuals evaluate their own competence according to whether or not they achieve certain goals. In their research, the authors argued that goals aimed at improving interpersonal relationships are those which have the greatest influence on students’ social competence. Subsequent studies have confirmed that these development goals are related to adaptive behaviors, while popularity and avoidance goals predict negative social outcomes (Shim, Cho, & Wang, 2013).
Moreover, in their interactions, children construct schemas about themselves and about others that logically influence their behavior (Crick & Dodge, 1994; Ladd & Troop-Gordon, 2003). Self-perception has been measured through constructs such as self-concept, self-esteem and social acceptance. The latter, understood as a measure of social self-concept, has been associated mainly with difficulties in relationships with peers and especially with problems of victimization (Cooley, Fite, Rubens, & Tunno, 2015; Hawker & Boulton, 2000).
The relational schemas theory (Baldwin, 1992; Holmes, 2000) posits that to understand social behavior, not only must the perceptions one has about oneself when interacting with others be taken into account, but the perceptions one has about others. Zimmer-Gembeck, Waters and Kindermann (2010) found that children who attributed negative qualities to their peers were less liked, but few studies have taken into account the combination of both perceptions for understanding social functioning. The work of Salmivalli and colleagues has addressed this dual perspective for understanding both aggressive behaviors and prosociality (Salmivalli & Isaacs, 2005; Salmivalli, Ojanen, Haanpää, & Peets, 2005).
However, no research has addressed social motivation and the dual relational perspective to explain the development of socially competent behaviors.

http://www. ijpsy. com © InternatIonal Journal of Psychology & PsychologIcal theraPy, 2017, 17, 3
assessment oF soCial CompetenCe 339
This study has a two-fold objective: 1) to determine the psychometric properties of the Spanish adaptation of two measures of social competence in early adolescence; and 2) to analyze the differences in explanatory models regarding social competence depending on the scale used.
We hypothesize that the influence of peer perception, motivation and social support will vary depending on the social competence instrument used.
Method
Participants Incidental-convenience sampling was performed in which 425 students (49.18%
girls) in the last two years of primary education (5th grade= 50.82%, 6th grade= 49.41%) participated. The participants ranged in age from 10 to 13 years (M= 10.94, SD= .78).
Instruments Perceived Social Competence Scale-II (PSCS-II; Anderson-Butcher et alii, 2014). This is
a Likert-type instrument consisting of five items scored on a scale of 1-5 (1= Not at all true; 5= Really true) (e.g., “I help other people”). The internal consistency (Omega McDonald) with the study sample was Ω= .87.
Self-Perception Profile for Children, Social Competence Subscale (SPPC; Harter, 1985). Internal consistency α= 78 for the original scale. In each item, the child is presented with two social situations and asked to indicate which option best describes him or her (e.g., “Some kids know how to make classmates like them BUT other kids don’t know how to make classmates like them”). After choosing one of the statements, the child decides whether the statement is “really true for me” or “sort of true for me”. The answers are scored from 1 to 4. Lower scores indicate a low level of social com-petence. The internal consistency of the study sample was Ω= .72.
Generalized Perception-of-Peers Questionnaire (Salmivalli et alii, 2005). Internal consis-tency α= 89 for the original scale. This instrument consists of 13 items that describe the positive and negative qualities of the child’s peer group, such as “My age-mates can really be relied on” or “My age-mates only think about their own interests”. The responses are measured using a one-factor Likert-type scale ranging from 0 to 3 (0= No, not at all; 3= Yes, completely). The reliability for the study sample was Ω= .93.
Social Goals Scale (Rodkin, Ryan, Jamison, & Wilson, 2013). Consists of 15 items structured into three factors: a) social development goals (α= .87) (e.g., “I like it when I learn new ways to make friends”); b) demonstration-approach goals (popularity) (α= .89) (e.g., “It is important to me that other kids think I am popular”; and c) demonstration-avoid goals (α= .84) (e.g., “It is important to me that I don’t embarrass myself around my friends”). The items are rated on a 5-point Likert-type scale (1= Not at all true; 5= Very true). The internal consistency with the study sample was adequate (ΩMD= .76, ΩMA= .76, ΩME= .76).
Social Support Scale (Harter, 1985). The validated Spanish version of the peer support subscale was used (Pastor, Quiles, & Pamies, 2012). The scale consists of six items. The surveyed students must first choose a statement and then decide whether it is “re-ally true for me” or “sort of true for me” (e.g., “Some kids spend their recess being alone BUT other kids spend recess playing with classmates”). The internal consistency was α= .69 for the original scale and Ω= .70 for the study sample.

340
© InternatIonal Journal of Psychology & PsychologIcal theraPy, 2017, 17, 3 http://www. ijpsy. com
RomeRa, FeRnández Rabanillo, Gómez oRtiz, oRteGa Ruiz, & Casas bolaños
Procedure and Design
The design was instrumental, cross-sectional and ex-post-facto (Montero & León, 2007). After informing the schools and obtaining their consent, the questionnaires were administered on an anonymous and voluntary basis. The questionnaires were administered by researchers trained specifically for this purpose. Average completion time was 30 minutes. The parallel back-translation procedure (Brislin, 1986) was used to translate the instruments into Spanish. Data were collected in accordance with the general principles and ethical standards for research of the American Psychological Association.
Data analysis
The psychometric properties of the scales were analyzed by means of confirmatory factor analysis (CFA) using the robust maximum likelihood (RML) estimation method. RML permits the use of polychoric matrices, which are recommended for working with non-normally distributed samples and ordinal variables (Freiberg, Straver, de la Iglesia, & Fernández, 2013; Lorenzo Seva & Ferrando, 2006). For the structural equation model, the robust least squared (RLS) method was used. RLS is recommended for developing structural equation models involving ordinal variables (Rhemtulla, Brosseau-Liard, & Savalei, 2012). The fit indices used in both analyses were the Satorra-Bentler chi-square (2001) (SBχ2), the comparative fit index (CFI) and the non-normed fit index (NNFI). All of the fit indices were >.95 for optimum values and >.90 for acceptable values. The root mean square error of approximation (RMSEA) (<.08) and the standardized root mean square residual of the covariances (SRMR) (<.08) were used (Byrne, 2013; Hu & Bentler, 1999). EQS 6.2 software was used. Factor 9.2 software, which is recommended to study the reliability of ordinal variables, was used to calculate the Omega McDonald (Elousa Oliden & Zumbo, 2008).
results
Regarding the psychometric properties of each of the scales measuring social competence, Table 1 shows the univariate statistics for each of the items of the PSCS-II scale (Anderson-Butcher et alii, 2014).
The polychoric correlations matrix between the items showed values ranging from .49 to .65. The CFA fit indices showed optimal values: SBχ2= 7.287; NNFI= .997; CFI= .998; RMSEA= .034; 90% confidence interval of RMSEA: .00-.84; SRMR= .023 (see Figure 1). The Mardia coefficient was 23.72.
The psychometric properties of Harter’s (1985) Social Competence Scale was also analyzed (see Table 2).
The CFA fit indices were acceptable: SBχ2= 33.341; NNFI= .914; CFI= .948; RMSEA= .081; 90% confidence interval of RMSEA: .053-.111; SRMR= .058 (see Figure 2). The polychoric correlations matrix between items showed values ranging from .22 to .47. Mardia coefficient= 2.73.
The psychometric properties of the Spanish adaptation of the Generalized Peer Perception Scale (Salmivalli, 2005) and the Social Goals Scale (Rodkin et alii, 2013) were also analyzed. The first showed optimal CFA fit indices for a one-factor model: SBχ2= 197.005; NNFI= .975; CFI= .979; RMSEA= .073; 90% confidence interval of

http://www. ijpsy. com © InternatIonal Journal of Psychology & PsychologIcal theraPy, 2017, 17, 3
assessment oF soCial CompetenCe 341
RMSEA: .061-.084; SRMR= .061. The univariate statistics are shown in Table 3. The values of the polychoric correlations matrix between items ranged from .34 to .70. The Mardia coefficient for the scale was 98.60 (see Figure 3).
The psychometric properties of the Spanish version of the Social Goals Scale were inadequate for a one-factor model (SBχ2= 435.3656; NNFI= .48; CFI= .56; RMSEA= .103; SRMR= .100) and optimal for the original three-factor model (SBχ2= 133.8625; NNFI= .963; CFI= .97; RMSEA= .039; 90% confidence interval of RMSEA: .025-.051; SRMR= .076; see Figure 4). The univariate statistics are shown in Table 4. Mardia coefficient= 198.51.
To achieve the second objective, an initial model was developed in which the influence of social goals, peer perception and social adjustment on each of the measures
Table 1. Univariate statistics for the CFA of the Perceived Social Competence Scale.
M SD Kurtosis Skewness Item 1 Item 2 Item 3 Item 4 Item 5
4.46 4.08 4.29 4.13 4.44
.841 1.017 .895 .962 .800
3.392 .395 1.047 .475 1.212
-1.774 -.983 -1.209 -0.958 -1.341
Figure 1. Normalized CFA coefficients in the PSCS-II items.
Figure 2. Normalized CFA coefficients in the SCS items.

342
© InternatIonal Journal of Psychology & PsychologIcal theraPy, 2017, 17, 3 http://www. ijpsy. com
RomeRa, FeRnández Rabanillo, Gómez oRtiz, oRteGa Ruiz, & Casas bolaños
of social competence was taken as a theoretical reference. The three goals used as measures of the same instrument were covaried together with peer perception and social support, following the recommendations of the relational schemas theory.
The model for social competence measured using the instrument of Anderson-Butcher (2014) showed acceptable indices: SBχ2= 964.667; NNFI= .93; CFI= .934; RMSEA= .041; 90% confidence interval of RMSEA: .036-.046; SRMR= .066 (see Figure 5).
As the model shows, development goals had a direct influence on social competence (ß= .53; p <.05). Avoidance (ß= -.13; p >.05) and demonstration goals (ß= -.08; p >.05)
Figure 3. Normalized CFA coefficients in the Generalized Peer Perception Scale items.
Table 3. Univariate statistics for the CFA of the Generalized Peer Perception Scale.
M SD Kurtosis Skewness Item 1 Item 2 Item 3 Item 4 Item 5 Item 6 Item 7 Item 8 Item 9 Item 10 Item 11 Item 12 Item 13
2.26 2.28 2.41 2.11 2.43 2.26 2.33 2.68 2.26 2.28 2.42 2.37 2.61
.737
.853
.775 1.007 .892 .933 .976 .694 .918 .834 .848 .784 .755
.737
.398 965
-.654 .929 -.113 .147 4.021 .441 .432 .852 1.427 3.451
-.882 -1.055 -1.236 -.763 -1.432 -1.007 -1.202 -2.201 -1.148 -1.027 -1.333 -1.290 -2.023

http://www. ijpsy. com © InternatIonal Journal of Psychology & PsychologIcal theraPy, 2017, 17, 3
assessment oF soCial CompetenCe 343
had an inverse influence. Peer perception also had a direct influence on social competence (ß= .56; p <.05), while peer support had an inverse influence (ß= -.14; p >.05).
As regards the social competence model measured according to the scale of Harter (1985) and based on the same relations of influence, acceptable indices were obtained: SBχ2= 987.034; NNFI= .927; CFI= .932; RMSEA= .041; 90% confidence interval of RMSEA: .036-.46; SRMR= .064 (see Figure 6). The R2 value for the dependent variable was .94.
Figure 4. Normalized CFA coefficients in the Social Goals Scale items.
Table 4. Univariate statistics for the CFA of the Social Goals Scale.
M SD Kurtosis Skewness Item 1 Item 2 Item 3 Item 4 Item 5 Item 6 Item 7 Item 8 Item 9 Item 10 Item 11 Item 12 Item 13 Item 14 Item 15
4.18 4.16 4.35 4.38 4.06 4.49 2.64 2.73 2.66 3.02 4.13 3.91 3.83 3.94 3.85
1.007 .979 .902 .938 1.027 .929 1.391 1.322 1.384 1.363 1.071 1.232 1.252 1.180 1.325
1.090 1.040 2.504 2.871 .724 3.903 -1.137 -1.025 -1.139 -1.126 .503 -.132 -.389 .074 -.310
-1.204 -1.169 -1.553 -1.720 -1.074 -2.038 .284 .209 .268 -.051 -1.132 -.927 -.810 -.957 -.934

344
© InternatIonal Journal of Psychology & PsychologIcal theraPy, 2017, 17, 3 http://www. ijpsy. com
RomeRa, FeRnández Rabanillo, Gómez oRtiz, oRteGa Ruiz, & Casas bolaños
The model shows that demonstration goals directly influenced social competence (ß= .44; p < .05). Avoidance goals (ß= -.47, p <.05) and development goals (ß= -.01; p >.05) showed the inverse influence. Peer support also had a direct influence on social competence (ß= .86; p <.05), while peer perception had an inverse influence (ß= -.01; p >.05).
A new model was developed in which the relationship between peer perception and development goals were omitted in the dependent variable due to their low value. The indices were similar to the original model: SBχ2= 983.383; NNFI= .928; CFI= .932; RMSEA= .041; 90% confidence interval of RMSEA: .036-.46; SRMR= .064 and an R2 value of the dependent variable of .92.
Figure 5. Model for PSCS-II (*p <.05).
Figure 6. Model for SCS (Harter, 2012) (*p < .05).
http://www. ijpsy. com © InternatIonal Journal of Psychology & PsychologIcal theraPy, 2017, 17, 3
assessment oF soCial CompetenCe 345
discussion
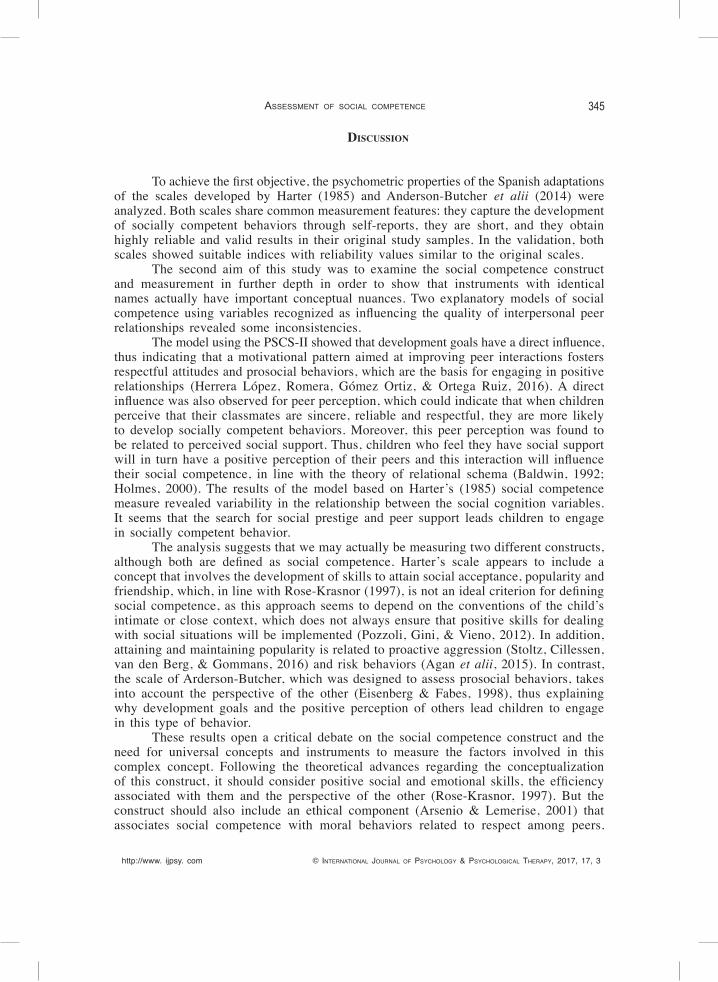
To achieve the first objective, the psychometric properties of the Spanish adaptations of the scales developed by Harter (1985) and Anderson-Butcher et alii (2014) were analyzed. Both scales share common measurement features: they capture the development of socially competent behaviors through self-reports, they are short, and they obtain highly reliable and valid results in their original study samples. In the validation, both scales showed suitable indices with reliability values similar to the original scales.
The second aim of this study was to examine the social competence construct and measurement in further depth in order to show that instruments with identical names actually have important conceptual nuances. Two explanatory models of social competence using variables recognized as influencing the quality of interpersonal peer relationships revealed some inconsistencies.
The model using the PSCS-II showed that development goals have a direct influence, thus indicating that a motivational pattern aimed at improving peer interactions fosters respectful attitudes and prosocial behaviors, which are the basis for engaging in positive relationships (Herrera López, Romera, Gómez Ortiz, & Ortega Ruiz, 2016). A direct influence was also observed for peer perception, which could indicate that when children perceive that their classmates are sincere, reliable and respectful, they are more likely to develop socially competent behaviors. Moreover, this peer perception was found to be related to perceived social support. Thus, children who feel they have social support will in turn have a positive perception of their peers and this interaction will influence their social competence, in line with the theory of relational schema (Baldwin, 1992; Holmes, 2000). The results of the model based on Harter’s (1985) social competence measure revealed variability in the relationship between the social cognition variables. It seems that the search for social prestige and peer support leads children to engage in socially competent behavior.
The analysis suggests that we may actually be measuring two different constructs, although both are defined as social competence. Harter’s scale appears to include a concept that involves the development of skills to attain social acceptance, popularity and friendship, which, in line with Rose-Krasnor (1997), is not an ideal criterion for defining social competence, as this approach seems to depend on the conventions of the child’s intimate or close context, which does not always ensure that positive skills for dealing with social situations will be implemented (Pozzoli, Gini, & Vieno, 2012). In addition, attaining and maintaining popularity is related to proactive aggression (Stoltz, Cillessen, van den Berg, & Gommans, 2016) and risk behaviors (Agan et alii, 2015). In contrast, the scale of Arderson-Butcher, which was designed to assess prosocial behaviors, takes into account the perspective of the other (Eisenberg & Fabes, 1998), thus explaining why development goals and the positive perception of others lead children to engage in this type of behavior.
These results open a critical debate on the social competence construct and the need for universal concepts and instruments to measure the factors involved in this complex concept. Following the theoretical advances regarding the conceptualization of this construct, it should consider positive social and emotional skills, the efficiency associated with them and the perspective of the other (Rose-Krasnor, 1997). But the construct should also include an ethical component (Arsenio & Lemerise, 2001) that associates social competence with moral behaviors related to respect among peers.

346
© InternatIonal Journal of Psychology & PsychologIcal theraPy, 2017, 17, 3 http://www. ijpsy. com
RomeRa, FeRnández Rabanillo, Gómez oRtiz, oRteGa Ruiz, & Casas bolaños
Progress in this line would permit reaching consensus on the degree to which social competence explains involvement in phenomena such as bullying and the response to the victimization of peers (Gómez Ortiz, Romera, & Ortega Ruiz, 2017).
This paper has certain limitations regarding the sample size, the method and the exclusive use of self-reports. In further research, it would be interesting to have a larger number of participants, explore the model with a longitudinal study, take into account the perception of other stakeholders such as teachers, and use measurement instruments that allow exploring social competence from a multidimensional perspective that includes a moral criterion.
references
Agan MLF, Costin AS, Deutz MHF, Edelsbrunner PA, Záliš L, & Franken A (2015). Associations between risk behaviour and social status in European adolescents. European Journal of Developmental Psychology, 12, 189-203. Doi: 10.1080/17405629.2014.975790
Anderson-Butcher D, Amorose AJ, Lower LM, Riley A, Gibson A, & Ruch D (2014). The Case for the Perceived Social Competence Scale II. Research on Social Work Practice, 9, 1-10. Doi: 10.1177/1049731514557362
Baldwin M (1992). Relational schemas and the processing of social information. Psychological Bulletin, 112, 461-484.Brislin RW (1986). The wording and translation of research instruments. In W Lonner & J Berry (Eds.), Field methods
in cross-cultural research (pp. 137-164). Beverly Hills, CA: Sage.Byrne BM (2013). Structural Equation Modeling With AMOS: Basic Concepts, Applications, and Programming.
Multivariate Applications Series.Chen X, Huang X, Chang L, Wang L, & Li D (2010). Aggression, social competence, and academic achievement in
Chinese children: A 5-year longitudinal study. Development and Psychopathology, 22, 583-592. Doi: https://doi.org/10.1017/S0954579410000295
Cichetti D & Bukowski WM (1995). Developmental processes in peer relations and psychopathology. Development and Psychopathology, 7, 587-589.
Connolly J (1989). Social self-efficacy in adolescence: Relations with self-concept, social adjustment, and mental health. Canadian Journal of Behavioral Science, 21, 258- 269.
Cooley JL, Fite PJ, Rubens SL, & Tunno AM (2015). Peer Victimization, Depressive Symptoms, and Rule-Breaking Behavior in Adolescence: The Moderating Role of Peer Social Support. Journal of Psychopathology and Behavioral Assessment, 37, 512-522. Doi:10.1007/s10862-014-9473-7
Crick NR & Dodge KA (1994). A review and reformulation of social information-processing mechanisms in children’s social adjustment. Psychological Bulletin, 115, 74-101.
Eisenberg N & Fabes RA (1992). Emotion, regulation, and the development of social competence. In MS Clark (Ed.), Emotion and social behavior. Review of personality and social psychology, vol. 14 (pp. 119-150). Newbury Park, CA: Sage.
Elousa-Oliden P & Zumbo BD (2008). Reliability coefficients for ordered categorical response scales. Psicothema, 20, 896-901.
Freiberg Hoffmann A, Stover JB, de la Iglesia G, & Fernández Liporace M (2013). Correlaciones policóricas y tetra-córicas en estudios factoriales exploratorios y confirmatorios. Ciencia Psicológica, 7, 151-64.
Gómez-Ortiz O, Romera EM, & Ortega-Ruiz O (2017). Multidimensionality of social competence: Measurement of the construct and its relationship with bullying roles. Revista de Psicodidáctica, 22.
Griffin KW, Epstein JA, Botvin GJ, & Spoth RL (2001). Social competence and substance use among rural youth: Mediating role of social benefit expectancies of use. Journal of Youth and Adolescence, 30, 485-498.
Harter S (1985). The Perceived Competence Scale for Children. Child Development, 53, 87-97.Harter S (1985). The self-perception profile for children: Revision of the perceived competence scale for children.
Denver, CO: University of Denver.

http://www. ijpsy. com © InternatIonal Journal of Psychology & PsychologIcal theraPy, 2017, 17, 3
assessment oF soCial CompetenCe 347
Hawker D & Boulton M (2000). Twenty years’ research on peer victimization and psychosocial maladjustment: A meta-analytic review of cross-sectional studies. Journal of Child Psychology and Psychiatry, 41, 441-455.
Herrera-López M, Romera EM, Ortega-Ruiz R, & Gómez-Ortiz O (2016). Influence of social motivation, self-perception of social efficacy and normative adjustment in the peer setting. Psicothema, 28, 32-39.
Holmes J (2000). Social relationships: The nature and function of relational schemas. European Journal of Social Psychology, 30, 447-495.
Hu L & Bentler P (1999). Cutoff criteria for fit indexes in covariance structure analysis: Conventional criteria versus new alternatives. Structural Equation Modeling, 6, 1–55.
Kohn M & Rosman BLA (1974). Social competence scale and symptom checklist: For the preschool child: Factor dimensions, their cross-instrument generality, and longitudinal persistence. Developmental Psychology, 6, 430-444.
Ladd GW & Troop-Gordon W (2003). The role of chronic peer difficulties in the development of children’s psychological adjustment problems. Child Development, 74, 1344-1367. Doi: 10.1111/1467-8624.00611
Lorenzo-Seva U & Ferrando PJ (2006). FACTOR: A computer program to fit the exploratory factor analysis model. Behavioral Research Methods, Instruments and Computers, 38, 88-91. Doi: 10.3758/BF03192753
Montero I & León OG (2007). A guide for naming research studies in Psychology. International Journal of Clinical and Health Psychology, 7, 847-862.
Moraleda M, González A, & García Gallo J (1998). AECS. Actitudes y Estrategias Cognitivas Sociales. Madrid: TEA Ediciones.
Padilla-Walker LM, Fraser AM, Black BB, & Bean RA (2015). Associations Between friendship, Sympathy, and Prosocial Behavior Toward Friends. Journal of Research on Adolescence, 25, 28-35. Doi: 10.1111/jora.12108
Parker JG, Rubin KH, Price JM, & DeRosier ME (1995). Peer relationships, child development, and adjustment: a developmental psychopathology perspective. In D Cicchetti & D Cohen (Eds.) Developmental Psychopathology. Volumen 2, Risk, Disorder, and Adaptation (pp. 96-161). New York: Wiley.
Pastor Y, Quiles Y, & Pamies L (2012). Apoyo social en la adolescencia: adaptación y propiedades psicométricas del “Social Support Scale for Children” de Harter (1985). Revista de Psicología Social, 27, 39-53.
Pozzoli T, Gini G, & Vieno A (2012). The Role of Individual Correlates and Class Norms in Defending and Passive Bystanding Behavior in Bullying: A Multilevel Analysis. Child Development, 83, 1917-1931. Doi: 10.1111/j.1467-8624.2012.01831.x
Rhemtulla M, Brosseau-Liard PÉ, & Savalei V (2012). When can categorical variables be treated as continuous? A comparison of robust continuous and categorical SEM estimation methods under suboptimal conditions. Psychological Methods, 17, 354-373. Doi: 10.1037/a0029315
Rodkin PC, Ryan AM, Jamison R, & Wilson T (2013). Social goals, social behavior, and social status in middle childhood. Developmental Psychology. 49, 1139-1150. Doi: 10.1037/a0029389
Ryan A & Shim SS (2006). Social achievement goals: the nature and consequences of different orientations toward social competence. Personality and Social Psychology Bulletin, 32, 1246-1263. Doi: 10.1177/0146167206289345
Salmivalli C & Isaacs J (2005). Prospective relations among victimization, rejection, friendlessness, and children’s self- and peer-perceptions. Child Development, 76, 1161-1171. Doi: 10.1111/j.1467-8624.2005.00841.x-i1
Salmivalli C, Ojanen T, Haanpaa J, & Peets K (2005). “I´m OK but You’re Not” and Other Peer-Relational Schemas: Explaining Individual Differences in Children’s Social Goals. Developmental Psychology, 2, 363-375. Doi. 10.1037/0012-1649.41.2.363
Satorra A & Bentler PM (2001). A scaled difference chi-square test statistic for moment structure analysis. Psycho-metrika, 66, 507-514. Doi: 10.1007/BF02296192
Shim SS, Cho Y, & Wang C (2013). Classroom Goal Structures, Social Achievement Goals, and Adjustment in Middle School. Learning and Instruction, 23, 69-77. Doi. 10.1016/j.learninstruc.2012.05.008
Stoltz S, Cillessen AHN, van den Berg, YHM, & Gommans R (2016). Popularity Differentially Predicts Reactive and Proactive Aggression in Early Adolescence. Aggressive Behavior, 42, 29-40. Doi: 10.1002/ab.21603
Waters E, Noyes D, Vaughn BE, & Ricks M (1985). Q-sort definitions of social competence and self esteem:

348
© InternatIonal Journal of Psychology & PsychologIcal theraPy, 2017, 17, 3 http://www. ijpsy. com
RomeRa, FeRnández Rabanillo, Gómez oRtiz, oRteGa Ruiz, & Casas bolaños
Discriminant validity of related constructs in theory and data. Developmental Psychology, 17, 275-288.Welsh M, Parke RD, Widaman K, & O’Neil R (2001). Linkages between children’s social and academic competence:
A longitudinal analysis. Journal of School Psychology, 39, 463–482. Doi: 10.1016/S0022-4405(01)00084-XZimmer-Gembeck MJ, Waters AM, & Kindermann T (2010). A social relations analysis of liking for and by peers:
Associations with gender, depression, peer perception, and worry. Journal of Adolescence, 33, 69-81. Doi: 10.1016/j.adolescence.2009.05.005
Received, December 18, 2016Final Acceptance, May 31, 2017