Embed Size (px)
Citation preview

Constellation Software Inc.
FINANCIAL REPORT
Fourth Quarter Fiscal Year 2016
For the three months and fiscal year ended December 31, 2016

1
CONSTELLATION SOFTWARE INC.
MANAGEMENT’S DISCUSSION AND ANALYSIS (“MD&A”)
The following discussion and analysis should be read in conjunction with the Annual Consolidated Financial Statements for the year ended December 31, 2016, which we prepared in accordance with International Financial Reporting Standards (“IFRS”). Certain information included herein is forward-looking and based upon assumptions and anticipated results that are subject to uncertainties. Should one or more of these uncertainties materialize or should the underlying assumptions prove incorrect, actual results may vary significantly from those expected. See “Forward-Looking Statements” and “Risks and Uncertainties”.
Unless otherwise indicated, all dollar amounts are expressed in U.S. dollars. All references to “$” are to U.S. dollars and all references to “C$” are to Canadian dollars. Certain totals, subtotals and percentages may not reconcile due to rounding.
Additional information about Constellation Software Inc. (the “Company” or “Constellation”), including
our most recently filed Annual Information Form ("AIF"), is available on SEDAR at www.sedar.com.
Forward Looking Statements
Certain statements in this report may contain “forward looking” statements that involve risks, uncertainties and other factors that may cause the actual results, performance or achievements of the Company or industry to be materially different from any future results, performance or achievements expressed or implied by such forward-looking statements. Words such as “may”, “will”, “expect”, “believe”, “plan”, “intend”, “should”, “anticipate” and other similar terminology are intended to identify forward looking statements. These statements reflect current assumptions and expectations regarding future events and operating performance as of the date of this MD&A, February 15, 2017. Forward looking statements involve significant risks and uncertainties, should not be read as guarantees of future performance or results, and will not necessarily be accurate indications of whether or not such results will be achieved. A number of factors could cause actual results to vary significantly from the results discussed in the forward looking statements, including, but not limited to, the factors discussed under “Risks and Uncertainties”. Although the forward looking statements contained in this MD&A are based upon what management of the Company believes are reasonable assumptions, the Company cannot assure investors that actual results will be consistent with these forward looking statements. These forward looking statements are made as of the date of this MD&A and the Company assumes no obligation, except as required by law, to update any forward looking statements to reflect new events or circumstances. This report should be viewed in conjunction with the Company’s other publicly available filings, copies of which can be obtained electronically on SEDAR at www.sedar.com.
Non-IFRS Measures
This MD&A includes certain measures which have not been prepared in accordance with IFRS such as Adjusted EBITA, Adjusted EBITA margin, Adjusted net income, Adjusted net income margin, Net Revenue, Average Invested Capital, and ROIC.
The term ‘‘Adjusted EBITA’’ refers to net income before adjusting for finance and other expense (income), bargain purchase gain, finance costs, income taxes, share in net income or loss of equity investees, impairment of non-financial assets, amortization, TSS membership liability revaluation charge, and foreign exchange gain or loss. The Company believes that Adjusted EBITA is useful supplemental information as it provides an indication of the results generated by the Company’s main business activities prior to taking into consideration how those activities

2
are financed and taxed and also prior to taking into consideration intangible asset amortization and the other items listed above. ‘‘Adjusted EBITA margin’’ refers to the percentage that Adjusted EBITA for any period represents as a portion of total revenue for that period.
‘‘Adjusted net income’’ means net income adjusted for non-cash expenses (income) such as amortization of intangible assets, deferred income taxes, the TSS membership liability revaluation charge, and certain other expenses (income), and excludes the portion of the adjusted net income of Total Specific Solutions (TSS) B.V. (“TSS”) attributable to the minority owners of TSS (see “Capital Resources and Commitments” section). The Company believes that Adjusted net income is useful supplemental information as it provides an indication of the results generated by the Company’s main business activities prior to taking into consideration amortization of intangible assets, deferred income taxes, the TSS membership liability revaluation charge, and certain other non-cash expenses (income) incurred or recognized by the Company from time to time, and adjusts for the portion of TSS’ Adjusted net income not attributable to shareholders of Constellation. ‘‘Adjusted net income margin’’ refers to the percentage that Adjusted net income for any period represents as a portion of total revenue for that period.
“Net Revenue”. Net Revenue is revenue for IFRS purposes less any third party and flow-through expenses. The Company believes Net Revenue is a useful measure since it captures 100% of the license, maintenance and services revenues associated with Constellation’s own products, and only the margin on the lower value-added revenues such as commodity hardware or third party software.
Adjusted EBITA, Adjusted net income, and Net Revenue are not recognized measures under IFRS and,
accordingly, readers are cautioned that Adjusted EBITA, Adjusted net income and Net Revenue should not be construed as alternatives to net income and revenue determined in accordance with IFRS. The Company’s method of calculating Adjusted EBITA, Adjusted net income and Net Revenue may differ from other issuers and, accordingly, Adjusted EBITA, Adjusted net income, and Net Revenue may not be comparable to similar measures presented by other issuers. See ‘‘Results of Operations —Adjusted EBITA’’ and ‘‘— Adjusted net income’’, for a reconciliation of Adjusted EBITA and Adjusted net income to Net income, and “ROIC plus Organic Growth” for a reconciliation of Net Revenue to Revenue. Adjusted EBITA includes 100% of the Adjusted EBITA of TSS, and Net Revenue includes 100% of the Net Revenue of TSS.
“Average Invested Capital” represents the average equity capital of the Company, and is based on the
Company’s estimate of the amount of money that its common shareholders had invested in CSI. Subsequent to that estimate, each period the Company has kept a running tally, adding Adjusted net income, subtracting any dividends, adding any amounts related to share issuances and making some minor adjustments, including adjustments relating to our use of certain incentive programs and the amortization of impaired intangibles. The Company believes that Average Invested Capital is a useful measure as it approximates the retained earnings of the Company prior to taking into consideration amortization of intangible assets, deferred income taxes, and certain other non-cash expenses (income) incurred or recognized by the Company from time to time.
“ROIC” means Return on Invested Capital and represents a ratio of Adjusted net income to Average Invested Capital. The Company believes this is a useful profitability measure as it excludes certain non-cash expenses (income) from both the numerator and denominator.

3
Overview
We acquire, manage and build vertical market software (“VMS”) businesses. Generally, these businesses provide mission critical software solutions that address the specific needs of our customers in particular markets. Our focus on acquiring businesses with growth potential, managing them well and then building them, has allowed us to generate significant cash flows and revenue growth during the past several years.
Our revenue consists primarily of software license fees, maintenance and other recurring fees, professional service fees and hardware sales. Software license revenue is comprised of license fees charged for the use of our software products generally licensed under multiple-year or perpetual arrangements in which the fair value of maintenance and/or professional service fees are determinable, where applicable. Maintenance and other recurring revenue primarily consists of fees charged for customer support on our software products post-delivery and also includes, to a lesser extent, recurring fees derived from software as a service, subscriptions, combined software/support contracts, transaction-related revenues, and hosted products. Maintenance and other recurring fee arrangements generally include ongoing customer support and rights to certain product updates “when and if available” and products sold on a subscription basis. Professional service revenue consists of fees charged for implementation and integration services, customized programming, product training and consulting. Hardware sales include the resale of third party hardware that forms part of our customer solutions, as well as sales of customized hardware assembled internally. Our customers typically purchase a combination of software, maintenance, professional services and hardware, although the type, mix and quantity of each vary by customer and by product.
Expenses consist primarily of staff costs, the cost of hardware, third party licenses, maintenance and professional services to fulfill our customer arrangements, travel and occupancy costs and other general operating expenses.
4
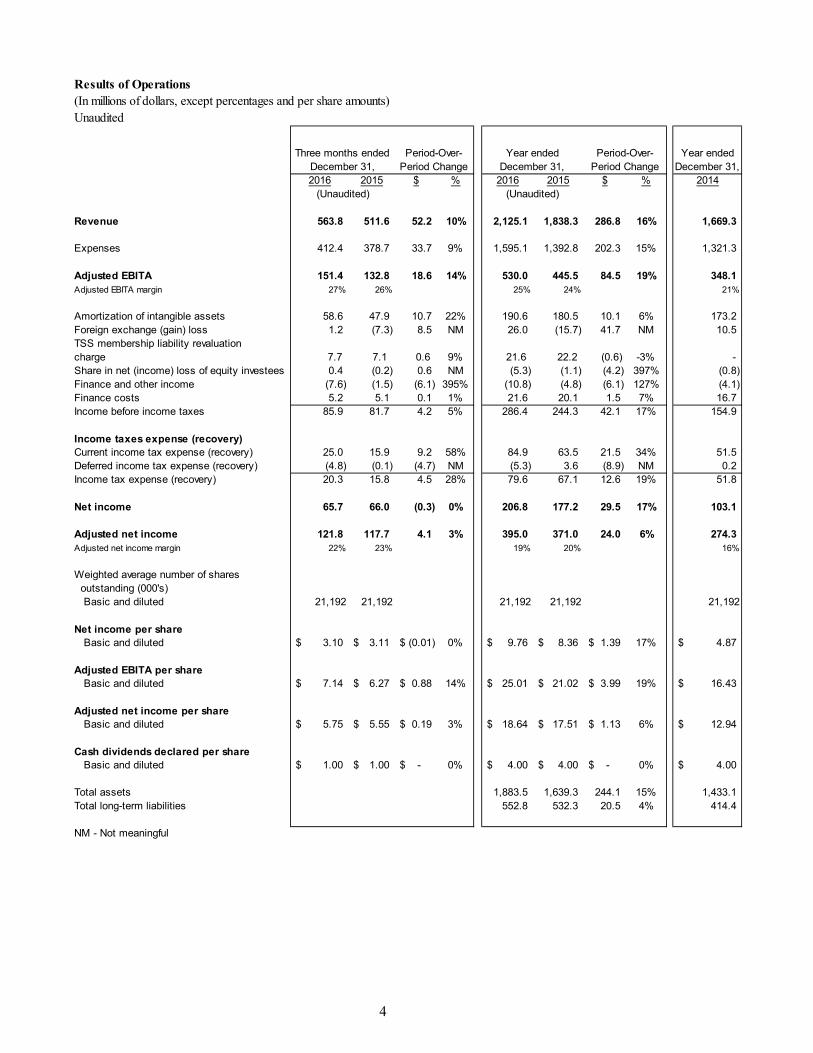
Results of Operations (In millions of dollars, except percentages and per share amounts)Unaudited
Year ended December 31,
2016 2015 $ % 2016 2015 $ % 2014
Revenue 563.8 511.6 52.2 10% 2,125.1 1,838.3 286.8 16% 1,669.3
Expenses 412.4 378.7 33.7 9% 1,595.1 1,392.8 202.3 15% 1,321.3
Adjusted EBITA 151.4 132.8 18.6 14% 530.0 445.5 84.5 19% 348.1 Adjusted EBITA margin 27% 26% 25% 24% 21%
Amortization of intangible assets 58.6 47.9 10.7 22% 190.6 180.5 10.1 6% 173.2 Foreign exchange (gain) loss 1.2 (7.3) 8.5 NM 26.0 (15.7) 41.7 NM 10.5 TSS membership liability revaluation charge 7.7 7.1 0.6 9% 21.6 22.2 (0.6) -3% - Share in net (income) loss of equity investees 0.4 (0.2) 0.6 NM (5.3) (1.1) (4.2) 397% (0.8) Finance and other income (7.6) (1.5) (6.1) 395% (10.8) (4.8) (6.1) 127% (4.1) Finance costs 5.2 5.1 0.1 1% 21.6 20.1 1.5 7% 16.7 Income before income taxes 85.9 81.7 4.2 5% 286.4 244.3 42.1 17% 154.9
Income taxes expense (recovery)Current income tax expense (recovery) 25.0 15.9 9.2 58% 84.9 63.5 21.5 34% 51.5 Deferred income tax expense (recovery) (4.8) (0.1) (4.7) NM (5.3) 3.6 (8.9) NM 0.2 Income tax expense (recovery) 20.3 15.8 4.5 28% 79.6 67.1 12.6 19% 51.8
Net income 65.7 66.0 (0.3) 0% 206.8 177.2 29.5 17% 103.1
Adjusted net income 121.8 117.7 4.1 3% 395.0 371.0 24.0 6% 274.3 Adjusted net income margin 22% 23% 19% 20% 16%
Weighted average number of shares outstanding (000's) Basic and diluted 21,192 21,192 21,192 21,192 21,192
Net income per share Basic and diluted 3.10$ 3.11$ (0.01)$ 0% 9.76$ 8.36$ 1.39$ 17% 4.87$
Adjusted EBITA per share Basic and diluted 7.14$ 6.27$ 0.88$ 14% 25.01$ 21.02$ 3.99$ 19% 16.43$
Adjusted net income per share Basic and diluted 5.75$ 5.55$ 0.19$ 3% 18.64$ 17.51$ 1.13$ 6% 12.94$
Cash dividends declared per share Basic and diluted 1.00$ 1.00$ -$ 0% 4.00$ 4.00$ -$ 0% 4.00$
Total assets 1,883.5 1,639.3 244.1 15% 1,433.1 Total long-term liabilities 552.8 532.3 20.5 4% 414.4
NM - Not meaningful
Three months ended December 31,
Period-Over-Period Change
Year ended December 31,
Period-Over-Period Change
(Unaudited) (Unaudited)

5
Comparison of the three and twelve months ended December 31, 2016 and 2015
Revenue:
Total revenue for the quarter ended December 31, 2016 was $563.8 million, an increase of 10%, or $52.2 million, compared to $511.6 million for the comparable period in 2015. For the 2016 fiscal year total revenues were $2,125.1 million, an increase of 16%, or $286.8 million, compared to $1,838.3 million for the comparable period in 2015. The increase for both the three and twelve month periods compared to the same periods in the prior year is primarily attributable to growth from acquisitions as the Company experienced organic growth of negative 1% and positive 1% respectively, positive 1% and 2% respectively after adjusting for the impact of the net appreciation of the US dollar against most major currencies in which the Company transacts business. For acquired companies, organic growth is calculated as the difference between actual revenues achieved by each company in the financial period following acquisition compared to the estimated revenues they achieved in the corresponding financial period preceding the date of acquisition by Constellation. The Company’s Q4 2016 organic growth rate was negatively impacted as a result of higher than average hardware sales recorded in the quarter ended December 31, 2015 in our public sector relating to deliveries on various large projects in our transit vertical during that quarter. Hardware revenue is primarily recognized on delivery and as such can result in temporary spikes in revenue. Organic growth for the three and twelve month periods ended December 31, 2016 was positive 4% and 3% respectively after adjusting for both foreign exchange and hardware sales.
The following table displays the breakdown of our revenue according to revenue type:
We aggregate our business into two distinct segments for financial reporting purposes: (i) the public sector reportable segment, which includes business units focused primarily on government and government-related customers, and (ii) the private sector reportable segment, which includes business units focused primarily on commercial customers.
The following table displays our revenue by reportable segment and the percentage change for the three and twelve months ended December 31, 2016 compared to the same periods in 2015:
Organic Growth
Organic Growth
2016 2015 $ % % 2016 2015 $ % %
Licenses 39.4 34.4 5.1 15% 5.6 -1% 142.5 131.0 11.5 9% 27.7 -10%Professional services 117.0 103.5 13.5 13% 12.9 1% 434.5 384.6 49.9 13% 49.6 0%Hardware and other 38.7 53.3 (14.6) -27% 1.1 -29% 147.7 152.9 (5.2) -3% 8.2 -8%Maintenance and other recurring 368.6 320.4 48.2 15% 36.7 3% 1,400.3 1,169.8 230.5 20% 187.6 3%
563.8 511.6 52.2 10% 56.4 -1% 2,125.1 1,838.3 286.8 16% 273.2 1%$M - Millions of dollarsNote 1: Estimated pre-acquisition revenues from companies acquired after September 30, 2015. (Obtained from unaudited vendor financial information.)Note 2: Estimated pre-acquisition revenues from companies acquired since the beginning of 2015. (Obtained from unaudited vendor financial information.)
Year ended December 31,
Period-Over-Period Change
2015 Proforma
Adjustment (Note 2)
($M, except percentages) ($M, except percentages)
Q415 Proforma
Adjustment (Note 1)
Three months ended December 31,
Period-Over-Period Change

6
Public Sector
For the quarter ended December 31, 2016, total revenue in the public sector reportable segment increased 10%, or $34.4 million to $383.6 million, compared to $349.3 million for the quarter ended December 31, 2015. For the fiscal year ended December 31, 2016, total revenue increased by 13%, or $159.8 million to $1,428.3 million, compared to $1,268.5 million for the comparable period in 2015. For purposes of calculating organic growth, estimated pre-acquisition revenues included from the relevant companies acquired in 2015 and 2016 were $40.8 million and $155.1 million for the three and twelve month periods ended December 31, 2015, respectively. Organic revenue growth was negative 2% and 0% respectively for the three and twelve months ended December 31, 2016 compared to the same periods in 2015, and 0% and 1% respectively after adjusting for the impact of the net appreciation of the US dollar against most major currencies in which the Company transacts business. The public sector’s Q4 2016 organic growth rate was negatively impacted as a result of higher than average hardware sales recorded in the quarter ended December 31, 2015 in our public sector relating to deliveries on various large projects in our transit vertical during that quarter. Hardware revenue is primarily recognized on delivery and as such can result in temporary spikes in revenue. Organic growth for the public sector for the three and twelve month periods ended December 31, 2016 was 4% and 2% respectively after adjusting for both foreign exchange and hardware sales.
Private Sector
For the quarter ended December 31, 2016, total revenue in the private sector reportable segment increased 11%, or $17.9 million to $180.2 million, compared to $162.3 million for the quarter ended December 31, 2015. For the fiscal year ended December 31, 2016, total revenue increased by 22%, or $127.0 million to $696.8 million, compared to $569.8 million for the comparable period in 2015. For purposes of calculating organic growth, estimated pre-acquisition revenues included from the relevant companies acquired in 2015 and 2016 were $15.6 million and $118.1 million for the three and twelve month periods ended December 31, 2015, respectively. Organic revenue growth was 1% for both the three and twelve months ended December 31, 2016 compared to the same periods in 2015, and 3% in each case after adjusting for the impact of the net appreciation of the US dollar against most major currencies in which the Company transacts business.
Organic Growth
Organic Growth
2016 2015 $ % % 2016 2015 $ % %
Public SectorLicenses 25.0 22.0 3.0 14% 3.9 -3% 87.6 86.0 1.6 2% 16.6 -15%Professional services 93.9 83.3 10.7 13% 10.1 1% 344.4 311.5 32.9 11% 35.1 -1%Hardware and other 32.3 46.4 (14.1) -30% 0.4 -31% 120.4 126.4 (5.9) -5% 2.2 -6%Maintenance and other recurring 232.4 197.6 34.8 18% 26.4 4% 875.9 744.6 131.2 18% 101.1 4%
383.6 349.3 34.4 10% 40.8 -2% 1,428.3 1,268.5 159.8 13% 155.1 0%
Private SectorLicenses 14.4 12.3 2.1 17% 1.8 2% 55.0 45.0 9.9 22% 11.2 -2%Professional services 23.1 20.2 2.9 14% 2.8 0% 90.1 73.1 17.0 23% 14.5 3%Hardware and other 6.5 6.9 (0.5) -7% 0.7 -16% 27.3 26.6 0.8 3% 5.9 -16%Maintenance and other recurring 136.2 122.8 13.4 11% 10.3 2% 524.5 425.2 99.3 23% 86.5 3%
180.2 162.3 17.9 11% 15.6 1% 696.8 569.8 127.0 22% 118.1 1%
Note 1: Estimated pre-acquisition revenues from companies acquired after September 30, 2015. (Obtained from unaudited vendor financial information.)Note 2: Estimated pre-acquisition revenues from companies acquired since the beginning of 2015. (Obtained from unaudited vendor financial information.)
2015 Proforma
Adjustment (Note 2)
($M, except percentages) ($M, except percentages)
Three months ended December 31,
Period-Over-Period Change
Q415 Proforma
Adjustment (Note 1)
Year ended December 31,
Period-Over-Period Change

7
Expenses:
The following table displays the breakdown of our expenses:
Overall expenses for the quarter ended December 31, 2016 increased 9%, or $33.7 million to $412.4
million, compared to $378.7 million during the same period in 2015. As a percentage of total revenue, expenses decreased to 73% for the quarter ended December 31, 2016 from 74% for the same period in 2015. During the fiscal year ended December 31, 2016, expenses increased 15%, or $202.3 million to $1,595.1 million, compared to $1,392.8 million during the same period in 2015. As a percentage of total revenue, expenses decreased to 75% for the fiscal year ended December 31, 2016 from 76% for the same period in 2015. Our average employee headcount grew 16% in 2016 from 10,420 for the quarter ended December 31, 2015 to 12,124 for the quarter ended December 31, 2016 primarily due to acquisitions. For both the three and twelve months ended December 31, 2016 the appreciation of the US dollar against most other major currencies in which the Company transacts business resulted in an approximate 2% reduction in expenses compared to the comparable periods of 2015.
Staff expense – Staff expenses increased 15% or $35.9 million for the quarter ended December 31, 2016 and 16% or $146.6 million for the fiscal year ended December 31, 2016 over the same periods in 2015. Staff expense can be broken down into five key operating departments: Professional Services, Maintenance, Research and Development, Sales and Marketing, and General and Administrative. Included within staff expenses for each of the above five departments are personnel and related costs associated with providing the necessary services. The table below compares the period over period variances.
2016 2015 $ % 2016 2015 $ %
ExpensesStaff 277.2 241.3 35.9 15% 1,059.0 912.4 146.6 16%Hardware 20.6 32.1 (11.6) -36% 82.3 90.3 (8.0) -9%Third party license, maintenance and professional services 49.9 46.5 3.4 7% 192.7 163.7 29.0 18%Occupancy 14.1 11.8 2.3 20% 51.7 43.2 8.5 20%
Travel, Telecommunications, Supplies & Software and equipment 34.4 33.0 1.4 4% 129.8 114.5 15.3 13%Professional fees 8.3 6.7 1.7 25% 28.2 22.6 5.6 25%Other, net 0.9 2.4 (1.5) -61% 29.0 29.0 (0.1) 0%Depreciation 6.9 5.0 2.0 40% 22.4 17.0 5.3 31%
412.4 378.7 33.7 9% 1,595.1 1,392.8 202.3 15%
Three months ended December 31,
Period-Over-Period Change
Year ended December 31,
Period-Over-Period Change
($M, except percentages) ($M, except percentages)
2016 2015 $ % 2016 2015 $ %
Professional services 61.5 54.4 7.1 13% 237.9 213.6 24.2 11%Maintenance 57.1 48.6 8.4 17% 213.8 176.5 37.3 21%Research and development 76.3 69.0 7.3 11% 294.1 259.2 34.9 13%Sales and marketing 38.7 32.5 6.2 19% 147.9 124.4 23.5 19%General and administrative 43.7 36.8 6.9 19% 165.3 138.6 26.6 19%
277.2 241.3 35.9 15% 1,059.0 912.4 146.6 16%
Three months ended December 31,
Period-Over-Period Change
Year ended December 31,
Period-Over-Period Change
($M, except percentages) ($M, except percentages)
8
The increase in staff expenses for both the three and twelve month periods ended December 31, 2016 was primarily due to the growth in the number of employees compared to the same periods in 2015 primarily due to acquisitions.
Hardware expenses – Hardware expenses decreased 36% or $11.6 million for the quarter ended December 31, 2016 and 9% or $8.0 million for the fiscal year ended December 31, 2016 over the same periods in 2015, in conjunction with the decline in hardware revenue. Hardware margins for the three and twelve months ended December 31, 2016 were 47% and 44% respectively as compared to 40% and 41% for the comparable periods in 2015.
Third party license, maintenance and professional services expenses – Third party license, maintenance and professional services expenses increased 7% or $3.4 million for the quarter ended December 31, 2016 and 18% or $29.0 million for the fiscal year ended December 31, 2016 over the same periods in 2015. The increase is primarily due to third party license, maintenance and professional services expenses of acquired businesses.
Occupancy expenses – Occupancy expenses increased 20% or $2.3 million for the quarter ended December 31, 2016 and 20% or $8.5 million for the fiscal year ended December 31, 2016 over the same periods in 2015. The increase in occupancy expenses is primarily due to the occupancy expenses of acquired businesses.
Travel, Telecommunications, Supplies & Software and equipment expenses – Travel, Telecommunications, Supplies & Software and equipment expenses increased 4% or $1.4 million for the quarter ended December 31, 2016 and 13% or $15.3 million for the fiscal year ended December 31, 2016 over the same periods in 2015. The increase in these expenses is primarily due to expenses incurred by acquired businesses.
Professional fees – Professional fees increased 25% or $1.7 million for the quarter ended December 31, 2016 and 25% or $5.6 million for the fiscal year ended December 31, 2016 over the same periods in 2015. The increase in professional fees is primarily the result of an increase in broker fees, due diligence services, and legal fees associated with acquisitions, and legal fees associated with the renewal of the Company’s credit facility.
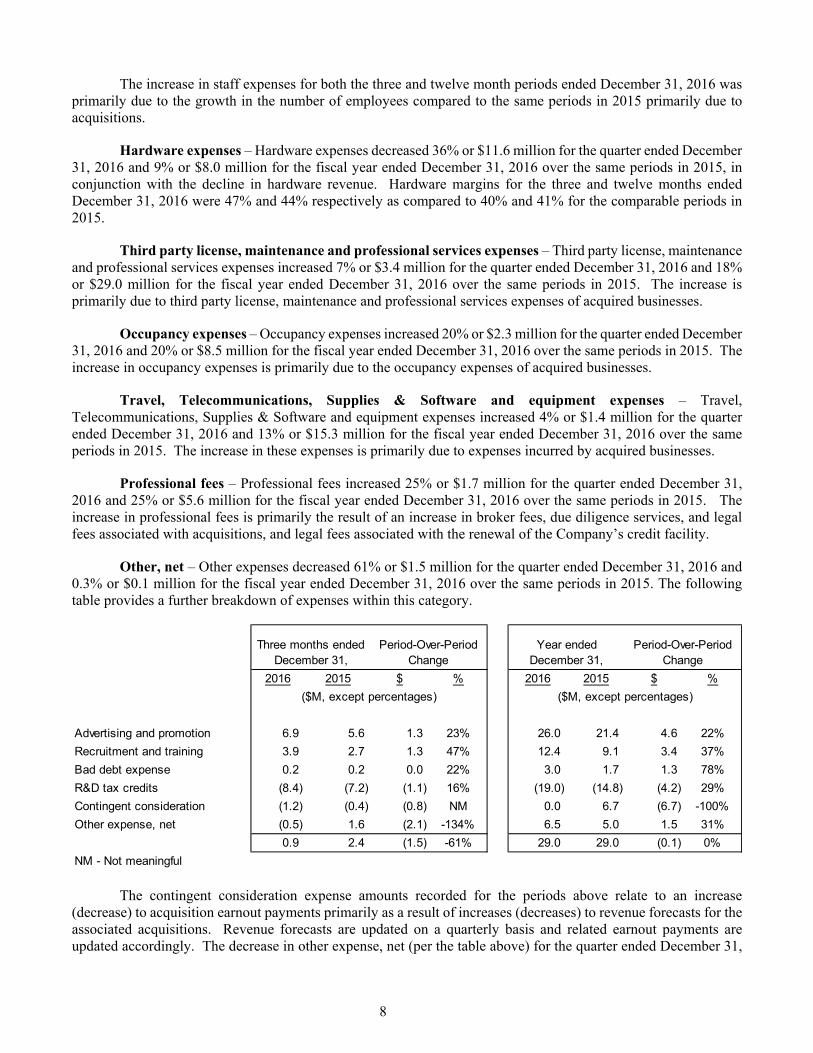
Other, net – Other expenses decreased 61% or $1.5 million for the quarter ended December 31, 2016 and 0.3% or $0.1 million for the fiscal year ended December 31, 2016 over the same periods in 2015. The following table provides a further breakdown of expenses within this category.
The contingent consideration expense amounts recorded for the periods above relate to an increase (decrease) to acquisition earnout payments primarily as a result of increases (decreases) to revenue forecasts for the associated acquisitions. Revenue forecasts are updated on a quarterly basis and related earnout payments are updated accordingly. The decrease in other expense, net (per the table above) for the quarter ended December 31,
2016 2015 $ % 2016 2015 $ %
Advertising and promotion 6.9 5.6 1.3 23% 26.0 21.4 4.6 22%
Recruitment and training 3.9 2.7 1.3 47% 12.4 9.1 3.4 37%
Bad debt expense 0.2 0.2 0.0 22% 3.0 1.7 1.3 78%
R&D tax credits (8.4) (7.2) (1.1) 16% (19.0) (14.8) (4.2) 29%
Contingent consideration (1.2) (0.4) (0.8) NM 0.0 6.7 (6.7) -100%
Other expense, net (0.5) 1.6 (2.1) -134% 6.5 5.0 1.5 31%
0.9 2.4 (1.5) -61% 29.0 29.0 (0.1) 0%
NM - Not meaningful
Three months ended December 31,
Period-Over-Period Change
Year ended December 31,
Period-Over-Period Change
($M, except percentages) ($M, except percentages)
9
2016 is primarily related to the $3.2 million termination fee received from Redknee Solutions Inc. (“Redknee”) after Redknee terminated a subscription agreement they had entered into with the Company. For the fiscal year ended December 31, 2016 other expense, net (per the table above) includes a legal settlement expense with no similar expense for the three or twelve months ended December 31, 2015, that partially offsets the benefit of the Redknee termination fee. Remaining expense increases are primarily due to expenses incurred by acquired businesses.
Depreciation – Depreciation of property and equipment increased 40% or $2.0 million for the quarter ended December 31, 2016 and increased 31% or $5.3 million for the fiscal year ended December 31, 2016 over the same periods in 2015.
Other Income and Expenses:
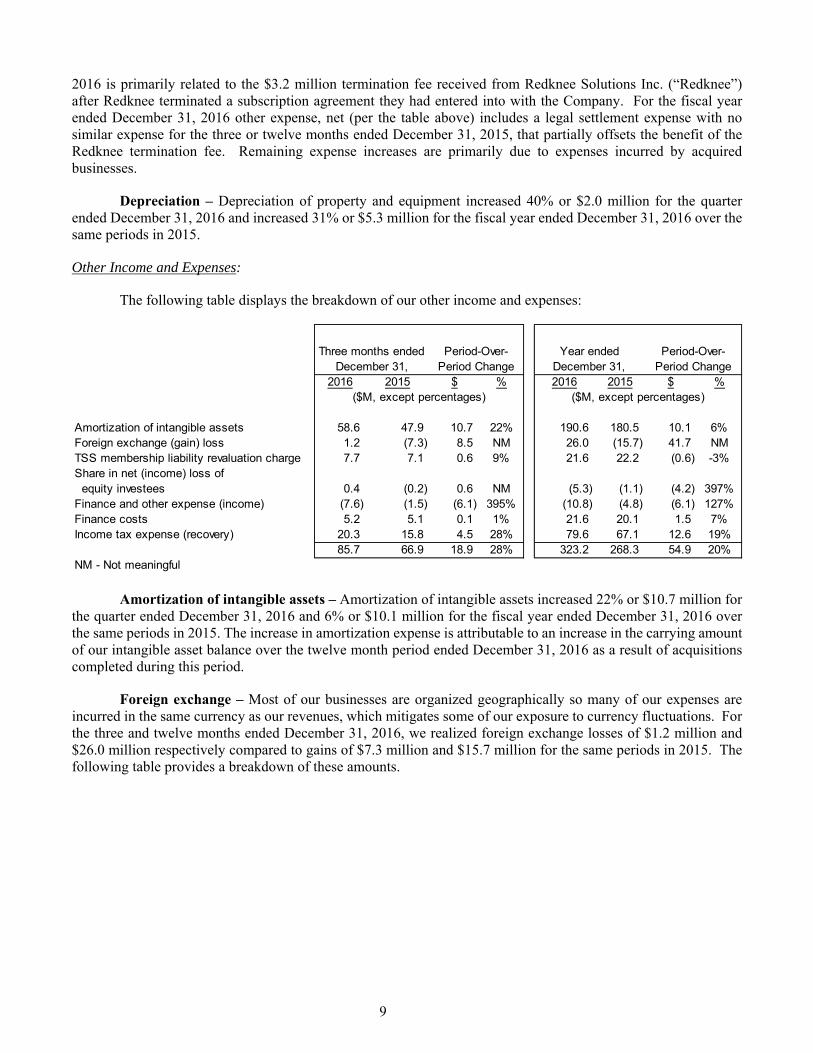
The following table displays the breakdown of our other income and expenses:
Amortization of intangible assets – Amortization of intangible assets increased 22% or $10.7 million for the quarter ended December 31, 2016 and 6% or $10.1 million for the fiscal year ended December 31, 2016 over the same periods in 2015. The increase in amortization expense is attributable to an increase in the carrying amount of our intangible asset balance over the twelve month period ended December 31, 2016 as a result of acquisitions completed during this period.
Foreign exchange – Most of our businesses are organized geographically so many of our expenses are incurred in the same currency as our revenues, which mitigates some of our exposure to currency fluctuations. For the three and twelve months ended December 31, 2016, we realized foreign exchange losses of $1.2 million and $26.0 million respectively compared to gains of $7.3 million and $15.7 million for the same periods in 2015. The following table provides a breakdown of these amounts.
2016 2015 $ % 2016 2015 $ %
Amortization of intangible assets 58.6 47.9 10.7 22% 190.6 180.5 10.1 6%Foreign exchange (gain) loss 1.2 (7.3) 8.5 NM 26.0 (15.7) 41.7 NMTSS membership liability revaluation charge 7.7 7.1 0.6 9% 21.6 22.2 (0.6) -3%Share in net (income) loss of equity investees 0.4 (0.2) 0.6 NM (5.3) (1.1) (4.2) 397%Finance and other expense (income) (7.6) (1.5) (6.1) 395% (10.8) (4.8) (6.1) 127%Finance costs 5.2 5.1 0.1 1% 21.6 20.1 1.5 7%Income tax expense (recovery) 20.3 15.8 4.5 28% 79.6 67.1 12.6 19%
85.7 66.9 18.9 28% 323.2 268.3 54.9 20%NM - Not meaningful
($M, except percentages) ($M, except percentages)
Three months ended December 31,
Period-Over-Period Change
Year ended December 31,
Period-Over-Period Change

10
The remaining foreign exchange gains and losses per the table above are primarily related to the unrealized foreign exchange translation gains and losses of certain net Canadian dollar denominated liability balances to US dollars as a result of the Canadian dollar’s depreciation or appreciation against the US dollar.
TSS membership liability revaluation charge – The valuation of the TSS membership liability increased by approximately 12% or $7.7 million for the quarter ended December 31, 2016 and by approximately 40% or $21.6 million for the fiscal year ended December 31, 2016 primarily as a result of the growth in TSS maintenance revenue in the respective periods. Valuation increases of $7.1 million and $22.2 million were recorded in the three and twelve months ended December 31, 2015. The liability recorded on the balance sheet increased by 35% or $18.9 million over the twelve month period as a result of a foreign exchange gain that was recorded through other comprehensive income. The TSS membership liability is denominated in Euros and the Euro depreciated 4% versus the US dollar during 2016.
Share in net (income) loss of equity investees – Share in the net (income) loss of equity investees was a loss of $0.4 million and income of $5.3 million for the three and twelve months ended December 31, 2016 respectively, compared to income of $0.2 million and $1.1 million for the same periods in 2015. The primary reason for the increase in net income for the twelve months ended December 31, 2016 was the gain on disposal of assets realized by an equity investee in the period.
Finance and other income – Finance and other income for the quarter ended December 31, 2016 was $7.6
million compared to $1.5 million for the same period in 2015. During the fiscal year ended December 31, 2016, finance and other income was $10.8 million compared to $4.8 million for the same period in 2015. Gains of $2.7 million and $5.2 million relating to the sale of equity securities available-for-sale were recorded during the three and twelve months ended December 31, 2016 and no similar gains were recorded in 2015. In addition, interest earned on cash balances totalling $0.5 million and $0.8 million were recorded during the three and twelve months ended December 31, 2016 with immaterial amounts recorded in 2015, in line with the increase in cash balances in 2016 as compared to 2015. The remaining other income amounts primarily relate to acquired net tangible asset adjustments for acquisitions recorded subsequent to the finalization of purchase accounting.
Finance costs – Finance costs for the quarter ended December 31, 2016 increased $0.1 million to $5.2
million, compared to $5.1 million for the same period in 2015. During the fiscal year ended December 31, 2016, finance costs increased $1.5 million to $21.6 million, from $20.1 million over the same period in 2015. The increase in finance costs for the fiscal year ended December 31, 2016 primarily relates to interest paid on the Company’s unsecured subordinated floating rate debentures. On September 30, 3015, the Company issued an additional tranche of debentures with a total principal value of C$186.2 million for total proceeds of C$214.2 million. The principal amount outstanding during the nine months ended September 30, 2015 was C$96.0 million, versus C$282.2 million
2016 2015 $ % 2016 2015 $ %
Unrealized foreign exchange (gain) loss related to:
‐ revaluation of intercompany loans between
entities with differing functional currencies (1) 6.8 2.6 4.1 157% 17.7 4.9 12.8 261%
‐ revaulation of the Company's unsecured subordinated floating rate debentures as a result of the appreciation (depreciation) of the Canadian dollar against the US dollar. (5.2) (7.6) 2.4 -31% 7.0 (18.0) 25.0 NM
Remaining foreign exchange (gain) loss (0.4) (2.4) 2.0 -83% 1.3 (2.7) 4.0 NM
1.2 (7.3) 8.5 NM 26.0 (15.7) 41.7 NM
NM - Not meaningful
(1) Offsetting amounts recorded in other comprehensive income. Net impact to Total comprehensive income for each period is nil.
Three months ended December 31,
Period-Over-Period Change
Year ended December 31,
Period-Over-Period Change
($M, except percentages) ($M, except percentages)

11
during the three months ended December 31, 2015 and fiscal year ended December 31, 2016. The interest expense recorded on the debentures issued on September 30, 2015 is reduced by the amortization of the 15% premium that was received when issued. The premium is being amortized over five years from the date of issuance. The increase in finance costs relating to the debentures was partially offset by reduced interest expense on our credit facilities resulting from decreased average borrowings and interest rates in the three and twelve month periods ended December 31, 2016 compared to the same periods in 2015.
Income taxes – We operate globally and we calculate our tax provision in each of the jurisdictions in which
we conduct business. Our effective tax rate on a consolidated basis is, therefore, affected by the realization and anticipated relative profitability of our operations in those various jurisdictions, as well as different tax rates that apply and our ability to utilize tax losses and other credits. For the quarter ended December 31, 2016, income tax expense increased $4.5 million to $20.3 million compared to $15.8 million for the same period in 2015. During the fiscal year ended December 31, 2016, income tax expense increased $12.6 million to $79.6 million compared to $67.1 million for the same period in 2015. Current tax expense as a percentage of adjusted net income before tax was 17% and 18% for the three and twelve months ended December 31, 2016 respectively, versus 12% and 15% for the same periods in 2015. This rate has historically approximated our cash tax rate however the quarterly rate can sometimes fall outside of the annual range due to out of period adjustments. As a result of the depletion of tax credits available to certain of our Canadian entities and a proportionately higher level of profitability in the US, the annual rate has gradually increased since 2013. Current tax expense reflects gross taxes before the application of R&D tax credits which are classified as part of “other, net” expenses in the statement of income. The deferred income tax expense decrease of $4.7 million and $8.9 million for the three and twelve months ended December 31, 2016 respectively, relates to various items including changes in recognition of certain deferred income tax assets.
Net Income and Earnings per Share:
Net income for the quarter ended December 31, 2016 was $65.7 million compared to net income of $66.0 million for the same period in 2015 representing a decrease of 0.5%. On a per share basis this translated into a net income per diluted share of $3.10 in the quarter ended December 31, 2016 compared to net income per diluted share of $3.11 for the same period in 2015. For the fiscal year ended December 31, 2016, net income was $206.8 million or $9.76 per diluted share compared to $177.2 million or $8.36 per diluted share for the same period in 2015, representing an increase of 17%.
There were no changes in the number of shares outstanding.
Adjusted EBITA:
For the quarter ended December 31, 2016, Adjusted EBITA increased to $151.4 million compared to $132.8 million for the same period in 2015 representing an increase of 14%. Adjusted EBITA margin was 27% for the quarter ended December 31, 2016 and 26% for the same period in 2015. For the 2016 fiscal year, Adjusted EBITA increased to $530.0 million compared to $445.5 million during the same period in 2015, representing an increase of 19%. Adjusted EBITA margin was 25% in the 2016 fiscal year and 24% for the same period in 2015. See “Non-IFRS Measures” for a description of Adjusted EBITA and Adjusted EBITA margin.

12
The following table reconciles Adjusted EBITA to net income:
Adjusted net income:
For the quarter ended December 31, 2016, Adjusted net income increased to $121.8 million from $117.7 million for the same period in 2015, representing an increase of 3%. Adjusted net income margin was 22% for the quarter ended December 31, 2016 and 23% for the same period in 2015. For the 2016 fiscal year, Adjusted net income increased to $395.0 million from $371.0 million during the same period in 2015, representing an increase of 6%. Adjusted net income margin was 19% in the 2016 fiscal year and 20% for the same period in 2015. See “Non-IFRS Measures” for a description of Adjusted net income and Adjusted net income margin.
Non-controlling interest in the Adjusted net income of TSS - As explained in the “Capital Resources
and Commitments” section below, in Q4 2014 33.29% of the voting interests in TSS were sold by us, however no adjustment has been made in the Company’s Consolidated Financial Statements to reflect the 33.29% of earnings that are not attributable to Constellation shareholders. Instead, due to an option available to the minority owners to exercise a put option to sell all or a portion of their interests back to Constellation, the minority interest is accounted for as a liability on the Company’s balance sheet. The liability is revalued at each period end in accordance with an agreed upon valuation methodology with the change being included in net income. The non-controlling interest in the Adjusted net income of TSS for the three and twelve months ended December 31, 2016 was $5.4 million and $18.7 million respectively, as compared to $3.1 million and $12.6 million for the same periods in 2015.
2016 2015 2016 2015
Total revenue 563.8 511.6 2,125.1 1,838.3
Net income 65.7 66.0 206.8 177.2 Adjusted for:Income tax expense (recovery) 20.3 15.8 79.6 67.1 Foreign exchange (gain) loss 1.2 (7.3) 26.0 (15.7) TSS membership liability revaluation charge 7.7 7.1 21.6 22.2 Share in net (income) loss of equity investees 0.4 (0.2) (5.3) (1.1) Finance and other income (7.6) (1.5) (10.8) (4.8) Finance costs 5.2 5.1 21.6 20.1 Amortization of intangible assets 58.6 47.9 190.6 180.5
Adjusted EBITA 151.4 132.8 530.0 445.5 Adjusted EBITA margin 27% 26% 25% 24%
Three months ended December 31,
Year ended December 31,
($M, except percentages) ($M, except percentages)

13
The following table reconciles Adjusted net income to Net income:
Quarterly Results
We experience seasonality in our operating results in that Adjusted net income margins in the first quarter of every year are typically lower than margins achieved in the second, third and fourth quarters. The key drivers for the lower margins are increased payroll tax costs associated with our annual bonus payments that are made in the month of March, and the fact that historically there has been a consistent focus at year end to complete sales implementation projects which generally translates into increased professional services revenue in the fourth quarter and decreased professional services revenue in the first quarter. Our quarterly results may also fluctuate as a result of the various acquisitions which may be completed by the Company in any given quarter. We may experience variations in our net income on a quarterly basis depending upon the timing of certain expenses or gains, which may include changes in provisions, acquired contract liabilities, bargain purchase gains and gains or losses on the sale of financial and other assets.
2016 2015 2016 2015
Total revenue 563.8 511.6 2,125.1 1,838.3
Net income 65.7 66.0 206.8 177.2 Adjusted for:Amortization of intangible assets 58.6 47.9 190.6 180.5 TSS membership liability revaluation charge 7.7 7.1 21.6 22.2 Less non-controlling interest in the Adjusted net income of TSS (5.4) (3.1) (18.7) (12.6) Deferred income tax expense (recovery) (4.8) (0.1) (5.3) 3.6
Adjusted net income 121.8 117.7 395.0 371.0 Adjusted net income margin 22% 23% 19% 20%
($M, except percentages) ($M, except percentages)
Three months ended December 31,
Year ended December 31,
Dec. 31 Mar. 31 Jun. 30 Sep. 30 Dec. 31 Mar. 31 Jun. 30 Sep. 30 Dec. 312014 2015 2015 2015 2015 2016 2016 2016 2016
Revenue 439.8 422.9 443.5 460.4 511.6 487.0 528.7 545.6 563.8 Net income 39.3 32.9 32.7 45.7 66.0 18.7 55.0 67.5 65.7 Adjusted net income 86.6 74.7 79.7 98.9 117.7 62.5 89.9 120.7 121.8 Adjusted net income margin 20% 18% 18% 21% 23% 13% 17% 22% 22%
Net income per share Basic & diluted 1.86 1.55 1.54 2.16 3.11 0.88 2.60 3.18 3.10
Adjusted net income per share Basic & diluted 4.09 3.52 3.76 4.67 5.55 2.95 4.24 5.70 5.75
Quarter Ended
($M, except per share amounts)

14
ROIC plus Organic Growth
We believe the metric of ROIC plus organic Net Revenue growth is a proxy for the annual increase in shareholder value. The table below summarizes this metric for 2015 and 2016. Further discussion on this metric is included in the Company’s annual letters to shareholders available on SEDAR at www.sedar.com. For acquired companies, organic Net Revenue growth is calculated as the difference between actual Net Revenues achieved by each company in the financial period following acquisition compared to the estimated Net Revenues they achieved in the corresponding financial period preceding the date of acquisition by Constellation.
Organic Net Revenue growth excludes any adjustment for foreign exchange.
See “Non-IFRS Measures” for a description of Adjusted Net Income, Average Invested Capital, ROIC and Net Revenue.
The following table reconciles Net Revenue to Revenue:
2016 2015
Adjusted Net Income 395 371
Average Invested Capital 1,261 965
ROIC 31% 38%
Organic Net Revenue growth (YoY) 1% ‐3%
ROIC + organic Net Revenue growth 32% 35%
Fiscal Year ended December 31,
($M, except percentages)
2016 2015
Revenue 2,125.1 1,838.3
Adjusted for:
Hardware expenses (82.3) (90.3)
Third party license, maintenance
and professional services expenses (192.7) (163.7)
Flow through expenses (18.9) (18.1)
Net Revenue 1,831.2 1,566.2
Fiscal Year ended December 31,
($M)

15
Liquidity
Our net cash position (cash less bank indebtedness excluding capitalized transaction costs) increased by $188.5 million to $227.3 million in the quarter ended December 31, 2016 resulting from cash flows from operations exceeding capital deployed on acquisitions. A repayment of €8 million (approximately $9 million) was made in 2016 on our Euro denominated credit facility however the impact of foreign exchange on this facility resulted in a net decrease in the fair value of $13.4 million to $126.2 million at December 31, 2016 compared to $139.6 million at December 31, 2015. In addition, cash increased by $175.0 million to $353.5 million at December 31, 2016 compared to $178.5 million at December 31, 2015.
Total assets increased $244.2 million, from $1,639.3 million at December 31, 2015 to $1,883.5 million at December 31, 2016. The increase is primarily due to an increase in cash of $175.0 million, and an increase in intangible assets of $41.6 million primarily relating to acquisitions made since December 31, 2015. At December 31, 2016 TSS held a cash balance of $9.0 million. As explained in the “Capital Resources and Commitments” section below, there are limitations on TSS’ ability to distribute funds to Constellation.
Current liabilities increased $103.4 million, from $769.8 million at December 31, 2015 to $873.2 million at December 31, 2016. The increase is primarily due to an increase in deferred revenue of $39.9 million mainly due to acquisitions made since December 31, 2015 and the timing of maintenance and other billings versus performance and delivery under those customer arrangements, and an increase in income taxes payable of $34.1 million.
2016 2015
Net Revenue 1,831.2 1,566.2
Prior year's Net Revenue 1,566.2 1,420.1
Proforma Adjustment. (Note 1) 238.5 187.6
1,804.7 1,607.7
Organic Net Revenue Growth 1% -3%
Fiscal Year ended December 31,
($M, except percentages)
Note 1: Estimated pre-acquisition Net Revenues from companies acquired since the beginning of 2015 and 2014 respectively. (Obtained from unaudited vendor financial information.)

16
The net cash flows from operating activities were $490.9 million for the fiscal year ended December 31, 2016. The $490.9 million provided by operating activities resulted from $206.8 million in net income plus $345.6 million of non-cash adjustments to net income, offset by $16.5 million of cash utilized from non-cash operating working capital and $45.0 million in taxes paid.
The net cash flows used in financing activities in the fiscal year ended December 31, 2016 were $117.6 million, which is mainly a result of dividends paid of $84.8 million, and interest paid on bank indebtedness and the Company’s unsecured subordinated floating rate debentures in the period of $22.9 million.
The net cash flows used in investing activities in the fiscal year ended December 31, 2016 were $194.7 million. The cash used in investing activities was primarily due to acquisitions for an aggregate of $178.1 million (including payments for holdbacks relating to prior acquisitions).
We believe we have sufficient cash and available credit capacity to continue to operate for the foreseeable future. Generally our VMS businesses operate with negative working capital as a result of the collection of maintenance payments and other revenues in advance of the performance of the related services. As such, management anticipates that it can continue to grow the business organically without any additional funding. If we continue to acquire VMS businesses we may need additional external funding depending upon the size and timing of the potential acquisitions.
Capital Resources and Commitments
Bank Indebtedness
On February 25, 2016, we completed an amendment and restatement of our revolving credit facility agreement (the “CSI Facility”), extending its maturity date to August 11, 2020. The CSI Facility limit was increased from $300 million to $485 million with a syndicate of new and existing Canadian chartered banks and U.S. banks. The CSI Facility bears a variable interest rate with no fixed repayments required over the term to maturity. Interest rates are calculated at standard U.S. and Canadian reference rates plus interest rate spreads based on a leverage table. The CSI Facility is currently collateralized by the majority of our assets including the assets of certain material subsidiaries. The CSI Facility contains standard events of default which if not remedied within a cure period would trigger the repayment of any outstanding balance. The CSI Facility is available for acquisitions, distributions, working capital needs, and other general corporate purposes and for the needs of our subsidiaries. As at December 31, 2016, no amounts were drawn on the CSI Facility, and letters of credit totalling $15.4 million were issued, which limits the borrowing capacity on a dollar-for-dollar basis. Transaction costs associated with this CSI
Net Changes in Cash Flows(in $M's)
Year ended December 31,
2016
Year ended December 31,
2015
Net cash provided by operating activities 490.9 395.9 Net cash from (used in) financing activities (117.6) (20.2)
Net cash from (used in) acquisition activities (178.1) (248.8) Net cash from (used in) other investing activities (16.6) (12.3) Net cash from (used in) investing activities (194.7) (261.1)
Effect of foreign currency (3.6) (6.9)
Net increase (decrease) in cash and cash equivalents 175.0 107.8

17
Facility are being amortized through profit or loss using the effective interest rate method. As at December 31, 2016, the carrying amount of such costs totalling $1.0 million has been classified as part of other non-current assets in the statement of financial position.
On June 24, 2014 Constellation Software Netherlands Holding Cooperatief U.A. (“CNH”), a subsidiary of Constellation and the indirect owner of 100% of TSS, entered into a €150 million (approximately $168 million) term and €10 million (approximately $11 million) multicurrency revolving credit facility (the “CNH Facility”) with a number of European and North American financial institutions. The CNH Facility bears interest at a rate calculated at EURIBOR plus interest rate spreads based on a leverage table. The CNH Facility is collateralized by substantially all of the assets owned by CNH and its subsidiaries which includes substantially all of the assets of TSS and its subsidiaries. The CNH Facility contains standard events of default which if not remedied within a cure period would trigger the repayment of any outstanding balance. At December 31, 2016, €120 million (approximately $126 million) remains outstanding on the term component of the CNH Facility. €20 million must be repaid in instalments prior to June 24, 2020, and €100 million is non-amortizing and due on June 24, 2021. The remaining €20 million term component of the CNH Facility remains undrawn. If drawn, principal must be repaid in five equal instalments starting on June 24, 2018. As at December 31, 2016 no amounts had been drawn on the €10 million multicurrency revolving component of the CNH Facility. The revolving component of the CNH Facility is available for acquisitions, working capital needs, and other general corporate purposes until June 24, 2020. Transaction costs associated with the CNH Facility have been included as part of the carrying amount of the liability and are being amortized through profit or loss using the effective interest rate method. As at December 31, 2016, the carrying amount of such costs relating to this CNH Facility totalling $3.5 million (€3.3 million) has been classified as part of non-current CNH Facility in the statement of financial position.
The CSI Facility and CNH Facility are independent of each other. The CNH Facility is not guaranteed by Constellation or its subsidiaries nor is Constellation or any subsidiary subject to the terms of the CNH Facility other than, in each case, CNH and its subsidiaries. Similarly, CNH and its subsidiaries did not guarantee the CSI Facility and are not subject to the provisions thereof. The CSI Facility imposes limitations on the aggregate amount of investment that Constellation may make in CNH and its subsidiaries and the financial results of CNH and its subsidiaries are not included for the purposes of determining compliance by Constellation with the financial covenants in the CSI Facility. The CNH Facility imposes limitations on the amount of distributions that CNH and its subsidiaries may make to Constellation.
Debentures
On October 1, 2014 and November 19, 2014, the Company issued unsecured subordinated debentures (the “Debentures”) with a total principal value of C$96.0 million for total proceeds of C$91.2 million. The proceeds were used by the Company to pay down $81.2 million of outstanding bank indebtedness.
On September 30, 3015, the Company issued an additional tranche of Debentures with a total principal value of C$186.2 million for total proceeds of C$214.2 million. The proceeds were used by the Company to pay down $130.4 million of outstanding bank indebtedness. The September 30, 2015 issuance formed a single series with the outstanding C$96.0 million aggregate principal amount of Debentures, Series 1 of the Company. The Debentures have a maturity date of March 31, 2040.
TSS Membership Liability
On December 23, 2014, in accordance with the terms of the purchase and sale agreement for the TSS acquisition, and on the basis of the term sheets attached thereto, Constellation and the sellers of TSS along with members of TSS’ executive management team (collectively, the “minority owners”) entered into a Members Agreement pursuant to which the minority owners acquired 33.29% of the voting interests in CNH. Proceeds from this transaction in the amount of €39.4 million ($48.5 million) were utilized to repay, in part, outstanding bank indebtedness of Constellation. In accordance with IFRS, 100% of the financial results for TSS are included in the consolidated financial results of the Company.

18
Each of the minority owners may, at any time, exercise a put option to sell all or a portion of their interests in CNH back to Constellation for an amount calculated in accordance with a valuation methodology described within the Members Agreement. Accordingly, the Company classified the proceeds from the Members Agreement as a liability. The main valuation driver in such calculation is the maintenance and other recurring revenue of CNH. Upon the exercise of a put option, Constellation would be obligated to redeem up to 33.33% of the minority owners’ interests put, no later than 30 business days from the date notice is received (classified as a current liability), and up to 33.33% on each of the first and second anniversary of the date the first redemption payment is made.
The seller of TSS also has an option available to it to sell approximately 68% of its interests in CNH, for an amount calculated in accordance with a valuation methodology described within the Members Agreement, in the event that Robin Van Poelje, TSS’ CEO, is no longer employed by TSS. The approximately 32% remaining interest can be sold via the put option described above.
In the event of a change of control in Constellation, the minority owners would have the option to sell 100% of their interests in CNH for an amount calculated in accordance with a valuation methodology described within the Members Agreement. Constellation would be obligated to remit payment in respect thereof no later than 30 business days from the date notice is given.
Commencing at any time after December 31, 2023, Constellation may exercise a call option to purchase all of the minority owners’ interests in CNH, for an amount calculated in accordance with a valuation methodology described within the Members Agreement. Upon exercise of the call option, the full purchase price will be paid within 30 business days of the notice date, following which the minority owners’ membership in CNH will be terminated. There is a valuation premium if the call option is exercised versus the put option.
If any of TSS’ executive management team that participate in the Members Agreement are terminated for urgent cause as defined in Section 7:678 of the Dutch Civil Code, Constellation shall have the right to purchase all of the interests beneficially owned by the terminated executive for an amount calculated in accordance with the valuation methodology described within the Members Agreement. The full purchase price will be paid within 30 business days from the date notice is given, following which the terminated executive’s membership in CNH will be terminated. An option does exist for the terminated executive to elect to be paid in annual installments of 33.33% of his interests in CNH over a 3 year period. The valuation of the interests being purchased will be calculated at each annual payment date.
Other commitments
Commitments include operating leases for office equipment and facilities, letters of credit and performance bonds issued on our behalf by financial institutions in connection with facility leases and contracts with public sector customers. Also, occasionally we structure some of our acquisitions with contingent consideration based on the future performance of the acquired business. The fair value of contingent consideration recorded in our statement of financial position was $15.5 million at December 31, 2016. Aside from the aforementioned, we do not have any other business arrangements, derivative financial instruments, or any equity interests in non-consolidated entities that would have a significant effect on our assets and liabilities as at December 31, 2016.
(in millions of dollars)Total < 1 yr 1-5 yrs > 5 yrs
Operating and capital leases 203.4 59.5 113.5 30.3 Holdbacks 17.9 17.1 0.9 - TSS membership liability 72.9 26.4 46.5 - Debentures 209.9 - - 209.9 Bank indebtedness 126.2 7.4 118.8 - Total outstanding commitments 630.3 110.4 279.7 240.3
19
The TSS membership liability commitment assumes that the minority owners have exercised their put option to sell 100% of their interests back to Constellation. This option however has not been exercised as at February 15, 2017. See the “Critical Accounting Estimate” section of the Company’s 2016 Annual Consolidated Financial Statements for a discussion on the valuation methodology utilized.
Foreign Currency Exposure
We operate internationally and have foreign currency risks related to our revenue, operating expenses, assets and liabilities denominated in currencies other than the U.S. dollar. Consequently, we believe movements in the foreign currencies in which we transact will impact future revenue and net earnings. Our analysis related to the change in average exchange rates from 2015 to 2016 suggests that the impact to Adjusted EBITA margins for both the three and twelve months ended December 31, 2016 was less than 1%. The impact to organic revenue growth for both the three and twelve months ended December 31, 2016 was approximately negative 2% and negative 1% respectively. We cannot predict the effect of foreign exchange gains or losses in the future; however, if significant foreign exchange losses are experienced, they could have a material adverse effect on our business, revenues, results of operations, and financial condition. The Company enters into forward foreign exchange contracts from time to time with the objective of mitigating volatility in profit or loss in respect of financial liabilities. In entering into these forward exchange contracts, the Company is exposed to the credit risk of the counterparties to such contracts and the possibility that the counterparties will default on their payment obligations under these contracts. However, given that the counterparties are Schedule 1 banks or affiliates thereof, the Company believes these risks are not material. During the fiscal year ended December 31, 2016, the Company did not purchase any contracts of this nature.
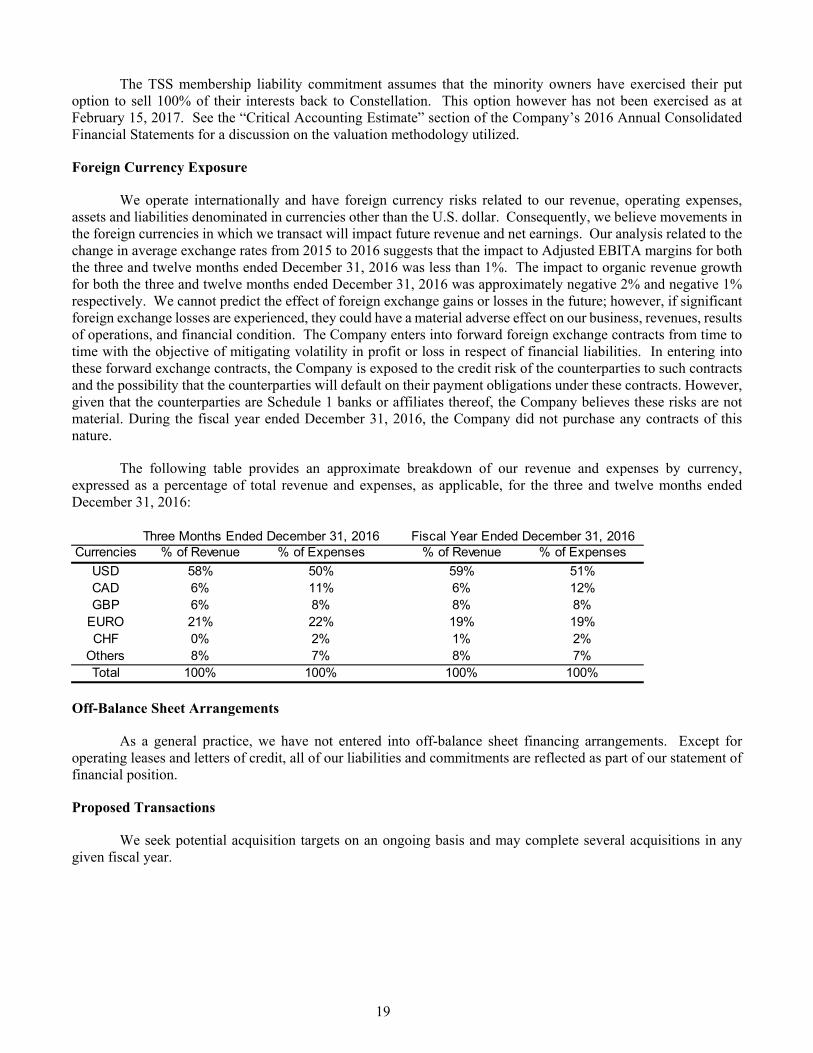
The following table provides an approximate breakdown of our revenue and expenses by currency, expressed as a percentage of total revenue and expenses, as applicable, for the three and twelve months ended December 31, 2016:
Off-Balance Sheet Arrangements
As a general practice, we have not entered into off-balance sheet financing arrangements. Except for operating leases and letters of credit, all of our liabilities and commitments are reflected as part of our statement of financial position.
Proposed Transactions
We seek potential acquisition targets on an ongoing basis and may complete several acquisitions in any given fiscal year.
Currencies % of Revenue % of Expenses % of Revenue % of Expenses
USD 58% 50% 59% 51%CAD 6% 11% 6% 12%GBP 6% 8% 8% 8%
EURO 21% 22% 19% 19%CHF 0% 2% 1% 2%
Others 8% 7% 8% 7%Total 100% 100% 100% 100%
Three Months Ended December 31, 2016 Fiscal Year Ended December 31, 2016

20
Critical Accounting Estimates
General
The preparation of our consolidated financial statements requires management to make estimates and assumptions that affect the reported amounts of assets, liabilities, revenue and expenses, and related disclosure of contingent assets and liabilities. Our estimates are based on historical experience and on various other assumptions that are believed to be reasonable under the circumstances. Our ongoing evaluation of these estimates forms the basis for making judgments about the carrying values of assets and liabilities and the reported amount of revenues and expenses, in cases where they are not readily ascertainable from other sources. Actual amounts may differ from these estimates under different assumptions or conditions.
Our significant accounting policies are fully described in Note 3 to our annual consolidated financial statements which are available on SEDAR (www.sedar.com). Certain accounting policies are particularly important to the reporting of our financial position and results of operations, and require the application of significant judgment by our management. An accounting policy is deemed to be critical if it requires an accounting estimate to be made based on assumptions about matters that are highly uncertain at the time the estimate is made, and if different, estimates that reasonably could have been used, or changes in the accounting estimates that are reasonably likely to occur periodically, could have a material impact on the financial statements. Management believes the following critical accounting policies reflect the more significant estimates and assumptions used in the preparation of our consolidated financial statements. We believe that there have been no significant changes in our critical accounting estimates for the years presented in our consolidated financial statements.
Revenue Recognition
Revenue represents the fair value of consideration received or receivable from customers for goods and services provided by the Company, net of discounts and sales taxes. The Company reports revenue under four revenue categories being, License, Hardware and other, Professional services, and Maintenance and other recurring revenue.
Typically, the Company's software license agreements are multiple-element arrangements as they may also include maintenance, professional services, and hardware. Multiple-element arrangements are recognized as the revenue for each unit of accounting is earned based on the relative fair value of each unit of accounting as determined by an internal analysis of prices or by using the residual method. A delivered element is considered a separate unit of accounting if it has value to the customer on a standalone basis, and delivery or performance of the undelivered elements is considered probable and substantially under the Company's control. If these criteria are not met, revenue for the arrangement as a whole is accounted for as a single unit of accounting. Where company-specific objective evidence of fair value cannot be determined for undelivered elements, the Company determines fair value of the respective element by estimating its stand-alone selling price, which is also applied for the presentation as part of the revenue categories noted above when certain of those elements are deemed to be a single unit of accounting.
The Company typically sells or licenses software on a perpetual basis, but also licenses software for a
specified period. Revenue from short-term time-based licenses, which usually include support services during the license period, is recognized rateably over the license term. Revenue from multi-year time-based licenses that include support services, whether separately priced or not, is recognized rateably over the license term unless a substantive support service renewal rate exists; if this is the case, the amount allocated to the delivered software is recognized as license revenue based on the residual approach once the revenue criteria have been met. In those instances where the customer is required to renew mandatory support and maintenance in order to maintain use of the licensed software over the license term, the Company recognizes the consideration attributable to the license and support for the initial term of the arrangement over the initial term and recognizes revenue for the support renewal fees in subsequent years over the respective renewal periods.

21
Revenue from the license of software involving significant implementation or customization essential to the functionality of the Company's product, or from the sales of hardware where software is essential to its functionality, is recognized under the percentage-of-completion method of contract accounting based either on the achievement of contractually defined milestones or based on labour hours. Any probable losses are recognized immediately in profit or loss. In certain situations where the outcome of an arrangement cannot be estimated reliably, costs associated with the arrangement are recognized as incurred. In this situation, revenues are recognized only to the extent of the costs incurred that are probable of recovery.
A portion of the Company's sales, categorized as hardware and other revenue, are accounted for as product
revenue. Product revenue is recognized when the Company has an executed agreement, the product has been delivered and costs can be measured reliably, the amount of the fee to be paid by the customer is fixed and determinable, and the collection of the related receivable is deemed probable from the outset of the arrangement. If for any of the product or service offerings, the Company determines at the outset of an arrangement that the amount of revenue cannot be measured reliably, and the Company concludes that the inflow of economic benefits associated with the transaction is not probable, then the revenue is deferred until the arrangement fee becomes due and payable by the customer. If, at the outset of an arrangement, the Company determines that collectability is not probable, and the Company concludes that the inflow of economic benefits associated with the transaction is not probable, then revenue recognition is deferred until the earlier of when collectability becomes probable or payment is received. If collectability becomes unlikely before all revenue from an arrangement is recognized, the Company recognizes revenue only to the extent of the fees that are successfully collected unless collectability becomes reasonably assured again. If a customer is specifically identified as a collection risk, the Company does not recognize revenue except to the extent of the fees that have already been collected.
Revenue related to the customer reimbursement of travel related expenses incurred during a project
implementation is included in the hardware and other revenue category. Revenue is recognized as costs are incurred which is consistent with the period in which the costs are invoiced. Reimbursable travel expenses incurred for which an invoice has not been issued, are recorded as part of work in progress on the statement of financial position.
Maintenance and other recurring revenue primarily consists of fees charged for customer support on
software products post-delivery and also includes, to a lesser extent, recurring fees derived from combined software/support contracts, transaction revenues, managed services, and hosted products. The company-specific fair value of maintenance is typically derived from rates charged to renew these services after an initial period. Maintenance revenue remaining to be recognized in profit or loss is recognized as deferred revenue in the statements of financial position when amounts have been billed in advance and the term of the service period has commenced.
Professional Services revenue including implementation, training and customization of software is
recognized by the stage of completion of the arrangement determined using the percentage of completion method noted above or as such services are performed as appropriate in the circumstances. The revenue and profit of fixed price contracts is recognized on a percentage of completion basis when the outcome of a contract can be estimated reliably. When the outcome of the contract cannot be estimated reliably, the amount of revenue recognized is limited to the cost incurred in the period. Losses on contracts are recognized as soon as a loss is foreseen by reference to the estimated costs of completion.
Management exercises judgement in determining whether a contract's outcome can be estimated reliably.
Management also applies estimates in the calculation of future contract costs and related profitability as it relates to labour hours and other considerations, which are used in determining the value of amounts recoverable on contracts and timing of revenue recognition. Estimates are continually and routinely revised based on changes in the facts relating to each contract. Judgement is also needed in assessing the ability to collect the corresponding receivables.
The timing of revenue recognition often differs from contract payment schedules, resulting in revenue that
has been earned but not billed. These amounts are included in work in progress. Amounts billed in accordance with customer contracts, but not yet earned, are recorded and presented as part of deferred revenue.
22
Valuation of Identifiable Goodwill and Other Intangible Assets
Acquisitions have been accounted for using the acquisition method required by IFRS 3. Goodwill arising on acquisitions is measured as the fair value of the consideration transferred including the recognized amount of any non-controlling interest in the acquiree, if any, less the net recognized amount of the estimated fair value of identifiable assets acquired and liabilities assumed (subject to certain exemptions to fair value measurement principles such as deferred tax assets or liabilities), all measured as of the acquisition date. When the excess of the consideration transferred less the assets and liabilities acquired is negative, a bargain purchase gain is recognized immediately in profit or loss. Transaction costs that the Company incurs in connection with a business combination are expensed as incurred.
We use the income approach to value acquired technology and customer related intangible assets, which
are the two material intangible asset categories reported in our financial statements. The income approach is a valuation technique that calculates the fair value of an intangible asset based on
the cash flows that the asset can be expected to generate over its remaining useful life. We utilize the discounted cash flow (“DCF”) methodology which is a form of the income approach that begins with a forecast of the annual cash flows a market participant would expect the subject intangible asset to generate over a discrete projection period. The forecasted cash flows for each of the years in the discrete projection period are then converted to their present value equivalent using a rate of return appropriate for the risk of achieving the intangible assets’ projected cash flows, again, from a market participant perspective. The present value of the forecasted cash flows are then added to the present value of the residual value of the intangible asset (if any) at the end of the discrete projection period to arrive at a conclusion with respect to the estimated fair value of the subject intangible asset.
Specifically, we rely on the relief-from-royalty method to value the acquired technology and the multiple-
period excess earnings method (“MEEM”) to value customer relationship assets. The underlying premise of the relief-from-royalty method is that the fair value of the technology is equal
to the costs savings (or the "royalty avoided") resulting from the ownership of the asset by the avoidance of paying royalties to license the use of the technology from another owner. Accordingly the income forecast reflects an estimate of a fair royalty that a licensee would pay, on a percentage of revenue basis, to obtain a license to utilize the technology.
The MEEM method isolates the cash flows attributable to the subject asset by utilizing a forecast of
expected cash flows less the returns attributable to other enabling assets, both tangible and intangible. Goodwill is initially recorded when the purchase price paid for an acquisition exceeds the fair value
assigned to the net identifiable tangible and intangible assets acquired. Goodwill is not amortized but rather it is periodically assessed for impairment. We perform an annual review in the fourth quarter of each fiscal year, or more frequently if indicators of potential impairment exist, to determine if the recorded goodwill is impaired.
After initial recognition, goodwill is measured at cost less any accumulated impairment losses, with the
carrying value being reviewed for impairment at least annually and whenever events or changes in circumstances indicate that the carrying value may be impaired. In respect of equity accounted investees, the carrying amount of goodwill is included in the carrying amount of the investment, and an impairment loss on such an investment is not allocated to any asset, including goodwill, that forms part of the carrying amount of the equity accounted investee. No such losses have been recognized during the year.
The impairment test methodology is based on a comparison between the higher of fair value less costs to
sell and value-in-use of each of the Company's business units (considered as the grouping of cash generating units at which level the impairment test is performed) and the net asset carrying values (including goodwill) of the Company's business units. Within the Company's reporting structure, business units generally reflect one level

23
below the six operating segments (Volaris, Harris, Total Specific Solutions, Jonas, Perseus (previously known as Homebuilder), and Vela Operating Groups). In determining the recoverable amount, the Company applies an estimated market valuation multiple to the business unit's most recent annual recurring revenues, which are derived from combined software/support contracts, transaction revenues, and hosted products. Valuation multiples applied by management for this purpose reflect current conditions specific to the business unit and are assessed for reasonability by comparison to the Company's current and past experience of ranges of multiples required to acquire representative software companies. In addition, in certain instances, the recoverable amount is determined using a value-in-use approach which follows the same valuation process that is undertaken for the Company’s business acquisitions. An impairment is recognized if the carrying amount of a cash generating unit exceeds its estimated recoverable amount.
We also review the carrying value of amortizable intangible assets for impairment whenever events and
circumstances indicate that the carrying value of an asset may not be recoverable from the estimated future cash flows expected to result from its use and eventual disposition. Any change in estimate which causes the undiscounted expected future cash flows to be less than the carrying value, would result in an impairment loss being recognized equal to the amount by which the carrying value of the asset exceeds the fair value of the asset.
The critical accounting estimates described above affect both the public and private segments of the
business. The approach taken by management in performing these estimates is not significantly different between segments.
TSS Membership Liability
Commencing any time after December 31, 2014, each of the minority owners may exercise a put option to sell all or a portion of their interests in CNH back to Constellation for an amount calculated in accordance with a valuation methodology described within the Members Agreement. Accordingly, the Company classified the proceeds from the membership agreement as a liability. The main valuation driver in such calculation is the maintenance and other recurring revenue of CNH. Upon the exercise of a put option, Constellation would be obligated to redeem up to 33.33% of the minority owners’ interests put, no later than 30 business days from the date notice is received, and up to 33.33% on each of the first and second anniversary of the date the first redemption payment is made.
In determining the valuation of the liability at December 31, 2016 we assumed the minority owners exercised their put option on December 31, 2016, and redeemed 33.33% of their interests on exercise, and will redeem 33.33% on each of the first and second anniversary dates. Maintenance and recurring revenue of CNH for the fiscal year ended December 31, 2016 was used as the basis for valuing the interests at each redemption date. A similar approach will be utilized to value any interests that have not been put or called at the end of each subsequent reporting period. However, the actual maintenance and recurring revenue of CNH for the trailing twelve months from the date of the related reporting period end will be utilized in the calculation. Any increase or decrease in the value of the membership liability will be recorded as an expense or income respectively in the Consolidated Statements of Income for the period.
Accounting for Income Taxes
Significant management judgment is required in determining our provision for income taxes, our income tax assets and liabilities, and any valuation allowance recorded against our net income tax assets. We operate in multiple geographic jurisdictions, and to the extent that we have profits in each jurisdiction, these profits are taxed pursuant to the tax laws of their jurisdiction. Our effective tax rate may be affected by changes in, or interpretations of, tax laws in any given jurisdiction, the level of profitability, utilization of net operating losses and tax credit carry forwards, changes in geographical mix of income and expense, and changes in management’s assessment of matters, such as the ability to realize future tax assets. As a result of these considerations, we must estimate our income taxes in each of the jurisdictions in which we operate on a quarterly basis. This process involves estimating our actual

24
current tax exposures, together with assessing temporary differences resulting from differing treatment of items for tax and accounting purposes. These differences result in future tax assets and liabilities, which are included in our consolidated balance sheet.
Current tax is the expected taxes payable or receivable on the taxable income or loss for the period, using
tax rates enacted or substantively enacted at the reporting date, and any adjustment to taxes payable in respect of previous years.
Deferred tax is recognized in respect of temporary differences between the carrying amounts of assets and
liabilities for financial reporting purposes and the amounts used for taxation purposes. Deferred tax is not recognized for temporary differences relating to investments in subsidiaries to the extent that it is probable that they will not reverse in the foreseeable future. In addition, deferred tax is not recognized for taxable temporary differences arising on the initial recognition of goodwill.
Deferred tax is measured at tax rates that are expected to be applied to temporary differences when they
reverse, based on the laws that have been enacted or substantively enacted by the reporting date. Deferred tax assets and liabilities are offset if there is a legally enforceable right to offset current tax liabilities and assets, and they relate to income taxes levied by the same tax authority on the same taxable entity, or on different tax entities, but we intend to settle current tax liabilities and assets on a net basis or their tax assets and liabilities will be realized simultaneously.
A deferred tax asset is recognized for unused tax losses, tax credits, difference in tax bases in the purchaser's
tax jurisdiction and its cost as reported in the consolidated financial statements as a result of an intra-group transfer of assets and deductible temporary differences, to the extent that it is probable that future taxable profits will be available against which they can be utilized. Deferred tax assets are reviewed at each reporting date and are reduced to the extent that it is no longer probable that the related tax benefit will be realized.
We are subject to income tax audits by various authorities in respect of prior periods that could result in
additional tax expense in future periods. While the outcome of current outstanding actions and claims remains uncertain, it is expected that they will be resolved without a material impact to our financial position. However, there can be no assurances as to the final resolution of these matters and, if the final outcome is adverse to us, the amounts we will be required to pay and the loss of certain future tax deductions could be material to our financial statements.
Accounts Receivable
We evaluate the collectability of our trade receivables based on a combination of factors. We regularly analyze our significant customer accounts and when we become aware of a specific customer’s inability to meet its financial obligations to us, such as in the case of bankruptcy filings or deterioration in the customer’s operating results or financial position, we record specific bad debt reserves to reduce the related receivable to the amount which we reasonably believe is collectible. We also record reserves for bad debts on a small portion of all other customer balances based on a variety of factors, including the length of time that the receivables are past due, the financial health of the customer, macroeconomic considerations and historical experience. If circumstances related to specific customers change, our estimates of the recoverability of receivables could be further adjusted.
Work In Progress
For revenue arrangements that are accounted for under the percentage of completion method as well as other arrangements and contracts which limit our ability to invoice at certain milestones that do not match the timing of the actual provision of the services, we record such revenue and the related unbilled receivable in work in process. Similar to accounts receivable, we constantly have to evaluate our ability to bill and subsequently collect any amounts contained in the work in progress accounts. We review these balances on a periodic basis to ensure customer balances are prudent based upon a variety of factors, such as the financial health of the customer,
25
macroeconomic considerations and historical experience. If circumstances related to specific customers change, our estimates of the recoverability of work in progress may be further adjusted.
Provisions
A provision is recognized if, as a result of a past event, the Company has a present legal or constructive obligation that can be estimated reliably, and it is probable that an outflow of economic benefits will be required to settle the obligation. Provisions are measured at the estimated future cash flows required to settle the present obligation, based on the most reliable evidence available at the reporting date. The estimated cash flows are discounted at a pre-tax rate that reflects current market assessments of the time value of money and the risks specific to the liability. The amortization of the discount is recognized as part of finance costs.
We are currently involved in various claims and legal proceedings. Quarterly, we review the status of each significant matter and assess our potential financial exposure. Because of the uncertainties related to these matters, provisions are based only on the best information available at the time. As additional information becomes available, we reassess the potential liability related to our pending claims and litigation and, if necessary, revise our provisions. Such revisions in the estimates of the potential liabilities could have a material impact on our results of operations and financial position.
Recent Accounting Pronouncements
A number of new standards, and amendments to standards and interpretations, are not yet effective for the quarter ended December 31, 2016, and have not been applied in preparing our consolidated financial statements. The relevant standards are listed below.
IFRS 9 Financial Instruments
IFRS 9 replaces the guidance in IAS 39 Financial Instruments: Recognition and Measurement, on the classification and measurement of financial assets. The Standard eliminates the existing IAS 39 categories of held to maturity, available-for-sale and loans and receivable.
Financial assets will be classified into one of two categories on initial recognition:
• financial assets measured at amortized cost; or • financial assets measured at fair value.
Gains and losses on remeasurement of financial assets measured at fair value will be recognized in profit or loss, except for an investment in an equity instrument which is not held-for-trading, IFRS 9 provides, on initial recognition, an irrevocable election to present all fair value changes from the investment in an equity instrument that is not held for trading in other comprehensive income (OCI). The election is available on an individual share-by-share basis. Amounts presented in OCI will not be reclassified to profit or loss at a later date. IFRS 9 also includes a new general hedge accounting standard which will align hedge accounting more closely with risk management.
The standard has a mandatory effective date for annual periods beginning on or after January 1, 2018 with early adoption permitted. The Company is assessing the impact of this standard on its consolidated financial statements.

26
IFRS 15 Revenue from Contracts with Customers
On May 28, 2014, the IASB issued IFRS 15 Revenue from Contracts with Customers. The new standard is effective for fiscal years beginning on or after January 1, 2018 and is available for early adoption. The standard contains a single model that applies to contracts with customers. The model features a contract-based five-step analysis of transactions to determine whether, how much and when revenue is recognized. New estimates and judgmental thresholds have been introduced, which may affect the amount and/or timing of revenue recognized. The Company intends to adopt IFRS 15 in its financial statements for the annual period beginning on January 1, 2018. We have a team dedicated to ensuring our compliance with IFRS 15. This team is responsible for determining existing policies, differences between existing policies and IFRS 15, ensuring our data collection is appropriate, and communicating the upcoming changes with various stakeholders. In addition, this team is assisting in the development of processes and policies that will help ensure an effective transition and the related results are accurate. As a result, we are continuing to assess the impact of this standard on our consolidated financial statements.
IFRS 16 Leases
In January 2016, the IASB issued the final publication of the IFRS 16 Leases standard, which will supersede the current IAS 17, Leases standard. Under IFRS 16, a lease will exist when a customer controls the right to use an identified asset as demonstrated by the customer having exclusive use of the asset for a period of time. IFRS 16 introduces a single accounting model for lessees and all leases will require an asset and liability to be recognized on the statement of financial position at inception. The accounting treatment for lessors will remain largely the same as under IAS 17.
The standard is effective for annual periods beginning on or after January 1, 2019 with early adoption permitted, but only if the entity is also applying IFRS 15. The Company is required to retrospectively apply IFRS 16 to all existing leases as of the date of transition and has the option to either:
apply IFRS 16 with full retrospective effect; or recognize the cumulative effect of initially applying IFRS 16 as an adjustment to opening equity at the
date of initial application.
As a practical expedient, an entity is not required to reassess whether a contract is, or contains, a lease at the date of initial application. The Company is assessing the impact of this standard on its consolidated financial statements; however, we believe that on adoption of the standard there will be an increase to assets and liabilities, as we will be required to record a right-of-use asset and a corresponding lease liability on our Consolidated Statements of Financial Position, as well as a decrease to operating costs, an increase to finance costs (due to accretion of the lease liability) and an increase to depreciation and amortization (due to amortization of the right-of-use asset).
Share Capital
As at February 15, 2017, there were 21,191,530 common shares outstanding.
Risks and Uncertainties
The Company’s business is subject to a number of risk factors which are described in our most recently filed AIF. Additional risks and uncertainties not presently known to us or that we currently consider immaterial also may impair our business and operations and cause the price of the common shares to decline. If any of the noted risks actually occur, our business may be harmed and the financial condition and results of operation may suffer significantly. In that event, the trading price of the common shares could decline, and shareholders may lose all or part of their investment.

27
Controls and Procedures Evaluation of disclosure controls and procedures:
Management is responsible for establishing and maintaining disclosure controls and procedures as defined under National Instrument 52-109. At December 31, 2016, the President and Chief Financial Officer concluded that the design and operation of these disclosure controls and procedures were effective and that material information relating to the Company, including its subsidiaries, was made known to them and was recorded, processed, summarized and reported within the time periods specified under applicable securities legislation.
Internal controls over financial reporting: The President and Chief Financial Officer have designed or caused to be designed under their supervision, disclosure controls and procedures which provide reasonable assurance that material information regarding the Company is accumulated and communicated to the Company’s management, including its President and Chief Financial Officer in a timely manner.
In addition, the President and Chief Financial Officer have designed or caused it to be designed under their supervision internal controls over financial reporting (“ICFR”) to provide reasonable assurance regarding the reliability of financial reporting and the preparation of financial statements. The President and Chief Financial Officer have been advised that the control framework the President and the Chief Financial Officer used to design the Company’s ICFR is recognized by the Committee of Sponsoring Organizations of the Treadway Commission.
The President and the Chief Financial Officer have evaluated, or caused to be evaluated under their
supervision, whether or not there were changes to its ICFR during the period ended December 31, 2016 that have materially affected, or are reasonably likely to materially affect the Company’s ICFR. No such changes were identified through their evaluation.
A control system, no matter how well conceived and operated, can provide only reasonable, not absolute,
assurance that its objectives are met. Due to inherent limitations in all such systems, no evaluations of controls can provide absolute assurance that all control issues, if any, within a company have been detected. Accordingly, our disclosure controls and procedures and our internal controls over financial reporting are effective in providing reasonable, not absolute, assurance that the objectives of our control systems have been met.

For the years ended December 31, 2016 and 2015
Consolidated Financial Statements(In U.S. dollars)
CONSTELLATIONSOFTWARE INC.

MANAGEMENT'S RESPONSIBILITY FOR FINANCIAL REPORTING December 31, 2016 The accompanying consolidated financial statements of Constellation Software Inc. ("Constellation") and its subsidiaries and all the information in Management's Discussion and Analysis are the responsibility of management and have been approved by the Board of Directors. The consolidated financial statements have been prepared by management in accordance with International Financial Reporting Standards ("IFRS"). The consolidated financial statements include certain amounts that are based on the best estimates and judgements of management and in their opinion present fairly, in all material respects, Constellation's financial position, results of operations and cash flows, in accordance with IFRS. Management has prepared the financial information presented elsewhere in the Management's Discussion and Analysis and has ensured that it is consistent with the consolidated financial statements, or has provided reconciliations where inconsistencies exist. Management of Constellation has developed and maintains a system of internal controls, which is supported by the internal audit function. Management believes the internal controls provide reasonable assurance that material transactions are properly authorized and recorded, financial records are reliable and form a basis for the preparation of consolidated financial statements and that Constellation's material assets are properly accounted for and safeguarded. The Board of Directors carries out its responsibility for the consolidated financial statements principally through its Audit Committee. This committee meets with management and the Company’s independent auditors to review the Company’s reported financial performance and to discuss audit, internal controls, accounting policies, and financial reporting matters. The consolidated financial statements were reviewed by the Audit Committee and approved by the Board of Directors. The consolidated financial statements have been audited by KPMG LLP, the external auditors, in accordance with Canadian generally accepted auditing standards on behalf of the shareholders. KPMG LLP has full and free access to the Audit Committee. February 15, 2017 "Mark Leonard" "Jamal Baksh" President Chief Financial Officer

KPMG LLP Bay Adelaide Centre Suite 4600 333 Bay Street Toronto, Ontario M5H 2S5 Telephone (416) 777-8500 Fax (416) 777-8818 www.kpmg.ca
INDEPENDENT AUDITORS’ REPORT
To the Shareholders of Constellation Software Inc.
We have audited the accompanying consolidated financial statements of Constellation Software Inc., which comprise the consolidated statements of financial position as at December 31, 2016 and December 31, 2015, the consolidated statements of income, comprehensive income, changes in equity and cash flows for the years then ended, and notes, comprising a summary of significant accounting policies and other explanatory information.
Management’s Responsibility for the Consolidated Financial Statements
Management is responsible for the preparation and fair presentation of these consolidated financial statements in accordance with International Financial Reporting Standards, and for such internal control as management determines is necessary to enable the preparation of consolidated financial statements that are free from material misstatement, whether due to fraud or error.
Auditors’ Responsibility
Our responsibility is to express an opinion on these consolidated financial statements based on our audits. We conducted our audits in accordance with Canadian generally accepted auditing standards. Those standards require that we comply with ethical requirements and plan and perform the audit to obtain reasonable assurance about whether the consolidated financial statements are free from material misstatement.
An audit involves performing procedures to obtain audit evidence about the amounts and disclosures in the consolidated financial statements. The procedures selected depend on our judgment, including the assessment of the risks of material misstatement of the consolidated financial statements, whether due to fraud or error. In making those risk assessments, we consider internal control relevant to the entity’s preparation and fair presentation of the consolidated financial statements in order to design audit procedures that are appropriate in the circumstances, but not for the purpose of expressing an opinion on the effectiveness of the entity’s internal control. An audit also includes evaluating the appropriateness of accounting policies used and the reasonableness of accounting estimates made by management, as well as evaluating the overall presentation of the consolidated financial statements.
We believe that the audit evidence we have obtained in our audits is sufficient and appropriate to provide a basis for our audit opinion.

Opinion
In our opinion, the consolidated financial statements present fairly, in all material respects, the consolidated financial position of Constellation Software Inc. as at December 31, 2016 and December 31, 2015 and its consolidated financial performance and its consolidated cash flows for the years then ended in accordance with International Financial Reporting Standards.
Chartered Professional Accountants, Licensed Public Accountants
February 15, 2017 Toronto, Canada
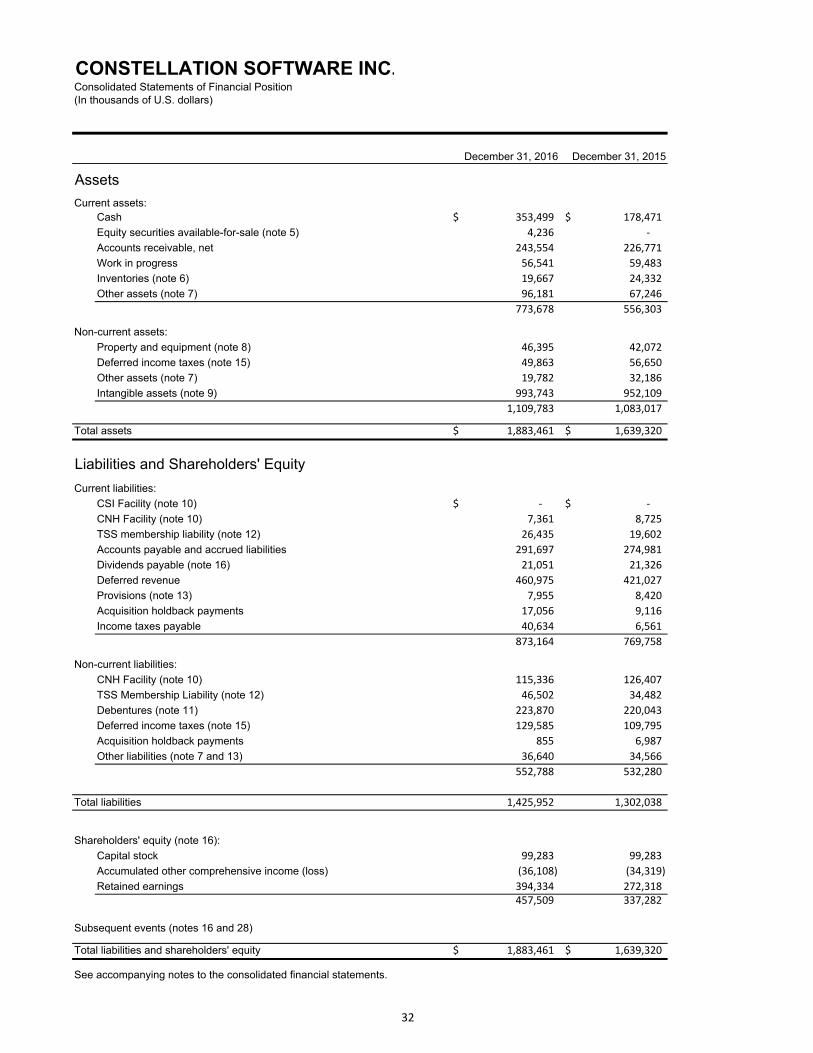
CONSTELLATION SOFTWARE INC.Consolidated Statements of Financial Position(In thousands of U.S. dollars)
December 31, 2016 December 31, 2015
Assets
Current assets:Cash 353,499$ 178,471$
Equity securities available-for-sale (note 5) 4,236 ‐
Accounts receivable, net 243,554 226,771
Work in progress 56,541 59,483
Inventories (note 6) 19,667 24,332
Other assets (note 7) 96,181 67,246
773,678 556,303
Non-current assets:
Property and equipment (note 8) 46,395 42,072
Deferred income taxes (note 15) 49,863 56,650
Other assets (note 7) 19,782 32,186
Intangible assets (note 9) 993,743 952,109
1,109,783 1,083,017
Total assets 1,883,461$ 1,639,320$
Liabilities and Shareholders' Equity
Current liabilities:
CSI Facility (note 10) ‐$ ‐$
CNH Facility (note 10) 7,361 8,725
TSS membership liability (note 12) 26,435 19,602
Accounts payable and accrued liabilities 291,697 274,981
Dividends payable (note 16) 21,051 21,326
Deferred revenue 460,975 421,027
Provisions (note 13) 7,955 8,420
Acquisition holdback payments 17,056 9,116
Income taxes payable 40,634 6,561
873,164 769,758
Non-current liabilities:
CNH Facility (note 10) 115,336 126,407
TSS Membership Liability (note 12) 46,502 34,482
Debentures (note 11) 223,870 220,043
Deferred income taxes (note 15) 129,585 109,795
Acquisition holdback payments 855 6,987
Other liabilities (note 7 and 13) 36,640 34,566
552,788 532,280
Total liabilities 1,425,952 1,302,038
Shareholders' equity (note 16):
Capital stock 99,283 99,283
Accumulated other comprehensive income (loss) (36,108) (34,319)
Retained earnings 394,334 272,318 457,509 337,282
Subsequent events (notes 16 and 28)
Total liabilities and shareholders' equity 1,883,461$ 1,639,320$
See accompanying notes to the consolidated financial statements.
32

CONSTELLATION SOFTWARE INC.Consolidated Statements of Income(In thousands of U.S. dollars, except per share amounts)
2016 2015
Revenue
License 142,534$ 131,022$
Professional services 434,488 384,583
Hardware and other 147,749 152,909
Maintenance and other recurring 1,400,315 1,169,795
2,125,086 1,838,309
Expenses
Staff 1,058,989 912,416
Hardware 82,304 90,308
Third party license, maintenance and professional services 192,703 163,684
Occupancy 51,696 43,218
Travel 61,745 54,643
Telecommunications 21,674 17,909
Supplies 9,820 10,951
Software and equipment 36,547 30,954
Professional fees 28,249 22,619
Other, net 28,963 29,042
Depreciation 22,376 17,028
Amortization of intangible assets 190,574 180,469
1,785,640 1,573,241
Foreign exchange loss (gain) 25,990 (15,743)
TSS membership liability revaluation charge (note 12) 21,635 22,244
Share in net (income) loss of equity investee (note 7) (5,317) (1,070)
Finance and other expense (income) (note 18) (10,834) (4,772)
Finance costs (note 18) 21,573 20,110
53,047 20,769
Income before income taxes 286,399 244,299
Current income tax expense (recovery) 84,943 63,450
Deferred income tax expense (recovery) (5,328) 3,601
Income tax expense (recovery) (note 14 and 15) 79,615 67,051
Net income 206,784 177,248
Earnings per shareBasic and diluted (note 19) 9.76$ 8.36$
See accompanying notes to the consolidated financial statements
Years ended December 31,
33

CONSTELLATION SOFTWARE INC.Consolidated Statements of Comprehensive Income(In thousands of U.S. dollars, except per share amounts)
2016 2015
Net income 206,784$ 177,248$
Items that are or may be reclassified subsequently to net income:
Net change in fair value
of available-for-sale financial
asset during the period 5,224 -
Net change in fair value
of derivatives designated as hedges
during the period 468 (423)
Amounts reclassified to profit during the period
related to realized gains on
available-for-sale financial assets (5,204) -
Foreign currency translation differences from foreign operations (2,134) (14,734)
Deferred income tax recovery (expense) (143) 128
Other comprehensive (loss) income for the period, net of income tax (1,789) (15,029)
Total comprehensive income (loss) for the period 204,995$ 162,219$
See accompanying notes to the consolidated financial statements.
Years ended December 31,
34

CONSTELLATION SOFTWARE INC.Consolidated Statements of Changes in Equity(In thousands of U.S. dollars)
Year ended December 31, 2016Capital stock Total accumulated other
comprehensive income/(loss)
Retained earnings
Total
Cumulative translation
account
Amounts related to
gains/losses on available-
for-sale financial
assets
Amounts related to
gains/(losses) on derivatives
designed as hedges
Balance at January 1, 2016 $ 99,283 $ (33,614) -$ $ (705) $ (34,319) $ 272,318 $ 337,282
Total comprehensive income for the period:
Net income - - - - - 206,784 206,784
Other comprehensive income (loss)
Net change in fair valueof available-for-sale financialasset during the period - - 5,224 - 5,224 - 5,224
Net change in fair valueof derivatives designated as hedgesduring the period - - - 468 468 - 468
Amounts reclassified to profit during the periodrelated to realized gains onavailable-for-sale financial assets - - (5,204) - (5,204) - (5,204)
Foreign currency translation differences fromforeign operations - (2,134) - - (2,134) - (2,134)
Deferred tax recovery (expense) - - (3) (140) (143) - (143)
Total other comprehensive income (loss)for the period - (2,134) 17 328 (1,789) - (1,789)
Total comprehensive income (loss) for the period - (2,134) 17 328 (1,789) 206,784 204,995
Transactions with owners, recorded directly in equityDividends to shareholders of the Company (note 16) - - - - - (84,768) (84,768)
Balance at December 31, 2016 $ 99,283 $ (35,748) $ 17 $ (377) $ (36,108) $ 394,334 $ 457,509
See accompanying notes to the consolidated financial statements.
Accumulated other comprehensive income/(loss)
35

CONSTELLATION SOFTWARE INC.Consolidated Statements of Changes in Equity(In thousands of U.S. dollars)
Year ended December 31, 2015
Capital stock Total accumulated other comprehensive
income/(loss)
Retained earnings
Total
Cumulative translation
account
Amounts related to
gains/losses on available-
for-sale financial
assets
Amounts related to
gains/(losses) on derivatives
designed as hedges
Balance at January 1, 2015 $ 99,283 $ (18,880) -$ $ (410) $ (19,290) $ 179,838 $ 259,831
Total comprehensive income for the period:
Net income - - - - - 177,248 177,248
Other comprehensive income (loss)
Net change in fair valueof available-for-sale financialasset during the period - - - - - - -
Net change in fair valueof derivatives designated as hedgesduring the period - - - (423) (423) - (423)
Amounts reclassified to profit during the periodrelated to realized gains onavailable-for-sale financial assets - - - - - - -
Foreign currency translation differences fromforeign operations - (14,734) - - (14,734) - (14,734)
Deferred tax recovery (expense) - - 128 128 - 128
Total other comprehensive income for the period - (14,734) - (295) (15,029) - (15,029)
Total comprehensive income for the period - (14,734) - (295) (15,029) 177,248 162,219
Transactions with owners, recorded directly in equityDividends to shareholders of the Company (note 16) - - - - (84,768) (84,768)
Balance at December 31, 2015 $ 99,283 $ (33,614) -$ $ (705) $ (34,319) $ 272,318 $ 337,282
See accompanying notes to the consolidated financial statements.
Accumulated other comprehensive income/(loss)
36

CONSTELLATION SOFTWARE INC.Consolidated Statements of Cash Flows(In thousands of U.S. dollars)
2016 2015
Cash flows from operating activities:Net income 206,784$ 177,248$ Adjustments for:
Depreciation 22,376 17,028 Amortization of intangible assets 190,574 180,469 TSS membership liability revaluation charge 21,635 22,244 Share in net (income) loss of equity investee (5,317) (1,070) Finance and other income (10,834) (4,772) Finance costs 21,573 20,110 Income tax expense (recovery) 79,615 67,051 Foreign exchange loss (gain) 25,990 (15,743)
Change in non-cash operating working capitalexclusive of effects of business combinations (note 26) (16,496) 3,080
Income taxes paid (45,019) (69,701) Net cash flows from operating activities 490,881 395,944
Cash flows from (used in) financing activities:Interest paid (22,867) (17,533) Increase (decrease) in revolving credit facility, net - (64,500) Repayments of CNH facility (8,709) (2,199) Credit facility transaction costs (1,212) - Proceeds from issuance of debentures (note 11) - 159,709
Distribution to TSS minority owners (note 12) - (10,879) Dividends paid (84,768) (84,768) Net cash flows from (used in) in financing activities (117,556) (20,170)
Cash flows from (used in) investing activities:Acquisition of businesses, net of cash
acquired (note 4) (152,310) (210,299) Post-acquisition settlement payments, net of receipts (25,791) (38,473) Purchases of available-for-sale equity securities (27,707) - Proceeds from sale of available-for-sale equity securities 28,491 - Interest, dividends and other proceeds received 1,729 570 Property and equipment purchased (19,098) (12,894) Net cash flows from (used in) investing activities (194,686) (261,096)
Effect of foreign currency oncash and cash equivalents (3,611) (6,886)
Increase (decrease) in cash and cash equivalents 175,028 107,792
Cash, beginning of period 178,471 70,679
Cash, end of period 353,499$ 178,471$
See accompanying notes to the consolidated financial statements.
Years ended December 31,
37

CONSTELLATION SOFTWARE INC. Notes to Consolidated Financial Statements (In thousands of U.S. dollars, except per share amounts and as otherwise indicated) Years ended December 31, 2016 and 2015
38
Notes to the consolidated financial statements
1. Reporting entity 15. Deferred tax assets and liabilities
2. Basis of presentation 16. Capital and other components of equity
3. Significant accounting policies 17. Revenue
4. Business acquisitions 18. Finance and other income and finance costs
5. Equity securities available-for-sale 19. Earnings per share
6. Inventories 20. Capital risk management
7. Other assets and liabilities 21. Financial risk management and financial instruments
8. Property and equipment 22. Operating leases
9. Intangible assets and goodwill 23. Operating segments
10. Bank indebtedness and CNH facility 24. Contingencies
11. Debentures 25. Guarantees
12. TSS membership liability 26. Changes in non-cash operating working capital
13. Provisions 27. Related parties
14. Income taxes 28. Subsequent events

CONSTELLATION SOFTWARE INC. Notes to Consolidated Financial Statements (In thousands of U.S. dollars, except per share amounts and as otherwise indicated) Years ended December 31, 2016 and 2015
39
1. Reporting entity
Constellation Software Inc. ("Constellation") is a company domiciled in Canada. The address of Constellation's registered office is 20 Adelaide Street East, Suite 1200, Toronto, Ontario, Canada. The consolidated financial statements of Constellation as at and for the fiscal years ended December 31, 2016 and December 31, 2015 comprise Constellation and its subsidiaries (together referred to as the "Company") and the Company's interest in associates. The Company is engaged principally in the development, installation and customization of software relating to the markets listed below, and in the provision of related professional services and support.
Public Sector:
Public transit operators Asset management Municipal systems Para transit operators Fleet and facility management School administration School transportation District attorney Public safety Non-emergency medical Taxi dispatch Healthcare Ride share Benefits administration Rental Local government Insurance Electric utilities Agri-business Collections management Court Marine asset management Water utilities School and special library Communications Credit unions Drink distribution Higher education Financial services Notaries Fashion retail Pharmacies Long-term care Home and community care County systems Research management Retail management and distribution Public housing authorities Not-for-profit organizations
Private Sector:
Private clubs and daily fee golf courses Lease management Window manufacturers
Construction Winery management Cabinet manufacturers Food services Buy here pay here dealers Made-to-order manufacturers Health clubs RV and marine dealers Window and other dealers Moving and storage Pulp and paper manufacturers Multi-carrier shipping Metal service centers Real estate brokers and agents Supply chain optimization Attractions Outdoor equipment dealers Multi-channel distribution Leisure centers Education Wholesale distribution
Retail management and distribution Healthcare electronic medical records Homebuilders
Radiology and laboratory information systems
Pharmaceutical and biotech manufacturers
Third party logistics warehouse management systems
Product licensing Event management Financial services Tire distribution Salons and spas Association management Housing finance agencies Municipal treasury and debt systems Public housing authorities Tour operators Auto clubs Real estate brokers and agents Long-term care Textiles and apparel Home and community care Hospitality Mining Ombudsman Aerospace

CONSTELLATION SOFTWARE INC. Notes to Consolidated Financial Statements (In thousands of U.S. dollars, except per share amounts and as otherwise indicated) Years ended December 31, 2016 and 2015
40
2. Basis of presentation
(a) Statement of compliance
These consolidated financial statements have been prepared in accordance with International Financial Reporting Standards (IFRS), issued and outstanding as of February 15, 2017, the date the Board of Directors approved such financial statements.
(b) Basis of measurement
The consolidated financial statements have been prepared on the historical cost basis except for certain assets and liabilities initially recognized in connection with business combinations, and certain financial instruments and derivative financial instruments, which are measured at fair value.
(c) Functional and presentation currency
The consolidated financial statements are presented in U.S. dollars, which is Constellation's functional currency.
(d) Use of estimates and judgements
The preparation of the consolidated financial statements in conformity with IFRS requires management to make judgements, estimates and assumptions that affect the application of accounting policies and reported amounts of assets, liabilities, income and expenses. Actual results may differ from these estimates.
Estimates and underlying assumptions are reviewed on an ongoing basis. Estimates are based on historical experience and other assumptions that are considered reasonable in the circumstances. The actual amount or values may vary in certain instances from the assumptions and estimates made. Changes will be recorded, with corresponding effect in profit or loss, when, and if, better information is obtained.
Information about assumptions and estimation uncertainties that have a significant risk of resulting in a material adjustment within the next financial year are included in the following notes:
Note 3(k) – Revenue recognition Note 3(a)(i) - Business combinations Note 3(m) - Income taxes Note 3(i) - Impairment Note 3(d) - Intangible assets Note 24 – Contingencies Critical judgements that management has made in the process of applying accounting policies disclosed herein and that have a significant effect on the amounts recognized in the consolidated financial statements relate to the (i) determination of functional currencies for Constellation’s subsidiaries and, most notably, in respect of businesses acquired during the period; (ii) assessment as to whether certain customer contract obligations and deliverables related to multiple-element arrangements have stand-alone value to the customer; (iii) recognition of deferred tax assets; and (iv) recognition of provisions. Functional currency - management applies judgement in situations where primary and secondary indicators
are mixed. Primary indicators such as the currency that mainly influence sales prices are given priority before considering secondary indicators.

CONSTELLATION SOFTWARE INC. Notes to Consolidated Financial Statements (In thousands of U.S. dollars, except per share amounts and as otherwise indicated) Years ended December 31, 2016 and 2015
41
Revenue recognition and separation of customer contract obligations and deliverables – management
applies judgement when assessing whether certain deliverables in a customer arrangement should be included or excluded from the unit of account to which contract accounting is applied. The judgement is typically related to the sale and inclusion of third party hardware, professional services and licenses in a customer arrangement and involves an assessment that principally addresses whether the deliverable has stand-alone value to the customer that is not dependent upon other components of the arrangement.
Deferred tax assets - the recognition of deferred tax assets is based on forecasts of future taxable profit. The measurement of future taxable profit for the purposes of determining whether or not to recognize deferred tax assets depends on many factors, including the Company's ability to generate such profits and the implementation of effective tax planning strategies. The occurrence or non-occurrence of such events in the future may lead to significant changes in the measurement of deferred tax assets.
Provisions - in recognizing provisions, the Company evaluates the extent to which it is probable that it has incurred a legal or constructive obligation in respect of past events and the probability that there will be an outflow of benefits as a result. The judgements used to recognize provisions are based on currently known factors which may vary over time, resulting in changes in the measurement of recorded amounts as compared to initial estimates.
3. Significant accounting policies
The accounting policies set out below have been applied consistently to all periods presented in these consolidated financial statements unless otherwise indicated.
The significant accounting policies have been applied consistently by the Company‘s subsidiaries.
(a) Basis of consolidation
(i) Business combinations
Acquisitions have been accounted for using the acquisition method required by IFRS 3 Business Combinations. Goodwill arising on acquisitions is measured as the fair value of the consideration transferred including the recognized amount of any non-controlling interest in the acquiree, if any, less the net recognized amount of the estimated fair value of identifiable assets acquired and liabilities assumed (subject to certain exemptions to fair value measurement principles such as deferred tax assets or liabilities), all measured as of the acquisition date. When the consideration transferred is less than the estimated fair value of assets acquired and liabilities assumed, a bargain purchase gain is recognized immediately in the consolidated statements of income. Transaction costs that the Company incurs in connection with a business combination are expensed as incurred.
The Company uses its best estimates and assumptions to reasonably value assets and liabilities assumed at the acquisition date as well as contingent consideration, where applicable, and these estimates are inherently uncertain and subject to refinement. As a result, during the measurement period, which may be up to one year from the acquisition date, the Company may record adjustments to the assets acquired and liabilities assumed with a corresponding offset to goodwill. Upon conclusion of the measurement period or final determination of the values of assets acquired or liabilities assumed, whichever comes first, any subsequent adjustments are recorded to profit or loss. For a given acquisition, the Company may identify certain pre-acquisition contingencies as of the acquisition date and may extend its review and evaluation of these pre-acquisition contingencies throughout the measurement period in order to obtain sufficient information to assess these contingencies as part of acquisition accounting, as applicable.

CONSTELLATION SOFTWARE INC. Notes to Consolidated Financial Statements (In thousands of U.S. dollars, except per share amounts and as otherwise indicated) Years ended December 31, 2016 and 2015
42
(ii) Consolidation methods
Entities over which the Company has control are fully consolidated from the date that control commences until the date that control ceases. Entities over which the Company has significant influence (investments in "associates") are accounted for under the equity method. Significant influence is assumed when the Company's interests are 20% or more, unless qualitative factors overcome this assumption.
Associates are those entities in which the Company has significant influence, but not control, over the financial and operating policies. Investments in associates are recognized initially at cost, inclusive of transaction costs. The Company's investment includes goodwill identified on acquisition, net of any accumulated impairment losses. The consolidated financial statements include the Company's share of the income and expenses and equity changes of equity accounted investees, from the date that significant influence commences until the date that significant influence ceases.
(iii) Transactions eliminated on consolidation
Intra-company balances and transactions, and any unrealized income and expenses arising from intra-company transactions, are eliminated in preparing the consolidated financial statements.
(b) Foreign currency translation
(i) Foreign currency transactions
Transactions in foreign currencies are translated to the respective functional currencies of subsidiaries of the Company at exchange rates at the dates of the transactions. Monetary assets and liabilities denominated in foreign currencies at the reporting date are re-measured to the functional currency at the exchange rate at that date. Foreign currency differences arising on re-measurement are recognized through profit or loss, except for differences arising on the retranslation of available-for-sale equity instruments, which are recognized in other comprehensive income. Non-monetary items that are measured in terms of historical cost in a foreign currency are translated using the exchange rate at the date of the transaction. Foreign currency gains and losses are reported in profit and loss on a net basis. The effect of currency translation adjustments on cash and cash equivalents is presented separately in the statements of cash flows and separated from investing and financing activities when deemed significant.
(ii) Foreign operations
The assets and liabilities of foreign operations, including goodwill and fair value adjustments arising on acquisition, are translated to U.S. dollars at exchange rates at the reporting date. The income and expenses of foreign operations are translated to U.S. dollars using average exchange rates for the month during which the transactions occurred. Foreign currency differences are recognized in other comprehensive income in the cumulative translation account; however, if the operation is a non-wholly owned subsidiary, then the relevant proportionate share of the translation difference is allocated to the non-controlling interest when applicable.
Foreign exchange gains or losses arising from a monetary item receivable from or payable to a foreign operation, the settlement of which is neither planned nor likely to occur in the foreseeable future and which its substance is considered to form part of the net investment in the foreign operation, are recognized in other comprehensive income in the cumulative amount of foreign currency translation differences. If, and when, settlement plans change or deemed likely to occur, then the accounting process in (b)(i) above is applied. When a foreign operation payable or receivable classified as a net investment is partially or fully disposed, the proportionate share of the cumulative amount in the translation reserve related to that foreign operation is transferred to profit or loss as part of the profit

CONSTELLATION SOFTWARE INC. Notes to Consolidated Financial Statements (In thousands of U.S. dollars, except per share amounts and as otherwise indicated) Years ended December 31, 2016 and 2015
43
or loss on disposal. The Company has elected not to treat repayments of monetary items receivable or payable to a foreign operation as a disposition.
(c) Financial Instruments
The Company's financial instruments comprise cash, equity securities, accounts receivable, derivatives in the form of cash flow hedges, bank indebtedness, CNH facility, debentures, Total Specific Solutions B.V. (“TSS”) membership liability, accounts payable and accrued liabilities, dividends payable, income taxes payable and holdback liabilities on acquisitions.
Financial assets are recognized in the consolidated statement of financial position if we have a contractual right to receive cash or other financial assets from another entity. Financial assets, including accounts receivable, are derecognized when the rights to receive cash flows from the investments have expired or were transferred to another party and the Company has transferred substantially all risks and rewards of ownership.
All financial liabilities are recognized initially on the date at which the Company becomes a party to the contractual provisions of the instrument. The Company derecognizes a financial liability when its contractual obligations are discharged, cancelled or expire.
Financial assets and liabilities are offset and the net amount presented in the statement of financial position when, and only when, the Company has a legal right to offset the amounts and intends either to settle on a net basis or to realize the asset and settle the liability simultaneously.
(i) Non-derivative financial assets
Non-derivative financial assets are classified in the following categories at the time of initial recognition based on the purpose for which the financial assets were acquired:
Available-for-sale financial assets
Available-for-sale financial assets are non-derivative financial assets that are designated as available-for-sale and that are not classified within loans and receivables or financial assets at fair value through profit or loss. The Company’s investments in equity securities are classified as available-for-sale financial assets and are recognized initially at fair value inclusive of any directly attributable transaction costs. Subsequent to initial recognition, they are measured at fair value and changes therein, other than impairment losses which are recognized in profit or loss, are recognized in other comprehensive income and presented within shareholders’ equity. When an investment is disposed of and derecognized, the cumulative gain or loss in other comprehensive income is transferred to profit or loss for the period.
The fair value of the available-for-sale financial assets is determined by reference to their quoted closing bid price at the reporting date.
Loans and receivables
Loans and receivables, which comprise accounts receivable, are financial assets with fixed or determinable payments that are not quoted in an active market. Such assets are recognized initially at fair value inclusive of any directly attributable transaction costs and subsequently carried at amortized cost using the effective interest method, less any impairment losses. They are included in current assets, except for those with maturities greater than 12 months after the balance sheet date, which are classified as non-current assets.

CONSTELLATION SOFTWARE INC. Notes to Consolidated Financial Statements (In thousands of U.S. dollars, except per share amounts and as otherwise indicated) Years ended December 31, 2016 and 2015
44
(ii) Non-derivative financial liabilities
Financial liabilities include bank indebtedness, CNH facility, TSS membership liability, debentures, accounts payable and accrued liabilities, dividends payable, income taxes payable and holdbacks on acquisitions. Financial liabilities are generally recognized initially at fair value, typically being transaction price, plus any directly attributable transaction costs and subsequently measured at amortized cost using the effective interest method. The Company derecognizes a financial liability when its contractual obligations are discharged, cancelled, or expired.
(iii) Capital Stock
Common shares are classified as equity. Incremental costs directly attributable to the issue of common shares are recognized as a deduction from equity, net of tax.
(iv) Derivatives
The Company’s derivatives are carried at fair value and are reported as assets when they have a positive fair value and as liabilities when they have a negative fair value.
Changes in the fair values of derivative financial instruments are reported in the consolidated statements of income, except for cash flow hedges that meet the conditions for hedge accounting. The portion of the gain or loss on the hedging instruments that are determined to be an effective hedge are recognized directly in other comprehensive income, and the ineffective portion in the consolidated statements of income. The gains or losses deferred in other comprehensive income in this way are subsequently recognized in the consolidated statements of income in the same period in which the hedged underlying transaction or firm commitment is recognized in the statement of income. In order to qualify for hedge accounting, the Company is required to document in advance the relationship between the item being hedged and the hedging instrument. The Company is also required to document and demonstrate an assessment of the relationship between the hedged item and the hedging instrument, which shows that the hedge will be highly effective on an ongoing basis. This effectiveness testing is re-performed at the end of each reporting period to ensure that the hedge remains highly effective.
(d) Intangible assets
(i) Goodwill
Goodwill that arises upon the acquisition of subsidiaries is included in intangible assets. After initial recognition, goodwill is measured at cost less any accumulated impairment losses, with the carrying value being reviewed for impairment at least annually and whenever events or changes in circumstances indicate that the carrying value may be impaired. In respect of equity accounted investees, the carrying amount of goodwill is included in the carrying amount of the investment. No such losses relating to goodwill have been recognized during the year.
The impairment test methodology is based on a comparison between the higher of fair value less costs to sell and value-in-use of each of the Company's business units (considered as the grouping of cash generating units at which level the impairment test is performed) and the net asset carrying values (including goodwill) of the Company's business units. Within the Company's reporting structure, business units generally reflect one level below the six operating segments (Volaris, Harris, Total Specific Solutions, Jonas, Perseus, and Vela Operating Groups). In determining the recoverable amount, the Company applies an estimated market valuation multiple to the business unit's most recent annual recurring revenues, which are derived from combined software/support contracts revenues, transactional revenues, and hosted products revenues. Valuation multiples applied by management for this purpose reflect current market conditions specific to the business unit and are assessed for reasonability by comparison to the Company's current and past acquisition experience involving ranges of revenue-based multiples

CONSTELLATION SOFTWARE INC. Notes to Consolidated Financial Statements (In thousands of U.S. dollars, except per share amounts and as otherwise indicated) Years ended December 31, 2016 and 2015
45
required to acquire representative software companies and the Company’s overall revenue based-trading multiple. In addition, in certain instances, the recoverable amount is determined using a value-in-use approach which follows the same valuation process that is undertaken for the Company’s business acquisitions. An impairment is recognized if the carrying amount of a cash generating unit (“CGU”) exceeds its estimated recoverable amount. The recoverable amount of goodwill is estimated annually on December 31 of each year or when required.
(ii) Acquired intangible assets
The Company uses the income approach to value acquired technology and customer relationship intangible assets. The income approach is a valuation technique that calculates the estimated fair value of an intangible asset based on the estimated future cash flows that the asset can be expected to generate over its remaining useful life.
The Company utilizes the discounted cash flow ("DCF") methodology which is a form of the income approach that begins with a forecast of the annual cash flows that a market participant would expect the subject intangible asset to generate over a discrete projection period. The forecasted cash flows for each of the years in the discrete projection period are then converted to their present value equivalent using a rate of return appropriate for the risk of achieving the intangible assets' projected cash flows, again, from a market participant perspective. The present value of the forecasted cash flows are then added to the present value of the residual value of the intangible asset (if any) at the end of the discrete projection period to arrive at a conclusion with respect to the estimated fair value of the subject intangible assets.
Specifically, the Company relies on the relief-from-royalty method to value the acquired technology and the multiple-period excess earnings ("MEEM") method to value customer relationship assets.
The underlying premise of the relief-from-royalty method is that the fair value of the technology is equal to the cost savings (or the "royalty avoided") resulting from the ownership of the asset by the avoidance of paying royalties to license the use of the technology from another owner. Accordingly the income forecast reflects an estimate of a fair royalty that a licensee would pay, on a percentage of revenue basis, to obtain a license to utilize the technology.
The MEEM method isolates the cash flows attributable to the subject asset by utilizing a forecast of expected cash flows less the returns attributable to other enabling assets, both tangible and intangible.
Other intangible assets that are acquired by the Company and have finite useful lives are measured at cost, being reflective of fair value, less accumulated amortization and impairment losses. Subsequent expenditures are capitalized only when it increases the future economic benefits that form part of the specific asset to which it relates and other criteria have been met. Otherwise all other expenditures are recognized in profit or loss as incurred.
Amortization is recognized in profit or loss on a straight-line basis over the estimated useful lives of intangible assets, other than goodwill, from the date that they are acquired and available for use, since this most closely reflects the expected usage and pattern of consumption of the future economic benefits embodied in the asset. To determine the useful life of the technology assets, the Company considers the length of time over which it expects to earn or recover the majority of the present value of the forecasted cash flows of the related intangible assets. The estimated useful lives for the current and comparative periods are as follows:
Technology assets 2 to 12 years Customer assets 5 to 20 years Trademarks 20 years Backlog Up to 1 year Non-compete agreements Term of agreement

CONSTELLATION SOFTWARE INC. Notes to Consolidated Financial Statements (In thousands of U.S. dollars, except per share amounts and as otherwise indicated) Years ended December 31, 2016 and 2015
46
Amortization methods, useful lives and the residual values are reviewed at least annually (or when there has been an indication of impairment) and are adjusted as appropriate.
(iii) Research and development
Expenditure on research activities, undertaken with the prospect of gaining new scientific or technical knowledge and understanding, is recognized in profit or loss as an expense as incurred.
Expenditure on development activities, whereby research findings are applied to a plan or design for the production of new or substantially improved products and processes, is capitalized only if the product or process is technically and commercially feasible, if development costs can be measured reliably, if future economic benefits are probable, if the Company intends to use or sell the asset and the Company intends and has sufficient resources to complete development. To date, no material development expenditures have been capitalized.
For the year ended December 31, 2016, $294,735 (2015 ‒ $258,416) of research and development costs have been expensed in profit or loss. These costs are net of estimated investment tax credits, recognized as part of other, net expenses through profit or loss of $19,007 for the year ended December 31, 2016 (2015 ‒ $14,772).
(e) Property and equipment
(i) Recognition and measurement
Property and equipment are measured at cost less accumulated depreciation and accumulated impairment losses. Cost includes initial and subsequent expenditures that are directly attributable to the acquisition of the related asset. When component parts of an item of property and equipment have different useful lives, they are accounted for as separate items (major components) of property and equipment, where applicable.
(ii) Depreciation
Depreciation is recognized in profit or loss on a straight-line basis over the estimated useful lives of each part of an item of property and equipment.
The estimated useful lives for the current and comparative periods are as follows:
Asset Rate Computer hardware 3-5 years Computer software 1 year Furniture and equipment 5 years Leasehold improvements Shorter of the estimated useful life and the term of the lease Building 50 years
Depreciation methods, useful lives and residual values are reviewed at each financial year end or more frequently as deemed relevant, and adjusted where appropriate.
(f) Inventories
Inventories are measured at the lower of cost and net realizable value. The cost of inventories is based on the first-in first-out principle, and includes expenditures incurred in acquiring the inventories, production and other costs incurred in bringing them to their existing location and condition. In the case of manufactured inventories and work

CONSTELLATION SOFTWARE INC. Notes to Consolidated Financial Statements (In thousands of U.S. dollars, except per share amounts and as otherwise indicated) Years ended December 31, 2016 and 2015
47
in progress, cost includes an appropriate share of production overheads based on normal operating capacity. Net realizable value is the estimated selling price in the ordinary course of business, less the estimated costs of completion and selling expenses.
(g) Work in progress
Work in progress represents the gross unbilled amount expected to be collected from customers for contract work performed to date. It is measured at cost plus profit recognized to date less progress billings and recognized losses, if any.
Work in progress is presented in the statement of financial position for all contracts in which costs incurred plus recognized profits exceed progress billings. If progress billings exceed costs incurred plus recognized profits, then the excess is presented as deferred revenue in the statement of financial position.
(h) Other non-current liabilities
Other non-current liabilities consists principally of the non-current portion of lease incentives, non-compete obligations, certain acquired contract liabilities, deferred revenue, provisions and contingent consideration recognized in connection with business acquisitions to be settled in cash, which are discounted for measurement purposes.
(i) Impairment
(i) Financial assets (including receivables)
A financial asset not carried at fair value through profit or loss is assessed at each reporting date to determine whether there is objective evidence that it is impaired. A financial asset is impaired if objective evidence indicates that a loss event has occurred after the initial recognition of the asset, and that the loss event had a negative effect on the estimated future cash flows of that asset that can be estimated reliably.
Objective evidence that financial assets are impaired can include default or delinquency by a debtor, restructuring of an amount due to the Company on terms that the Company would not consider otherwise, or indications that a debtor or issuer will enter bankruptcy.
The Company considers evidence of impairment for receivables at both a specific and collective level. All individually significant receivables are assessed for specific impairment. All individually significant receivables found not to be specifically impaired, together with receivables that are not individually significant are collectively assessed for impairment by grouping together receivables with similar risk characteristics.
An impairment loss in respect of a financial asset measured at amortized cost is calculated as the difference between its carrying amount and the present value of the estimated future cash flows discounted at the asset's original effective interest rate. Losses are recognized in profit or loss and reflected in an allowance account against receivables. When a subsequent event causes the amount of impairment loss to decrease, the decrease in impairment loss is reversed through profit or loss.
(ii) Non-financial assets
The carrying amounts of the Company’s non-financial assets, other than inventories (which is addressed in note 3(f)) and deferred tax assets (which is addressed in note 3(m)), are reviewed at each reporting date (or more
CONSTELLATION SOFTWARE INC. Notes to Consolidated Financial Statements (In thousands of U.S. dollars, except per share amounts and as otherwise indicated) Years ended December 31, 2016 and 2015
48
frequently if required) to determine whether there is any indication of impairment. If any such indication exists, then the asset’s recoverable amount is estimated. For goodwill, the recoverable amount is estimated annually on December 31 of each fiscal year or whenever required.
The recoverable amount of an asset or CGU is the greater of its value in use and its fair value less costs to sell. In assessing the value in use, the Company uses discounted cash flows which are determined using a pre-tax discount rate specific to the asset or CGU. The discount rate used reflects current market conditions including risks specific to the assets. Significant estimates within the cash flows include recurring revenue growth rates and operating expenses. For the purpose of impairment testing, assets that cannot be tested individually are grouped together into the smallest group of assets that generates cash inflows from continuing use that are largely independent of the cash inflows of other assets or groups of assets, which for the Company’s purposes is typically representative of the business unit level within the corporate and management structure. For the purposes of goodwill impairment testing, goodwill acquired in a business combination is allocated to the CGU, or the group of CGUs, that is expected to benefit from the synergies of the combination.
An impairment loss is recognized if the carrying amount of an asset or its CGU exceeds its estimated recoverable amount. Impairment losses are recognized in profit or loss. Impairment losses recognized in respect of CGUs are allocated first to reduce the carrying amount of any goodwill allocated to the CGU, and then to reduce the carrying amounts of the other assets (such as intangible assets and property and equipment) in the CGU (group of units) on a pro rata basis.
Goodwill that forms part of the carrying amount of an investment in an associate is not recognized separately and, therefore, is not tested for impairment separately. Instead, the entire amount of the investment in an associate is tested for impairment as a single asset when there is objective evidence that the investment in an associate may be impaired.
An impairment loss in respect of goodwill is not reversed. In respect of other non-financial assets, impairment losses recognized in prior periods are assessed at each reporting date for any indications that the loss has decreased or no longer exists. An impairment loss is reversed if there has been a change in the estimates used to determine the recoverable amount. An impairment loss is reversed only to the extent that the asset's carrying amount does not exceed the carrying amount that would have been determined, net of depreciation or amortization, if no impairment loss had been previously recognized.
(j) Provisions
A provision is recognized if, as a result of a past event, the Company has a present legal or constructive obligation that can be estimated reliably, and it is probable that an outflow of economic benefits will be required to settle the obligation. Provisions are measured at the estimated future cash flows required to settle the present obligation, based on the most reliable evidence available at the reporting date. The estimated cash flows are discounted at a pre-tax rate that reflects current market assessments of the time value of money and the risks specific to the liability. The amortization of the discount is recognized as part of finance costs.
(k) Revenue recognition
Revenue represents the fair value of consideration received or receivable from customers for goods and services provided by the Company, net of discounts and sales taxes. The Company reports revenue under four revenue categories being, License, Hardware and other, Professional services, and Maintenance and other recurring revenue.

CONSTELLATION SOFTWARE INC. Notes to Consolidated Financial Statements (In thousands of U.S. dollars, except per share amounts and as otherwise indicated) Years ended December 31, 2016 and 2015
49
Typically, the Company's software license agreements are multiple-element arrangements as they may also include maintenance, professional services, and hardware. Multiple-element arrangements are recognized as the revenue for each unit of accounting is earned based on the relative fair value of each unit of accounting as determined by an internal analysis of prices or by using the residual method. A delivered element is considered a separate unit of accounting if it has value to the customer on a standalone basis, and delivery or performance of the undelivered elements is considered probable and substantially under the Company's control. If these criteria are not met, revenue for the arrangement as a whole is accounted for as a single unit of accounting. Where company-specific objective evidence of fair value cannot be determined for undelivered elements, the Company determines fair value of the respective element by estimating its stand-alone selling price, which is also applied for the presentation as part of the revenue categories noted above when certain of those elements are deemed to be a single unit of accounting.
The Company typically sells or licenses software on a perpetual basis, but also licenses software for a specified period. Revenue from short-term time-based licenses, which usually include support services during the license period, is recognized rateably over the license term. Revenue from multi-year time-based licenses that include support services, whether separately priced or not, is recognized rateably over the license term unless a substantive support service renewal rate exists; if this is the case, the amount allocated to the delivered software is recognized as license revenue based on the residual approach once the revenue criteria have been met. In those instances where the customer is required to renew mandatory support and maintenance in order to maintain use of the licensed software over the license term, the Company recognizes the consideration attributable to the license and support for the initial term of the arrangement over the initial term and recognizes revenue for the support renewal fees in subsequent years over the respective renewal periods.
Revenue from the license of software involving significant implementation or customization essential to the functionality of the Company's product, or from the sales of hardware where software is essential to its functionality, is recognized under the percentage-of-completion method of contract accounting based either on the achievement of contractually defined milestones or based on labour hours. Any probable losses are recognized immediately in profit or loss. In certain situations where the outcome of an arrangement cannot be estimated reliably, costs associated with the arrangement are recognized as incurred. In this situation, revenues are recognized only to the extent of the costs incurred that are probable of recovery.
A portion of the Company's sales, categorized as hardware and other revenue, are accounted for as product revenue. Product revenue is recognized when the Company has an executed agreement, the product has been delivered and costs can be measured reliably, the amount of the fee to be paid by the customer is fixed and determinable, and the collection of the related receivable is deemed probable from the outset of the arrangement. If for any of the product or service offerings, the Company determines at the outset of an arrangement that the amount of revenue cannot be measured reliably, and the Company concludes that the inflow of economic benefits associated with the transaction is not probable, then the revenue is deferred until the arrangement fee becomes due and payable by the customer. If, at the outset of an arrangement, the Company determines that collectability is not probable, and the Company concludes that the inflow of economic benefits associated with the transaction is not probable, then revenue recognition is deferred until the earlier of when collectability becomes probable or payment is received. If collectability becomes unlikely before all revenue from an arrangement is recognized, the Company recognizes revenue only to the extent of the fees that are successfully collected unless collectability becomes reasonably assured again. If a customer is specifically identified as a collection risk, the Company does not recognize revenue except to the extent of the fees that have already been collected.
Revenue related to the customer reimbursement of travel related expenses incurred during a project implementation is included in the hardware and other revenue category. Revenue is recognized as costs are incurred which is consistent with the period in which the costs are invoiced. Reimbursable travel expenses incurred for which an invoice has not been issued, are recorded as part of work in progress on the statement of financial position.

CONSTELLATION SOFTWARE INC. Notes to Consolidated Financial Statements (In thousands of U.S. dollars, except per share amounts and as otherwise indicated) Years ended December 31, 2016 and 2015
50
Maintenance and other recurring revenue primarily consists of fees charged for customer support on software products post-delivery and also includes, to a lesser extent, recurring fees derived from combined software/support contracts, transaction revenues, managed services, and hosted products. The company-specific fair value of maintenance is typically derived from rates charged to renew these services after an initial period. Maintenance revenue remaining to be recognized in profit or loss is recognized as deferred revenue in the statements of financial position when amounts have been billed in advance and the term of the service period has commenced.
Professional Services revenue including implementation, training and customization of software is recognized by the stage of completion of the arrangement determined using the percentage of completion method noted above or as such services are performed as appropriate in the circumstances. The revenue and profit of fixed price contracts is recognized on a percentage of completion basis when the outcome of a contract can be estimated reliably. When the outcome of the contract cannot be estimated reliably, the amount of revenue recognized is limited to the cost incurred in the period. Losses on contracts are recognized as soon as a loss is foreseen by reference to the estimated costs of completion.
Management exercises judgement in determining whether a contract's outcome can be estimated reliably. Management also applies estimates in the calculation of future contract costs and related profitability as it relates to labour hours and other considerations, which are used in determining the value of amounts recoverable on contracts and timing of revenue recognition. Estimates are continually and routinely revised based on changes in the facts relating to each contract. Judgement is also needed in assessing the ability to collect the corresponding receivables.
The timing of revenue recognition often differs from contract payment schedules, resulting in revenue that has been earned but not billed. These amounts are included in work in progress. Amounts billed in accordance with customer contracts, but not yet earned, are recorded and presented as part of deferred revenue.
(l) Finance income and finance costs
Finance income comprises interest income, gains on the disposal of available-for-sale financial assets, and changes in the fair value of financial assets at fair value through profit or loss. Interest income is recognized as it accrues through profit or loss, using the effective interest method.
Finance costs comprise interest expense on borrowings, amortization of the discount on provisions, fair value losses on financial assets at fair value through profit or loss, and impairment losses recognized on financial assets other than trade receivables. Transaction costs attributable to the Company’s bank indebtedness are recognized in finance costs using the effective interest method.
(m) Income taxes
Income tax expense comprises current and deferred tax. Current tax and deferred tax are recognized in profit or loss except to the extent that it relates to a business combination, or items recognized directly in equity or in other comprehensive income.
Current tax is the expected taxes payable or receivable on the taxable income or loss for the period, using tax rates enacted or substantively enacted at the reporting date, and any adjustment to taxes payable in respect of previous years.
Deferred tax is recognized in respect of temporary differences between the carrying amounts of assets and liabilities for financial reporting purposes and the amounts used for taxation purposes. Deferred tax is not recognized for temporary differences relating to investments in subsidiaries to the extent that it is probable that they will not reverse

CONSTELLATION SOFTWARE INC. Notes to Consolidated Financial Statements (In thousands of U.S. dollars, except per share amounts and as otherwise indicated) Years ended December 31, 2016 and 2015
51
in the foreseeable future. In addition, deferred tax is not recognized for taxable temporary differences arising on the initial recognition of goodwill.
Deferred tax is measured at tax rates that are expected to be applied to temporary differences when they reverse, based on the laws that have been enacted or substantively enacted by the reporting date. Deferred tax assets and liabilities are offset if there is a legally enforceable right to offset current tax liabilities and assets, and they relate to income taxes levied by the same tax authority on the same taxable entity, or on different tax entities, but we intend to settle current tax liabilities and assets on a net basis or their tax assets and liabilities will be realized simultaneously.
A deferred tax asset is recognized for unused tax losses, tax credits, difference in tax bases in the purchaser's tax jurisdiction and its cost as reported in the consolidated financial statements as a result of an intra-group transfer of assets and deductible temporary differences, to the extent that it is probable that future taxable profits will be available against which they can be utilized. Deferred tax assets are reviewed at each reporting date and are reduced to the extent that it is no longer probable that the related tax benefit will be realized.
(n) Investment tax credits
The Company is entitled to both non-refundable and refundable investment tax credits for qualifying research and development activities. Investment tax credits are accounted for as a reduction of the related expenditure for items of a period expense nature or as a reduction of property and equipment for items of a capital nature when the amount is reliably estimable and the Company has reasonable assurance regarding compliance with the relevant objective conditions and that the credit will be realized.
(o) Segment reporting
An operating segment is a component of the Company that engages in business activities from which it may earn revenues and incur expenses, including revenues and expenses that relate to transactions with any of the Company’s other components. The operating results of all operating segments are reviewed regularly by the Company’s President and Chairman of the Board of Directors to make decisions about resources to be allocated to the segment and assessing their performance.
The Company has six operating segments, referred to as Operating Groups by the Company, being Volaris, Harris, Total Specific Solutions, Jonas, Perseus, and Vela. The operating segments are aggregated by applying the aggregation criteria in IFRS 8, Operating Segments, into two reportable segments Public (Volaris, Harris, TSS Operating Groups) and Private (Jonas, Perseus, Vela Operating Groups). To the extent there have been transfers of business units between our Public and Private segments, we have restated the comparatives for these transfers.
Segment operating results, assets and liabilities include items directly attributable to a segment as well as those that can be allocated on a reasonable basis. Unallocated items comprise mainly interest-bearing borrowings and related expenses, and corporate assets and expenses and are included as part of the other segment when reconciling to the Company’s consolidated totals.
Segment capital expenditures are the total costs incurred during the period to acquire segment assets, being property and equipment and intangible assets that are expected to be used for more than one year.

CONSTELLATION SOFTWARE INC. Notes to Consolidated Financial Statements (In thousands of U.S. dollars, except per share amounts and as otherwise indicated) Years ended December 31, 2016 and 2015
52
(p) Earnings per share
The Company presents basic and diluted earnings per share data for its ordinary shares, being common shares. Basic earnings per share is calculated by dividing the profit or loss attributable to ordinary shareholders of the Company by the weighted average number of ordinary shares outstanding during the period, adjusted for treasury shares held. Diluted earnings per share is determined by dividing the profit or loss attributable to shareholders of ordinary shares by the weighted average number of shares outstanding, adjusted for the effects of all dilutive potential ordinary shares.
(q) Short-term employee benefits
Short-term employee benefit obligations, including wages, benefits, incentive compensation, and compensated absences are measured on an undiscounted basis and are expensed as the related service is provided. A liability is recognized for the amount expected to be paid and settled under the Company's employee incentive compensation plan if the Company has legal or constructive obligation to pay this amount at the time bonuses are paid as a result of past service provided by the employee, and the obligation can be estimated reliably.
(r) Lease payments
Payments made under operating leases are recognized in profit or loss on a straight-line basis over the term of the lease. Lease incentives received are recognized as an integral part of the total lease expense over the term of the lease.
(s) New standards and interpretations not yet adopted
IFRS 9 Financial Instruments
IFRS 9 replaces the guidance in IAS 39 Financial Instruments: Recognition and Measurement, on the classification and measurement of financial assets. IFRS 9 eliminates the existing IAS 39 categories of held to maturity, available-for-sale and loans and receivable.
Financial assets will be classified into one of two categories on initial recognition:
• financial assets measured at amortized cost; or • financial assets measured at fair value.
Gains and losses on remeasurement of financial assets measured at fair value will be recognized in profit or loss, except for an investment in an equity instrument which is not held-for-trading. IFRS 9 provides, on initial recognition, an irrevocable election to present all fair value changes from the investment an equity instrument that is not held for trading in other comprehensive income (OCI). The election is available on an individual investment-by-investment basis. Amounts presented in OCI will not be reclassified to profit or loss at a later date. IFRS 9 also includes a new general hedge accounting standard which will align hedge accounting more closely with risk management.
The standard has a mandatory effective date for annual periods beginning on or after January 1, 2018 with early adoption permitted. The Company is assessing the impact of this standard on its consolidated financial statements.

CONSTELLATION SOFTWARE INC. Notes to Consolidated Financial Statements (In thousands of U.S. dollars, except per share amounts and as otherwise indicated) Years ended December 31, 2016 and 2015
53
IFRS 15 Revenue from Contracts with Customers
On May 28, 2014, the IASB issued IFRS 15 Revenue from Contracts with Customers. The new standard is effective for fiscal years beginning on or after January 1, 2018 and is available for early adoption. The standard contains a single model that applies to contracts with customers. The model features a contract-based five-step analysis of transactions to determine whether, how much and when revenue is recognized. New estimates and judgmental thresholds have been introduced, which may affect the amount and/or timing of revenue recognized. The Company intends to adopt IFRS 15 in its financial statements for the annual period beginning on January 1, 2018. We have a team dedicated to ensuring our compliance with IFRS 15. This team is responsible for determining existing policies, differences between existing policies and IFRS 15, ensuring our data collection is appropriate, and communicating the upcoming changes with various stakeholders. In addition, this team is assisting in the development of processes and policies that will help ensure an effective transition and the related results are accurate. As a result, we are continuing to assess the impact of this standard on our consolidated financial statements.
IFRS 16 Leases
In January 2016, the IASB issued the final publication of the IFRS 16 Leases standard, which will supersede the current IAS 17, Leases standard. Under IFRS 16, a lease will exist when a customer controls the right to use an identified asset as demonstrated by the customer having exclusive use of the asset for a period of time. IFRS 16 introduces a single accounting model for lessees and all leases will require an asset and liability to be recognized on the statement of financial position at inception. The accounting treatment for lessors will remain largely the same as under IAS 17.
The standard is effective for annual periods beginning on or after January 1, 2019 with early adoption permitted, but only if the entity is also applying IFRS 15. The Company is required to retrospectively apply IFRS 16 to all existing leases as of the date of transition and has the option to either:
apply IFRS 16 with full retrospective effect; or recognize the cumulative effect of initially applying IFRS 16 as an adjustment to opening equity at the date
of initial application.
As a practical expedient, an entity is not required to reassess whether a contract is, or contains, a lease at the date of initial application. The Company is assessing the impact of this standard on its consolidated financial statements; however, we believe that on adoption of the standard there will be an increase to assets and liabilities, as we will be required to record a right-of-use asset and a corresponding lease liability on our Consolidated Statements of Financial Position, as well as a decrease to operating costs, an increase to finance costs (due to accretion of the lease liability) and an increase to depreciation and amortization (due to amortization of the right-of-use asset).
4. Business acquisitions
(a) During the year ended December 31, 2016, the Company completed forty acquisitions for aggregate cash consideration of $188,068 plus cash holdbacks of $18,797 and contingent consideration with an estimated fair value of $4,551 resulting in total consideration of $211,416. The contingent consideration is payable on the achievement of certain financial targets in the post-acquisition periods. The obligation for contingent consideration for acquisitions during the year ended December 31, 2016 has been recorded at its estimated fair value at the various acquisition dates. The estimated fair value of the applicable contingent consideration is calculated using the weighted probability of the expected contingent consideration to be paid and inclusion of a discount rate as appropriate. For these arrangements, which include both maximum, or capped, and unlimited contingent consideration amounts, the estimated increase to the initial consideration is not expected to exceed a maximum of
CONSTELLATION SOFTWARE INC. Notes to Consolidated Financial Statements (In thousands of U.S. dollars, except per share amounts and as otherwise indicated) Years ended December 31, 2016 and 2015
54
$15,529. Aggregate contingent consideration of $15,538 (December 31, 2015 - $21,494) has been reported in the consolidated statement of financial position at its estimated fair value relating to applicable acquisitions completed in the current and prior periods. Changes made to the estimated fair value of contingent consideration are included in other expenses, net in the consolidated statements of income. An expense of $20 has been recorded for the year ended December 31, 2016, as a result of such changes (expense of $6,729 for the year ended December 31, 2015).
There were no acquisitions during the period that were deemed to be individually significant. Of the forty acquisitions, the Company acquired 100% of the shares of twenty-nine businesses and acquired the net assets of the other eleven businesses. The cash holdbacks are generally payable over a 6-month to 24-month period and are adjusted, as necessary, for such items as working capital or net tangible asset assessments, as defined in the agreements, and claims under the respective representations and warranties of the purchase and sale agreements.
The acquisitions during the year ended December 31, 2016 include software companies catering to the following markets; notaries, mining, pharmacies, electric utility, ombudsman, healthcare, aerospace, local government, communications, research management, agribusiness, public housing authorities, retail management and distribution, event management, school administration, homebuilders, real estate brokers and agents, public safety, marine asset management, moving and storage, not-for-profit organizations, and financial services, all of which are software businesses similar to existing businesses operated by the Company. The acquisitions have been accounted for using the acquisition method with the results of operations included in these consolidated financial statements from the date of each acquisition. Twenty-eight of the acquisitions have been included in the Public reportable segment and twelve have been included in the Private reportable segment.
The goodwill recognized in connection with these acquisitions is primarily attributable to the application of Constellation’s best practices to improve the operations of the companies acquired, synergies with existing businesses of Constellation, and other intangibles that do not qualify for separate recognition including assembled workforce. Goodwill in the amount of $43 (December 31, 2015 - $1,554) is expected to be deductible for income tax purposes.
The gross contractual amounts of acquired receivables was $26,357; however the Company has recorded an allowance of $1,078 as part of the acquisition accounting to reflect contractual cash flows that are not expected to be collected.
Due to the complexity and timing of certain acquisitions made, the Company is in the process of determining and finalizing the estimated fair value of the net assets acquired as part of the acquisitions closed during 2016. The amounts determined on a provisional basis generally relate to net asset assessments and measurement of the assumed liabilities, including acquired contract liabilities. The cash consideration associated with these provisional estimates totals $188,068.
The aggregate impact of acquisition accounting applied in connection with business acquisitions in the year ended December 31, 2016 is as follows:

CONSTELLATION SOFTWARE INC. Notes to Consolidated Financial Statements (In thousands of U.S. dollars, except per share amounts and as otherwise indicated) Years ended December 31, 2016 and 2015
55
(b) The 2016 business acquisitions did not have a material impact to either the consolidated revenue or the consolidated net income for the year ended December 31, 2016. The materiality threshold is reviewed on an annual basis taking into account the quantitative (contribution to revenue and net income) and qualitative (size and comparability with other Constellation businesses) factors of current period acquisitions on both an individual and aggregate basis.
5. Equity securities available-for-sale
During the year ended December 31, 2016, the Company made investments in two public companies listed in the U.S. and Canada, both of which develop and sell software solutions. These investments have been designated as available-for-sale. The unrealized gains/losses related to the available-for-sale equity securities have been recorded in Accumulated other comprehensive income. During the year, the Company fully disposed of one of these investments. The realized gain or loss upon disposition was recorded in Finance and other expense (income) in the Consolidated Statement of Income.
December 31, 2016 December 31, 2015 Cost Fair Value Cost Fair Value
Common shares $ 4,419 $ 4,236 $ - $ -
Public Sector Private Sector Consolidated
Assets acquired:
Cash 30,896$ 4,862$ 35,758$
Accounts receivable 20,543 4,736 25,279
Other current assets 17,342 2,059 19,401
Property and equipment 8,222 1,239 9,461
Other non-current assets 464 284 748
Deferred income taxes 7,094 400 7,494
Technology assets 136,384 33,947 170,331
Customer assets 60,624 12,415 73,039
281,569 59,942 341,511
Liabilities assumed:
Current liabilities 29,969 6,511 36,480
Deferred revenue 53,579 7,902 61,481
Deferred income taxes 41,143 2,471 43,614 Other non-current liabilities 4,336 314 4,650
129,027 17,198 146,225
Goodwill 13,598 2,532 16,130
Total consideration 166,140$ 45,276$ 211,416$

CONSTELLATION SOFTWARE INC. Notes to Consolidated Financial Statements (In thousands of U.S. dollars, except per share amounts and as otherwise indicated) Years ended December 31, 2016 and 2015
56
6. Inventories
No inventories were carried at fair value less cost to sell, and the carrying amount of inventories subject to retention of title clauses was $nil as at December 31, 2016 and 2015.
Raw materials (which consists primarily of hardware components) and changes in finished goods and work in progress recognized as hardware expenses in the statements of income amounted to $74,431 (2015: $84,359). The write-downs of inventories to net realizable value amounted to $1,722 (2015: $1,061). The reversals of write-downs amounted to $581 (2015: $593). Write-downs and reversals of write-downs are based on the Company’s projected sales. The write-downs and reversals are included in hardware expenses.
7. Other assets and liabilities
(a) Other assets
(i) Equity accounted investees
The Company’s share of net income in its investments currently being accounted for as equity investees was $5,317 (2015: $1,070). Dividends received for the year totalled $nil (2015: $509). The carrying value of the Company’s investments in equity accounted investees as at December 31, 2016 was $1,270 (December 31, 2015
December 31, 2016
December 31, 2015
Raw materials 11,529$ 13,948$
Work in progress 767 2,123
Finished goods 7,371 8,261
Total 19,667$ 24,332$
December 31, 2016
December 31, 2015
Prepaid and other current assets 46,931$ 47,196$
Other assets 18,779 -
Investment tax credits recoverable 21,140 11,479
Sales tax receivable 3,971 2,835
Other receivables 5,360 5,736
Total other current assets 96,181$ 67,246$
Investment tax credits recoverable 10,670$ 12,490$
Non-current trade and other receivables 7,842 4,079
Equity accounted investees (i) 1,270 15,617
Total other non-current assets 19,782$ 32,186$
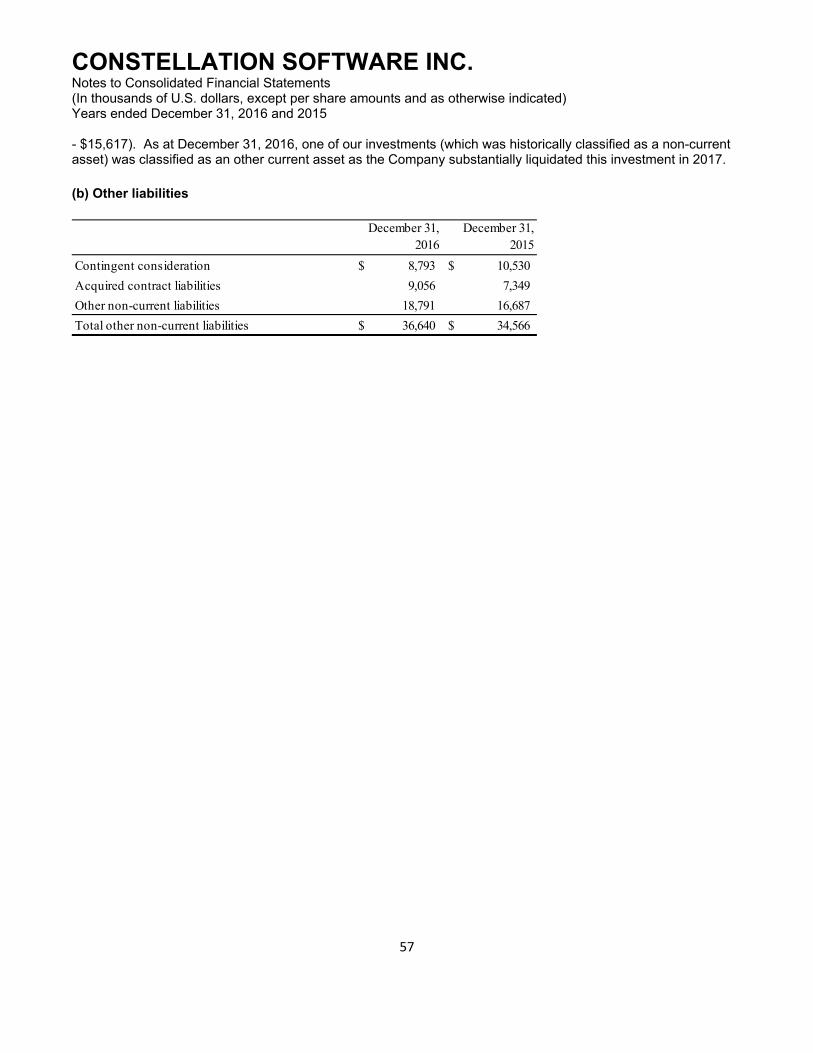
CONSTELLATION SOFTWARE INC. Notes to Consolidated Financial Statements (In thousands of U.S. dollars, except per share amounts and as otherwise indicated) Years ended December 31, 2016 and 2015
57
- $15,617). As at December 31, 2016, one of our investments (which was historically classified as a non-current asset) was classified as an other current asset as the Company substantially liquidated this investment in 2017.
(b) Other liabilities
December 31, 2016
December 31, 2015
Contingent consideration 8,793$ 10,530$
Acquired contract liabilities 9,056 7,349
Other non-current liabilities 18,791 16,687
Total other non-current liabilities 36,640$ 34,566$

CONSTELLATION SOFTWARE INC. Notes to Consolidated Financial Statements (In thousands of U.S. dollars, except per share amounts and as otherwise indicated) Years ended December 31, 2016 and 2015
58
8. Property and equipment
Computer hardwareComputer software
Furniture and equipment
Leasehold improvements Building Total
Cost
Balance at January 1, 2015 46,448$ 20,834$ 23,073$ 11,333$ 3,325$ 105,013$
Additions 6,719 2,467 2,619 1,089 - 12,894
Acquisitions through business combinations 3,998 759 2,831 3,409 22 11,019
Disposals / retirements (9,587) (1,105) (2,051) (13) 80 (12,676)
Effect of movements in foreign exchange and other (1,388) (505) (1,048) (607) (309) (3,857)
Balance at December 31, 2015 46,190$ 22,450$ 25,424$ 15,211$ 3,118$ 112,393$
Balance at January 1, 2016 46,190$ 22,450$ 25,424$ 15,211$ 3,118$ 112,393$
Additions 7,763 2,723 4,774 3,836 2 19,098
Acquisitions through business combinations 5,142 141 2,109 954 933 9,279
Disposals / retirements (10,378) (2,679) (5,120) (2,550) (3) (20,730)
Effect of movements in foreign exchange and other (1,586) (691) (1,226) (365) (210) (4,078)
Balance at December 31, 2016 47,131$ 21,944$ 25,961$ 17,086$ 3,840$ 115,962$
Depreciation and impairment losses
Balance at January 1, 2015 31,508$ 17,165$ 12,996$ 5,924$ 193$ 67,786$
Depreciation charge for the year 9,071 2,518 3,513 1,799 127 17,028
Disposals / retirements (9,547) (1,102) (1,904) (26) - (12,579)
Effect of movements in foreign exchange and other (701) (358) (627) (193) (35) (1,914)
Balance at December 31, 2015 30,331$ 18,223$ 13,978$ 7,504$ 285$ 70,321$
Balance at January 1, 2016 30,331$ 18,223$ 13,978$ 7,504$ 285$ 70,321$
Depreciation charge for the year 11,134 3,106 4,399 3,602 135 22,376
Disposals / retirements (10,120) (2,527) (4,915) (2,397) - (19,959)
Effect of movements in foreign exchange and other (1,439) (615) (839) (255) (23) (3,171)
Balance at December 31, 2016 29,906$ 18,187$ 12,623$ 8,454$ 397$ 69,567$
Carrying amounts:
At January 1, 2015 14,940$ 3,669$ 10,077$ 5,409$ 3,132$ 37,227$
At December 31, 2015 15,859$ 4,227$ 11,446$ 7,707$ 2,833$ 42,072$
At January 1, 2016 15,859$ 4,227$ 11,446$ 7,707$ 2,833$ 42,072$
At December 31, 2016 17,225$ 3,757$ 13,338$ 8,632$ 3,443$ 46,395$

CONSTELLATION SOFTWARE INC. Notes to Consolidated Financial Statements (In thousands of U.S. dollars, except per share amounts and as otherwise indicated) Years ended December 31, 2016 and 2015
59
9. Intangible assets and goodwill
Impairment testing for cash-generating units containing goodwill
The annual impairment test of goodwill was performed as of December 31, 2016 and 2015 and did not result in any impairment loss. For the purpose of impairment testing, goodwill is allocated to the Company’s business units included in each operating segment, which represent the lowest level within the Company at which goodwill is monitored for internal management purposes. There was no goodwill reallocated to the Company’s business units that was deemed to be significant in comparison to the carrying amount of goodwill as at December 31, 2016.
The Company has three CGUs whereby the total goodwill allocated is significant in comparison to the Company’s total carrying amount of goodwill. The total goodwill allocated to each of these CGUs as at December 31, 2016 is $22,912, $23,763 and $24,515. In determining the recoverable amount, the Company applied an estimated market valuation multiple to the business unit's most recent annual recurring revenues, which are derived from combined
Technology Assets
Customer Assets Backlog
Non-compete agreements Trademarks Goodwill Total
Cost
Balance at January 1, 2015 856,469$ 460,810$ 16,348$ 2,638$ 7,660$ 219,920$ 1,563,845$
Acquisitions through business combinations 198,334 88,673 - - - 8,114 295,121
Effect of movements in foreign exchange (25,142) (23,637) (121) (86) (788) (11,771) (61,545)
Balance at December 31, 2015 1,029,661$ 525,846$ 16,227$ 2,552$ 6,872$ 216,263$ 1,797,421$
Balance at January 1, 2016 1,029,661$ 525,846$ 16,227$ 2,552$ 6,872$ 216,263$ 1,797,421$
Acquisitions through business combinations 171,421 73,879 - - - 16,776 262,076
Effect of movements in foreign exchange (24,235) (15,669) (46) 14 (205) (6,537) (46,678)
Balance at December 31, 2016 1,176,847$ 584,056$ 16,181$ 2,566$ 6,667$ 226,502$ 2,012,819$
Accumulated amortization and impairment losses
Balance at January 1, 2015 492,221$ 164,784$ 16,348$ 2,638$ 419$ -$ 676,410$
Amortization for the year 136,523 43,599 - - 347 - 180,469
Effect of movements in foreign exchange (8,760) (2,585) (136) (86) - - (11,567)
Balance at December 31, 2015 619,984$ 205,798$ 16,212$ 2,552$ 766$ -$ 845,312$
Balance at January 1, 2016 619,984$ 205,798$ 16,212$ 2,552$ 766$ -$ 845,312$
Amortization for the year 138,907 51,319 - - 348 - 190,574
Effect of movements in foreign exchange (12,031) (4,684) (31) 14 (78) - (16,810)
Balance at December 31, 2016 746,860$ 252,433$ 16,181$ 2,566$ 1,036$ -$ 1,019,076$
Carrying amounts
At January 1, 2015 364,248$ 296,026$ -$ -$ 7,241$ 219,920$ 887,435$
At December 31, 2015 409,677$ 320,048$ 15$ -$ 6,106$ 216,263$ 952,109$
At January 1, 2016 409,677$ 320,048$ 15$ -$ 6,106$ 216,263$ 952,109$
At December 31, 2016 429,987$ 331,623$ -$ -$ 5,631$ 226,502$ 993,743$

CONSTELLATION SOFTWARE INC. Notes to Consolidated Financial Statements (In thousands of U.S. dollars, except per share amounts and as otherwise indicated) Years ended December 31, 2016 and 2015
60
software/support contracts, transaction revenues, and hosted products. Valuation multiples, which are Level 3 inputs, applied by management for this purpose reflect current market conditions specific to the business unit and are assessed for reasonability by comparison to the Company's current and past acquisition experience involving ranges of revenue-based multiples required to acquire representative software companies.
10. Bank indebtedness and CNH facility
On February 25, 2016, Constellation completed an amendment and restatement of the revolving credit facility agreement (the “CSI Facility”), extending its maturity date to August 11, 2020. The facility limit was increased from $300,000 to $485,000 with a syndicate of new and existing Canadian chartered banks and U.S. banks. The CSI Facility bears a variable interest rate and is due in full on August 11, 2020 with no fixed repayments required over the term to maturity. Interest rates are calculated at standard U.S. and Canadian reference rates plus interest rate spreads based on a leverage table. The CSI Facility is currently collateralized by the majority of our assets including the assets of certain material subsidiaries. The CSI Facility contains standard events of default which if not remedied within a cure period would trigger the repayment of any outstanding balance. As at December 31, 2016, $nil (December 31, 2015 – $nil) had been drawn from this credit facility, and letters of credit totaling $15,377 (December 31, 2015 - $17,130) were issued, which limits the borrowing capacity on a dollar-for-dollar basis. Transaction costs associated with the CSI Facility in the amount of $1,212 have been capitalized and included in other non-current assets in the consolidated statement of financial position and are being amortized through profit or loss using the effective interest rate method. Amortized costs recognized in the year ended December 31, 2016 relating to this line-of-credit amounted to $225. As at December 31, 2016 the carrying amount of such costs is $987.
On June 24, 2014 Constellation Software Netherlands Holding Cooperatief U.A. (“CNH”), a subsidiary of Constellation and the indirect owner of 100% of TSS, entered into a €150,000 term and €10,000 multicurrency revolving credit facility (the “CNH Facility”) with a number of European and North American financial institutions. The CNH Facility bears interest at a rate calculated at EURIBOR plus interest rate spreads based on a leverage table. The CNH Facility is collateralized by substantially all of the assets owned by CNH and its subsidiaries which includes substantially all of the assets of TSS and its subsidiaries. The CNH Facility contains standard events of default which if not remedied within a cure period would trigger the repayment of any outstanding balance. As at December 31, 2016, €120,000 ($126,183) (December 31, 2015 - €128,000 ($139,600)) had been drawn from this credit facility. The terms of the CNH Facility require that €20,000 must be repaid in instalments between now and June 2020, and €100,000 is non-amortizing and due in June 2021. The remaining €20,000 term component of the CNH Facility is currently available and if drawn must be repaid in five equal instalments starting on June 24, 2018. As at December 31, 2016 no amounts had been drawn on the €10,000 multicurrency revolving component of the CNH Facility (December 31, 2015 - $nil). The revolving component of the CNH Facility is available for acquisitions, working capital needs, and other general corporate purposes until June 24, 2020. Transaction costs associated with the CNH Facility have been included as part of the carrying amount of the liability and are being amortized through profit or loss using the effective interest rate method. Amortized costs recognized in the year ended December 31, 2016 relating to this facility amounted to $865 (2015 - $866). As at December 31, 2016, the carrying amount of such costs relating to this facility totaling approximately $3,486 (€3,316) has been classified as part of the CNH Facility in the consolidated statement of financial position (December 31, 2015 - $4,468 (€4,097)).
The CNH Facility and CSI Facility are independent of each other. The CNH Facility is not guaranteed by Constellation or its subsidiaries nor is Constellation or its subsidiaries subject to the terms of the CNH Facility other than, in each case, CNH and its subsidiaries. Similarly, CNH and its subsidiaries did not guarantee Constellation’s other credit facilities and are not subject to the provisions thereof. Constellation’s credit facilities impose limitations on the aggregate amount of investment that Constellation may make in CNH and its subsidiaries and the financial results of CNH and its subsidiaries are not included for the purposes of determining compliance by Constellation with the financial covenants in Constellation’s other credit facilities. The CNH Facility imposes limitations on the amount of distributions that CNH and its subsidiaries may make to Constellation.

CONSTELLATION SOFTWARE INC. Notes to Consolidated Financial Statements (In thousands of U.S. dollars, except per share amounts and as otherwise indicated) Years ended December 31, 2016 and 2015
61
11. Debentures
On October 1, 2014 and November 19, 2014, the Company issued debentures with a total principal value of C$96,038 for total proceeds of C$91,236. On September 30, 2015, the Company issued another tranche of debentures (collectively with the 2014 issuances called the “Debentures”) with a total principal value of C$186,249 for total proceeds of C$214,186.
The Debentures have a maturity date of March 31, 2040 (the “Maturity Date”). From and including the date of issue to but excluding March 31, 2015, the Debentures bore interest at a rate of 7.4% per annum, paid quarterly in arrears. The rate from March 31, 2015 to March 30, 2016 was 8.5% per annum. The rate from March 31, 2016 to March 30, 2017 is 7.6%. From and including March 31, 2017 to but excluding the Maturity Date, the interest rate applicable to the Debentures will be reset on an annual basis on March 31 of each year, at a rate equal to the annual average percentage change in the All-items Consumer Price Index during the 12 month period ending on December 31 in the prior year (which amount may be positive or negative) plus 6.5%. Notwithstanding the foregoing, the interest rate applicable to the debentures will not be less than 0%. The Company may, subject to certain approvals, elect the Payment in Kind election (“PIK Election”), in lieu of paying interest in cash, to satisfy all or any portion of its interest obligation payable on an interest payment date by issuing to each Debenture holder PIK Debentures equal to the amount of the interest obligation to be satisfied. The PIK Debentures will have the same terms and conditions as the Debentures and will form part of the principal amount of the Debentures. If, on any interest payment date, the Company fails to pay the amount of interest owing on the Debentures in full in cash, the Company will not (A) declare or pay dividends of any kind on the Common Shares, nor (B) participate in any share buyback or redemption involving the Common Shares, until the date on which the Company pays such interest (or the unpaid portion thereof) in cash to holders of the Debentures; however, where the Company has issued PIK Debentures in respect of all or a portion of the amount of interest owing on the Debentures on an interest payment date, the Company may resume declaring or paying dividends of any kind on the Common Shares and participating in any share buyback or redemption involving the Common Shares beginning on the next earlier of (i) the interest payment date of which the Company pays the amount of interest owing on the Debentures in full in cash and (ii) the date on which the Company repays all amounts owing under the PIK Debenture. All payments in respect of the Debentures will be subordinated in right of payment to the prior payment in full of all senior indebtedness of the Company.
The Debentures will be redeemable in certain circumstances at the option of the Company or the holder. During the period beginning on March 16 and ending on March 31 of each year, the Company will have the right, at its option, to give notice to holders of Debentures of its intention to redeem the Debentures, in whole or in part, on March 31 in the year that is five years following the year in which notice is given, at a price equal to the principal amount thereof plus accrued and unpaid interest up to but excluding the date fixed for redemption. During the period beginning on March 1 and ending on March 15 of each year, holders of Debentures will also have the right, at their option, to give notice to the Company of their intention to require the Company to repurchase (or to “put”) the Debentures, in whole or in part, on March 31 in the year that is five years following the year in which notice is given, at a price equal to the principal amount thereof plus accrued and unpaid interest up to but excluding the date fixed for repurchase.
During the year ended December 31, 2016, no notices for redemption of the Debentures were received or given by the Company.
12. TSS Membership Liability
On December 23, 2014, in accordance with the terms of the purchase and sale agreement for the TSS acquisition, and on the basis of the term sheets attached thereto, Constellation and the sellers of TSS along with members of TSS’ executive management team (collectively, the “minority owners”) entered into a Members Agreement pursuant to which the minority owners acquired 33.29% of the voting interests in CNH. Total proceeds from this transaction was €39,375 ($48,503).
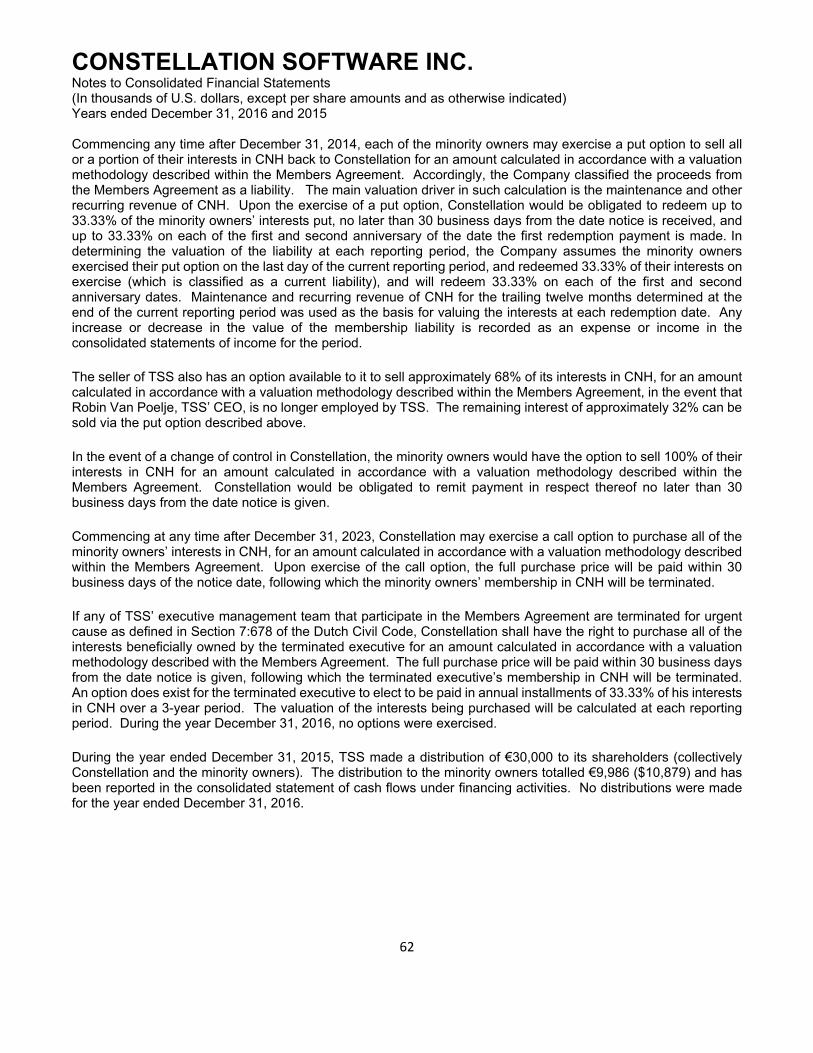
CONSTELLATION SOFTWARE INC. Notes to Consolidated Financial Statements (In thousands of U.S. dollars, except per share amounts and as otherwise indicated) Years ended December 31, 2016 and 2015
62
Commencing any time after December 31, 2014, each of the minority owners may exercise a put option to sell all or a portion of their interests in CNH back to Constellation for an amount calculated in accordance with a valuation methodology described within the Members Agreement. Accordingly, the Company classified the proceeds from the Members Agreement as a liability. The main valuation driver in such calculation is the maintenance and other recurring revenue of CNH. Upon the exercise of a put option, Constellation would be obligated to redeem up to 33.33% of the minority owners’ interests put, no later than 30 business days from the date notice is received, and up to 33.33% on each of the first and second anniversary of the date the first redemption payment is made. In determining the valuation of the liability at each reporting period, the Company assumes the minority owners exercised their put option on the last day of the current reporting period, and redeemed 33.33% of their interests on exercise (which is classified as a current liability), and will redeem 33.33% on each of the first and second anniversary dates. Maintenance and recurring revenue of CNH for the trailing twelve months determined at the end of the current reporting period was used as the basis for valuing the interests at each redemption date. Any increase or decrease in the value of the membership liability is recorded as an expense or income in the consolidated statements of income for the period.
The seller of TSS also has an option available to it to sell approximately 68% of its interests in CNH, for an amount calculated in accordance with a valuation methodology described within the Members Agreement, in the event that Robin Van Poelje, TSS’ CEO, is no longer employed by TSS. The remaining interest of approximately 32% can be sold via the put option described above.
In the event of a change of control in Constellation, the minority owners would have the option to sell 100% of their interests in CNH for an amount calculated in accordance with a valuation methodology described within the Members Agreement. Constellation would be obligated to remit payment in respect thereof no later than 30 business days from the date notice is given.
Commencing at any time after December 31, 2023, Constellation may exercise a call option to purchase all of the minority owners’ interests in CNH, for an amount calculated in accordance with a valuation methodology described within the Members Agreement. Upon exercise of the call option, the full purchase price will be paid within 30 business days of the notice date, following which the minority owners’ membership in CNH will be terminated.
If any of TSS’ executive management team that participate in the Members Agreement are terminated for urgent cause as defined in Section 7:678 of the Dutch Civil Code, Constellation shall have the right to purchase all of the interests beneficially owned by the terminated executive for an amount calculated in accordance with a valuation methodology described with the Members Agreement. The full purchase price will be paid within 30 business days from the date notice is given, following which the terminated executive’s membership in CNH will be terminated. An option does exist for the terminated executive to elect to be paid in annual installments of 33.33% of his interests in CNH over a 3-year period. The valuation of the interests being purchased will be calculated at each reporting period. During the year December 31, 2016, no options were exercised.
During the year ended December 31, 2015, TSS made a distribution of €30,000 to its shareholders (collectively Constellation and the minority owners). The distribution to the minority owners totalled €9,986 ($10,879) and has been reported in the consolidated statement of cash flows under financing activities. No distributions were made for the year ended December 31, 2016.
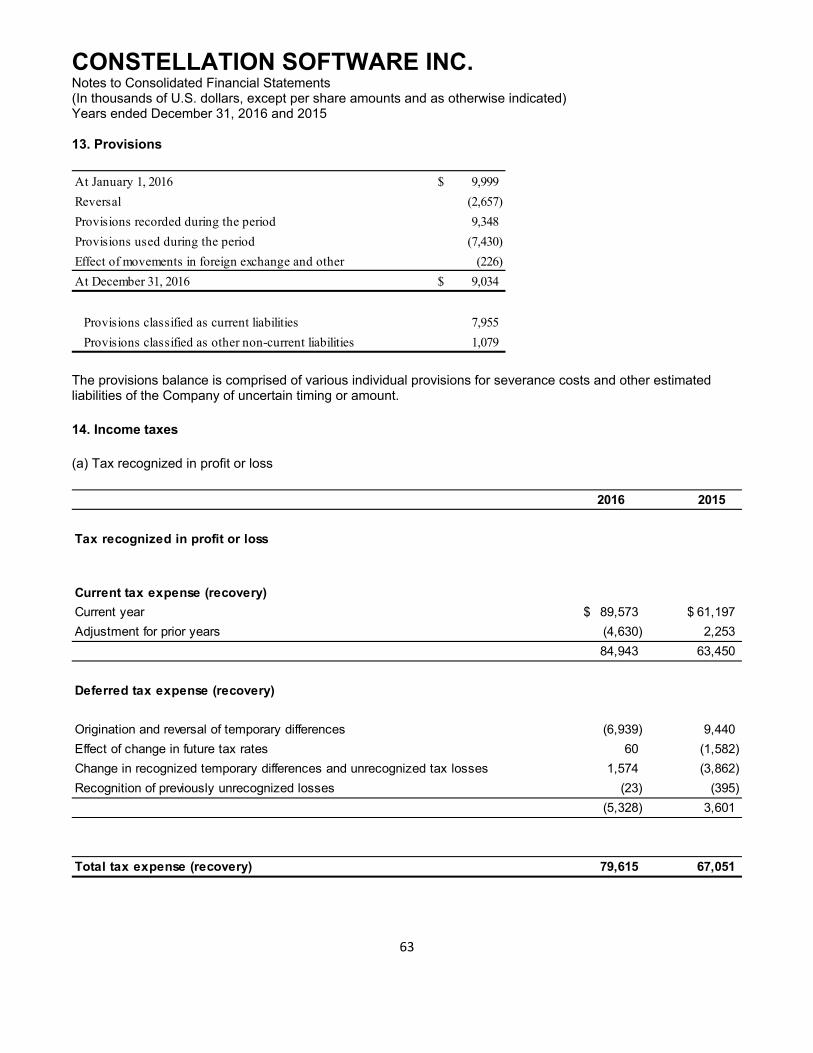
CONSTELLATION SOFTWARE INC. Notes to Consolidated Financial Statements (In thousands of U.S. dollars, except per share amounts and as otherwise indicated) Years ended December 31, 2016 and 2015
63
13. Provisions
The provisions balance is comprised of various individual provisions for severance costs and other estimated liabilities of the Company of uncertain timing or amount.
14. Income taxes
(a) Tax recognized in profit or loss
At January 1, 2016 9,999$
Reversal (2,657)
Provisions recorded during the period 9,348
Provisions used during the period (7,430)
Effect of movements in foreign exchange and other (226)
At December 31, 2016 9,034$
Provisions classified as current liabilities 7,955
Provisions classified as other non-current liabilities 1,079
2016 2015
Tax recognized in profit or loss
Current tax expense (recovery)
Current year 89,573$ 61,197$
Adjustment for prior years (4,630) 2,253
84,943 63,450
Deferred tax expense (recovery)
Origination and reversal of temporary differences (6,939) 9,440
Effect of change in future tax rates 60 (1,582)
Change in recognized temporary differences and unrecognized tax losses 1,574 (3,862)
Recognition of previously unrecognized losses (23) (395)
(5,328) 3,601
Total tax expense (recovery) 79,615 67,051
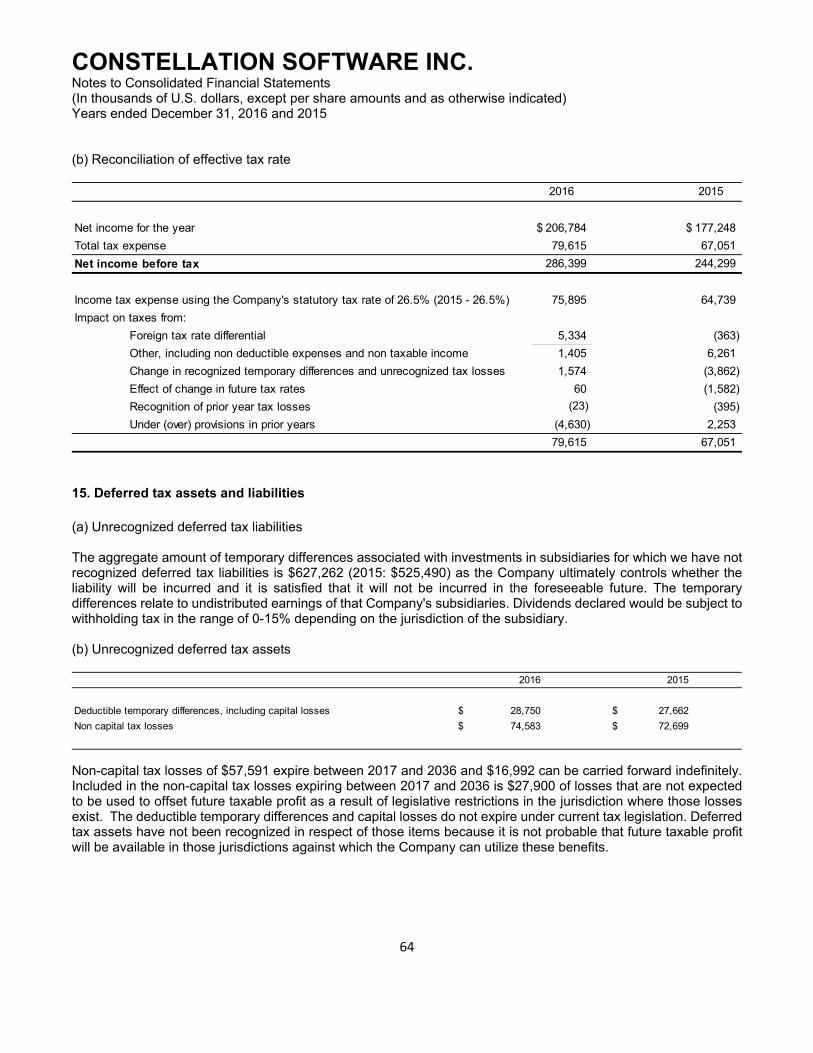
CONSTELLATION SOFTWARE INC. Notes to Consolidated Financial Statements (In thousands of U.S. dollars, except per share amounts and as otherwise indicated) Years ended December 31, 2016 and 2015
64
(b) Reconciliation of effective tax rate
15. Deferred tax assets and liabilities
(a) Unrecognized deferred tax liabilities The aggregate amount of temporary differences associated with investments in subsidiaries for which we have not recognized deferred tax liabilities is $627,262 (2015: $525,490) as the Company ultimately controls whether the liability will be incurred and it is satisfied that it will not be incurred in the foreseeable future. The temporary differences relate to undistributed earnings of that Company's subsidiaries. Dividends declared would be subject to withholding tax in the range of 0-15% depending on the jurisdiction of the subsidiary. (b) Unrecognized deferred tax assets
Non-capital tax losses of $57,591 expire between 2017 and 2036 and $16,992 can be carried forward indefinitely. Included in the non-capital tax losses expiring between 2017 and 2036 is $27,900 of losses that are not expected to be used to offset future taxable profit as a result of legislative restrictions in the jurisdiction where those losses exist. The deductible temporary differences and capital losses do not expire under current tax legislation. Deferred tax assets have not been recognized in respect of those items because it is not probable that future taxable profit will be available in those jurisdictions against which the Company can utilize these benefits.
2016 2015
Net income for the year 206,784$ 177,248$
Total tax expense 79,615 67,051
Net income before tax 286,399 244,299
Income tax expense using the Company's statutory tax rate of 26.5% (2015 - 26.5%) 75,895 64,739
Impact on taxes from:
Foreign tax rate differential 5,334 (363)
Other, including non deductible expenses and non taxable income 1,405 6,261
Change in recognized temporary differences and unrecognized tax losses 1,574 (3,862)
Effect of change in future tax rates 60 (1,582)
Recognition of prior year tax losses (23) (395)
Under (over) provisions in prior years (4,630) 2,253
79,615 67,051
2016 2015
Deductible temporary differences, including capital losses $ 28,750 $ 27,662
Non capital tax losses $ 74,583 $ 72,699

CONSTELLATION SOFTWARE INC. Notes to Consolidated Financial Statements (In thousands of U.S. dollars, except per share amounts and as otherwise indicated) Years ended December 31, 2016 and 2015
65
(c) Recognized deferred tax assets and liabilities
This reclassification relates to the offsetting of deferred tax assets and deferred tax liabilities to the extent that they relate to the same taxing authorities and there is a legally enforceable right to do so. (d) Movement in deferred tax balances during the year
2016 2015 2016 2015 2016 2015
Property, plant and equipment 2,831 2,218 (1,632) (1,140) 1,199 1,078
Intangible assets 117,317 120,586 (222,714) (191,225) (105,397) (70,639)
Reserves 16,188 16,792 (122) (77) 16,066 16,715
Non capital loss carryforwards 6,398 7,471 - - 6,398 7,471
SR&ED expenditure pool 755 1,100 (84) (6) 671 1,094
Deferred revenue 12,924 4,568 (950) (781) 11,974 3,787
Foreign and other tax credits 238 248 (3,168) (3,388) (2,930) (3,140)
Other, including capital losses, withholding tax and foreign exchange 5,374 6,486 (13,077) (15,997) (7,703) (9,511)
Tax assets (liabilities) 162,025 159,469 (241,747) (212,614) (79,722) (53,145)
Reclassification (112,162) (102,819) 112,162 102,819
Net tax assets (liabilities) 49,863 56,650 (129,585) (109,795) (79,722) (53,145)
Assets Liabilities Net
Balance January 1, 2016
Recognized in profit or loss
Recognized in other
comprehensive income
Acquired in business
combinations Other
Balance December 31, 2016
Property, plant and equipment 1,078 146 - (25) - 1,199
Intangible assets (70,639) 8,418 - (43,176) - (105,397)
Reserves 16,715 (945) - 296 - 16,066
Non-capital loss carryforwards 7,471 (7,473) - 6,400 - 6,398
SR&ED expenditure pool 1,094 (423) - - - 671
Deferred revenue 3,787 7,697 - 490 - 11,974
Tax credits (3,140) 210 - - - (2,930)
Other, including capital losses, withholding tax and foreign exchange (9,511) (2,302) (143) (105) 4,358 (7,703)
(53,145) 5,328 (143) (36,120) 4,358 (79,722)
Balance January 1, 2015
Recognized in profit or loss
Recognized in other
comprehensive income
Acquired in business
combinations Other
Balance December 31, 2015
Property, plant and equipment 898 253 - (73) - 1,078
Intangible assets (56,684) 7,602 - (21,557) - (70,639)
Reserves 9,785 6,481 - 449 - 16,715
Non-capital loss carryforwards 6,298 (424) - 1,597 - 7,471
SR&ED expenditure pool 1,044 (944) - 994 - 1,094
Deferred revenue 3,325 (6,757) - 7,219 - 3,787
Tax credits (4,044) 904 - - - (3,140)
Other, including capital losses, withholding tax and foreign exchange (7,134) (10,716) 128 (592) 8,803 (9,511)
(46,512) (3,601) 128 (11,963) 8,803 (53,145)

CONSTELLATION SOFTWARE INC. Notes to Consolidated Financial Statements (In thousands of U.S. dollars, except per share amounts and as otherwise indicated) Years ended December 31, 2016 and 2015
66
16. Capital and other components of equity
Capital Stock
At December 31, 2016 and December 31, 2015, the authorized share capital of Constellation consisted of an unlimited number of voting common shares and a limited number of non-voting preferred shares (there are no preferred shares outstanding).
Accumulated other comprehensive income (loss)
Accumulated other comprehensive income (loss) is comprised of the following separate components of equity: Cumulative translation account The cumulative translation account comprises all foreign currency differences arising from the translation of the financial statements of foreign operations, as well as foreign exchange gains and losses arising from monetary items that form part of the net investment in the foreign operation. Amounts related to derivatives designated as hedges The portion of the gain or loss on derivatives designated as hedges that are determined to be an effective hedge are recognized directly in other comprehensive income, and the ineffective portion in the statement of income. The gains or losses deferred in other comprehensive income in this way are subsequently recognized in the statement of income in the same period in which the hedged underlying transaction or firm commitment is recognized in the statement of income. Amounts related to available-for-sale financial assets Available-for-sale differences comprise the cumulative net change in the fair value of available-for-sale financial assets until the investments are sold/derecognized or impaired. Dividends During the year ended December 31, 2016 the Board of Directors approved and the Company declared dividends of $4.00 per common share. The dividend declared in the quarter ended March 31, 2016 representing $21,192 was paid and settled on April 5, 2016. The dividend declared in the quarter ended June 30, 2016 representing $21,192 was paid and settled on July 6, 2016. The dividend declared in the quarter ended September 30, 2016 representing $21,192 was paid and settled on October 5, 2016. The fourth dividend declared in the quarter ended December 31, 2016 representing $21,192 was paid and settled on January 5, 2017.
Number Amount
December 31, 2016 21,191,530 99,283$
December 31, 2015 21,191,530 99,283$
Common Shares

CONSTELLATION SOFTWARE INC. Notes to Consolidated Financial Statements (In thousands of U.S. dollars, except per share amounts and as otherwise indicated) Years ended December 31, 2016 and 2015
67
17. Revenue
The Company sub-classifies revenue within the following components: license revenue, professional services revenue, hardware and other revenue, and maintenance and other recurring revenue. Software license revenue is comprised of license fees charged for the use of software products licensed under multiple-year or perpetual arrangements in which the fair value of maintenance and/or professional service fees are determinable. Professional service revenue consists of fees charged for implementation services, custom programming, product training and consulting. Hardware and other revenue includes the resale of third party hardware as part of customized solutions, as well as sales of hardware assembled internally and the reimbursement of travel costs. Maintenance and other recurring revenue primarily consists of fees charged for customer support on software products post-delivery and also includes recurring fees derived from combined software/support contracts, transaction revenues, managed services, and hosted products.
Revenues from the application of contract accounting are typically allocated to license revenue, professional service revenue and hardware and other revenue based on their relative fair values when the amount recognized in the period is determined using the percentage of completion method under contract accounting. During the year ended December 31, 2016 $315,143 (December 31, 2015 - $283,180) of contract revenue was recognized.
18. Finance and other income and finance costs
Included in finance and other income is a $4,210 adjustment which was made during 2016 relating to the acquired net tangible assets of an acquisition which closed in March 2015 (December 31, 2015 - $3,000 adjustment relating to the acquired net tangible assets of an acquisition which closed in May 2013).
During 2014, the Company entered into a three year floating-to-fixed interest rate swap to manage its cash-flow interest rate risk associated with the CNH Facility. The Company applied hedge accounting and determined that this is an effective hedge. Payments under the interest rate swap are made quarterly. The notional principal amount of the outstanding floating to fixed interest rate swap contract at December 31, 2016 was €120,000 (December 31,
2016 2015
Gains on sale of available-for-sale financial
assets transferred from other comprehensive income (5,204)$ -$
Interest income on cash (824) (15)
Finance and other income (4,806) (4,757)
Finance and other income (10,834)$ (4,772)$
Interest expense on bank indebtedness and debentures 22,861$ 17,434$
Amortization of debt related transaction costs 1,089 1,475
Amortization of debenture discount (premium) and associated rights offering, net (4,059) (1,050)
Other finance costs 1,682 2,251
Finance costs 21,573$ 20,110$
Year ended December 31,

CONSTELLATION SOFTWARE INC. Notes to Consolidated Financial Statements (In thousands of U.S. dollars, except per share amounts and as otherwise indicated) Years ended December 31, 2016 and 2015
68
2015 - €130,000). The fair value of the interest rate swap contract at December 31, 2016 was $503 (December 31, 2015 - $907).
19. Earnings per share
Basic and diluted earnings per share
20. Capital risk management
The Company's objectives in managing capital are to ensure sufficient liquidity to pursue its strategy of organic growth combined with strategic acquisitions and to provide returns to its shareholders. The Company manages its capital with the objective of ensuring that there are adequate capital resources while maximizing the return to shareholders through the optimization of the debt and equity balance. The capital structure of the Company consists of cash, revolving credit facility, CNH facility, Debentures, TSS membership liability and components of shareholders' equity including retained earnings and capital stock.
The Company is subject to certain covenants on its revolving credit facility. The covenants include a leverage ratio and an interest coverage ratio. The CNH facility is also subject to certain covenants. The covenants include a leverage ratio, debt service coverage ratio and an interest coverage ratio. The Company monitors the ratios on a quarterly basis. As at December 31, 2016, the Company is in compliance with its debt covenants. Other than the covenants required for the revolving credit facility and the CNH facility, the Company is not subject to any externally imposed capital requirements.
The Board of Directors determine if and when dividends should be declared and paid based on all relevant circumstances, including the desirability of financing further growth of the Company and its financial position at the relevant time. The Board of Directors has adopted a policy to pay quarterly dividends, which commenced in 2012. Constellation intends to declare a regular quarterly dividend to allow shareholders to participate in its free cash flow, while retaining sufficient capital to invest in acquisitions and organic growth. There is no guarantee that dividends will continue to be declared and paid in the future.
The Company makes adjustments to its capital structure in light of general economic conditions, the risk characteristics of the underlying assets and the Company's working capital requirements. In order to maintain or adjust its capital structure, the Company, upon approval from its Board of Directors, may increase or decrease dividends, increase or decrease the line of credit or undertake other activities as deemed appropriate under the specific circumstances. The Board of Directors reviews and approves any material transactions not in the ordinary course of business, as well as significant acquisitions and other major investments above pre-determined quantitative thresholds.
2016 2015
Numerator:
Net income 206,784$ 177,248$
Denominator:
Basic and diluted shares outstanding 21,192 21,192
Earnings per share
Basic and diluted 9.76$ 8.36$
Year ended December 31,

CONSTELLATION SOFTWARE INC. Notes to Consolidated Financial Statements (In thousands of U.S. dollars, except per share amounts and as otherwise indicated) Years ended December 31, 2016 and 2015
69
21. Financial risk management and financial instruments
Overview
The Company is exposed to risks of varying degrees of significance which could affect its ability to achieve its strategic objectives for growth. The main objectives of the Company's risk management process are to ensure that risks are properly identified and that the capital base is adequate in relation to those risks. The principal financial risks to which the Company is exposed are described below.
Market risk
Market risk is the risk that changes in market prices, such as fluctuations in foreign exchange rates and interest rates, will affect the Company's income or the value of its financial instruments.
The Company is exposed to interest rate risk on the utilized portion of its revolving credit facility and its Debentures and does not currently hold any financial instruments that mitigate this risk. If there was a 1% increase in the interest rate on the Debentures, there would be a corresponding decrease in income before tax of $2,099. There would be an equal and opposite impact if there was a 1% decrease in the interest rate.
The Company is also exposed to interest rate risk on the utilized portion of its CNH Facility. As required by our lenders, the Company entered into a floating-to-fixed interest rate swap to manage its cash-flow interest rate risk associated with the CNH Facility. The notional principal amount of the outstanding floating to fixed interest rate swap contract at December 31, 2016 was €120,000.
The Company operates internationally, giving rise to exposure to market risks from changes in foreign exchange rates which impact sales and purchases that are denominated in a currency other than the respective functional currencies of certain of its subsidiaries. The Company currently does not typically use derivative instruments to hedge its exposure to those risks. Most of the Company's businesses are organized geographically so that many of its expenses are incurred in the same currency as its revenues thus mitigating some of its exposure to currency fluctuations.
Foreign currency sensitivity analysis:
Foreign currency risk arises on financial instruments that are denominated in a currency other than the functional currency in which they are measured. The Company’s primary exposure with respect to foreign currencies is through the Canadian dollar denominated Debentures (note 11). The carrying value of the Debentures at December 31, 2016 is $223,870 (C$301,037) (December 31, 2015 - $220,043 (C$305,244)). If there was a 1% strengthening of the Canadian dollar against the U.S. dollar, there would be a corresponding decrease in income before tax of $2,239. There would be an equal and opposite impact if there was a 1% weakening of the Canadian dollar against the U.S. dollar.
Liquidity risk
Liquidity risk is the risk that the Company is not able to meet its financial obligations as they fall due or can do so only at excessive cost. The Company manages liquidity risk through the management of its capital structure and financial leverage, as outlined in note 20 to the consolidated financial statements. The Company's growth is financed through a combination of cash flows from operations and borrowing under the existing credit facilities, TSS Membership Liability and Debentures. One of management's primary goals is to maintain an optimal level of liquidity through the active management of the assets and liabilities as well as the cash flows from operations. The details

CONSTELLATION SOFTWARE INC. Notes to Consolidated Financial Statements (In thousands of U.S. dollars, except per share amounts and as otherwise indicated) Years ended December 31, 2016 and 2015
70
of the Company's revolving credit facility, CNH facility, Debentures, and TSS membership liability are disclosed in note 10, note 11 and note 12 to the consolidated financial statements. As at December 31, 2016, available credit in respect of the Company's revolving credit facility was $469,622.
The majority of the Company's financial liabilities recorded in accounts payable and accrued liabilities are due within 60 days. The Company also has payment processing liabilities which are settled within a few days of year-end. Included in cash is an equivalent cash balance of $8,441 (December 31, 2015 - $9,995) that is held to settle these payment processing liabilities as they become due. Holdbacks payable related to business acquisitions are generally due within six months to two years.
Given the Company's available liquid resources and credit capacity as compared to the timing of the payments of liabilities, management assesses the Company's liquidity risk to be low.
Credit risk
Credit risk represents the financial loss that the Company would experience if a counterparty to a financial instrument, in which the Company has an amount owing from the counterparty failed to meet its obligations in accordance with the terms and conditions of its contracts with the Company. The carrying amount of the Company's financial assets, including receivables from customers, represents the Company's maximum credit exposure.
The majority of the accounts receivable balance relates to maintenance invoices to customers that have a history of payment. In addition, a large proportion of the Company's accounts receivable are with public sector government agencies where the credit risk has historically been assessed to be low.
The maximum exposure to credit risk for accounts receivable at the reporting date by geographic region was:
December 31, 2016
December 31, 2015
United States 136,229$ 120,183$
Canada 21,910 17,989
United Kingdom 16,786 20,605
Europe 54,783 52,180
Other 13,846 15,814
243,554$ 226,771$

CONSTELLATION SOFTWARE INC. Notes to Consolidated Financial Statements (In thousands of U.S. dollars, except per share amounts and as otherwise indicated) Years ended December 31, 2016 and 2015
71
The maximum exposure to credit risk for accounts receivable at the reporting date by reportable segment was:
The aging of accounts receivables at the reporting date was:
An allowance account for accounts receivable is used to record impairment losses unless the Company is satisfied that no recovery of the amount owing is possible; at which point the amounts are considered to be uncollectible and are written off against the specific accounts receivable amount attributable to a customer. The number of days outstanding of an individual receivable balance is the key indicator for determining whether an account is at risk of being impaired.
December 31, 2016
December 31, 2015
Public 164,765 160,951
Private 78,789 65,820
243,554$ 226,771$
December 31, 2016
December 31, 2015
Current
Gross 189,402 184,929
Impairment (618) (1,779)
Net 188,784 183,150
90-180 days
Gross 40,453 26,707
Impairment (786) (1,547)
Net 39,667 25,160
More than 180 days
Gross 35,587 37,603
Impairment (20,484) (19,142)
Net 15,103 18,461
Total accounts receivable
Gross 265,442 249,239
Impairment (21,888) (22,468)
Net 243,554 226,771

CONSTELLATION SOFTWARE INC. Notes to Consolidated Financial Statements (In thousands of U.S. dollars, except per share amounts and as otherwise indicated) Years ended December 31, 2016 and 2015
72
The movement in the allowance for impairment in respect of accounts receivable during the year ended:
There is no concentration of credit risk because of the Company's diverse and disparate number of customers with individual receivables that are not significant to the Company on a consolidated basis. In addition, the Company typically requires up front deposits from customers to protect against credit risk.
The Company manages credit risk related to cash by maintaining the majority of the Company’s bank accounts with Schedule 1 banks.
In the ordinary course of business, the Company and its subsidiaries have provided performance bonds and other guarantees for the completion of certain customer contracts. The Company has not experienced a loss to date and future losses are not anticipated; therefore, no liability has been recorded in the consolidated statements of financial position related to these types of indemnifications or guarantees at December 31, 2016.
Fair values versus carrying amounts
The carrying values of cash, accounts receivable, accounts payable, accrued liabilities, the majority of acquisition holdbacks and revolving line of credit, approximate their fair values due to the short-term nature of these instruments. Bank debt is subject to market interest rates.
The Company has capitalized transaction costs associated with its current revolving credit facility and CNH Facility. At December 31, 2016, the fair value and carrying value of the line of credit is $nil (December 31, 2015: $nil). As at December 31, 2016, the fair value of the CNH Facility is $126,183 and the carrying value is $122,697 (December 31, 2015 - $139,600 and the carrying value is $135,132). As at December 31, 2016, the fair value of the Debentures is $243,514 and the carrying value is $223,870. (December 31, 2015 – the fair value is $220,791 and the carrying value is $220,043).
Fair value hierarchy
The table below analyzes financial instruments carried at fair value, by valuation method.
level 1 inputs are quoted prices (unadjusted) in active markets for identical assets or liabilities;
2016 2015
Aggregate balance at January 1 22,468$ 13,981$
Increase from business acquistions 879 7,029
Impairment loss recognized 12,444 12,911
Impairment loss reversed (6,494) (6,273)
Amounts written off (7,033) (3,297)
Other movements (376) (1,883)
Aggregate balance at December 31 21,888$ 22,468$
Allowance for doubtful accounts arising from businss combinations 6,841$ 9,955$

CONSTELLATION SOFTWARE INC. Notes to Consolidated Financial Statements (In thousands of U.S. dollars, except per share amounts and as otherwise indicated) Years ended December 31, 2016 and 2015
73
level 2 inputs are inputs other than quoted prices included in level 1 that are observable for the asset or liability either directly (i.e. prices) or indirectly (i.e. derived from prices); and
level 3 inputs are inputs for the asset or liability that are not based on observable market data (i.e. unobservable inputs).
In the table below, the Company has segregated all financial assets and liabilities that are measured at fair value into the most appropriate level within the fair value hierarchy based on the inputs used to determine the fair value at the measurement date.
Financial assets and financial liabilities measured at fair value as at December 31, 2016 and December 31, 2015 in the financial statements are summarized below. The Company has no additional financial liabilities measured at fair value initially other than those recognized in connection with business combinations.
There were no transfers of fair value measurements between level 1, 2 and level 3 of the fair value hierarchy in the years ended December 31, 2016 and 2015.
The following table shows a reconciliation from the beginning balances to the ending balances for fair value measurements in Level 3 of the fair value hierarchy.
Estimates of the fair value of contingent consideration is performed by the Company on a quarterly basis. Key unobservable inputs include revenue growth rates and the discount rates applied (8% to 11%). The estimated fair value increases as the annual growth rate increases and as the discount rate decreases and vice versa.
Level 1 Level 2 Level 3 Total Level 1 Level 2 Level 3 Total
Assets:Available-for-sale equity securities 4,236$ -$ -$ 4,236$ -$ -$ -$ -$
4,236 - - 4,236 - - - -
Liabilities:Contingent consideration -$ -$ 15,538$ 15,538$ -$ -$ 21,494$ 21,494$ Interest rate swap contract - 503 - 503 - 907 - 907
- 503 15,538 16,041 - 907 21,494 22,401
December 31, 2016 December 31, 2015
Balance at January 1, 2016 21,494
Increase from business acquisitions 4,551 Cash payments (11,204) Charges through profit or loss 658 Foreign exchange and other movements 39
Balance at December 31, 2016 15,538
Contingent consideration classified as current liabilities 6,745 Contingent consideration classified as other non-current liabilities 8,793

CONSTELLATION SOFTWARE INC. Notes to Consolidated Financial Statements (In thousands of U.S. dollars, except per share amounts and as otherwise indicated) Years ended December 31, 2016 and 2015
74
22. Operating leases
The Company leases premises and certain equipment and automobiles under operating leases. The operating rental expense for the year ended December 31, 2016 was $42,255 (2015 - $34,670). The annual minimum lease commitments are as follows:
December 31, 2016
December 31, 2015
Less than 1 year $ 59,541 $ 43,230Between 1 and 5 years 113,500 96,593More than 5 years 30,333 31,331 Total $ 203,374 $ 171,154
23. Operating segments
Segment information is presented in respect of the Company's business and geographical segments. The accounting policies of the segments are the same as those described in the significant accounting policies section of these consolidated financial statements.
Reportable segments
The Company has six operating segments, referred to as Operating Groups by the Company, being Volaris, Harris, TSS, Jonas, Perseus, and Vela. The operating segments are aggregated into two reportable segments in accordance with IFRS 8 Operating Segments. The Company‘s Public Sector segment develops and distributes software solutions primarily to government and government-related customers. The Company‘s Private Sector segment develops and distributes software solutions primarily to commercial customers.
The operating groups exhibit similar economic characteristics (such as gross and earnings before income tax and amortization (“EBITA”) margins) and are substantially similar in relation to the nature of products and services, the nature of production processes, and the methods used to distribute product; however, the determination that the Company has two reportable segments is based primarily on the assessment that differences in economic cycles and procedures for securing contracts between our governmental clients and commercial, or private sector clients, are significant, thus warranting distinct segmented disclosures. Volaris, Harris and TSS have been aggregated into the Public Sector segment. Jonas, Perseus and Vela have been aggregated into the Private Sector segment.
Intercompany expenses (income) primarily represent Constellation head office management fees and intercompany interest charged on related borrowings to the reportable segments.

CONSTELLATION SOFTWARE INC. Notes to Consolidated Financial Statements (In thousands of U.S. dollars, except per share amounts and as otherwise indicated) Years ended December 31, 2016 and 2015
75
Year ended December 31, 2016 Public Sector Private Sector OtherConsolidated
Total
Revenue 1,428,284$ 696,802$ -$ 2,125,086$
Expenses
Staff 708,426 346,545 4,018 1,058,989
Hardware 65,630 16,674 - 82,304
Third party licenses, maintenance and professional services 112,049 80,654 - 192,703
Occupancy 31,445 19,956 295 51,696
Travel 44,649 16,841 255 61,745
Telecommunications 13,232 8,381 61 21,674
Supplies 6,788 2,963 69 9,820
Software and equipment 29,259 7,098 190 36,547
Professional fees 19,559 5,749 2,941 28,249
Other, net 10,423 17,054 1,486 28,963
Depreciation 15,172 7,193 11 22,376
Amortization of intangible assets 124,877 65,697 - 190,574
1,181,509 594,805 9,326 1,785,640
Foreign exchange (gain) loss 2,454 3 23,533 25,990
TSS membership liability revaluation charge 21,635 - - 21,635
Equity in net (income) loss of equity investees (304) - (5,013) (5,317)
Finance income (4,613) (186) (6,035) (10,834)
Finance costs 6,447 892 14,234 21,573
Intercompany expenses (income) 35,401 15,422 (50,823) -
61,020 16,131 (24,104) 53,047
Profit before income tax 185,755 85,866 14,778 286,399
Current income tax expense (recovery) 53,622 29,639 1,682 84,943
Deferred income tax expense (recovery) (41) (2,986) (2,301) (5,328)
Income tax expense (recovery) 53,581 26,653 (619) 79,615
Net income 132,174 59,213 15,397 206,784
December 31, 2016 Public Sector Private Sector OtherConsolidated
Total
Current assets 314,448 130,480 328,750 773,678
Current liabilities 586,712 264,327 22,125 873,164

CONSTELLATION SOFTWARE INC. Notes to Consolidated Financial Statements (In thousands of U.S. dollars, except per share amounts and as otherwise indicated) Years ended December 31, 2016 and 2015
76
Year ended December 31, 2015Public Sector
Private Sector Other
Consolidated Total
Revenue 1,268,495 569,814 - 1,838,309$
Expenses
Staff 625,452 282,847 4,117 912,416
Hardware 74,321 15,987 - 90,308
Third party licenses, maintenance and professional services 96,273 67,411 - 163,684
Occupancy 27,910 15,060 248 43,218
Travel 39,382 15,082 179 54,643
Telecommunications 10,958 6,896 55 17,909
Supplies 7,708 3,191 52 10,951
Software and equipment 24,650 5,877 427 30,954
Professional fees 14,438 5,500 2,681 22,619
Other, net 15,586 12,273 1,183 29,042
Depreciation 11,862 5,148 18 17,028
Amortization of intangible assets 127,425 53,044 - 180,469
1,075,965 488,316 8,960 1,573,241
Foreign exchange (gain) loss 1,671 (6,053) (11,361) (15,743)
TSS membership liability revaluation charge 22,244 - - 22,244
Equity in net (income) loss of equity investees - - (1,070) (1,070)
Finance income (4,823) 51 - (4,772)
Finance costs 7,995 1,715 10,400 20,110
Intercompany expenses (income) 40,402 16,235 (56,637) -
67,489 11,948 (58,668) 20,769
Profit before income tax 125,041 69,550 49,708 244,299
Current income tax expense (recovery) 42,591 22,236 (1,377) 63,450
Deferred income tax expense (recovery) 1,878 2,574 (851) 3,601
Income tax expense (recovery) 44,469 24,810 (2,228) 67,051
Net income 80,572 44,740 51,936 177,248
December 31, 2015Public Sector
Private Sector Other
Consolidated Total
Current assets 309,395 119,784 127,124 556,303
Current liabilities 517,629 234,039 18,090 769,758

CONSTELLATION SOFTWARE INC. Notes to Consolidated Financial Statements (In thousands of U.S. dollars, except per share amounts and as otherwise indicated) Years ended December 31, 2016 and 2015
77
Geographical segments
The public and private sector segments are managed on a worldwide basis, but operate in three principal geographical areas, Canada, USA, and UK/Europe.
In presenting information on the basis of geographical segments, segment revenue is based on the region in which the revenue is transacted and intellectual property is located. Segment assets are based on the geographic locations of the assets.
Major customers
No customer represents revenue in excess of 5% of total revenue in both years ended December 31, 2016 and 2015.
24. Contingencies
In the normal course of operations, the Company is subject to litigation and claims from time to time. The Company may also be subject to lawsuits, investigations and other claims, including environmental, labour, product, customer disputes and other matters. Management believes that adequate provisions have been recorded in the accounts where required. Although it is not always possible to estimate the extent of potential costs, if any, management believes that the ultimate resolution of such contingencies will not have a material adverse impact on the results of operations, financial position or liquidity of the Company.
25. Guarantees
(a) In the ordinary course of business the Company and its subsidiaries have provided performance bonds and other guarantees for the completion of certain customer contracts. The total obligations of the Company pursuant to such bonds and related contingencies total $46,932 (2015 - $56,049). No liability has been recorded in the consolidated financial statements.
(b) As at December 31, 2016, in the normal course of business, the Company and its subsidiaries have
outstanding letters of credit totalling $18,263 (2015 - $17,130).
Year ended December 31, 2016 Canada USA UK/Europe Other Total
Revenue 252,508$ 1,114,821$ 643,147$ 114,610$ 2,125,086$
Non-current assets 205,666 349,751 475,503 78,863 1,109,783
Year ended December 31, 2015 Canada USA UK/Europe Other Total
Revenue 224,223$ 990,241$ 530,608$ 93,237$ 1,838,309$
Non-current assets 232,732 359,784 449,573 40,928 1,083,017

CONSTELLATION SOFTWARE INC. Notes to Consolidated Financial Statements (In thousands of U.S. dollars, except per share amounts and as otherwise indicated) Years ended December 31, 2016 and 2015
78
(c) In the normal course of business, some of the Company's subsidiaries entered into lease agreements for facilities. As the joint lessees, the subsidiaries agree to indemnify the lessor for liabilities that may arise from the use of the leased facility. The maximum amount potentially payable under the foregoing indemnity cannot be reasonably estimated. The subsidiaries have liability insurance that relates to the indemnifications.
(d) The Company and its subsidiaries have provided routine indemnifications to some of its customers against
liability if the Company's product infringes on a third party's intellectual property rights. The maximum exposure from the indemnifications cannot be reasonably estimated.
26. Changes in non-cash operating working capital
2016 2015
Decrease (increase) in accounts receivable 2,605$ (5,663)$
Decrease (increase) in work in progress 3,874 (2,280)
Decrease (increase) in other current assets (3,132) (9,977)
Decrease (increase) in inventory 4,843 666
Decrease (increase) in non-current assets 583 4,706
Increase (decrease) in other non-current liabilities (2,986) (11,990)
Increase (decrease) in accounts payable and accrued liabilities,
excluding holdbacks from acquisitions (4,068) 23,408
Increase (decrease) in deferred revenue (17,766) 8,345
Increase (decrease) in provisions (449) (4,135)
Change in non-cash operating working capital (16,496)$ 3,080$
Year ended
December 31,

CONSTELLATION SOFTWARE INC. Notes to Consolidated Financial Statements (In thousands of U.S. dollars, except per share amounts and as otherwise indicated) Years ended December 31, 2016 and 2015
79
27. Related parties
Key management personnel compensation
The key management personnel of the Company, inclusive of the operating segments, are the members of the Company’s executive management team at the Company operating segments and head office and Board of Directors.
Years ended December 31, 2016 2015 Salaries, bonus and employee benefits $ 10,746 $ 8,740 Total $ 10,746 $ 8,740
There were no significant post-employment benefits, other long-term benefits, or share-based payments attributed to the key management personnel in 2016 and 2015.
28. Subsequent events
On February 15, 2017, the Company declared a $1.00 per share dividend that is payable on April 5, 2017 to all common shareholders of record at close of business on March 17, 2017.