Embed Size (px)
Citation preview

Considering the DAPM: Low-beta and High-beta Industries
Are low- and high-risk industries empirically consistent with the DAPM?
Abstract
This thesis researches if the Dichotomous Asset Pricing Model (DAPM) is consistent with industry portfolio’s. A distinction between low-risk and high-risk industries is made and the beta will be used to measure this riskiness. Low-risk industries are defined as industries having a beta below 0.8 and are labelled as industries where demand will by stable overtime (e.g. healthcare). High-risk industries are defined as industries having a beta above 1.2 and are labelled as pro-cyclical and sensitive to the conditions of the market (e.g. luxurious companies). Neutral industries (beta between 0.8 and 1.2) are not the subject of this thesis. Results show that low-risk industries are more or less consistent with the DAPM whereas high-risk industries show some deviations. These deviations from the DAPM can be explained by using concepts from behavioral finance and transaction cost theory.

Table of Content
1. Introduction ......................................................................................................................... 3
2. Literature Review ................................................................................................................ 6
2.1. Low-beta and high-beta industries .............................................................................. 6
2.2. Dichotomous Asset Pricing Model (DAPM) ............................................................. 10
3. Methodology ..................................................................................................................... 14
3.1. Data ............................................................................................................................ 14
3.2. Two-pass regression model ....................................................................................... 15
3.3. Ratio’s ........................................................................................................................ 16
4. Results ............................................................................................................................... 17
4.1. Low- and High-beta industry analysis ....................................................................... 17
4.2. Lower- and upper economic environment ................................................................. 18
4.3. High-beta industries recovering from an economic downturn .................................. 22
5. Conclusion ........................................................................................................................ 29
Appendix I ................................................................................................................................ 31
Appendix II .............................................................................................................................. 42
Appendix III ............................................................................................................................. 54
References ................................................................................................................................ 55
University of Amsterdam Thesis July, 2014
Claire de Jager Studentnumber: 10409890 Supervisor: Dr. L. Zou
2

1. Introduction
Asset pricing theory makes an attempt to understand and determine prices or values that
should be paid for an asset in theory (Cochrane, 2000). To value an asset, several models have
been developed to determine the appropriate rate of return of an asset considering its risk.
Using the rate of return and the level of risk (usually measured by the “beta” of the asset), the
value of the asset or portfolio can be determined. To construct optimal portfolios, the investor
attempts to maximize expected return and minimize risk by having various assets in a
portfolio, also called Modern Portfolio Theory (Shipway, 2009). Using asset pricing models,
beta is a good indicator of what will be the level of risk for investors, where a low beta
indicates less risk while a high beta indicates substantial higher risk.
Several investment strategies have been outlined to create an optimized portfolio and generate
returns against lowest possible risk (see for example Dybvig, 1988; Merton, Scholes and
Gladstein, 1978). These strategies are used by investors to make investment decisions that
will yield long-term excessive returns on their portfolio (Woolridge and Snow, 1990; Hayes
and Abernathy, 1980). These strategies make use of diversification to construct an optimal
portfolio for the investor; investing in different companies, different industries and different
types of assets can mitigate the risk and increase return (Bloomfield, Leftwich, and Long Jr.,
1997).
As mentioned above, one of the ways to diversify could be by constructing a portfolio of
stocks in different industries (based on Lessard, 1976). This thesis makes a distinction
between low-risk versus high-risk industries where low-risk industries are labelled as
industries where demand will by stable overtime, even in a downturn economy or scarcity
(e.g. health care) (Wilson, 1999). High-risk industries are labelled as pro-cyclical and
sensitive to the conditions of the market (e.g. luxurious companies) (ibid). Indicating low-risk
industries (i.e. industries with a low beta) and high-risk industries (i.e. industries with a high
beta) is important for investors to execute their investment strategy which implies assessing
3

the riskiness of these industries and optimize their portfolio (based on Asness, Frazzini and
Pedersen, 2013).
In the history of modern portfolio theory, several models have been developed to value assets
and compose optimal portfolios. One of the latest development in the field of asset pricing is
the Dichotomous Asset Pricing Model (DAPM). The DAPM makes a distinction between the
value of an asset when the market is in an economic downturn or upturn (Zou, 2005).
According to this model, the riskiness of the firm can be divided according to these two
different growth stages (the market is in an upturn or in a downturn), therefore, the beta of the
firm can be separated into a beta when the market is in an economic downturn and a beta
when the market is in an economic upturn. In other words, the DAPM will value the riskiness
of the asset individually, i.e. when the market is in an upper-state and when the market is in a
lower-state. The DAPM predicts and confirms that the beta in the lower-state will equal the
beta in the higher-state, therefore the difference in betas of the asset will equal zero.
Combining the distinction between low-beta and high-beta industries (based on Wilson, 1998)
and the DAPM as an asset pricing model (Zou, 2005), the investment strategies in low- and
high-risk industries should empirically be consistent with the DAPM. This means that the beta
in the lower-state will equal the beta in the upper-state, and this will hold for all industries
(i.e. for all low-risk and high-risk industries). The first part of this thesis will investigate
whether this statement is true. The second part of this thesis will investigate why industries or
a cluster of industries will deviate from this statement (i.e. low and high beta-industries are
not consistent with the DAPM). Therefore, the objective of this thesis is in twofold: “are the
low- and high-beta industries empirically consistent with the DAPM? If not, what can be the
reasons for this inconsistency?”.
Fama and French provide several industry classifications based on SIC-codes (Standard
Industrial Classification, used by the government of the United States). This system classifies
firms according to their division, major group and industry group. Fama and French base their
categorization on these codes and classify American firms ranging from 5 to 49 different
industries. This thesis used a specification of 30 industries where daily average value
weighted return in the US market and the daily risk free rate was subtracted from the data of
Fama and French. The CRSP database provided average market returns. With this
4

information, the beta (in lower- and upper-state) according to the DAPM was calculated. For
all data, a time period between 01-01-2003 and 31-12-2013 was chosen.
Results are statistically not significant, however, a closer look showed that low-beta industries
are more or less consistent with the DAPM (Δβ ≈ 0 or Δβ > 0), whereas high-beta industries
showed some deviations (i.e. negative Δβ for most inconsistent industries) Arguments about
loss-aversion, bounded rationality and future prospects and overconfident investors explain
the results from a behavioral point of view. The results also confirm a decrease in transaction
costs and the presence of high frequency traders, where high frequency traders function as
market-makers.
This thesis makes a contribution in two ways, first, a distinction between low-risk and high-
risk industries is made. Previous research has not labelled industries as more or less risky, this
distinction clarifies which industries could add/eliminate risk according to the investor’s
portfolio and preferences. Second, this thesis shows some regularity among inconsistent
industries when using the DAPM. Several explanations are provided why some high-beta
industries are not consistent with the DAPM and show a negative difference between the beta
in the upper-state and the beta in the lower-state. Arguments are mostly found in behavioral
finance but also transaction costs theory gives reasonable explanations.
This thesis proceeds as follows, section 2 will review important literature concerning the
distinction between low-risk and high-risk industries and development of the DAPM. An
outline of the data and methodology will be given in section 3. Section 4 will analyze the
results. Lastly, section 5 will summarize and conclude.
5

2. Literature Review This chapter will outline important theory and empirical findings in the literature regarding
the riskiness of an industry. This thesis will make a distinction between high-risk and low-risk
industries where the beta will be the indicator to measure that risk. In that sense, low-beta and
high-beta industries are considered. Furthermore, the Dichotomous Asset Pricing Model
(DAPM) is explained. Combining the concepts of low- and high-beta industries and the
DAPM will lead to some assumptions and hypothesis at the end of this chapter.
2.1. Low-beta and high-beta industries As Markowitz (1952) explains, preferences of the investor shape their portfolios but the
overall goal of investment portfolios is to maximize return and minimize risk. To hedge risk,
the investor’s portfolio consists of several assets with different characteristics to diversify as
much as possible (this way, risk is reduced). By investing in low-risk stocks yielding a lower
return and investing in high-risk stocks yielding a higher return, the investor has a balanced
strategy. According to his preferences and utility, the investor can take more risk by having
more high-risk stocks or the investor can take less risk by having more low-risk stocks in his
portfolio. In this case, the systematic risk of an individual assets contributing to the portfolio
can increase or decrease the overall risk/return relationship of that portfolio (Klemkosky and
Martin, 1975).
Important is the notion of systematic risk of the asset. Different types and categories of
financial risk are researched. For example, Artzner, et al. (1999) provide two broad categories
of risk: market and nonmarket, also called systematic and non-systematic risk. Dowd (2002)
distinguishes also different types of financial risks: market risk, credit risk, operational risk,
etc. This thesis will only consider market (systematic) risk. Broadly defined, market risk is
6

“the risk of loss (or gain) arising from unexpected changes in the market prices (e.g., such as
security prices) or market rates (e.g., such as interest or exchange rates)” (Dowd, 2002, p.1).
Throughout this thesis, risk will refer to systematic (market) risk unless stated differently.
The beta of a company (partly) reflects its sensitivity to systematic (market) risk and thus its
level of return considering the riskiness of that company (Campell and Mei, 1993). The first
model that demonstrated this relationship was the Capital Asset Pricing Model (CAPM),
where a high beta indicates an asset with higher risk but also the likelihood of higher returns
while a low beta indicates a less risky asset with more stable returns (chapter 2.2 will
elaborate more on the CAPM) (Sharpe, 1964; Lintner, 1965). Risk is created through, among
others, uncertainty in the general environment, industry and/or firm-specific variables (Miller,
1992). Uncertainty in the general environment is created because of political and
governmental instability, and uncertainty coming from the macroeconomic environment
(ibid). Uncertainty related to the industry includes input and product market, competition and
technologies (ibid). Lastly, firm-specific uncertainty is related to firm-specific operations,
management and employees (ibid). This thesis will only focus on industry risk, other forms of
risk will be considered as constant.
Different risk levels due to the nature of the industry has received significant attention in the
literature (i.e. Lessard, 1976; King, 1966). King (1966) shows that differences in risk/return
levels between industries are large enough to subscribe these differences to the industry
effect. He concludes that the industry structure explains the similar risk/return relations for all
firms in that industry, based on this notion, it makes sense to divide industries according to
their riskiness (i.e. low-beta and high-beta industries) (Wilson, 1998). Low-beta industries
will be industries less sensitive to market changes and can be seen as more safely industries
than the market average. Investing in these industries provides less risk but also lower returns.
Conversely, high-beta industries will be industries more sensitive to market changes and can
be seen as more risky industries than the market average. Investing in these industries provide
more risk but also higher returns. Implicitly, there is an assumption made about the
relationship between the average industry beta and the risk of that industry which is the basic
idea behind the CAPM: the beta of the industry reflects the riskiness of that specific industry.
However, this thesis stretches the meaning of the CAPM over industries and not specifically
to firms. In other words, it is assumed that the beta does not only measure risk for firms but
will also hold across industries as a good indicator to measure risk.
7

Assumption 1: The riskiness of the industry is measured by the average beta of all the firms in
that industry, as theorized by the CAPM.
How important are these industry effects? Schmalensee (1985) researches the influence of
industry effects on accounting rates of return at a business level and he finds that performance
is strongly influenced by industry effects. King (1966) finds that 20% of the variance in stock
prices can be explained because of differences between industries. Other studies find
somewhat moderate confirmation. Hawanini and Subramanian (2001) show that for “a few
dominant value creators” [firms that are frontrunners in their industry] and “destroyers” [firms
that are stragglers in their industry] firm-specific factors matter more than industry factors.
However, “for most of firms, i.e. for those that are not notable leaders or losers in their
industry, the industry effect turns out to be an important determinant for the level of
performance rather than firm-specific factors” (Hawanini and Subramanian, 2001, p. 2).
Livingston (1977) empirically investigates the co-movement of stocks within industries and
concludes that there are different industry patterns per industry which supports the view that
efficient diversification can be achieved by having multiple stocks across different industries.
Overall, previous research implies that it makes sense to divide firms in industry clusters.
Therefore, it is assumed that firms can be categorized according to their industry and
industries can be categorized according to their average riskiness.
What is the nature of these differences between industries? In other words, what factors
contribute to the difference in risk across industries? As King (1966) points out, the stock
market is exposed to information that will affect the value of an asset or firm. If there is new
information, this will impact the price of stock A, however, the nature of information may not
only be subjected to stock A. Rather, the information may be important for the industry (or
sub-industry) in which stock A is active. In other words, information (e.g. policy changes,
regulation) is most often relevant for the whole industry and not specifically affecting one
firm (it will also affect stock B, stock C, etc. who are active in the same industry).
Another explanation could be the competitiveness within the industry. MacKay and Phillips
(2005) explain that decisions of the firm (and thus the value of the firm) are partly determined
by the position a firm occupies within the industry. In a competitive industry, the riskiness of
the firm partly depends on actions of other firms in the industry and “its status as entrant,
8

incumbent or existing firm” (MacKay and Phillips, 2005, p. 1433). Maksimowic and Zechner
(1991) represent an example concerning technology. They assume that firms can choose to
adopt a safe technology at a marginal cost, implying lower returns against lower risk, or adopt
a riskier technology at an uncertain cost, implying higher returns against higher risk. In a
competitive environment, it will be most attractive for all firms to adopt the riskier technology
financed with debt to outperform and to compete with each other, therefore, most firms will
do so. In other words, strategic and financing decisions (thus the level of risk) are jointly
determined within competitive industries. In a less competitive environment, there is no force
to choose the risky technology because there is less pressure to outperform, therefore, each
firm does not make decisions based on the industry standard. The extra risk added when
adopting a “riskier” technology is not hedged in a less competitive industry because other
firms within the industry are not forced to meet a specific industry standard in order to
compete. Therefore, less competition within an industry will reduce risk-taking behavior
while highly competitive industries will induce risk-taking behavior in order to be able to
compete.
Furthermore, uncertainty may also be attributable to the industry life cycle (Klepper and
Graddy, 1990; Suarez and Utterback, 1995). Three stages in the industry can be distinguished:
early exploratory stage, intermediated development stage, and mature stage” (Klepper, 1997,
pp. 146/147). The first stage is characterized by a few firms adopting new technologies and
involves a high degree of uncertainty (and thus risk). In the next stage, intermediate
development stage, technologies will be more refined and fit with the demand of the market.
This stage is characterized with less uncertainty compared to the previous stage. The last stage
is characterized by stable and predictable growth where there are no new innovation but just
refinements and improvements. At the end of the mature stage, the industry can experience
renewal (where a new technology takes over the industry) or decline (where the industry
decreases in volume and eventually become extinct) which might increase the degree of
uncertainty. Each stage, especially the exploratory and the possibility of renewal in the mature
stage, brings uncertainty because of market approval of the majority and/or new competitors
entering the industry with a more advanced technology (early adaptors).
Note that the division between industry- and firm-specific factors might have some overlap.
Some firms within the industry will be early adaptors (firm-specific), while sometimes the
whole industry will adopt a new technology (industry-specific). Similarly, some firms can
9

become extinct (firm-specific) but also the entire industry can become irrelevant because of a
new invention (industry-specific).
2.2.Dichotomous Asset Pricing Model (DAPM) As previously stated, asset pricing models are used to assess the relationship between risk and
return of an asset. In history, the Capital Asset Pricing Model (CAPM) of Sharpe (1964) and
Linter (1965) has been the most prominent and discussed asset pricing model. The model was
widely accepted by the financial community because of its theoretical appeal, simplicity and
applicability. The CAPM describes a linear relation between the asset’s expected excess
return and the market expected excess return. The CAPM implies that assets with higher
sensitivity to the market (i.e. these assets bear more risk) should offer higher expected return
as a compensation for bearing such risk. According to the CAPM, the beta is a well-known
indicator to measure the sensitivity of the company to the market (i.e. to measure systematic
or market risk). The Security Market Line (SML) represents a graphical explanation of the
relationship between the expected return and the risk of a company (see figure 1). The risk-
free rate (rf) imposes no risk to the investor, every increase in beta (β) (thus additional risk)
results in higher return (E(ri)) for the investor. Higher return compensates the investor for the
additional risk he takes compared to the market. Therefore, CAPM can be expressed as
𝐸𝐸(𝑟𝑟) = 𝑟𝑟𝑓𝑓 + 𝛽𝛽𝑖𝑖(𝐸𝐸(𝑟𝑟𝑚𝑚) − 𝑟𝑟𝑓𝑓 or rewritten in expected asset’s payoff as 𝐸𝐸(𝑥𝑥) = 𝛽𝛽𝑖𝑖(𝐸𝐸(𝑥𝑥𝑚𝑚).
Besides the great insides of the CAPM, numerous empirical studies have shown that the
CAPM has some failures, e.g. the CAPM fails to explain the cross-section of average stock
returns (Campbell and Voulteenaho, 2003).
Figure 1. Security Market Line
Source: e.g. Sharpe (1964) and Linter (1965)
10

Since the CAPM, multiple variations of asset pricing models have come across. One of the
variations is the Dichotomous Asset Pricing Model (DAPM). The DAPM is one of the newest
asset pricing models by Zou (2005) allowing investors to make rational decisions about their
investments. The basic rationale behind asset pricing models, as described above, will hold
because the DAPM is an extension of the CAPM. The DAPM model considers a two-state
model where the market can be in an upper-state or lower-state. If it is more profitable to
invest in the market than in a risk-free asset, the market is in an upper-state (i.e. 𝑟𝑟𝑚𝑚 > 𝑟𝑟0). If it
is more profitable to invest in a risk-free asset than in the market, the market is in a lower-
state (i.e. 𝑟𝑟𝑚𝑚 ≤ 𝑟𝑟0). Therefore, the return of asset i (ri) depends whether the market is in an
upturn or downturn. It follows for all assets i, their upper-market expected gain equals
x�i = ri − r0, 𝑖𝑖𝑖𝑖 rm > r0 𝑎𝑎𝑎𝑎𝑎𝑎 x�i = 0 otherwise. Similarly, for all assets i, their lower-
market expected loss equals 𝑥𝑥i = r0 − ri, 𝑖𝑖𝑖𝑖 rm ≤ r0 𝑎𝑎𝑎𝑎𝑎𝑎 𝑥𝑥i = 0 otherwise. Following the
logic of the CAPM (written in asset’s expected payoff),
𝑈𝑈𝑈𝑈𝑈𝑈𝑈𝑈𝑟𝑟 𝑚𝑚𝑎𝑎𝑟𝑟𝑚𝑚𝑈𝑈𝑚𝑚 𝑠𝑠𝑚𝑚𝑎𝑎𝑚𝑚𝑈𝑈: 𝐸𝐸(𝑥𝑥𝑖𝑖) = 𝛽𝛽𝑖𝑖+𝐸𝐸(𝑥𝑥𝑚𝑚), 𝛽𝛽𝑖𝑖+ = 𝐸𝐸(𝑥𝑥𝑚𝑚𝑥𝑥𝑖𝑖)𝐸𝐸�𝑥𝑥𝑚𝑚
2 �
𝐿𝐿𝐿𝐿𝐿𝐿𝑈𝑈𝑟𝑟 𝑚𝑚𝑎𝑎𝑟𝑟𝑚𝑚𝑈𝑈𝑚𝑚 𝑠𝑠𝑚𝑚𝑎𝑎𝑚𝑚𝑈𝑈: 𝐸𝐸�𝑥𝑥𝑖𝑖� = 𝛽𝛽𝑖𝑖−𝐸𝐸�𝑥𝑥𝑚𝑚�, 𝛽𝛽𝑖𝑖− = 𝐸𝐸(𝑥𝑥𝑚𝑚𝑥𝑥𝑖𝑖)𝐸𝐸�𝑥𝑥𝑚𝑚2 �
In theory, the DAPM will hold if the market portfolio meets two conditions. First, the market
portfolio should be mean-variance (MV) efficient (see condition 1). This implies that that the
portfolio should minimize the variance for any given value of the mean. In other words, there
is no other portfolio that has a higher return (E(rm)) against lower risk (r𝑚𝑚) than the market
portfolio. This condition is met when the market portfolio has the highest Sharpe ratio (𝜂𝜂2)
compared to all other portfolios. Second, the portfolio should be gain-loss (GL) efficient (see
condition 2). This implies that the market portfolio has the highest gain-loss ratio, i.e.
portfolio has the highest gains (𝐸𝐸�̅�𝑥) against the lowest possible losses (𝐸𝐸𝑥𝑥). In this case, there
is no investment strategy that will generate higher returns against possible losses than the
market portfolio (Zou, 2005). It is assumed that the market MV and GL efficient when using
the DAPM, i.e. the following conditions hold:
Condition 1: 𝜂𝜂2(𝑥𝑥𝑖𝑖) ≤ 𝜂𝜂2(𝑥𝑥𝑚𝑚) < 1, 𝐿𝐿ℎ𝑈𝑈𝑟𝑟𝑈𝑈 𝜂𝜂(𝑥𝑥) = 𝐸𝐸(𝑥𝑥)�𝐸𝐸(𝑥𝑥2)
Condition 2: 𝑍𝑍(𝑥𝑥𝑖𝑖) ≤ 𝑍𝑍(𝑥𝑥𝑚𝑚) < ∞, 𝐿𝐿ℎ𝑈𝑈𝑟𝑟𝑈𝑈 𝑍𝑍(𝑥𝑥) = 𝐸𝐸(𝑥𝑥+)𝐸𝐸(−𝑥𝑥−)
11
When the market is MV and GL efficient, i.e. condition 1 and 2 are met, the beta in the upper
market state will be equal to the beta in the lower market state. Intuitively explained; when the
market is MV and GL efficient, the expected return of the investor’s portfolio cannot be
higher than the return of the market because the market portfolio will generate the highest
expected return, holding risk constant (i.e. no arbitrage). This also holds for the level of risk:
the level of risk the investor’s portfolio bears cannot be lower than the risk of the market
because the market portfolio will provide the lowest possible level of risk, holding return
constant (i.e. no risk arbitrage). This implies that an investor cannot profit from opportunities
where an asset will have different risk/return levels, i.e. 𝛽𝛽𝑖𝑖+ = 𝛽𝛽𝑖𝑖−. For a mathematical proof,
see Zou (2005).
Difference between the DAPM and CAPM is the extension of a two-state model where the
beta of an asset is expressed in different states of the economy (i.e. lower-state or higher-
state). Where the CAPM assumes one beta, regardless the state of the market, the DAPM
takes the external economic conditions into account. Furthermore, the DAPM implies the
CAPM but not the other way around. Because of MV efficiency, the CAPM should hold but
the DAPM will only hold if there is also GL efficiency. As pointed out before, similarities
exist because of the same rationale (i.e. the DAPM is based on the CAPM with some
additional insights).
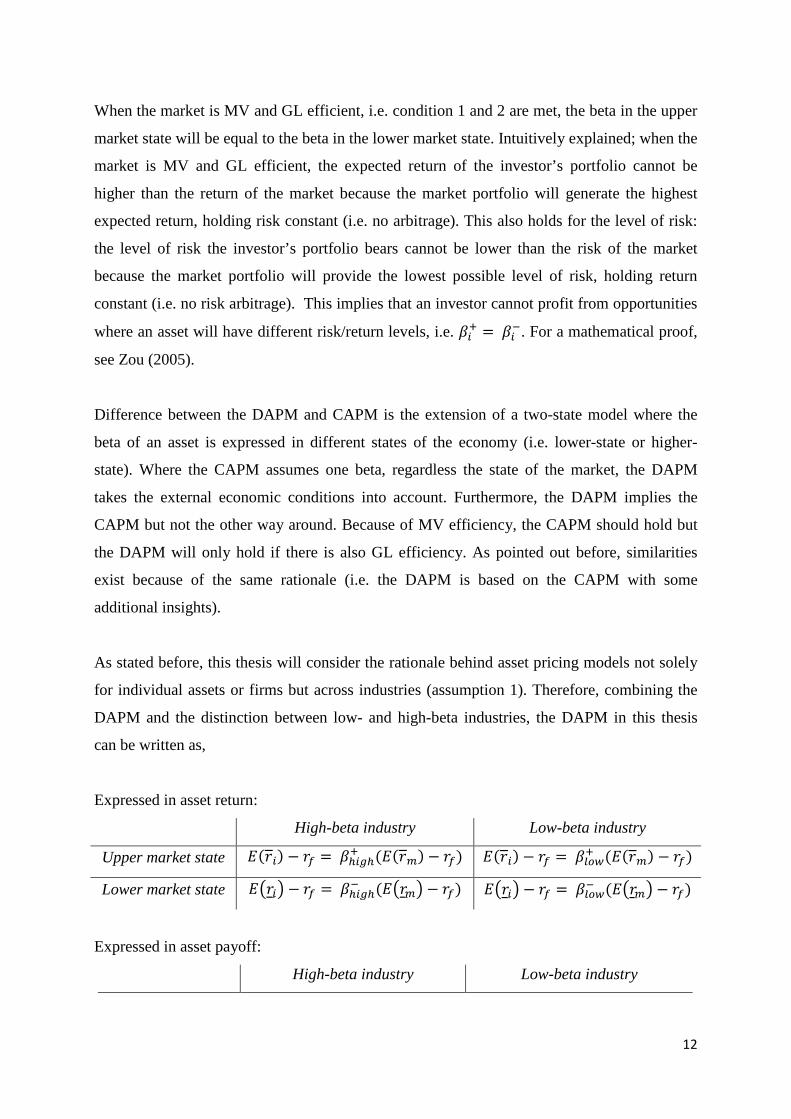
As stated before, this thesis will consider the rationale behind asset pricing models not solely
for individual assets or firms but across industries (assumption 1). Therefore, combining the
DAPM and the distinction between low- and high-beta industries, the DAPM in this thesis
can be written as,
Expressed in asset return:
High-beta industry Low-beta industry
Upper market state 𝐸𝐸(𝑟𝑟𝑖𝑖) − 𝑟𝑟𝑓𝑓 = 𝛽𝛽ℎ𝑖𝑖𝑖𝑖ℎ+ (𝐸𝐸(𝑟𝑟𝑚𝑚) − 𝑟𝑟𝑓𝑓) 𝐸𝐸(𝑟𝑟𝑖𝑖) − 𝑟𝑟𝑓𝑓 = 𝛽𝛽𝑙𝑙𝑙𝑙𝑙𝑙+ (𝐸𝐸(𝑟𝑟𝑚𝑚) − 𝑟𝑟𝑓𝑓)
Lower market state 𝐸𝐸�𝑟𝑟𝑖𝑖� − 𝑟𝑟𝑓𝑓 = 𝛽𝛽ℎ𝑖𝑖𝑖𝑖ℎ− (𝐸𝐸�𝑟𝑟𝑚𝑚� − 𝑟𝑟𝑓𝑓) 𝐸𝐸�𝑟𝑟𝑖𝑖� − 𝑟𝑟𝑓𝑓 = 𝛽𝛽𝑙𝑙𝑙𝑙𝑙𝑙− (𝐸𝐸�𝑟𝑟𝑚𝑚� − 𝑟𝑟𝑓𝑓)
Expressed in asset payoff:
High-beta industry Low-beta industry
12

Upper market state 𝐸𝐸(𝑥𝑥𝑖𝑖) = 𝛽𝛽ℎ𝑖𝑖𝑖𝑖ℎ+ 𝐸𝐸(𝑥𝑥𝑚𝑚) 𝐸𝐸(𝑥𝑥𝑖𝑖) = 𝛽𝛽𝑙𝑙𝑙𝑙𝑙𝑙+ 𝐸𝐸(𝑥𝑥𝑚𝑚)
Lower market state 𝐸𝐸�𝑥𝑥𝑖𝑖� = 𝛽𝛽ℎ𝑖𝑖𝑖𝑖ℎ− 𝐸𝐸�𝑥𝑥𝑚𝑚� 𝐸𝐸�𝑥𝑥𝑖𝑖� = 𝛽𝛽𝑙𝑙𝑙𝑙𝑙𝑙− 𝐸𝐸�𝑥𝑥𝑚𝑚�
Where 𝛽𝛽𝑙𝑙𝑙𝑙𝑙𝑙 represents the beta of the industries that are less sensitive to market changes, i.e.
these industries provides less risk but also lower returns for investors and 𝛽𝛽ℎ𝑖𝑖𝑖𝑖ℎ represents the
beta of the industries that are more sensitive to market changes, i.e. these industries provide
more risk but also higher returns for investors. Since a high beta indicates higher risk but also
the likelihood of higher returns, this is characterizing for high-beta industries. Conversely, a
low beta indicates a less risky assets with more stable returns, characterizing low-beta
industries. The plus (𝛽𝛽ℎ𝑖𝑖𝑖𝑖ℎ/𝑙𝑙𝑙𝑙𝑙𝑙+ ) and minus (𝛽𝛽ℎ𝑖𝑖𝑖𝑖ℎ/𝑙𝑙𝑙𝑙𝑙𝑙
− ) signs indicate respectively if the
market is in an upturn or downturn.
Assuming categorization of industries according to their beta, one could distinguish low-,
neutral- and high-risk industries (as explained above, this thesis will focus on the difference
between low- and high-beta industries). According to the CAPM (and DAPM), a risk-free
asset has a beta of 0 and the market has an average beta of 1 (Sharpe, 1964; Lintner, 1965).
Therefore, low-risk industries should have a beta between 0 and >1, neutral-risk industries
have a beta around 1, and high-risk industries should have a beta higher than 1. For simplicity,
it is assumed that an industry with a beta below 0.8 is indicated as a low-risk industry and an
industry with a beta above 1.2 will be labelled as a high-risk industry. Everything in between
will be considered as a neutral-“risk” industry and not be relevant for this thesis. Note that the
term neutral-risk does not mean risk-free, it means that the differences with the risk/return of
the market portfolio are not substantial enough to classify themselves as low- or high-risk
industries. In that sense, neutral-risk industries have more or less the same characteristics as
the market portfolio and were therefore not mentioned before.
Assumption 2: Industries can be categorized according to their riskiness of the average firm
within that industry measured by calculating the beta. A distinction between
low-, neutral- and risky industries can be made where;
Beta < 0.8 is categorized as low-beta industry (βlow)
0.8 ≤ Beta ≤ 1 is categorized as neutral-beta industry (βneutral)
Beta > 1 is categorized as high-beta industry (βhigh)
13

Logically, βlow < βhigh. Besides the separation between low- and high-beta industries, the
DAPM includes the dynamics of the overall economic environment. Because the beta in an
upturn equals the beta in a downturn, assumption 2 implicitly validates 𝛽𝛽𝑙𝑙𝑙𝑙𝑙𝑙+ = 𝛽𝛽𝑙𝑙𝑙𝑙𝑙𝑙− < 𝛽𝛽ℎ𝑖𝑖𝑖𝑖ℎ+ =
𝛽𝛽ℎ𝑖𝑖𝑖𝑖ℎ− . Next, the DAPM will be consistent with low- and high-risk industries if the following
hypothesis holds:
Hypothesis: Because the market is MV and GL efficient, the beta in an upturn and the beta
in a downturn will be equal across industries, therefore,
∆𝛽𝛽𝑙𝑙𝑙𝑙𝑙𝑙 = 𝛽𝛽𝑙𝑙𝑙𝑙𝑙𝑙+ − 𝛽𝛽𝑙𝑙𝑙𝑙𝑙𝑙− = 0
∆𝛽𝛽ℎ𝑖𝑖𝑖𝑖ℎ = 𝛽𝛽ℎ𝑖𝑖𝑖𝑖ℎ+ − 𝛽𝛽ℎ𝑖𝑖𝑖𝑖ℎ− = 0
3. Methodology
Testing the assumptions and hypothesis, two different analyses should be done. First, an
industry analysis should indicate which industries can be labelled as low- or high-beta
industries. Second, the upper- or lower-state of the economic environment and the beta in
each state should be examined per industry in order to test the hypothesis.
3.1. Data To test the hypothesis, a distinction in industries should be made to indicate which industries
bear more (high-beta industry) or less risk (low-beta industry) compared to the market.
According to the U.S. Security and Exchange Commission (SEC) there are 12 industries
(labelled as A/D) and several sub-industries (labelled as SIC). Appendix I gives an overview
of all the industries and sub-industries according to the SEC. Within an industry, there exist
differences in risk per company due to company-specific characteristics. However, following
Fama and French it is assumed that the industry average will display an even picture despite
some outliers, therefore, the average beta industry will give a clear indication about the
overall riskiness of the industry. Fama and French provide several industry portfolios based
on the SEC and data according to these industry portfolios, therefore, their research data will
be used. The range of these portfolios differs; e.g. Fama and French provide several
definitions of industries and their sub-industries where they divide U.S. firms in 5, 10, 12, 17,
14

30, 38, 48 or 49 different industry portfolios. Using a narrow definition of industry groups
(e.g. separating all companies in 5 different industries) might cause extreme outliers but still
have an average beta because of the large differences within the industry. However, a wide
definition of industry groups (e.g. separating all companies in 49 different industries) might
lead to fragmentation and will make it more difficult to analyze. Therefore, a specification of
30 industries is used. A definition of the industries according to the SIC-codes can be found in
appendix II. For each industry, the daily average value weighted return (𝑟𝑟𝑖𝑖) in the period 01-
01-2003 until 31-12-2013 in the US market will be used. Also the daily risk-free rate (𝑟𝑟𝑓𝑓) is
available in this database for the same time-period (risk-free rate is based on the T-bill rate).
In order to calculate the beta of the industry, market return should be used. The CRSP
database provides returns on the market (𝑟𝑟𝑚𝑚) and therefore, the market premium (𝑟𝑟𝑚𝑚 - 𝑟𝑟𝑓𝑓) can
be calculated.
3.2. Two-pass regression model The DAPM consists of a two-pass regression model. In order to obtain the beta of the
industry, only the first pass of the model is needed. In the first pass, the return of each
industry is regressed on the market return to obtain the beta of the industry. It is expected that
the lower-market and upper-market return of any industry is proportional to its beta in the
lower-state (𝛽𝛽𝑖𝑖−) or its beta in the upper-state (𝛽𝛽𝑖𝑖+). If the DAPM holds, the intercept of the
security market line (SML) will be zero. In other words, the SML+ and SML- will pass
through the origin. Figure 2 gives a graphical explanation.
Figure 2. Graphical explanation DAPM
Source: Zou (2005)
15

The SML is important to determine which industries can be classified as low- or high-beta
industries. Theory assumes that the SML represents the relationship between the expected
return and risk of an asset (in this case, an industry). Consider a positive market (i.e. upturn)
where the industry is plotted above the SML+, this means that the industry is undervalued
because the investor will expect a greater return given the risk he/she is taking. Conversely, if
the industry is below the SML+, the industry will be overvalued because the investor accepts
less return given the risk of that particular industry. The same holds when the market is in a
negative spiral: industries above the SML- provide the same risk but against a lower return
and therefore, are overvalued. Conversely, if the industry is below the SML- the industry is
undervalued. Empirical studies show that the real SML (the real relationship between risk and
return) is less steep than the hypothesized SML (displayed in figure 2) due to the market
premium (in reality there is no riskless asset). The area between the real and hypothesized
SML is the “abnormal extra return [or loss] over the market”, denoted as alpha (Jensen,
1969). Therefore, the alpha represents the average return above the expected return predicted
by the hypothesized SML, ceteris paribus the portfolio’s beta and market return. In other
words, the alpha can be seen as residuals of all means excess return, which is also calculated
in the first pass. The second pass will see if condition 1 (MV-efficient) and condition 2 (GL-
efficient) are satisfied. However, as explained before, these conditions are assumed to be met
and therefore the second pass will not be used.
3.3. Ratio’s To assess the link between the industries and their risk, several variables can be used. In order
to identify the riskiness of the industry, the beta and alpha will be used. The beta is defined
according to the best-beta (measures the beta for all states, no distinction between lower- and
upper-state), 𝛽𝛽 = 𝐸𝐸(𝑥𝑥𝑚𝑚𝑥𝑥)𝐸𝐸(𝑥𝑥𝑚𝑚2 )
, where a beta > 1.2 indicates a more risky investment compared to
the market average and a beta < 0.8 indicates a less risky investment compared to the market
average (see assumption 2). The alpha will be defined as 𝛼𝛼 = 𝐸𝐸(𝑥𝑥𝑖𝑖) − 𝛽𝛽𝐸𝐸(𝑥𝑥𝑚𝑚), where alpha
< 0 implies that the asset earned too little given its risk and alpha > 0 implies excess return for
the assumed risk for the investor. The beta will be used to divide industries in low-beta or
high-beta industries, the alpha will be an additional indicator and give information about the
correctness of the division.
16

This thesis focusses specifically on the difference between low-beta and high-beta industries
because of the more extreme difference in their risk/return relationship. As explained before,
neutral-risk industries will have similar results since their risk/return relation is less extreme
and results will be less obvious. Therefore, the beta in the upper state and lower state will be
computed for the low-beta and high-beta industry following the DAPM;
𝛽𝛽𝑖𝑖− = 𝐸𝐸(𝑥𝑥𝑚𝑚𝑥𝑥𝑖𝑖)𝐸𝐸�𝑥𝑥𝑚𝑚2 �
, 𝛽𝛽𝑖𝑖+ = 𝐸𝐸(𝑥𝑥𝑚𝑚𝑥𝑥𝑖𝑖)𝐸𝐸�𝑥𝑥𝑚𝑚
2 �
Thereafter, ∆𝛽𝛽𝑙𝑙𝑙𝑙𝑙𝑙 and ∆𝛽𝛽ℎ𝑖𝑖𝑖𝑖ℎ are computed and its t-statistic which is defined as
𝑚𝑚 − 𝑠𝑠𝑚𝑚𝑎𝑎𝑚𝑚𝑖𝑖𝑠𝑠𝑚𝑚𝑖𝑖𝑠𝑠 = ∆𝛽𝛽𝑖𝑖 − 0𝑆𝑆𝑆𝑆(∆𝛽𝛽𝑖𝑖)
= 𝛽𝛽𝑖𝑖+ − 𝛽𝛽𝑖𝑖−
�𝑉𝑉𝑉𝑉𝑉𝑉(𝛽𝛽𝑖𝑖+ − 𝛽𝛽𝑖𝑖−)=
𝛽𝛽𝑖𝑖+ − 𝛽𝛽𝑖𝑖−
�𝑉𝑉𝑉𝑉𝑉𝑉(𝛽𝛽𝑖𝑖+|𝐺𝐺) + 𝑉𝑉𝑉𝑉𝑉𝑉(𝛽𝛽𝑖𝑖−|𝐿𝐿)
= 𝛽𝛽𝑖𝑖+ − 𝛽𝛽𝑖𝑖−
�𝜎𝜎𝑖𝑖
𝑇𝑇1𝐸𝐸(𝑥𝑥𝑚𝑚2 |𝐺𝐺)
+ 𝜎𝜎𝑖𝑖𝑇𝑇2𝐸𝐸(𝑥𝑥𝑚𝑚2 |𝐿𝐿)
4. Results This section will analyze the division of industries and analyze results across low- and high-
risk industries. First, the industry analysis will outline the riskiness of each industry (30
industries in total). In other words, a distinction between low-, neutral- and high-risk
industries is made. Next, the hypothesis across low- and high-risk industries is tested.
4.1. Low- and High-beta industry analysis This subsection will divide 30 industries (see Appendix II) according to their riskiness. As
mentioned before, a risky industry will have an estimated beta higher than 1.2. Conversely, a
low-risk industry will have a beta lower than 0.8. “Neutral” industries are not the topic of this
research but are given for completeness. Also the alpha is calculated to give a more complete
overview of the different industries and their dynamics. Using the DAPM, the following
results are found;
Low-risk Neutral High-risk
Industry Beta Alpha Industry Beta Alpha Industry Beta Alpha
Food 0,677 0,020 Games 1,187 0,013 Textiles 1,206 0,013
Beer 0,539 0,017 Books 1,105 -0,028 Construction 1,343 0,001
Smoke 0,585 0,055 Clothes 1,070 0,026 Steel 1,609 -0,001
17

The categorization of the industries is not surprising according to the literature (e.g. Wilson,
1998). Basic needs (“Households”, “Utilities”, “Health”, “Food”) are classified as low-risk
because they will always be important even if the economy experiences a slowdown.
Secondary industries, like “Beer” and “Smoke”, might be unexpected since these products
will be far from essential for humans. An additional explanation might be the addictive nature
of these products (people “have to” smoke and people “have to” drink), however, further
research should explore these industries more in depth. Also the classification of high-risk
industries are logical and predictable. Especially industries related to engineering/industrial
(e.g. steel, coals, mines, construction and fabricated products) and luxury expenditures (e.g.
cars) experience significant declines when the economy is in a recession. The classification of
these industries will be valid across several time periods and will remain valid in the future
because the nature of an industry “cannot easily, if at all, change” (Bettis and Mahajan, 1985,
p. 786).
4.2. Lower- and upper economic environment Table 2 gives an overview of the beta when the market is in an upper- or lower-state for all
low-risk and high-risk industries. As explained before, the beta of low-risk and high-risk
industries in an upper-state (β+) should equal the beta in a lower-state (β-) (and equal the best-
beta (β)). Industries showing strong differences between the upper- and lower-beta are marked
Households 0,656 0,012 Chemicals 1,170 0,018 Fabricated Products 1,292 0,016
Health 0,710 0,014 Carry 1,012 0,029 Electrical Equipment 1,208 0,012
Utilities 0,748 0,021 Oil 1,115 0,025 Autos 1,337 -0,008
Telecom 0,960 0,009 Mines 1,286 0,014
Services 0,965 0,011 Coals 1,726 0,017
Business
Equipment 1,072 0,009 Finance 1,364 -0,018
Paper 0,951 0,009
Transport 1,040 0,016
Wholesale 0,914 0,018
Retail 0,855 0,016
Meals 0,832 0,036
Other 0,916 0,000
Table 1. Low-, Neutral and High-risk industries
18

with red (βi+ − βi− ≥ |0.03|), these industries are expected to be inconsistent with the
hypothesis (i.e. Δβ ≉ 0) (table 3, next page). To see if these industries will be inconsistent
with the DAPM, a t-test is used (Appendix III gives a complete overview of low-, neutral and
high-risk industries).
Low-risk industries High-risk industries
Industry β β+ β- Industry β β+ β-
Food 0,68 0,67 0,68 Textiles 1,21 1,21 1,20
Beer 0,54 0,56 0,52 Construction 1,34 1,34 1,35
Smoke 0,59 0,58 0,59 Steel 1,61 1,57 1,65
Household 0,66 0,67 0,64 Fabricated Products 1,29 1,30 1,29
Health 0,71 0,71 0,71 Electronic Equipment 1,21 1,22 1,19
Utilities 0,75 0,75 0,75 Autos 1,34 1,33 1,34
Mines 1,29 1,26 1,31
Coal 1,73 1,68 1,77
Finance 1,36 1,37 1,36
Table 2. Industry-betas according to the DAPM
Low-beta industries High-beta industries
Industry β+ β- β+ - β- t-stat Industry β+ β- β+ - β- t-stat
Food 0,67 0,68 0,00 -0,15 Textiles 1,21 1,20 0,00 0,07
Beer 0,56 0,52 0,05 1,56 Construction 1,34 1,35 -0,01 -0,12
Smoke 0,58 0,59 -0,01 -0,29 Steel 1,57 1,65 -0,07 -1,03
Household 0,67 0,64 0,03 0,81 Fabricated Products 1,30 1,29 0,01 0,14
Health 0,71 0,71 0,00 0,13 Electronic Equipment 1,22 1,19 0,03 0,54
Utilities 0,75 0,75 0,00 0,15 Autos 1,33 1,34 -0,02 -0,26
Mines 1,26 1,31 -0,05 -0,79
Coal 1,68 1,77 -0,10 -1,00
Finance 1,37 1,36 0,00 0,08
Table 3. Results according to the DAPM
As expected, industries where ∆β deviates significantly from zero also have higher t-statistics
than industries who are more or less consistent with the DAPM. None of the t-statistics are
significant at a 5% significance level (t-stat = 1.96) and therefore cannot be rejected, however,
19

one sees a clear movement of higher t-statistics when the industry differs significantly from
the DAPM. Therefore, t-statistic should not be interpreted too strictly since the estimator does
not give a complete overview of the correctness of the model. It can be concluded that the
industries marked with green are more or less consistent with the DAPM. In other words,
∆𝛽𝛽𝑙𝑙𝑙𝑙𝑙𝑙 = 𝛽𝛽𝑙𝑙𝑙𝑙𝑙𝑙+ − 𝛽𝛽𝑙𝑙𝑙𝑙𝑙𝑙− ≈ 0 or ∆𝛽𝛽ℎ𝑖𝑖𝑖𝑖ℎ = 𝛽𝛽ℎ𝑖𝑖𝑖𝑖ℎ+ − 𝛽𝛽ℎ𝑖𝑖𝑖𝑖ℎ− ≈ 0 for these industries. The
industries marked with red are inconsistent with the DAPM. In other words, ∆𝛽𝛽𝑙𝑙𝑙𝑙𝑙𝑙 = 𝛽𝛽𝑙𝑙𝑙𝑙𝑙𝑙+ −
𝛽𝛽𝑙𝑙𝑙𝑙𝑙𝑙− ≉ 0 or ∆𝛽𝛽ℎ𝑖𝑖𝑖𝑖ℎ = 𝛽𝛽ℎ𝑖𝑖𝑖𝑖ℎ+ − 𝛽𝛽ℎ𝑖𝑖𝑖𝑖ℎ− ≉ 0 for these industries.
Industries consistent with the DAPM imply that the “net riskiness” of a low-risk industry
compared to a high-risk industry should be equal and not be an issue for the investor when
shaping his portfolio. In other words, low-beta industries (like “Food”, “Smoke”, “Health”
and “Utilities”) should have equal risk/return levels as high-beta industries (like “Textiles”,
“Construction”, “Fabricated Products”, “Auto’s” and “Finance”). Therefore, the investor
could construct portfolios of solely low-beta industries or solely high-beta industries with the
same amount of risk. This implies that diversification and combinations of industries in the
investors’ portfolio (involving any risky industry or a combination of less risky industries)
represent the preferences and utility of the investor (based on Sharpe, 1964).
When the investor is indifferent between low- and high-beta stocks, one could make a
portfolio of solely low-beta industries that will outperform a portfolio of solely high-beta
stocks. To construct such a portfolio (solely low-beta industries with lower risk and higher
returns), investors should borrow money and invest in low-beta stocks to shift to a position
with similar risk but higher returns (Black, 1972). The beta indicates how exposed the
industry is to the economic environment where a higher beta will increase the average price of
the stocks in that industry because of an increase in willingness to bear risk (based on Miller,
1977). As a result, the payoff on assets in a high-risk industry will be lowered because of this
higher price. Assuming interest rates on equal terms for each investor, the payoff on high-beta
industry will be less compared to constructing a portfolio when money is borrowed in order to
invest in low-beta industries (Miller, 1977). However, the reason why investor will not invest
in low-beta industries is because you need to borrow money which in itself brings additional
risk. Yet, results show that completely rational investors will be indifferent between the two
options (holding interest rates constant).
20

Overall, the DAPM model is a consistent model for investors to asses different industries and
their riskiness in most cases. However, is there an explanation why the DAPM does not hold
for all industries? Are there some similarities across inconsistent industries that can explain
these deviations? Taking a closer look at the deviations, results show that the inconsistent
low-beta industries (“Beer” and “Household”) have higher betas when the market is in an
upturn and lower betas when the market is in a downturn (i.e. positive Δβ). This implies that
the average risk of the industry will be higher when the economy is doing well and lower
when the economy is performing badly. One could argue that industries with a positive Δβ,
are the industries that experience a slow down when there is a recession but will experience
superior growth as soon as the market will move towards the upper-state because of the
“neediness” of that particular industry. In other words, “Households” and “Beer” are the first
industries that become significant to consumers when the economy is recovering from a
slowdown and therefore, profitable for investors. This means that investing in “Beer” or
“Households” is a profitable opportunity because the risk (and thus return) will recover from
economic downturns. This thesis will not argue why this is the case but only explain the
behavior of industries with a positive Δβ.
Inconsistent high-beta industries have higher betas when the market is in a downturn and
lower betas when the market is in an upturn (i.e. negative Δβ). This implies that the investor
overvalues these industries, where the only exception is “Electrical Equipment” which is
classified as a high-beta industry but behaves like a low-beta industry. For these high-beta
industries (“Steel”, “Mines” and “Coal”), it means that the industry recovers less fast from an
economic downturn (e.g. the market is moving towards the upper-state) and it will be
confronted as first when there is an economic downturn. In other words, the industry will
experience less growth in economic ups compared to the decline in an economic downturn
because investors are hesitant to invest in these industries (i.e. leads to a negative Δβ). Why
are investors cautious when investing in these industries? Is there a logical explanation that
could explain the hesitance of investors to invest less in these industries when the economy is
recovering from a downturn (i.e. the economy is moving towards an upper-state)? This
interesting notion might be explained by using concepts from behavioral economics and the
transaction cost theory. The next paragraph will explain these arguments more in depth
(“Electrical Equipment” will not be explained since this industry behaves like a low-risk
industry).
21

4.3. High-beta industries recovering from an economic downturn As shown in table 2 and 3, high-beta industries who are inconsistent with the DAPM show
some similarities with respect to the differences in their riskiness when the market is in an
upturn or downturn. All inconsistent high-risk industries (except “Electrical Equipment”)
have a negative Δβ. Is this coincidence? Or is there a theoretical explanation that could
explain this regularity? Theories and concepts from behavioral finance and transaction cost
theory might give an explanation for this effect.
Behavioral finance focusses on the psychological and social dimension of finance (Shiller,
2003). One of the new insights gathered by behavioral finance is the notion of bounded
rationality. Asset pricing models assume rational investors, i.e. the investor makes optimal
choices that benefit the utility of the investor (Simon, 1997). However, in the real world
investors’ rational is limited, also called bounded rationality; decision-making has “systematic
biases that separate the beliefs that people have and the choices they make from the optimal
beliefs and choices that rational investors would make” (Kahneman, 2003, p. 1449). This
means that investors will not make optimal choices because their psyche limits them to do so.
An example of bounded rationality is loss-aversion. Loss-aversion means that investors are
more sensitive to losses than to gains (Benartzi, and Thailer, 1995) and could explain a
negative Δβ for inconsistent high-beta industries. This concept is used in the prospect theory
of Kahneman and Tversky (1979), where it is argued that the utility function of investors
comes from gains and losses in pay-off. In this case, the investor will not make optimal
choices because its utility depends on relative returns and the (investment) decision is not
evaluated on an absolute level, i.e. the final outcome is less relevant to the investor than the
value of gains and losses. Figure 3a and 3b illustrate the prospect theory where the value
displays the reference point between what is experienced as a loss or gain by the investor.
Note: investors can be more/less loss averse, therefore, the value function might differ
between investors; figure 3a displays an investor who is very loss-averse while the investor
displayed in figure 3b values his losses to a lesser extent.
22

Figure 3a and 3b. Examples of value functions from investors
Source: Kahneman and Tversky (1979)
Because loss-averse investors will value losses more intensive than gains, even when the loss-
or gain-differential is equal, investors will try to avoid losses as much as possible even if the
compensation to avoid losses is imbalanced with the actual loss. In other words, where
rational investors would take the loss to avoid additional risk, a loss-averse investor would
avoid the loss even if the additional risk involved is not rational. Taking a look at the results
of inconsistent high-beta industries, one sees that in the lower state the investor is willing to
take more risk (i.e. 𝛽𝛽ℎ𝑖𝑖𝑖𝑖ℎ+ < 𝛽𝛽ℎ𝑖𝑖𝑖𝑖ℎ− ) even if the additional loss in return is not proportional to
the additional risk. Because investors put greater weight on the losses, they “demand
additional compensation” for these industries when the economy is in a downturn (based on
Ang, Chen, and Xing, 2006, pp. 1191). In other words, they will value these industries as
more risky and therefore the beta will increase during a downturn of the economy because the
downturn will cause additional loss for the industry and thus for the investor. Compared to
low-beta industries, investors will take their loss in an early stage because the deviations are
less and thus the impact on the value function is limited. Concluding, when the market is
going down, investors demand higher returns than the difference in return when the market is
going up because they put more weight to their losses than to equal gains. In other words, the
investor will demand a higher return in a downturn compared the return asked by the investors
when the market is in an upturn than rational investors, holding the additional
increase/decrease in risk equal.
Second, forecasting errors might be a reason for a negative Δβ. As Chandler (1990) describes,
there are some industries that have continously new innovations that require firms in that
23

industry to adapt and develop new resources/capabilities. A good example are energy
companies who need to compete and innovate for their share of “clean energy” (this includes
the “Coal” and “Mine” industry). This brings additional risk for investors because a bounded
rational investor cannot forcast the future and the precise pattern of the industry (or firm). A
frequent used indicator for innovation is the number of patents (Lanjouw and Schankerman,
2004). For industries where there is a high number of patents, it is assumed that these
industries will be most competitive on innovation and have increased uncertainty (ibid). In
other words, figure 4 (next page) shows how innovative the industries in the U.S are and
indeed it can be concluded that coal and mining will be industries where innovation is
important and the competition is severe. This means that the forecast of these industries tend
to be more difficult (Will your company still be profitable after the completion of the
innovation? Will your company also beat the competition when there is a new innovation
wave?), therefore, uncertainty is increased and investors will demand a higher compensation
which marks a higher average beta.
In general, high-innovative industries have an uncertain future because of their systematic
innovations. Because it is impossible for the investor to be completely rational, his respond to
this increased uncertainty will be based on heuristics and affect. Indeed, because of this
uncertainty, investors have to rely on their instincts and will tend to be more loss-averse, as
explained before, loss-averse investors will hold on to their losses even if the additional risk is
not proportional. This might be an explanation why industries with a highly innovative
character and uncertainty have higher betas in the lower state and lower betas in the upper
state.
24

Figure 4. Number of patents per industry in the U.S.
Source: OECD statistics, number of patents per industry
25

Concluding, whether the market will experience an upturn or downturn, the uncertainty about
the competitive industries will remain the same. However, the investor will experience the
lower-state of the economy as more uncertain and they become more attached to their losses
and therefore ask a higher return to compensate. Furthermore, in the lower-state of the
economy the pressure to innovate in highly competitive industries might truly increase
because of the limited performance and declining results (Roberts, 2003). This will increase
uncertainty in the lower-state, leading to a higher beta. The exact mechanism of the two
scenarios should be researched in the future. Note that human necessities (see figure 4) also
have an innovative character, however, because they are considered as a basic need for human
presence, innovation will not create uncertainty but rather create efficiency.
Another example of bounded rationality is an overconfident investor, defined as an investor
“who overestimates the precision of his private information and underestimates the value of
public information” (Daniel, Hirshleifer, and Subrahmanyam, 1998, p. 1841). Evidence
supports overreaction of investors that lead to a negative correlation between stock returns
and volatility (Daniel, et. al, 1998). In other words, the investor bears more risk (excess
volatility) given the return than a rational investors would do. In case of the high-beta
industries, investors overreact on their private information in the lower-state of the economy,
probably because they want to avoid their loss (loss-averse). This implies that investor is
taking excess risks in the lower state, at least in excess of what a rational investor would
obtain. In the upper state, investors underreact to public information (i.e. macro-economic
signals) about the industry (Daniel, et. al, 1998). This means that the investor does not adjust
their risk level according to the change in return on the industry compared to rational
investors (risk-averse) given the public information about the industry.
More specific, investors will be overconfident in the lower-state since they think they have
more credible signals because of private information and thus overreact their accuracy of the
prediction of the market based on this information (Daniel, et. al, 1998). This means that the
investors will take excess risk but do not experience this additional risk as imbalanced
compared to the change in return (as rational investors would do). In case of the upper state,
the macro-economic signals (i.e. public information) is undervalued and investors will
underreact since they do not take these signals as credible enough (Daniel, et. al, 1998). They
will see the industry as “safe” while a rational investor would give more credibility to publicly
available information which changes the risk level. This implies that investors will overvalue
26

private information in the lower-state to justify their loss-averse behavior and undervalue
public information in the upper-state in order to avoid additional risk (risk-averse behavior).
This leads to a lower beta in the upper-state and a higher beta in the lower-state, i.e. a negative
Δβ. This might be specifically the case for high-beta industries since the investor has more to
lose and more to gain. Because the deviation between “winning” and “losing” is increased,
the relation to over-/under-reaction of private/public information tends to be stronger.
Especially for the “Steel” and “Coal” industry, the average gain and loss will be higher since
the overall beta is higher compared to the average of the high-beta industries.
Besides behavioral aspects, transaction costs and frequency traders also confirm the results.
The lower- and higher-state betas of high-risk industries are consistent with the idea that high
frequency traders indeed have impact on the market since they can trade repeated times a day
at very low costs. Classical theory reviews the bid-ask spread as a compensation for the
market maker (Madhaven, 2000). This compensation is needed because the market maker has
order-handling costs, the cost of adverse selection and price risk (ibid). Logically, a market
maker would prefer to have markets where these costs are as low as possible. Research shows
that high frequency trades are likely to change the average transaction cost (Kirilenkoz and
Cvitanik, 2010). Several costs decrease, e.g. search costs, order-processing costs and fees,
because of these high frequency traders. This implies that the bid-ask spread will decrease and
therefore, transaction costs improve and trades can be continuously and instantly done
(Menkveld, 2011). In other words, high frequency traders will instantly sell stocks in
industries that underperform because they are not stopped because of high transaction costs
(i.e. transactions are insignificant to the loss that is made by the stock).
This means that a high frequency trader “enables a market-making strategy to quickly update
quotes on the arrival of public information and thus reduce the risk of being adversely
selected” (Menkveld, 2011, p. 5). Furthermore, the response time will decrease (i.e. low
latency) which enables the high frequency trader to have a market-making role for investors
(ibid). Therefore, high frequency traders will be the new market-maker who instantly can sell
and buy stocks as a rational investor would do in offset of the transaction costs. Previously
research shows that systematic risk (β) in an increasing function of the expected return of an
stock where return is an increasing function of the bid-ask spread (i.e. asset illiquidity)
(Amihud and Mendelson, 1986). If high frequency traders value in industry as more risky,
they will not invest in these industries or sell the stock in these industries which will decrease
27

the liquidity of that industry which will increase the risk of that industry. Logically, in the
lower-state of the economy, high frequency-traders will sell or not invest, and the industry
will experience more risk and will demand additional return because of decreased liquidity.
This particular industry will become even more illiquid and thus risk is even more increased
(i.e. the loss-spiral). Indeed, the beta in the lower state will increase significantly compared to
the beta in the upper state for industries that are sensitive to the economic environment
because of instant trades done by the higher frequency trader.
This thesis tried to gather first insights in possible explanations for the behavior of investors
when considering patterns of risk and return. The focus is on irregular high-risk industries and
further research should clarify the exact mechanism behind this notion.
28

5. Conclusion
The central question in this thesis explores if low- and high-risk industries are empirically
consistent with the DAPM. An important distinction is the division between low- and high-
risk industries where low-risk industries are labelled as industries where demand will by
stable overtime, even in a downturn economy or scarcity (e.g. health care) (Wilson, 1999).
High-risk industries are labelled as pro-cyclical and sensitive to the conditions of the market
(e.g. luxurious companies) (ibid). The beta is used as an indicator of the industry’s riskiness
and is derived by using the DAPM. This DAPM (Zou, 2005) advances the CAPM because it
makes a distinction between the upper- and lower-state of the market. Therefore, the beta of
the firm (industry) can be divided into a beta when the market is in an economic downturn
and a beta when the market is in an economic upturn. Overall, the thesis uses the DAPM to
derive the upper-beta and lower-beta for low-risk and high-risk industries.
From this thesis we learn that rational investors should be indifferent between investing in
low-beta or high-beta industries. Investors could achieve the same returns from a portfolio of
solely low-beta stocks as they expect to generate when investing in high-beta industries, this
is achieved by borrowing money. However, because investors are not rational and the
borrowing rate is not constant overtime, they do not like to invest in low-beta industries
because borrowing money in itself adds additional risk. Results also show that low-beta
industries are more or less consistent with the DAPM (Δβ ≈ 0 or Δβ > 0). High-beta industries
show some deviations (i.e. negative Δβ for most inconsistent industries) but the results are not
statistically significant to reject.
The second part of this thesis tries to explain why inconsistent high-beta industries have
higher betas in the lower-state and lower betas in the upper-state (i.e. negative Δβ). Reasons
for a negative Δβ across high-beta industries can be found in behavioral finance and the
transaction cost theory. Arguments from concepts like loss-aversion, bounded rationality,
future prospects, and overconfident investors are explaining the results from a behavioral
point of view. The results also confirm a decrease in transaction costs and the presence of
high frequency traders, where high frequency traders function as market-makers. This thesis
is just a start to explain this irregularity, further research should explore these arguments more
in depth.
29

These findings have some important implications; first, it shows that the DAPM (as also holds
for the CAPM) does not incorporate irrational behavior of investors and therefore, does not
fully predict the movements of the market. However, the DAPM is a consistent model which
is a useful tool for investors to get some sense of investment decisions and portfolios.
Furthermore, this research highlights the importance of diversification. Holding several stocks
across industries reduces market risk for investors, this way, investors can reduce risk by
adding more stocks from low-beta industries but can increase risk (and thus expected return)
by adding stocks from high-beta industries. This thesis gives a clear indication about creating
diversified investment by investing in different industries according to the preference of the
investor.
Overall, the DAPM is useful for investor when assessing their portfolio and changing the
risk/return relationship of that portfolio. Assuming that investors are rational, the model can
give a clear prediction of the market. However, results confirm that the assumption about full
rational behavior is not representing reality. Behavioral finance gives some clear arguments
why the prediction according to the DAPM does not corresponds with the actual risk/return
relationship. Lastly, further development of the DAPM should incorporate transaction costs to
give a more accurate and rational picture of the market.
30

Appendix I Industry Sub Name
1 2833 MEDICINAL CHEMICALS & BOTANICAL PRODUCTS
1 2834 PHARMACEUTICAL PREPARATIONS
1 2835 IN VITRO & IN VIVO DIAGNOSTIC SUBSTANCES
1 2836 BIOLOGICAL PRODUCTS, (NO DISGNOSTIC SUBSTANCES)
1 5912 RETAIL-DRUG STORES AND PROPRIETARY STORES
1 6311 LIFE INSURANCE
1 6321 ACCIDENT & HEALTH INSURANCE
1 6324 HOSPITAL & MEDICAL SERVICE PLANS
1 6331 FIRE, MARINE & CASUALTY INSURANCE
1 6351 SURETY INSURANCE
1 6361 TITLE INSURANCE
1 6399 INSURANCE CARRIERS, NEC
1 6411 INSURANCE AGENTS, BROKERS & SERVICE
1 8011 SERVICES-OFFICES & CLINICS OF DOCTORS OF MEDICINE
1 8060 SERVICES-HOSPITALS
1 8062 SERVICES-GENERAL MEDICAL & SURGICAL HOSPITALS, NEC
1 8093 SERVICES-SPECIALTY OUTPATIENT FACILITIES, NEC
1 8731 SERVICES-COMMERCIAL PHYSICAL & BIOLOGICAL RESEARCH
2 2200 TEXTILE MILL PRODUCTS
2 2211 BROADWOVEN FABRIC MILLS, COTTON
2 2221 BROADWOVEN FABRIC MILLS, MAN MADE FIBER & SILK
2 2250 KNITTING MILLS
2 2273 CARPETS & RUGS
2 3873 WATCHES, CLOCKS, CLOCKWORK OPERATED DEVICES/PARTS
2 3910 JEWELRY, SILVERWARE & PLATED WARE
2 3911 JEWELRY, PRECIOUS METAL
2 4900 ELECTRIC, GAS & SANITARY SERVICES
2 4911 ELECTRIC SERVICES
2 4922 NATURAL GAS TRANSMISSION
2 4923 NATURAL GAS TRANSMISISON & DISTRIBUTION
2 4924 NATURAL GAS DISTRIBUTION
2 4931 ELECTRIC & OTHER SERVICES COMBINED
2 4932 GAS & OTHER SERVICES COMBINED
2 4941 WATER SUPPLY
2 4961 STEAM & AIR-CONDITIONING SUPPLY
2 4991 COGENERATION SERVICES & SMALL POWER PRODUCERS
2 5000 WHOLESALE-DURABLE GOODS
2 5020 WHOLESALE-FURNITURE & HOME FURNISHINGS
31

2 5040 WHOLESALE-PROFESSIONAL & COMMERCIAL EQUIPMENT & SUPPLIES
2 5090 WHOLESALE-MISC DURABLE GOODS
2 5094 WHOLESALE-JEWELRY, WATCHES, PRECIOUS STONES & METALS
2 5099 WHOLESALE-DURABLE GOODS, NEC
2 5140 WHOLESALE-GROCERIES & RELATED PRODUCTS
2 5141 WHOLESALE-GROCERIES, GENERAL LINE
2 5190 WHOLESALE-MISCELLANEOUS NONDURABLE GOODS
2 5271 RETAIL-MOBILE HOME DEALERS
2 5311 RETAIL-DEPARTMENT STORES
2 5331 RETAIL-VARIETY STORES
2 5399 RETAIL-MISC GENERAL MERCHANDISE STORES
2 5400 RETAIL-FOOD STORES
2 5411 RETAIL-GROCERY STORES
2 5412 RETAIL-CONVENIENCE STORES
2 5500 RETAIL-AUTO DEALERS & GASOLINE STATIONS
2 5531 RETAIL-AUTO & HOME SUPPLY STORES
2 5700 RETAIL-HOME FURNITURE, FURNISHINGS & EQUIPMENT STORES
2 5712 RETAIL-FURNITURE STORES
2 5731 RETAIL-RADIO, TV & CONSUMER ELECTRONICS STORES
2 5734 RETAIL-COMPUTER & COMPUTER SOFTWARE STORES
2 5735 RETAIL-RECORD & PRERECORDED TAPE STORES
2 5900 RETAIL-MISCELLANEOUS RETAIL
2 5940 RETAIL-MISCELLANEOUS SHOPPING GOODS STORES
2 5944 RETAIL-JEWELRY STORES
2 5945 RETAIL-HOBBY, TOY & GAME SHOPS
2 5960 RETAIL-NONSTORE RETAILERS
2 5961 RETAIL-CATALOG & MAIL-ORDER HOUSES
2 5990 RETAIL-RETAIL STORES, NEC
2 & 3 7389 SERVICES-BUSINESS SERVICES, NEC
3 3570 COMPUTER & OFFICE EQUIPMENT
3 3571 ELECTRONIC COMPUTERS
3 3572 COMPUTER STORAGE DEVICES
3 3575 COMPUTER TERMINALS
3 3576 COMPUTER COMMUNICATIONS EQUIPMENT
3 3577 COMPUTER PERIPHERAL EQUIPMENT, NEC
3 3578 CALCULATING & ACCOUNTING MACHINES (NO ELECTRONIC COMPUTERS)
3 3579 OFFICE MACHINES, NEC
3 3672 PRINTED CIRCUIT BOARDS
3 5045 WHOLESALE-COMPUTERS & PERIPHERAL EQUIPMENT & SOFTWARE
3 6794 PATENT OWNERS & LESSORS
3 7370 SERVICES-COMPUTER PROGRAMMING, DATA PROCESSING, ETC.
3 7371 SERVICES-COMPUTER PROGRAMMING SERVICES
3 7372 SERVICES-PREPACKAGED SOFTWARE
3 7373 SERVICES-COMPUTER INTEGRATED SYSTEMS DESIGN
32

3 7374 SERVICES-COMPUTER PROCESSING & DATA PREPARATION
3 7377 SERVICES-COMPUTER RENTAL & LEASING
4 1311 CRUDE PETROLEUM & NATURAL GAS
4 1381 DRILLING OIL & GAS WELLS
4 1382 OIL & GAS FIELD EXPLORATION SERVICES
4 1389 OIL & GAS FIELD SERVICES, NEC
4 2000 FOOD AND KINDRED PRODUCTS
4 2020 DAIRY PRODUCTS
4 2024 ICE CREAM & FROZEN DESSERTS
4 2030 CANNED, FROZEN & PRESERVD FRUIT, VEG & FOOD SPECIALTIES
4 2033 CANNED, FRUITS, VEG, PRESERVES, JAMS & JELLIES
4 2040 GRAIN MILL PRODUCTS
4 2050 BAKERY PRODUCTS
4 2052 COOKIES & CRACKERS
4 2060 SUGAR & CONFECTIONERY PRODUCTS
4 2070 FATS & OILS
4 2090 MISCELLANEOUS FOOD PREPARATIONS & KINDRED PRODUCTS
4 2092 PREPARED FRESH OR FROZEN FISH & SEAFOODS
4 2600 PAPERS & ALLIED PRODUCTS
4 2611 PULP MILLS
4 2621 PAPER MILLS
4 2631 PAPERBOARD MILLS
4 2650 PAPERBOARD CONTAINERS & BOXES
4 2670 CONVERTED PAPER & PAPERBOARD PRODS (NO CONTANERS/BOXES)
4 2911 PETROLEUM REFINING
4 3533 OIL & GAS FIELD MACHINERY & EQUIPMENT
4 4610 PIPE LINES (NO NATURAL GAS)
4 5110 WHOLESALE-PAPER & PAPER PRODUCTS
4 5171 WHOLESALE-PETROLEUM BULK STATIONS & TERMINALS
4 5172 WHOLESALE-PETROLEUM & PETROLEUM PRODUCTS (NO BULK STATIONS)
4 6792 OIL ROYALTY TRADERS
5 100 AGRICULTURAL PRODUCTION-CROPS
5 200 AGRICULTURAL PROD-LIVESTOCK & ANIMAL SPECIALTIES
5 700 AGRICULTURAL SERVICES
5 800 FORESTRY
5 900 FISHING, HUNTING AND TRAPPING
5 2011 MEAT PACKING PLANTS
5 2013 SAUSAGES & OTHER PREPARED MEAT PRODUCTS
5 2015 POULTRY SLAUGHTERING AND PROCESSING
5 2100 TOBACCO PRODUCTS
5 2111 CIGARETTES
5 2711 NEWSPAPERS: PUBLISHING OR PUBLISHING & PRINTING
5 2721 PERIODICALS: PUBLISHING OR PUBLISHING & PRINTING
5 2731 BOOKS: PUBLISHING OR PUBLISHING & PRINTING
33

5 2732 BOOK PRINTING
5 2741 MISCELLANEOUS PUBLISHING
5 2750 COMMERCIAL PRINTING
5 2761 MANIFOLD BUSINESS FORMS
5 2771 GREETING CARDS
5 2780 BLANKBOOKS, LOOSELEAF BINDERS & BOOKBINDG & RELATD WORK
5 2790 SERVICE INDUSTRIES FOR THE PRINTING TRADE
5 2870 AGRICULTURAL CHEMICALS
5 3711 MOTOR VEHICLES & PASSENGER CAR BODIES
5 3713 TRUCK & BUS BODIES
5 3714 MOTOR VEHICLE PARTS & ACCESSORIES
5 3715 TRUCK TRAILERS
5 3716 MOTOR HOMES
5 3720 AIRCRAFT & PARTS
5 3721 AIRCRAFT
5 3724 AIRCRAFT ENGINES & ENGINE PARTS
5 3728 AIRCRAFT PARTS & AUXILIARY EQUIPMENT, NEC
5 3730 SHIP & BOAT BUILDING & REPAIRING
5 3743 RAILROAD EQUIPMENT
5 3751 MOTORCYCLES, BICYCLES & PARTS
5 3760 GUIDED MISSILES & SPACE VEHICLES & PARTS
5 3790 MISCELLANEOUS TRANSPORTATION EQUIPMENT
5 3812 SEARCH, DETECTION, NAVAGATION, GUIDANCE, AERONAUTICAL SYS
5 3931 MUSICAL INSTRUMENTS
5 3942 DOLLS & STUFFED TOYS
5 3944 GAMES, TOYS & CHILDREN'S VEHICLES (NO DOLLS & BICYCLES)
5 3949 SPORTING & ATHLETIC GOODS, NEC
5 4011 RAILROADS, LINE-HAUL OPERATING
5 4013 RAILROAD SWITCHING & TERMINAL ESTABLISHMENTS
5 4100 LOCAL & SUBURBAN TRANSIT & INTERURBAN HWY PASSENGER TRANS
5 4210 TRUCKING & COURIER SERVICES (NO AIR)
5 4213 TRUCKING (NO LOCAL)
5 4220 PUBLIC WAREHOUSING & STORAGE
5 4231 TERMINAL MAINTENANCE FACILITIES FOR MOTOR FREIGHT TRANSPORT
5 4400 WATER TRANSPORTATION
5 4412 DEEP SEA FOREIGN TRANSPORTATION OF FREIGHT
5 4512 AIR TRANSPORTATION, SCHEDULED
5 4513 AIR COURIER SERVICES
5 4522 AIR TRANSPORTATION, NONSCHEDULED
5 4581 AIRPORTS, FLYING FIELDS & AIRPORT TERMINAL SERVICES
5 4700 TRANSPORTATION SERVICES
5 4731 ARRANGEMENT OF TRANSPORTATION OF FREIGHT & CARGO
5 5010 WHOLESALE-MOTOR VEHICLES & MOTOR VEHICLE PARTS & SUPPLIES
5 5013 WHOLESALE-MOTOR VEHICLE SUPPLIES & NEW PARTS
34

5 5050 WHOLESALE-METALS & MINERALS (NO PETROLEUM)
5 5051 WHOLESALE-METALS SERVICE CENTERS & OFFICES
5 5150 WHOLESALE-FARM PRODUCT RAW MATERIALS
5 5810 RETAIL-EATING & DRINKING PLACES
5 5812 RETAIL-EATING PLACES
5 7500 SERVICES-AUTOMOTIVE REPAIR, SERVICES & PARKING
5 7510 SERVICES-AUTO RENTAL & LEASING (NO DRIVERS)
5 7812 SERVICES-MOTION PICTURE & VIDEO TAPE PRODUCTION
5 7819 SERVICES-ALLIED TO MOTION PICTURE PRODUCTION
5 7822 SERVICES-MOTION PICTURE & VIDEO TAPE DISTRIBUTION
5 7829 SERVICES-ALLIED TO MOTION PICTURE DISTRIBUTION
5 7830 SERVICES-MOTION PICTURE THEATERS
5 7841 SERVICES-VIDEO TAPE RENTAL
5 7900 SERVICES-AMUSEMENT & RECREATION SERVICES
5 7948 SERVICES-RACING, INCLUDING TRACK OPERATION
5 7990 SERVICES-MISCELLANEOUS AMUSEMENT & RECREATION
5 7997 SERVICES-MEMBERSHIP SPORTS & RECREATION CLUBS
5 8600 SERVICES-MEMBERSHIP ORGANIZATIONS
6 1520 GENERAL BLDG CONTRACTORS - RESIDENTIAL BLDGS
6 1531 OPERATIVE BUILDERS
6 1540 GENERAL BLDG CONTRACTORS - NONRESIDENTIAL BLDGS
6 1600 HEAVY CONSTRUCTION OTHER THAN BLDG CONST - CONTRACTORS
6 1623 WATER, SEWER, PIPELINE, COMM & POWER LINE CONSTRUCTION
6 1700 CONSTRUCTION - SPECIAL TRADE CONTRACTORS
6 1731 ELECTRICAL WORK
6 2400 LUMBER & WOOD PRODUCTS (NO FURNITURE)
6 2421 SAWMILLS & PLANTING MILLS, GENERAL
6 2430 MILLWOOD, VENEER, PLYWOOD, & STRUCTURAL WOOD MEMBERS
6 2451 MOBILE HOMES
6 2452 PREFABRICATED WOOD BLDGS & COMPONENTS
6 2510 HOUSEHOLD FURNITURE
6 2511 WOOD HOUSEHOLD FURNITURE, (NO UPHOLSTERED)
6 2520 OFFICE FURNITURE
6 2522 OFFICE FURNITURE (NO WOOD)
6 2531 PUBLIC BLDG & RELATED FURNITURE
6 2540 PARTITIONS, SHELVG, LOCKERS, & OFFICE & STORE FIXTURES
6 2590 MISCELLANEOUS FURNITURE & FIXTURES
6 2673 PLASTICS, FOIL & COATED PAPER BAGS
6 2800 CHEMICALS & ALLIED PRODUCTS
6 2810 INDUSTRIAL INORGANIC CHEMICALS
6 2820 PLASTIC MATERIAL, SYNTH RESIN/RUBBER, CELLULOS (NO GLASS)
6 2821 PLASTIC MATERIALS, SYNTH RESINS & NONVULCAN ELASTOMERS
6 2840 SOAP, DETERGENTS, CLEANG PREPARATIONS, PERFUMES, COSMETICS
6 2842 SPECIALTY CLEANING, POLISHING AND SANITATION PREPARATIONS
35

6 2844 PERFUMES, COSMETICS & OTHER TOILET PREPARATIONS
6 2851 PAINTS, VARNISHES, LACQUERS, ENAMELS & ALLIED PRODS
6 2860 INDUSTRIAL ORGANIC CHEMICALS
6 2890 MISCELLANEOUS CHEMICAL PRODUCTS
6 2891 ADHESIVES & SEALANTS
6 2950 ASPHALT PAVING & ROOFING MATERIALS
6 2990 MISCELLANEOUS PRODUCTS OF PETROLEUM & COAL
6 3011 TIRES & INNER TUBES
6 3021 RUBBER & PLASTICS FOOTWEAR
6 3050 GASKETS, PACKG & SEALG DEVICES & RUBBER & PLASTICS HOSE
6 3060 FABRICATED RUBBER PRODUCTS, NEC
6 3080 MISCELLANEOUS PLASTICS PRODUCTS
6 3081 UNSUPPORTED PLASTICS FILM & SHEET
6 3086 PLASTICS FOAM PRODUCTS
6 3089 PLASTICS PRODUCTS, NEC
6 3211 FLAT GLASS
6 3220 GLASS & GLASSWARE, PRESSED OR BLOWN
6 3221 GLASS CONTAINERS
6 3231 GLASS PRODUCTS, MADE OF PURCHASED GLASS
6 3241 CEMENT, HYDRAULIC
6 3250 STRUCTURAL CLAY PRODUCTS
6 3260 POTTERY & RELATED PRODUCTS
6 3270 CONCRETE, GYPSUM & PLASTER PRODUCTS
6 3272 CONCRETE PRODUCTS, EXCEPT BLOCK & BRICK
6 3281 CUT STONE & STONE PRODUCTS
6 3290 ABRASIVE, ASBESTOS & MISC NONMETALLIC MINERAL PRODS
6 3310 STEEL WORKS, BLAST FURNACES & ROLLING & FINISHING MILLS
6 3312 STEEL WORKS, BLAST FURNACES & ROLLING MILLS (COKE OVENS)
6 3317 STEEL PIPE & TUBES
6 3320 IRON & STEEL FOUNDRIES
6 3341 SECONDARY SMELTING & REFINING OF NONFERROUS METALS
6 3350 ROLLING DRAWING & EXTRUDING OF NONFERROUS METALS
6 3357 DRAWING & INSULATING OF NONFERROUS WIRE
6 3360 NONFERROUS FOUNDRIES (CASTINGS)
6 3390 MISCELLANEOUS PRIMARY METAL PRODUCTS
6 3411 METAL CANS
6 3412 METAL SHIPPING BARRELS, DRUMS, KEGS & PAILS
6 3420 CUTLERY, HANDTOOLS & GENERAL HARDWARE
6 3430 HEARING EQUIP, EXCEPT ELEC & WARM AIR; & PLUMBING FIXTURES
6 3433 HEATING EQUIPMENT, EXCEPT ELECTRIC & WARM AIR FURNACES
6 3440 FABRICATED STRUCTURAL METAL PRODUCTS
6 3442 METAL DOORS, SASH, FRAMES, MOLDINGS & TRIM
6 3443 FABRICATED PLATE WORK (BOILER SHOPS)
6 3444 SHEET METAL WORK
36

6 3448 PREFABRICATED METAL BUILDINGS & COMPONENTS
6 3451 SCREW MACHINE PRODUCTS
6 3452 BOLTS, NUTS, SCREWS, RIVETS & WASHERS
6 3460 METAL FORGINGS & STAMPINGS
6 3470 COATING, ENGRAVING & ALLIED SERVICES
6 3480 ORDNANCE & ACCESSORIES, (NO VEHICLES/GUIDED MISSILES)
6 3490 MISCELLANEOUS FABRICATED METAL PRODUCTS
6 3562 BALL & ROLLER BEARINGS
6 3564 INDUSTRIAL & COMMERCIAL FANS & BLOWERS & AIR PURIFING EQUIP
6 3567 INDUSTRIAL PROCESS FURNACES & OVENS
6 3569 GENERAL INDUSTRIAL MACHINERY & EQUIPMENT, NEC
6 3580 REFRIGERATION & SERVICE INDUSTRY MACHINERY
6 3585 AIR-COND & WARM AIR HEATG EQUIP & COMM & INDL REFRIG EQUIP
6 3590 MISC INDUSTRIAL & COMMERCIAL MACHINERY & EQUIPMENT
6 3960 COSTUME JEWELRY & NOVELTIES
6 3990 MISCELLANEOUS MANUFACTURING INDUSTRIES
6 4950 SANITARY SERVICES
6 4953 REFUSE SYSTEMS
6 4955 HAZARDOUS WASTE MANAGEMENT
6 5030 WHOLESALE-LUMBER & OTHER CONSTRUCTION MATERIALS
6 5031 WHOLESALE-LUMBER, PLYWOOD, MILLWORK & WOOD PANELS
6 5070 WHOLESALE-HARDWARE & PLUMBING & HEATING EQUIPMENT & SUPPLIES
6 5072 WHOLESALE-HARDWARE
6 5080 WHOLESALE-MACHINERY, EQUIPMENT & SUPPLIES
6 5082 WHOLESALE-CONSTRUCTION & MINING (NO PETRO) MACHINERY & EQUIP
6 5084 WHOLESALE-INDUSTRIAL MACHINERY & EQUIPMENT
6 5160 WHOLESALE-CHEMICALS & ALLIED PRODUCTS
6 5200 RETAIL-BUILDING MATERIALS, HARDWARE, GARDEN SUPPLY
6 5211 RETAIL-LUMBER & OTHER BUILDING MATERIALS DEALERS
6 7350 SERVICES-MISCELLANEOUS EQUIPMENT RENTAL & LEASING
6 7359 SERVICES-EQUIPMENT RENTAL & LEASING, NEC
6 8700 SERVICES-ENGINEERING, ACCOUNTING, RESEARCH, MANAGEMENT
6 8711 SERVICES-ENGINEERING SERVICES
6 8744 SERVICES-FACILITIES SUPPORT MANAGEMENT SERVICES
7 6021 NATIONAL COMMERCIAL BANKS
7 6022 STATE COMMERCIAL BANKS
7 6035 SAVINGS INSTITUTION, FEDERALLY CHARTERED
7 6036 SAVINGS INSTITUTIONS, NOT FEDERALLY CHARTERED
7 6099 FUNCTIONS RELATED TO DEPOSITORY BANKING, NEC
7 6141 PERSONAL CREDIT INSTITUTIONS
7 6153 SHORT-TERM BUSINESS CREDIT INSTITUTIONS
7 6159 MISCELLANEOUS BUSINESS CREDIT INSTITUTION
7 6162 MORTGAGE BANKERS & LOAN CORRESPONDENTS
7 6163 LOAN BROKERS
37

7 6172 FINANCE LESSORS
7 6199 FINANCE SERVICES
7 & 12 6029 COMMERCIAL BANKS, NEC
8 6200 SECURITY & COMMODITY BROKERS, DEALERS, EXCHANGES & SERVICES
8 6221 COMMODITY CONTRACTS BROKERS & DEALERS
8 6500 REAL ESTATE
8 6510 REAL ESTATE OPERATORS (NO DEVELOPERS) & LESSORS
8 6512 OPERATORS OF NONRESIDENTIAL BUILDINGS
8 6513 OPERATORS OF APARTMENT BUILDINGS
8 6519 LESSORS OF REAL PROPERTY, NEC
8 6531 REAL ESTATE AGENTS & MANAGERS (FOR OTHERS)
8 6532 REAL ESTATE DEALERS (FOR THEIR OWN ACCOUNT)
8 6552 LAND SUBDIVIDERS & DEVELOPERS (NO CEMETERIES)
8 6798 REAL ESTATE INVESTMENT TRUSTS
8 6799 INVESTORS, NEC
8 7000 HOTELS, ROOMING HOUSES, CAMPS & OTHER LODGING PLACES
8 7011 HOTELS & MOTELS
8 7340 SERVICES-TO DWELLINGS & OTHER BUILDINGS
8 7361 SERVICES-EMPLOYMENT AGENCIES
8 8741 SERVICES-MANAGEMENT SERVICES
8 8742 SERVICES-MANAGEMENT CONSULTING SERVICES
9 1000 METAL MINING
9 1040 GOLD AND SILVER ORES
9 1090 MISCELLANEOUS METAL ORES
9 1220 BITUMINOUS COAL & LIGNITE MINING
9 1221 BITUMINOUS COAL & LIGNITE SURFACE MINING
9 1400 MINING & QUARRYING OF NONMETALLIC MINERALS (NO FUELS)
9 2080 BEVERAGES
9 2082 MALT BEVERAGES
9 2086 BOTTLED & CANNED SOFT DRINKS & CARBONATED WATERS
9 2253 KNIT OUTERWEAR MILLS
9 2300 APPAREL & OTHER FINISHD PRODS OF FABRICS & SIMILAR MATL
9 2320 MEN'S & BOYS' FURNISHGS, WORK CLOTHG, & ALLIED GARMENTS
9 2330 WOMEN'S, MISSES', AND JUNIORS OUTERWEAR
9 2340 WOMEN'S, MISSES', CHILDREN'S & INFANTS' UNDERGARMENTS
9 2390 MISCELLANEOUS FABRICATED TEXTILE PRODUCTS
9 3100 LEATHER & LEATHER PRODUCTS
9 3140 FOOTWEAR, (NO RUBBER)
9 3330 PRIMARY SMELTING & REFINING OF NONFERROUS METALS
9 3334 PRIMARY PRODUCTION OF ALUMINUM
9 3950 PENS, PENCILS & OTHER ARTISTS' MATERIALS
9 5047 WHOLESALE-MEDICAL, DENTAL & HOSPITAL EQUIPMENT & SUPPLIES
9 5122 WHOLESALE-DRUGS, PROPRIETARIES & DRUGGISTS' SUNDRIES
9 5130 WHOLESALE-APPAREL, PIECE GOODS & NOTIONS
38

9 5180 WHOLESALE-BEER, WINE & DISTILLED ALCOHOLIC BEVERAGES
9 5600 RETAIL-APPAREL & ACCESSORY STORES
9 5621 RETAIL-WOMEN'S CLOTHING STORES
9 5651 RETAIL-FAMILY CLOTHING STORES
9 5661 RETAIL-SHOE STORES
9 6795 MINERAL ROYALTY TRADERS
9 8000 SERVICES-HEALTH SERVICES
9 8071 SERVICES-MEDICAL LABORATORIES
9 8082 SERVICES-HOME HEALTH CARE SERVICES
9 8090 SERVICES-MISC HEALTH & ALLIED SERVICES, NEC
9 8300 SERVICES-SOCIAL SERVICES
9 8351 SERVICES-CHILD DAY CARE SERVICES
9 8734 SERVICES-TESTING LABORATORIES
10 3510 ENGINES & TURBINES
10 3523 FARM MACHINERY & EQUIPMENT
10 3524 LAWN & GARDEN TRACTORS & HOME LAWN & GARDENS EQUIP
10 3530 CONSTRUCTION, MINING & MATERIALS HANDLING MACHINERY & EQUIP
10 3531 CONSTRUCTION MACHINERY & EQUIP
10 3532 MINING MACHINERY & EQUIP (NO OIL & GAS FIELD MACH & EQUIP)
10 3537 INDUSTRIAL TRUCKS, TRACTORS, TRAILORS & STACKERS
10 3540 METALWORKG MACHINERY & EQUIPMENT
10 3541 MACHINE TOOLS, METAL CUTTING TYPES
10 3550 SPECIAL INDUSTRY MACHINERY (NO METALWORKING MACHINERY)
10 3555 PRINTING TRADES MACHINERY & EQUIPMENT
10 3559 SPECIAL INDUSTRY MACHINERY, NEC
10 3560 GENERAL INDUSTRIAL MACHINERY & EQUIPMENT
10 3561 PUMPS & PUMPING EQUIPMENT
10 3600 ELECTRONIC & OTHER ELECTRICAL EQUIPMENT (NO COMPUTER EQUIP)
10 3612 POWER, DISTRIBUTION & SPECIALTY TRANSFORMERS
10 3613 SWITCHGEAR & SWITCHBOARD APPARATUS
10 3620 ELECTRICAL INDUSTRIAL APPARATUS
10 3621 MOTORS & GENERATORS
10 3670 ELECTRONIC COMPONENTS & ACCESSORIES
10 3674 SEMICONDUCTORS & RELATED DEVICES
10 3677 ELECTRONIC COILS, TRANSFORMERS & OTHER INDUCTORS
10 3678 ELECTRONIC CONNECTORS
10 3679 ELECTRONIC COMPONENTS, NEC
10 3690 MISCELLANEOUS ELECTRICAL MACHINERY, EQUIPMENT & SUPPLIES
10 3821 LABORATORY APPARATUS & FURNITURE
10 3822 AUTO CONTROLS FOR REGULATING RESIDENTIAL & COMML ENVIRONMENTS
10 3823 INDUSTRIAL INSTRUMENTS FOR MEASUREMENT, DISPLAY, AND CONTROL
10 3824 TOTALIZING FLUID METERS & COUNTING DEVICES
10 3825 INSTRUMENTS FOR MEAS & TESTING OF ELECTRICITY & ELEC SIGNALS
10 3826 LABORATORY ANALYTICAL INSTRUMENTS
39

10 3827 OPTICAL INSTRUMENTS & LENSES
10 3829 MEASURING & CONTROLLING DEVICES, NEC
10 3841 SURGICAL & MEDICAL INSTRUMENTS & APPARATUS
10 3842 ORTHOPEDIC, PROSTHETIC & SURGICAL APPLIANCES & SUPPLIES
10 3843 DENTAL EQUIPMENT & SUPPLIES
10 3844 X-RAY APPARATUS & TUBES & RELATED IRRADIATION APPARATUS
10 3845 ELECTROMEDICAL & ELECTROTHERAPEUTIC APPARATUS
10 3851 OPHTHALMIC GOODS
10 3861 PHOTOGRAPHIC EQUIPMENT & SUPPLIES
10 5063 WHOLESALE-ELECTRICAL APPARATUS & EQUIPMENT, WIRING SUPPLIES
10 5064 WHOLESALE-ELECTRICAL APPLIANCES, TV & RADIO SETS
10 5065 WHOLESALE-ELECTRONIC PARTS & EQUIPMENT, NEC
11 3630 HOUSEHOLD APPLIANCES
11 3634 ELECTRIC HOUSEWARES & FANS
11 3640 ELECTRIC LIGHTING & WIRING EQUIPMENT
11 3651 HOUSEHOLD AUDIO & VIDEO EQUIPMENT
11 3652 PHONOGRAPH RECORDS & PRERECORDED AUDIO TAPES & DISKS
11 3661 TELEPHONE & TELEGRAPH APPARATUS
11 3663 RADIO & TV BROADCASTING & COMMUNICATIONS EQUIPMENT
11 3669 COMMUNICATIONS EQUIPMENT, NEC
11 3695 MAGNETIC & OPTICAL RECORDING MEDIA
11 4812 RADIOTELEPHONE COMMUNICATIONS
11 4813 TELEPHONE COMMUNICATIONS (NO RADIOTELEPHONE)
11 4822 TELEGRAPH & OTHER MESSAGE COMMUNICATIONS
11 4832 RADIO BROADCASTING STATIONS
11 4833 TELEVISION BROADCASTING STATIONS
11 4841 CABLE & OTHER PAY TELEVISION SERVICES
11 4899 COMMUNICATIONS SERVICES, NEC
11 7200 SERVICES-PERSONAL SERVICES
11 7310 SERVICES-ADVERTISING
11 7311 SERVICES-ADVERTISING AGENCIES
11 7320 SERVICES-CONSUMER CREDIT REPORTING, COLLECTION AGENCIES
11 7330 SERVICES-MAILING, REPRODUCTION, COMMERCIAL ART & PHOTOGRAPHY
11 7331 SERVICES-DIRECT MAIL ADVERTISING SERVICES
11 7363 SERVICES-HELP SUPPLY SERVICES
11 7380 SERVICES-MISCELLANEOUS BUSINESS SERVICES
11 7381 SERVICES-DETECTIVE, GUARD & ARMORED CAR SERVICES
11 7384 SERVICES-PHOTOFINISHING LABORATORIES
11 7385 SERVICES-TELEPHONE INTERCONNECT SYSTEMS
11 7600 SERVICES-MISCELLANEOUS REPAIR SERVICES
11 8050 SERVICES-NURSING & PERSONAL CARE FACILITIES
11 8051 SERVICES-SKILLED NURSING CARE FACILITIES
11 8111 SERVICES-LEGAL SERVICES
11 8200 SERVICES-EDUCATIONAL SERVICES
40

11 8900 SERVICES-SERVICES, NEC
12 6111 FEDERAL & FEDERALLY-SPONSORED CREDIT AGENCIES
12 6211 SECURITY BROKERS, DEALERS & FLOTATION COMPANIES
12 6282 INVESTMENT ADVICE
99 8880 AMERICAN DEPOSITARY RECEIPTS
99 8888 FOREIGN GOVERNMENTS
99 9721 INTERNATIONAL AFFAIRS
All 6770 BLANK CHECKS
All 9995 NON-OPERATING ESTABLISHMENTS
OSF 6189 ASSET-BACKED SECURITIES
41

Appendix II 1 Food Food Products 0100-0199 Agric production - crops 0200-0299 Agric production - livestock 0700-0799 Agricultural services 0910-0919 Commercial fishing 2000-2009 Food and kindred products 2010-2019 Meat products 2020-2029 Dairy products 2030-2039 Canned-preserved fruits-vegs 2040-2046 Flour and other grain mill products 2048-2048 Prepared feeds for animals 2050-2059 Bakery products 2060-2063 Sugar and confectionery products 2064-2068 Candy and other confectionery 2070-2079 Fats and oils 2086-2086 Bottled-canned soft drinks 2087-2087 Flavoring syrup 2090-2092 Misc food preps 2095-2095 Roasted coffee 2096-2096 Potato chips 2097-2097 Manufactured ice 2098-2099 Misc food preparations 2 Beer Beer & Liquor 2080-2080 Beverages 2082-2082 Malt beverages 2083-2083 Malt 2084-2084 Wine 2085-2085 Distilled and blended liquors 3 Smoke Tobacco Products 2100-2199 Tobacco products 4 Games Recreation 0920-0999 Fishing, hunting & trapping 3650-3651 Household audio visual equip 3652-3652 Phonographic records 3732-3732 Boat building and repair 3930-3931 Musical instruments 3940-3949 Toys 7800-7829 Services - motion picture production and distribution 7830-7833 Services - motion picture theatres 7840-7841 Services - video rental 7900-7900 Services - amusement and recreation 7910-7911 Services - dance studios 7920-7929 Services - bands, entertainers 7930-7933 Services - bowling centers 7940-7949 Services - professional sports
42

7980-7980 Amusement and recreation services (?) 7990-7999 Services - misc entertainment 5 Books Printing and Publishing 2700-2709 Printing publishing and allied 2710-2719 Newspapers: publishing-printing 2720-2729 Periodicals: publishing-printing 2730-2739 Books: publishing-printing 2740-2749 Misc publishing 2750-2759 Commercial printing 2770-2771 Greeting card publishing 2780-2789 Book binding 2790-2799 Service industries for print trade 3993-3993 Signs, advertising specialty 6 Hshld Consumer Goods 2047-2047 Dog and cat food 2391-2392 Curtains, home furnishings 2510-2519 Household furniture 2590-2599 Misc furniture and fixtures 2840-2843 Soap & other detergents 2844-2844 Perfumes cosmetics 3160-3161 Luggage 3170-3171 Handbags and purses 3172-3172 Personal leather goods, except handbags 3190-3199 Leather goods 3229-3229 Pressed and blown glass 3260-3260 Pottery and related products 3262-3263 China and earthenware table articles 3269-3269 Pottery products 3230-3231 Glass products 3630-3639 Household appliances 3750-3751 Motorcycles, bicycles and parts (Harley & Huffy) 3800-3800 Misc inst, photo goods, watches 3860-3861 Photographic equip (Kodak etc, but also Xerox) 3870-3873 Watches clocks and parts 3910-3911 Jewelry-precious metals 3914-3914 Silverware 3915-3915 Jewelers' findings, materials 3960-3962 Costume jewelry and notions 3991-3991 Brooms and brushes 3995-3995 Burial caskets 7 Clths Apparel 2300-2390 Apparel and other finished products 3020-3021 Rubber and plastics footwear 3100-3111 Leather tanning and finishing 3130-3131 Boot, shoe cut stock, findings 3140-3149 Footware except rubber 3150-3151 Leather gloves and mittens 3963-3965 Fasteners, buttons, needles, pins 8 Hlth Healthcare, Medical Equipment, Pharmaceutical Products 2830-2830 Drugs 2831-2831 Biological products 2833-2833 Medicinal chemicals
43

2834-2834 Pharmaceutical preparations 2835-2835 In vitro, in vivo diagnostics 2836-2836 Biological products, except diagnostics 3693-3693 X-ray, electromedical app 3840-3849 Surg & med instru 3850-3851 Ophthalmic goods 8000-8099 Services - health 9 Chems Chemicals 2800-2809 Chemicals and allied products 2810-2819 Industrial inorganical chems 2820-2829 Plastic material & synthetic resin 2850-2859 Paints 2860-2869 Industrial organic chems 2870-2879 Agriculture chemicals 2890-2899 Misc chemical products 10 Txtls Textiles 2200-2269 Textile mill products 2270-2279 Floor covering mills 2280-2284 Yarn and thread mills 2290-2295 Misc textile goods 2297-2297 Nonwoven fabrics 2298-2298 Cordage and twine 2299-2299 Misc textile products 2393-2395 Textile bags, canvas products 2397-2399 Misc textile products 11 Cnstr Construction and Construction Materials 0800-0899 Forestry 1500-1511 Build construction - general contractors 1520-1529 Gen building contractors - residential 1530-1539 Operative builders 1540-1549 Gen building contractors - non-residential 1600-1699 Heavy Construction - not building contractors 1700-1799 Construction - special contractors 2400-2439 Lumber and wood products 2450-2459 Wood buildings-mobile homes 2490-2499 Misc wood products 2660-2661 Building paper and board mills 2950-2952 Paving & roofing materials 3200-3200 Stone, clay, glass, concrete etc 3210-3211 Flat glass 3240-3241 Cement hydraulic 3250-3259 Structural clay prods 3261-3261 Vitreous china plumbing fixtures 3264-3264 Porcelain electrical supply 3270-3275 Concrete gypsum & plaster 3280-3281 Cut stone and stone products 3290-3293 Abrasive and asbestos products 3295-3299 Non-metalic mineral products 3420-3429 Handtools and hardware 3430-3433 Heating equip & plumbing fix 3440-3441 Fabicated struct metal products 3442-3442 Metal doors, frames 3446-3446 Architectual or ornamental metal work
44

3448-3448 Pre-fab metal buildings 3449-3449 Misc structural metal work 3450-3451 Screw machine products 3452-3452 Bolts, nuts screws 3490-3499 Misc fabricated metal products 3996-3996 Hard surface floor cover 12 Steel Steel Works Etc 3300-3300 Primary metal industries 3310-3317 Blast furnaces & steel works 3320-3325 Iron & steel foundries 3330-3339 Prim smelt-refin nonfer metals 3340-3341 Secondary smelt-refin nonfer metals 3350-3357 Rolling & drawing nonferous metals 3360-3369 Non-ferrous foundries and casting 3370-3379 Steel works etc 3390-3399 Misc primary metal products 13 FabPr Fabricated Products and Machinery 3400-3400 Fabricated metal, except machinery and trans eq 3443-3443 Fabricated plate work 3444-3444 Sheet metal work 3460-3469 Metal forgings and stampings 3470-3479 Coating and engraving 3510-3519 Engines & turbines 3520-3529 Farm and garden machinery 3530-3530 Constr, mining material handling machinery 3531-3531 Construction machinery 3532-3532 Mining machinery, except oil field 3533-3533 Oil field machinery 3534-3534 Elevators 3535-3535 Conveyors 3536-3536 Cranes, hoists 3538-3538 Machinery 3540-3549 Metalworking machinery 3550-3559 Special industry machinery 3560-3569 General industrial machinery 3580-3580 Refrig & service ind machines 3581-3581 Automatic vending machines 3582-3582 Commercial laundry and drycleaning machines 3585-3585 Air conditioning, heating, refrid eq 3586-3586 Measuring and dispensing pumps 3589-3589 Service industry machinery 3590-3599 Misc industrial and commercial equipment and mach 14 ElcEq Electrical Equipment 3600-3600 Elec mach eq & supply 3610-3613 Elec transmission 3620-3621 Electrical industrial appar 3623-3629 Electrical industrial appar 3640-3644 Electric lighting, wiring 3645-3645 Residential lighting fixtures 3646-3646 Commercial lighting 3648-3649 Lighting equipment 3660-3660 Communication equip 3690-3690 Miscellaneous electrical machinery and equip
45

3691-3692 Storage batteries 3699-3699 Electrical machinery and equip 15 Autos Automobiles and Trucks 2296-2296 Tire cord and fabric 2396-2396 Auto trim 3010-3011 Tires and inner tubes 3537-3537 Trucks, tractors, trailers 3647-3647 Vehicular lighting 3694-3694 Elec eq, internal combustion engines 3700-3700 Transportation equipment 3710-3710 Motor vehicles and motor vehicle equip 3711-3711 Motor vehicles & car bodies 3713-3713 Truck & bus bodies 3714-3714 Motor vehicle parts 3715-3715 Truck trailers 3716-3716 Motor homes 3792-3792 Travel trailers and campers 3790-3791 Misc trans equip 3799-3799 Misc trans equip 16 Carry Aircraft, ships, and railroad equipment 3720-3720 Aircraft & parts 3721-3721 Aircraft 3723-3724 Aircraft engines, engine parts 3725-3725 Aircraft parts 3728-3729 Aircraft parts 3730-3731 Ship building and repair 3740-3743 Railroad Equipment 17 Mines Precious Metals, Non-Metallic, and Industrial Metal Mining 1000-1009 Metal mining 1010-1019 Iron ores 1020-1029 Copper ores 1030-1039 Lead and zinc ores 1040-1049 Gold & silver ores 1050-1059 Bauxite and other aluminum ores 1060-1069 Ferroalloy ores 1070-1079 Mining 1080-1089 Mining services 1090-1099 Misc metal ores 1100-1119 Anthracite mining 1400-1499 Mining and quarrying non-metalic minerals 18 Coal Coal 1200-1299 Bituminous coal 19 Oil Petroleum and Natural Gas 1300-1300 Oil and gas extraction 1310-1319 Crude petroleum & natural gas 1320-1329 Natural gas liquids 1330-1339 Petroleum and natural gas 1370-1379 Petroleum and natural gas 1380-1380 Oil and gas field services 1381-1381 Drilling oil & gas wells 1382-1382 Oil-gas field exploration
46

1389-1389 Oil and gas field services 2900-2912 Petroleum refining 2990-2999 Misc petroleum products 20 Util Utilities 4900-4900 Electric, gas, sanitary services 4910-4911 Electric services 4920-4922 Natural gas transmission 4923-4923 Natural gas transmission-distr 4924-4925 Natural gas distribution 4930-4931 Electric and other services combined 4932-4932 Gas and other services combined 4939-4939 Combination utilities 4940-4942 Water supply 21 Telcm Communication 4800-4800 Communications 4810-4813 Telephone communications 4820-4822 Telegraph and other message communication 4830-4839 Radio-TV Broadcasters 4840-4841 Cable and other pay TV services 4880-4889 Communications 4890-4890 Communication services (Comsat) 4891-4891 Cable TV operators 4892-4892 Telephone interconnect 4899-4899 Communication services 22 Servs Personal and Business Services 7020-7021 Rooming and boarding houses 7030-7033 Camps and recreational vehicle parks 7200-7200 Services - personal 7210-7212 Services - laundry, cleaners 7214-7214 Services - diaper service 7215-7216 Services - coin-op cleaners, dry cleaners 7217-7217 Services - carpet, upholstery cleaning 7218-7218 Services - industrial launderers 7219-7219 Services - laundry, cleaners 7220-7221 Services - photo studios, portrait 7230-7231 Services - beauty shops 7240-7241 Services - barber shops 7250-7251 Services - shoe repair 7260-7269 Services - funeral 7270-7290 Services - misc 7291-7291 Services - tax return 7292-7299 Services - misc 7300-7300 Services - business services 7310-7319 Services - advertising 7320-7329 Services - credit reporting agencies, collection services 7330-7339 Services - mailing, reproduction, commercial art 7340-7342 Services - services to dwellings, other buildings 7349-7349 Services - cleaning and builging maint 7350-7351 Services - misc equip rental and leasing 7352-7352 Services - medical equip rental 7353-7353 Services - heavy construction equip rental 7359-7359 Services - equip rental and leasing 7360-7369 Services - personnel supply services
47

7370-7372 Services - computer programming and data processing 7374-7374 Services - computer processing, data prep 7375-7375 Services - information retrieval services 7376-7376 Services - computer facilities management service 7377-7377 Services - computer rental and leasing 7378-7378 Services - computer maintanence and repair 7379-7379 Services - computer related services 7380-7380 Services - misc business services 7381-7382 Services - security 7383-7383 Services - news syndicates 7384-7384 Services - photofinishing labs 7385-7385 Services - telephone interconnections 7389-7390 Services - misc business services 7391-7391 Services - R&D labs 7392-7392 Services - management consulting & P.R. 7393-7393 Services - detective and protective (ADT) 7394-7394 Services - equipment rental & leasing 7395-7395 Services - photofinishing labs (School pictures) 7396-7396 Services - trading stamp services 7397-7397 Services - commercial testing labs 7399-7399 Services - business services 7500-7500 Services - auto repair, services 7510-7519 Services - truck, auto, trailer rental and leasing 7520-7529 Services - automobile parking 7530-7539 Services - auto repair shops 7540-7549 Services - auto services, except repair (car washes) 7600-7600 Services - Misc repair services 7620-7620 Services - Electrical repair shops 7622-7622 Services - Radio and TV repair shops 7623-7623 Services - Refridg and air conditioner repair 7629-7629 Services - Electrical repair shops 7630-7631 Services - Watch, clock and jewelry repair 7640-7641 Services - Reupholster, furniture repair 7690-7699 Services - Misc repair shops 8100-8199 Services - legal 8200-8299 Services - educational 8300-8399 Services - social services 8400-8499 Services - museums, galleries, botanic gardens 8600-8699 Services - membership organizations 8700-8700 Services - engineering, accounting, research, management 8710-8713 Services - engineering, accounting, surveying 8720-8721 Services - accounting, auditing, bookkeeping 8730-8734 Services - research, development, testing labs 8740-8748 Services - management, public relations, consulting 8800-8899 Services - private households 8900-8910 Services - misc 8911-8911 Services - engineering & architect 8920-8999 Services - misc 23 BusEq Business Equipment 3570-3579 Office computers 3622-3622 Industrial controls 3661-3661 Telephone and telegraph apparatus 3662-3662 Communications equipment 3663-3663 Radio TV comm equip & apparatus 3664-3664 Search, navigation, guidance systems
48

3665-3665 Training equipment & simulators 3666-3666 Alarm & signaling products 3669-3669 Communication equipment 3670-3679 Electronic components 3680-3680 Computers 3681-3681 Computers - mini 3682-3682 Computers - mainframe 3683-3683 Computers - terminals 3684-3684 Computers - disk & tape drives 3685-3685 Computers - optical scanners 3686-3686 Computers - graphics 3687-3687 Computers - office automation systems 3688-3688 Computers - peripherals 3689-3689 Computers - equipment 3695-3695 Magnetic and optical recording media 3810-3810 Search, detection, navigation, guidance 3811-3811 Engr lab and research equipment 3812-3812 Search, detection, navigation, guidance 3820-3820 Measuring and controlling equipment 3821-3821 Lab apparatus and furniture 3822-3822 Automatic controls - Envir and applic 3823-3823 Industrial measurement instru 3824-3824 Totalizing fluid meters 3825-3825 Elec meas & test instr 3826-3826 Lab analytical instruments 3827-3827 Optical instr and lenses 3829-3829 Meas and control devices 3830-3839 Optical instr and lenses 7373-7373 Computer integrated systems design 24 Paper Business Supplies and Shipping Containers 2440-2449 Wood containers 2520-2549 Office furniture and fixtures 2600-2639 Paper and allied products 2640-2659 Paperboard containers, boxes, drums, tubs 2670-2699 Paper and allied products 2760-2761 Manifold business forms 3220-3221 Glass containers 3410-3412 Metal cans and shipping containers 3950-3955 Pens pencils and office supplies 25 Trans Transportation 4000-4013 Railroads-line haul 4040-4049 Railway express service 4100-4100 Transit and passenger trans 4110-4119 Local passenger trans 4120-4121 Taxicabs 4130-4131 Intercity bus trans (Greyhound) 4140-4142 Bus charter 4150-4151 School buses 4170-4173 Motor vehicle terminals, service facilities 4190-4199 Misc transit and passenger transportation 4200-4200 Motor freight trans, warehousing 4210-4219 Trucking 4220-4229 Warehousing and storage 4230-4231 Terminal facilities - motor freight
49

4240-4249 Transportation 4400-4499 Water transport 4500-4599 Air transportation 4600-4699 Pipelines, except natural gas 4700-4700 Transportation services 4710-4712 Freight forwarding 4720-4729 Travel agencies, etc 4730-4739 Arrange trans - freight and cargo 4740-4749 Rental of railroad cars 4780-4780 Misc services incidental to trans 4782-4782 Inspection and weighing services 4783-4783 Packing and crating 4784-4784 Fixed facilities for vehicles, not elsewhere classified 4785-4785 Motor vehicle inspection 4789-4789 Transportation services 26 Whlsl Wholesale 5000-5000 Wholesale - durable goods 5010-5015 Wholesale - autos and parts 5020-5023 Wholesale - furniture and home furnishings 5030-5039 Wholesale - lumber and construction materials 5040-5042 Wholesale - professional and commercial equipment and supplies 5043-5043 Wholesale - photographic equipment 5044-5044 Wholesale - office equipment 5045-5045 Wholesale - computers 5046-5046 Wholesale - commerical equip 5047-5047 Wholesale - medical, dental equip 5048-5048 Wholesale - ophthalmic goods 5049-5049 Wholesale - professional equip and supplies 5050-5059 Wholesale - metals and minerals 5060-5060 Wholesale - electrical goods 5063-5063 Wholesale - electrical apparatus and equipment 5064-5064 Wholesale - electrical appliance TV and radio 5065-5065 Wholesale - electronic parts 5070-5078 Wholesale - hardware, plumbing, heating equip 5080-5080 Wholesale - machinery and equipment 5081-5081 Wholesale - machinery and equipment (?) 5082-5082 Wholesale - construction and mining equipment 5083-5083 Wholesale - farm and garden machinery 5084-5084 Wholesale - industrial machinery and equipment 5085-5085 Wholesale - industrial supplies 5086-5087 Wholesale - machinery and equipment (?) 5088-5088 Wholesale - trans eq except motor vehicles 5090-5090 Wholesale - misc durable goods 5091-5092 Wholesale - sporting goods, toys 5093-5093 Wholesale - scrap and waste materials 5094-5094 Wholesale - jewelry and watches 5099-5099 Wholesale - durable goods 5100-5100 Wholesale - nondurable goods 5110-5113 Wholesale - paper and paper products 5120-5122 Wholesale - drugs & propietary 5130-5139 Wholesale - apparel 5140-5149 Wholesale - groceries & related prods 5150-5159 Wholesale - farm products 5160-5169 Wholesale - chemicals & allied prods 5170-5172 Wholesale - petroleum and petro prods
50

5180-5182 Wholesale - beer, wine 5190-5199 Wholesale - non-durable goods 27 Rtail Retail 5200-5200 Retail - bldg material, hardware, garden 5210-5219 Retail - lumber & other building mat 5220-5229 Retail 5230-5231 Retail - paint, glass, wallpaper 5250-5251 Retail - hardward stores 5260-5261 Retail - nurseries, lawn, garden stores 5270-5271 Retail - mobile home dealers 5300-5300 Retail - general merchandise stores 5310-5311 Retail - department stores 5320-5320 Retail - general merchandise stores (?) 5330-5331 Retail - variety stores 5334-5334 Retail - catalog showroom 5340-5349 Retail 5390-5399 Retail - Misc general merchandise stores 5400-5400 Retail - food stores 5410-5411 Retail - grocery stores 5412-5412 Retail - convenience stores 5420-5429 Retail - meat, fish mkt 5430-5439 Retail - fruite and vegatable markets 5440-5449 Retail - candy, nut, confectionary stores 5450-5459 Retail - dairy product stores 5460-5469 Retail - bakeries 5490-5499 Retail - miscellaneous food stores 5500-5500 Retail - auto dealers and gas stations 5510-5529 Retail - auto dealers 5530-5539 Retail - auto and home supply stores 5540-5549 Retail - gasoline service stations 5550-5559 Retail - boat dealers 5560-5569 Retail - recreational vehicle dealers 5570-5579 Retail - motorcycle dealers 5590-5599 Retail - automotive dealers 5600-5699 Retail - apparel & acces 5700-5700 Retail - home furniture and equipment stores 5710-5719 Retail - home furnishings stores 5720-5722 Retail - household appliance stores 5730-5733 Retail - radio, TV and consumer electronic stores 5734-5734 Retail - computer and computer software stores 5735-5735 Retail - record and tape stores 5736-5736 Retail - musical instrument stores 5750-5799 Retail 5900-5900 Retail - misc 5910-5912 Retail - drug & proprietary stores 5920-5929 Retail - liquor stores 5930-5932 Retail - used merchandise stores 5940-5940 Retail - misc 5941-5941 Retail - sporting goods stores, bike shops 5942-5942 Retail - book stores 5943-5943 Retail - stationery stores 5944-5944 Retail - jewelry stores 5945-5945 Retail - hobby, toy and game shops 5946-5946 Retail - camera and photo shop 5947-5947 Retail - gift, novelty
51

5948-5948 Retail - luggage 5949-5949 Retail - sewing & needlework stores 5950-5959 Retail 5960-5969 Retail - non-store retailers (catalogs, etc) 5970-5979 Retail 5980-5989 Retail - fuel & ice stores (Penn Central Co) 5990-5990 Retail - retail stores 5992-5992 Retail - florists 5993-5993 Retail - tobacco stores 5994-5994 Retail - newsdealers 5995-5995 Retail - computer stores 5999-5999 Retail stores 28 Meals Restaraunts, Hotels, Motels 5800-5819 Retail - eating places 5820-5829 Restaraunts, hotels, motels 5890-5899 Eating and drinking places 7000-7000 Hotels, other lodging places 7010-7019 Hotels motels 7040-7049 Membership hotels and lodging 7213-7213 Services - linen 29 Fin Banking, Insurance, Real Estate, Trading 6000-6000 Depository institutions 6010-6019 Federal reserve banks 6020-6020 Commercial banks 6021-6021 National commercial banks 6022-6022 State banks - Fed Res System 6023-6024 State banks - not Fed Res System 6025-6025 National banks - Fed Res System 6026-6026 National banks - not Fed Res System 6027-6027 National banks, not FDIC 6028-6029 Banks 6030-6036 Savings institutions 6040-6059 Banks (?) 6060-6062 Credit unions 6080-6082 Foreign banks 6090-6099 Functions related to deposit banking 6100-6100 Nondepository credit institutions 6110-6111 Federal credit agencies 6112-6113 FNMA 6120-6129 S&Ls 6130-6139 Agricultural credit institutions 6140-6149 Personal credit institutions (Beneficial) 6150-6159 Business credit institutions 6160-6169 Mortgage bankers 6170-6179 Finance lessors 6190-6199 Financial services 6200-6299 Security and commodity brokers 6300-6300 Insurance 6310-6319 Life insurance 6320-6329 Accident and health insurance 6330-6331 Fire, marine, property-casualty ins 6350-6351 Surety insurance 6360-6361 Title insurance 6370-6379 Pension, health, welfare funds
52
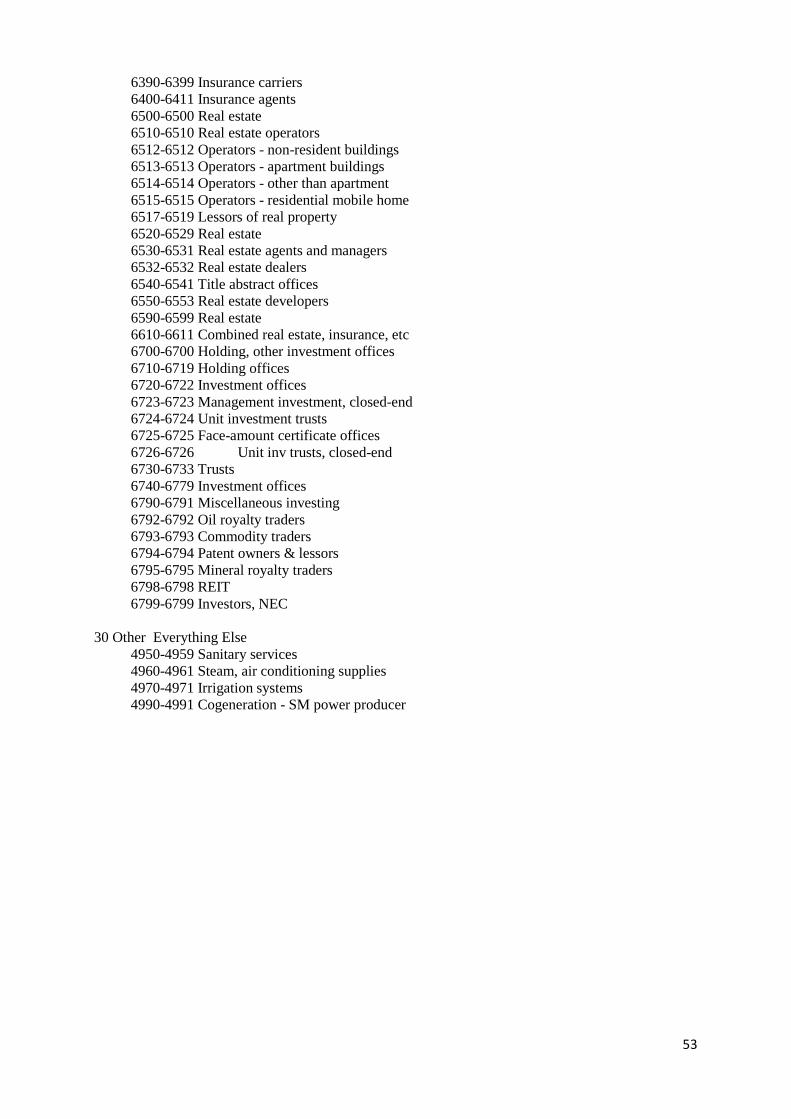
6390-6399 Insurance carriers 6400-6411 Insurance agents 6500-6500 Real estate 6510-6510 Real estate operators 6512-6512 Operators - non-resident buildings 6513-6513 Operators - apartment buildings 6514-6514 Operators - other than apartment 6515-6515 Operators - residential mobile home 6517-6519 Lessors of real property 6520-6529 Real estate 6530-6531 Real estate agents and managers 6532-6532 Real estate dealers 6540-6541 Title abstract offices 6550-6553 Real estate developers 6590-6599 Real estate 6610-6611 Combined real estate, insurance, etc 6700-6700 Holding, other investment offices 6710-6719 Holding offices 6720-6722 Investment offices 6723-6723 Management investment, closed-end 6724-6724 Unit investment trusts 6725-6725 Face-amount certificate offices 6726-6726 Unit inv trusts, closed-end 6730-6733 Trusts 6740-6779 Investment offices 6790-6791 Miscellaneous investing 6792-6792 Oil royalty traders 6793-6793 Commodity traders 6794-6794 Patent owners & lessors 6795-6795 Mineral royalty traders 6798-6798 REIT 6799-6799 Investors, NEC 30 Other Everything Else 4950-4959 Sanitary services 4960-4961 Steam, air conditioning supplies 4970-4971 Irrigation systems 4990-4991 Cogeneration - SM power producer
53

Appendix III
Low-risk Industries Neutral Industries High-risk Industries
Industry β+ β- β+ - β- t-stat Industry β+ β- β+ - β- t-stat Industry β+ β- β+ - β- t-stat
Food 0,67 0,68 0,00 -0,15 Games 1,16 1,22 -0,06 -1,10 Textiles 1,21 1,20 0,00 0,07
Beer 0,56 0,52 0,05 1,56 Books 1,08 1,13 -0,06 -1,19 Construction 1,34 1,35 -0,01 -0,12
Smoke 0,58 0,59 -0,01 -0,29 Clothes 1,08 1,06 0,03 0,61 Steel 1,57 1,65 -0,07 -1,03
Households 0,67 0,64 0,03 0,81 Chemicals 1,15 1,19 -0,03 -0,67 Fabricated Products 1,30 1,29 0,01 0,14
Health 0,71 0,71 0,00 0,13 Carry 1,03 0,99 0,04 0,88 Electrical Equipment 1,22 1,19 0,03 0,54
Utilities 0,75 0,75 0,00 0,15 Oil 1,10 1,13 -0,02 -0,39 Autos 1,33 1,34 -0,02 -0,26
Telecom 0,98 0,94 0,05 1,17 Mines 1,26 1,31 -0,05 -0,79
Services 0,98 0,95 0,04 0,97 Coals 1,68 1,77 -0,10 -1,00
Business Equipment 1,10 1,05 0,05 1,10 Finance 1,37 1,36 0,00 0,08
Paper 0,95 0,96 -0,01 -0,22
Transport 1,05 1,03 0,01 0,32
Wholesale 0,92 0,91 0,01 0,22
Retail 0,88 0,83 0,05 1,44
Meals 0,85 0,81 0,04 1,15
Other 0,90 0,93 -0,02 -0,57
54

References
Amihud, Y. and Mendelson, H. (1986). Asset Pricing and the Bid-Ask Spread. Journal of Financial Economics, Vol. 15, pp. 223-49. Ang, A., Chen, J. and Xing, Y. (2006). Downside Risk. The Review of Financial Studies, Vol. 19, No. 4, pp, 1191-1239 Artzner, P., Delbaen, F., Eber, J. and Heath, D. (1999). Coherent Measures of Risk. Mathematical Finance, Vol. 9, No. 3, pp. 203–228. Asness, C., Frazini, A. and Pedersen, L.H. (2013). Low-Risk Investing Without Industry Bets. Working paper (first draft: June 6, 2012), pp. 1-27. Benartzi, S. and Thailer, R.H. (1995). Myopic Loss Aversion and the Equity Premium Puzzle. The Quarterly Journal of Economics, Vol. 110, No. 1, pp. 73-92. Bettis, R.A. and Mahajan, V. (1985). Risk/Return Performance of Diversified Firms. Management Science, Vol. 31, No. 7, pp. 785-799. Black, F. (1972). Capital market equilibrium with restricted borrowing. Journal of Business, No. 45, Bloomfield, T., Leftwich, R. and Long Jr., J.B. (1997). Portfolio Strategies and Performance. Journal of Financial Economics, Vol. 5, pp. 201-218. Campbell, J.Y and Voulteenaho, T. (2003). Bad Beta, Good Beta. Harvard Institute of Economic Research, Harvard University, Discussion paper No. 2016. Campbell, J.Y. and Mei, J. (1993). Where Do Betas come From? Asset Price Dynamics and the Sources of Systematic Risk. The Review of Financial Studies, Vol. 6, No. 3, pp. 567-592. Chandler, A.D. (1990). Scale and Scope: The Dynamic of Industrial Capitalism. Harvard Press. Cochrane, J.H. (2002). Asset Pricing. Book published by Graduate School of Business, University of Chicago. Daniel, K., Hirshleifer, D. and Subrahmanyam, A. (1998). Investor Psychology and Security Market under- and Overreactions. The Journal of Finance, Vol. 53, No. 6, pp. 1839-1885. Dowd, K. (2002). Measuring Market Risk. Ohn Wiley & Sons, LTD. Dybvig, P.H. (1988). Inefficient Dynamic Portfolio Strategies or How to Throw Away a Million Dollars in the Stock Market. The Review of Financial Studies, Vol. 1, No. 1, pp. 67-88. Hawanini, G. and Subramanian, V. (2001). Is Performance Driven By Industry- or Firm-specific Factors? A new look at the evidence. Insead R&D, working paper.
55

Hayes, R. H. and Abernathy, W. J. (1980). 'Managing our way to economic decline'. Harvard Business Review, pp. 67-77. Jensen, M.C. (1969). Risk, The Pricing of Capital Assets, and The Evaluation of Investment Portfolios. The Journal of Business, Vol. 42, No. 2., pp. 167-247. Kahneman, D. (2003). Maps of Bounded Rationality: Psychology for Behavioral Economics. The American Economic Review, Vol. 93, No. 5, pp. 1449-1475. Kahneman, D. and Tversky, A. (1979). Prospect Theory: An Analysis of Decision Under Risk. Econometrica, Vol. 47, No. 2, pp. 263-292. King, B.F. (1966). Market and Industry Factors in Stock Price Behavior. The Journal of Business, Vol. 39, No. 1, Part 2: Supplement on Security Prices, pp. 139-190 Kirilenkoz, A. and Cvitanik, J. (2010). High Frequency Traders and Asset Prices. Cal. Tech Magazine. Klemkosky, R.C. and Martin, J.D. (1975). The Effect of Market Risk on Portfolio Diversification. The Journal of Finance, Vol. 30, No. 1, pp. 147-154. Klepper, S. (1997). Industry Life Cycles. Industrial and Corporate Change, Vol. 6, No. 1, pp. 145-181. Klepper, S. and Graddy, E. (1990)‘The evolution of new industries and the determinants of market Structure. Rand Journal of Economics, Vol. 2, pp. 27-44. Lanjouw, J.O. and Schankerman, M. (2004). Patent Quality and Research Productivity: Measuring Innovation with Multiple Indicators. The Economic Journal, Vol. 114, No. 495, pp. 441-465 Lessard, D.R. (1976). World, Country, and Industry Relationships in Equity Returns: Implications for Risk Reduction through International Diversification. Financial Analysts Journal, Vol. 32, No. 1, pp. 32-38. Lintner, J. (1965). Security Prices, Risk, and Maximal Gains from Diversification. Journal of Finance, Vol. 20, pp. 587-615. Livingston, M. (1977). Industry Movements of Common Stocks. The Journal of Finance, Vol. 32, No. 3, pp. 861-874 MacKay, P. and Phillips, G.M. (2005). How Does Industry Affect Firm Financial Structure? The Review of Financial Studies, Vol. 18, No. 4, pp. 1433-1466. Madhavan, A. (2000). Market microstructure: A survey. Journal of Financial Markets, Vol. 3, No. 3, pp. 205–258. Maksimovic, V. and Zechner, J. (1991). Debt, Agency Costs and Industry Equilibrium. Journal of Finance, Vol. 46, pp. 1619-1643.
56

Markowitz, H. (1952). Portfolio Selection. The Journal of Finance, Vol. 7, No. 1, pp. 77-91 Menkveld, A.J. (2011). High Frequency Trading and the New-Market Makers, Tinbergen Institute Discussion Paper, No. 11-076/2/DSF21. Merton, R.C., Scholes, M.S. and Gladstein, M.L. (1978). The Returns and Risk of Alternative Call Option Portfolio Investment Strategies. The Journal of Business, Vol. 51, No. 2, pp. 183-242. Miller, E.M. (1997). Risk, Uncertainty, and Divergence of Opinion. The Journal of Finance, Vol. 32, No. 4, pp. 1151-1168. Roberts, K. (2003). What strategic investments should you make during a recession to gain competitive advantage in the recovery? Strategy & Leadership, Vol. 31, No. 4, pp. 31 – 39. Schmalensee, R. (1985). Do Markets Differ Much? American Economic Review, Vol. 75, pp. 341-51. Sharpe, W.F. (1964). Capital Asset Prices: A Theory of Market Equilibrium under Conditions of Risk. The Journal of Finance, Vol. 19, No. 3, pp. 425-442. Sharpe, W.F. (1964). Capital Asset Prices: A Theory of Market Equilibrium Under Conditions of Risk. Journal of Finance, Vol. 19, pp. 425-42. Shiller, R.J. (2003). From Efficient Markets Theory to Behavioral Finance. The Journal of Economic Perspectives, Vol. 17, No. 1, pp. 83-104. Shipway, I. (2009). Modern Portfolio Theory. Trusts & Trustees, Vol. 15, No. 2, pp. 66-71. Simon, H.A. (1997). Models of Bounded Rationality: Empirically grounded economic reason. Massachusetts Institute of technology, Vol. 3, pp. 1-457 Wilson, T.C. (1998). Portfolio Credit Risk. FRBNY Economic Policy Review, pp. 71-82. Woolridge, R. and Snow, C.C. (1990). Stock Market Reaction to Strategic Investment Decisions. Strategic Management Journal, Vol. 11, No. 5, pp. 353-363. Zou, L. (2005). Dichotomous Asset Pricing Model. Annals of Economics and Finance, No. 6, pp. 185-207.
57