Embed Size (px)
Citation preview
Consideration of Queensland Treasury and Trade Annual Report
2012-13
Report No. 47 Finance and Administration Committee August 2014
Finance and Administration Committee iii
FINANCE AND ADMINSTRATION COMMITTEE
Chair Mr Steve Davies MP, Member for Capalaba
Deputy Chair Mr Curtis Pitt MP, Member for Mulgrave
Members Mrs Liz Cunningham MP, Member for Gladstone
Dr Bruce Flegg MP, Member for Moggill
Mr Reg Gulley MP, Member for Murrumba
Mrs Freya Ostapovitch MP, Member for Stretton
Mr Mark Stewart MP, Member for Sunnybank
Mr Steve Davies MP, Member for Capalaba
Mr Curtis Pitt MP, Member for Mulgrave
Mrs Liz Cunningham MP, Member for Gladstone
Staff Ms Deborah Jeffrey, Research Director
Dr Maggie Lilith, Principal Research Officer
Ms Lynette Whelan, Executive Assistant
Ms Debbie Mohi, Executive Assistant (from 8 October 2013 to 22 April 2014)
Ms Louise Johnson, Executive Assistant (from 30 April 2014)
Contact details Finance and Administration Committee Parliament House George Street Brisbane Qld 4000
Telephone +61 7 3406 7576
Fax +61 7 3406 7500
Email [email protected]
Web www.parliament.qld.gov.au/fac
iv Finance and Administration Committee
Contents
Abbreviations vi
Abbreviations (cont.) vii
Glossary vii
Chair’s Foreword viii
Recommendations ix
1 Introduction 1 1.1 Recommendations in this report 1 1.2 Role of the Committee 1 1.3 Conduct of the inquiry 2
2 Annual Report 2012-13 2 2.1 Organisational Structure 4 2.2 Key Achievements 6
2.2.1 Departmental scoping studies 7 2.2.2 Management of GOCs 7 2.2.3 Economic Modelling 8 2.2.4 Financial sustainability indicators 9 2.2.5 Committee Comments 9 2.2.6 Royalty Revenues 10
2.3 Challenges 10 2.4 Departmental workforce 10 2.5 Key Performance Indicators 11 2.6 Committee Comments 15
3 Financial Statements 2012-13 16 3.1 Statement of Controlled Comprehensive Income 17 3.2 Statement of Controlled Financial Position 18 3.3 Statement of Administered Comprehensive Income 19 3.4 Ratio Analysis 22 3.5 Committee Comments 27
4 Comparison of actual results to estimated actual results contained in budget papers 27 4.1 Committee comments 30
Finance and Administration Committee v
5 Queensland Treasury’s role as a central agency 30 5.1 Report on State Finances 2012-13 31 5.2 Consolidated Fund Financial Report 32 5.3 Mid Year Financial and Economic Review 2013-14 33 5.4 Accounting Standards 35
Appendices 37 Appendix A – Officers appearing on behalf of the department at public departmental hearing – Wednesday 19 March 2014 38
Abbreviations and Glossary Review of Qld Workers’ Compensation Scheme
vi Finance and Administration Committee
Abbreviations
AAS Australian Accounting Standards
AASB Australian Accounting Standards Board
CEO Chief Executive Officer
CFFR Consolidated Fund Financial Report
CFO Chief Finance Officer
CSO Community service obligation
DEWS Department of Energy and Water Supply
ED Exposure Draft
FAA Financial Accountability Act 2009
FAC Finance and Administration Committee
FPMS Financial and Performance Management Standard 2009
GGS General Government Sector
GOC Government Owned Corporation
GST Goods and Services Tax
HoTARAC Heads of Treasuries Accounting and Reporting Advisory Committee
IPSASB International Public Sector Accounting Standards Board
KPIs Key Performance Indicators
MAIC Motor Accident Insurance Commission
MOG machinery of government
MYFER Mid Year Financial and Economic Review
NDRRA Natural Disaster Relief and Recovery Arrangements
OSR Office of State Revenue
PFE Public Financial Enterprises
PNFC Public Non-Financial Corporations
PNFS Public Non-Financial Sector
RPG Recommended Practice Guideline
QAO Queensland Audit Office
QTC Queensland Treasury Corporation
QTH Queensland Treasury Holdings Pty Ltd
Consideration of QTT Annual Report 2012-13 Abbreviations and Glossary
Finance and Administration Committee vii
Abbreviations (cont.)
QTT Queensland Treasury and Trade
SDIIC State Development, Infrastructure and Industry Committee
SPER State Penalties Enforcement Registry
SVS State Valuation Service
TIQ Trade and Investment Queensland
UPF Uniform Presentation Framework
Glossary
Acts All Acts referred to in this report refer to Queensland Acts unless otherwise specified.
general government sector (GGS)
means the institutional sector comprising all government units and non-profit institutions controlled and mainly financed by government, as defined in Australian Accounting Standard AASB 1049
The Committee Finance and Administration Committee
The department Queensland Treasury and Trade
Chair’s Foreword Consideration of QTT Annual Report 2012-13
viii Finance and Administration Committee
Chair’s Foreword
Under the Parliament of Queensland Act, parliamentary committees may perform its role in relation to examination of the public accounts related to its portfolio area. The Committee has responsibility to assess the integrity, economy, efficiency and effectiveness of government financial management by examining government financial documents; and considering the annual and other reports of the auditor-general. With this in mind, the Committee agreed to examine the annual reports of the entities for which it has portfolio responsibilities. This report is the result of that assessment.
On behalf of the Committee, I would like to thank Queensland Treasury and Trade for their assistance. In particular, the Committee wishes to thank the officers who meet with the Committee and provided additional information as requested.
Finally, I would like to thank the other Members of the Committee and committee secretariat for their valuable contribution and their continuing hard work in undertaking the work of the Committee.
Steve Davies MP Chair
Consideration of QTT Annual Report 2012-13 Recommendations
Finance and Administration Committee ix
Recommendations
The Committee makes the following recommendations:
Recommendation 1 9
The Committee recommends that the Auditor-General and the relevant parliamentary committees be included in any consultation process regarding changes to the performance reporting framework.
Recommendations Consideration of QTT Annual Report 2012-13
x Finance and Administration Committee
Consideration of QTT Annual Report 2012-13
Finance and Administration Committee 1
1 Introduction
1.1 Recommendations in this report
The recommendation in this report is addressed to the Treasurer and Minister for Trade as the responsible minister.1
1.2 Role of the Committee
The Finance and Administration Committee (the Committee) is a portfolio committee established by the Parliament of Queensland Act 2001 and the Standing Orders of the Legislative Assembly on 18 May 2012.2 The committee’s primary areas of responsibility are:
Premier and Cabinet; and
Treasury and Trade.
In relation to its areas of responsibility, the Committee:
examines bills to consider the policy to be enacted and the application of the fundamental legislative principles set out in the Legislative Standards Act;
examines the estimates of each department;
considers the lawfulness of subordinate legislation;
assesses the public accounts of each agency within the areas of responsibility in regard to the integrity, economy, efficiency and effectiveness of financial management by:
examining government financial documents; and
considering the annual and other reports of the Auditor-General;
consider the public works of each agency within the areas of responsibility in light of matters including, but not limited to the:
suitability of the works for the purpose;
necessity for the works;
value for money of the works;
revenue produced by, and recurrent costs of, the works, or estimates of revenue and costs;
present and prospective public value of the works;
procurement methods used for the works; and
the suitability of the works in meeting the needs and achieving the stated purposes of the works.
Section 92(2) of the Parliament of Queensland Act 2001 provides that a portfolio committee is to also deal with an issue referred to it by the Assembly or under another Act, whether or not the issue is within its portfolio area.
The Committee also has oversight functions in relation to the Auditor-General, the Integrity Commissioner and the Family and Child Commission.
1 Parliament of Queensland Act 2001, s107 2 Parliament of Queensland Act 2001, s88 and Standing Order 194
Consideration of QTT Annual Report 2012-13
2 Finance and Administration Committee
1.3 Conduct of the inquiry
One of the functions of the Committee, as prescribed in section 95 of the Parliament of Queensland Act 2001 is to assess the public accounts of each agency within the areas of responsibility in regard to the integrity, economy, efficiency and effectiveness of financial management by examining government financial documents.
Government financial documents are defined in the Act to include—
(a) a document tabled in the Assembly under the Financial Accountability Act 2009; and
(b) the annual financial statements and annual reports of Government Owned Corporations (GOC) or the Authority; and
(c) a document that would be a government financial document if it had been tabled in the Assembly as required by law;
but does not include estimates of receipts for the proposed expenditure under an Annual Appropriation Act.
The annual reports of its portfolio agencies therefore fall within the definition of a government financial document.
The Committee resolved to consider the Queensland Treasury and Trade (QTT) annual report in further detail and invited the department to a public hearing held on Wednesday 19 March 2014. A list of officers who gave evidence at the hearing is contained in Appendix A. In addition, the Committee sought and received written information from the department.
Copies of the hearing transcript and answers to questions taken on notice at the hearing are available from the Committee secretariat or on the Committee’s web page at: http://www.parliament.qld.gov.au/work-of-committees/committees/FAC
QTT also performs a role as a central agency administering funds on behalf of the State. As part of this inquiry the Committee also considered the Report on State Finances 2012-13 and the Mid Year Financial and Economic Review 2013-14 (MYFER).
2 Annual Report 2012-13
Section 63 of the Financial Accountability Act 2009 (FAA) prescribes that accountable officers and statutory bodies must prepare annual reports for their agency in accordance with the requirements set out in the Financial and Performance Management Standard 2009 (FPMS). QTT’s Annual Report was tabled on 24 September 2013. QTT has prepared financial statements in compliance with section 42 of the FPMS.
The Annual Report identifies that QTT provides a fiscal, commercial and economic leadership role for the Queensland Government to enhance the State’s financial position and economic performance. As at 30 June 2014 they were responsible for two statutory authorities: the Motor Accident Insurance Commission (MAIC) and Queensland Treasury Corporation (QTC), which produce their own annual reports. Subsequent to the end of the financial year, the Treasurer announced that Trade and Investment Queensland would become a statutory body.3
3 Queensland Treasury and Trade, Annual Report 2012-13, September 2013: 4
Consideration of QTT Annual Report 2012-13
Finance and Administration Committee 3
As at 30 June 2013 the department had the following specialist divisions:
Fiscal
Economic and Structural Policy
Projects Queensland
Office of State Revenue (OSR)
Trade and Investment Queensland
Corporate Services4
The Annual Report states that during 2012-13 the department delivered the following services:
Fiscal – the fundamental role is to provide whole-of-government policies, strategies and advice to promote value-for-money service delivery, and manage the State’s finances.
Economic – the role is to advance the performance of the Queensland economy by providing statistical, economic and demographic research and advice across Government, managing the State’s interest in the GOC sector, achieving best practice regulation and reducing red tape, advising on microeconomic and competition reform, and managing intergovernmental fiscal relations.
Commercial services/Projects Queensland – Projects Queensland investigates and evaluates funding, financing, procurement and delivery models for key infrastructure projects and service delivery outcomes with the greatest potential for public private partnerships.
Revenue management – the department manages $1.3 billion of Queensland’s revenue base by delivering and administering simple, efficient and equitable revenue management services for State taxes, royalty revenue, grant schemes and revenues from fines and penalties.
Trade and investment – the department help Queensland companies develop markets, improve their export capability and promote trade and investment opportunities.5
The Under Treasurer advised the Committee at its public hearing that as a department they must comply with the departmental provisions of the Financial Accountability Act, including the preparation of financial statements and an annual report. He advised that the 2012-13 controlled financial statements consisted of Treasury, including the Office of State Revenue, and also Trade, which is now a separate statutory body subsequent to the 2012-13 financial year, as well as the controlled entities of Queensland Treasury Holdings Pty Ltd (QTH) and Queensland Trade and Investment Office Pty Ltd.6
The Under Treasurer advised that QTH acts as a corporate vehicle through which the Queensland Government holds assets of strategic importance. These include the state’s residual shareholding in Aurizon Holdings Ltd, formerly QR National Ltd. QTH also holds a controlling interest in entities such as the Cairns and Mackay airports and Queensland Lottery Corporation Pty Ltd. He advised that QTT owns 60 per cent of the shares in QTH with QTC holding the other 40 per cent. Queensland Trade and Investment Office Pty Ltd exists to support the activities of the department’s Trade and Investment Queensland Offices overseas.7
4 Queensland Treasury and Trade, Annual Report 2012-13, September 2013: 5 5 Queensland Treasury and Trade, Annual Report 2012-13, September 2013: 4 6 Mr Gray, Transcript 19 March 2014: 1 7 Mr Gray, Transcript 19 March 2014: 1-2
Consideration of QTT Annual Report 2012-13
4 Finance and Administration Committee
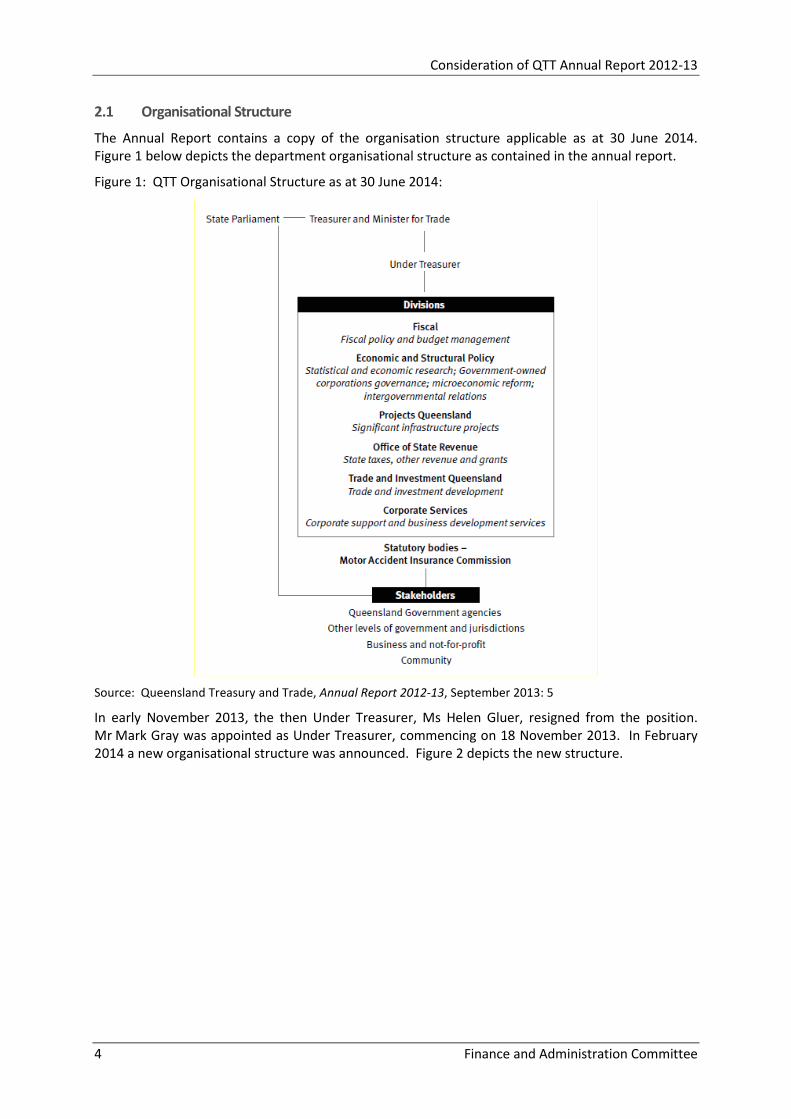
2.1 Organisational Structure
The Annual Report contains a copy of the organisation structure applicable as at 30 June 2014. Figure 1 below depicts the department organisational structure as contained in the annual report.
Figure 1: QTT Organisational Structure as at 30 June 2014:
Source: Queensland Treasury and Trade, Annual Report 2012-13, September 2013: 5
In early November 2013, the then Under Treasurer, Ms Helen Gluer, resigned from the position. Mr Mark Gray was appointed as Under Treasurer, commencing on 18 November 2013. In February 2014 a new organisational structure was announced. Figure 2 depicts the new structure.
Consideration of QTT Annual Report 2012-13
Finance and Administration Committee 5
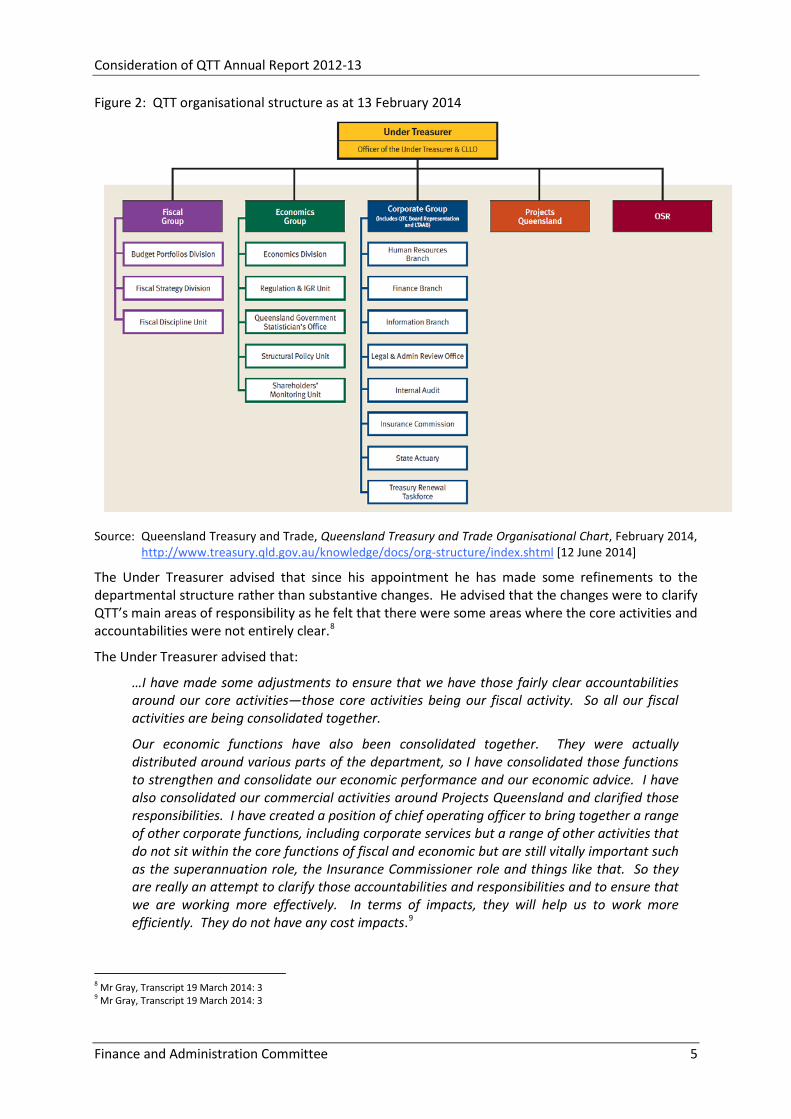
Figure 2: QTT organisational structure as at 13 February 2014
Source: Queensland Treasury and Trade, Queensland Treasury and Trade Organisational Chart, February 2014,
http://www.treasury.qld.gov.au/knowledge/docs/org-structure/index.shtml [12 June 2014]
The Under Treasurer advised that since his appointment he has made some refinements to the departmental structure rather than substantive changes. He advised that the changes were to clarify QTT’s main areas of responsibility as he felt that there were some areas where the core activities and accountabilities were not entirely clear.8
The Under Treasurer advised that:
…I have made some adjustments to ensure that we have those fairly clear accountabilities around our core activities—those core activities being our fiscal activity. So all our fiscal activities are being consolidated together.
Our economic functions have also been consolidated together. They were actually distributed around various parts of the department, so I have consolidated those functions to strengthen and consolidate our economic performance and our economic advice. I have also consolidated our commercial activities around Projects Queensland and clarified those responsibilities. I have created a position of chief operating officer to bring together a range of other corporate functions, including corporate services but a range of other activities that do not sit within the core functions of fiscal and economic but are still vitally important such as the superannuation role, the Insurance Commissioner role and things like that. So they are really an attempt to clarify those accountabilities and responsibilities and to ensure that we are working more effectively. In terms of impacts, they will help us to work more efficiently. They do not have any cost impacts.9
8 Mr Gray, Transcript 19 March 2014: 3 9 Mr Gray, Transcript 19 March 2014: 3
Consideration of QTT Annual Report 2012-13
6 Finance and Administration Committee
2.2 Key Achievements
The Annual Report highlighted a number of major initiatives and key achievements in each of departmental services areas. The report states that much of QTT’s work during 2012-13 has been driven by the need for a fundamental shift in the way the public sector delivers services and infrastructure. Achievements throughout the year included:
developing the 2012-13 and 2013-14 State Budgets;
developing a revised fiscal strategy, which focussed on reducing debt, achieving a fiscal balance, stabilising then maintaining a then maintaining a competitive tax environment for business and targeting fully funding long term liabilities;
establishing the Office of best practice Regulation to play a lead role in reducing the burden of regulation and red tape;
implementing the $15,000 Great Start Grant for first homebuyers buying or building a new home;
establishing Projects Queensland, and commencing the 1 William Street development in the Brisbane CBD;
making critical contributions to the Commission of Audit’s final report; and
amalgamating the three bulk water entities – Seqwater, Linkwater and the South East Queensland Water Grid Manager.10
In addition, the department advised the Committee that some of the achievements during the year included:
the completion of the independent Commission of Audit and the provision of advice to the government on its response11;
delivering the budget;
leading the government’s involvement in intergovernmental reforms;
distribution of GST grants;
provision of advice on the economic impact on a number of national reforms;
implementation of a number of election and other commitments on behalf of government; and
completion of the review of Trade and Investment Queensland (TIQ).12
The Committee sought additional information from the department on the following areas:
departmental scoping studies;
management of the government’s shareholding relationship with GOCs;
economic modelling;
indicators of financial sustainability used in the performance reporting framework; and
royalty revenues
10 Queensland Treasury and Trade, Annual Report 2012-13, September 2013: 3 11 Mr Gray, Transcript 19 March 2014: 4 12 Mr Beavers, Transcript 19 March 2014: 4
Consideration of QTT Annual Report 2012-13
Finance and Administration Committee 7
2.2.1 Departmental scoping studies
The Committee asked the department whether scoping studies are considered to be commercial-in-confidence and the reasons why. The department advised that the latest scoping studies have been undertaken by the government through a committee – the Queensland Capital Project Committee – set up for that purpose. The committee is a subcommittee of cabinet and as such all the information relating to that committee is cabinet-in-confidence.
The Under Treasurer further advised that, in terms of commercial-in-confidence, judgements need to be made about whether costs should be revealed in scoping studies as this may give competitors an insight into bidding strategies and how they price scoping studies. The Under Treasurer confirmed that there are a number of scoping studies about the sale of assets currently being undertaken and that it is appropriate that, at this point in time, cost information remain commercial-in-confidence. He advised that to give commercial information to other parties could prejudice the government in terms of getting best possible value for money outcomes in the future.13
The department also confirmed that, at the time of the hearing, the scoping studies were still in the process of being completed.14
2.2.2 Management of GOCs
The Committee sought advice from the department regarding QTT’s role and responsibilities with respect to GOCs. The Under Treasurer advised that the department has a unit that is now called the Shareholders’ Monitoring Unit, which interacts on a regular basis with GOCs. He advised that:
It works with the GOCs in respect of their corporate plans and their statements of corporate intent, which are presented each year to the government as the shareholders and they are negotiated through a fairly extensive process of consultation with the management and the board of the GOCs. That is a major task that is undertaken around this time each year. That sets the overall strategy and direction for the organisations. It presents their five-year budget forecast and financial performance indicators.
During the course of the year that monitoring unit then monitors that performance during each quarter and presents a quarterly report to the Treasurer highlighting the performance estimated actual against budget, or actual year to date compared to budget. We raise any particular issues in consultation with, again, the board and management—the CEO and the CFO—where there are particular issues of concern, particular variations in performance compared to what was expected. So there is an ongoing process of consultation and fairly ongoing engagement with the GOCs during the course of the year.15
The Committee noted that in QTT’s response to Auditor-General’s Report No 9: 2013-14 – Results of Audit: Energy sector entities 2012-13, some of the indicators provided in the report are not included in the statements of corporate intent. The Committee asked the department to explain the reasoning for this exclusion and whether there is value in including these in the GOCs statement of corporate intent.
13 Mr Gray, Transcript 19 March 2014: 3 14 Mr Molloy, Transcript 19 March 2014: 6 15 Mr Gray, Transcript 19 March 2014: 5
Consideration of QTT Annual Report 2012-13
8 Finance and Administration Committee
The Under Treasurer advised that there are a number of financial performance measures and that GOCs present their financial statements and financial performance measures based on an agreed set of indicators that have been developed over a period of time. He advised that the department ensures a consistent set of indicators across the performance indicators across the GOCs to the maximum extent possible. The Under Treasurer noted that the Auditor-General chose to refer to several other performance indicators that are slightly different in nature but are variations on a theme. The Under Treasurer considered that the indicators selected by the Queensland Audit Office (QAO) do not add to the store of knowledge beyond the financial indicators they currently use, which are broadly in line with those used by credit rating agencies and markets in their analysis of the performance of companies.16
2.2.3 Economic Modelling
The Committee noted that QTT released a report in March 2014 titled Economic and fiscal challenges and asked the department about the scenarios and projections contained therein. The department advised that the projected scenarios contained in the document represents the midpoint scenario but also includes more optimistic assumptions to show the variability that exists.17 They explained that there is a subtle distinction between forecasts and projections in that there is a higher degree of precision in forecasts because specific information is obtained from departments. However, for the purposes of projections they do not go down to the same level of detail and are based on more broad based assumptions and rules of thumb about likely indicative expenditure trends over the period.18
The department advised that the core message from the modelling exercises is that there are structural weaknesses in the budget going forward and that something needs to be done to rectify this.19 The Under Treasurer confirmed that the broad trends reflect the conclusions arrived at in analysis done in a number of other jurisdictions. These conclusions include having an ageing population that is going to put more pressure on aged care and healthcare expenditure at the same time as there is a narrower tax and revenue bases because of a smaller proportion of the population being in the workforce. This results in expenditure pressures continuing to increase and revenue remaining fairly soft.20
The Under Treasurer also confirmed that the department had taken a fairly conservative view in preparing the projections including a reduced projected growth rate. He advised that the main drivers of economic grown are: population growth; participation rates and productivity.21
In analysing each of these three components they considered that:
population growth – is not going to provide the stimulus that it has in the past unless there are very high levels of interstate migration;
participation rate – analysis indicates that participation is probably topping out after having increased over the last 10 to 20 years due to female participation increasing; and
productivity growth – has been poor over past 10 years.22
The Under Treasurer considered that taking these factors into consideration has led to the conclusion of a fairly sober view of the future economic growth prospects unless policy are undertaken to stimulate high economic growth.23
16 Mr Gray, Transcript 19 March 2014: 6 17 Mr Molloy, Transcript 19 March 2014: 6 18 Mr Gray, Transcript 19 March 2014: 6 19 Mr Molloy, Transcript 19 March 2014: 6 20 Mr Gray, Transcript 19 March 2014: 7 21 Mr Gray, Transcript 19 March 2014: 7 22 Mr Gray, Transcript 19 March 2014: 7
Consideration of QTT Annual Report 2012-13
Finance and Administration Committee 9
2.2.4 Financial sustainability indicators
The Committee sought information on the indicators of financial sustainability to be used in the performance reporting framework.
The department advised that the Auditor-General in Report No 9: 2013-14 – Energy sector entities 2012-13 recommended that the following indicators be used in the performance reporting framework – operating surplus ratio, liquidity ratio, capital replacement and growth ratio and debt sustainability ratio. The Shareholders’ Monitoring Unit already calculates and reviews some of these ratios in the monthly monitoring undertaken on each GOC. They indicated that some of these ratios may change very little over time and may not provide any additional insight into the performance and position of the GOCs beyond that already visible in the underlying data.24
The department advised that, in line with the commitment provided in QTT’s response to the Auditor-General’s report, the Shareholders’ Monitoring Unit has commenced a review of the sustainability indicators suggested by the Auditor-General. They indicated that this review is well progressed and is assessing each ratio on its merits. They also indicated that, if warranted, a plan will be developed for adopting any new ratios which provide additional value compared to the indicators already measured and reported. They advised that, if implemented, into either the GOC’s Statements of Corporate Intent (SCI) or the monthly monitoring process (key aspects of the performance reporting framework).25
The department advised that the review is ongoing but it is anticipated that, following consultation with the Department of Energy and Water Supply (DEWS), a report on the findings of the review will be completed in the coming months. The findings of the review will dictate the next steps, but may include wider formal consultation (including with GOCs) and/or sectors beyond the energy sector.26
The Committee also sought information from QTT regarding the future sustainability of GOCs under changing consumer demand and green energy technologies. QTT advised that they will continue to work closely with the GOCs on future trends. They noted that GOCs are very conscious of industry trends and directions. They noted that one of the challenges with GOCs is the need to be nimble and agile and flexible enough to respond to rapidly changing commercial environments.27
2.2.5 Committee Comments
The Committee considers accepts that the review of the sustainability indicators is ongoing and being undertaken in consultation with DEWS. However, the Committee also considers that both the Auditor-General and the relevant parliamentary committees, including the FAC and the State Development, Infrastructure and Industry Committee (SDIIC) in respect of the energy sector, should be included as part of the consultation process.
Recommendation 1
The Committee recommends that the Auditor-General and the relevant parliamentary committees be included in any consultation process regarding changes to the performance reporting framework.
23 Mr Gray, Transcript 19 March 2014: 7 24 Correspondence from Mr M Gray, Under Treasurer, QTT, to FAC dated 1 April 2014: 2 25 Correspondence from Mr M Gray, Under Treasurer, QTT, to FAC dated 1 April 2014: 2 26 Correspondence from Mr M Gray, Under Treasurer, QTT, to FAC dated 1 April 2014: 3 27 Mr Gray, Transcript 19 March 2014: 8
Consideration of QTT Annual Report 2012-13
10 Finance and Administration Committee
2.2.6 Royalty Revenues
The Committee noted that varying sources royalty revenues impact on the state’s bottom line and sought information regarding this type of revenue and the impact on GOCs. QTT confirmed that coal royalties have been deteriorating and royalties from the LNG industry have become a very prospective source of income for the state.28
However, QTT noted that Australia operates under the system of fiscal equalisation, which means that when a state has more capacity than other states to raise a particular type of revenue, it ultimately gets redistributed amongst the states. This is to enable all states to be able to provide the same level of services to their citizens. The department advised that whilst they anticipate growth in LNG royalties, in the long run a lot of these gains are redistributed to the other states. They advised that they therefore need to be cautious in how much they translate to the bottom line because it ultimately affects GST distributions.29
2.3 Challenges
The Under Treasurer informed the Committee that QTT has a number of challenges on the horizon, including preparing the 2014-15 Budget for the new AAS requirement for GGS agencies to show their budget versus actual results and providing explanations for significant variances. The second challenge is the ongoing work being undertaken by Projects Queensland on a variety of projects such as the Toowoomba second range crossing and the underground bus and train project for Brisbane. The third challenge is assisting the government with implementing recommendations from the Commission of Audit.30
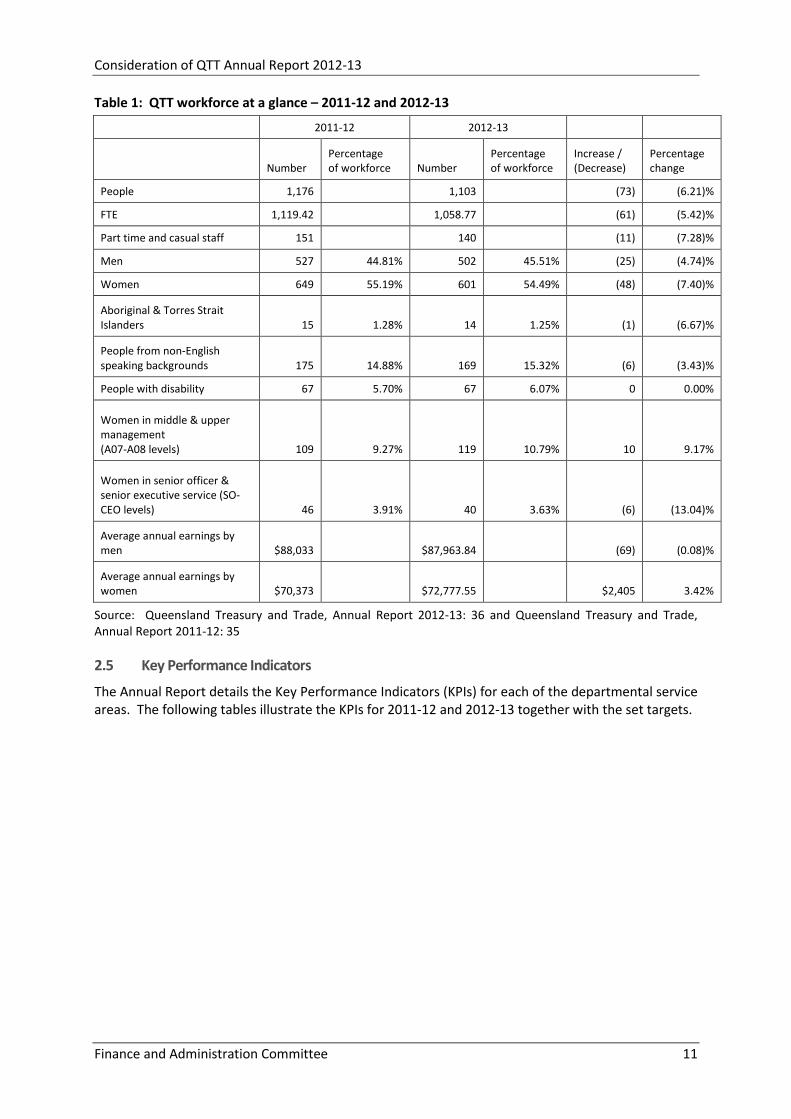
2.4 Departmental workforce
The Annual report identifies that the QTT workforce decreased in size during 2012-13 due to the implementation of the whole of government workforce reforms. Table 1 below details the QTT workforce as at 30 June 2013 in comparison to 30 June 2012.
The Annual report identifies that a program of voluntary redundancies was implemented during 2012-13. It identifies that 74 employees received redundancy packages at a cost of $5.099million, including one voluntary redundancy funded by the MAIC.31
The report notes that employees who did not accept an offer of a redundancy were offered case management for a set period of time, where reasonable attempts were made to find alternative employment placements. At the conclusion of this period, and where it was deemed that continued attempts of ongoing placement were no longer appropriate, employees yet to be placed were terminated and paid a retrenchment package. During the period, two employees received retrenchment packages at a total of $94,000.32
28 Mr Gray, Transcript 19 March 2014: 8 29 Mr Molloy, Transcript 19 March 2014: 8-9 30 Mr Gray, Transcript 19 March 2014: 2 31 Queensland Treasury and Trade, Annual Report 2012-13, September 2013: 37 32 Queensland Treasury and Trade, Annual Report 2012-13, September 2013: 37
Consideration of QTT Annual Report 2012-13
Finance and Administration Committee 11
Table 1: QTT workforce at a glance – 2011-12 and 2012-13
2011-12 2012-13
Number Percentage of workforce Number
Percentage of workforce
Increase / (Decrease)
Percentage change
People 1,176 1,103 (73) (6.21)%
FTE 1,119.42 1,058.77 (61) (5.42)%
Part time and casual staff 151 140 (11) (7.28)%
Men 527 44.81% 502 45.51% (25) (4.74)%
Women 649 55.19% 601 54.49% (48) (7.40)%
Aboriginal & Torres Strait Islanders 15 1.28% 14 1.25% (1) (6.67)%
People from non-English speaking backgrounds 175 14.88% 169 15.32% (6) (3.43)%
People with disability 67 5.70% 67 6.07% 0 0.00%
Women in middle & upper management (A07-A08 levels) 109 9.27% 119 10.79% 10 9.17%
Women in senior officer & senior executive service (SO-CEO levels) 46 3.91% 40 3.63% (6) (13.04)%
Average annual earnings by men $88,033 $87,963.84 (69) (0.08)%
Average annual earnings by women $70,373 $72,777.55 $2,405 3.42%
Source: Queensland Treasury and Trade, Annual Report 2012-13: 36 and Queensland Treasury and Trade, Annual Report 2011-12: 35
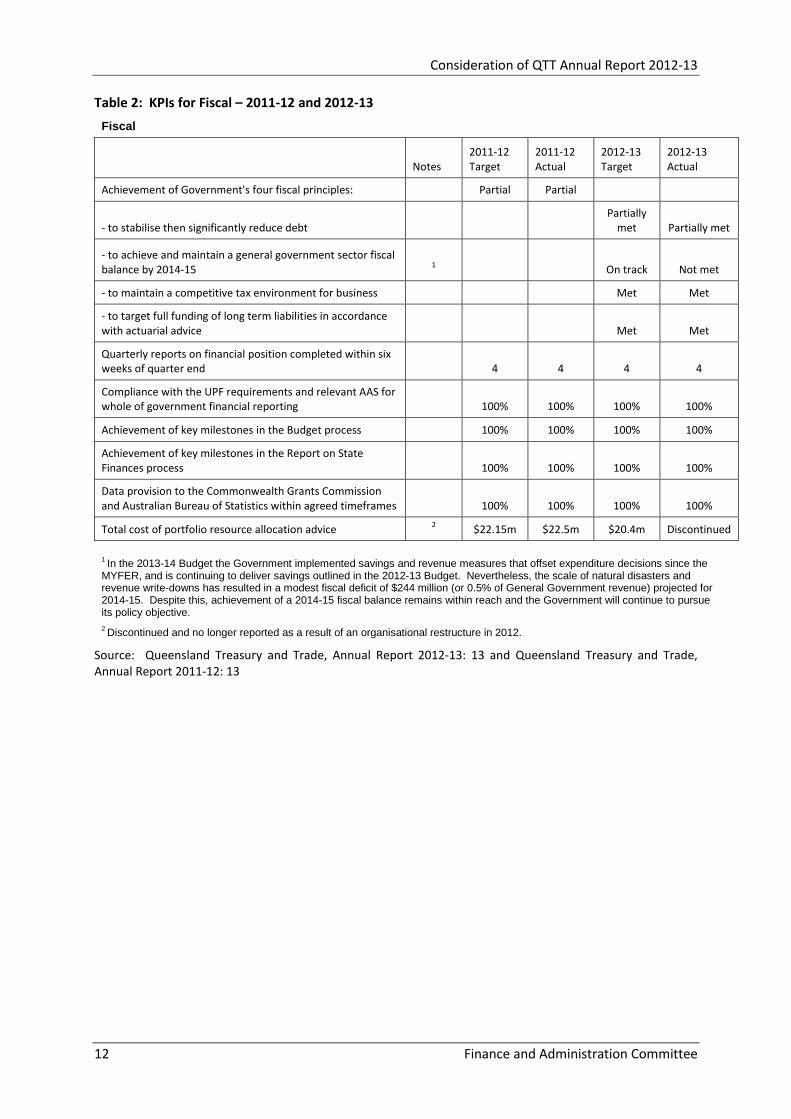
2.5 Key Performance Indicators
The Annual Report details the Key Performance Indicators (KPIs) for each of the departmental service areas. The following tables illustrate the KPIs for 2011-12 and 2012-13 together with the set targets.
Consideration of QTT Annual Report 2012-13
12 Finance and Administration Committee
Table 2: KPIs for Fiscal – 2011-12 and 2012-13 Fiscal
Notes
2011-12 Target
2011-12 Actual
2012-13 Target
2012-13 Actual
Achievement of Government's four fiscal principles: Partial Partial
- to stabilise then significantly reduce debt Partially
met Partially met
- to achieve and maintain a general government sector fiscal balance by 2014-15 1
On track
Not met
- to maintain a competitive tax environment for business Met Met
- to target full funding of long term liabilities in accordance with actuarial advice Met Met
Quarterly reports on financial position completed within six weeks of quarter end
4 4 4 4
Compliance with the UPF requirements and relevant AAS for whole of government financial reporting 100% 100% 100% 100%
Achievement of key milestones in the Budget process 100% 100% 100% 100%
Achievement of key milestones in the Report on State Finances process 100% 100% 100% 100%
Data provision to the Commonwealth Grants Commission and Australian Bureau of Statistics within agreed timeframes 100% 100% 100% 100%
Total cost of portfolio resource allocation advice 2 $22.15m $22.5m $20.4m Discontinued
1 In the 2013-14 Budget the Government implemented savings and revenue measures that offset expenditure decisions since the MYFER, and is continuing to deliver savings outlined in the 2012-13 Budget. Nevertheless, the scale of natural disasters and revenue write-downs has resulted in a modest fiscal deficit of $244 million (or 0.5% of General Government revenue) projected for 2014-15. Despite this, achievement of a 2014-15 fiscal balance remains within reach and the Government will continue to pursue its policy objective. 2 Discontinued and no longer reported as a result of an organisational restructure in 2012.
Source: Queensland Treasury and Trade, Annual Report 2012-13: 13 and Queensland Treasury and Trade, Annual Report 2011-12: 13
Consideration of QTT Annual Report 2012-13
Finance and Administration Committee 13
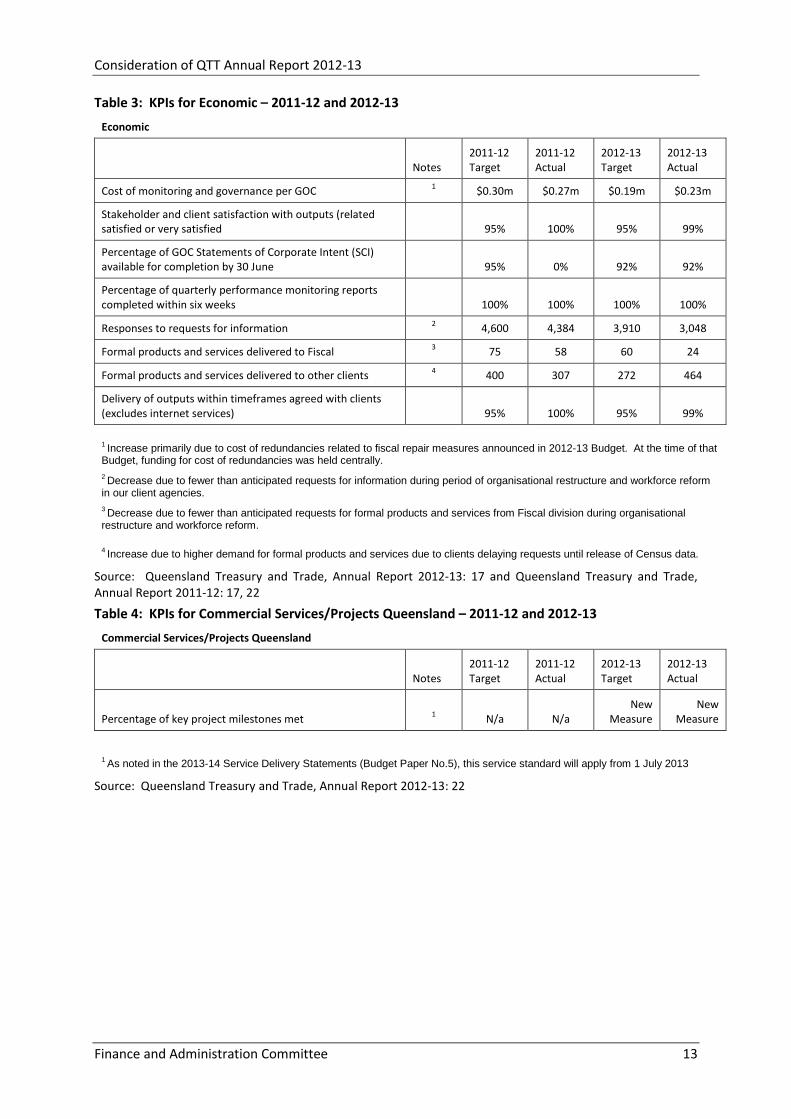
Table 3: KPIs for Economic – 2011-12 and 2012-13
Economic
Notes
2011-12 Target
2011-12 Actual
2012-13 Target
2012-13 Actual
Cost of monitoring and governance per GOC 1 $0.30m $0.27m $0.19m $0.23m
Stakeholder and client satisfaction with outputs (related satisfied or very satisfied
95% 100% 95% 99%
Percentage of GOC Statements of Corporate Intent (SCI) available for completion by 30 June 95% 0% 92% 92%
Percentage of quarterly performance monitoring reports completed within six weeks 100% 100% 100% 100%
Responses to requests for information 2 4,600 4,384 3,910 3,048
Formal products and services delivered to Fiscal 3 75 58 60 24
Formal products and services delivered to other clients 4 400 307 272 464
Delivery of outputs within timeframes agreed with clients (excludes internet services) 95% 100% 95% 99%
1 Increase primarily due to cost of redundancies related to fiscal repair measures announced in 2012-13 Budget. At the time of that Budget, funding for cost of redundancies was held centrally. 2 Decrease due to fewer than anticipated requests for information during period of organisational restructure and workforce reform in our client agencies. 3 Decrease due to fewer than anticipated requests for formal products and services from Fiscal division during organisational restructure and workforce reform.
4 Increase due to higher demand for formal products and services due to clients delaying requests until release of Census data.
Source: Queensland Treasury and Trade, Annual Report 2012-13: 17 and Queensland Treasury and Trade, Annual Report 2011-12: 17, 22
Table 4: KPIs for Commercial Services/Projects Queensland – 2011-12 and 2012-13
Commercial Services/Projects Queensland
Notes
2011-12 Target
2011-12 Actual
2012-13 Target
2012-13 Actual
Percentage of key project milestones met 1 N/a N/a New
Measure New
Measure
1 As noted in the 2013-14 Service Delivery Statements (Budget Paper No.5), this service standard will apply from 1 July 2013 Source: Queensland Treasury and Trade, Annual Report 2012-13: 22
Consideration of QTT Annual Report 2012-13
14 Finance and Administration Committee
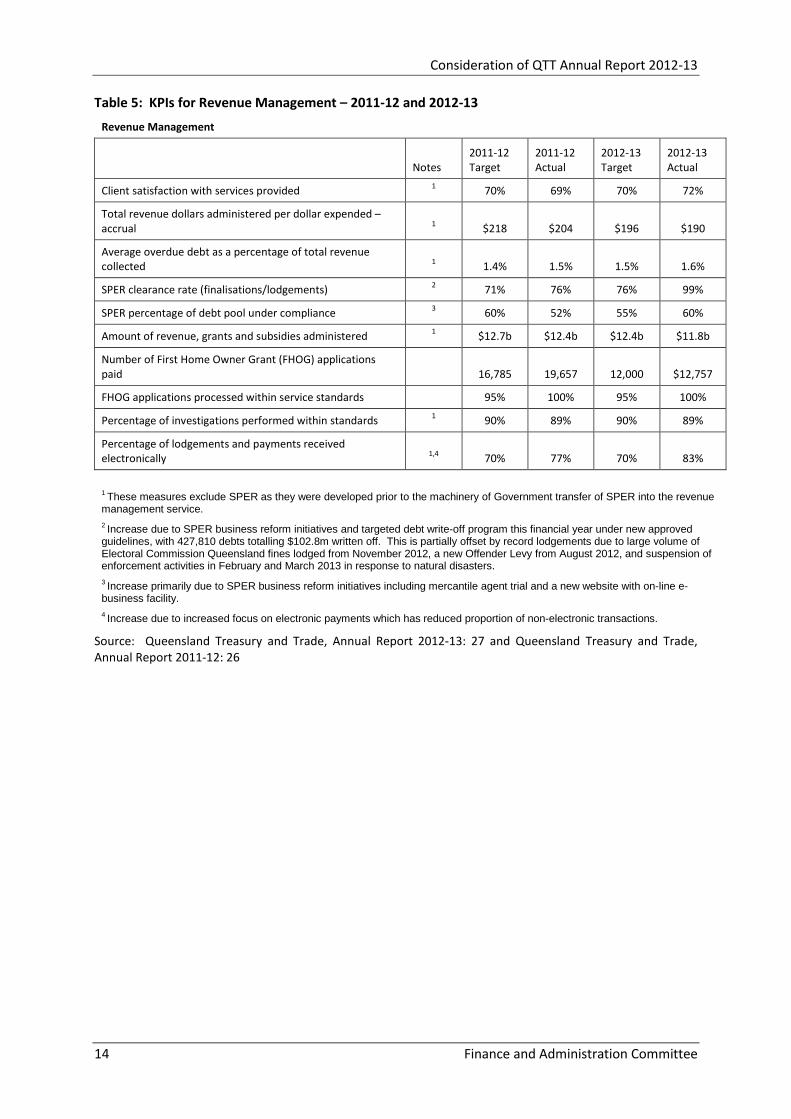
Table 5: KPIs for Revenue Management – 2011-12 and 2012-13
Revenue Management
Notes
2011-12 Target
2011-12 Actual
2012-13 Target
2012-13 Actual
Client satisfaction with services provided 1 70% 69% 70% 72%
Total revenue dollars administered per dollar expended – accrual 1 $218 $204 $196 $190
Average overdue debt as a percentage of total revenue collected 1 1.4% 1.5% 1.5% 1.6%
SPER clearance rate (finalisations/lodgements) 2 71% 76% 76% 99%
SPER percentage of debt pool under compliance 3 60% 52% 55% 60%
Amount of revenue, grants and subsidies administered 1 $12.7b $12.4b $12.4b $11.8b
Number of First Home Owner Grant (FHOG) applications paid 16,785 19,657 12,000 $12,757
FHOG applications processed within service standards 95% 100% 95% 100%
Percentage of investigations performed within standards 1 90% 89% 90% 89%
Percentage of lodgements and payments received electronically 1,4 70% 77% 70% 83%
1 These measures exclude SPER as they were developed prior to the machinery of Government transfer of SPER into the revenue management service. 2 Increase due to SPER business reform initiatives and targeted debt write-off program this financial year under new approved guidelines, with 427,810 debts totalling $102.8m written off. This is partially offset by record lodgements due to large volume of Electoral Commission Queensland fines lodged from November 2012, a new Offender Levy from August 2012, and suspension of enforcement activities in February and March 2013 in response to natural disasters. 3 Increase primarily due to SPER business reform initiatives including mercantile agent trial and a new website with on-line e-business facility. 4 Increase due to increased focus on electronic payments which has reduced proportion of non-electronic transactions.
Source: Queensland Treasury and Trade, Annual Report 2012-13: 27 and Queensland Treasury and Trade, Annual Report 2011-12: 26
Consideration of QTT Annual Report 2012-13
Finance and Administration Committee 15
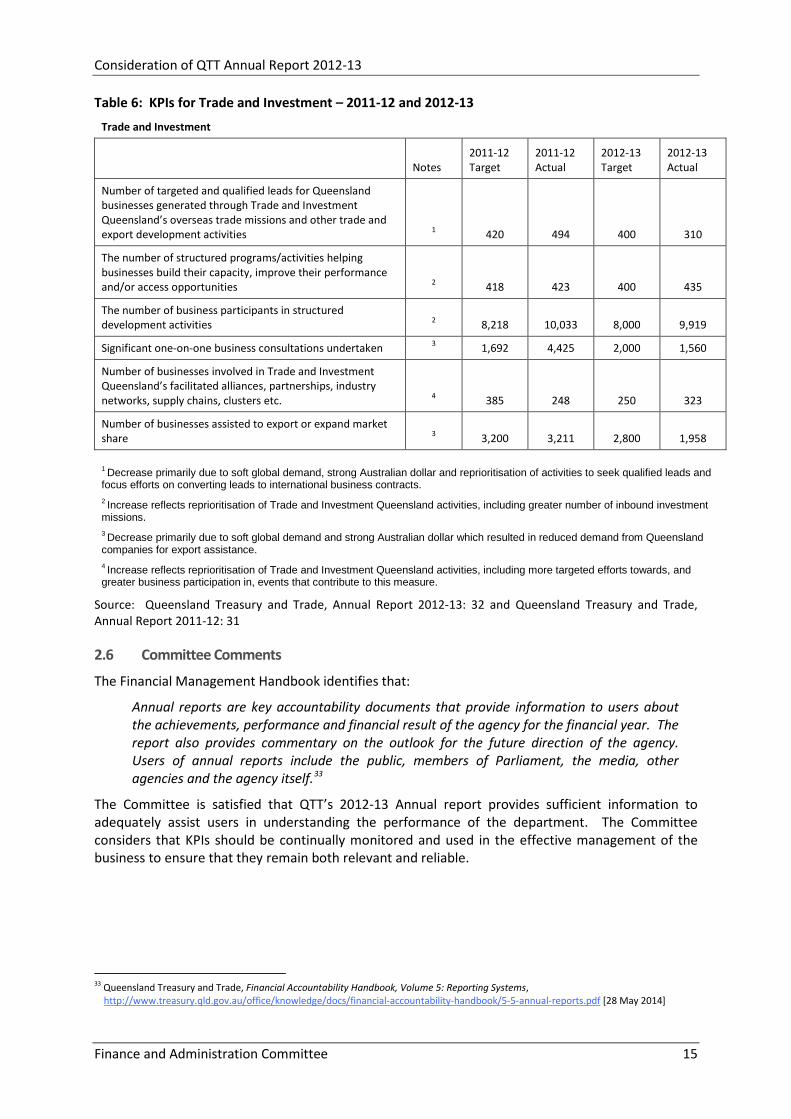
Table 6: KPIs for Trade and Investment – 2011-12 and 2012-13
Trade and Investment
Notes
2011-12 Target
2011-12 Actual
2012-13 Target
2012-13 Actual
Number of targeted and qualified leads for Queensland businesses generated through Trade and Investment Queensland’s overseas trade missions and other trade and export development activities 1 420 494 400 310
The number of structured programs/activities helping businesses build their capacity, improve their performance and/or access opportunities 2 418 423 400 435
The number of business participants in structured development activities 2 8,218 10,033 8,000 9,919
Significant one-on-one business consultations undertaken 3 1,692 4,425 2,000 1,560
Number of businesses involved in Trade and Investment Queensland’s facilitated alliances, partnerships, industry networks, supply chains, clusters etc. 4 385 248 250 323
Number of businesses assisted to export or expand market share 3 3,200 3,211 2,800 1,958
1 Decrease primarily due to soft global demand, strong Australian dollar and reprioritisation of activities to seek qualified leads and focus efforts on converting leads to international business contracts. 2 Increase reflects reprioritisation of Trade and Investment Queensland activities, including greater number of inbound investment missions. 3 Decrease primarily due to soft global demand and strong Australian dollar which resulted in reduced demand from Queensland companies for export assistance. 4 Increase reflects reprioritisation of Trade and Investment Queensland activities, including more targeted efforts towards, and greater business participation in, events that contribute to this measure.
Source: Queensland Treasury and Trade, Annual Report 2012-13: 32 and Queensland Treasury and Trade, Annual Report 2011-12: 31
2.6 Committee Comments
The Financial Management Handbook identifies that:
Annual reports are key accountability documents that provide information to users about the achievements, performance and financial result of the agency for the financial year. The report also provides commentary on the outlook for the future direction of the agency. Users of annual reports include the public, members of Parliament, the media, other agencies and the agency itself.33
The Committee is satisfied that QTT’s 2012-13 Annual report provides sufficient information to adequately assist users in understanding the performance of the department. The Committee considers that KPIs should be continually monitored and used in the effective management of the business to ensure that they remain both relevant and reliable.
33 Queensland Treasury and Trade, Financial Accountability Handbook, Volume 5: Reporting Systems,
http://www.treasury.qld.gov.au/office/knowledge/docs/financial-accountability-handbook/5-5-annual-reports.pdf [28 May 2014]
Consideration of QTT Annual Report 2012-13
16 Finance and Administration Committee
3 Financial Statements 2012-13
Section 50 of the FPMS provides that the annual report of a department or statutory body must include:
the annual financial statements, including the management and audit certificates, and
the information required by the Annual Report Requirements for Queensland Government Agencies as prepared and released by DPC.
The Financial Management Handbook states that when reproducing the financial statements in the annual report, they must be exactly the same as those audited and certified by the Auditor-General (or delegate). No changes, however minor, are permitted.34
The FAA (section 77) also requires that the Chief Finance Officer (CFO) must give the accountable officer a statement about whether the financial internal controls of the department are operating efficiently, effectively and economically. The statement must be given to the accountable officer in the way and at the time stated in the FPMS.35 The annual report states that the CFO provided a statement to the accountable officer, the then Under Treasurer, assuring her of the efficiency, effectiveness and economy of the department’s financial operations and governance. This statement indicated not deficiencies or breakdowns in internal controls which would impact adversely on the financial statements or governance for the year.36
The Annual Report notes that:
QTT ensures it has appropriate and relevant policies, processes, systems and controls to ensure it operates within its budget, achieves value for money and minimises its costs and risks in relation to its liabilities. All divisions of QTT provide regular assurance as to the operation of internal controls and fraud detection processes.37
QTT’s financial statements fall into two categories:
Administered, which report on the funds QTT administers on behalf of the Queensland Government in its role as the State’s financial manager; and
Controlled, which disclose the revenue, expenses, assets and liabilities used to conduct Queensland Treasury and Trade business.38
In 2012–13, QTT administered $24.96 billion of revenue and $7.91 billion of expenses on behalf of the State. This excludes administered item revenue which is appropriation revenue received from the Consolidated Fund to meet administered expenses.39
QTT’s controlled revenues consist principally of Parliamentary appropriations. In 2011–12, revenue allocated to services was $192.69 million (compared with $154.75 million in 2011-12). The increase was predominantly due to the full year impact of the machinery-of-Government transfers of TIQ and the State Penalties Enforcement Registry (SPER) into the department.40
34 Queensland Treasury and Trade, Financial Accountability Handbook, Volume 5: Reporting Systems,
http://www.treasury.qld.gov.au/office/knowledge/docs/financial-accountability-handbook/5-5-annual-reports.pdf [28 May 2014] 35 Financial Accountability Act 2009, section 77 36 Queensland Treasury and Trade, Annual Report 2012-13, September 2013: 46 37 Queensland Treasury and Trade, Annual Report 2012-13, September 2013: 46 38 Queensland Treasury and Trade, Annual Report 2012-13, September 2013: 46 39 Queensland Treasury and Trade, Annual Report 2012-13, September 2013: 46 40 Queensland Treasury and Trade, Annual Report 2012-13, September 2013: 46
Consideration of QTT Annual Report 2012-13
Finance and Administration Committee 17
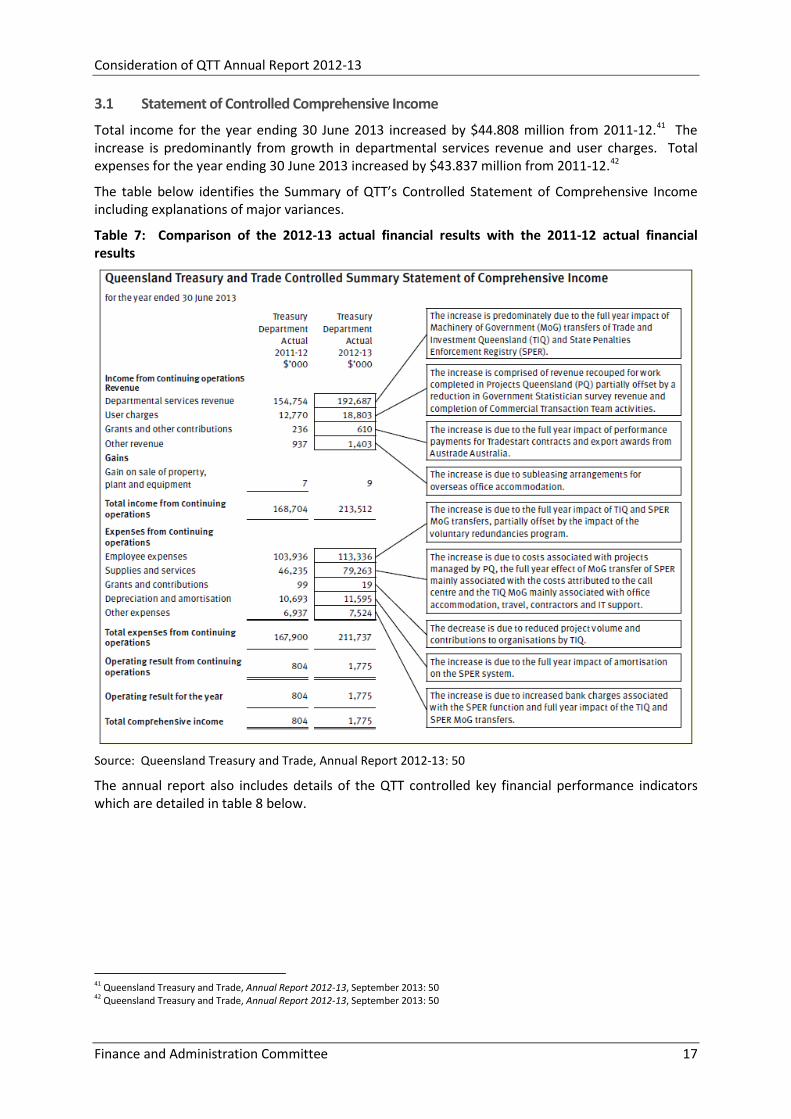
3.1 Statement of Controlled Comprehensive Income
Total income for the year ending 30 June 2013 increased by $44.808 million from 2011-12.41 The increase is predominantly from growth in departmental services revenue and user charges. Total expenses for the year ending 30 June 2013 increased by $43.837 million from 2011-12.42
The table below identifies the Summary of QTT’s Controlled Statement of Comprehensive Income including explanations of major variances.
Table 7: Comparison of the 2012-13 actual financial results with the 2011-12 actual financial results
Source: Queensland Treasury and Trade, Annual Report 2012-13: 50
The annual report also includes details of the QTT controlled key financial performance indicators which are detailed in table 8 below.
41 Queensland Treasury and Trade, Annual Report 2012-13, September 2013: 50 42 Queensland Treasury and Trade, Annual Report 2012-13, September 2013: 50
Consideration of QTT Annual Report 2012-13
18 Finance and Administration Committee
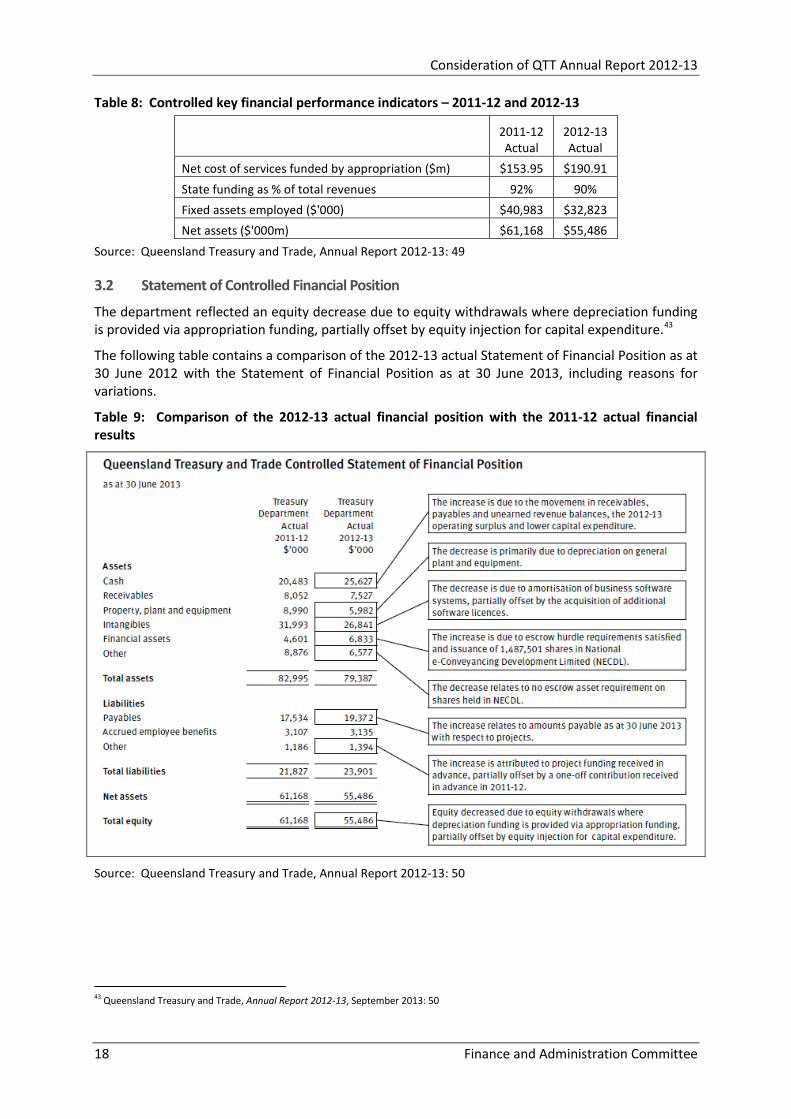
Table 8: Controlled key financial performance indicators – 2011-12 and 2012-13
2011-12 Actual
2012-13 Actual
Net cost of services funded by appropriation ($m) $153.95 $190.91 State funding as % of total revenues 92% 90% Fixed assets employed ($'000) $40,983 $32,823 Net assets ($'000m) $61,168 $55,486
Source: Queensland Treasury and Trade, Annual Report 2012-13: 49
3.2 Statement of Controlled Financial Position
The department reflected an equity decrease due to equity withdrawals where depreciation funding is provided via appropriation funding, partially offset by equity injection for capital expenditure.43
The following table contains a comparison of the 2012-13 actual Statement of Financial Position as at 30 June 2012 with the Statement of Financial Position as at 30 June 2013, including reasons for variations.
Table 9: Comparison of the 2012-13 actual financial position with the 2011-12 actual financial results
Source: Queensland Treasury and Trade, Annual Report 2012-13: 50
43 Queensland Treasury and Trade, Annual Report 2012-13, September 2013: 50
Consideration of QTT Annual Report 2012-13
Finance and Administration Committee 19
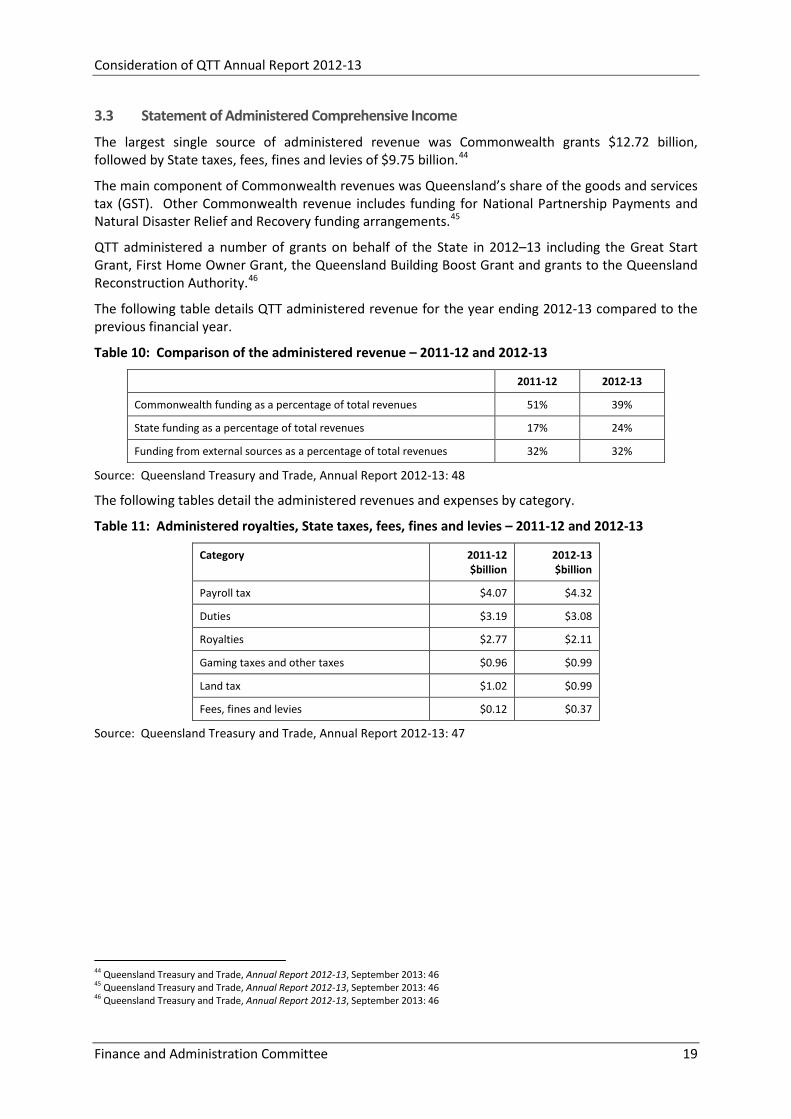
3.3 Statement of Administered Comprehensive Income
The largest single source of administered revenue was Commonwealth grants $12.72 billion, followed by State taxes, fees, fines and levies of $9.75 billion.44
The main component of Commonwealth revenues was Queensland’s share of the goods and services tax (GST). Other Commonwealth revenue includes funding for National Partnership Payments and Natural Disaster Relief and Recovery funding arrangements.45
QTT administered a number of grants on behalf of the State in 2012–13 including the Great Start Grant, First Home Owner Grant, the Queensland Building Boost Grant and grants to the Queensland Reconstruction Authority.46
The following table details QTT administered revenue for the year ending 2012-13 compared to the previous financial year.
Table 10: Comparison of the administered revenue – 2011-12 and 2012-13
2011-12 2012-13
Commonwealth funding as a percentage of total revenues 51% 39%
State funding as a percentage of total revenues 17% 24%
Funding from external sources as a percentage of total revenues 32% 32%
Source: Queensland Treasury and Trade, Annual Report 2012-13: 48
The following tables detail the administered revenues and expenses by category.
Table 11: Administered royalties, State taxes, fees, fines and levies – 2011-12 and 2012-13
Category 2011-12 $billion
2012-13 $billion
Payroll tax $4.07 $4.32
Duties $3.19 $3.08
Royalties $2.77 $2.11
Gaming taxes and other taxes $0.96 $0.99
Land tax $1.02 $0.99
Fees, fines and levies $0.12 $0.37
Source: Queensland Treasury and Trade, Annual Report 2012-13: 47
44 Queensland Treasury and Trade, Annual Report 2012-13, September 2013: 46 45 Queensland Treasury and Trade, Annual Report 2012-13, September 2013: 46 46 Queensland Treasury and Trade, Annual Report 2012-13, September 2013: 46
Consideration of QTT Annual Report 2012-13
20 Finance and Administration Committee
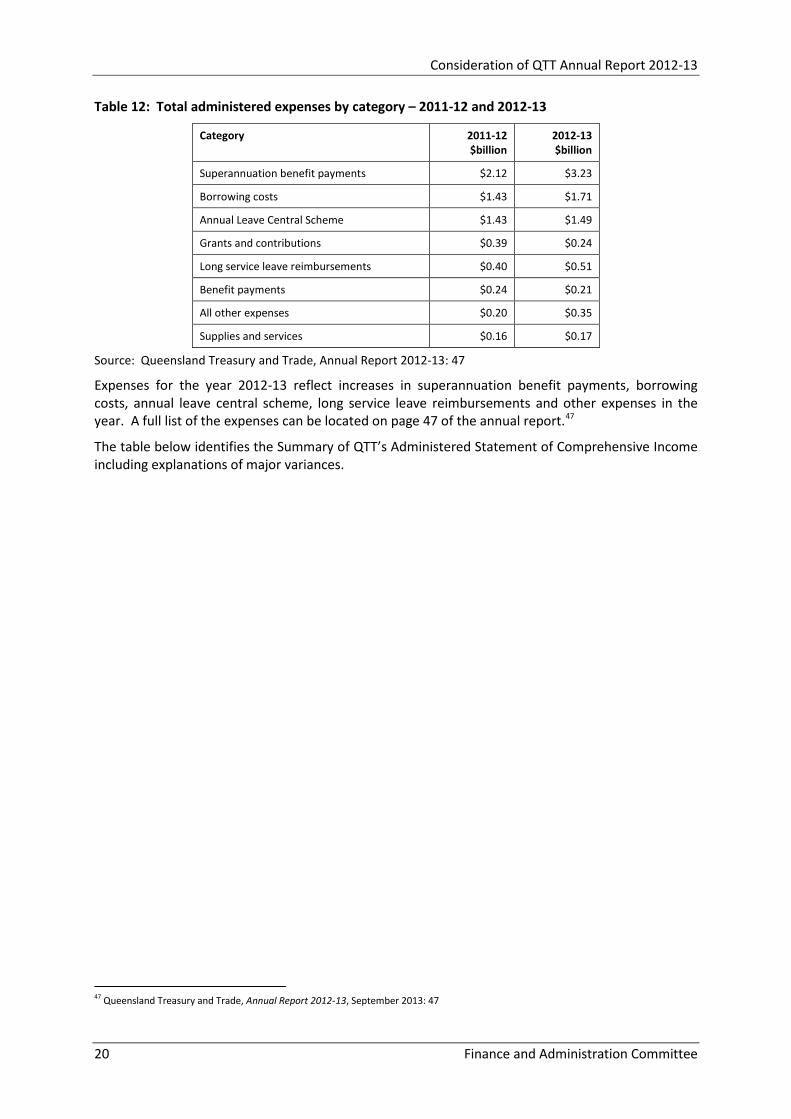
Table 12: Total administered expenses by category – 2011-12 and 2012-13
Category 2011-12 $billion
2012-13 $billion
Superannuation benefit payments $2.12 $3.23
Borrowing costs $1.43 $1.71
Annual Leave Central Scheme $1.43 $1.49
Grants and contributions $0.39 $0.24
Long service leave reimbursements $0.40 $0.51
Benefit payments $0.24 $0.21
All other expenses $0.20 $0.35
Supplies and services $0.16 $0.17
Source: Queensland Treasury and Trade, Annual Report 2012-13: 47
Expenses for the year 2012-13 reflect increases in superannuation benefit payments, borrowing costs, annual leave central scheme, long service leave reimbursements and other expenses in the year. A full list of the expenses can be located on page 47 of the annual report.47
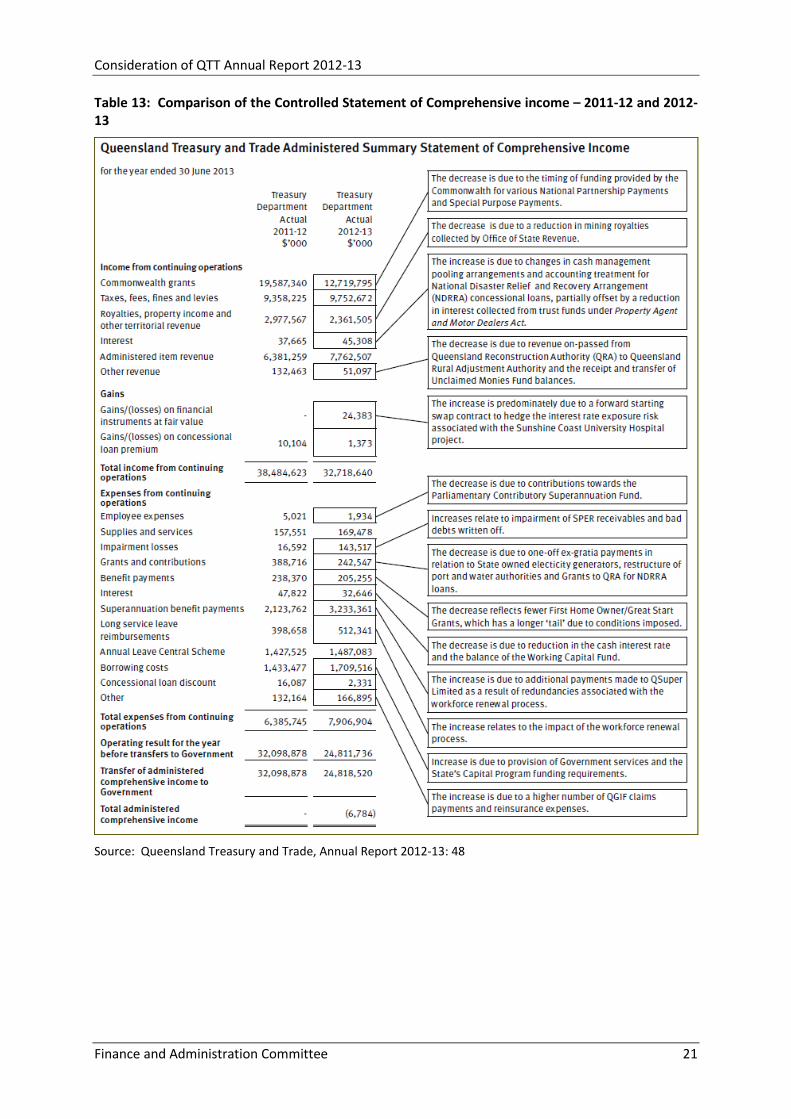
The table below identifies the Summary of QTT’s Administered Statement of Comprehensive Income including explanations of major variances.
47 Queensland Treasury and Trade, Annual Report 2012-13, September 2013: 47
Consideration of QTT Annual Report 2012-13
Finance and Administration Committee 21
Table 13: Comparison of the Controlled Statement of Comprehensive income – 2011-12 and 2012-13
Source: Queensland Treasury and Trade, Annual Report 2012-13: 48
Consideration of QTT Annual Report 2012-13
22 Finance and Administration Committee
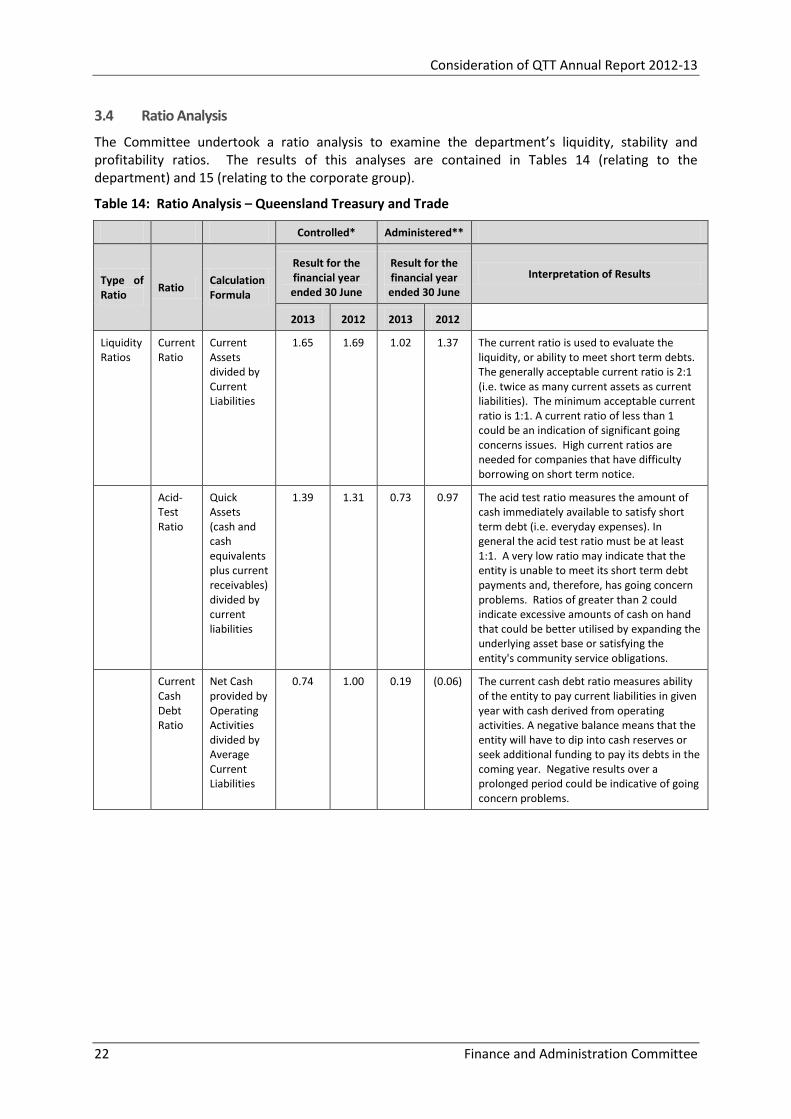
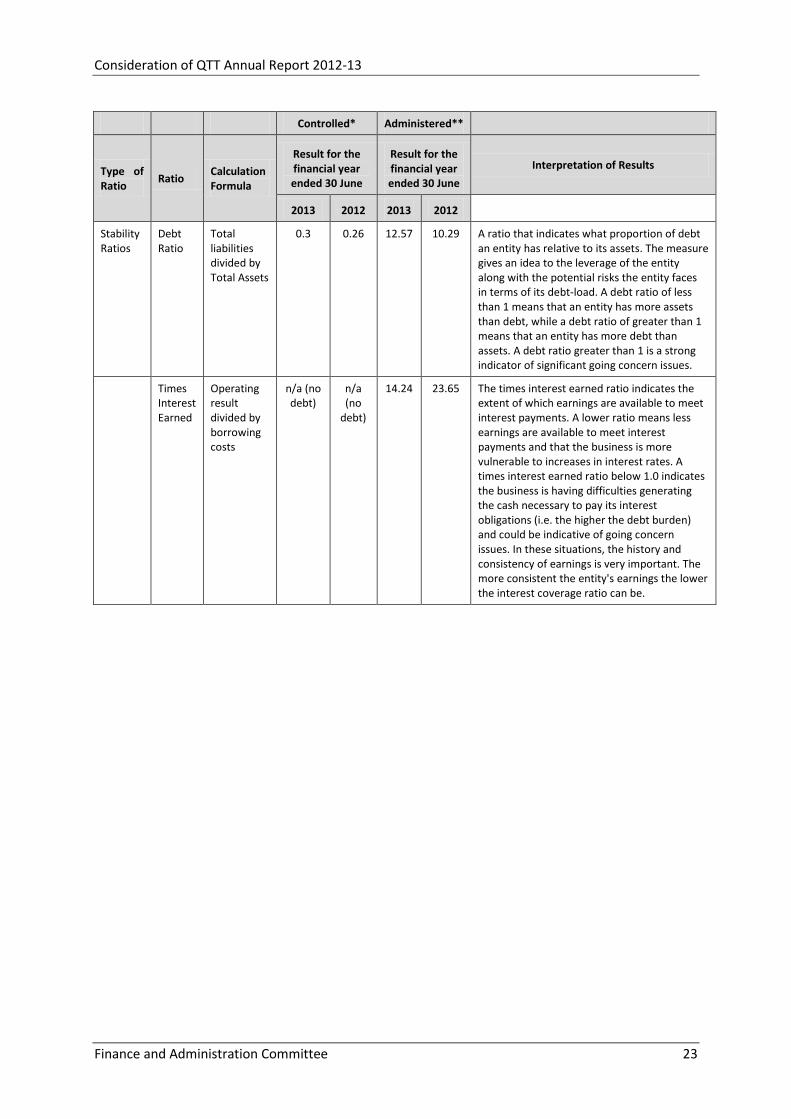
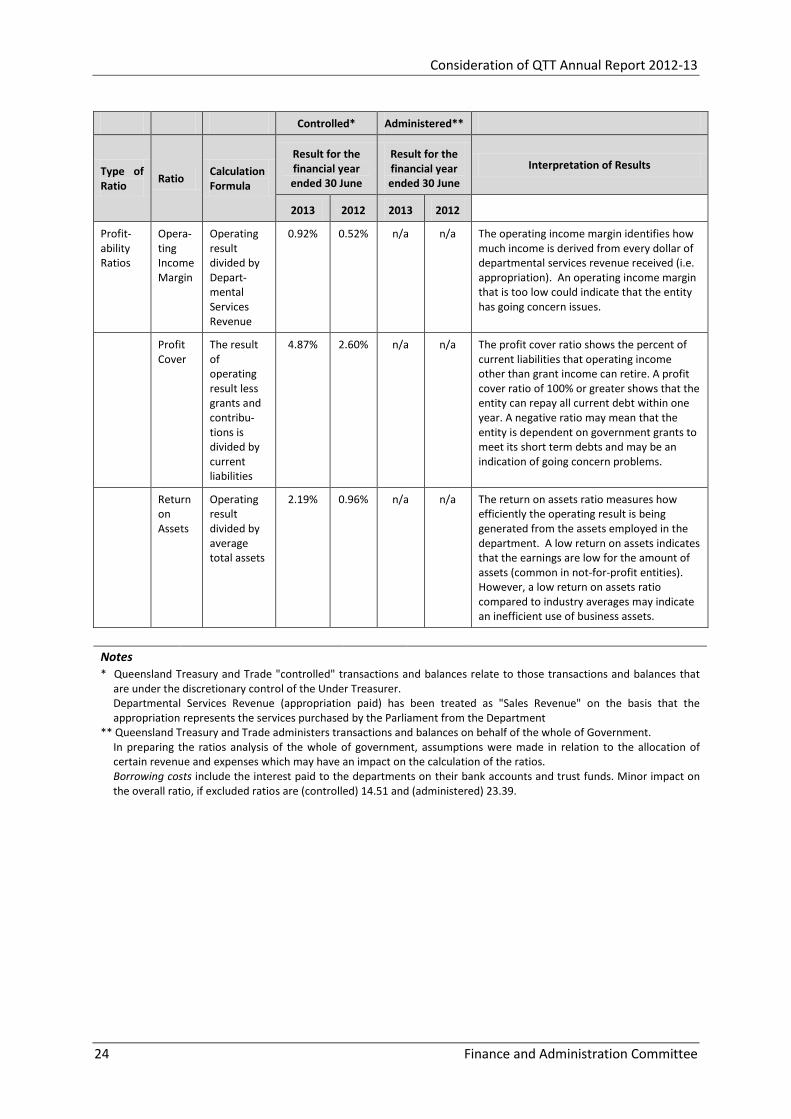
3.4 Ratio Analysis
The Committee undertook a ratio analysis to examine the department’s liquidity, stability and profitability ratios. The results of this analyses are contained in Tables 14 (relating to the department) and 15 (relating to the corporate group).
Table 14: Ratio Analysis – Queensland Treasury and Trade
Controlled* Administered**
Type of Ratio Ratio Calculation
Formula
Result for the financial year ended 30 June
Result for the financial year ended 30 June
Interpretation of Results
2013 2012 2013 2012
Liquidity Ratios
Current Ratio
Current Assets divided by Current Liabilities
1.65 1.69 1.02 1.37 The current ratio is used to evaluate the liquidity, or ability to meet short term debts. The generally acceptable current ratio is 2:1 (i.e. twice as many current assets as current liabilities). The minimum acceptable current ratio is 1:1. A current ratio of less than 1 could be an indication of significant going concerns issues. High current ratios are needed for companies that have difficulty borrowing on short term notice.
Acid-Test Ratio
Quick Assets (cash and cash equivalents plus current receivables) divided by current liabilities
1.39 1.31 0.73 0.97 The acid test ratio measures the amount of cash immediately available to satisfy short term debt (i.e. everyday expenses). In general the acid test ratio must be at least 1:1. A very low ratio may indicate that the entity is unable to meet its short term debt payments and, therefore, has going concern problems. Ratios of greater than 2 could indicate excessive amounts of cash on hand that could be better utilised by expanding the underlying asset base or satisfying the entity's community service obligations.
Current Cash Debt Ratio
Net Cash provided by Operating Activities divided by Average Current Liabilities
0.74 1.00 0.19 (0.06) The current cash debt ratio measures ability of the entity to pay current liabilities in given year with cash derived from operating activities. A negative balance means that the entity will have to dip into cash reserves or seek additional funding to pay its debts in the coming year. Negative results over a prolonged period could be indicative of going concern problems.
Consideration of QTT Annual Report 2012-13
Finance and Administration Committee 23
Controlled* Administered**
Type of Ratio Ratio Calculation
Formula
Result for the financial year ended 30 June
Result for the financial year ended 30 June
Interpretation of Results
2013 2012 2013 2012
Stability Ratios
Debt Ratio
Total liabilities divided by Total Assets
0.3 0.26 12.57 10.29 A ratio that indicates what proportion of debt an entity has relative to its assets. The measure gives an idea to the leverage of the entity along with the potential risks the entity faces in terms of its debt-load. A debt ratio of less than 1 means that an entity has more assets than debt, while a debt ratio of greater than 1 means that an entity has more debt than assets. A debt ratio greater than 1 is a strong indicator of significant going concern issues.
Times Interest Earned
Operating result divided by borrowing costs
n/a (no debt)
n/a (no
debt)
14.24 23.65 The times interest earned ratio indicates the extent of which earnings are available to meet interest payments. A lower ratio means less earnings are available to meet interest payments and that the business is more vulnerable to increases in interest rates. A times interest earned ratio below 1.0 indicates the business is having difficulties generating the cash necessary to pay its interest obligations (i.e. the higher the debt burden) and could be indicative of going concern issues. In these situations, the history and consistency of earnings is very important. The more consistent the entity's earnings the lower the interest coverage ratio can be.
Consideration of QTT Annual Report 2012-13
24 Finance and Administration Committee
Controlled* Administered**
Type of Ratio Ratio Calculation
Formula
Result for the financial year ended 30 June
Result for the financial year ended 30 June
Interpretation of Results
2013 2012 2013 2012
Profit-ability Ratios
Opera-ting Income Margin
Operating result divided by Depart-mental Services Revenue
0.92% 0.52% n/a n/a The operating income margin identifies how much income is derived from every dollar of departmental services revenue received (i.e. appropriation). An operating income margin that is too low could indicate that the entity has going concern issues.
Profit Cover
The result of operating result less grants and contribu-tions is divided by current liabilities
4.87% 2.60% n/a n/a The profit cover ratio shows the percent of current liabilities that operating income other than grant income can retire. A profit cover ratio of 100% or greater shows that the entity can repay all current debt within one year. A negative ratio may mean that the entity is dependent on government grants to meet its short term debts and may be an indication of going concern problems.
Return on Assets
Operating result divided by average total assets
2.19% 0.96% n/a n/a The return on assets ratio measures how efficiently the operating result is being generated from the assets employed in the department. A low return on assets indicates that the earnings are low for the amount of assets (common in not-for-profit entities). However, a low return on assets ratio compared to industry averages may indicate an inefficient use of business assets.
Notes
* Queensland Treasury and Trade "controlled" transactions and balances relate to those transactions and balances that are under the discretionary control of the Under Treasurer. Departmental Services Revenue (appropriation paid) has been treated as "Sales Revenue" on the basis that the appropriation represents the services purchased by the Parliament from the Department
** Queensland Treasury and Trade administers transactions and balances on behalf of the whole of Government. In preparing the ratios analysis of the whole of government, assumptions were made in relation to the allocation of certain revenue and expenses which may have an impact on the calculation of the ratios. Borrowing costs include the interest paid to the departments on their bank accounts and trust funds. Minor impact on the overall ratio, if excluded ratios are (controlled) 14.51 and (administered) 23.39.
Consideration of QTT Annual Report 2012-13
Finance and Administration Committee 25
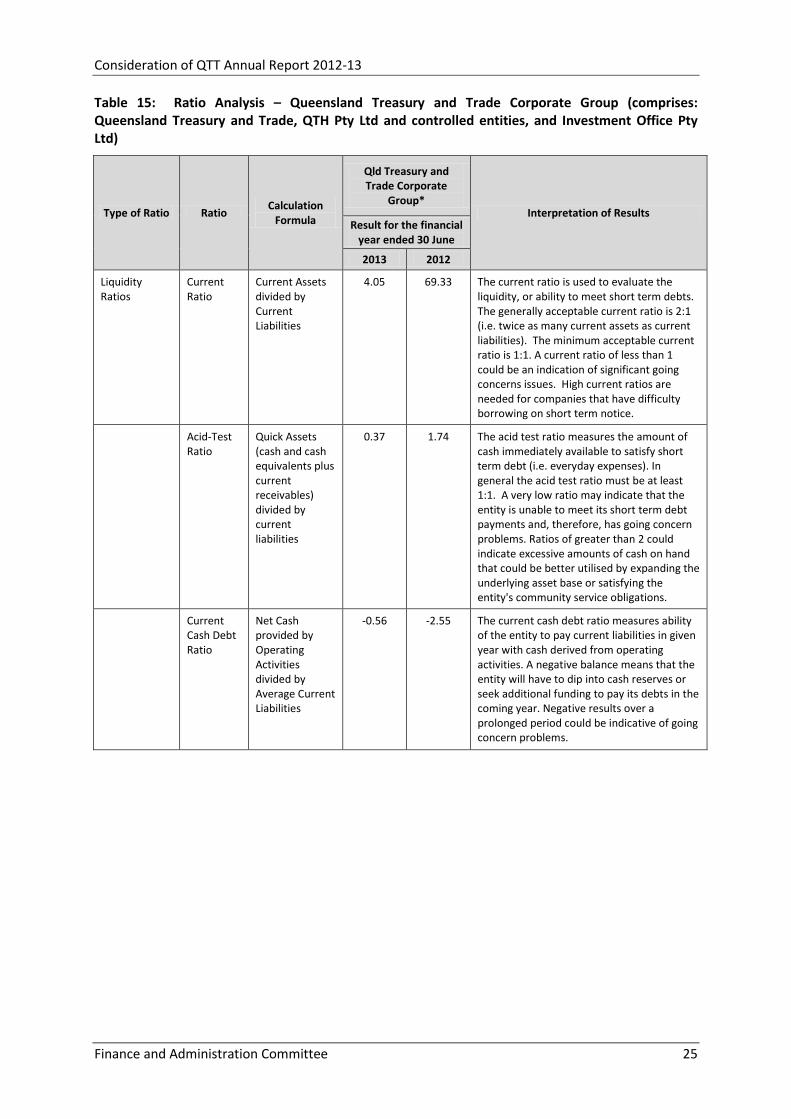
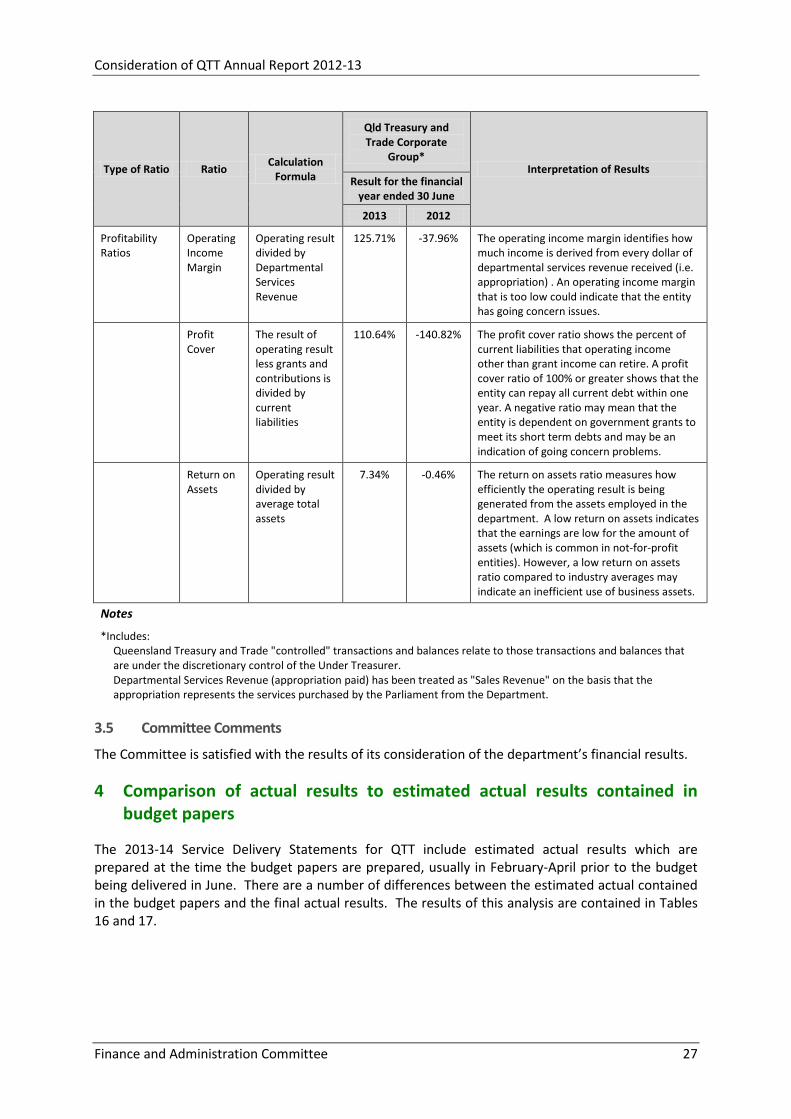
Table 15: Ratio Analysis – Queensland Treasury and Trade Corporate Group (comprises: Queensland Treasury and Trade, QTH Pty Ltd and controlled entities, and Investment Office Pty Ltd)
Type of Ratio Ratio Calculation Formula
Qld Treasury and Trade Corporate
Group* Interpretation of Results
Result for the financial year ended 30 June
2013 2012
Liquidity Ratios
Current Ratio
Current Assets divided by Current Liabilities
4.05 69.33 The current ratio is used to evaluate the liquidity, or ability to meet short term debts. The generally acceptable current ratio is 2:1 (i.e. twice as many current assets as current liabilities). The minimum acceptable current ratio is 1:1. A current ratio of less than 1 could be an indication of significant going concerns issues. High current ratios are needed for companies that have difficulty borrowing on short term notice.
Acid-Test Ratio
Quick Assets (cash and cash equivalents plus current receivables) divided by current liabilities
0.37 1.74 The acid test ratio measures the amount of cash immediately available to satisfy short term debt (i.e. everyday expenses). In general the acid test ratio must be at least 1:1. A very low ratio may indicate that the entity is unable to meet its short term debt payments and, therefore, has going concern problems. Ratios of greater than 2 could indicate excessive amounts of cash on hand that could be better utilised by expanding the underlying asset base or satisfying the entity's community service obligations.
Current Cash Debt Ratio
Net Cash provided by Operating Activities divided by Average Current Liabilities
-0.56 -2.55 The current cash debt ratio measures ability of the entity to pay current liabilities in given year with cash derived from operating activities. A negative balance means that the entity will have to dip into cash reserves or seek additional funding to pay its debts in the coming year. Negative results over a prolonged period could be indicative of going concern problems.
Consideration of QTT Annual Report 2012-13
26 Finance and Administration Committee
Type of Ratio Ratio Calculation Formula
Qld Treasury and Trade Corporate
Group* Interpretation of Results
Result for the financial year ended 30 June
2013 2012
Stability Ratios Debt Ratio Total liabilities divided by Total Assets
0.47 0.84 A ratio that indicates what proportion of debt an entity has relative to its assets. The measure gives an idea to the leverage of the entity along with the potential risks the entity faces in terms of its debt-load. A debt ratio of less than 1 means that an entity has more assets than debt, while a debt ratio of greater than 1 means that an entity has more debt than assets. A debt ratio greater than 1 is a strong indicator of significant going concern issues.
Times Interest Earned
Operating result divided by borrowing costs (interest expense)
2.78 -0.43 The times interest earned ratio indicates the extent of which earnings are available to meet interest payments. A lower ratio means less earnings are available to meet interest payments and that the business is more vulnerable to increases in interest rates. A times interest earned ratio below 1.0 indicates the business is having difficulties generating the cash necessary to pay its interest obligations (i.e. the higher the debt burden) and could be indicative of going concern issues. In these situations, the history and consistency of earnings is very important. The more consistent the entity's earnings the lower the interest coverage ratio can be.
Consideration of QTT Annual Report 2012-13
Finance and Administration Committee 27
Type of Ratio Ratio Calculation Formula
Qld Treasury and Trade Corporate
Group* Interpretation of Results
Result for the financial year ended 30 June
2013 2012
Profitability Ratios
Operating Income Margin
Operating result divided by Departmental Services Revenue
125.71% -37.96% The operating income margin identifies how much income is derived from every dollar of departmental services revenue received (i.e. appropriation) . An operating income margin that is too low could indicate that the entity has going concern issues.
Profit Cover
The result of operating result less grants and contributions is divided by current liabilities
110.64% -140.82% The profit cover ratio shows the percent of current liabilities that operating income other than grant income can retire. A profit cover ratio of 100% or greater shows that the entity can repay all current debt within one year. A negative ratio may mean that the entity is dependent on government grants to meet its short term debts and may be an indication of going concern problems.
Return on Assets
Operating result divided by average total assets
7.34% -0.46% The return on assets ratio measures how efficiently the operating result is being generated from the assets employed in the department. A low return on assets indicates that the earnings are low for the amount of assets (which is common in not-for-profit entities). However, a low return on assets ratio compared to industry averages may indicate an inefficient use of business assets.
Notes *Includes:
Queensland Treasury and Trade "controlled" transactions and balances relate to those transactions and balances that are under the discretionary control of the Under Treasurer. Departmental Services Revenue (appropriation paid) has been treated as "Sales Revenue" on the basis that the appropriation represents the services purchased by the Parliament from the Department.
3.5 Committee Comments
The Committee is satisfied with the results of its consideration of the department’s financial results.
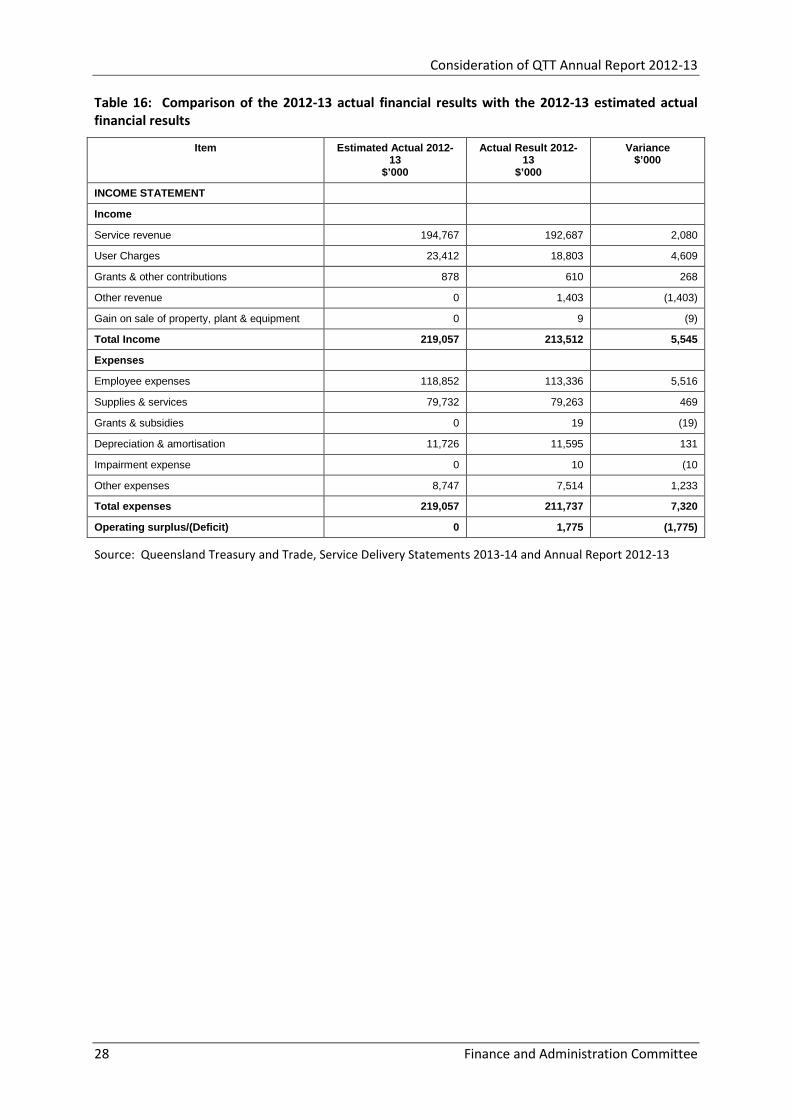
4 Comparison of actual results to estimated actual results contained in budget papers
The 2013-14 Service Delivery Statements for QTT include estimated actual results which are prepared at the time the budget papers are prepared, usually in February-April prior to the budget being delivered in June. There are a number of differences between the estimated actual contained in the budget papers and the final actual results. The results of this analysis are contained in Tables 16 and 17.
Consideration of QTT Annual Report 2012-13
28 Finance and Administration Committee
Table 16: Comparison of the 2012-13 actual financial results with the 2012-13 estimated actual financial results
Item Estimated Actual 2012-13
$’000
Actual Result 2012-13
$’000
Variance $’000
INCOME STATEMENT
Income
Service revenue 194,767 192,687 2,080
User Charges 23,412 18,803 4,609
Grants & other contributions 878 610 268
Other revenue 0 1,403 (1,403)
Gain on sale of property, plant & equipment 0 9 (9)
Total Income 219,057 213,512 5,545
Expenses
Employee expenses 118,852 113,336 5,516
Supplies & services 79,732 79,263 469
Grants & subsidies 0 19 (19)
Depreciation & amortisation 11,726 11,595 131
Impairment expense 0 10 (10
Other expenses 8,747 7,514 1,233
Total expenses 219,057 211,737 7,320
Operating surplus/(Deficit) 0 1,775 (1,775)
Source: Queensland Treasury and Trade, Service Delivery Statements 2013-14 and Annual Report 2012-13
Consideration of QTT Annual Report 2012-13
Finance and Administration Committee 29
Table 17: Comparison of the 2012-13 actual financial results with the 2012-13 estimated actual financial results
Item Estimated Actual 2012-13
$’000
Actual Result 2012-13
$’000
Variance $’000
BALANCE SHEET
Current Assets
Cash assets 16,565 25,627 (9,062)
Receivables 4,899 7,527 (2,628)
Other 3,966 6,326 (2,360)
Total Current Assets 25,430 39,480 (14,050)
Non-current Assets
Other financial assets 6,832 6,833 (1)
Property, plant & equipment 7,530 5,982 1,548
Intangibles 26,839 26,841 (2)
Other 0 251 (251)
Total Non-current Assets 41,201 39,907 1,294
Total Assets 66,631 79,387 (12,756)
Current Liabilities
Payables 8,169 19,372 (11,203)
Accrued employee benefits 3,024 3,135 (111)
Unearned revenue 0 1,394 (1,394)
Other 1,726 0 1,726
Total Current Liabilities 12,919 23,901 (10,982)
Non-current Liabilities
Interest-bearing liabilities & derivatives 0 0 0
Total Non-Current Liabilities 0 0 0
Total Liabilities 12,919 23,901 (10,982)
Net Assets/(Liabilities) 53,712 55,486 (1,774)
Equity
Capital/contributed equity 15,797 16,082 (285)
Accumulated surplus/(accumulated deficit) 37,915 39,404 (1,489)
Total Equity 53,712 55,486 (1,774))
Source: Queensland Treasury and Trade, Service Delivery Statements 2013-14 and Annual Report 2012-13
The Committee asked the department to explain the differences between the estimated actual results contained in the budget papers and the actual results contained in the annual report. With regard to the operating surplus, the department advised that the surplus related to employee expenses and the fact that the department had more vacancies than were anticipated when the estimated actuals were prepared in the March preceding the budget. The department indicated that Queensland Treasury’s employee budget is approximately $100 million and it is generally as a result of vacancies that there is a surplus.48
48 Mr Beavers, Transcript 19 March 2014: 4
Consideration of QTT Annual Report 2012-13
30 Finance and Administration Committee
With regard to the ‘Unearned Revenue’ item in the Balance Sheet, the department advised that this relates to billable work that Projects Queensland does on behalf of other departments.49 The Under Treasurer confirmed that unearned income is an accrual accounting term which relates to the revenue being received in advance of the expenditure occurring.50
QTT provided the following additional detail:
Of the $1.7 million in unearned revenue, $1.029 million related to Trade and Investment Queensland, specifically a contribution from the Department of Education in 2012-13 for TIQ to undertake activities on its behalf relating to international education and training promotion; $365,000 related to the Government Statisticians Office for surveys that they undertake on behalf of government departments, for example, health surveys and so forth, that they received in advance in 2012-13 for work that will be undertaken in 2013-14. So that makes up the two largest components of the $1.7 million.51
4.1 Committee comments
The Committee considers that the variations in the actual results compared to the estimated results is due to timing issues caused by the estimated actual results being prepared significantly before the end of the financial year in order to enable sufficient time for preparation of the budget.
The Committee has previously recommended that where material variations occur between the estimated actual results and actual results, commentary could be included in the annual report explaining discrepancies. The Committee continues to support the view that this should happen.
5 Queensland Treasury’s role as a central agency
The Under Treasurer confirmed that in 2012-13, QTT administered nearly $25 billion in revenue. The largest single source of administered revenue was Commonwealth grants of $12.7 billion, followed by state taxes, fees, fines and levies of $9.75 billion. He explained that the main component of Commonwealth revenues was Queensland’s share of GST. Other Commonwealth revenue includes funding for National Partnership payments and the Natural Disaster Relief and Recovery Arrangements (NDRRA) funding arrangements.52
The Committee was advised that QTT administered nearly $8 billion of expenses on behalf of the state. This included administering a number of grant programs such as the Great Start Grant, the First Home Owner Grant, the Queensland Building Boost Grant and grants to the Queensland Reconstruction Authority.53
The Under Treasurer advised that, as a central agency, QTT has a number of additional obligations under the Financial Accountability Act for the operation, management and reporting of the Consolidated Fund and the consolidated state accounts. Under section 23, QTT prepares the Consolidated Fund Financial Report (CFFR), which is audited by the Auditor-General and tabled in the parliament by the Treasurer.54
49 Mr Beavers, Transcript 19 March 2014: 4 50 Mr Gray, Transcript 19 March 2014: 4 51 Mr Beavers, Transcript 19 March 2014: 9 52 Mr Gray, Transcript 19 March 2014: 2 53 Mr Gray, Transcript 19 March 2014: 2 54 Mr Gray, Transcript 19 March 2014: 2
Consideration of QTT Annual Report 2012-13
Finance and Administration Committee 31
5.1 Report on State Finances 2012-13
The Report on State Finances incorporates both the Outcomes Report and the AASB 1049 Financial Statements providing a comprehensive view of the financial operations and position of the Queensland Government. The Outcomes Report includes a comparison between the Actual results for 2012-13 and the Estimated Actual per the 2013-14 Budget in accordance with the Uniform Presentation Framework (UPF). The Financial Statements comply with AASB1049 Whole of Government and General Government Sector Reporting and include detailed notes for the General Government and Total State Sectors.55
The Under Treasurer confirmed that under section 25 of the Financial Accountability Act, QTT prepares financial statements for the whole of government and the general government sector (GGS). These are audited by the Auditor-General and tabled in the Parliament by the Treasurer in the Report on State Finances. This report also provides high-level information for the GGS about reasons for significant variances which occurred from the published budget.56
The Under Treasurer explained that information in the Report on State Finances is presented in accordance with the reporting requirements of the UPF, which is established under Australian Loan Council arrangements and involves all states and territories as well as the Commonwealth. The latest version of the UPF was prepared by the UPF committee convened by Heads of Treasuries for this task. The UPF committee comprised representatives from Australian state and territory Treasuries and the Australian Department of Finance and Deregulation. Consolidated financial statements were also presented in the Report on State Finances in accordance with Australian Accounting Standards (AAS) requirements.57
The Committee noted that the Auditor-General’s report highlighted that the financial reporting matter identified in previous reports about the valuation and disclosure of land under roads remained unresolved as at 30 June 2013 and sought information from QTT regarding this issue and advice regarding what action was being taken to resolve this issue.
QTT provided the following advice:
The existing policies for reporting and valuing land under roads were agreed with the previous Auditor-General to comply with AASB 1051 Land Under Roads. The previous Auditor-General endorsed the existing approach to enable first time adoption of AASB 1051 for the 2008-09 financial year. Subsequent to 2011-12, the current Auditor-General questioned:
• the practice of all land designated for road purposes under the Land Act 1994 being recognised as an administered asset by (what is now) the Department of Natural Resources and Mines; and
• the valuation of such land.
The Queensland Audit Office (QAO) engaged an external advisor regarding both these issues. QTT understands that, based on the views of the external advisor, QAO is no longer pursuing the first issue described above.
The valuation of land under roads for Queensland is determined by the State Valuation Service (SVS) using a methodology developed by experienced and qualified valuers.
55 Queensland Treasury and Trade, Report on State Finances 2012-13, http://www.treasury.qld.gov.au/office/services/reporting/state-
finances/index.shtml [12 June 2014] 56 Mr Gray, Transcript 19 March 2014: 2 57 Mr Gray, Transcript 19 March 2014: 2
Consideration of QTT Annual Report 2012-13
32 Finance and Administration Committee
QTT acknowledges that land under roads is valued differently across jurisdictions. Queensland is happy to adopt a methodology that is consistent with other States/Territories, provided all States/Territories can agree on a consistent approach. This will help to guard against continual revision of the methodology and the introduction of volatility into the financial statements.
Key users of Queensland's whole-of-Government financial statements (such as ratings agencies) have not indicated any particular concerns since this valuation does not feed into any of the key credit metrics.
QAO has requested information from the Department of Natural Resources and Mines (of which SVS is part) that supports the current valuation methodology's compliance with the new accounting standard AASB 13 Fair Value Measurement. QAO has now forwarded the information received to the external advisor for their views on this matter. Ultimately, QTT is concerned to ensure that any departure from the existing methodology is conceptually defensible over time, such that future changes based on subjective views are avoided as far as possible.58
5.2 Consolidated Fund Financial Report
The CFFR is prepared in accordance with section 23 of the Financial Accountability Act 2009. It contains particulars of transactions and balances of the Consolidated Fund and details of collections from, and appropriation paid to, each Department (including adjustments to original appropriation). The Statement is to be audited by the Auditor-General within three months after the end of the financial year to which it relates and tabled in the Legislative Assembly.59
The Under Treasurer advised that the CFFR details the cash flows into and out of the Consolidated Fund, including information about appropriations to departments. The CFFR also provides reasons for appropriation adjustments and explains any variances between the appropriation heading amount in the appropriation acts, adjusted for section 79 transfers, and the actual appropriation paid. He confirmed that section 79 transfers related to MOG transfers.60
Prior to the passage of the Treasury and Trade and Other Legislation Amendment Act 2013 in September 2013, the Financial Accountability Act 2009 required that the Treasurer publish the quarterly statement for the first, second or third quarter of a financial year in the gazette. The Treasury and Trade and Other Legislation Amendment Act amended the Financial Accountability Act so that the Treasurer is now required to make the statement publicly available.61
In its consideration of the Treasury and Trade and Other Legislation Amendment Bill, the Committee ask the Treasurer and Minister for Trade to provide comment on how historical information will be retained with the abolition of the requirement to publish quarterly financial reports in the government gazette.62 In the government response, the Minister confirmed that QTT that has made a commitment to retain all quarterly statements on its website, not only the most recent statement and to ensure members of the public know where to find the quarterly statements, a link to these will be included in the annual consolidated fund financial report, along with a statement that a copy of the quarterly statement can be provided to a member of the public on request to QTT.63
58 Correspondence from Mr M Gray, Under Treasurer, QTT, to FAC dated 1 April 2014: 4-5 59 Queensland Treasury and Trade, Consolidated Fund Financial Report,
http://www.treasury.qld.gov.au/office/knowledge/docs/consolidated-fund-financial-report/index.shtml [12 June 2014] 60 Mr Gray, Transcript 19 March 2014: 2 61 Financial Accountability Act 2009, section 22 62 Finance and Administration Committee, Report No. 31 – Treasury and Trade and Other Legislation Amendment Bill 2013, August 2014: 6 63 Queensland Government, Ministerial Response to FAC Report No 31 – Treasury and Trade and Other Legislation Amendment Bill 2013,
September 2013: 1
Consideration of QTT Annual Report 2012-13
Finance and Administration Committee 33
QTT’s website notes that:
The Quarterly Report of the Consolidated Fund is published on the Treasury website and future quarterly reports will no longer be published in the Government Gazette.64
5.3 Mid Year Financial and Economic Review 2013-14
The MYFER provides a mid-year update on the fiscal and economic outlook for the State. This includes updated forecasts for major economic parameters, revised estimates of State Government borrowings and consolidated sectoral financial statements prepared under the GFS framework of accounting.65
The MYFER is an annual document required by the Australian Loan Council's UPF. The UPF focuses on financial statements for three sectors – General Government (departments), Public Non-financial Corporations (PNFC) (Government-owned Corporations) and Public Financial Enterprises (PFE) (for example, Queensland Treasury Corporation). For Budget purposes, estimates are prepared for the GGS, PNFC sectors and the combined Public Non-financial Sector (PNFS).66
The MYFER presents revised fiscal estimates for the current Budget year and the three following years for the GGS, PNFC and PNFS. These revised estimates take into account fiscal and economic developments since the preparation of the Budget. The MYFER also includes a revised estimated of the Loan Council Allocation.67
The Committee noted that the MYFER indicated a slight improvement in the size of the deficit and asked the department to explain the impacts of that forecast deficit. The department explained that:
The best way to pull all of that together is in the midyear review document itself. Page 13 of the midyear review document has what is referred to as a reconciliation table—a reconciliation of net operating and fiscal balance. Again, if we are focused on the 2013-14 year, that goes through the various elements that have contributed to that improvement. Inevitably, in any estimates update there are swings and roundabouts. There are some things that are an improvement and there are some things that are a deterioration. If we were to run through that reconciliation table from the top, our taxation risks for 2013-14 improved a little bit. They were up about—this is the midyear review estimates—$63 million on budget, but we had royalty revenue, primarily because of some weaker coal prices than what we were anticipating at budget time, a negative $97 million. There were some natural disaster revisions in that year, which were a positive $225 million. So that is taking into account expenditure and expenses and revenue. So it is the net of those two. Then we have a net flow from public non-financial corporation entities, which was a negative of $65 million. That refers to the GOC flows net of CSOs. So it is your dividends and tax equivalent payments. You then have to offset that for any change in CSOs. So that was detracting.
64 Queensland Treasury and Trade, Consolidated Fund Financial Report,
http://www.treasury.qld.gov.au/office/knowledge/docs/consolidated-fund-financial-report/index.shtml [12 June 2014] 65 Queensland Treasury and Trade, Whole of Government reporting, http://www.treasury.qld.gov.au/office/services/reporting/w-o-
g/index.shtml [12 June 2014] 66 Queensland Treasury and Trade, Whole of Government reporting, http://www.treasury.qld.gov.au/office/services/reporting/w-o-g/govt-
fin-stats.shtml [4 August 2014] 67 Queensland Treasury and Trade, Mid Year Fiscal and Economic Review, http://www.treasury.qld.gov.au/office/knowledge/docs/mid-
year-review/index.shtml [12 June 2014]
Consideration of QTT Annual Report 2012-13
34 Finance and Administration Committee
Then there were government policy measures. These are decisions taken since the budget in that 2013-14 year, which were a negative $124 million. Then we had the parameter adjustments. There are always other parameters that are moving, be it inflation, population—those types of factors. That was a negative $11 million. So when you add all of those up, the net operating balance in 2013-14 had deteriorated slightly from a deficit of $3.760 billion at budget time to a deficit of $3.769 billion. But then we need to take into account, because of the focus on the fiscal balance, also other capital movements and they were a slight positive.
So if we have a look at the 2013-14 fiscal balance, we see that at budget time—and again this is for the 2013-14 year—we are anticipating a fiscal balance deficit of $7.664 billion and at midyear review the estimate was that that would be slightly better at $7.604 billion.68
The Committee noted that the MYFER identifies that the superannuation liability for the GGS is forecast to fall from $26 billion in 2013-14 financial year to $22.2 billion in the 2016-17 financial year. The Committee sought an explanation for this.
QTT advised that the superannuation liability for the GGS is forecast to decline over the forward estimate period largely as a result of actuarial gains due to discount rate assumptions used in valuing the defined benefit superannuation liability. They advised that the superannuation liability is valued in accordance with AASB 119 Employee Benefits which requires the discounting of future superannuation benefit obligations using yield rates on government bonds. They noted that the defined benefit fund was closed to new entrants from 2009 which also contributes to the decline in superannuation liabilities.69
The Committee sought an explanation regarding the changes in the fiscal deficits included in the GGS operating statement compared with the 2011-12 MYFER. QTT explained that they prepare a table every six months which reconciles the net operating balance and the fiscal balance. This table also provides a breakdown of the movements in the balances. They advised that the recent tables were included in the 2012-13 Budget Paper 2 Budget Strategy and Outlook (Table 1.3 on page 11) and the 2013-14 MYFER (Table 5 on page 5).70
QTT advised that the change in fiscal balance reflects changes in both the net operating balance and net acquisition of non-financial assets. They advised that, in summary:
• The fall in the Net Operating Balance is largely due to savings measures in the 2012-13 Budget being more than offset by taxation and royalties revisions and changes to National Disaster Relief and Recovery Arrangements (NDRRA) revenue and expenditure.
• An increase in net acquisitions of non-financial assets increases the fiscal deficit. Increases in NDRRA capital expenditure have been the main driver of the deterioration since the 2011-12 MYFER, partly offset by savings measures.
• …the 2013-14 Budget highlighted that flooding caused by ex-Tropical Cyclone Oswald was forecast to cost $2.5 billion. This event occurred in early 2013 and was not foreseen in the 2011-12 MYFER. This event and other revisions to the impact of previous disasters on Queensland were estimated in the 2013-14 Budget to detract almost $2.7 billion from the fiscal balance in 2013-14.71
68 Mr Molloy, Transcript 19 March 2014: 5 69 Correspondence from Mr M Gray, Under Treasurer, QTT, to FAC dated 1 April 2014: 5 70 Correspondence from Mr M Gray, Under Treasurer, QTT, to FAC dated 1 April 2014: 6 71 Correspondence from Mr M Gray, Under Treasurer, QTT, to FAC dated 1 April 2014: 6
Consideration of QTT Annual Report 2012-13
Finance and Administration Committee 35
The Committee sought an explanation of the modelling behind the assumption of ‘lower rates of working age population growth’ contained on page two of the MYFER. QTT advised that population estimates are derived from the Government Statistician’s 2013 population projections which includes projections of the total population by age and gender. They noted that the 2013 edition uses a 2011 base population with time horizons to 2061. These projections represent usual resident populations, excluding visitors and temporary residents. The projections reflect the outcomes of applying a set of assumptions about the future direction of fertility, mortality and migration applied to a base population.72
The department advised that in the decade to 2011, the Queensland population increased at an average annual rate of 2.3 percent and this rate is projected to decline slightly to 2.0 percent in the 2011 to 2021 period.73
5.4 Accounting Standards
The Committee noted that in February 2014, the Australian Accounting Standards Board (AASB) issued an alert advising that the International Public Sector Accounting Standards Board (IPSASB) issued an Exposure Draft (ED) 54 – Reporting Service Performance Information. Comments were requested by 31 May 2014. If adopted by the AASB, the ED will be a Recommended Practice Guideline (RPG) with compliance not being mandatory, however, it would apply to Queensland public sector entities.
The Committee sought comment from QTT regarding the ED. QTT confirmed that for those jurisdictions that comply with IPSASB pronouncements, the RPG will be applicable to reporting by all public sector entities, other than Government Business Enterprises, to provide guidance on reporting service performance information.74
The department advised that:
The Queensland public sector, as with all Australian jurisdictions and the private sector, follows requirements set by the Australian Accounting Standards Board(AASB), not the IPSASB. The AASB closely monitors the IPSASB work program and undertakes its own work on selected topics based on their significance to financial reporting in Australia. The AASB is monitoring the progress of ED 54 to determine whether something similar should be issued in Australia.
QTT co-ordinated the response on the earlier consultation paper on this subject on behalf of HoTARAC (Heads of Treasuries Accounting and Reporting Advisory Committee). HoTARAC is an intergovernmental committee that advises Australian Heads of Treasuries on accounting and reporting issues. The committee comprises the senior accounting policy representative from each Australian State, Territory and the Australian Government.
In broad terms, HoTARAC did not have any significant concerns with the proposals in the consultation paper, but suggested that there be further clarification and guidance and removal of duplication and inconsistencies.
QTT will also be co-ordinating the HoTARAC response to ED 54. No significant concerns have been identified in ED 54 based on QTT's review to date. Subject to feedback from other jurisdictions, QTT's views will be reflected in the HoTARAC submission on ED 54. HoTARAC's submission will also be provided to the AASB for its information.
72 Correspondence from Mr M Gray, Under Treasurer, QTT, to FAC dated 1 April 2014: 6 73 Correspondence from Mr M Gray, Under Treasurer, QTT, to FAC dated 1 April 2014: 6 74 Correspondence from Mr M Gray, Under Treasurer, QTT, to FAC dated 1 April 2014: 3
Consideration of QTT Annual Report 2012-13
36 Finance and Administration Committee
ED 54 notes that, in some jurisdictions, extensive requirements for the preparation and presentation of service performance information are already a legislative or regulatory requirement and exceed the requirements of ED 54 – this is the case with the Queensland public sector. To the extent that any of the content of ED 54 is adopted in Queensland, it is expected that this would be reflected in the Queensland Government Performance Management Framework, maintained by the Department of the Premier and Cabinet.75
75 Correspondence from Mr M Gray, Under Treasurer, QTT, to FAC dated 1 April 2014: 3-4
Consideration of QTT Annual Report 2012-13 Appendices
Finance and Administration Committee 37
Appendices
Appendices Consideration of QTT Annual Report 2012-13
38 Finance and Administration Committee
Appendix A – Officers appearing on behalf of the department at public departmental hearing – Wednesday 19 March 2014
Witnesses
Mr Mark Gray, Under Treasurer, Queensland Treasury and Trade
Mr Alex Beavers, Deputy Under Treasurer – Fiscal Group, Queensland Treasury and Trade
Mr Dennis Molloy, Assistant Under Treasurer – Fiscal Strategy Division, Queensland Treasury and Trade