Embed Size (px)
Citation preview
1
Connectivity and Infrastructure
towards Sustainable Agriculture Development
Mahendra SiregarVice Minister of Finance, Republic of Indonesia
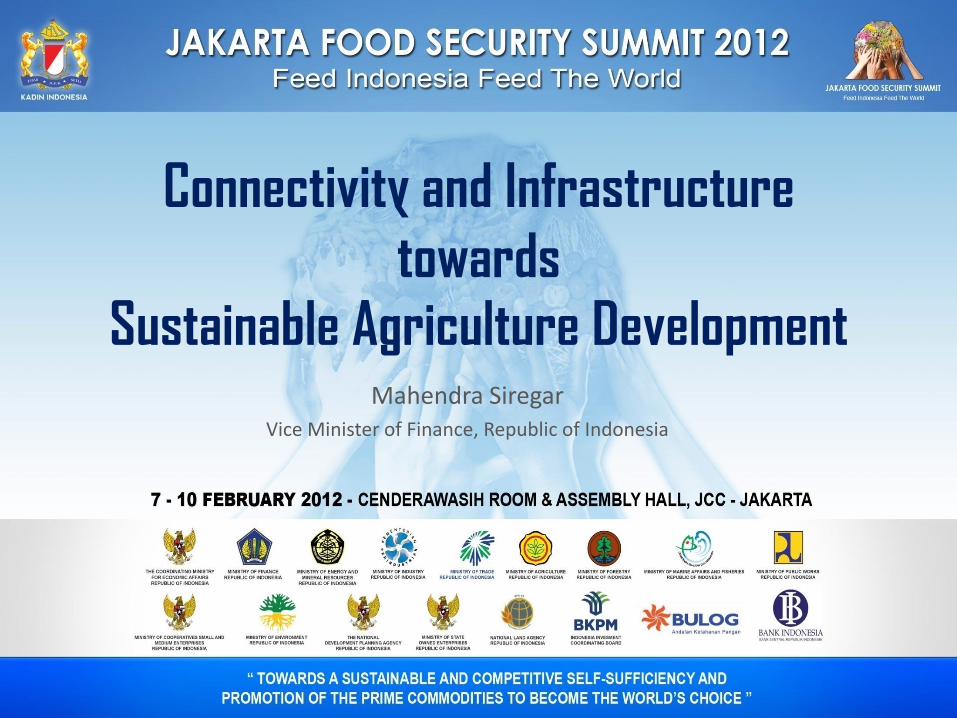
The economy in 2011:New historical high
• GPD per capita: US$ 3,542.9
• Total GDP: US$854 bn
• Growth rate: 6.5%
• Exports: US$ 203.6 bn
• Budget deficit to GDP: 1.3%
• Debt to GDP: 24%
• Tax and non-tax revenue: Rp1,196 Trillion
As a result: Return to Investment Grade!2
927065-004 3
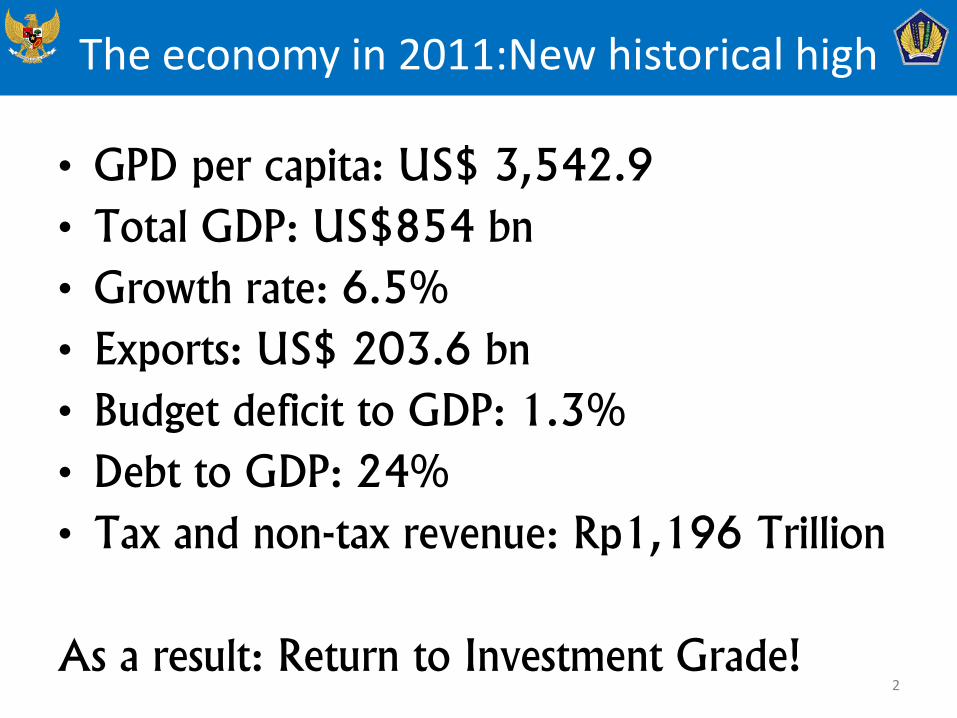
Crisis Mitigation in Budget 2012
Budget allocated for macroeconomic risk Rp15,8T;
Budget allocated for social expenditures (PNPM, PKH, Public health and natural disasters Rp47,8T ;
Budget allocated for non energy subsidy Rp40,3T
Rice reserves for the poor Rp2,0T;
4
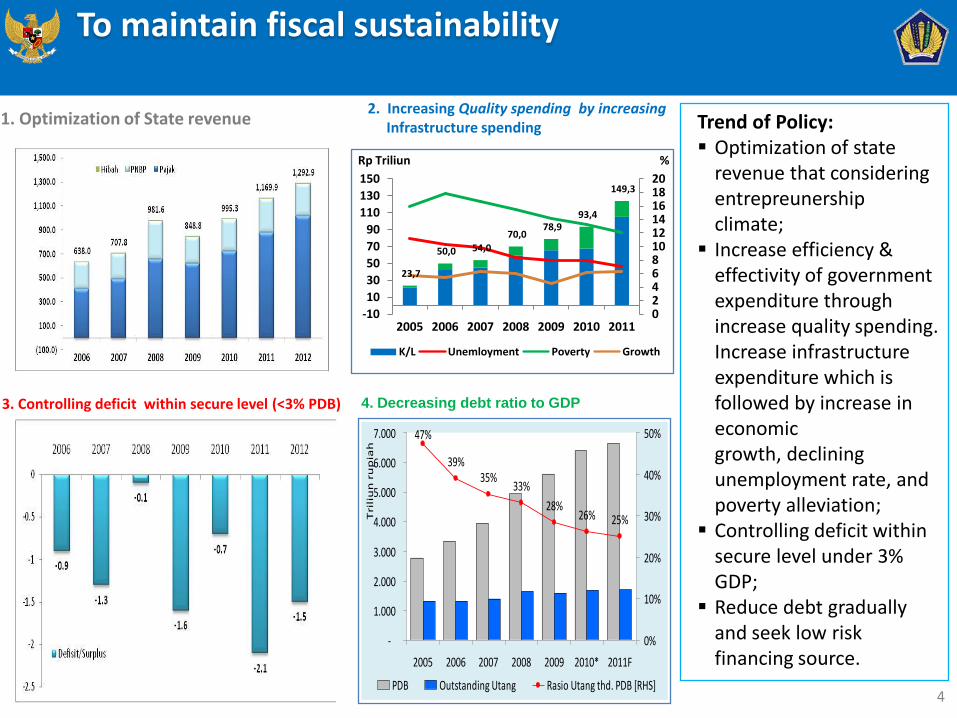
1. Optimization of State revenue2. Increasing Quality spending by increasing
Infrastructure spending
4. Decreasing debt ratio to GDP
Trend of Policy: Optimization of state
revenue that considering entrepreunership climate; Increase efficiency &
effectivity of government expenditure through increase quality spending. Increase infrastructure expenditure which is followed by increase in economic growth, declining unemployment rate, and poverty alleviation; Controlling deficit within
secure level under 3%GDP; Reduce debt gradually
and seek low risk financing source.
47%
39%35%
33%
28%26% 25%
-
1.000
2.000
3.000
4.000
5.000
6.000
7.000
2005 2006 2007 2008 2009 2010* 2011F
Tri
liu
n r
up
iah
0%
10%
20%
30%
40%
50%
PDB Outstanding Utang Rasio Utang thd. PDB [RHS]
To maintain fiscal sustainability
23,7
50,0 54,0
70,0 78,9
93,4
149,3
02468101214161820
-10
10
30
50
70
90
110
130
150
2005 2006 2007 2008 2009 2010 2011
%Rp Triliun
K/L Unemloyment Poverty Growth
3. Controlling deficit within secure level (<3% PDB)
5
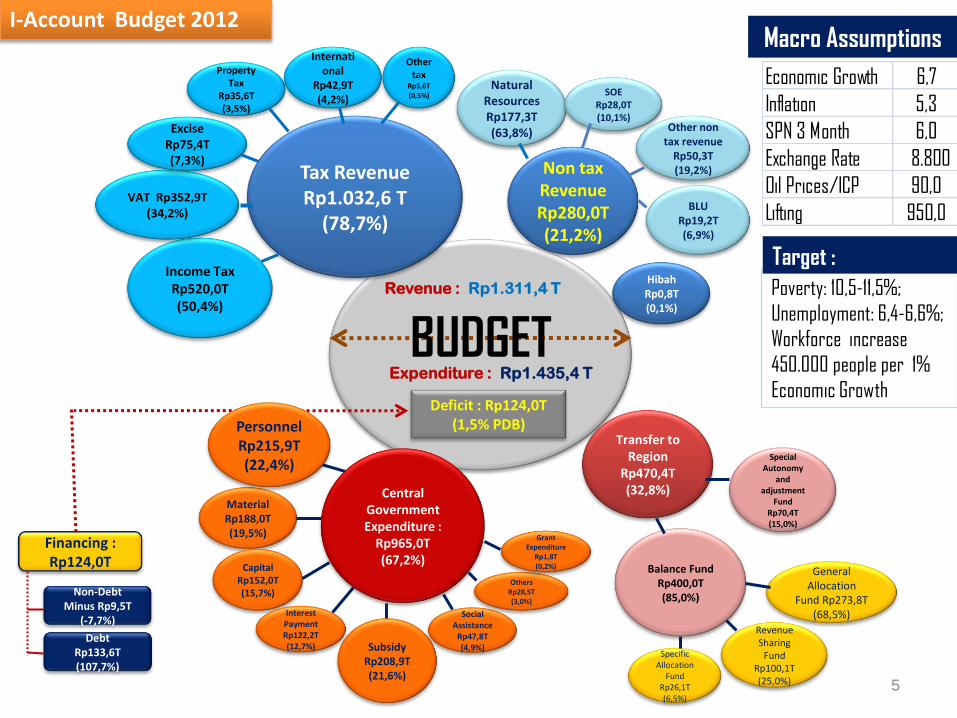
Expenditure : Rp1.435,4 T
Tax Revenue Rp1.032,6 T
(78,7%)
Non tax Revenue Rp280,0T (21,2%)
HibahRp0,8T (0,1%)
Income Tax Rp520,0T(50,4%)
VAT Rp352,9T(34,2%)
ExciseRp75,4T(7,3%)
Property Tax
Rp35,6T(3,5%)
International
Rp42,9T(4,2%)
Other tax
Rp5,6T(0,5%)
Natural Resources Rp177,3T(63,8%)
SOE Rp28,0T(10,1%)
Other non tax revenue
Rp50,3T(19,2%)
BLU Rp19,2T(6,9%)
Transfer to Region
Rp470,4T (32,8%)
MaterialRp188,0T(19,5%)
Capital Rp152,0T(15,7%)
Interest Payment Rp122,2T(12,7%) Subsidy
Rp208,9T(21,6%)
Social Assistance
Rp47,8T (4,9%)
OthersRp28,5T(3,0%)
Grant Expenditure
Rp1,8T (0,2%)
Deficit : Rp124,0T (1,5% PDB)
Balance FundRp400,0T(85,0%)
Special Autonomy
and adjustment
FundRp70,4T(15,0%)
Revenue Sharing
Fund Rp100,1T(25,0%)
General Allocation
Fund Rp273,8T(68,5%)
Specific Allocation
Fund Rp26,1T (6,5%)
Central Government Expenditure :
Rp965,0T (67,2%)
Macro Assumptions
Poverty: 10,5-11,5%;
Unemployment: 6,4-6,6%;
Workforce increase
450.000 people per 1%
Economic Growth
Target :
PersonnelRp215,9T(22,4%)
Financing : Rp124,0T
BUDGET
Debt Rp133,6T(107,7%)
Non-DebtMinus Rp9,5T
(-7,7%)
Revenue : Rp1.311,4 T
Economic Growth 6,7
Inflation 5,3
SPN 3 Month 6,0
Exchange Rate 8.800
Oil Prices/ICP 90,0
Lifting 950,0
I-Account Budget 2012
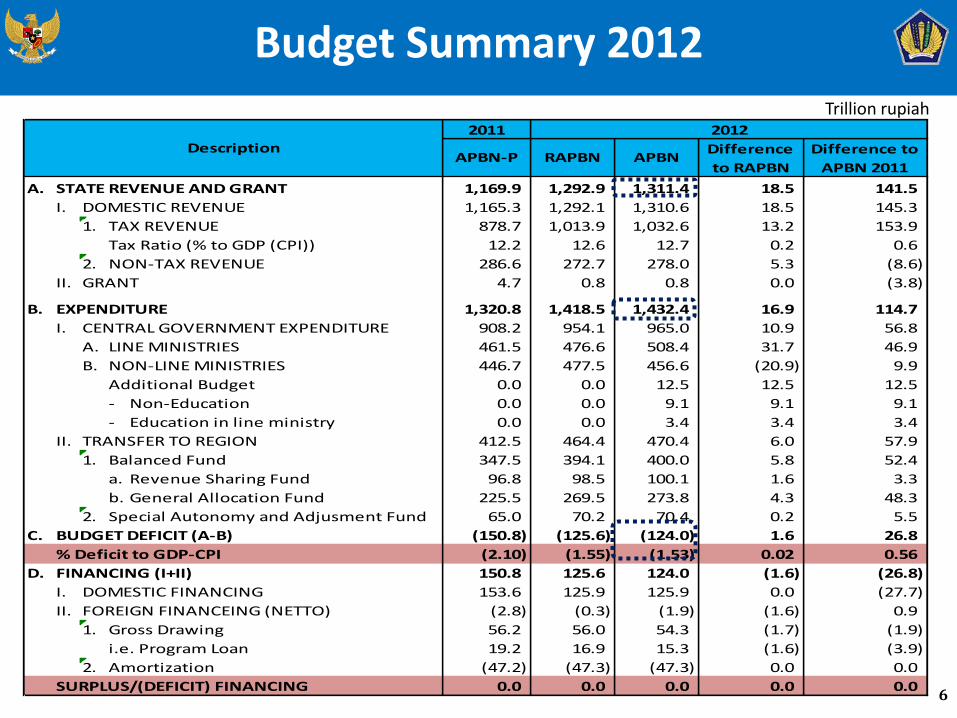
2011
A. STATE REVENUE AND GRANT 1,169.9 1,292.9 1,311.4 18.5 141.5
I. DOMESTIC REVENUE 1,165.3 1,292.1 1,310.6 18.5 145.3
1. TAX REVENUE 878.7 1,013.9 1,032.6 13.2 153.9
Tax Ratio (% to GDP (CPI)) 12.2 12.6 12.7 0.2 0.6
2. NON-TAX REVENUE 286.6 272.7 278.0 5.3 (8.6)
II. GRANT 4.7 0.8 0.8 0.0 (3.8)
B. EXPENDITURE 1,320.8 1,418.5 1,432.4 16.9 114.7
I. CENTRAL GOVERNMENT EXPENDITURE 908.2 954.1 965.0 10.9 56.8
A. LINE MINISTRIES 461.5 476.6 508.4 31.7 46.9
B. NON-LINE MINISTRIES 446.7 477.5 456.6 (20.9) 9.9
Additional Budget 0.0 0.0 12.5 12.5 12.5
- Non-Education 0.0 0.0 9.1 9.1 9.1
- Education in line ministry 0.0 0.0 3.4 3.4 3.4
II. TRANSFER TO REGION 412.5 464.4 470.4 6.0 57.9
1. Balanced Fund 347.5 394.1 400.0 5.8 52.4
a. Revenue Sharing Fund 96.8 98.5 100.1 1.6 3.3
b. General Allocation Fund 225.5 269.5 273.8 4.3 48.3
2. Special Autonomy and Adjusment Fund 65.0 70.2 70.4 0.2 5.5
C. BUDGET DEFICIT (A-B) (150.8) (125.6) (124.0) 1.6 26.8
% Deficit to GDP-CPI (2.10) (1.55) (1.53) 0.02 0.56
D. FINANCING (I+II) 150.8 125.6 124.0 (1.6) (26.8)
I. DOMESTIC FINANCING 153.6 125.9 125.9 0.0 (27.7)
II. FOREIGN FINANCEING (NETTO) (2.8) (0.3) (1.9) (1.6) 0.9
1. Gross Drawing 56.2 56.0 54.3 (1.7) (1.9)
i.e. Program Loan 19.2 16.9 15.3 (1.6) (3.9)
2. Amortization (47.2) (47.3) (47.3) 0.0 0.0
SURPLUS/(DEFICIT) FINANCING 0.0 0.0 0.0 0.0 0.0
DescriptionAPBN-P
Difference
to RAPBN
Difference to
APBN 2011
2012
APBNRAPBN
Budget Summary 2012
6
Trillion rupiah
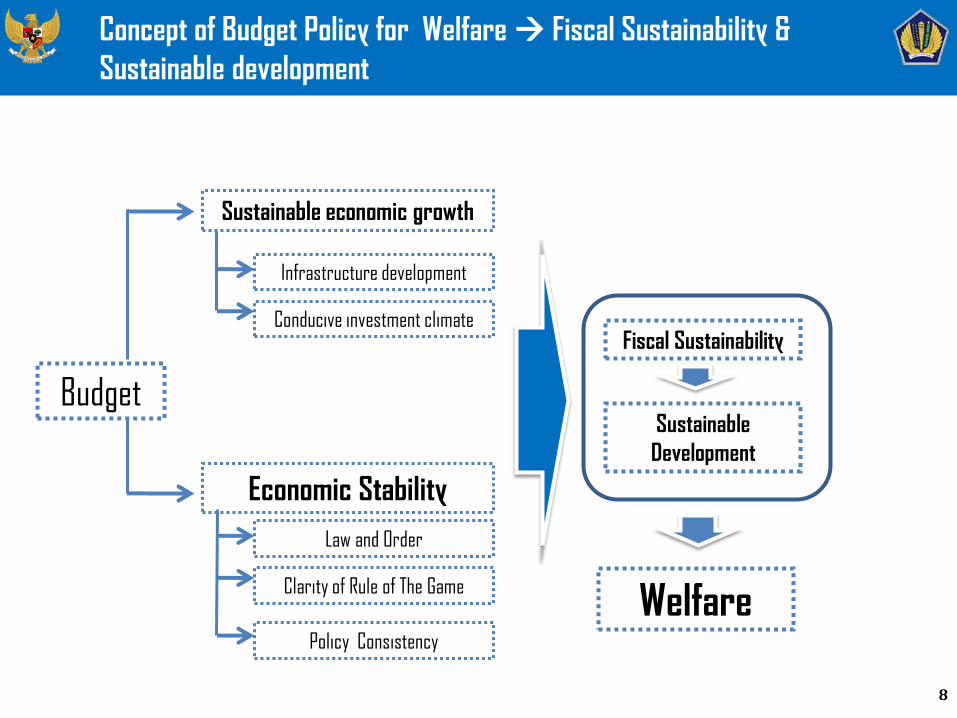
Fiscal Policy Direction for Sustainable Development
8
Budget
Sustainable economic growth
Economic Stability
Infrastructure development
Conducive investment climate
Law and Order
Clarity of Rule of The Game
Policy Consistency
Fiscal Sustainability
Sustainable
Development
Welfare
Concept of Budget Policy for Welfare Fiscal Sustainability &
Sustainable development
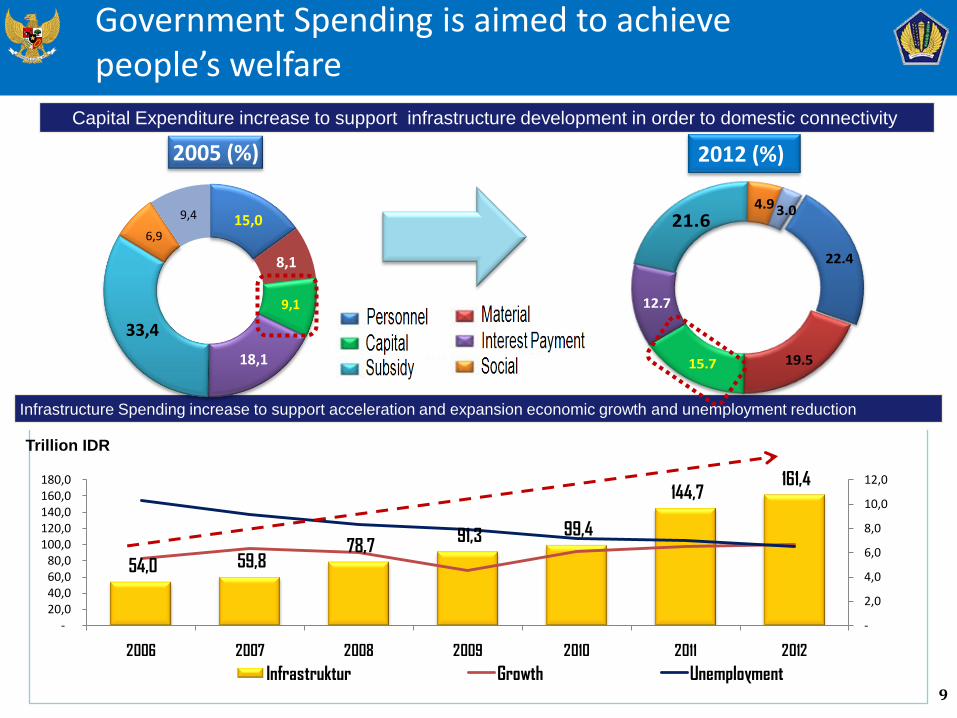
54,0 59,8 78,7
91,3 99,4
144,7 161,4
-
2,0
4,0
6,0
8,0
10,0
12,0
-20,0 40,0 60,0 80,0
100,0 120,0 140,0 160,0 180,0
2006 2007 2008 2009 2010 2011 2012
Infrastruktur Growth Unemployment9
Capital Expenditure increase to support infrastructure development in order to domestic connectivity
Infrastructure Spending increase to support acceleration and expansion economic growth and unemployment reduction
Government Spending is aimed to achieve people’s welfare
15,0
8,1
9,1
18,1
33,4
6,9
9,4
2005 (%)
Trillion IDR
22.4
19.5 15.7
12.7
21.6 4.9 3.0
2012 (%)
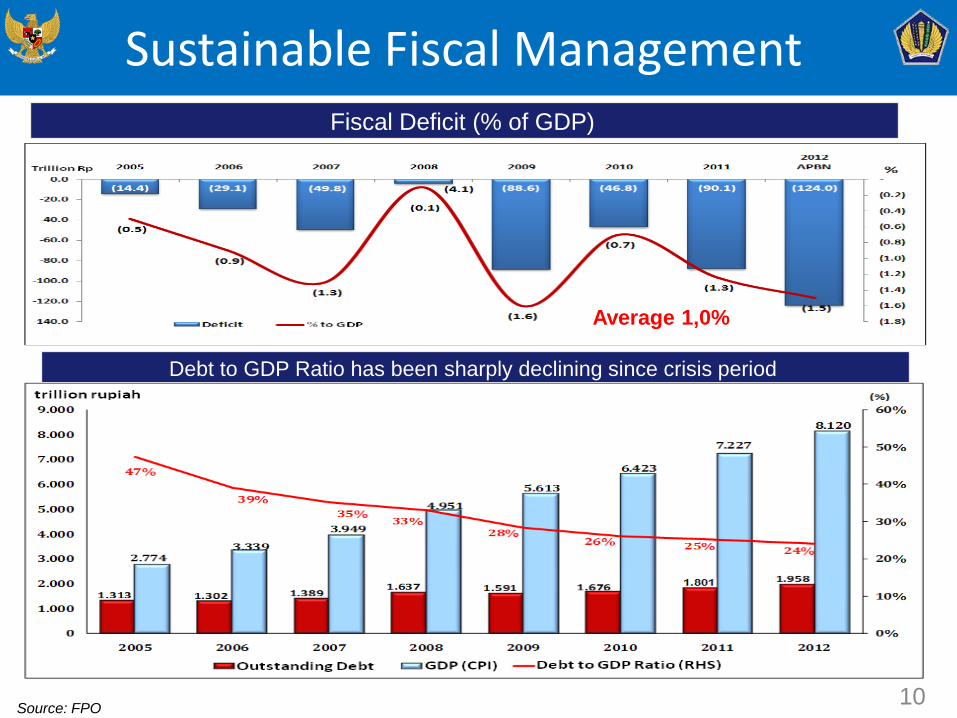
Sustainable Fiscal Management
10
Debt to GDP Ratio has been sharply declining since crisis period
Fiscal Deficit (% of GDP)
8-year fiscal deficit
average= -1.1%
Source: FPO
Average 1,0%
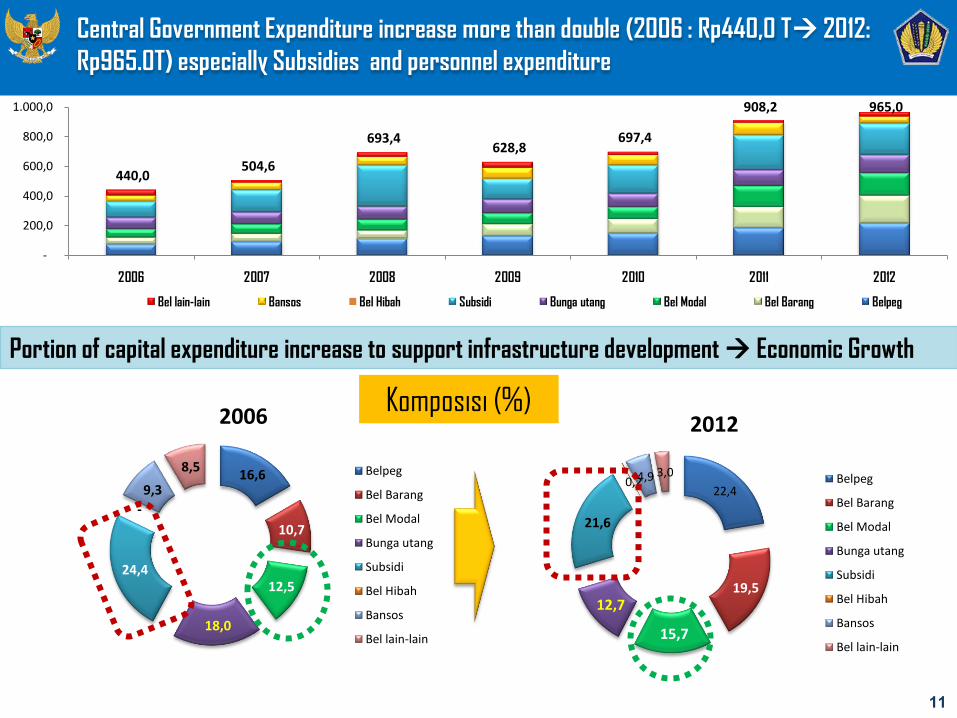
Central Government Expenditure increase more than double (2006 : Rp440,0 T 2012:
Rp965.0T) especially Subsidies and personnel expenditure
11
440,0 504,6
693,4 628,8
697,4
908,2 965,0
-
200,0
400,0
600,0
800,0
1.000,0
2006 2007 2008 2009 2010 2011 2012
Bel lain-lain Bansos Bel Hibah Subsidi Bunga utang Bel Modal Bel Barang Belpeg
16,6
10,7
12,5
18,0
24,4
-
9,3
8,5
2006
Belpeg
Bel Barang
Bel Modal
Bunga utang
Subsidi
Bel Hibah
Bansos
Bel lain-lain
22,4
19,5
15,7
12,7
21,6
0,2 4,9 3,0
2012
Belpeg
Bel Barang
Bel Modal
Bunga utang
Subsidi
Bel Hibah
Bansos
Bel lain-lain
Portion of capital expenditure increase to support infrastructure development Economic Growth
Komposisi (%)
12
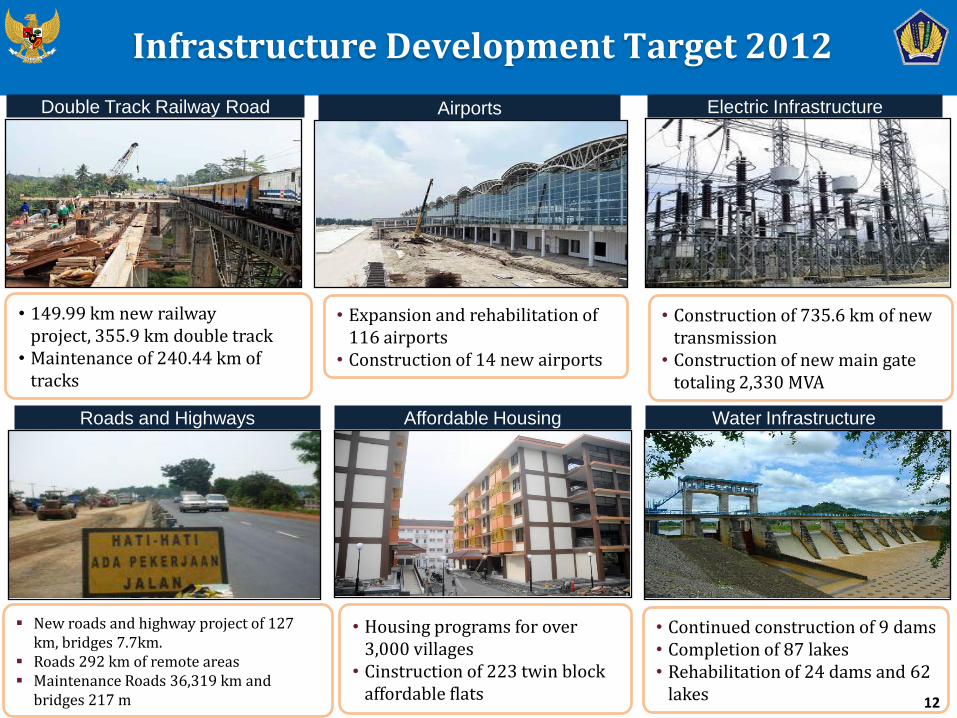
• 149.99 km new railway project, 355.9 km double track
• Maintenance of 240.44 km of tracks
• Expansion and rehabilitation of 116 airports
• Construction of 14 new airports
• Housing programs for over 3,000 villages
• Cinstruction of 223 twin block affordable flats
New roads and highway project of 127 km, bridges 7.7km.
Roads 292 km of remote areas Maintenance Roads 36,319 km and
bridges 217 m
• Continued construction of 9 dams• Completion of 87 lakes• Rehabilitation of 24 dams and 62
lakes
• Construction of 735.6 km of new transmission
• Construction of new main gate totaling 2,330 MVA
Infrastructure Development Target 2012
12
Airports
Affordable HousingRoads and Highways
Double Track Railway Road Electric Infrastructure
Water Infrastructure
13
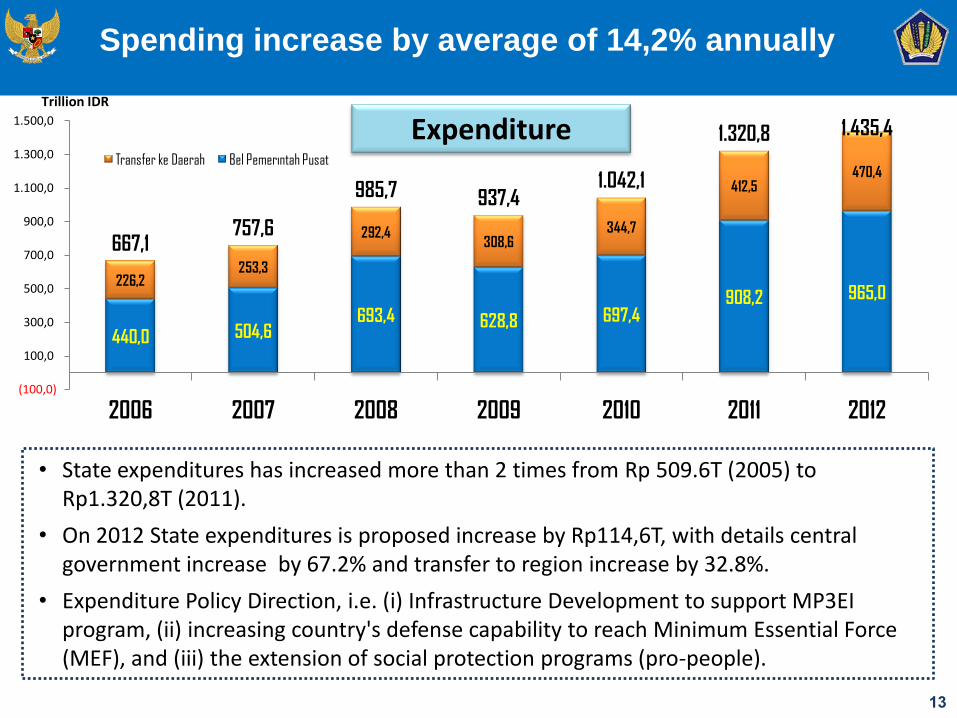
Trillion IDR
Expenditure
440,0 504,6 693,4 628,8 697,4
908,2 965,0 226,2
253,3
292,4 308,6
344,7
412,5 470,4
667,1 757,6
985,7 937,4 1.042,1
1.320,8 1.435,4
(100,0)
100,0
300,0
500,0
700,0
900,0
1.100,0
1.300,0
1.500,0
2006 2007 2008 2009 2010 2011 2012
Transfer ke Daerah Bel Pemerintah Pusat
• State expenditures has increased more than 2 times from Rp 509.6T (2005) to Rp1.320,8T (2011).
• On 2012 State expenditures is proposed increase by Rp114,6T, with details central government increase by 67.2% and transfer to region increase by 32.8%.
• Expenditure Policy Direction, i.e. (i) Infrastructure Development to support MP3EI program, (ii) increasing country's defense capability to reach Minimum Essential Force (MEF), and (iii) the extension of social protection programs (pro-people).
Spending increase by average of 14,2% annually
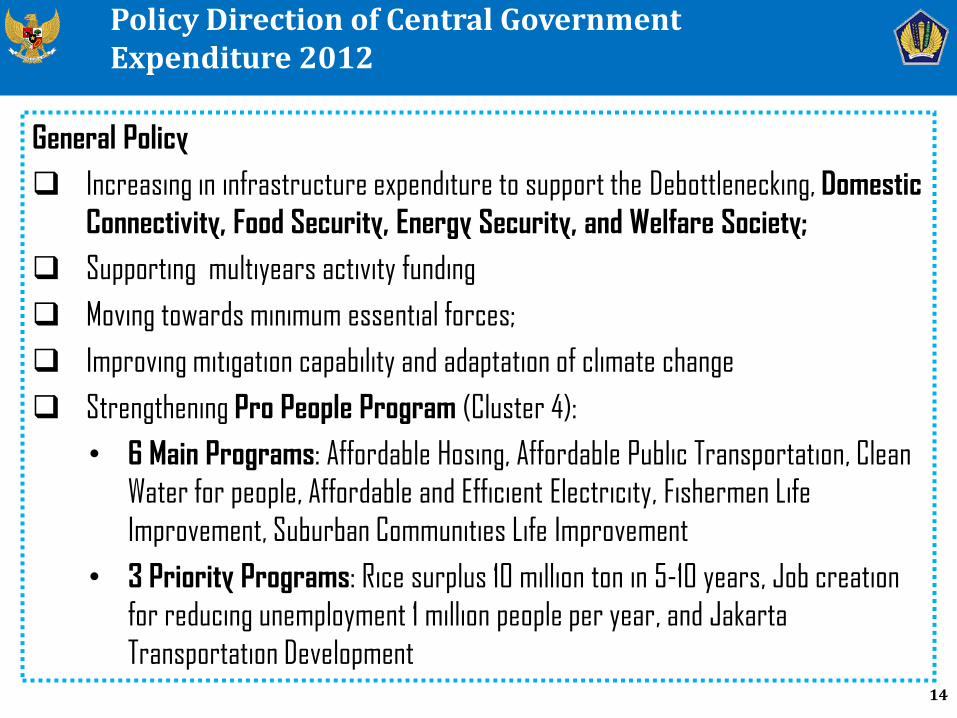
General Policy
Increasing in infrastructure expenditure to support the Debottlenecking, Domestic
Connectivity, Food Security, Energy Security, and Welfare Society;
Supporting multiyears activity funding
Moving towards minimum essential forces;
Improving mitigation capability and adaptation of climate change
Strengthening Pro People Program (Cluster 4):
• 6 Main Programs: Affordable Hosing, Affordable Public Transportation, Clean
Water for people, Affordable and Efficient Electricity, Fishermen Life
Improvement, Suburban Communities Life Improvement
• 3 Priority Programs: Rice surplus 10 million ton in 5-10 years, Job creation
for reducing unemployment 1 million people per year, and Jakarta
Transportation Development14
Policy Direction of Central Government Expenditure 2012
15
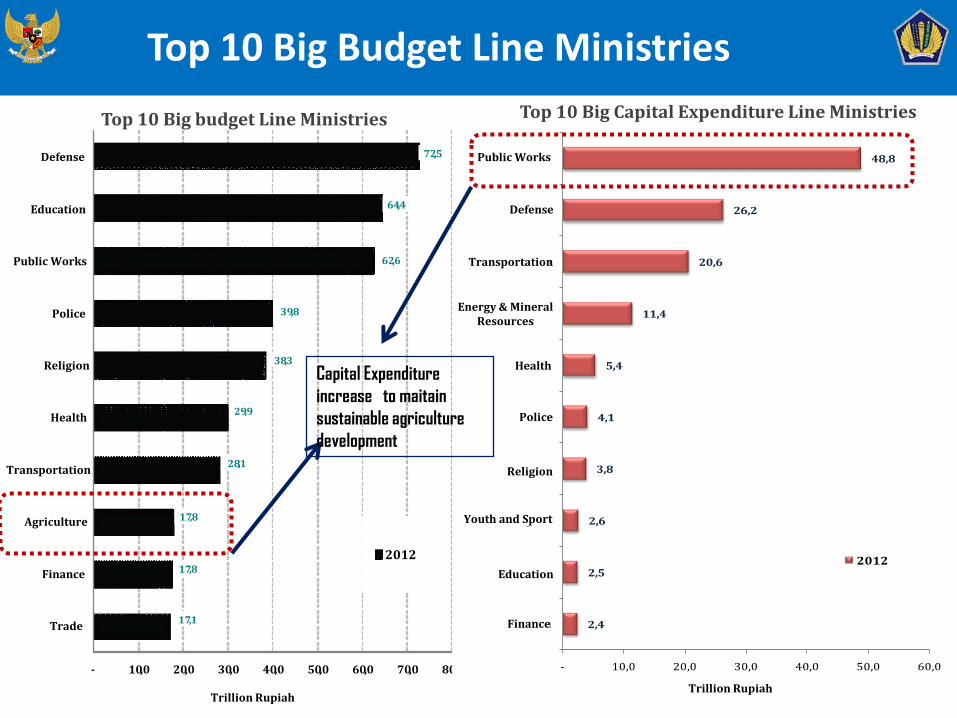
Top 10 Big Budget Line Ministries
Top 10 Big Capital Expenditure Line MinistriesTop 10 Big budget Line Ministries
17,1
17,8
17,8
28,1
29,9
38,3
39,8
62,6
64,4
72,5
- 10,0 20,0 30,0 40,0 50,0 60,0 70,0 80,0
Trade
Finance
Agriculture
Transportation
Health
Religion
Police
Public Works
Education
Defense
Trillion Rupiah
2012
2,4
2,5
2,6
3,8
4,1
5,4
11,4
20,6
26,2
48,8
- 10,0 20,0 30,0 40,0 50,0 60,0
Kemenkeu
Kemendiknas
Kemenpera
Kemenag
Polri
Kemenkes
Kemen ESDM
Kemenhub
Kemenhan
Kemen PU
Triliun Rupiah
2012
Public Works
Defense
Transportation
Health
Police
Religion
Education
Finance
Trillion Rupiah
Youth and Sport
Energy & MineralResources
Capital Expenditure
increase to maitain
sustainable agriculture
development
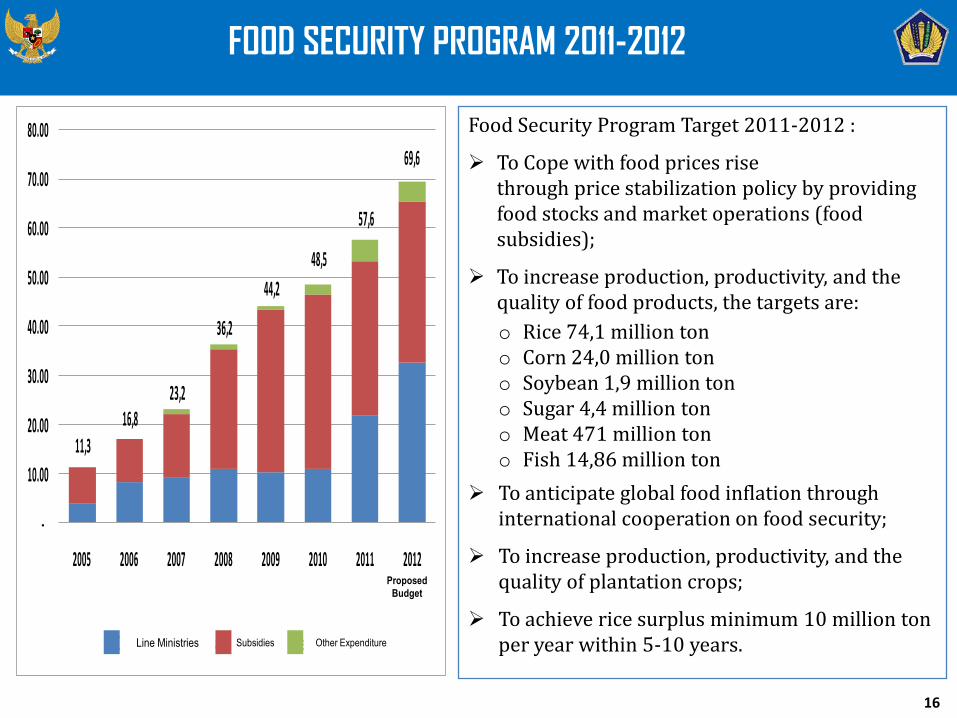
FOOD SECURITY PROGRAM 2011-2012
Food Security Program Target 2011-2012 :
To Cope with food prices rise through price stabilization policy by providing food stocks and market operations (food subsidies);
To increase production, productivity, and the quality of food products, the targets are:
o Rice 74,1 million tono Corn 24,0 million tono Soybean 1,9 million tono Sugar 4,4 million tono Meat 471 million tono Fish 14,86 million ton
To anticipate global food inflation through international cooperation on food security;
To increase production, productivity, and the quality of plantation crops;
To achieve rice surplus minimum 10 million ton per year within 5-10 years.
16
11,3 16,8
23,2
36,2
44,2
48,5
57,6
69,6
-
10.00
20.00
30.00
40.00
50.00
60.00
70.00
80.00
2005 2006 2007 2008 2009 2010 2011 2012RAPBN
Kementerian Negara/Lembaga Subsidi Belanja Lain-LainLine Ministries Subsidies Other Expenditure
Proposed
Budget
95,664,2 83,8
139,1
45,082,4
129,7 123,6
8,930,4
33,1
83,9
49,5
57,6
65,645,0
16,212,9
33,3
52,2
43,5
52,8
41,940,3
120,8107,4
150,2
275,3
138,1
192,7
237,2208,9
23,7
16,1
19,8
27,9
14,7
18,5 18,0
14,5
0
5
10
15
20
25
30
0
50
100
150
200
250
300
350
400
450
500
2005 2006 2007 2008 2009 2010 2011 APBN-P 2012APBN
Non-Energy Electricity Fuel
%
% to State Expenditure
17
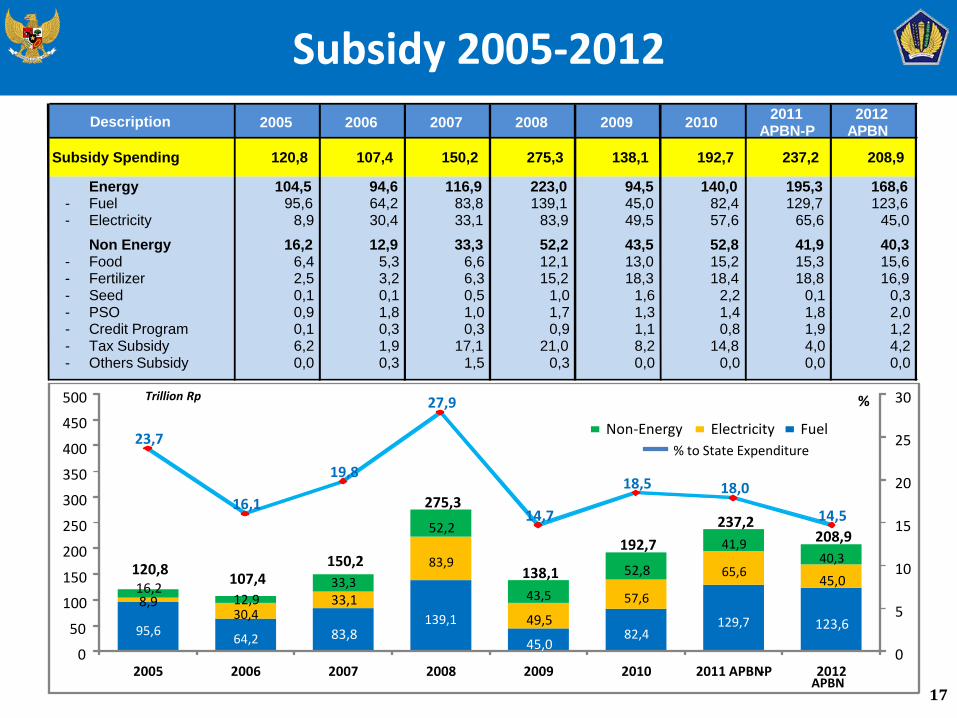
Subsidy 2005-2012
Trillion Rp
2005 2006 2007 2008 2009 20102011
APBN-P2012
APBN
Energy 104,5 94,6 116,9 223,0 94,5 140,0 195,3 168,6- Fuel 95,6 64,2 83,8 139,1 45,0 82,4 129,7 123,6- Electricity 8,9 30,4 33,1 83,9 49,5 57,6 65,6 45,0
Non Energy 16,2 12,9 33,3 52,2 43,5 52,8 41,9 40,3- Food 6,4 5,3 6,6 12,1 13,0 15,2 15,3 15,6- Fertilizer 2,5 3,2 6,3 15,2 18,3 18,4 18,8 16,9- Seed 0,1 0,1 0,5 1,0 1,6 2,2 0,1 0,3- PSO 0,9 1,8 1,0 1,7 1,3 1,4 1,8 2,0- Credit Program 0,1 0,3 0,3 0,9 1,1 0,8 1,9 1,2- Tax Subsidy 6,2 1,9 17,1 21,0 8,2 14,8 4,0 4,2- Others Subsidy 0,0 0,3 1,5 0,3 0,0 0,0 0,0 0,0
192,7 237,2 208,9
Description
Subsidy Spending 120,8 107,4 150,2 275,3 138,1
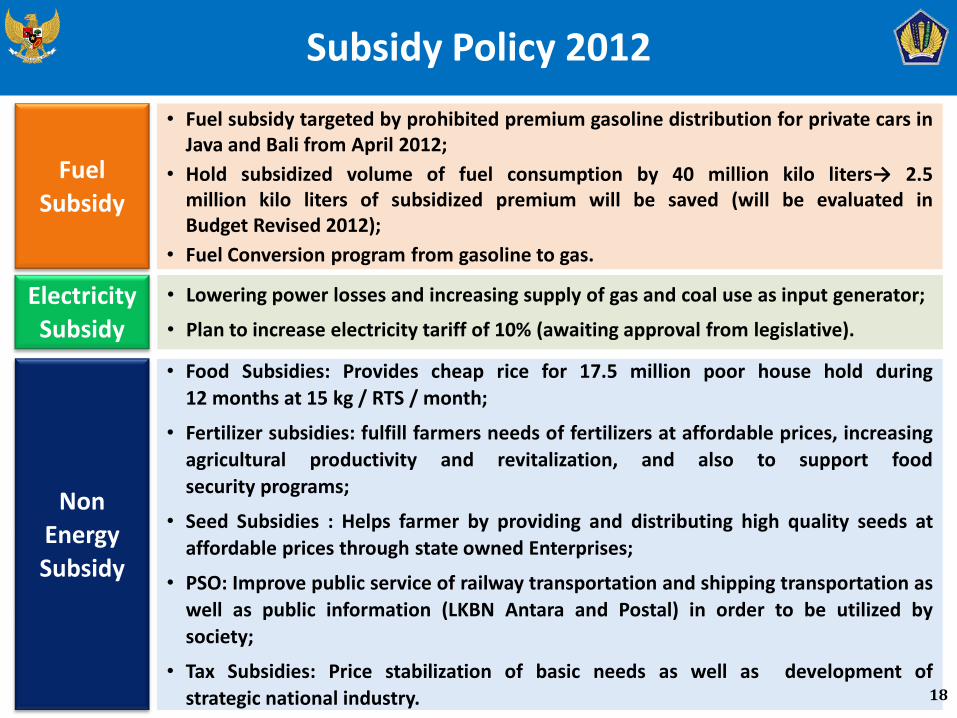
Subsidy Policy 2012
Fuel
Subsidy
• Fuel subsidy targeted by prohibited premium gasoline distribution for private cars inJava and Bali from April 2012;
• Hold subsidized volume of fuel consumption by 40 million kilo liters→ 2.5million kilo liters of subsidized premium will be saved (will be evaluated inBudget Revised 2012);
• Fuel Conversion program from gasoline to gas.
Electricity
Subsidy
• Lowering power losses and increasing supply of gas and coal use as input generator;
• Plan to increase electricity tariff of 10% (awaiting approval from legislative).
Non
Energy
Subsidy
• Food Subsidies: Provides cheap rice for 17.5 million poor house hold during
12 months at 15 kg / RTS / month;
• Fertilizer subsidies: fulfill farmers needs of fertilizers at affordable prices, increasing
agricultural productivity and revitalization, and also to support food
security programs;
• Seed Subsidies : Helps farmer by providing and distributing high quality seeds at
affordable prices through state owned Enterprises;
• PSO: Improve public service of railway transportation and shipping transportation as
well as public information (LKBN Antara and Postal) in order to be utilized by
society;
• Tax Subsidies: Price stabilization of basic needs as well as development of
strategic national industry. 18
19
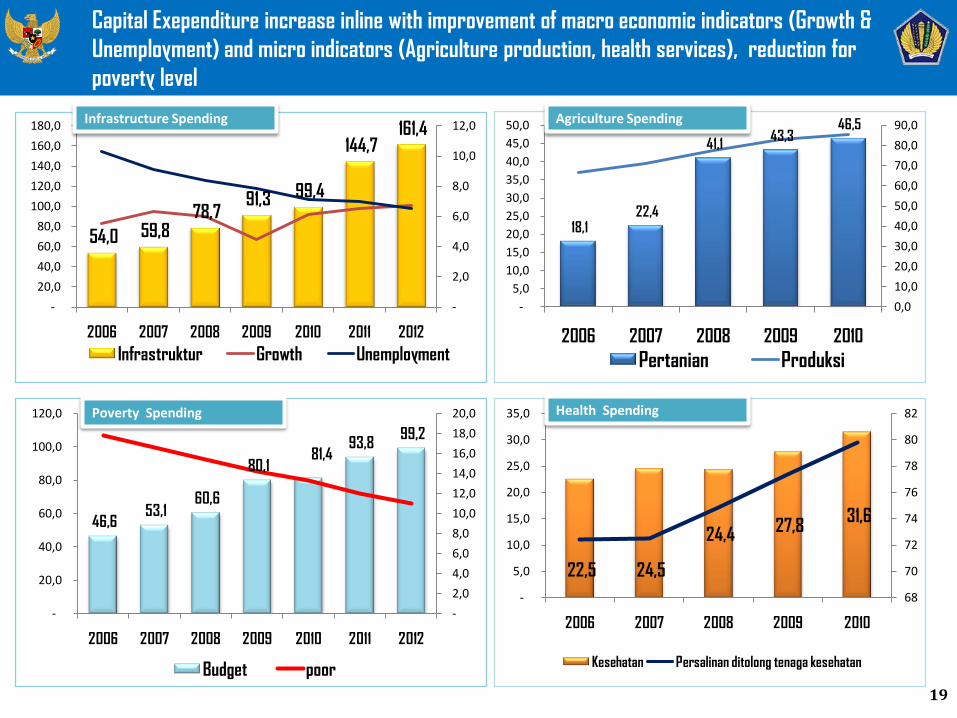
54,0 59,8 78,7
91,3 99,4
144,7 161,4
-
2,0
4,0
6,0
8,0
10,0
12,0
-
20,0
40,0
60,0
80,0
100,0
120,0
140,0
160,0
180,0
2006 2007 2008 2009 2010 2011 2012
Infrastruktur Growth Unemployment
46,6 53,1
60,6
80,1 81,4
93,8 99,2
-
2,0
4,0
6,0
8,0
10,0
12,0
14,0
16,0
18,0
20,0
-
20,0
40,0
60,0
80,0
100,0
120,0
2006 2007 2008 2009 2010 2011 2012
Budget poor
18,1 22,4
41,1 43,3
46,5
0,0
10,0
20,0
30,0
40,0
50,0
60,0
70,0
80,0
90,0
-
5,0
10,0
15,0
20,0
25,0
30,0
35,0
40,0
45,0
50,0
2006 2007 2008 2009 2010
Pertanian Produksi
22,5 24,5
24,4 27,8
31,6
68
70
72
74
76
78
80
82
-
5,0
10,0
15,0
20,0
25,0
30,0
35,0
2006 2007 2008 2009 2010
Kesehatan Persalinan ditolong tenaga kesehatan
Capital Exependiture increase inline with improvement of macro economic indicators (Growth &
Unemployment) and micro indicators (Agriculture production, health services), reduction for
poverty level
Infrastructure Spending Agriculture Spending
Poverty Spending Health Spending
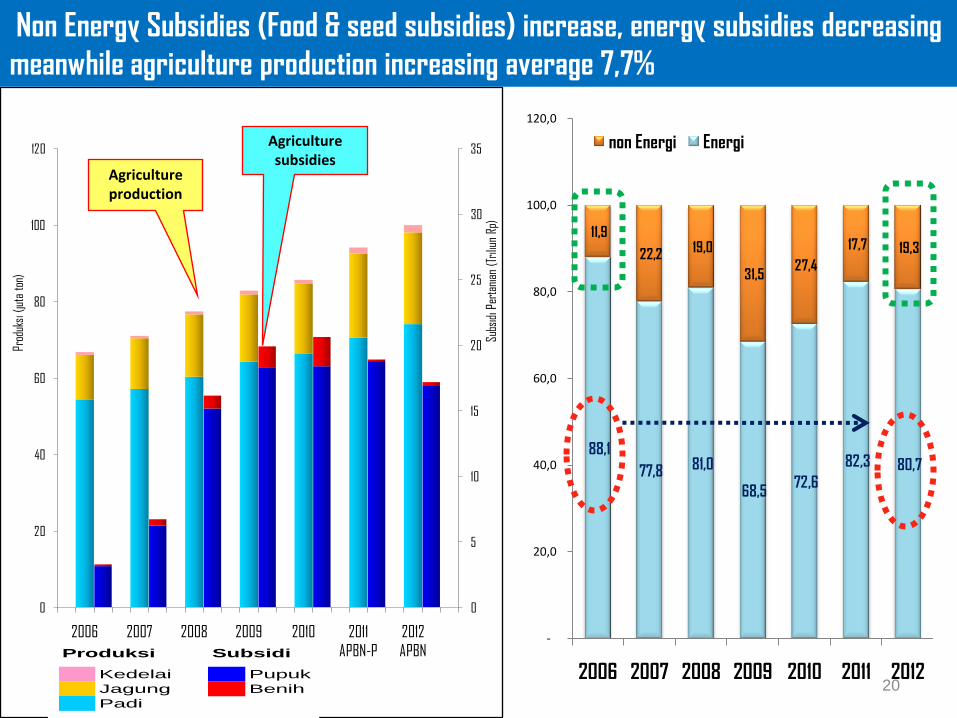
20
88,1
77,8 81,0
68,5 72,6
82,3 80,7
11,9
22,2 19,0
31,5 27,4
17,7 19,3
-
20,0
40,0
60,0
80,0
100,0
120,0
2006 2007 2008 2009 2010 2011 2012
non Energi Energi
0
5
10
15
20
25
30
35
0
20
40
60
80
100
120
2006 2007 2008 2009 2010 2011
APBN-P
2012
APBN
Subs
idi P
erta
nian
(Tr
iliun
Rp)
Prod
uksi
(ju
ta t
on)
Agriculture production
Agriculture subsidies
Produksi Subsidi
Kedelai Pupuk
Jagung Benih
Padi
Non Energy Subsidies (Food & seed subsidies) increase, energy subsidies decreasing
meanwhile agriculture production increasing average 7,7%
Fiscal Incentives of Agriculture Sector
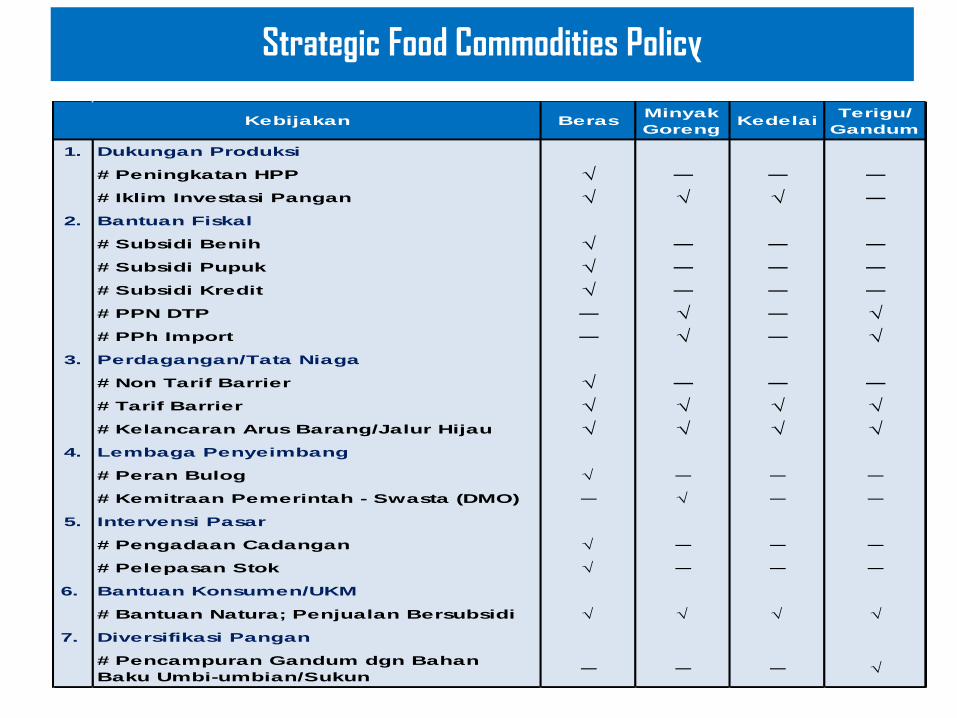
BerasMinyak
GorengKedelai
Terigu/
Gandum
1. Dukungan Produksi
# Peningkatan HPP √ ─ ─ ─
# Iklim Investasi Pangan √ √ √ ─
2. Bantuan Fiskal
# Subsidi Benih √ ─ ─ ─
# Subsidi Pupuk √ ─ ─ ─
# Subsidi Kredit √ ─ ─ ─
# PPN DTP ─ √ ─ √
# PPh Import ─ √ ─ √
3. Perdagangan/Tata Niaga
# Non Tarif Barrier √ ─ ─ ─
# Tarif Barrier √ √ √ √
# Kelancaran Arus Barang/Jalur Hijau √ √ √ √
4. Lembaga Penyeimbang
# Peran Bulog √ ─ ─ ─
# Kemitraan Pemerintah - Swasta (DMO) ─ √ ─ ─
5. Intervensi Pasar
# Pengadaan Cadangan √ ─ ─ ─
# Pelepasan Stok √ ─ ─ ─
6. Bantuan Konsumen/UKM
# Bantuan Natura; Penjualan Bersubsidi √ √ √ √
7. Diversifikasi Pangan
# Pencampuran Gandum dgn Bahan
Baku Umbi-umbian/Sukun─ ─ ─ √
Kebijakan
Strategic Food Commodities Policy
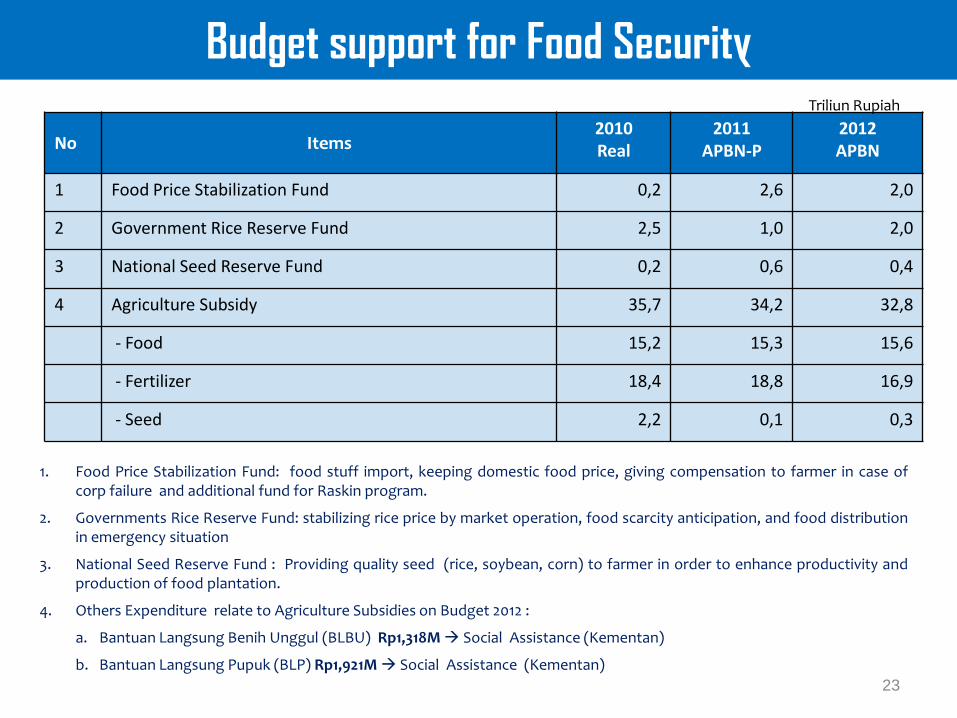
Budget support for Food Security
No Items2010Real
2011APBN-P
2012APBN
1 Food Price Stabilization Fund 0,2 2,6 2,0
2 Government Rice Reserve Fund 2,5 1,0 2,0
3 National Seed Reserve Fund 0,2 0,6 0,4
4 Agriculture Subsidy 35,7 34,2 32,8
- Food 15,2 15,3 15,6
- Fertilizer 18,4 18,8 16,9
- Seed 2,2 0,1 0,3
1. Food Price Stabilization Fund: food stuff import, keeping domestic food price, giving compensation to farmer in case ofcorp failure and additional fund for Raskin program.
2. Governments Rice Reserve Fund: stabilizing rice price by market operation, food scarcity anticipation, and food distributionin emergency situation
3. National Seed Reserve Fund : Providing quality seed (rice, soybean, corn) to farmer in order to enhance productivity andproduction of food plantation.
4. Others Expenditure relate to Agriculture Subsidies on Budget 2012 :
a. Bantuan Langsung Benih Unggul (BLBU) Rp1,318M Social Assistance (Kementan)
b. Bantuan Langsung Pupuk (BLP) Rp1,921M Social Assistance (Kementan)
Triliun Rupiah
23
24