Embed Size (px)
Citation preview
Connectwhereit countsMapping your transformation into a digital economywith GCI 2016


Table ofContentsExecutive Summary
A global digital economy worth trillions
What you can expect from GCI 2016
The pillars of a digital economy: Supply, Demand, Experience, and Potential
GCI 2016: How did you do?
GCI 2016: Dramatic changes for some countries
Technology innovation trends
The future: Augmented Innovation
Realizing economic transformation with the five tech enablers
The five tech enablers in action: Smart Cities
Digitizing industry to build a digital economy
Call to action: Recommendations for Starters, Adopters, and Frontrunners
Seven countries in focusChina IndiaIndonesiaMalaysiaMoroccoThe UKThe USA
Methodology
GCI definitions
FAQ
04
06
08
10
18
29
32
36
38
44
47
54
5959626568717376
79
86
91

G C I 2 0 1 6 :
H O W D O Y O U S T A C K U P ?
Lorem ipsum dolor sit ametdelirium epitamesa laten
E X E C U T I V E S U M M A R Y
Imagine the possibilities when you know what, where,
when, and how to connect.
5
As you’re reading this, a revolutionary shift is happening in the way the world works, with economies across the planet going digital fast.
So, what were the major digital transformation trends in 2015? The main investment target of all nations was broadband – both speed and coverage.
Developed economies concentrated on accelerating downloads and cutting latency. They also made headway in deploying cloud services, big data analytics, and the Internet of Things (IoT) – but not to the extent that can prevent economic stagnancy right now. Data is simply not creating the value it could.
Emerging economies are focusing on broadband coverage, but they’re weak in cloud, big data, and IoT. This is hindering the productivity and scaling benefits of digitization.
Individually, some countries like the UK, Malaysia, and Indonesia played a great game over the past year, making gains and jumping in rank. Not all countries are reaping the benefits of the digital whirlwind, though – the rate of increase is uneven, and some countries are falling behind.
But there’s a way out.
Balancing four economic pillars can form the necessary foundation for ICT to thrive. These pillars are supply, demand, experience, and potential. Technology needs to be available or governments, industry, and people can’t use it; it needs to deliver a good experience or people won’t use it; it needs to sow the seeds for
a better future or its potential is wasted.
While everyone instinctively knows that technology is good, investment in ICT is invisible – it isn’t as obvious as police on the streets, a new school, or more nurses. However, here’s what we’ve found: a one-point increase in your national GCI rating correlates with the following:
• A 2.1 percent increase in competitiveness.
• A 2.2 percent rise in innovation.• A 2.3 percent jump in productivity.
And it can help drive up your GDP per capita – the pulse of economic health.
How much your GCI score ramps up GDP depends on which stage your country is in when it comes to innovation. We’ve identified four stages of digital maturity: Foundation, Internet, Data, and the stage no country has reached yet – Augmented. But more on that later.
Let’s get back to ICT. It encompasses many things, but in this white paper we talk about five key technologies that enable economic digitization: broadband, data centers, cloud services, big data, and IoT.
Investing in these five ICT tech enablers – especially broadband – lays a muscular infrastructure for digital transformation and long-term economic health, competitiveness, innovation, and productivity.
There are no shortcuts on the journey to digital transformation.
Find out where you are and where you can go by connecting where it counts.
Huawei’s Global Connectivity Index (GCI) 2016 measures how 50 nations are progressing with digital transformation using Information and Communications Technology (ICT).
E X E C U T I V E S U M M A R Y

G C I 2 0 1 6 :
H O W D O Y O U S T A C K U P ?
Lorem ipsum dolor sit ametdelirium epitamesa laten
A G L O B A L D I G I T A L
E C O N O M Y W O R T H T R I L L I O N S
A digital economy is born whendigital computing technologies
enable economic activity.
7
The digital economy has emerged as an unstoppablegiant that’s growing at 10 percent a year – more than triple the rate ofoverall global economic growth.
Big business in the global digital economy
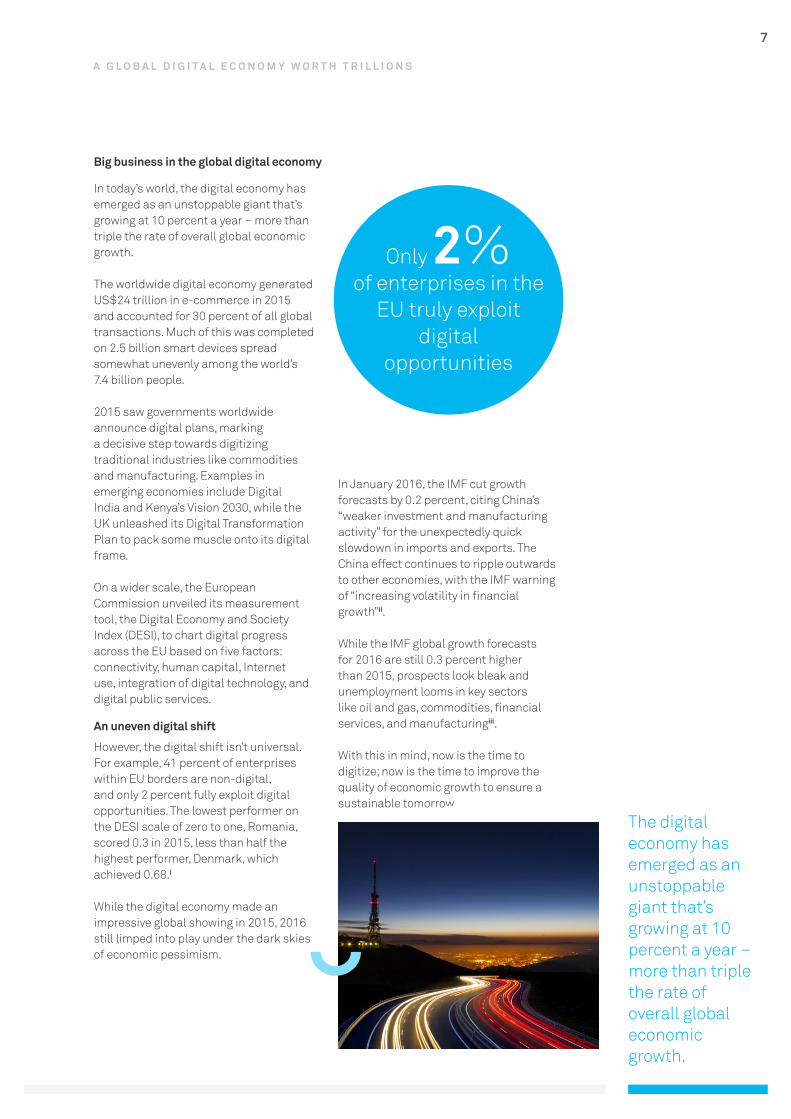
In today’s world, the digital economy has emerged as an unstoppable giant that’s growing at 10 percent a year – more than triple the rate of overall global economic growth.
The worldwide digital economy generated US$24 trillion in e-commerce in 2015 and accounted for 30 percent of all global transactions. Much of this was completed on 2.5 billion smart devices spread somewhat unevenly among the world’s 7.4 billion people.
2015 saw governments worldwide announce digital plans, marking a decisive step towards digitizing traditional industries like commodities and manufacturing. Examples in emerging economies include Digital India and Kenya’s Vision 2030, while the UK unleashed its Digital Transformation Plan to pack some muscle onto its digital frame.
On a wider scale, the European Commission unveiled its measurement tool, the Digital Economy and Society Index (DESI), to chart digital progress across the EU based on five factors: connectivity, human capital, Internet use, integration of digital technology, and digital public services.
An uneven digital shift
However, the digital shift isn’t universal. For example, 41 percent of enterprises within EU borders are non-digital, and only 2 percent fully exploit digital opportunities. The lowest performer on the DESI scale of zero to one, Romania, scored 0.3 in 2015, less than half the highest performer, Denmark, which achieved 0.68.i
While the digital economy made an impressive global showing in 2015, 2016 still limped into play under the dark skies of economic pessimism.
In January 2016, the IMF cut growth forecasts by 0.2 percent, citing China’s “weaker investment and manufacturing activity” for the unexpectedly quick slowdown in imports and exports. The China effect continues to ripple outwards to other economies, with the IMF warning of “increasing volatility in financial growth”ii.
While the IMF global growth forecasts for 2016 are still 0.3 percent higher than 2015, prospects look bleak and unemployment looms in key sectors like oil and gas, commodities, financial services, and manufacturingiii.
With this in mind, now is the time to digitize; now is the time to improve the quality of economic growth to ensure a sustainable tomorrow.
A G L O B A L D I G I T A L E C O N O M Y W O R T H T R I L L I O N S
Only 2%of enterprises in the
EU truly exploit digital
opportunities
FPO
G C I 2 0 1 6 :
H O W D O Y O U S T A C K U P ?
Lorem ipsum dolor sit ametdelirium epitamesa laten
W H A T Y O U C A N E X P E C T F R O M G C I 2 0 1 6
The GCI is a unique quantitative assessment that comprehensively and objectively evaluates connectivity from
both a national and industrial perspective.
9
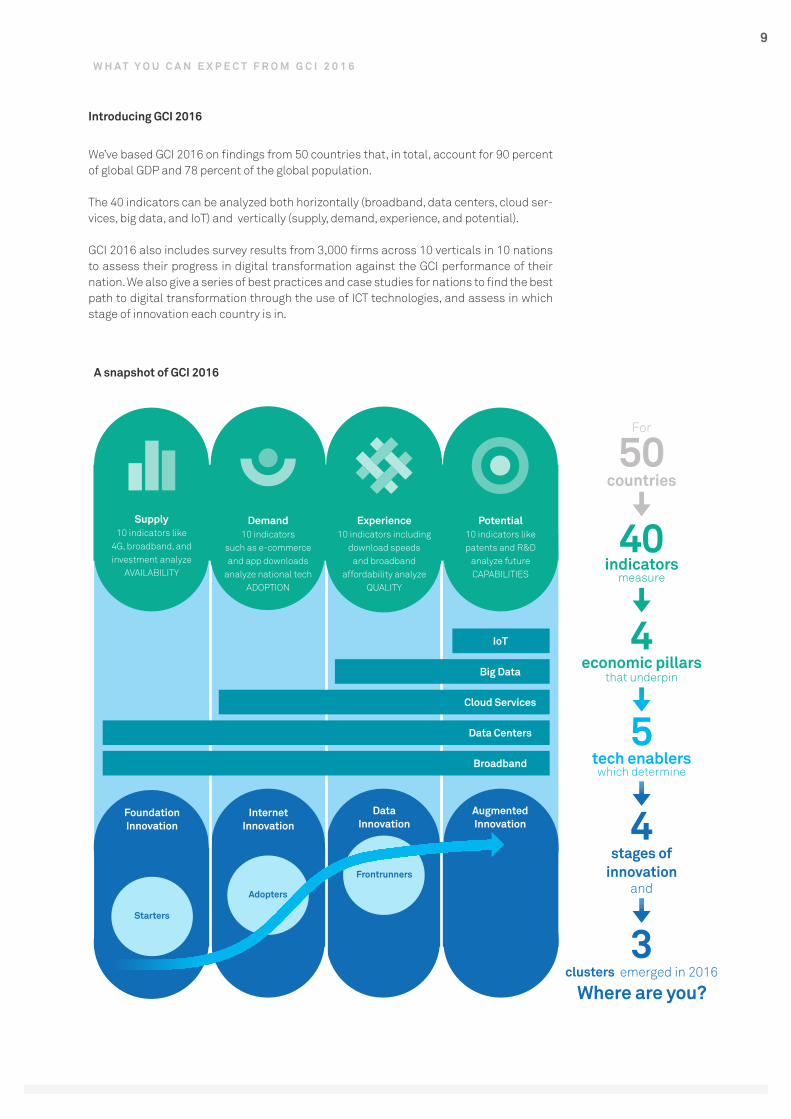
We’ve based GCI 2016 on findings from 50 countries that, in total, account for 90 percent of global GDP and 78 percent of the global population.
The 40 indicators can be analyzed both horizontally (broadband, data centers, cloud ser-vices, big data, and IoT) and vertically (supply, demand, experience, and potential).
GCI 2016 also includes survey results from 3,000 firms across 10 verticals in 10 nations to assess their progress in digital transformation against the GCI performance of their nation. We also give a series of best practices and case studies for nations to find the best path to digital transformation through the use of ICT technologies, and assess in which stage of innovation each country is in.
W H A T Y O U C A N E X P E C T F R O M G C I 2 0 1 6
A snapshot of GCI 2016
FoundationInnovation
Starters
Frontrunners
InternetInnovation
DataInnovation
AugmentedInnovation
Adopters
IoT
Cloud Services
Data Centers
Broadband
Big Data
3 clusters emerged in 2016
Where are you?
For
50countries
40indicators
measure
4economic pillars
that underpin
5 tech enablers
which determine
4stages of
innovation and
Supply10 indicators like
4G, broadband, and investment analyze
AVAILABILITY
Demand10 indicators
such as e-commerce and app downloads
analyze national techADOPTION
Experience10 indicators including
download speeds and broadband
affordability analyze QUALITY
Potential10 indicators like patents and R&D
analyze future CAPABILITIES
Introducing GCI 2016
G C I 2 0 1 6 :
H O W D O Y O U S T A C K U P ?
Lorem ipsum dolor sit ametdelirium epitamesa laten
T H E P I L L A R S O F A D I G I T A L E C O N O M Y
S U P P L Y, D E M A N D , E X P E R I E N C E , A N D P O T E N T I A L
( S D E P )
These encompass the entire chainof ICT development and digital
transformation to provide a 360-degree view of the digital economy.
Supply Demand Experience Potential

11
Investment in supply-side ICT is a precondition for ubiquitous connectivity and a digital economy.
Supply measures current levels of supply of ICT products and services.
Better connectivity requires key supply elements to be widely available, including infrastructure, wired and wireless coverage, telecommunications companies (telcos), data centers (DCs), and data. For IoT infrastructure, platforms, and services to flourish, the supply of these elements relies on investment from governments, businesses, telcos, and cloud service providers. Investment by end users in IT hardware (such as servers, storage, and PCs), software, and services, also influences the supply foundation.
Major indicators include quality of bandwidth, wireless coverage, and fiber optic connections, all of which gauge the impact of supply on connectivity.
Snapshot: Vietnam
To ensure the supply of high-speed broadband, the Vietnamese government issued five licenses in 2014 for telcos to trial 4G services, with two running 4G pilots in late 2015 based on plans to rollout 4G services by mid 2016. This drove up ICT investment in Vietnam in 2015 in line with the ICT development plans of both the nation’s government and ASEAN TELMIN for 2020. Specifically, Vietnam is seeking to increase the supply of high-speed broadband so it can become a major contributor to the ASEAN plan.
Supply
T H E P I L L A R S O F A D I G I T A L E C O N O M Y : S D E P
3.80
2.0% 14.3% 1.3% 1.9%
800700
1,5401,520
1101083.72
Global digital investment in 2015 and forecasts for 2016
I C TI N V E S T M E N T
( I N U S $ T R I L L I O N S )
I O TI N V E S T M E N T
( I N U S $ B I L L I O N S )
T E L E C O MI N V E S T M E N T
( I N U S $ B I L L I O N S )
D ATA C E N T E RI N V E S T M E N T
( I N U S $ B I L L I O N S )
2015 2016
12
Onceconnected, the appetite for data, applications, and services grows, which in turn drives supply and investment in infrastructure and services.
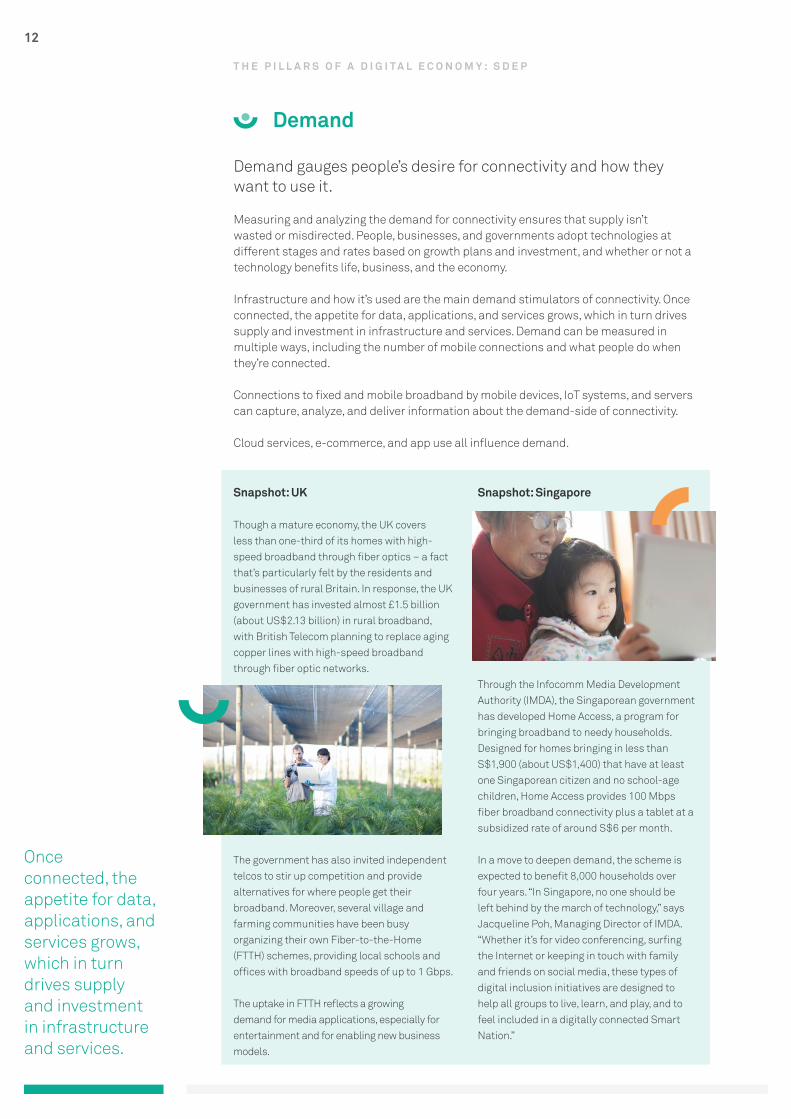
Demand gauges people’s desire for connectivity and how they want to use it.
Measuring and analyzing the demand for connectivity ensures that supply isn’t wasted or misdirected. People, businesses, and governments adopt technologies at different stages and rates based on growth plans and investment, and whether or not a technology benefits life, business, and the economy.
Infrastructure and how it’s used are the main demand stimulators of connectivity. Once connected, the appetite for data, applications, and services grows, which in turn drives supply and investment in infrastructure and services. Demand can be measured in multiple ways, including the number of mobile connections and what people do when they’re connected.
Connections to fixed and mobile broadband by mobile devices, IoT systems, and servers can capture, analyze, and deliver information about the demand-side of connectivity.
Cloud services, e-commerce, and app use all influence demand.
Snapshot: UK
Though a mature economy, the UK covers less than one-third of its homes with high-speed broadband through fiber optics – a fact that’s particularly felt by the residents and businesses of rural Britain. In response, the UK government has invested almost £1.5 billion (about US$2.13 billion) in rural broadband, with British Telecom planning to replace aging copper lines with high-speed broadband through fiber optic networks.
The government has also invited independent telcos to stir up competition and provide alternatives for where people get their broadband. Moreover, several village and farming communities have been busy organizing their own Fiber-to-the-Home (FTTH) schemes, providing local schools and offices with broadband speeds of up to 1 Gbps.
The uptake in FTTH reflects a growing demand for media applications, especially for entertainment and for enabling new business models.
Snapshot: Singapore
Through the Infocomm Media Development Authority (IMDA), the Singaporean government has developed Home Access, a program for bringing broadband to needy households. Designed for homes bringing in less than S$1,900 (about US$1,400) that have at least one Singaporean citizen and no school-age children, Home Access provides 100 Mbps fiber broadband connectivity plus a tablet at a subsidized rate of around S$6 per month.
In a move to deepen demand, the scheme is expected to benefit 8,000 households over four years. “In Singapore, no one should be left behind by the march of technology,” says Jacqueline Poh, Managing Director of IMDA. “Whether it’s for video conferencing, surfing the Internet or keeping in touch with family and friends on social media, these types of digital inclusion initiatives are designed to help all groups to live, learn, and play, and to feel included in a digitally connected Smart Nation.”
Demand
T H E P I L L A R S O F A D I G I T A L E C O N O M Y : S D E P
13
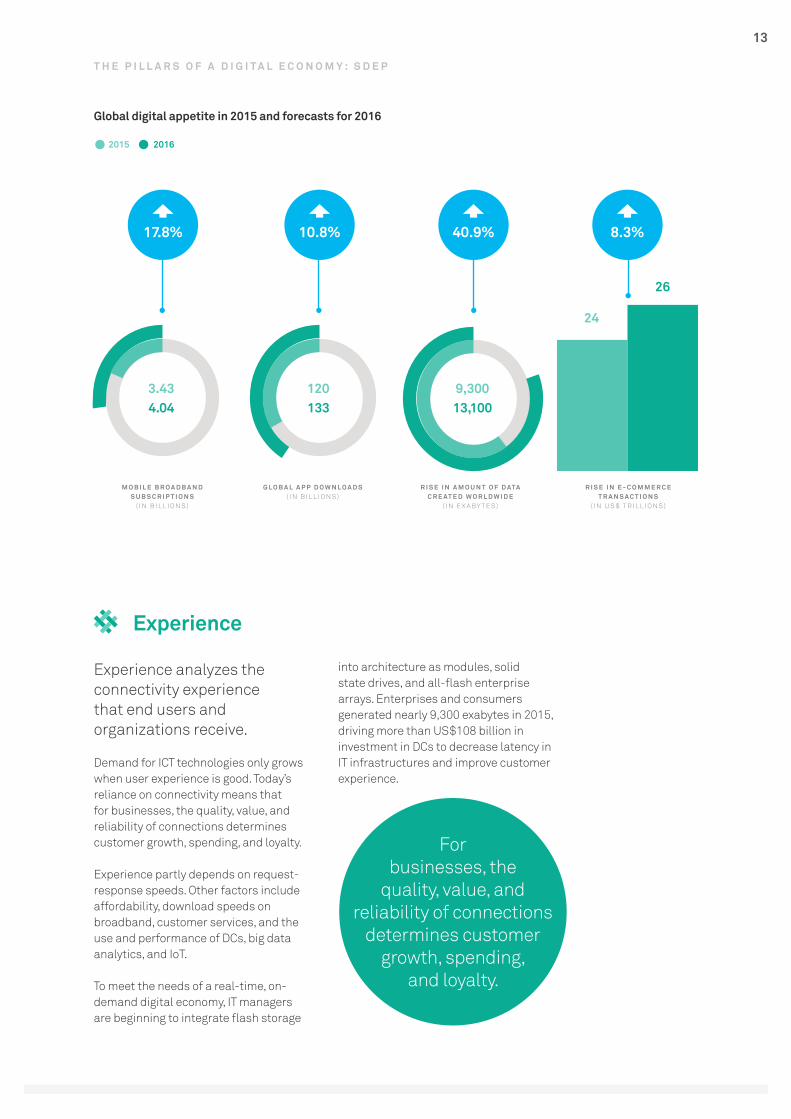
Experience analyzes the connectivity experiencethat end users and organizations receive.
Demand for ICT technologies only grows when user experience is good. Today’s reliance on connectivity means that for businesses, the quality, value, and reliability of connections determines customer growth, spending, and loyalty.
Experience partly depends on request-response speeds. Other factors include affordability, download speeds on broadband, customer services, and the use and performance of DCs, big data analytics, and IoT.
To meet the needs of a real-time, on-demand digital economy, IT managers are beginning to integrate flash storage
into architecture as modules, solid state drives, and all-flash enterprise arrays. Enterprises and consumers generated nearly 9,300 exabytes in 2015, driving more than US$108 billion in investment in DCs to decrease latency in IT infrastructures and improve customer experience.
Experience
T H E P I L L A R S O F A D I G I T A L E C O N O M Y : S D E P
Global digital appetite in 2015 and forecasts for 2016
9,3001203.4313,1001334.04
M O B I L E B R O A D B A N DS U B S C R I P T I O N S
( I N B I L L I O N S )
R I S E I N A M O U N T O F D ATAC R E AT E D W O R L D W I D E
( I N E X A B Y T E S )
G L O B A L A P P D O W N L O A D S( I N B I L L I O N S )
R I S E I N E - C O M M E R C ET R A N S A C T I O N S
( I N U S $ T R I L L I O N S )
Forbusinesses, the
quality, value, andreliability of connections
determines customer growth, spending,
and loyalty.
24
26
2015 2016
17.8% 8.3%10.8% 40.9%
14
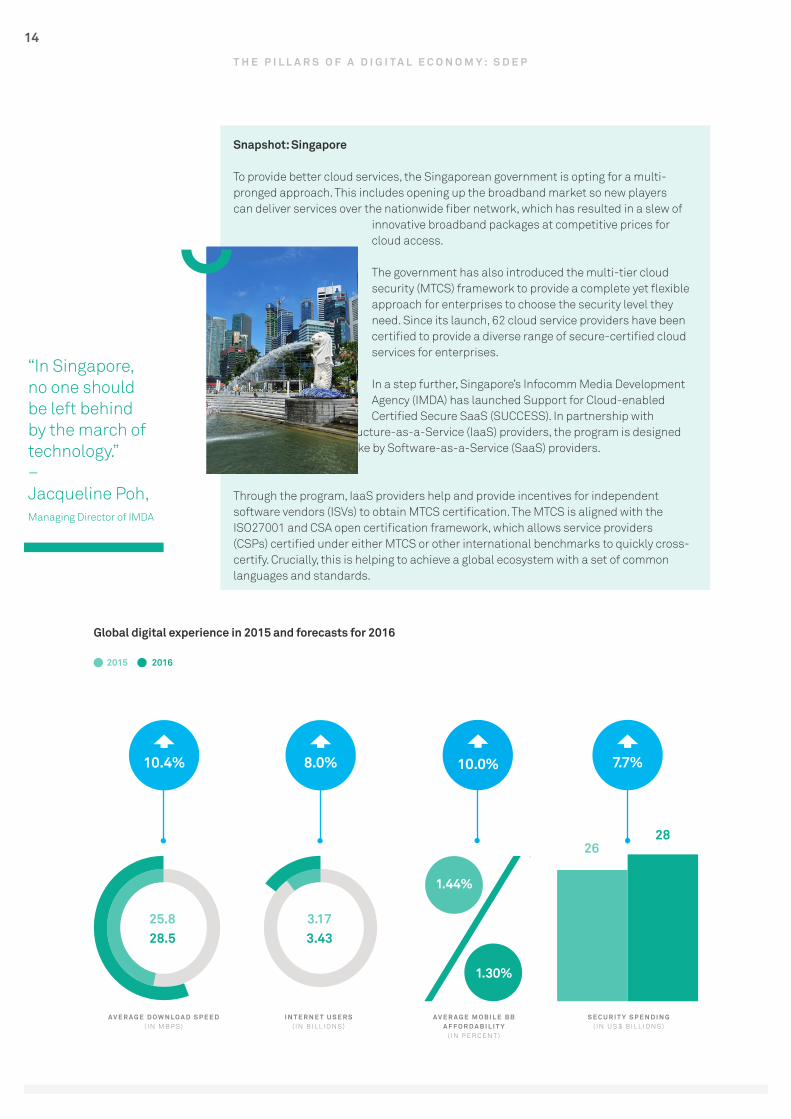
Snapshot: Singapore
To provide better cloud services, the Singaporean government is opting for a multi-pronged approach. This includes opening up the broadband market so new players can deliver services over the nationwide fiber network, which has resulted in a slew of
innovative broadband packages at competitive prices for cloud access.
The government has also introduced the multi-tier cloud security (MTCS) framework to provide a complete yet flexible approach for enterprises to choose the security level they need. Since its launch, 62 cloud service providers have been certified to provide a diverse range of secure-certified cloud services for enterprises.
In a step further, Singapore’s Infocomm Media Development Agency (IMDA) has launched Support for Cloud-enabled Certified Secure SaaS (SUCCESS). In partnership with
MTCS-certified Infrastructure-as-a-Service (IaaS) providers, the program is designed to stimulate MTCS uptake by Software-as-a-Service (SaaS) providers.
Through the program, IaaS providers help and provide incentives for independent software vendors (ISVs) to obtain MTCS certification. The MTCS is aligned with the ISO27001 and CSA open certification framework, which allows service providers (CSPs) certified under either MTCS or other international benchmarks to quickly cross-certify. Crucially, this is helping to achieve a global ecosystem with a set of common languages and standards.
T H E P I L L A R S O F A D I G I T A L E C O N O M Y : S D E P
Global digital experience in 2015 and forecasts for 2016
A V E R A G E D O W N L O A D S P E E D( I N M B P S )
I N T E R N E T U S E R S( I N B I L L I O N S )
A V E R A G E M O B I L E B BA F F O R D A B I L I T Y
( I N P E R C E N T )
S E C U R I T Y S P E N D I N G( I N U S $ B I L L I O N S )
“In Singapore, no one should be left behind by the march of technology.”–Jacqueline Poh,Managing Director of IMDA
2628
7.7%
1.44%
1.30%
10.0%
3.1725.83.4328.5
10.4% 8.0%
2015 2016
15
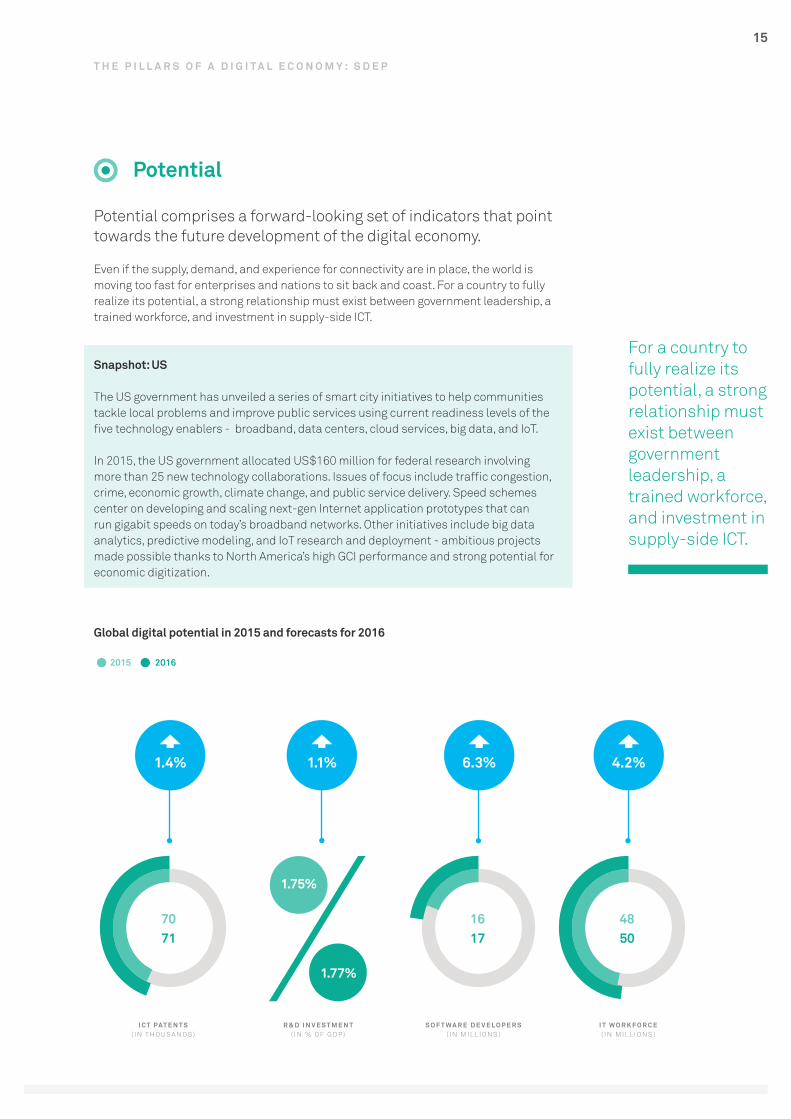
Global digital potential in 2015 and forecasts for 2016
I C T PAT E N T S( I N T H O U S A N D S )
R & D I N V E S T M E N T( I N % O F G D P )
S O F T W A R E D E V E L O P E R S( I N M I L L I O N S )
I T W O R K F O R C E( I N M I L L I O N S )
Potential comprises a forward-looking set of indicators that point towards the future development of the digital economy.
Even if the supply, demand, and experience for connectivity are in place, the world is moving too fast for enterprises and nations to sit back and coast. For a country to fully realize its potential, a strong relationship must exist between government leadership, a trained workforce, and investment in supply-side ICT.
Snapshot: US
The US government has unveiled a series of smart city initiatives to help communities tackle local problems and improve public services using current readiness levels of the five technology enablers - broadband, data centers, cloud services, big data, and IoT.
In 2015, the US government allocated US$160 million for federal research involving more than 25 new technology collaborations. Issues of focus include traffic congestion, crime, economic growth, climate change, and public service delivery. Speed schemes center on developing and scaling next-gen Internet application prototypes that can run gigabit speeds on today’s broadband networks. Other initiatives include big data analytics, predictive modeling, and IoT research and deployment - ambitious projects made possible thanks to North America’s high GCI performance and strong potential for economic digitization.
Potential
T H E P I L L A R S O F A D I G I T A L E C O N O M Y : S D E P
For a country to fully realize its potential, a strongrelationship must exist between government leadership, a trained workforce, and investment in supply-side ICT.
1.75%
1.77%
70 16 4871 17 50
1.4% 1.1% 6.3% 4.2%
2015 2016

16
The transformation process of the digital economy depends on the coordinated development of these four pillars:
SupplyDemandExperience Potential
Supply means investing in a strong digital infrastructure that can provide enough digital services to those who want them. The relationship between supply and demand is symbiotic: better supply leads to higher demand, while strong demand drives up investment in supply.
Indonesia, for example, increased ICT investment by 6 percent between 2014 and 2015 to drive mobile broadband adoption up from 37 percent in 2014 to 50 percent. The resulting increase in demand is expected to boost ICT investment further, pushing mobile broadband coverage beyond current levels.
Investment in cultivating demand generally intensifies competition and increases funding to improve experience through better quality of service (QoS). When this happens, demand for services
increases.
In the case of broadband, people value speed and reliability. In China, spending on the media and entertainment sector has increased because the broadband experience has improved, creating high demand. With more people using mobile broadband to access digital entertainment services, the market is expected to be worth US$800 million by 2018.
Investing in supply can mean upgrading digital infrastructure to boost experience. Better QoS generally leads to further network upgrades, creating a virtuous cycle of investment. In Europe, the UK is putting money into a next-gen broadband network to enhance the broadband experience for users, hoping to cover 95 percent of the country with super-fast broadband services at 100 Mbps by 2017.
Supply, demand, and experience help build the potential of nations for growing their digital economies, with ample supply, high demand, and a good experience.
This in turn creates strong momentum for nations to transform into digital economies.
The relationship between the four pillars: SDEP
T H E P I L L A R S O F A D I G I T A L E C O N O M Y : S D E P

17
The relationship between the four pillars: SDEP
Gro
ws the
digi
tal m
arke
t
Lays the digital foundation
Increases the digital appetite Exper
ienc
e
Supply
Dem
and
Potential
Driving DigitalFuture Momentum
Sup
ply
build
s co
vera
ge a
nd in
creases penetra
tion
Dem
and boosts experience through standards and network quality
Experience drives funding for upgrades
Dem
and
driv
es fu
ndin
g for e
xpansion
Network externalities increase demand
Supply improves quality and experience
T H E P I L L A R S O F A D I G I T A L E C O N O M Y : S D E P
G C I 2 0 1 6 :
H O W D O Y O U S T A C K U P ?
Lorem ipsum dolor sit ametdelirium epitamesa laten
G C I 2 0 1 6
H O W D I D Y O U D O ?
The GCI metric reliably indicateswhere a nation is located on the
road to a digital economy.
19
1
2
3
4
5
6
7
8
9
10
11
12
13
14
15
16
17
18
19
20
21
22
23
24
25
26
27
28
29
30
31
32
33
34
35
36
37
38
39
40
41
42
43
44
45
46
47
48
49
50
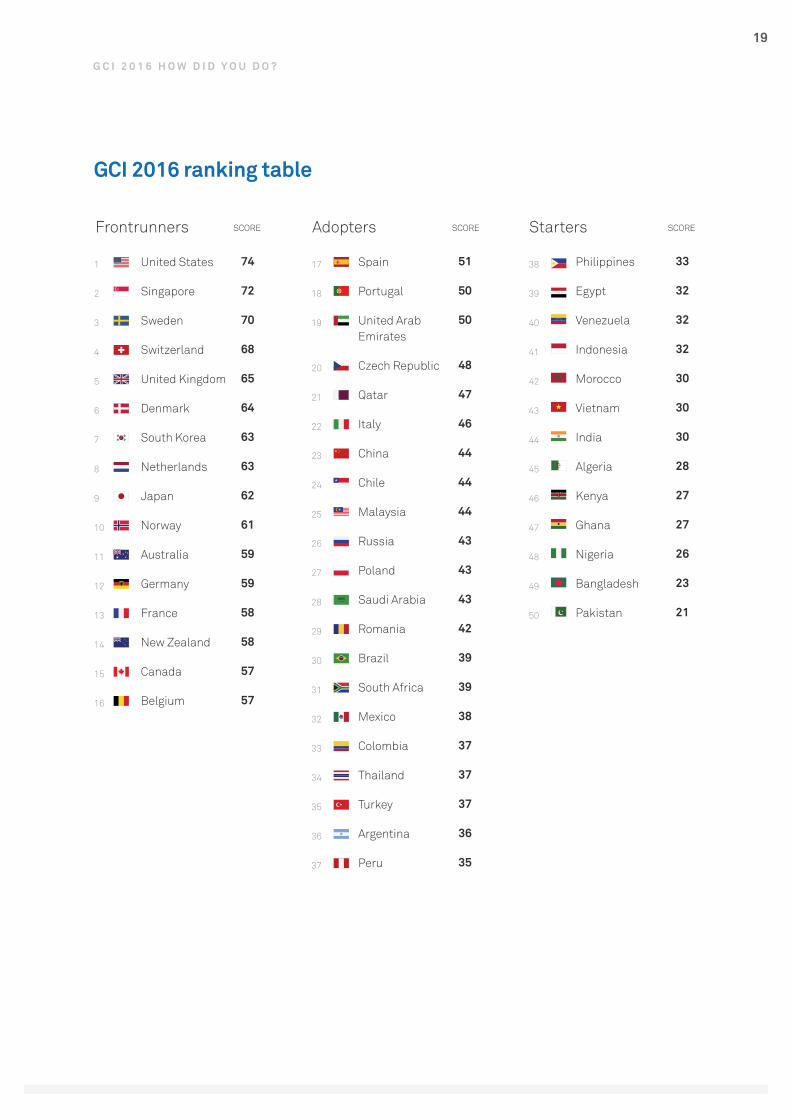
United States
Singapore
Sweden
Switzerland
United Kingdom
Denmark
South Korea
Netherlands
Japan
Norway
Australia
Germany
France
New Zealand
Canada
Belgium
Spain
Portugal
United ArabEmirates
Czech Republic
Qatar
Italy
China
Chile
Malaysia
Russia
Poland
Saudi Arabia
Romania
Brazil
South Africa
Mexico
Colombia
Thailand
Turkey
Argentina
Peru
Philippines
Egypt
Venezuela
Indonesia
Morocco
Vietnam
India
Algeria
Kenya
Ghana
Nigeria
Bangladesh
Pakistan
74
72
70
68
65
64
63
63
62
61
59
59
58
58
57
57
51
50
50
48
47
46
44
44
44
43
43
43
42
39
39
38
37
37
37
36
35
33
32
32
32
30
30
30
28
27
27
26
23
21
G C I 2 0 1 6 H O W D I D Y O U D O ?
GCI 2016 ranking table
Frontrunners Adopters StartersSCORE SCORE SCORE
20
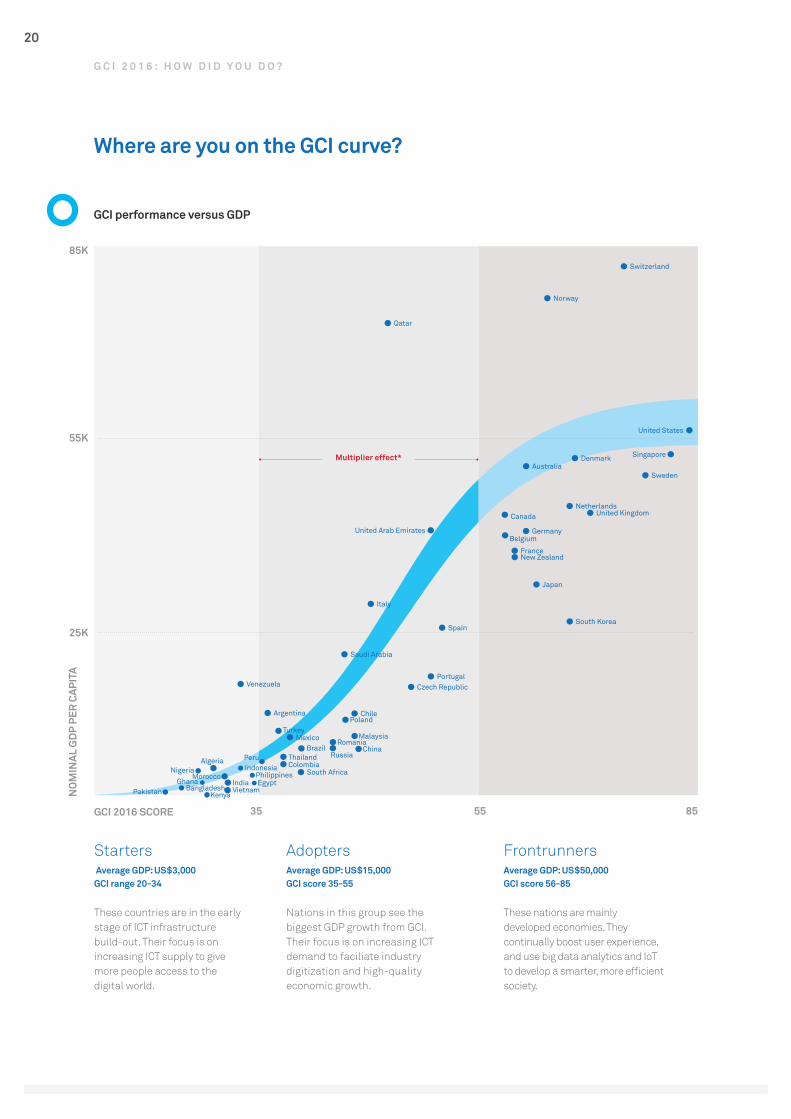
Where are you on the GCI curve?
G C I 2 0 1 6 : H O W D I D Y O U D O ?
GCI performance versus GDP
NO
MIN
AL G
DP
PER
CAP
ITA
GCI 2016 SCORE 35 55 85
25K
55K
85K
Multiplier effect*
Algeria
Morocco
Kenya
Indonesia
IndiaGhana Egypt
Argentina
Turkey
Thailand
South Africa
Romania
Russia
Portugal
Poland
Peru
Philippines
Norway
Czech Republic
Denmark
United States
Singapore
Netherlands
New Zealand
Japan
Nigeria
Germany
France
BangladeshPakistan
MalaysiaMexico
Venezuela
Vietnam
Australia
Belgium
Saudi Arabia
United Arab Emirates
United Kingdom
Sweden
Switzerland
SpainSouth Korea
Brazil
Canada
Chile
Italy
Qatar
China
Colombia
These countries are in the early stage of ICT infrastructure build-out. Their focus is on increasing ICT supply to give more people access to the digital world.
Nations in this group see the biggest GDP growth from GCI. Their focus is on increasing ICT demand to faciliate industry digitization and high-quality economic growth.
These nations are mainly developed economies. They continually boost user experience, and use big data analytics and IoT to develop a smarter, more efficient society.
Average GDP: US$3,000GCI range 20-34
Average GDP: US$15,000GCI score 35-55
Average GDP: US$50,000GCI score 56-85
Starters Adopters Frontrunners
21
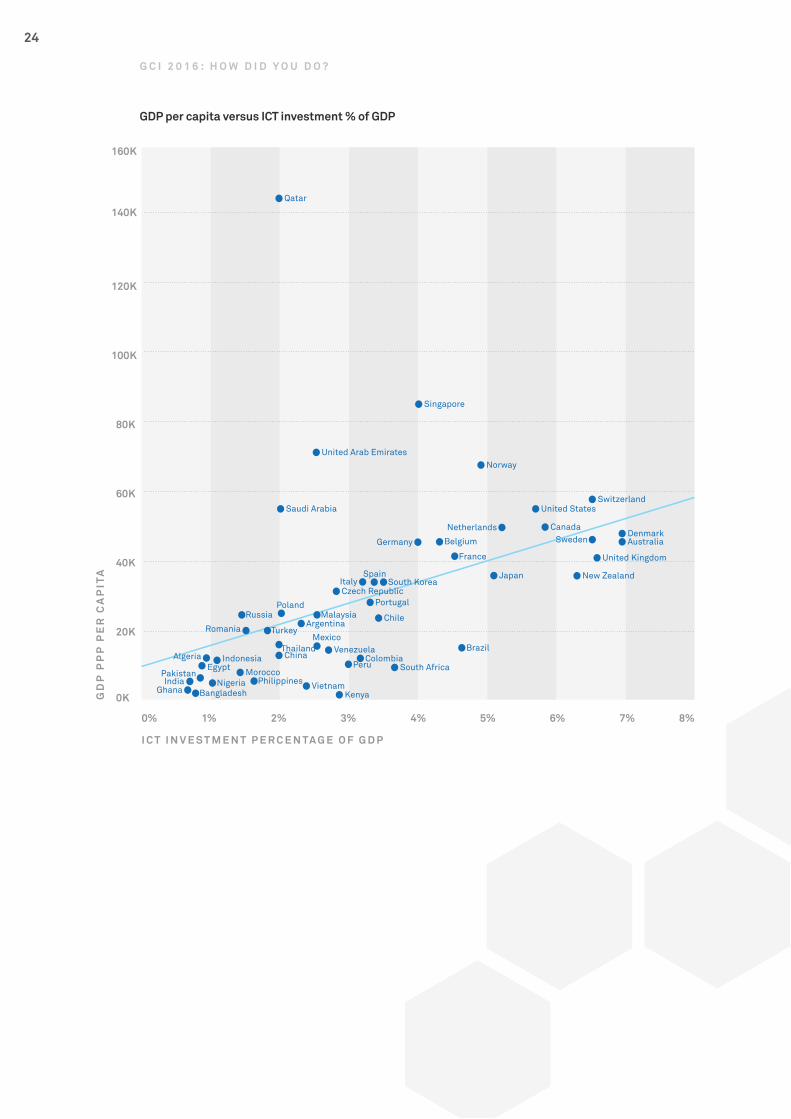
ICT investment correlates with GDP in each stage, but this relationship is not linear, nor is it uniform for each of the five tech enablers. Countries must consider their position along the transformation path and invest accordingly.
G C I 2 0 1 6 : H O W D I D Y O U D O ?
Starters: < 35
Starting in the bottom-left corner, countries with a GCI score of below 35 are Starters on the economic transformation path. They show a flatter GCI to GDP relationship because the GCI’s impact on GDP is low, mainly because none of the five tech enablers are particularly well developed. For example, a data center generates little economic value if the Internet that connects it is too unreliable for businesses to depend on. Thus, countries in this cluster would be best served by prioritizing high-speed broadband as none of the other enablers are particularly useful without it.
Adopters: 35 to 55
The second group is clustered in the second stage of digital economic transformation, scoring in the low-to-mid range of 35 to 55. These countries
are using some if not all of the five technology enablers to create economic value, and receive the greatest GDP impact from ICT investment because there’s still low-hanging fruit in their markets to pick.
As the steepness of the curve shows, each point increase in GCI has a greater effect on GDP than it does in the first or third cluster.
Frontrunners: > 55
In the third stage of economic digitization, the GCI-GDP curve starts to flatten out again, because the market is saturated with basic services and newer enablers like big data and IoT are relatively immature. However, that doesn’t mean that these nations should ease up, as another steepening of the curve is waiting in the next stage of the transformation journey.
22
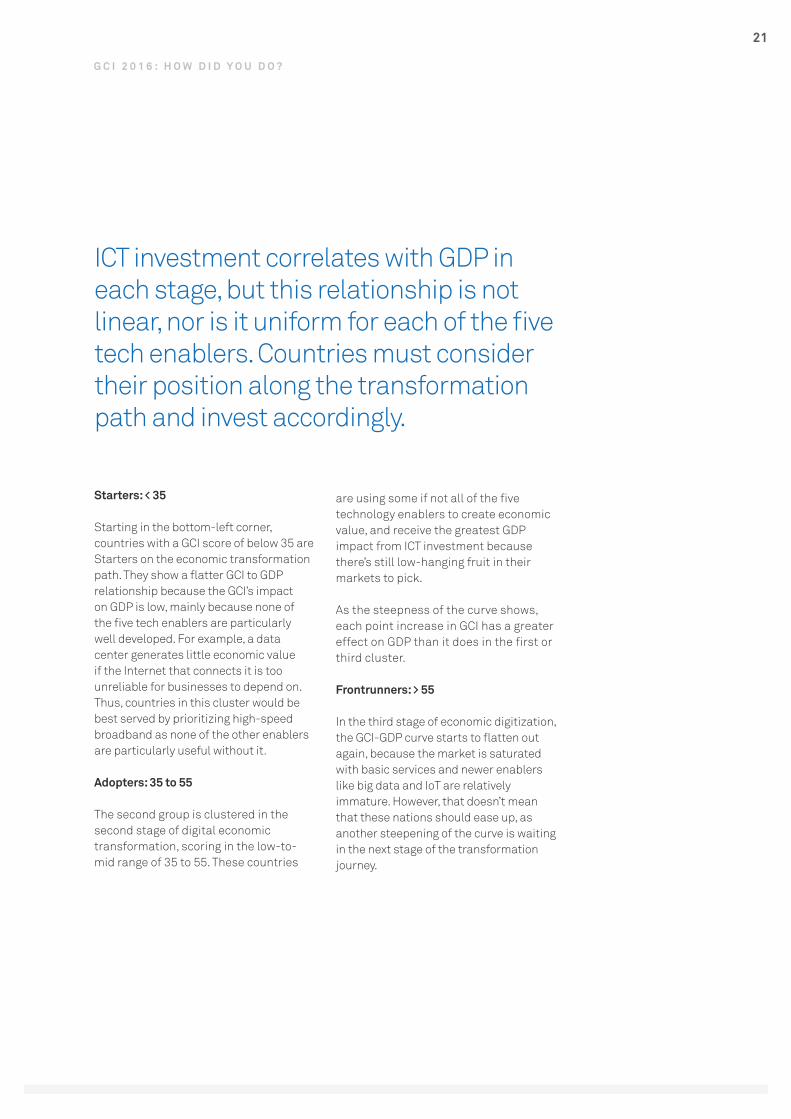
High-GCI nations that invest in the five technology enablers are more competitive, productive, and innovative.
A high GCI score provides a favorable environment for driving industry digitization and boosting competitiveness, innovation, and productivity.
Because GCI scores correlate closely with GDP per capita, investing in GCI pays GDP dividends due to increased economic dynamism, efficiency, and productivity. Although GDP is influenced by many factors, the GCI metric reliably indicates where a nation is located on the road to becoming a digital economy.
One of the roles of digital transformation is to improve productivity, which is closely linked to GDP per worker. Therefore, investment in ICT and GDP per capita performance
show a positive correlation.
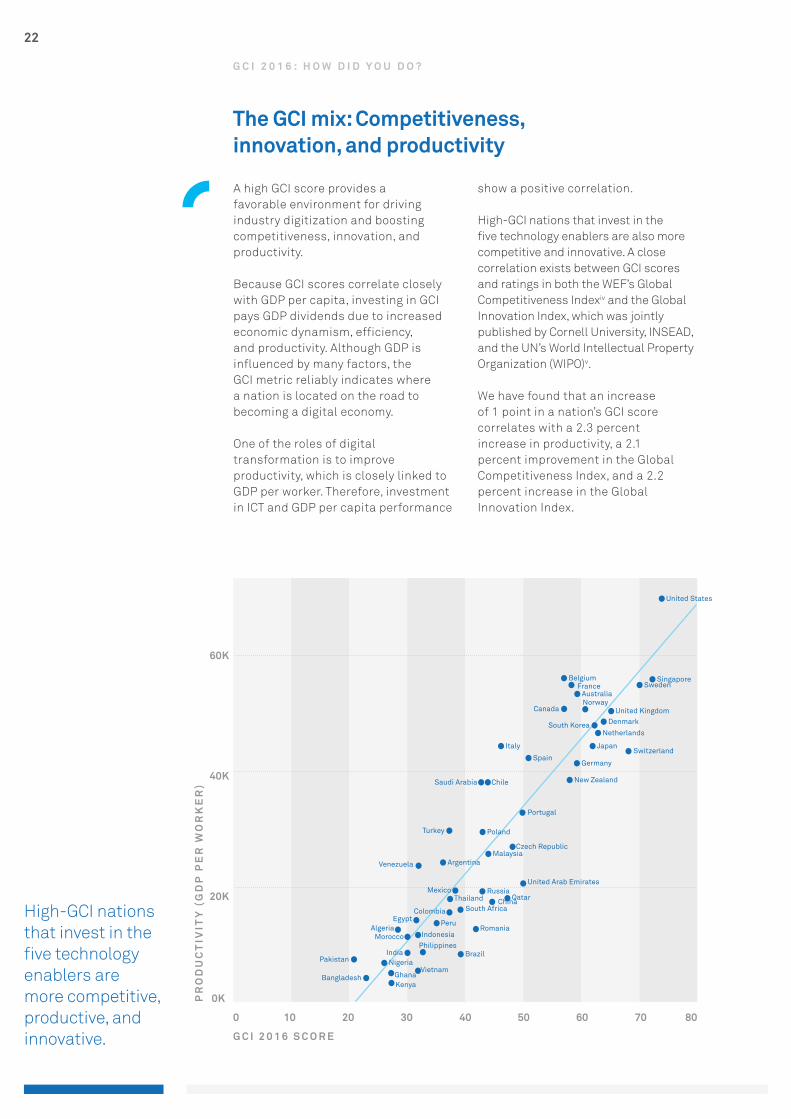
High-GCI nations that invest in the five technology enablers are also more competitive and innovative. A close correlation exists between GCI scores and ratings in both the WEF’s Global Competitiveness Indexiv and the Global Innovation Index, which was jointly published by Cornell University, INSEAD, and the UN’s World Intellectual Property Organization (WIPO)v.
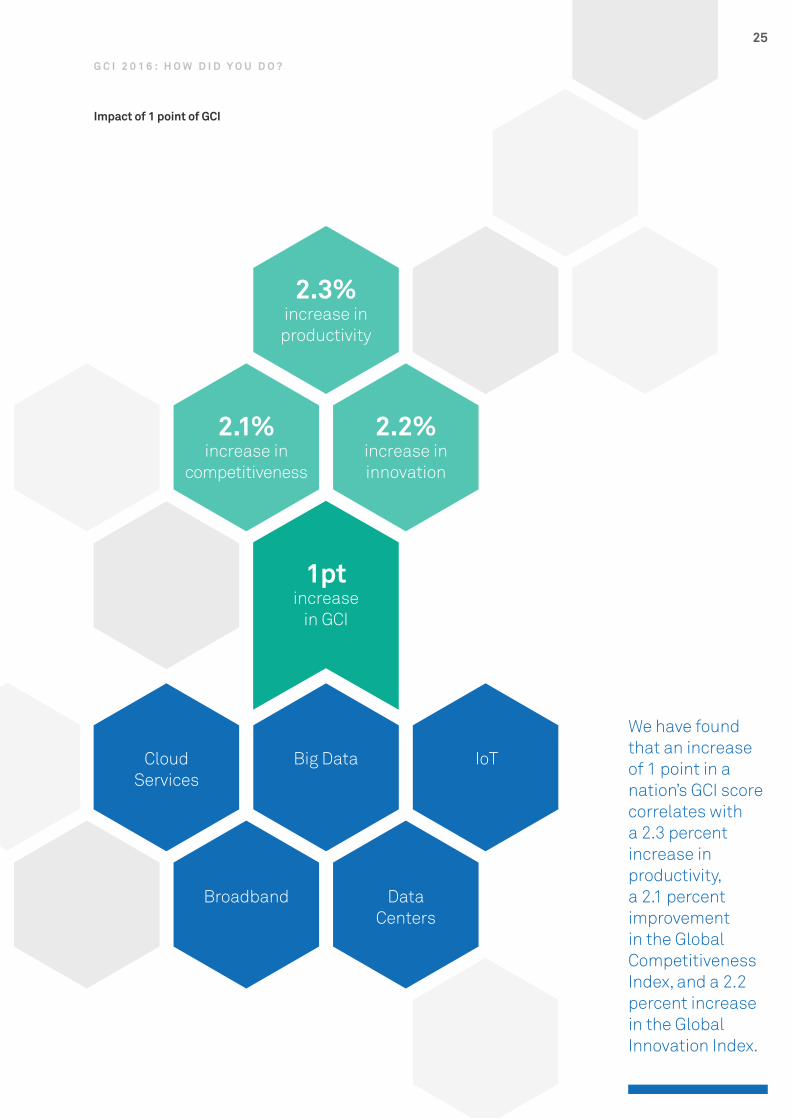
We have found that an increase of 1 point in a nation’s GCI score correlates with a 2.3 percent increase in productivity, a 2.1 percent improvement in the Global Competitiveness Index, and a 2.2 percent increase in the Global Innovation Index.
G C I 2 0 1 6 : H O W D I D Y O U D O ?
The GCI mix: Competitiveness, innovation, and productivity
PR
OD
UC
TIV
ITY
(G
DP
PE
R W
OR
KE
R)
G C I 2 0 1 6 S C O R E
0 10 30 50 7020 40 60 80
20K
0K
40K
60K
Algeria
Argentina
Denmark
Egypt
Netherlands
France
BangladeshVietnam
Ghana
India
Indonesia
Poland
Sweden
Switzerland
Thailand
Portugal
Qatar
United Arab Emirates
United Kingdom
United States
Venezuela
Romania
Russia
South Korea
Spain
Norway
Malaysia
Mexico
PhilippinesMorocco
Italy
New Zealand
Nigeria
Peru
Japan
Belgium
Germany
Brazil
Canada
Kenya
Chile
Singapore
South Africa
Pakistan
ChinaColombia
Turkey
Saudi Arabia
Czech Republic
Australia
23
GCI versus the Global Competitive Index
GL
OB
AL
CO
MP
ET
ITIV
EN
ES
S I
ND
EX
G C I 2 0 1 6 S C O R E0 10 30 50 7020 40 60 80
3
5
4
6
Japan
Algeria Brazil
Canada
Chile
Egypt
Pakistan
South Korea
PeruMorocco
India
Malaysia
PhilippinesIndonesia Portugal
Qatar
United Arab Emirates
United States
Venezuela
Vietnam
UnitedKingdom
Thailand
Turkey
SwitzerlandSingapore
South Africa
Romania
Poland
Netherlands
Italy
Nigeria
NorwayNew Zealand
Ghana
FranceChina
Germany
Kenya
Australia
Bangladesh
DenmarkBelgium
Argentina
Russia
Saudi Arabia
Colombia
Spain
Sweden
GL
OB
AL
IN
NO
VA
TIO
N I
ND
EX
G C I 2 0 1 6 S C O R E
0 10 30 50 7020 40 60 80
40
20
60
80
GCI versus the Global Innovation Index
Algeria
Argentina
Australia
Belgium
Brazil
Chile
EgyptGhana
Nigeria
Malaysia
Kenya
Italy
India
Mexico
Pakistan
MoroccoColombia
NetherlandsSweden
Switzerland
Turkey
UnitedKingdom
United States
Venezuela
Vietnam Thailand
Spain
Singapore
South AfricaRomania
QatarUnited Arab Emirates
Portugal
Poland
Phillipines
Peru
Norway
New Zealand
Indonesia
China
Russia
Japan
Germany
FranceCzech Republic
DenmarkCanada
Bangladesh
Saudi Arabia
South Korea
24
I C T I N V E S T M E N T P E R C E N TA G E O F G D P
0% 1% 3% 5% 7%2% 4% 6% 8%
40K
20K
0K
80K
60K
120K
100K
160K
140K
GD
P P
PP
PE
R C
AP
ITA
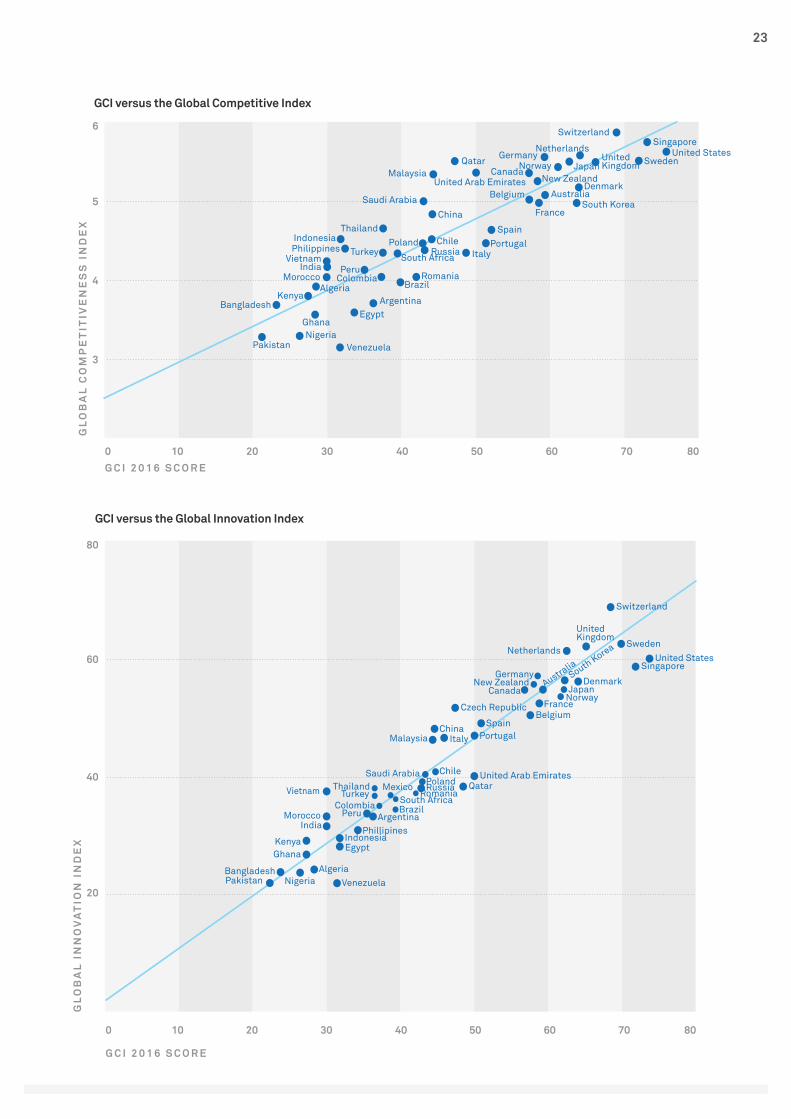
GDP per capita versus ICT investment % of GDP
G C I 2 0 1 6 : H O W D I D Y O U D O ?
Qatar
Algeria
Argentina
Australia
Bangladesh
Belgium
Brazil
Canada
Chile
China Colombia
Czech Republic
Denmark
Egypt
France
New Zealand
Nigeria
Norway
PakistanPeru
Philippines
Poland Portugal
Romania
Russia
Saudi Arabia
Singapore
South Africa
South KoreaSpain
Sweden
Switzerland
Thailand
Turkey
United Arab Emirates
United Kingdom
United States
Venezuela
Vietnam
Germany
GhanaIndia
Indonesia
ItalyJapan
Kenya
Malaysia
Mexico
Morocco
Netherlands
25
We have found that an increase of 1 point in a nation’s GCI score correlates with a 2.3 percent increase in productivity, a 2.1 percent improvement in the Global Competitiveness Index, and a 2.2 percent increase in the Global Innovation Index.
Impact of 1 point of GCI
2.3%
Cloud
G C I 2 0 1 6 : H O W D I D Y O U D O ?
1ptincrease
in GCI
2.1%increase in
competitiveness
CloudServices
Big Data IoT
DataCenters
Broadband
2.2%increase ininnovation
2.3%increase inproductivity
26
The momentum for investing in ICT to improve national GDP, competitiveness, and innovation has continued for most of the economies tracked.
Overall, scores are better than they were in 2015, with the average score increasing from 43.4 last year to 45.5 this year, an improvement of 2 base points (equivalent to 5 percent).
The momentum for investing in ICT to improve national productivity, competitiveness, and innovation has continued for most of the economies tracked. The biggest improvements were seen in supply and demand, although all four pillars improved compared with 2015.
Supply scores show the second highest increase at 2.1 base points (6 percent) higher than 2015, largely due to a 36 percent rise in 4G coverage and 13 percent increases in international bandwidth and fiber-to-the-home (FTTH), including offices. Investment in DCs increased by 9 percent and in IoT by 7 percent.
In 2015, most nations focused on expanding network coverage quality and bandwidth to provide high-speed broadband with sufficient computing capacity. To overcome infrastructure challenges in laying fixed networks, investment was centered on mobile technology rather than landlines. Mobile computing uptake has increased, with more smartphones and IoT devices in use. Data consumption and app downloads are on the rise, with the shift from fixed lines and PCs to mobile devices and wearables continuing.
Demand scores improved the most at 2.7 base points (7 percent) higher than 2015. This is mainly attributable to user-generated data, which saw a 17 percent increase, signifying that data intensity and the indirect demand for big data are growing fast. This is followed by smartphone penetration (up 16 percent) and then IoT infrastructure, which grew per capita by 11 percent. Mobile broadband penetration and app downloads per capita grew by 9 percent and 5 percent, respectively.
Experience scores rose by 4 percent on average, with variations between nations existing because low-GCI economies are still expanding their infrastructures and ICT use.
Globally, improvements were seen in download speeds (up 7 percent over 2015), customer services (up 8 percent) and mobile broadband affordability (also up 8 percent). However, many nations still need to make gains in each of these areas.
Potential rose by 3 percent, mostly because of the impact of broadband on the digital economy and an 8-percent increase in patent applications.
G C I 2 0 1 6 : H O W D I D Y O U D O ?
Improvements over GCI 2015 in SDEP

27
When unsupported by analytics solutions, IoT has limited value because the data generated and captured by IoT computing is not converted into actionable information.
G C I 2 0 1 6 : H O W D I D Y O U D O ?
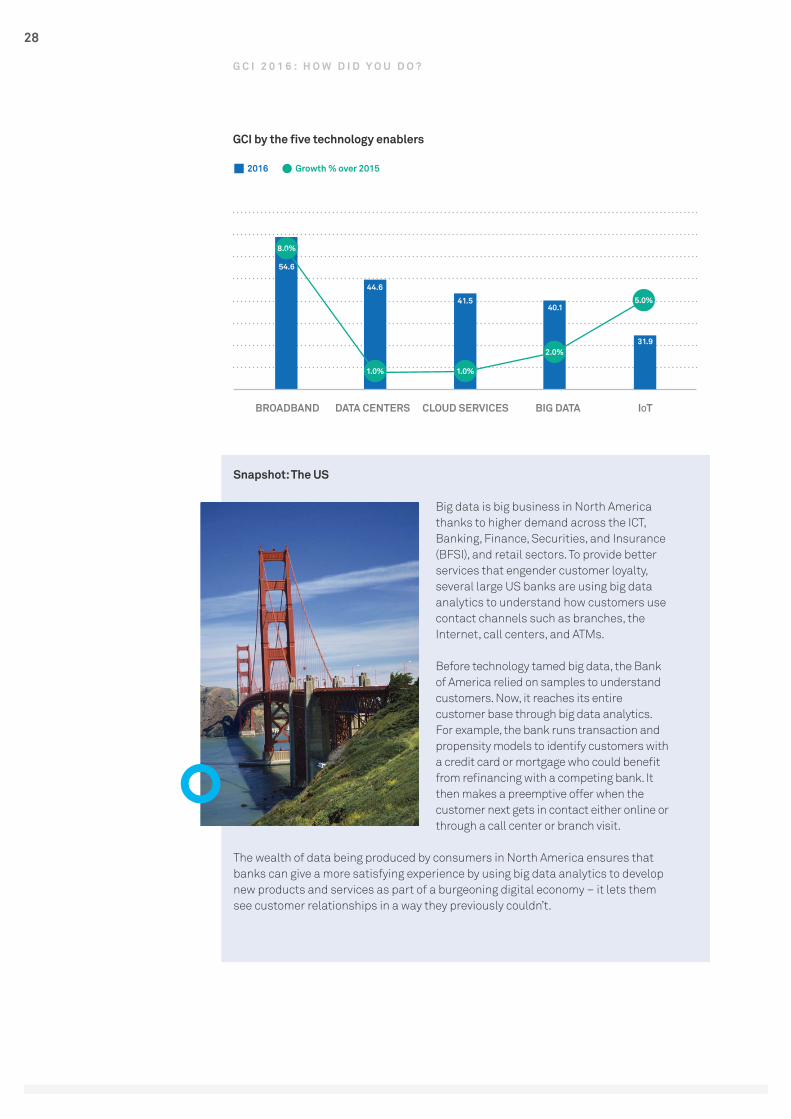
The results for GCI 2016 show that nations are continuing to improve broadband performance, with broadband showing the largest increase of the five technology enablers at 8 percent, largely due to the rise of mobile broadband.
IoT is next with a 5 percent increase, followed by big data at 2 percent. DCs and cloud services bring up the rear at 1 percent.
The broadband and IoT technology horizontals have improved the most,
indicating a focus on high-speed broadband coverage and quality coupled with IoT computing platforms that can exploit the greater ubiquity of computing resources.
However, nations can only experience the full benefit of a digital economy if they improve their performance in big data analytics and cloud services.
When unsupported by analytics solutions, IoT has limited value because the data generated and captured by IoT computing devices is not converted into actionable information, and therefore doesn’t create innovation possibilities or new value.
What the results tell us
6.3%
4.0%
7.4%
5.0%
GCI by SDEP
SUPPLY DEMAND EXPERIENCE OVERALLPOTENTIAL
2016 Growth % over 2015
3.0%
35.4
39.4
51.6
55.5
45.5
28
G C I 2 0 1 6 : H O W D I D Y O U D O ?
Snapshot: The US
Big data is big business in North America thanks to higher demand across the ICT, Banking, Finance, Securities, and Insurance (BFSI), and retail sectors. To provide better services that engender customer loyalty, several large US banks are using big data analytics to understand how customers use contact channels such as branches, the Internet, call centers, and ATMs.
Before technology tamed big data, the Bank of America relied on samples to understand customers. Now, it reaches its entire customer base through big data analytics. For example, the bank runs transaction and propensity models to identify customers with a credit card or mortgage who could benefit from refinancing with a competing bank. It then makes a preemptive offer when the customer next gets in contact either online or through a call center or branch visit.
The wealth of data being produced by consumers in North America ensures that banks can give a more satisfying experience by using big data analytics to develop new products and services as part of a burgeoning digital economy – it lets them see customer relationships in a way they previously couldn’t.
8.0%
GCI by the five technology enablers
BROADBAND DATA CENTERS CLOUD SERVICES IOTBIG DATA
2016 Growth % over 2015
2.0%
54.6
44.6
41.540.1
31.9
1.0%
5.0%
1.0%
G C I 2 0 1 6 :
H O W D O Y O U S T A C K U P ?
Lorem ipsum dolor sit ametdelirium epitamesa laten
G C I 2 0 1 6 :
D R A M A T I C C H A N G E S F O R S O M E
C O U N T R I E S
Each nation needs to benchmark its progress to ensure growth is fast enough,
because slow growth or staying at the same level means falling behind in real
terms.
30
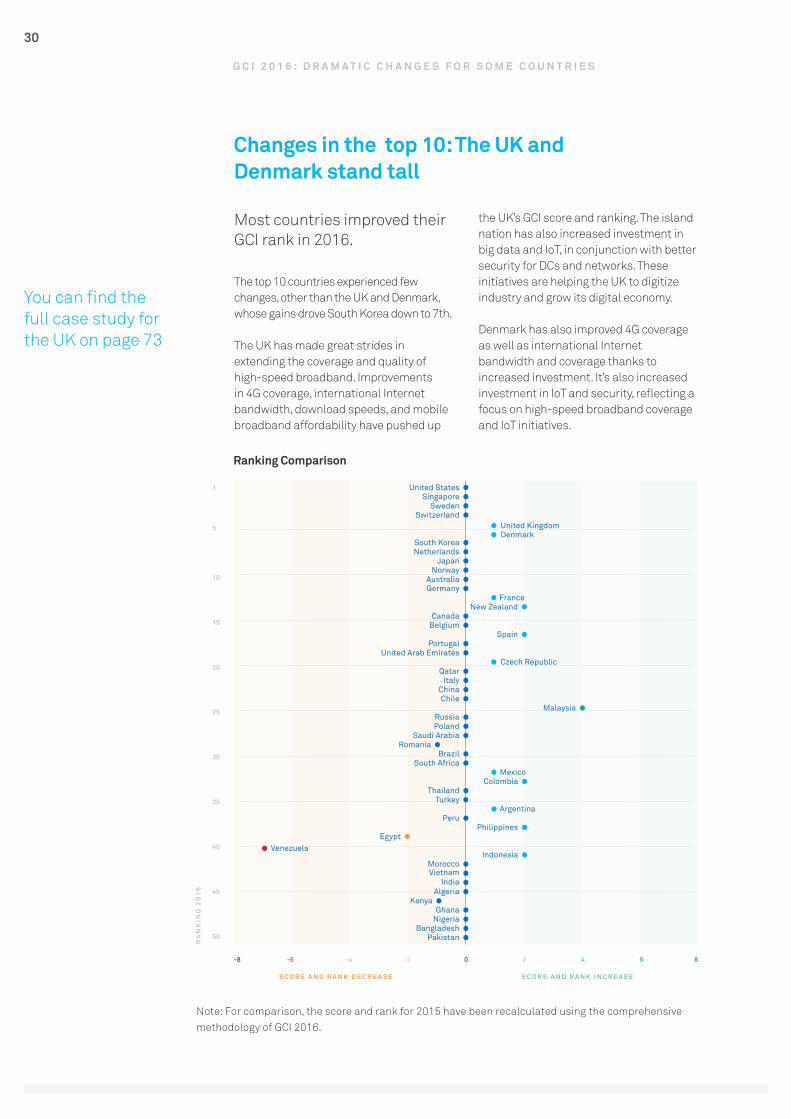
Most countries improved theirGCI rank in 2016.
The top 10 countries experienced few changes, other than the UK and Denmark, whose gains drove South Korea down to 7th.
The UK has made great strides in extending the coverage and quality of high-speed broadband. Improvements in 4G coverage, international Internet bandwidth, download speeds, and mobile broadband affordability have pushed up
the UK’s GCI score and ranking. The island nation has also increased investment in big data and IoT, in conjunction with better security for DCs and networks. These initiatives are helping the UK to digitize industry and grow its digital economy.
Denmark has also improved 4G coverage as well as international Internet bandwidth and coverage thanks to increased investment. It’s also increased investment in IoT and security, reflecting a focus on high-speed broadband coverage and IoT initiatives.
Ranking Comparison
G C I 2 0 1 6 : D R A M A T I C C H A N G E S F O R S O M E C O U N T R I E S
Changes in the top 10: The UK and Denmark stand tall
You can find the full case study for the UK on page 73
RA
NK
ING
20
16
S C O R E A N D R A N K D E C R E A S E
-8 -6 -2 2 6-4 0 4 8
50
10
15
20
25
30
35
40
45
1
5
Pakistan
Thailand
Portugal
Morocco
Russia
Norway
Kenya
Brazil
New Zealand
Philippines
Italy
Denmark
Nigeria
Mexico
Belgium
Venezuela
Chile
Netherlands
Vietnam
Saudi Arabia
Germany
Argentina
Czech Republic
Switzerland
Singapore
Bangladesh
Colombia
Spain
Indonesia
Malaysia
Japan
Algeria
Romania
France
Peru
Qatar
United Kingdom
Ghana
South Africa
Canada
Egypt
China
South Korea
India
Poland
Australia
Turkey
United Arab Emirates
Sweden
United States
S C O R E A N D R A N K I N C R E A S E
Note: For comparison, the score and rank for 2015 have been recalculated using the comprehensive methodology of GCI 2016.
31
Without a solid foundation of high-speed broadband, it’s hard to adopt other technology enablers like cloud services, big data, and IoT.
A total of 12 countries have improved their positions.
A total of 12 countries have improved their positions.
Notably, Malaysia has moved up four places, and Indonesia, Philippines, Colombia, Spain, and New Zealand have all moved up two.
Malaysia is comparatively advanced in Southeast Asia in terms of ICT adoption, usage, and investment, increasing both its capabilities and competitiveness. It stepped up ICT investment last year to improve 4G coverage as well as mobile broadband coverage and affordability. These measures have maximized the benefits of increased smartphone use by its already well-connected population. Malaysia has also invested more in cloud services and DCs in a push for industry digitization and full economic digitization by 2020. Despite existing challenges with infrastructure and broadband, Malaysia provides an example of digital economic transformation on a relatively traditional economy that’s reliant on oil, agriculture, and manufacturing.
Indonesia may rank in the bottom third of the GCI list, but its overall position has jumped. This is mainly because the Indonesian government is serious about using ICT to improve society by applying mobile solutions that increase uptake by
residents and organizations. Mobile broadband use has grown thanks to a rise in the number of telcos, which has improved affordability across the nation. Equally, cheaper handsets and tariffs are increasing smartphone use. The government wants more small-to-medium enterprises (SMEs) to adopt cloud computing and use ICT to transform business or, at the very least, develop e-commerce. Indonesia is now positioned for strong GDP growth over the next few years.
Of the high-GCI economies, New Zealand enjoyed the biggest jump in rank. Like the UK and Denmark, New Zealand has ramped up ICT investment to focus on affordable high-speed broadband coverage on 4G. The government also plans to deploy IoT in the tourism and agriculture sectors.
The UK, Denmark, France, Czech Republic, Mexico, and Argentina all moved up one place on the GCI list. Argentina is focusing on expanding high-speed broadband coverage based on mobile broadband and 4G. It has also made broadband more affordable, resulting in higher Internet penetration in homes and smartphone adoption. Combined, these trends have driven up demand for computing tech, prompting a positive shift towards economic digitization.
Venezuela dropped seven places, Egypt two, and Kenya and Romania one place each. All have fallen behind in fixed and mobile broadband coverage and affordability. Venezuela is experiencing an economic crisis, with drastic spending and investment cuts caused by declining oil prices and political unrest. Similarly, conflict has plunged Egypt into a recession, slashing the nation’s revenues from oil and tourism. Kenya and Romania haven’t invested as much as their peers in expanding communications networks, which in turn has negatively affected demand.
Without a solid foundation of high-speed broadband, it’s hard to adopt other technology enablers like cloud services, big data, and IoT.
Every nation is doing its best to outpace others by developing ICT capabilities in the five technology enablers and thus boost competitiveness, productivity, and GDP growth. Each nation needs to benchmark its progress to ensure growth is fast enough, because slow growth or staying at the same level means falling behind in real terms.
G C I 2 0 1 6 : D R A M A T I C C H A N G E S F O R S O M E C O U N T R I E S
Meet the upwardly mobile
A downward turn for some
You can find the full case study for Malaysia on page 68
32
T E C H N O L O G Y I N N O V A T I O N T R E N D S
Building a strong digitalinfrastructure is the first step to
realizing effective transformation.
FoundationInnovation
InternetInnovation
DataInnovation
AugmentedInnovation
33
Starters are not fully benefiting from the digital economy and its potential to raise incomes and overall qualityof life.
For the Starter GCI cluster, breadth of coverage tends to be more of a priority than depth and advanced supplementary technologies, making for rising broadband scores while the other four technology enablers remain flat. Demand has increased the most in these countries, thanks to the broadening of Internet access at home and on the go.
Internet use rates in the Starter cluster have grown the fastest among the GCI-rated countries due to their modest starting points. However, technology progress is weak. Broadband and data center figures are still relatively low, leaving Starters’ economies unprepared for cloud services, big data, or IoT.
Features of Foundation Innovation
Nations in this stage rely on analog factors of value addition like labor and commodities. Innovation is sporadic and uncoordinated, and ICT infrastructure is too weak to significantly impact GDP. Such nations sit at the bottom of the GCI 2016 rankings. Examples include Ghana and Bangladesh.
Starters show the following characteristics:
• ICT investment is less than 2 percent of GDP.
• 4G coverage is under 10 percent.• International bandwidth is less than
100 Kbps, and download speeds don’t reach 10 Mbps.
• Investment in DCs is less than 0.05 percent of GDP, and investment in cloud services is negligible at less than 1 percent of total IT investment.
• Investment in national big data and IoT initiatives is low.
These nations have undeveloped digital economies:
• E-commerce is low at US$5,000 per capita per year.
• About 40 percent of the population uses the Internet.
• Patents per million capita are fewer than 1.
• Less than 1 percent of the population works in IT.
Starters are not fully benefiting from the digital economy and its potential to raise incomes and overall quality of life. Policy makers need to ensure ICT maturity enters the second stage, Internet Innovation, so e-commerce can create economic growth. Faster broadband expansion is necessary to increase supply scores so that most businesses and citizens have affordable broadband access.
To become Adopters, it’s advisable for Starters to:
• Increase ICT investment as a percentage of GDP to accelerate nationwide broadband coverage.
• Reduce tariffs and provide subsidies for smartphones to get more smart devices into homes.
• Issue more telecom licenses to raise coverage and encourage competitive pricing.
• Encourage third-party providers to invest in DCs to meet the computing needs of the whole population.
• Start planning for high-speed broadband with 4G and FTTH rollout.
T E C H N O L O G Y I N N O V A T I O N T R E N D S
Starters in the Foundation Innovation stage
You can find the full case study on Indonesia, which is in the Foundation Innovation stage, on page 65.
34
These countries are seeing the largest GDP gains from ICT investment, which is best oriented around higher-speed broadband networks that can enable cloud services and big data.
Nations in the second cluster have made good progress in building infrastructure for broadband and DCs, and are now shifting focus on boosting the adoption and quality of broadband. With ICT plans in place and improved demand and experience ratings, people are ready to adopt digital tech, and the national potential for economic digitization is high.
Of the three clusters, 4G coverage is growing fastest for Adopters, with wider international Internet bandwidth and FTTH coverage starting to increase the demand for broadband and better experience.
Adopters also enjoy the fastest growth in ICT investment – they’re ready to use cloud services as a pivotal technology for boosting big data and IoT.
Features of Internet Innovation
For many nations in this stage, Internet speeds are still too low for more than basic interaction like e-commerce. Value is added through broader online access to goods and services, with innovation driven by the online extension of brick and mortar services. These countries are seeing the largest GDP gains from ICT investment, which is best oriented around higher-speed broadband networks that can enable cloud services and big data, improve productivity, raise the potential for gains, and use digital technologies to develop new markets and ways of working. Examples include China and Malaysia.
Adopters have the following characteristics:
• ICT investment is below 4 percent of GDP.
• 4G coverage is less than 35 percent.• International bandwidth is less than
300 Kbps, and download speeds are below 50 Mbps.
• Investment in DCs is under 0.1 percent of GDP, with cloud services making up less than 3 percent of IT investment.
• National investment in big data and IoT is low, but it’s growing.
Their digital economies are evolving, and economic activity is creating GDP benefits.
• E-commerce is double that of Starters, reaching US$11,000 per capita per year.
• Less than 70 percent of the population uses the Internet.
• Patents per million capita range from between 1 and 15.
• Less than 3 percent of the population works in IT.
Adopters can move up the GCI curve if they:
• Continue investing in improving high-speed broadband coverage via wider 4G and FTTH coverage.
• Invest more in DC capacity, whether in-house or third party, so that nobody misses out on ICT.
• Launch initiatives for inspiring enterprises, governments, and consumers to adopt cloud services.
• Encourage SMEs to use cloud software (SaaS) to run more business services, thus lowering the costs of doing business.
• Encourage technology startups to use Platform as a Service (PaaS) for solution deployment, thus lowering the barriers to innovation.
• Improve high-speed broadband experience by increasing bandwidth and download speeds.
T E C H N O L O G Y I N N O V A T I O N T R E N D S
Adopters in the Internet Innovation stage
China is a prime example of an Internet Innovator. You can find the full case study on page 59.
35
Frontrunners use data to generate value and improve user experience, with an eye on multiplying these benefits via big data.
However, despite their advanced state, many of these nations’ economies are stagnant.
The Frontrunner cluster comprises the most advanced nations, with GCI scores topping 55. They tend to focus on improving all five technology enablers, especially broadband supply and its adoption rate. They’re looking at next-gen networks like 5G and beyond to support big data and IoT initiatives.
4G LTE coverage is widening, along with international Internet bandwidth and DCs. Demand scores are up due to the increased uptake of mobile broadband and smartphones, faster download speeds, and better experience with big data and IoT. This group has seen the fastest growth in both big data and IoT scores.
Telecom networks – both high-speed broadband and DC – are relatively mature, but they still have some way to go to improve the other three IT enablers of digital transformation.
Features of Data Innovation
These nations represent current GCI leadership. High-speed broadband, DC networks, and cloud services are now common. Value is added through differentiation, customization, and personalization, often based on the analysis of data. But big data and IoT remain immature. This reduces the GDP gains of ICT investment somewhat, and leaves innovation driven by the human ability to connect the dots of a sporadic data picture. Big data and IoT are needed for further productivity gains under a more reliable innovation mechanism. Examples include the UK and Singapore.
The characteristics of Frontrunners are as follows:
• ICT investment is up to 8 percent of GDP, double that of Adopters.
• 4G coverage is as high as 85 percent.• International bandwidth can reach 1
Mbps, and download speeds can hit 150 Mbps.
• Investment in DCs is up to 0.3 percent of GDP, with up to 10 percent of IT budgets going to cloud services.
• Investment in big data can reach 5 percent of IT spending.
• The average person has seven IoT-enabled devices.
These countries have moved past traditional industries and have the most advanced digital economies.
• E-commerce is more than triple that of Adopters, at US$35,000 per capita per year.
• Almost everyone uses the Internet.• Patents per million capita are
approaching 150.• Up to 5 percent of the population works
in IT.
Frontrunners use data to generate value and improve user experience, with an eye on multiplying these benefits via big data. Compared with Adopters, Frontrunners have higher GDP per capita, but a lower GCI-GDP multiplier.
However, despite their advanced state, many of these nations’ economies are stagnant. GDP growth can be stimulated for Frontrunners if they:
• Quickly embrace ultra-fast next-gen networks with low latency to kick-start a variety of growth sectors such as self-driving vehicles, cloud AI, robotics, and immersive realities.
• Improve the quality of DC networks to support cloud services, big data, and IoT solutions; boost network security; and lower latency.
• Develop robust data policies that offer anonymity and increase availability for data sharing and trading, thus enriching the value of the big data experience.
• Adopt big data as a critical part of ICT planning so that government and business become leaders in using analytics and driving innovation.
• Investing in IoT initiatives that put IoT on the national agenda for industry.
T E C H N O L O G Y I N N O V A T I O N T R E N D S
Frontrunners in the Data Innovation stage
You can find the full case study on USA, a leading Data Innovator, on page 76
36
T H E F U T U R E
A U G M E N T E D I N N O V A T I O N
Cloud AI will utilize big data analytics to achieve a scale of innovation never before
possible, one that transcends physical barriers and the limitations of the
human mind.
Augmented Innovation
37
We estimate that the first Augmented Innovators will arrive at around 2020. At that time, big data analytics will be common and ubiquitous; it will be embedded into IoT systems and used to empower machine-assisted innovation in the form of virtual assistants, advanced robotics, or some other means not yet thought of.
Even today, technology’s power isn’t always harnessed to create new ways of innovating and working with new business models. In many countries, ICT is still simply a tool for making business more efficient under traditional models.
The next stage: Augmented Innovation
Most advanced economies today are Frontrunners, and most are experiencing declining GDP growth against ICT investment. However, there’s a fourth stage on the horizon that promises a new gold rush. Powered by the other four technology enablers, cloud AI will utilize big data analytics to achieve a scale of innovation never before possible, one that transcends physical barriers and the limitations of the human mind. We call this Augmented Innovation.
Innovation will still be based on data analysis, but it will be accelerated by data sets complete enough for machines to start contributing insights. This will create a veritable big bang of growth in innovation and productivity.
We estimate that the first Augmented Innovators will arrive at around 2020. At that time, big data analytics will be common and ubiquitous; it will be embedded into IoT systems and used to empower machine-assisted innovation in the form of virtual assistants, advanced robotics, or some other means not yet thought of.
While many forms of innovation might already qualify as machine-assisted, the difference is that conventional forms of innovation use machines in the process. With Augmented Innovation, machines will contribute to the process of innovation, thus expanding its scale and reducing its barriers in a variety of ways:
• Processing information too complex for human attentions spans, and distilling it into insights that humans can perceive and use.
• Tackling problems too tedious, repetitive, time-consuming, complicated or otherwise onerous for humans to solve.
• Providing accurate modeling, simulation, and predictions through the IoT-enabled consideration of all possible factors.
• Enabling more intuitive interaction, so that innovation can be carried out by people with physical disabilities or people without specialized skills – innovation will no longer be for geeks and coders, it will be for everyone.
In practical terms, Augmented Innovators will have the following characteristics:
• ICT investment exceeds 8 percent of GDP, and IoT has made many everyday products smart.
• 4G coverage is 100 percent, and more than half the population has 5G.
• International bandwidth is at least 1 Mbps, and average download speeds are at least 150 Mbps.
• Investment in DCs is up to 1 percent of GDP, and over 10 percent of IT budgets are spent on cloud services.
• Investment in big data analytics is more than 5 percent of IT spending.
• The average person has 12 IoT-enabled devices.
Augmented Innovators’ digital economies are likely to have the following features:
• E-commerce is more than US$35,000 per capita per year.
• 100 percent of the population uses high-speed Internet.
• Patents per million capita have exceeded150.
• At least 5 percent of the population works in IT.
Frontrunners can move into the Augmented Innovation stage if they:
• Accelerate the adoption of cloud services in all verticals to build a cloud platform for ubiquitous computing.
• Promote wider IoT investment and deployment by governments, SMEs, and large enterprises.
• Develop industry ecosystems that enable cross-industry collaboration to produce new IoT ideas, products, and services that change how society runs and does things.
• Ensure that broadband and DC quality can support cloud and big data services to encourage Io T adoption.
T H E F U T U R E : A U G M E N T E D I N N O V A T I O N
38
R E A L I Z I N G E C O N O M I C T R A N S F O R M A T I O N
W I T H T H E F I V E T E C H E N A B L E R S
To build a Better Connected World, nations need to look past broadband
and the Internet, and shift up the gears to reach the next level of technology
investment and application.
39
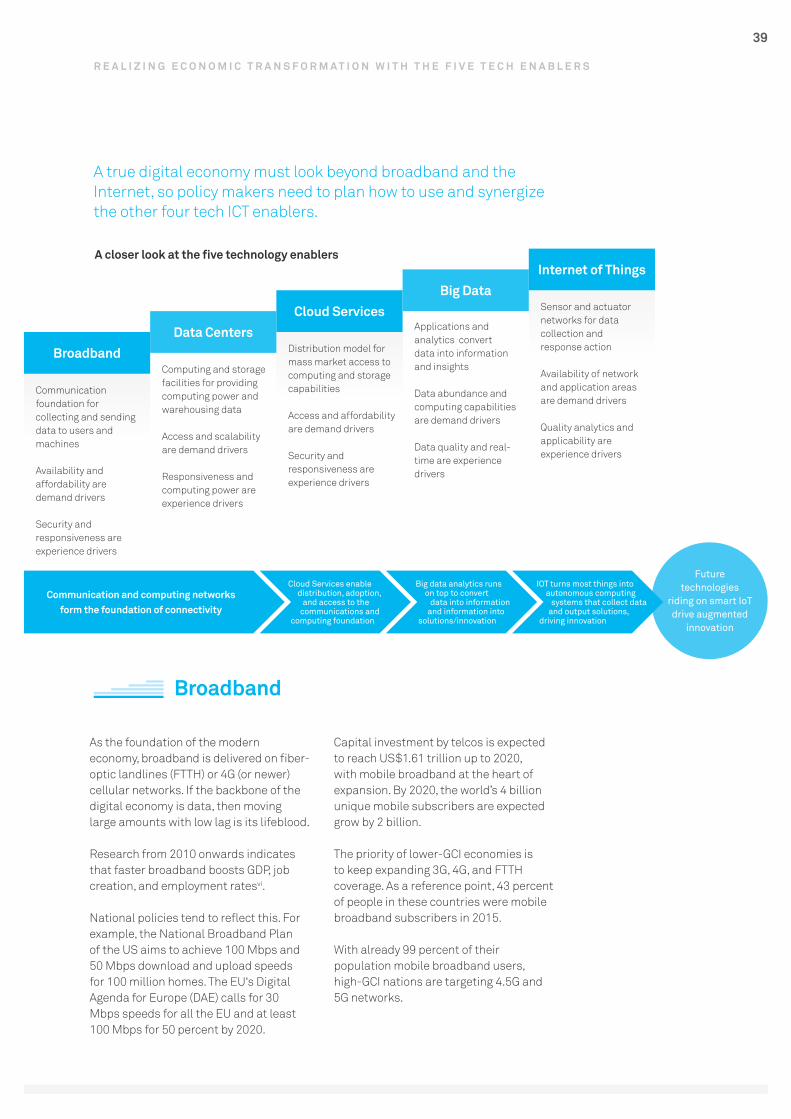
A true digital economy must look beyond broadband and the Internet, so policy makers need to plan how to use and synergize the other four tech ICT enablers.
Broadband
As the foundation of the modern economy, broadband is delivered on fiber-optic landlines (FTTH) or 4G (or newer) cellular networks. If the backbone of the digital economy is data, then moving large amounts with low lag is its lifeblood.
Research from 2010 onwards indicates that faster broadband boosts GDP, job creation, and employment ratesvi.
National policies tend to reflect this. For example, the National Broadband Plan of the US aims to achieve 100 Mbps and 50 Mbps download and upload speeds for 100 million homes. The EU‘s Digital Agenda for Europe (DAE) calls for 30 Mbps speeds for all the EU and at least 100 Mbps for 50 percent by 2020.
Capital investment by telcos is expected to reach US$1.61 trillion up to 2020, with mobile broadband at the heart of expansion. By 2020, the world’s 4 billion unique mobile subscribers are expected grow by 2 billion.
The priority of lower-GCI economies is to keep expanding 3G, 4G, and FTTH coverage. As a reference point, 43 percent of people in these countries were mobile broadband subscribers in 2015.
With already 99 percent of their population mobile broadband users, high-GCI nations are targeting 4.5G and 5G networks.
R E A L I Z I N G E C O N O M I C T R A N S F O R M A T I O N W I T H T H E F I V E T E C H E N A B L E R S
Future technologies
riding on smart IoT drive augmented
innovation
A closer look at the five technology enablers
Communication foundation forcollecting and sending data to users and machines
Availability and affordability aredemand drivers
Security and responsiveness are experience drivers
Computing and storage facilities for providing computing power and warehousing data
Access and scalabilityare demand drivers
Responsiveness and computing power are experience drivers
Distribution model for mass market access to computing and storage capabilities
Access and affordability are demand drivers
Security and responsiveness are experience drivers
Applications and analytics convertdata into information and insights
Data abundance and computing capabilitiesare demand drivers
Data quality and real-time are experience drivers
Sensor and actuator networks for data collection andresponse action
Availability of networkand application areasare demand drivers
Quality analytics and applicability areexperience drivers
BroadbandData Centers
Cloud ServicesBig Data
Internet of Things
Communication and computing networks form the foundation of connectivity
Cloud Services enable distribution, adoption,
and access to the communications and
computing foundation
Big data analytics runs on top to convert
data into information and information into
solutions/innovation
IOT turns most things into autonomous computing
systems that collect dataand output solutions,
driving innovation
40
While the percentage of households with Internet access is high, many are still dependent on slow copper cables, with few households benefiting from fiber access.
Although this may be good enough for efficiency and productivity in areas like trade because it makes e-commerce possible, high-speed broadband is necessary to transform business models and processes. This results in innovative products and services under new delivery models where services as well as goods are traded. High-speed broadband is necessary for services to be delivered remotely, including maintenance, public safety, health services, security, HD entertainment, and virtual reality.
Snapshot: China
In mid-2015, the Chinese government unveiled Internet Plus, its plan for boosting growth by infusing mobile Internet, cloud computing, big data, and IoT into manufacturing.
Internet Plus aims to develop e-commerce, industry networks, and online banking, and raise the profile of Internet companies on the world stage. Strong broadband networks have made Internet Plus possible, serving as its backbone. A key part of the initiative is to expand e-commerce in the countryside to around 600 million people, which is expected to ramp up e-commerce growth in the country. In 2014, Alibaba reported that e-commerce companies had already created 280,000 jobs in rural areas, and will generate around 649 million yuan in turnover over the next few yearsix.
No longer just a place for hosting IT equipment, DC networks form a key part
of the infrastructure for enabling digital transformation and satisfying parallel demands on speed, efficiency, and processing power.
With fewer computing devices on the network edge (the user access point), computing and storage requirements are shifting to the core, that is, to DCs.
Big data and IoT are creating huge amounts of data that needs to be stored, processed, and analyzed to produce actionable information. The edge cannot function without the core, and thus the core needs to be an impenetrable fortress – nations must invest in fully secure, reliable, and efficient DCs to digitize their economies.
Referring to Hong Kong’s Tier IV-ready Financial Data Center, the city’s secretary for innovation and technology, Nicholas Yang, made the following statement on the importance of DCs: “Data centers are part of the key infrastructure for a knowledge-based economy, and play a pivotal role in the development of our information and communications technology sector.”x
Hong Kong’s strategy on DCs aims to meet the needs of data-centric companies, transform the banking sector, develop new industries and applications to boost the economy; tie in with China’s One Belt, One Road development initiative to drive trade with Asia and Europe, and accelerate digital transformation.
To meet requirements for cloud services, big data, and IoT, the capacity of DCs worldwide is expected to grow from 480 million square meters at present to almost 600 million square meters by 2020.
Aware of these trends, DC owners have sought to improve their efficiency, with DC infrastructure management generating US$500 million in revenue in 2015.
R E A L I Z I N G E C O N O M I C T R A N S F O R M A T I O N W I T H T H E F I V E T E C H E N A B L E R S
Data Centers (DC)

41
The cloud is vital to the digital economy, because it forms the platform for nations – and for people and SMEs who can’t build their own DCs – to access powerful computing and scalable storage capabilities.
Digital transformation requires businesses and governments to find a scalable infrastructure that they can roll out quickly and scale up affordably.
This will enable quick product and service time-to-market, and allow for the trial-and-error approach that’s so necessary for innovation. Cloud services are fast becoming a mainstream model for building and deploying IT systems. The cloud is vital to the digital economy, because it forms the platform for nations – and for people and SMEs who can’t build their own DCs – to access powerful computing and scalable storage capabilities. Cloud services allow SMEs and startups to adopt big data and IoT solutions to develop new products, services, and business processes.
The industrial cloud platform and community participation has the potential to scale digital supply and distribution chains 1,000-fold. By 2018, the IT analyst IDC predicts that more than 50 percent of large enterprises – and more than 80 percent of enterprises with advanced digital strategies – will create or use industrial cloud platforms to scale up their digital supply and distribution networksxi.
Snapshot: India
In India, small and medium cooperative banks are using cloud computing to deploy core banking solutions to improve efficiency and profitability.
There are more than 200 such cooperatives with 7,000 branches that have been set up by and serve rural communities.
Most are at best partially computerized, and they can’t afford a core banking solution. In response, the National Bank for Agriculture and Rural Development (NABARD) set up a cloud platform with a built-in banking solution. It runs on a pay-per-use basis coupled with an affordable monthly subscription fee.
NABARD also gave the smallest banks that can’t afford their own solutions access to basic banking facilities such as Any Branch Banking, National Electronic Funds Transfer, real-time gross settlement systems, mobile services, and ATMs. According to Subrata Gupta, Chief General Manager of NABARD, “By adopting the CBS platform, the co-operative banks have made huge cost savings, and as a result, the banks will now have more time and money for finding business in rural areas and attracting new customers.”
Globally, public cloud services brought in around US$70 billion in 2015, which is expected to grow by 20 percent a year to US$150 billion by 2019.
R E A L I Z I N G E C O N O M I C T R A N S F O R M A T I O N W I T H T H E F I V E T E C H E N A B L E R S
Cloud Services
42
R E A L I Z I N G E C O N O M I C T R A N S F O R M A T I O N W I T H T H E F I V E T E C H E N A B L E R S
Data is the backbone of the digital economy. Digital transformation will exponentially increase the data generated that needs to be processed into information for decision making.
Big data enables digital transformation by keeping enterprises globally competitive – they can make informed decisions that minimize costs and maximize returns. Without big data analytics, economic digitization is next to impossible. The insight it provides unlocks value for digital customers, channels, and markets, and it’s becoming increasingly necessary for digital enterprises to run their businesses.
As an IT enabler, big data analytics lets nations convert data into information they can use to create new products and services that contribute to socioeconomic development.
Today’s consumers generate increasing volumes of data that requires analytics to give it value. To attract and retain customers, businesses need analytics to provide personalized services that deliver the best quality at the best price.
For digital transformation to take hold, ICT can create new work processes and new products and services. As more companies operate within an ecosystem, they typically become part of one or many digital ecosystems that multiply the amount of data processed, exchanged, and conveyed, and which is available to generate returns. This data needs to be continuously analyzed so
services can be improved and remain competitive. Otherwise, it will swamp both consumers and businesses in a raw data flood.
Estimates hold that by 2020, the global market for big data, its analytics, and its technology will be worth US$200 billion. Organizations that can analyze data and act on the resulting information will be rewarded with an extra US$430 billion in productivity gains over their less analytically inclined peers.
Snapshot: Thailand
Thailand needs to improve the way it tracks and manages energy distribution across key urban areas following increases in population and industry activity.
Power requirements are impossible to predict in different urban and industrial sectors, causing power waste and brownouts. Thailand’s Provincial Electricity Authority (PEA) ran a smart grid pilot in key districts in Chonburi province to track electricity use and predict demand surges at different locations. The pilot is a proof-of-concept for PEA’s smart grid national blueprint, which it will implement in other provinces over time and in partnership with other electricity companies.
This smart grid pilot will generate energy usage and provisioning data, mainly from home users. Coupled with energy management and the software and hardware in PEA’s DC, big data technology will manage the grid to increase energy efficiency and cut pollution.
Users can then retrieve information and manage the electricity they use with smart meters that store their data in a cloud DC.
The long-term plan is to link this system with other areas.
Without analytics, improving processes and productivity or understanding markets and customers is impossible, which in turn erodes competitiveness.
Big Data
43
By 2025,Huawei predicts that the number of connected devices will reach 100 billion, which in turn will drive millions of new apps and solutions.
R E A L I Z I N G E C O N O M I C T R A N S F O R M A T I O N W I T H T H E F I V E T E C H E N A B L E R S
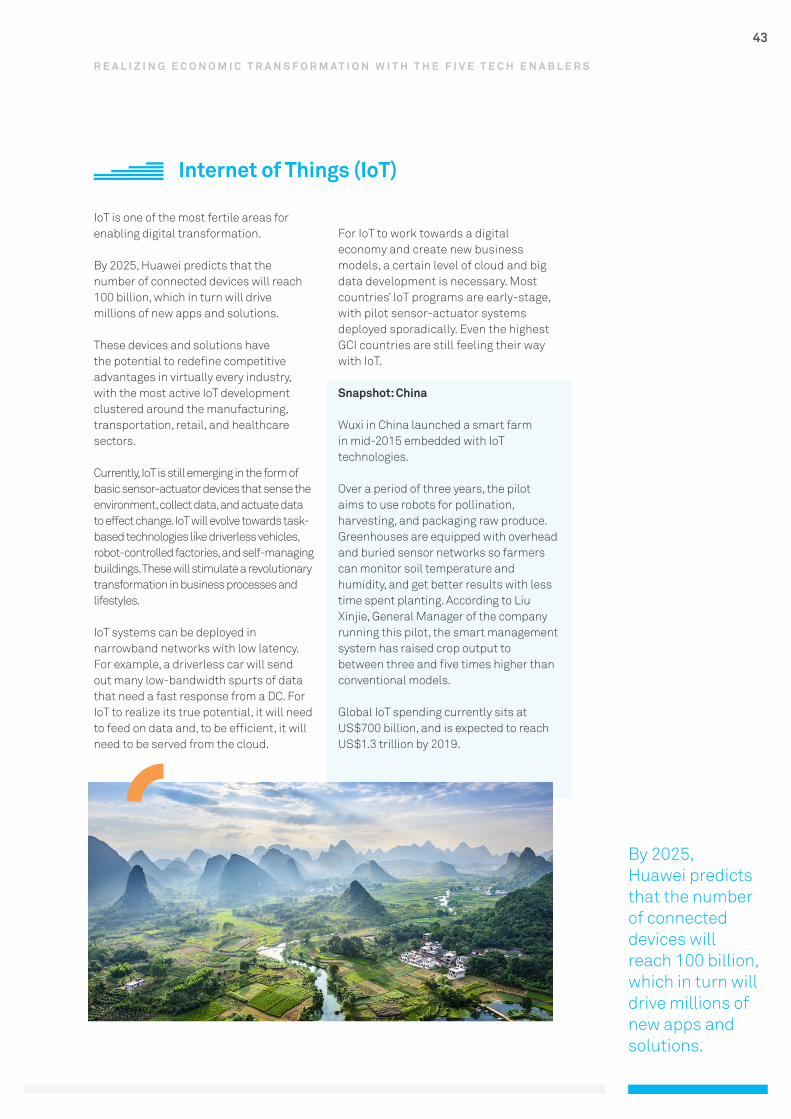
IoT is one of the most fertile areas for enabling digital transformation.
By 2025, Huawei predicts that the number of connected devices will reach 100 billion, which in turn will drive millions of new apps and solutions.
These devices and solutions have the potential to redefine competitive advantages in virtually every industry, with the most active IoT development clustered around the manufacturing, transportation, retail, and healthcare sectors.
Currently, IoT is still emerging in the form of basic sensor-actuator devices that sense the environment, collect data, and actuate data to effect change. IoT will evolve towards task-based technologies like driverless vehicles, robot-controlled factories, and self-managing buildings. These will stimulate a revolutionary transformation in business processes and lifestyles.
IoT systems can be deployed in narrowband networks with low latency. For example, a driverless car will send out many low-bandwidth spurts of data that need a fast response from a DC. For IoT to realize its true potential, it will need to feed on data and, to be efficient, it will need to be served from the cloud.
For IoT to work towards a digital economy and create new business models, a certain level of cloud and big data development is necessary. Most countries’ IoT programs are early-stage, with pilot sensor-actuator systems deployed sporadically. Even the highest GCI countries are still feeling their way with IoT.
Snapshot: China
Wuxi in China launched a smart farm in mid-2015 embedded with IoT technologies.
Over a period of three years, the pilot aims to use robots for pollination, harvesting, and packaging raw produce. Greenhouses are equipped with overhead and buried sensor networks so farmers can monitor soil temperature and humidity, and get better results with less time spent planting. According to Liu Xinjie, General Manager of the company running this pilot, the smart management system has raised crop output to between three and five times higher than conventional models.
Global IoT spending currently sits at US$700 billion, and is expected to reach US$1.3 trillion by 2019.
Internet of Things (IoT)
44
T H E F I V E T E C H E N A B L E R S I N A C T I O N :
S M A R T C I T I E S
Cities are the major incubatorsof ideas and economic growth.
45
Cities needhigh-speed mobile broadband to build networks that are fast and broad enough to support smart city solutions. This explains why governments are focusing investment on upgrading networks with high-speed broadband.
Unsurprisingly, digital transformation is concentrated in cities. They are the political centers where the transfer of products, services, and information largely happens, and they are also the major incubators of ideas and economic growth.
The report on digital infrastructurexii by the World Economic Forum (WEF) states that smart cities have the biggest socioeconomic impact and investment potential when it comes to applying digital technologies.
Due to the rapid and unplanned rise of urbanization, resource scarcity, and slow infrastructure expansion, many cities are overcrowded and lack basic services. According to the WEF, 50 percent of people were urban dwellers in 2007, which will rise to 60 percent by 2030xiii.
Governments know that they need to deploy smart city solutions in the following areas: transportation, public works, buildings, public administration, education, utilities, tourism, healthcare, and social services.
In Asia Pacific, governments have made 400 smart city declarations. Singapore has already begun its smart nation journey, with its minister for trade and industry, S. Iswaran, commenting, “Smart-city solutions, including…ICT technologies and embedding intelligent systems in buildings, transportation networks as well as utility grids, will play an increasingly important role in addressing these challenges.”
The challenges that smart city solutions need to overcome include poor infrastructure, bureaucratic complexity, and a lack of multi-agency coordination. But it‘s virtually impossible to just rip out and replace existing infrastructure because of the resulting unplanned urban buildout and cost of displacing property owners.
The five technology enablers are the foundation for developing smart city solutions and overcoming these challenges.
Cities need high-speed mobile broadband to build networks that are fast and broad enough to support smart city solutions. This explains why governments are focusing investment on upgrading networks with high-speed broadband.
Networks that connect ICT systems and devices need built-in capacity and security, because they will connect and collect data from sensors in IoT-connected devices and wearables, and transmit this data to the DC core, which will in turn collate, store, and analyze it. Decision makers can use the information generated for smart city management in real time, such as diverting traffic to avoid congestion.
Real-time responses require speedy data analytics at scale, which form complex prediction models that need high-powered computers that run big data analytics applications.
For smart city solutions to be easily scalable and affordable for people, enterprises, and government departments, computing and storage services need to be delivered through cloud services.
T H E F I V E T E C H E N A B L E R S I N A C T I O N : S M A R T C I T I E S
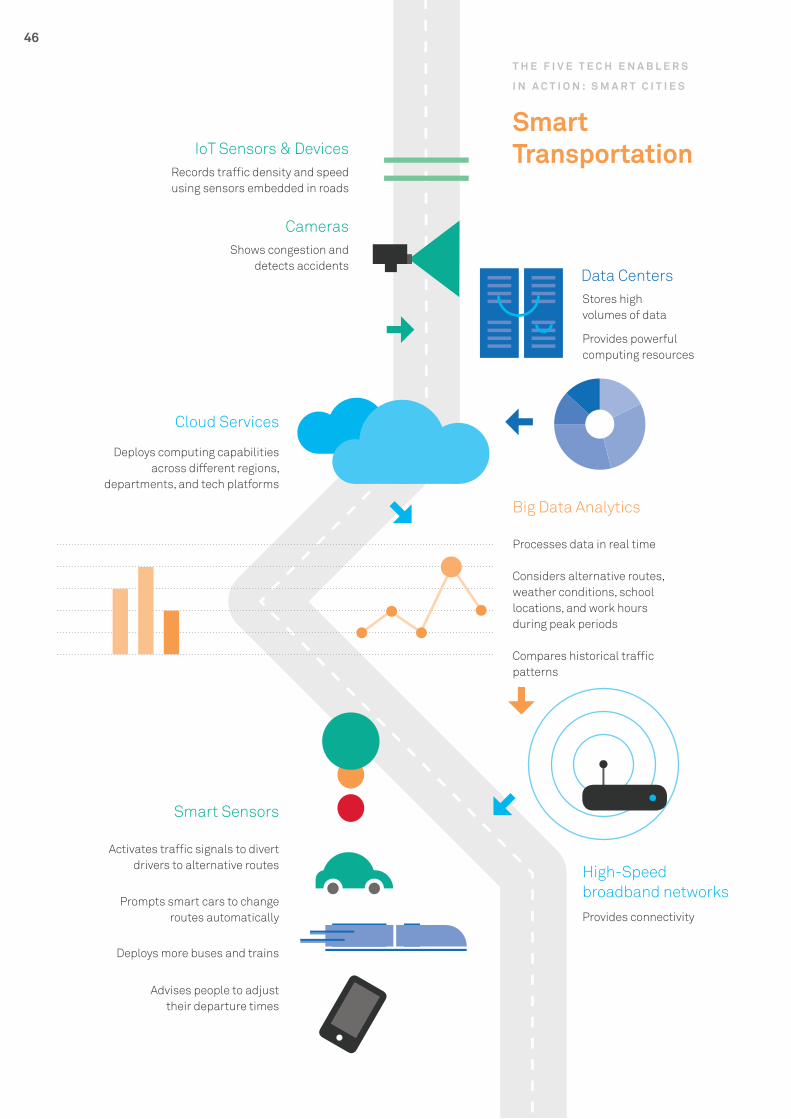
46
T H E F I V E T E C H E N A B L E R S
I N A C T I O N : S M A R T C I T I E S
Records traffic density and speed using sensors embedded in roads
IoT Sensors & Devices
Cameras
Cloud Services
Smart Sensors
Data Centers
Big Data Analytics
SmartTransportation
Shows congestion anddetects accidents
Stores highvolumes of data
Provides powerfulcomputing resources
Deploys computing capabilities across different regions,
departments, and tech platforms
Processes data in real time
Considers alternative routes, weather conditions, school locations, and work hoursduring peak periods
Compares historical traffic patterns
Activates traffic signals to divert drivers to alternative routes
Prompts smart cars to change routes automatically
Deploys more buses and trains
Advises people to adjusttheir departure times
High-Speedbroadband networksProvides connectivity

47
T H E F I V E T E C H E N A B L E R S
I N A C T I O N : S M A R T C I T I E S
D I G I T I Z I N G I N D U S T R Y T O
B U I L D A D I G I T A L E C O N O M Y
The transformation of any economy into a digital economy starts and ends
with the digital transformation of government, industry, and society.
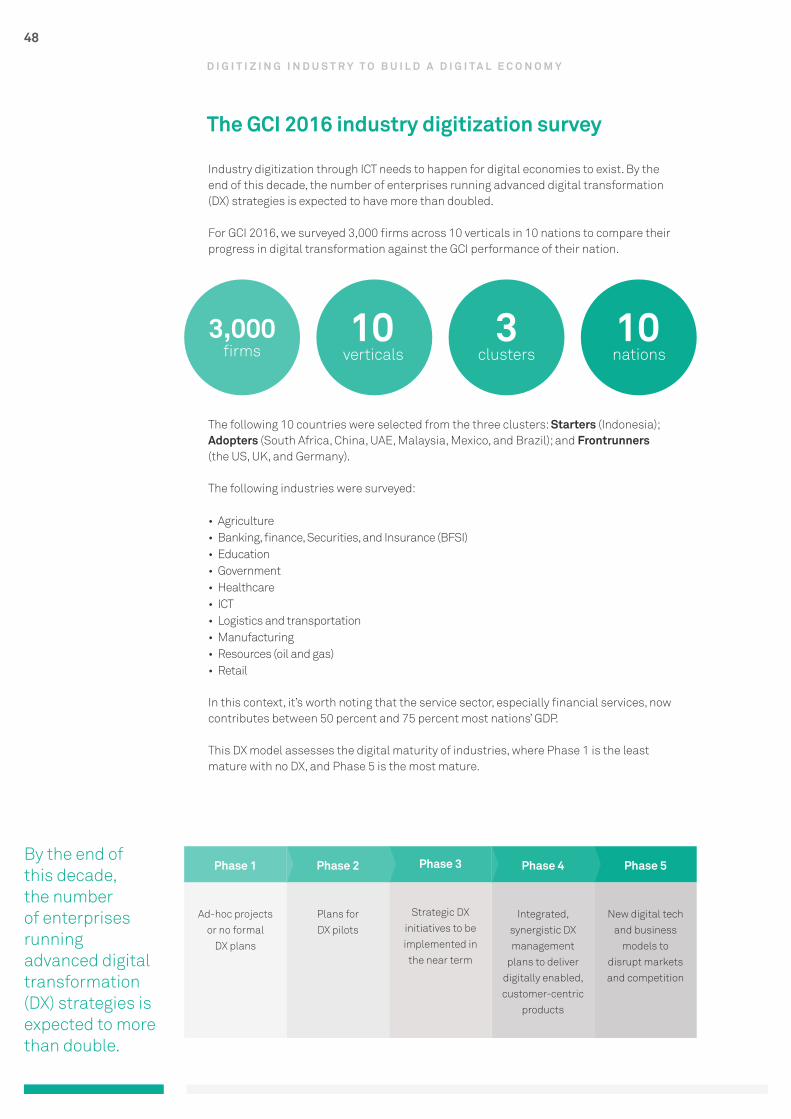
48
By the end of this decade, the number of enterprises running advanced digital transformation (DX) strategies is expected to more than double.
Industry digitization through ICT needs to happen for digital economies to exist. By the end of this decade, the number of enterprises running advanced digital transformation (DX) strategies is expected to have more than doubled.
For GCI 2016, we surveyed 3,000 firms across 10 verticals in 10 nations to compare their progress in digital transformation against the GCI performance of their nation.
The following 10 countries were selected from the three clusters: Starters (Indonesia); Adopters (South Africa, China, UAE, Malaysia, Mexico, and Brazil); and Frontrunners (the US, UK, and Germany).
The following industries were surveyed:
• Agriculture• Banking, finance, Securities, and Insurance (BFSI) • Education • Government • Healthcare• ICT • Logistics and transportation• Manufacturing• Resources (oil and gas) • Retail
In this context, it’s worth noting that the service sector, especially financial services, now contributes between 50 percent and 75 percent most nations’ GDP.
This DX model assesses the digital maturity of industries, where Phase 1 is the least mature with no DX, and Phase 5 is the most mature.
Phase 1
Ad-hoc projects or no formal
DX plans
Phase 2
Plans forDX pilots
Phase 3
Strategic DX initiatives to be implemented in
the near term
Phase 4
Integrated, synergistic DX management
plans to deliver digitally enabled, customer-centric
products
Phase 5
New digital tech and business
models to disrupt markets and competition
D I G I T I Z I N G I N D U S T R Y T O B U I L D A D I G I T A L E C O N O M Y
3,000firms
10 verticals
3clusters
10 nations
The GCI 2016 industry digitization survey
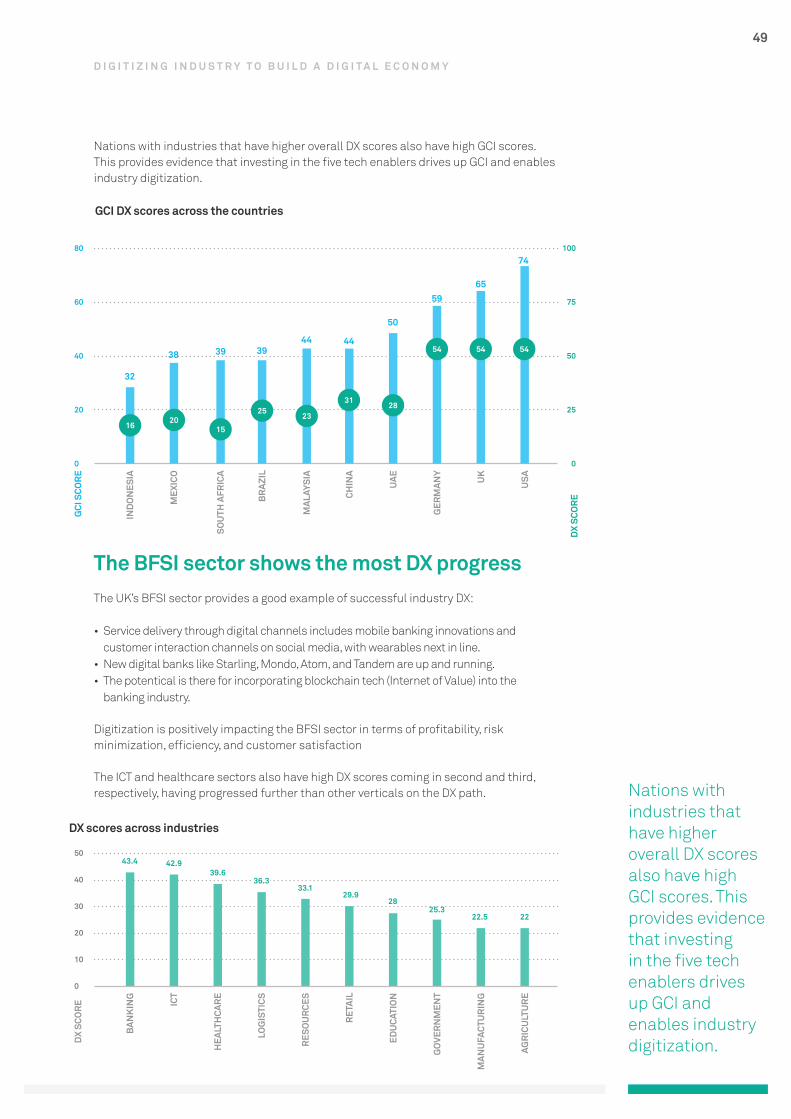
49
Nations with industries that have higher overall DX scores also have high GCI scores. This provides evidence that investing in the five tech enablers drives up GCI and enables industry digitization.
GCI DX scores across the countries
Nations with industries that have higher overall DX scores also have high GCI scores. This provides evidence that investing in the five tech enablers drives up GCI and enables industry digitization.
DX scores across industries
The BFSI sector shows the most DX progressThe UK’s BFSI sector provides a good example of successful industry DX:
• Service delivery through digital channels includes mobile banking innovations and customer interaction channels on social media, with wearables next in line.
• New digital banks like Starling, Mondo, Atom, and Tandem are up and running.• The potentical is there for incorporating blockchain tech (Internet of Value) into the
banking industry.
Digitization is positively impacting the BFSI sector in terms of profitability, risk minimization, efficiency, and customer satisfaction
The ICT and healthcare sectors also have high DX scores coming in second and third, respectively, having progressed further than other verticals on the DX path.
D I G I T I Z I N G I N D U S T R Y T O B U I L D A D I G I T A L E C O N O M Y
IND
ON
ESIA
BAN
KIN
G
GCI
SCO
RE
DX
SCO
RE
DX
SCO
RE
ICT
HEA
LTH
CAR
E
LOG
ISTI
CS
RES
OU
RCE
S
CHIN
AR
ETAI
L
UAE
EDU
CATI
ON
GER
MAN
YG
OVE
RN
MEN
T
UK
MAN
UFA
CTU
RIN
G
USA
AGR
ICU
LTU
RE
20
30
32
44
50
5965
25
0
0
0
60
40
75
40
20
10
50
80
50
100
16
MEX
ICO
38
20
MAL
AYSI
A
44
23
BR
AZIL
39
2531
28
54 54 54
74
SOU
TH A
FRIC
A
15
39
43.4 42.939.6
33.129.9
2825.3
22.5 22
36.3
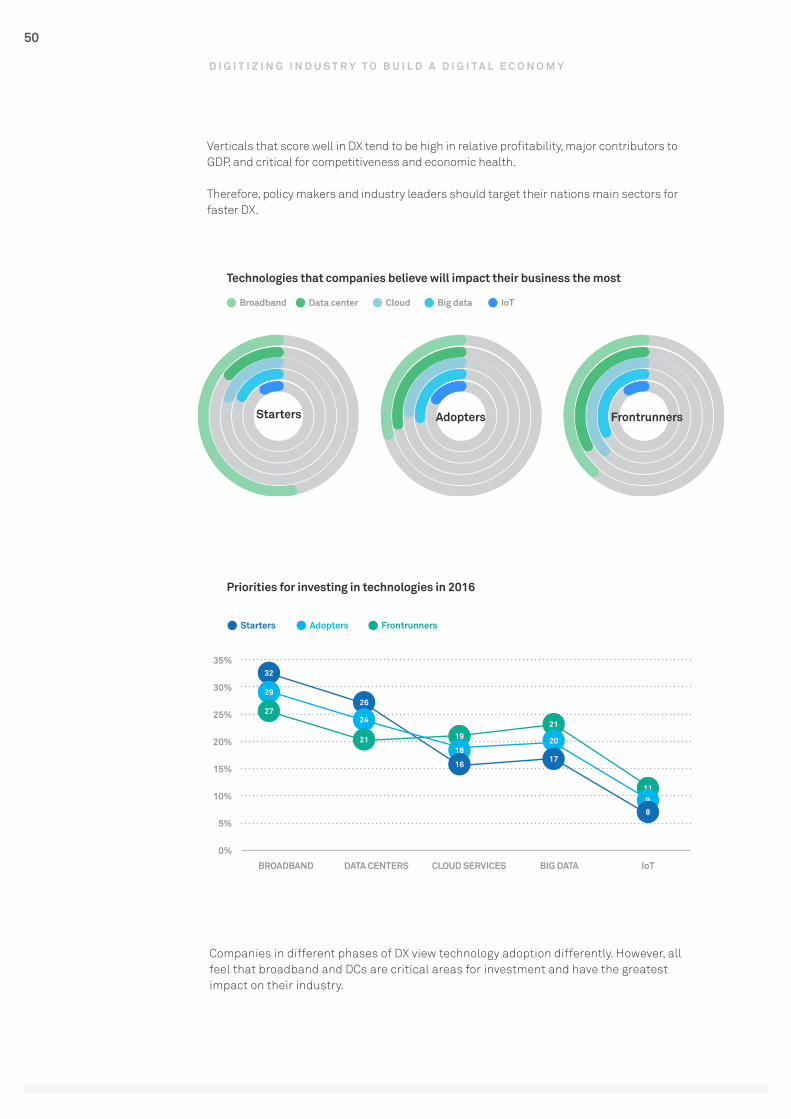
50
Technologies that companies believe will impact their business the most
Priorities for investing in technologies in 2016
Broadband Data center Big dataCloud IoT
Verticals that score well in DX tend to be high in relative profitability, major contributors to GDP, and critical for competitiveness and economic health.
Therefore, policy makers and industry leaders should target their nations main sectors for faster DX.
Starters Adopters Frontrunners
32
2629
2427
21 19
18
11
21
BROADBAND
35%
20%
30%
15%
5%
25%
10%
0%
DATA CENTERS CLOUD SERVICES BIG DATA IoT
Starters Adopters Frontrunners
98
16
20
17
Companies in different phases of DX view technology adoption differently. However, all feel that broadband and DCs are critical areas for investment and have the greatest impact on their industry.
D I G I T I Z I N G I N D U S T R Y T O B U I L D A D I G I T A L E C O N O M Y
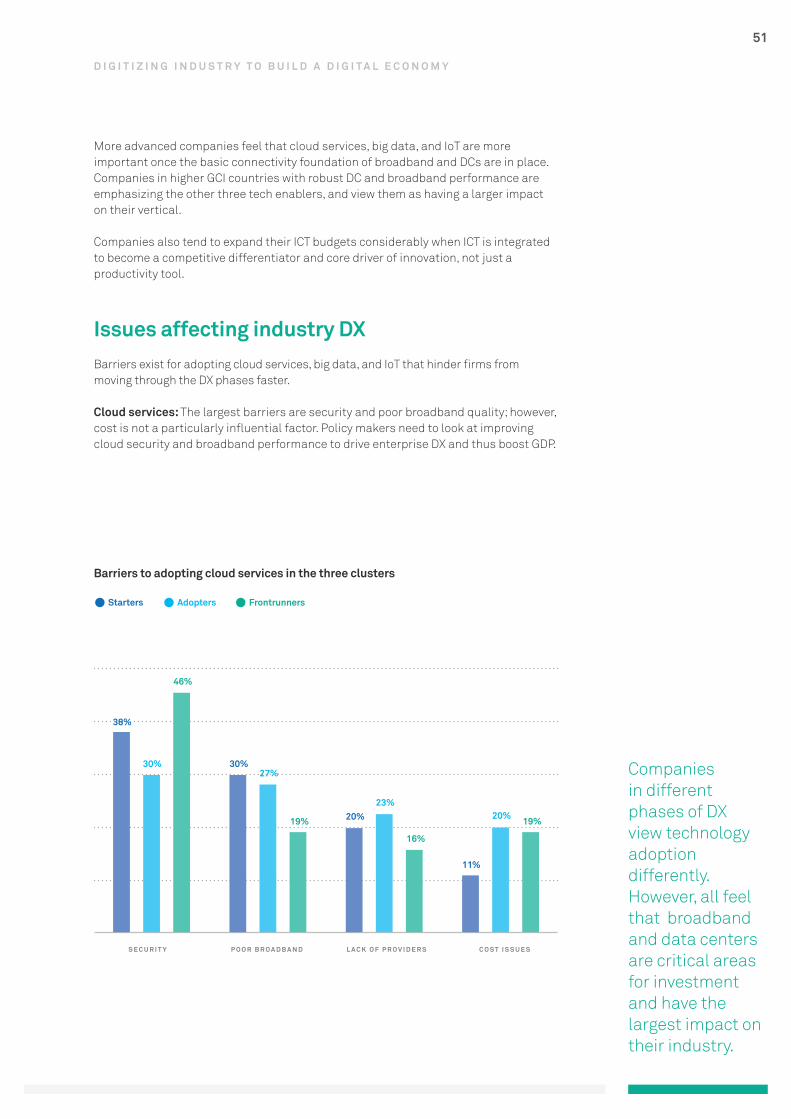
51
Companies in different phases of DX view technology adoption differently. However, all feel that broadband and data centers are critical areas for investment and have the largest impact on their industry.
More advanced companies feel that cloud services, big data, and IoT are more important once the basic connectivity foundation of broadband and DCs are in place. Companies in higher GCI countries with robust DC and broadband performance are emphasizing the other three tech enablers, and view them as having a larger impact on their vertical.
Companies also tend to expand their ICT budgets considerably when ICT is integrated to become a competitive differentiator and core driver of innovation, not just a productivity tool.
Issues affecting industry DXBarriers exist for adopting cloud services, big data, and IoT that hinder firms from moving through the DX phases faster.
Cloud services: The largest barriers are security and poor broadband quality; however, cost is not a particularly influential factor. Policy makers need to look at improving cloud security and broadband performance to drive enterprise DX and thus boost GDP.
D I G I T I Z I N G I N D U S T R Y T O B U I L D A D I G I T A L E C O N O M Y
Barriers to adopting cloud services in the three clusters
S E C U R I T Y P O O R B R O A D B A N D L A C K O F P R O V I D E R S C O S T I S S U E S
Starters
38%
30%
20%
11%
30%27%
23%20%
46%
19%
16%
19%
Adopters Frontrunners
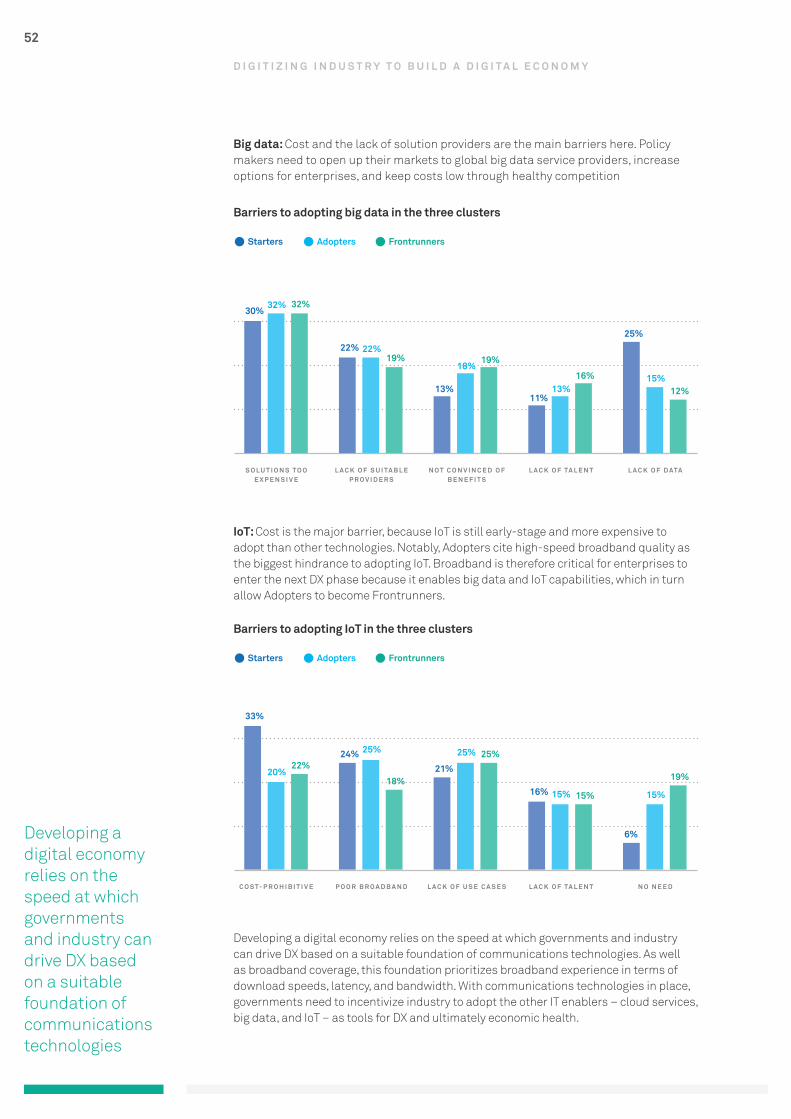
52
Developing a digital economy relies on the speed at which governments and industry can drive DX based on a suitable foundation of communications technologies
Big data: Cost and the lack of solution providers are the main barriers here. Policy makers need to open up their markets to global big data service providers, increase options for enterprises, and keep costs low through healthy competition
IoT: Cost is the major barrier, because IoT is still early-stage and more expensive to adopt than other technologies. Notably, Adopters cite high-speed broadband quality as the biggest hindrance to adopting IoT. Broadband is therefore critical for enterprises to enter the next DX phase because it enables big data and IoT capabilities, which in turn allow Adopters to become Frontrunners.
Developing a digital economy relies on the speed at which governments and industry can drive DX based on a suitable foundation of communications technologies. As well as broadband coverage, this foundation prioritizes broadband experience in terms of download speeds, latency, and bandwidth. With communications technologies in place, governments need to incentivize industry to adopt the other IT enablers – cloud services, big data, and IoT – as tools for DX and ultimately economic health.
D I G I T I Z I N G I N D U S T R Y T O B U I L D A D I G I T A L E C O N O M Y
Barriers to adopting big data in the three clusters
Barriers to adopting IoT in the three clusters
S O L U T I O N S T O O E X P E N S I V E
C O S T- P R O H I B I T I V E
L A C K O F S U I TA B L E P R O V I D E R S
P O O R B R O A D B A N D
N O T C O N V I N C E D O F B E N E F I T S
L A C K O F U S E C A S E S
L A C K O F TA L E N T
L A C K O F TA L E N T
L A C K O F D ATA
N O N E E D
Starters
Starters
Adopters
Adopters
Frontrunners
Frontrunners
30%
33%
32%
20%
32%
22%
22%
24%
22%
25%
19%
18%
13%
21%
18%
25%
19%
25%
11%
16%
13%
15%
16%
15%
25%
6%
15%
15%
12%
19%

53
For lower-GCI countries, driving high-speed mobile broadband and the high penetration rate of smartphones is a critical step in closing the digital divide, delivering essential services, and giving people more income opportunities where existing infrastructureis poor.
The role of government in digital transformation Due to its reach and role in all aspects of business and society, government is a critical component of national digital transformation, a crucial part of which is its own transformation and how it delivers services.
Research by Boston Consulting Group on 12 nations found that 94 percent of Internet users accessed at least one government service over the last two years, and that an average of 32 percent use online government (eGov) services more than once a week. Users in lower-GCI countries like Malaysia, Kenya, and Nigeria access more eGov services more often than their high-GCI peers.
They also view online service delivery as more important than people in high-GCI nations, especially services that greatly impact life and work such as healthcare and education.
The upsurge in eGov services in lower-GCI countries is attributable to high mobile broadband and smartphone penetration, which helps overcome a number of access issues like poor fixed-line infrastructure, lengthy trips to government offices, long queues that can eat up the whole day, or services that are not available in person.
Kenya’s government, for example, has deployed e-systems in various state departments and systems, including tax, immigration, and legal services, as well as integrated financial management and education. Fax, e-mail, and electronic media are all in the communications mix, and the government provides partial electronic services to citizens and businesses through government portals.
For lower-GCI countries, driving high-speed mobile broadband and the high penetration rate of smartphones is a critical step in closing the digital divide, delivering essential services, and giving people more income opportunities where existing infrastructure is poor.
In higher-GCI countries, better infrastructure and existing brick and mortar setups make over-the-counter government services fast and convenient, reducing the pull of eGov services.
However, that’s not to say there isn’t a drive for governments in high-GCI nations to digitize. Launched earlier this year, the UK’s Government Digital Service (GDS) advisory board was set up to help and advise the government on delivering better services for users, and evaluating how emerging digital and technology trends can be applied to public services. The board comprises UK experts from the retail, digital data, and technology sectors from companies as diverse as the Open Data Institute, Facebook, and LoveFilm. The GDS combines the experience of its members at delivering digital products and services to millions of people. In Cabinet Office Minister Matt Hancock’s words:
“We are recasting the relationship between the citizen and the state – all with the goal of making people’s lives better.”The transformation of any economy into a digital economy starts and ends with the digital transformation of government, industry, and society. If it doesn’t, society will retain what we see today – pockets of innovation that contribute to massive inequality and economic stagnation.
D I G I T I Z I N G I N D U S T R Y T O B U I L D A D I G I T A L E C O N O M Y
54
C A L L T O A C T I O N
R E C O M M E N D A T I O N S F O R S T A R T E R S ,
A D O P T E R S , A N D F R O N T R U N N E R S
Nations are competing to gain competitive advantages, stimulate economic activity, and ensure long-term employment for their citizens.
55
Policies set the direction of digital transformation, and form the legal basis for a nation to act.
Policy makers, trade associations, and industry leaders need to objectively benchmark their nations’ GCI performance against their peers and frontrunners to set goals for developing digital economies.
Alongside GCI, they must also consider the following elements:
Policies, institutions, and incentives: Policies set the direction of digital transformation, and form the legal basis for a nation to act; incentives set the speed and depth of change; and institutions drive change, provide governance, and monitor progress.
Manpower and skills: Skilled manpower is at the heart of digital transformation. Technical, management, policy, and planning skills are all needed. IT literacy is crucial as it affects how digital content is consumed and adopted by people at large.
Digital ecosystem: Governments need to take the lead in digitally transforming themselves, driving cross-industry collaboration, and building long-term partnerships with the private sector and the financial world to create a robust ICT ecosystem.
Recommendations for Starters
Policy makers
• Increase ICT investment as a percentage of GDP to expand mobile broadband nationwide.
• Reduce tariffs and subsidize smartphone adoption to get smart devices into homes.
• Promote investment in DCs by third parties to meet national computing needs.
• Open up the market to telcos to widen coverage and make broadband affordable through competition.
• Plan high-speed broadband through 4G and FTTH rollout.
Industry Leaders
• Act now to plan digital transformation initiatives, even if it’s only high-speed broadband for e-commerce. The majority of enterprises in the Foundation Innovation stage are in Phase 1 of digital transformation – now is the time to get ahead.
• Lobby the government to define a national standard for high-speed broadband bandwidth, coverage, and speed over the next one to two years to support industry digitization.
• Step up cloud services to support digital transformation.
C A L L T O A C T I O N

56
Recommendations for Adopters
Policy makers
• Prioritize government digitization so governments can serve as leaders in digital transformation.
• Aim to double ICT investment as a percentage of GDP to broaden broadband coverage through 4G and FTTH.
• Reduce tariffs and subsidize smart devices to get more devices into homes and schools.
• Invite more third-party cloud services providers to support the nation’s computing needs; invest more in building DC capacity, whether in-house or third-party, to support national computing and storage needs.
• Encourage enterprises, the government, and consumers to adopt cloud services.
• Encourage enterprise to use Software-as-a-Service to promote efficiency and lower costs.
• Encourage technology startups to use Platform-as-a-Service to encourage innovation and lower the bar for market entry.
• Improve the high-speed broadband experience by increasing Internet bandwidth and download speeds.
• Develop plans for rolling out big data analytics to support industry digitization.
Industry leaders
• Assess the overall digitization status of enterprises and industry, and develop a clear mandate for adopting the five technology enablers to transform verticals and enterprises.
• Lobby the government to define a national standard for high-speed broadband bandwidth, coverage, and speed over the next one to two years to support industry digitization.
• Use the affordable and scalable architecture of cloud services to enable digital transformation initiatives and deploy ICT solutions.
• Integrate big data analytics solutions to shift national digital transformation from Adopter to Frontrunner and industry digitization from Phase 2 or 3 to Phase 4.
C A L L T O A C T I O N
57
Recommendations for Frontrunners
Policy makers
• Develop industry ecosystems that enable cross-industry collaboration to produce new IoT ideas, products, and services that can change how business is conducted.
• Ensure sufficient high-speed broadband and DC quality for cloud services and big data, and thus IoT.
• Upgrade to ultrafast, low-latency, next-gen networks.
• Improve DC network quality, both in security and latency, to support cloud services, big data analytics, and IoT solutions.
• Accelerate cloud services in all verticals so the cloud can become the platform for ubiquitous computing.
• Promote government and enterprise investment in big data analytics by making anonymized public data available; incentivize the use of analytics and provide training in its use for all enterprises.
• Develop strong data policies to make more data available for sharing to enrich the value it provides; build a robust data market framework for sharing anonymous data for analytics; make the government database library available.
• Invest in IoT initiatives as a major industry strategy; expand IoT deployment and investment by the government and enterprises.
• Identify key industries where digital transformation needs to be accelerated, especially first-movers like tourism, healthcare, or BFSI; develop holistic transformation plans for using technology enablers.
• Develop industry innovation clusters to bring related sectors together to develop new products and services in the IoT arena.
Industry leaders
• Lobby policy makers to build the ICT environment required for enabling industry and enterprise digitization.
• Assess industry and enterprise digitization levels to develop a clear mandate for adopting the five technology enablers for transforming verticals and enterprises.
• Invest in big data analytics and use public data, operating data, and customer data to raise productivity and innovation.
• Join industry innovation clusters to create new products and services that can disrupt competition and create new markets.
C A L L T O A C T I O N
58
C A S E S T U D I E S
China
India
Indonesia
Malaysia
Morocco
The UK
The USA
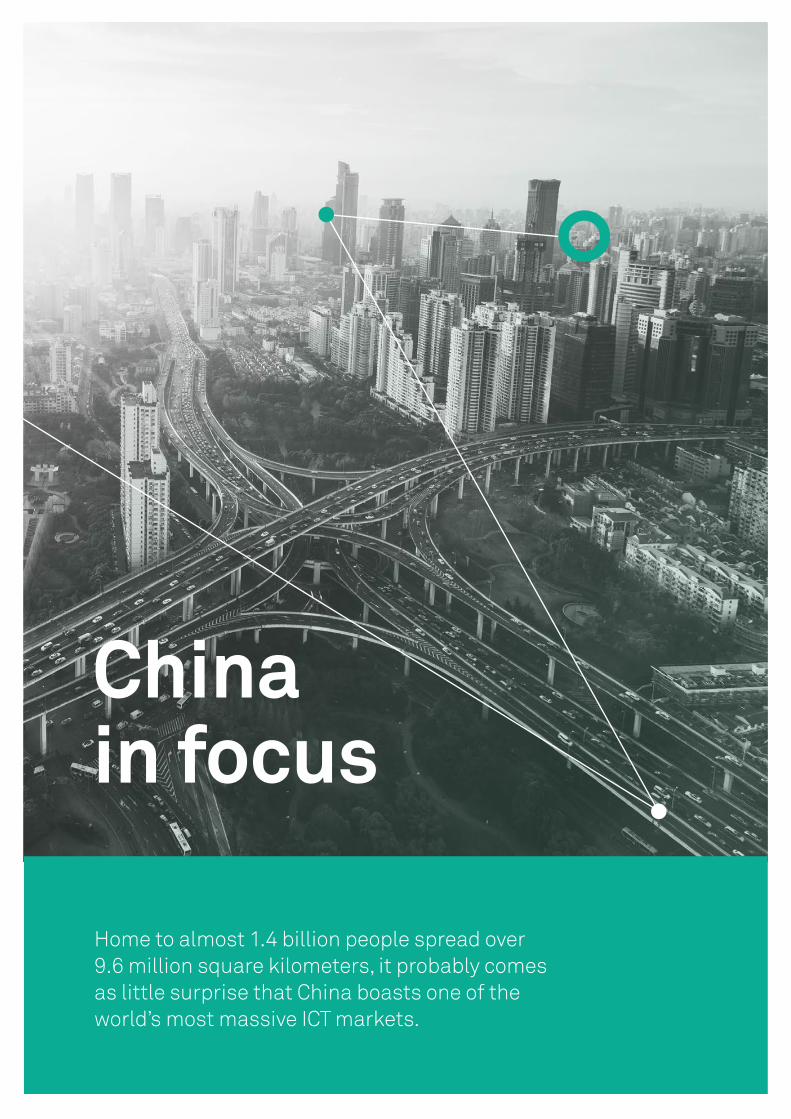
59
Chinain focus
Home to almost 1.4 billion people spread over 9.6 million square kilometers, it probably comes as little surprise that China boasts one of the world’s most massive ICT markets.
60
Though large in absolute terms, a relative view of this trillion-yuan sum sees it trickle in at just 2 percent of the nation’s GDP, barely hitting half the average amount of high-GCI nations.
Counting the zeroes
It’s fair to say that China’s annual ICT investment dwarfs most other countries’ – it certainly did in 2015, with spending totaling 2.7 trillion yuan (US$415 billion).
Where’s this money going? IT hardware accounts for 41 percent, communications technology (CT) for 51 percent, while a modest 8 percent goes on software and services. ICT infrastructure build-out is still expanding to cover the country, though a portion is reserved for upgrading urban CT services.
Though large in absolute terms, a relative view of this trillion-yuan sum sees it trickle in at just 2 percent of the nation’s GDP, barely hitting half the average amount of high-GCI nations, which spend from 4 percent to 7 percent of their GDP on ICT.
Let us entertain you
But, improved urban connectivity is really waking up the media and entertainment market. Thanks to its Broadband China strategy, the country is emerging as one of the top global players in this sector.
With China’s online access speeds zipping along nicely, video is becoming the new star of the show – a total of 46.6 million homes were enjoying IPTV in China in 2015, a 13-million jump from 2014. For supply, China Telecom and China Unicom are expanding IPTV services to urban and rural homes via FTTH, while China Mobile went live with its stand-alone OTT video services in 2015, bringing the market some new flavors. And it’s not just about keeping people entertained – video is also being applied to services like remote healthcare and online education.
China is hitting the digital-transformation ground running with what we call the ROADS experience. These five letters
reveal what people expect these days: real-time, on-demand, all-online, DIY, and social.
Ubiquitous coverage and high-speed broadband are enabling ROADS, and stimulating a crop of video innovations and a new breed of entrepreneurs, which explains the rise of 4K video, augmented reality, and virtual reality.
Going digital with e-commerce
Despite good gains in building supply and demand, many areas still need high-speed broadband. The State Council responded with the national strategy Broadband China, which is touted as the key turner to service- and software-led growth and, ultimately, transformation into a digital economy – a goal that China’s aggressively pursuing. Now’s the right time, too, given the widely reported slowdown in its hardware and manufacturing exports.
In tandem with this downturn, e-commerce is on the rise – between 2006 and 2014, shipping leapt tenfold from 1 billion to 10 billion packages delivered. While China certainly has one of the largest e-commerce markets in the world, it’s mainly using its CT infrastructure to pick the low-hanging fruit of the digital economy – spending per person is just US$3,000 per year, less than a third of the US$10,000 that people in high-GCI countries are lavishing on e-commerce goods. Still, the momentum is strong for China to rapidly monetize its digital economy with e-commerce, increase trade productivity, and open easy routes into new markets.
Of course, e-commerce needs a strong Internet infrastructure and wide broadband coverage to develop. By 2020, Broadband China wants urban broadband access to hit 50 Mbps,
C A S E S T U D I E S : C H I N A I N F O C U S
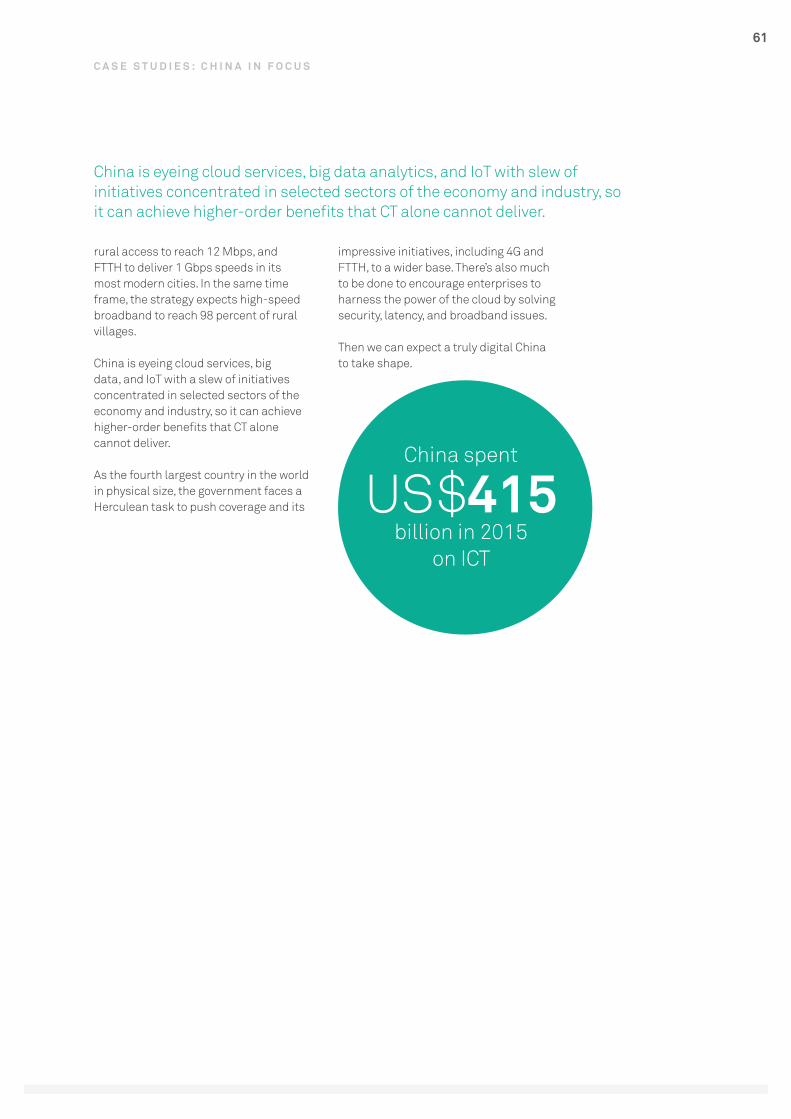
61
rural access to reach 12 Mbps, and FTTH to deliver 1 Gbps speeds in its most modern cities. In the same time frame, the strategy expects high-speed broadband to reach 98 percent of rural villages.
China is eyeing cloud services, big data, and IoT with a slew of initiatives concentrated in selected sectors of the economy and industry, so it can achieve higher-order benefits that CT alone cannot deliver.
As the fourth largest country in the world in physical size, the government faces a Herculean task to push coverage and its
impressive initiatives, including 4G and FTTH, to a wider base. There’s also much to be done to encourage enterprises to harness the power of the cloud by solving security, latency, and broadband issues.
Then we can expect a truly digital China to take shape.
C A S E S T U D I E S : C H I N A I N F O C U S
China spent
US$415billion in 2015
on ICT
China is eyeing cloud services, big data analytics, and IoT with slew of initiatives concentrated in selected sectors of the economy and industry, so it can achieve higher-order benefits that CT alone cannot deliver.

62
Indiain focus
Digital India stepped confidently onto the national stage in 2015. Ambitious in scope and aims, the program seeks to digitally transform this ancient nation, which is home to almost 1.3 billion people and dates back some 5,300 years.
63
To create a knowledge economy, Digital India has three central visions: a connectivity infrastructure for all, e-governance and services, and digitally empowered citizens who can become strong innovators.
What’s Digital India all about?
To create a knowledge economy, Digital India has three central visions: a connectivity infrastructure for all, e-governance and services, and digitally empowered citizens who can become strong innovators.
Providing high-speed broadband through sustained investment sits at the hub of Digital India. Plans are in motion for a national optical fiber network (NOFN) to connect 250,000 larger villages and towns over three years. Costing a total of about 333 billion rupees (US$5 billion), the scheme also involves getting virtual network operators to deliver mobile broadband services in urban areas.
The government will be investing around 130 billion rupees to cover 40,000 villages with mobile broadband by 2018, thus connecting all remaining unconnected villages. To stimulate demand for ICT services, it has allocated around US$1 billion to build more than 250,000 service centers and convert 150,000 post offices into public points for Internet access that rural businesses and people without computers can use.
Better connectivity supply and increased demand for Internet services will help Digital India make life better by giving people opportunities to increase their incomes and by improving healthcare.
For example, current initiatives are in play that let farmers and fisherman track weather and compare wholesale prices on their phones in real time. These measures have driven up profits by 8 percent and cut prices for consumers by 4 percent. Nationwide access can only result in more of these types of dividends.
Governance begins with an “E”
Leading by example, the Indian government is migrating its services online, and using the cloud for scaling and to ultimately provide on-demand eGov services for everyone. Investing in data centers (DC), network security, and minimal latency solutions are preconditions for this to happen.
In parallel, the government is reengineering its workflows, combining databases, and deploying e-payment systems for one-stop access online and on the move. The eKranti platform, for instance, houses the judiciary, security, education, healthcare, registration, administration, planning, and governance systems on one platform, marking a decisive step on the road to government digital transformation.
Staying healthy, staying sociable
Better connectivity is at the heart of the telemedicine scheme run by Maharashtra local government. It’s increased the number of patients diagnosed sevenfold in just three years by letting consultants access and develop specific treatments based on patient data sets from a central repository.
Designed for rural dwellers, the social media platform Gram Vaani incorporates smart IVR (interactive voice response) so people can leave or listen to messages about their community. Trialed in Jharkhand and Bihar, Gram Vaani’s 400,000 users make more than 5,000 calls a day to discuss things like popular culture, local news, events, and government schemes, or just to share information.
C A S E S T U D I E S : I N D I A I N F O C U S
64
Digitally empowered people can become innovators, and greatly boost the potential of a nation’s digital economy. With this in mind, the government wants to train10 million villagers in ICT to help digitize rural communities.
C A S E S T U D I E S : I N D I A I N F O C U S
People power
Digitally empowered people can become innovators and greatly boost the potential of their nation’s digital economy. With this in mind, the Indian government wants to train 10 million villagers in ICT to help digitize rural communities. It plans to provide IT training to support businesses in rural communities and train people to work in IT service delivery centers.
It will complement these schemes with an online depository of all government information and documents under an open data platform, so that big data can be used for innovation at the village level. First, of course, there must be a sufficient supply of high-speed broadband coupled with the wider coverage of and increased demand for DCs.
The startup firm CropIn Technology has created an app for farmers that relays information about a selected farm to a cloud-based server, applies analytics to boost productivity, and connects farmers to financial firms like HDFC Bank, which uses the app to provide unsecured loans.
CropIn enables HDFC to reach farmers faster, collect information remotely, and speed up the loan process. Currently, 40 agro-firms use the solution, including Godfrey Phillips India, McCain Foods, and FieldFresh.
And that’s not all
• Teacher-training programs run by NGOs like Pratham are getting ICT into schools and training teachers.• Samsung and Attano’s first eBook store for India forms the largest market for eBooks, which they complement with the app My Education.• Tech firm Netcore provides SaaS solutions embedded with sensors to monitor factors like the temperature of perishable goods in warehouses in remote locations to reduce waste.• TCS has developed the mobile platform mKRISHI to advise rural farmers, connect them with multiple services, and send them data about pesticides, fertilizers, and soil and water conservation so they can plan better.• Chitale Dairy Farm has automated the feeding and breeding of its cows and buffaloes. Each animal is tagged with an RFID tag that transmits data back to the data center. Benefits include better animal health and higher milk yields.
Digital India’s effect on people’s lives is obvious. High-speed and mobile broadband supply and DC quality are creating tremendous potential for India to quickly improve its GCI and lay the foundation for cloud services, big data, and IoT on the road to digital transformation.

65
Indonesiain focus
Indonesia is emerging from a tough year following a heavy drop in exports and oil prices coupled with a volatile currency. Companies in traditional verticals have felt the biggest pinch, and are casting a hopeful eye in ICT’s direction as a way out.
66
Close to 90 percent of ICT investment will go on hardware, as domestic and international companies continue to set-up and expand into the eastern region of the archipelago nation, whose people are spread over more than 6,000 islands.
Big investment for big gains
ICT investment in Indonesia is expected to total 433.9 billion rupiah (about US$33 billion) by the end of 2016.
Close to 90 percent of this investment will go on hardware, as domestic and international companies continue to setup and expand into the eastern region of the archipelago nation, whose people are spread over more than 6,000 islands.
The media and communications sector remains the first mover in acquiring, building, and modernizing infrastructure – it’ll also be the heaviest investor in ICT by the end of 2016, spending up to US$4 billion. ICT investment across the gamut of industry will be strong. The banking, financial services, securities, and insurance (BFSI) sector will put in an estimated US$1.2 billion into ICT this year, and the manufacturing sector between US$700 million and US$800 million. The retail and service industries will increase spending by 5 percent year-on-year to allocate US$500 million to ICT initiatives.
Indonesia Broadband Plan (IBP)
On a national scale, the IBP aims to provide fixed connectivity through fiber alongside mobile voice and data services. The government is studying how its people are using ICT so it can formulate a 5G service plan by 2020, even though no concrete plan exists for 5G yet and the focus remains on 4G.
Cloud services and data centers (DC) now sit at the top of CIOs’ agendas, especially hybrid clouds and data hosting on third-party sites.
Data centers: An international approach
Suffering from a perceived lack of credible and trustworthy domestic
DC providers, government policy has looked further afield, prompting many partnerships with foreign tech vendors on things like the processes and core infrastructure needed to upgrade DC services. Japan’s NTT and IIJ have acquired or partnered with many Indonesian DC providers to provide DC networks and cloud services, and AWS is likely to make its play in 2017. Big hitters like IBM, Mitsui, Microsoft, and Google are waiting in the wings to enter the Indonesian market at the right time.
Like many other countries, Indonesia lacks a clear strategy to become a digital nation by 2025, despite its stated aims to do so. Its tactics are erratic, with a heavy focus on digital startups and certain areas of e-commerce, but little central push on big data, cloud services, or other new tech. The government itself is slow to digitize – a common situation across the globe.
The government’s e-commerce drive was stimulated by US$12 billion worth of transactions in 2014 and an anticipated US$20 billion by year-end 2015. The sector no doubt has great potential, especially as Indonesians are savvy tech adopters. While direct government funding is lacking, the ICT Ministry has funded initiatives by private companies and is doing cross-border work with Singapore, Malaysia, and Japan.
In the public sector, moves were made in 2014 to modernize education and healthcare, but implementation has been patchy, with IoT projects driven by telcos like Telkomsel mostly confined to M2M in the logistics and retail arenas. On the whole, IoT initiatives remain the exception rather than the rule.
Some high-profile national-level initiatives exist, but digitization is not happening across the nation in a uniform manner.
C A S E S T U D I E S : I N D O N E S I A I N F O C U S
67
On the whole, some high-profile national level initiatives exist but digitization is not happening across the nation in a uniform manner.
A healthy nation with Indonesia Sehat (Healthy Indonesia)
Lifestyle coaching, better healthcare, and a national healthcare system – these are the three objectives of the Healthy Indonesia initiative.
ICT was introduced into the healthcare system in 2014, a central feature of which was a smart health card for each citizen. Based on this card, Telkom Indonesia developed a digital healthcare solution to link citizens, healthcare providers, the government, and agents.
Healthy Indonesia has in large part driven the IBP, alongside the faster rollout plan for rural Indonesia, which is scheduled for completion in 2019. Infrastructure and hosting services provided by Telkom Indonesia, coupled
with high-speed broadband, will give healthcare providers access to patient records online and in real time, and hospitals will be able to mine masses of data across interagency databases. To date, a total of 45 million individuals (54 percent of eligible users) have the health card.
The government is working closely with healthcare providers to modernize the infrastructure of the health sector and digitize its records to provide a seamless experience for Indonesia’s 250 million people.
Indonesia is going digital with forward-looking initiatives like Healthy Indonesia, but its future challenges lie in ensuring that transformation spreads nationwide under a coherent digital strategy.
C A S E S T U D I E S : I N D O N E S I A I N F O C U S
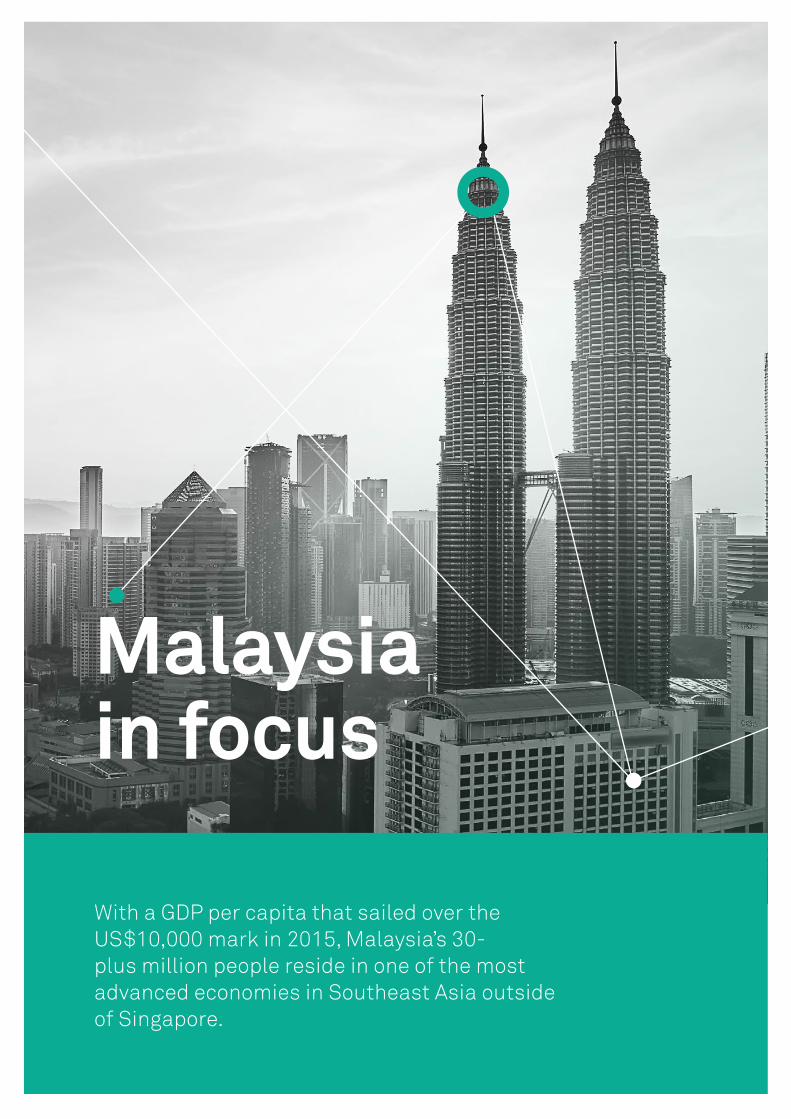
68
Malaysiain focus
With a GDP per capita that sailed over the US$10,000 mark in 2015, Malaysia’s 30-plus million people reside in one of the most advanced economies in Southeast Asia outside of Singapore.
69
Malaysia wants to wear the crown as the data center and cloud hub of South East Asia.
Strong on tradition
Despite its relatively high GDP, Malaysia’s economy depends on traditional industries like oil and gas, manufacturing, and agriculture. That hasn’t stopped the nation from getting visionary though – it’s pushing strongly to transform its manufacturing-based economy into a service economy, with a focus on high-value services like business process outsourcing (BPO).
Vision 2020 aims to get the nation service-oriented by using digital technology for economic transformation, and building on existing initiatives like promoting enterprise and government digitization, facilitating e-commerce, and developing the nation’s outsourcing and offshore business.
Strong on ambition
Malaysia’s ambitions don’t end there – it wants to wear the crown as the data center and cloud hub of Southeast Asia, and become the regional hub for developing and testing software for mobile apps and IoT solutions. The situation for data centers is looking promising, with industry growth jumping by 40 percent in the past three years – over double Asia Pacific’s average of 16 percent. Malaysia can also take pride in the inception of the Sedenak Iskandar Data Hub (SIDH), a new 700-acre construction project in Johor.
The nation’s 2020 digital economy aims to:
• Create 160,000 high-value jobs.• Contribute 17 percent to GNI.• Boost SME contributions to GDP by 1 percent.• Generate an extra 7,000 ringgits (about US$1,800) in digital income per year for 350,000 citizens.
• Make the top 10 on the IMD world competitiveness scoreboard by 2020, compared with 16th in 2011.• Make the top 20 in the digital economy rankings of the Economist Intelligence Unit, up from its current figure of 36th.
Strong on investment
Malaysia is investing hard to ensure the adequate supply of ICT services. Its ICT investment exceeded US$24.7 billion at the close of 2015, with 51 percent going on IT.
Consumers were enthusiastically buying up tablets and smartphones, which recorded spending gains of 10 percent and 21 percent, respectively.
For enterprises, spending on networking hardware for data centers rose by 14 percent, but negative growth hit mid-range and high-end servers at -1 percent and -8 percent respectively, with sales for tape storage also bottoming out at -8 percent. However, this reflects the introduction of newer, efficient, and cost-effective technologies that are cannibalizing legacy hardware – a further sign of Malaysia’s transformation into a country that’s ready for big data and IoT.
That said, the proportion of spending on IT services compared with IT spending is still relatively low compared to higher-GCI countries, growing just 0.3 percent from 22.2 percent between 2011 and 2015.
The Malaysian government is rapidly completing its easier-to-do policies of building out hardware infrastructure; however, it’s much trickier to drive the development and adoption of IT services like big data and IoT, which are necessary for industry and economic digitization.
C A S E S T U D I E S : M A L A Y S I A I N F O C U S
Data centers: An international approach
70
Despite the fanfare for initiatives in the IT areas of cloud, big data analytics, and IoT, these are still in their infancy, and require broadband issues like coverage, download speed, latency, and cost to be solved.
C A S E S T U D I E S : M A L A Y S I A I N F O C U S
On a positive note, the regulator MCMC and service providers are improving the broadband experience by expanding coverage and providing affordable broadband to users. Keeping pace with the latest technology, MCMC regulated the 2.6 GHz frequency band in 2012, allocating it to four of the nation’s mobile service providers. They then launched LTE networks in 2013 with peak download speeds of 75 Mbps. This move by the government has leveled the competitive playing field, and the nation is now witnessing a battle to provide the best price-performance ratio.
So, what’s holding Malaysia back?
Mobile broadband affordability remains an issue. In GCI 2016, Malaysia scored only slightly above average in this category at 6 out of 10, compared with Singapore’s 8. The last MCMC survey also found that only 25 percent of people were satisfied with mobile broadband pricing and services. For example, the average download speed crawls along at 8 Mbps, almost half the speed of its less developed neighbor, Thailand, at 14 Mbps, and way behind Singapore at 121 Mbps.
Today, only 14 percent of properties – mostly urban – have FTTH, with the vast majority forced to suffer old and slow ADSL. At the end of 2015, the government pledged to expand FTTH networks to 400,000 premises in suburban areas, and to deliver broadband speeds of up to 100 Mbps by 2019.
Moreover, infrastructure for mass cloud services, big data, and IoT adoption is lacking, and 4G is available to fewer than one in four people.
It’s getting cloudier
Through MDeC, the government has rolled out multiple initiatives to spur cloud adoption and usage. A key 2014 scheme for SMEs granted up to US$192 for cloud subscriptions to 1,800 SMEs. The MalaysiaOneCloud platform set up by CloudFX and MDeC helps independent software vendors (ISVs) migrate to the cloud and build a strong cloud ecosystem for Malaysia ISVs and DC providers.
Telcos have been indirectly driving public cloud services and service quality by upgrading infrastructure to raise bandwidth and lower latency. However, cloud service uptake in Malaysia lags behind other leading economies in Asia Pacific like Australia, New Zealand, and Singapore, whose average cloud spending as a percentage of IT spending is more than triple Malaysia’s.
The drive is there
With falling oil prices and sluggish agricultural output, Malaysia is aggressively pushing to develop the five technology enablers for digital transformation.
2015 brought with it a national big data framework and national big data innovation network, coupled with a crop of MoUs to build industry-driven centers of excellence for big data analytics.
An MoU signed between the Malaysian Administrative Modernization and Management Planning Unit (MAMPU) and MIMOS pledges to establish a digital government lab for big data analytics as part of the wider national big data innovation network.
The government set up an IoT working group in 2014, bringing together telcos, IT firms, verticals such as healthcare providers and universities, and tech start-ups. A year later, the National Strategic Roadmap was born, underlining roles for each vertical to drive IoT.
Malaysia is ambitious when it comes to digital transformation. But despite the fanfare surrounding initiatives in the IT areas of cloud services, big data, and IoT, these are still in their infancy and first require moves to solve broadband issues like coverage, download speed, latency, and cost.
Otherwise, adoption will be patchy and transformation into a service-based digital economy based on IT will be limited.

71
Moroccoin focus
To infuse power into its digital journey, Morocco has painted a digital target on economic diversification. Already a few years into its transformation strategy, the African nation is aiming to race past its agricultural legacy and digitize its way into new high-value pastures.
72
On the ICT front, BPO has helped Morocco grow one of the most developed ICT sectors out of Africa’s 54 countries, second only to South Africa on the GCI.
C A S E S T U D I E S : M O R O C C O I N F O C U S
Hello Europe
Morocco’s above-average economic growth of 4.3 percent in 2015 gave way to a gloomier outlook for 2016, with growth predictions settling on a modest 2.6 percent – a slip that takes it below the global average. For this, the nation has falling agricultural output to thank.
But, Morocco’s 35 million people face Europe from northwest Africa, making the country a popular choice for inward investment from the EU for near-shore manufacturing and services. Its emerging digital economy largely derives from European business process outsourcing (BPO), centering on Casablanca and Rabat. On the ICT front, BPO has helped Morocco grow one of the most developed ICT sectors out of Africa’s 54 countries, second only to South Africa on the GCI.
Standing tall at three years old
With no new plans in place, the four priorities of the existing national ICT plan, Digital Morocco 2013 (Maroc13), are as follows:
• Expand broadband access to boost the national knowledge stack.• Provide more and better eGov services.• Inspire SMEs to digitize for better productivity. • Develop the local IT industry.
Investing in schemes like nationwide broadband has brought in gains, with about 40 percent of Moroccans able to access mobile broadband mainly on 3G, supplemented by fixed broadband carried over ADSL networks. Morocco issued 4G licenses in 2015 alongside an FTTH license for Maroc Telecom, but rollout is still slow and therefore so is demand.
An upsurge in the supply of high-speed broadband and nationwide 4G and FTTH are the jolts that Morocco needs. Aware of this, the government’s priority for driving the digital transformation of its economy is to push for a robust broadband network that links all key cities and industrial centers.
The future promises an open field of cloud services like Software as a Service (SaaS) and BPO as a Service. This is likely to reduce demand for call centers and BPO operations, a change for which Morocco can prepare by evolving its current call centers and BPO hubs into a delivery mechanism for cloud services and support centers for Europe.
A long, hot summer for data centers
Beyond improving broadband, Morocco can strengthen its position as a data center (DC) hub by investing in the DC domain. Crucially, the nation boasts one of the largest solar power farms in the world, promising cheap and clean power for DCs – no small advantage given that this technology devours energy as the world’s fifth most power-hungry sector.
Morocco has also been pushing ICT in schools and healthcare scenarios, like getting health information into as many hands as possible, which is helped by a smart phone penetration rate that exceeds 100 percent.
To best harness and wield the power of its tech-trained and connected populace, Morocco needs to supply affordable high-speed broadband so that it can build a sustainable digital economy.

73
The UnitedKingdomin focus
The UK government is on a mission that it’s passionate about: enhancing the island nation’s connectivity over the next five years by boosting access to superfast broadband and 4G.
74
Through Innovate UK, the government is putting into play a business and policy environment that’s attracting international IT service providers to build data centers (DC) and other infrastructure to serve Europe from the UK.
ICT the UK way
In 2015, the UK government pledged £1.7 billion to 47 local projects, with the aim of giving 95 percent of the country access to superfast broadband by 2017. In the same time frame, it’s looking to increase 4G coverage to approximately 98 percent of the country. Like many of the economies leading the way in GCI 2016, the UK government knows that broadband alone is not enough – it also needs to focus on developing big data and the Internet of Things (IoT) to truly realize digital transformation.
Let’s talk data
Through Innovate UK, the government is putting into play a business and policy environment that’s attracting international IT service providers to build data centers (DC) and other infrastructure to serve Europe from the UK.
The public sector is a keen adopter of cloud and DC solutions, setting a fine example for other verticals to follow. And indeed they are – Microsoft will bring its Azure DC online in 2016, Amazon will open its first UK DC in 2017, and IBM was way ahead of the curve, having opened its Softlayer cloud DC back in July 2014.
The welcoming business environment established by the UK government has in large part stimulated this flurry of investment activity. For example, in January 2015, it expanded the climate change exemption levy to include DCs,
thus lowering the tax paid on energy. This measure adrenalized cloud service providers to compete for a slice of the UK action by building large-scale DCs, which has increased scalability and improved services for customers. These providers are also increasing performance and keeping data secure by offering dedicated network access to the cloud.
A big future with big data
Over the past few years, the government has stepped up investment in big data. In February 2014, it allocated £73 million to big data research, including £50 million to bioinformatics, £4 million to 21 open data projects, £14 million to 4 new research centers, and £4.6 million to 24 projects centering on environmental data.
It then supplemented this with £42 million for the Alan Turing Centre to research the collection, organization, and analysis of big data.
IoT in the UK
In addition to investing in big data, the UK government committed £40 million to the IoTUK program in September 2015, with £10 million set aside for a single, collaborative R&D project in a city region. Innovate UK backed a consortium of 40 UK tech companies in 2014 to create a new open IoT specification for machines to work together over the Internet and for applications to analyze data autonomously. As part of the government’s digital economy strategy,
C A S E S T U D I E S : T H E U K I N F O C U S
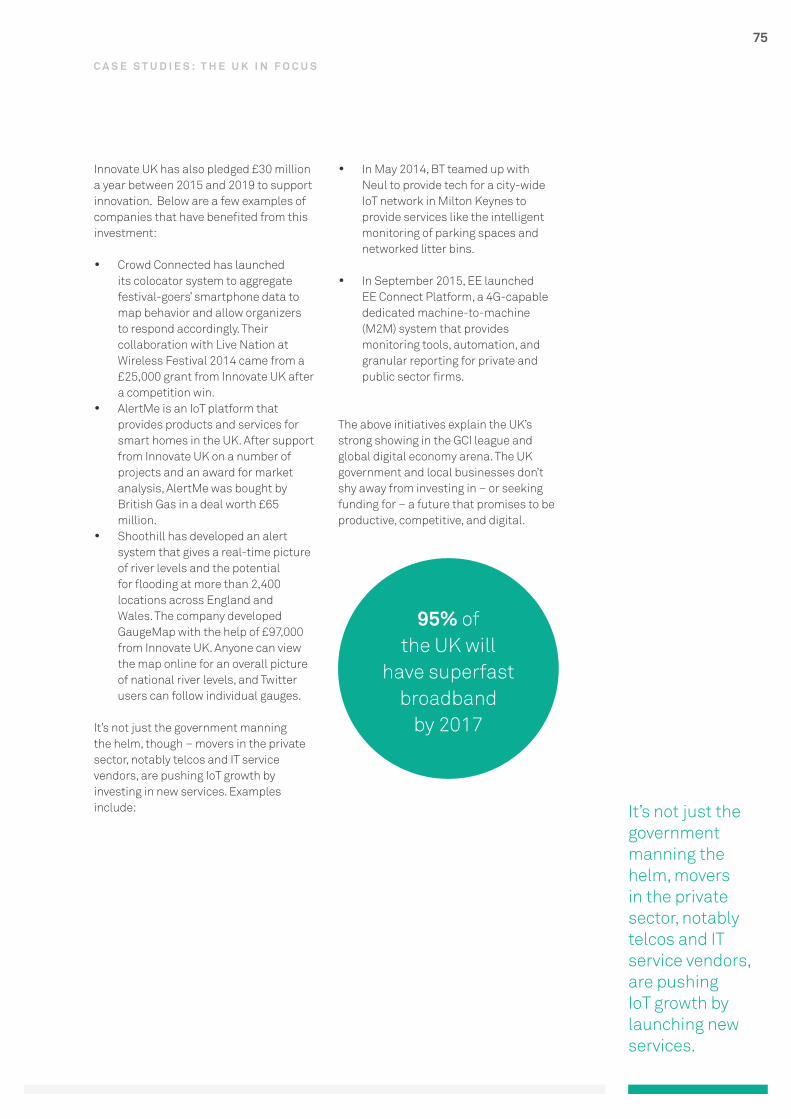
75
It’s not just the government manning the helm, movers in the private sector, notably telcos and IT service vendors, are pushing IoT growth by launching new services.
Innovate UK has also pledged £30 million a year between 2015 and 2019 to support innovation. Below are a few examples of companies that have benefited from this investment:
• Crowd Connected has launched its colocator system to aggregate festival-goers’ smartphone data to map behavior and allow organizers to respond accordingly. Their collaboration with Live Nation at Wireless Festival 2014 came from a £25,000 grant from Innovate UK after a competition win.
• AlertMe is an IoT platform that provides products and services for smart homes in the UK. After support from Innovate UK on a number of projects and an award for market analysis, AlertMe was bought by British Gas in a deal worth £65 million.
• Shoothill has developed an alert system that gives a real-time picture of river levels and the potential for flooding at more than 2,400 locations across England and Wales. The company developed GaugeMap with the help of £97,000 from Innovate UK. Anyone can view the map online for an overall picture of national river levels, and Twitter users can follow individual gauges.
It’s not just the government manning the helm, though – movers in the private sector, notably telcos and IT service vendors, are pushing IoT growth by investing in new services. Examples include:
• In May 2014, BT teamed up with Neul to provide tech for a city-wide IoT network in Milton Keynes to provide services like the intelligent monitoring of parking spaces and networked litter bins.
• In September 2015, EE launched EE Connect Platform, a 4G-capable dedicated machine-to-machine (M2M) system that provides monitoring tools, automation, and granular reporting for private and public sector firms.
The above initiatives explain the UK’s strong showing in the GCI league and global digital economy arena. The UK government and local businesses don’t shy away from investing in – or seeking funding for – a future that promises to be productive, competitive, and digital.
C A S E S T U D I E S : T H E U K I N F O C U S
95% ofthe UK will
have superfastbroadband
by 2017

76
USAin focus
With ICT investment totaling a whopping US$1.1 trillion in 2015, the US is no stranger to investing heavily in digital tech. It’s fully aware of ICT’s value as a competitive tool in today’s global market and as a response mechanism to frequent disruptions by emerging technologies.
77
Speed, like quality, is a big thing in the US and as such a heavy investment focus.
Picking up the pace
Speed, like quality, is a big thing in the US and thus a heavy investment focus. The Federal Communications Commission (FCC) now considers download and upload speeds of 25 and 3 Mbps, respectively, as “broadband”, and is striving to cover the 39 percent of rural and 4 percent of urban dwellers who lack access to these FCC-defined speeds.
In partnership with the private sector, the government has launched ConnectHome to bring broadband to poorer communities across the country using Google Fiber in a move to bridge the digital divide. Currently, Google Fiber connects residents in selected public and low-end properties across 22 cities for a free monthly subscription and installation, supplemented by training under the Digital Inclusion Fellowship scheme.
Better high-speed broadband quality has kicked demand up a notch for cloud-based solutions. The government, Federal CIO Council, and Office of Management and Budget (OMB) are driving government agencies to shift certain IT systems onto the cloud – in particular, new systems, stored data, and mobile solutions.
The federally owned cloud service provider USDA has launched its National Information Technology Center (NITC) to offer both IaaS and PaaS to local, state, and federal government systems. It helps them deploy virtual systems quickly via on-demand, self-service, and flexible networking capabilities. These include resource pooling, rapid elasticity, and a robust disaster recovery infrastructure within a virtual data center (VDC) construct situated on a hybrid cloud.
Big data doing its bit for society
Due to better connectivity and massive repositories of data, there’s no shortage
of demand for big data analytics, which has been stimulated by positive outcomes in predictive solutions in various verticals. US law enforcement agencies across the local, state, and federal levels are deploying analytics solutions to predict and prevent crimes. For example, automated license plate recognition (ALPR) software identifies people with outstanding warrants, and predictive analytics anticipates possible crime flashpoints and connects crimes to repeat offenders.
The Department of Transportation applies ALPR, cameras, and sensors to track travelers and traffic flow, predict breakdowns, and assess how much investment is needed in which particular component of infrastructure.
The Department of Defense (DOD) applies big data analytics to analyze a vast amount of sensor data and time-critical information to support troops across large geographical areas. Defense agencies are investing heavily in automated analysis techniques, text analytics, user interface techniques, and advanced analytics to analyze large data sets in tight timeframes and with limited manpower.
The US is continuing to invest heavily in IoT. In 2015, the nation’s top 10 IoT applications looked like this: smart home, wearables, smart city, smart grids, Industrial internet, connected cars, connected health, smart retail, smart supply chain, and smart farming.
On a health kick
The publicly run healthcare sector is enjoying the use of Third Platform technologies, while the National Institute of Health (NIH) launched PMI Cohort to set up a database of at least 1 million volunteers for the President’s Precision Medicine Initiative.
C A S E S T U D I E S : U S A I N F O C U S

78
More than 40 private sector partners involved in the research project include IBM and its supercomputer, Watson, which will be used to crunch genomic data. The initiative will also include Amazon’s AWS cloud storage solution, and Intel’s analytics tools coupled with its proof of concept for a data center (DC) that can cope with huge genomic data sets. As the name suggests, NIH’s Big Data to Knowledge (BD2K) solution will let scientists use analytics techniques on complex biomedical data sets, so continued leadership in bio-medical innovation and healthcare services is only a digital step away.
According to the 2015 Strategy for American Innovation, the “2016 federal budget allots funds for several federal agencies to build digital services teams of experts to transform some of the country’s most important citizen- and business-facing services”. It aims to do so in a way that people like and which doesn’t break the bank. Moreover, the strategy will piggy back on the success of the US Digital Service and 18F in projects like the Veterans Benefits Management System, green card replacements and renewals, and College Scorecard.
Despite having one of the most advanced ICT infrastructures of the 50 countries surveyed this year, the US knows that it can’t stand still – other countries such as Sweden, Singapore, Switzerland, and the UK are nipping at its heels, and also have robust high-speed broadband, data center networks, and cloud solutions capabilities.
This explains why the US government continues to strengthen economic digitization with massive investment, building on an already strong foundation.
C A S E S T U D I E S : U S A I N F O C U S
Despite having one of the most advanced ICT
infrastructures, the US knows that it can’t
stand still.

79
G C I M E T H O D O L O G Y
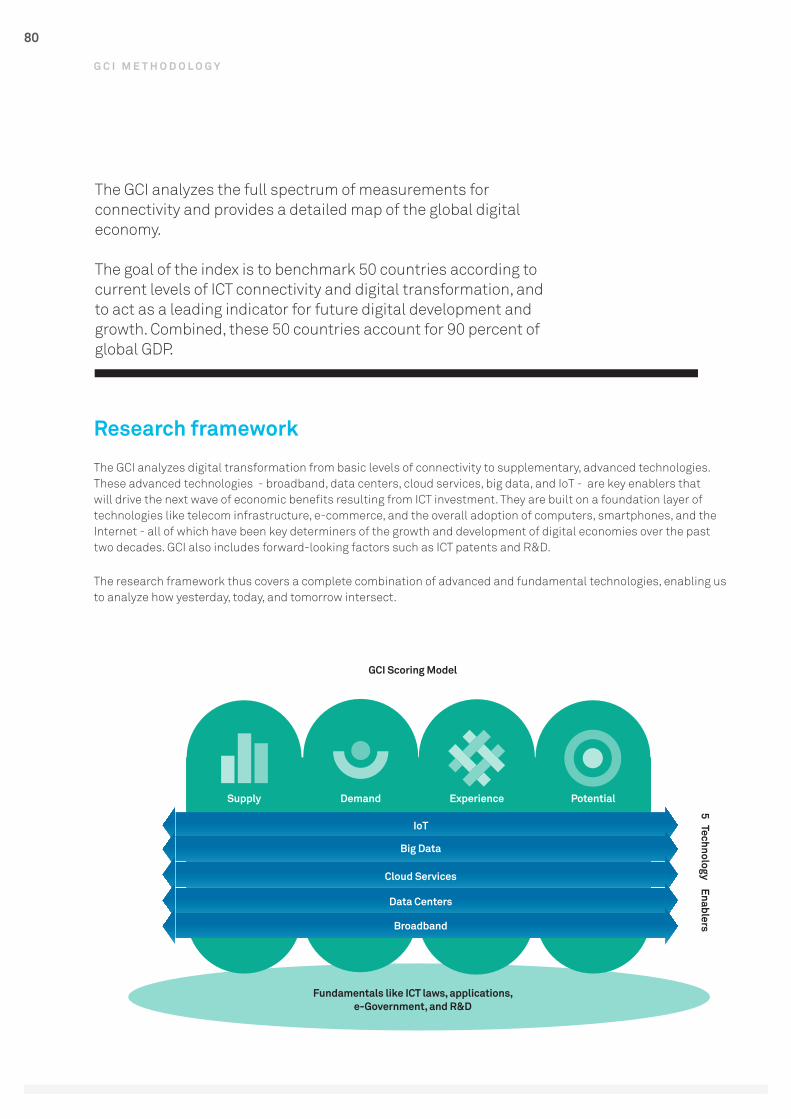
80
G C I M E T H O D O L O G Y
The GCI analyzes the full spectrum of measurements for connectivity and provides a detailed map of the global digital economy.
The goal of the index is to benchmark 50 countries according to current levels of ICT connectivity and digital transformation, and to act as a leading indicator for future digital development and growth. Combined, these 50 countries account for 90 percent of global GDP.
Research framework
The GCI analyzes digital transformation from basic levels of connectivity to supplementary, advanced technologies. These advanced technologies - broadband, data centers, cloud services, big data, and IoT - are key enablers that will drive the next wave of economic benefits resulting from ICT investment. They are built on a foundation layer of technologies like telecom infrastructure, e-commerce, and the overall adoption of computers, smartphones, and the Internet - all of which have been key determiners of the growth and development of digital economies over the past two decades. GCI also includes forward-looking factors such as ICT patents and R&D.
The research framework thus covers a complete combination of advanced and fundamental technologies, enabling us to analyze how yesterday, today, and tomorrow intersect.
Supply Demand Experience Potential
IoT
Cloud Services
Data Centers
Broadband
Big Data
Fundamentals like ICT laws, applications, e-Government, and R&D
GCI Scoring Model
5 Technology Enablers
81
The four pillars: SDEP
The four pillars encompass the entire chain of ICT development and digital transformation to provide a
360-degree view of the digital economy. Each pillar has a set of 10 data indicators.
Supply
measures current levels of supply for ICT products and services used for digital transformation.
Supply indicators: ICT investment, telecom investment, ICT laws, international Internet bandwidth, fiber optics, 4G coverage, data center investment, cloud investment, big data investment, and IoT investment.
Demand
gauges demand for connectivity in the context of users and activities relating to digital transformation initiatives.
Demand indicators: app downloads, e-commerce transactions, smartphone penetration, computer households, fixed broadband subscriptions, mobile broadband subscriptions, data center equipment, cloud migration, analytics data creation, IoT installed base.
Experience
comprises variables for analyzing the experience of connectivity for end-users and organizations in today’s digital economy.
Experience indicators: government services, telecom customer services, internet participation, broadband download speeds, fixed broadband affordability, mobile broadband affordability, data center experience, big data experience, cloud experience, IoT experience.
Potential
comprises a forward-looking set of indicators that point towards the future development of the digital economy.
Potential indicators: R&D expenditure, ICT patents, IT workforce, software developers, and market potential Index calculations for broadband, data centers, cloud services, big data, and IoT experience.
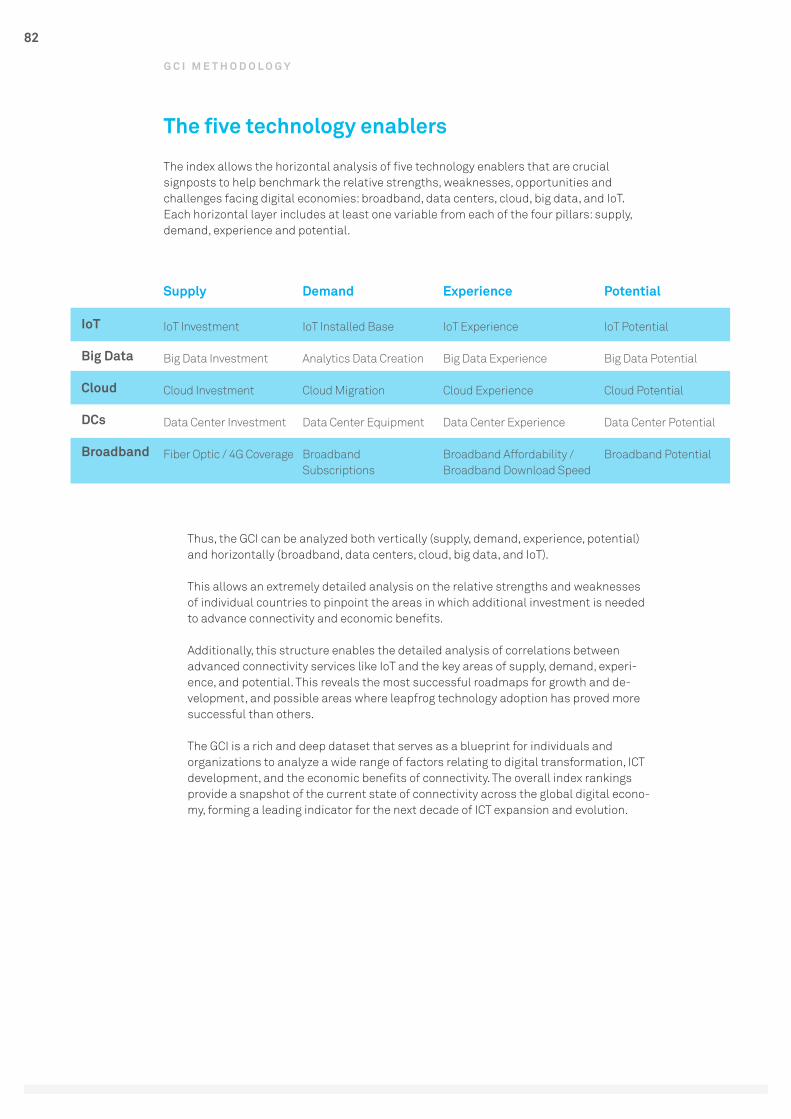
82
G C I M E T H O D O L O G Y
The five technology enablers
The index allows the horizontal analysis of five technology enablers that are crucial signposts to help benchmark the relative strengths, weaknesses, opportunities and challenges facing digital economies: broadband, data centers, cloud, big data, and IoT. Each horizontal layer includes at least one variable from each of the four pillars: supply, demand, experience and potential.
Thus, the GCI can be analyzed both vertically (supply, demand, experience, potential) and horizontally (broadband, data centers, cloud, big data, and IoT).
This allows an extremely detailed analysis on the relative strengths and weaknesses of individual countries to pinpoint the areas in which additional investment is needed to advance connectivity and economic benefits.
Additionally, this structure enables the detailed analysis of correlations between advanced connectivity services like IoT and the key areas of supply, demand, experi-ence, and potential. This reveals the most successful roadmaps for growth and de-velopment, and possible areas where leapfrog technology adoption has proved more successful than others.
The GCI is a rich and deep dataset that serves as a blueprint for individuals and organizations to analyze a wide range of factors relating to digital transformation, ICT development, and the economic benefits of connectivity. The overall index rankings provide a snapshot of the current state of connectivity across the global digital econo-my, forming a leading indicator for the next decade of ICT expansion and evolution.
IoT
Big Data
Cloud
DCs
Broadband
IoT Investment
Big Data Investment
Cloud Investment
Data Center Investment
Fiber Optic / 4G Coverage
IoT Installed Base
Analytics Data Creation
Cloud Migration
Data Center Equipment
Broadband Subscriptions
IoT Experience
Big Data Experience
Cloud Experience
Data Center Experience
Broadband Affordability / Broadband Download Speed
IoT Potential
Big Data Potential
Cloud Potential
Data Center Potential
Broadband Potential
Supply Demand Experience Potential
83
The ICT fundamentalsThe five technology enablers need to function on a platform of robust core measure-ments of ICT fundamentals for a nation to transform into a digital economy and build upon these fundamentals in a self-reinforcing loop.
Examples of these fundamentals and their functions are as follows: ICT laws are essential for supply: They set down regulatory boundaries that govern privacy, confidentiality, and safe and legal use. The digital IPs, digital assets, identities, and privacy of businesses and consumers must be protected against abuse and mis-use. ICT laws make it feasible for the public and private sectors to invest in supplying ICT products and services to the mass market safely and under regulations.
Applications drive demand. Delivered on broadband networks, stored in DCs, and dis-tributed via cloud services for mass consumption, they enable technology to produce outcomes. Applications feed data to analytics solutions for processing into informa-tion that can effect changes through IoT devices.
Customer experience concerns quality of service (QoS). It ensures that ICT services meet the expectations and requirements of businesses and consumers in a way that encourages greater use and investment. For example, a country could have strong investment in cloud solutions but poor network performance or reliability, which will hinder the ability of end users to derive economic benefits.
Patents lead to potential. They form the basis that stimulate the innovation of new products and services. High demand coupled with a good experience builds strong future potential to accelerate digital transformation and make economic gains. The five tech enablers require patents for innovation.
A strong IT workforce ensures that a skilled and technology-literate population is available to drive future digital transformation through innovation based on real-world use. A shortage of skilled workers can be a significant inhibitor to a country’s potential transformation. Equally an educated workforce is needed to make the most of digital technology.
Other fundamental layer measurements include telecom infrastructure investment, Internet bandwidth, e-commerce, smartphone and computer penetration, e-govern-ment, Internet participation, average download speed, R&D expenditure, and number of software developers.
84
G C I M E T H O D O L O G Y
Measurement and normalizationThe variables are measured against factors such as GDP PPP, number of households, and total population.
These factors assess the full picture of connectivity for each country, including measurements like app downloads per person or fiber optic penetration against total
households.
In emerging economies, connectivity levels in major metropolitan areas tend to be much higher than their national scores, because these nations are still in the early stages of ICT adoption. This provides an important metric for understanding the potential of the increased economic benefits that these emerging economies will probably see over the next decade and beyond, as they close the digital divide through rapid investment and adoption programs.
In all cases, the data inputs are first measured against a normalizing variable like population size, so the index can benchmark countries according to relative levels of connectivity rather than absolute market sizes, which would be more reflective of economy size.
The index benchmarks nations according to their overall rate of connectivity across the economy and entire population.
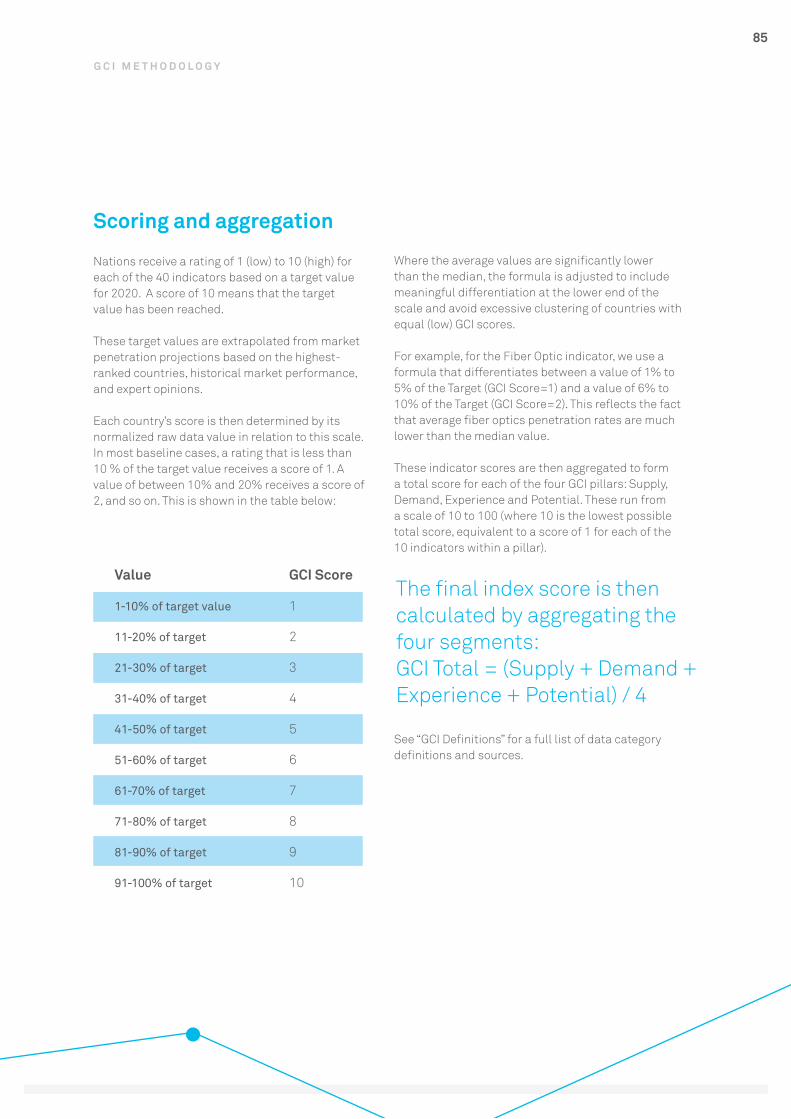
85
G C I M E T H O D O L O G Y
Scoring and aggregation
Nations receive a rating of 1 (low) to 10 (high) for each of the 40 indicators based on a target value for 2020. A score of 10 means that the target value has been reached.
These target values are extrapolated from market penetration projections based on the highest-ranked countries, historical market performance, and expert opinions.
Each country’s score is then determined by its normalized raw data value in relation to this scale. In most baseline cases, a rating that is less than 10 % of the target value receives a score of 1. A value of between 10% and 20% receives a score of 2, and so on. This is shown in the table below:
Where the average values are significantly lower than the median, the formula is adjusted to include meaningful differentiation at the lower end of the scale and avoid excessive clustering of countries with equal (low) GCI scores.
For example, for the Fiber Optic indicator, we use a formula that differentiates between a value of 1% to 5% of the Target (GCI Score=1) and a value of 6% to 10% of the Target (GCI Score=2). This reflects the fact that average fiber optics penetration rates are much lower than the median value.
These indicator scores are then aggregated to form a total score for each of the four GCI pillars: Supply, Demand, Experience and Potential. These run from a scale of 10 to 100 (where 10 is the lowest possible total score, equivalent to a score of 1 for each of the 10 indicators within a pillar).
See “GCI Definitions” for a full list of data category definitions and sources.
Value
1-10% of target value
11-20% of target
21-30% of target
31-40% of target
41-50% of target
51-60% of target
61-70% of target
71-80% of target
81-90% of target
91-100% of target
GCI Score
1
2
3
4
5
6
7
8
9
10
The final index score is then calculated by aggregating thefour segments:GCI Total = (Supply + Demand + Experience + Potential) / 4

86
G C I D E F I N I T I O N S
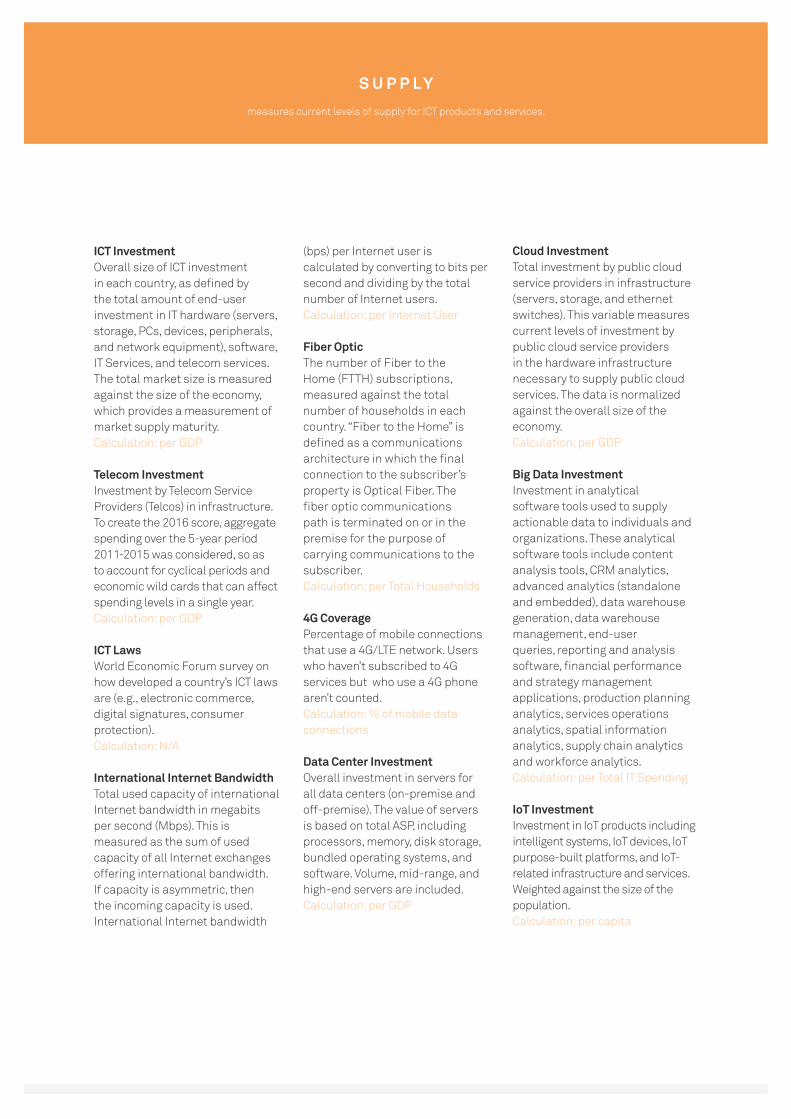
87
S U P P L Y
ICT InvestmentOverall size of ICT investment in each country, as defined by the total amount of end-user investment in IT hardware (servers, storage, PCs, devices, peripherals, and network equipment), software, IT Services, and telecom services. The total market size is measured against the size of the economy, which provides a measurement of market supply maturity.Calculation: per GDP
Telecom InvestmentInvestment by Telecom Service Providers (Telcos) in infrastructure. To create the 2016 score, aggregate spending over the 5-year period 2011-2015 was considered, so as to account for cyclical periods and economic wild cards that can affect spending levels in a single year.Calculation: per GDP
ICT LawsWorld Economic Forum survey on how developed a country’s ICT laws are (e.g., electronic commerce, digital signatures, consumer protection). Calculation: N/A
International Internet BandwidthTotal used capacity of international Internet bandwidth in megabits per second (Mbps). This is measured as the sum of used capacity of all Internet exchanges offering international bandwidth. If capacity is asymmetric, then the incoming capacity is used. International Internet bandwidth
(bps) per Internet user is calculated by converting to bits per second and dividing by the total number of Internet users.Calculation: per Internet User
Fiber OpticThe number of Fiber to the Home (FTTH) subscriptions, measured against the total number of households in each country. “Fiber to the Home” is defined as a communications architecture in which the final connection to the subscriber’s property is Optical Fiber. The fiber optic communications path is terminated on or in the premise for the purpose of carrying communications to the subscriber. Calculation: per Total Households
4G CoveragePercentage of mobile connections that use a 4G/LTE network. Users who haven’t subscribed to 4G services but who use a 4G phone aren’t counted. Calculation: % of mobile data connections
Data Center InvestmentOverall investment in servers for all data centers (on-premise and off-premise). The value of servers is based on total ASP, including processors, memory, disk storage, bundled operating systems, and software. Volume, mid-range, and high-end servers are included. Calculation: per GDP
Cloud InvestmentTotal investment by public cloud service providers in infrastructure (servers, storage, and ethernet switches). This variable measures current levels of investment by public cloud service providers in the hardware infrastructure necessary to supply public cloud services. The data is normalized against the overall size of the economy. Calculation: per GDP
Big Data InvestmentInvestment in analytical software tools used to supply actionable data to individuals and organizations. These analytical software tools include content analysis tools, CRM analytics, advanced analytics (standalone and embedded), data warehouse generation, data warehouse management, end-user queries, reporting and analysis software, financial performance and strategy management applications, production planning analytics, services operations analytics, spatial information analytics, supply chain analytics and workforce analytics. Calculation: per Total IT Spending
IoT InvestmentInvestment in IoT products including intelligent systems, IoT devices, IoT purpose-built platforms, and IoT-related infrastructure and services. Weighted against the size of the population.Calculation: per capita
measures current levels of supply for ICT products and services.
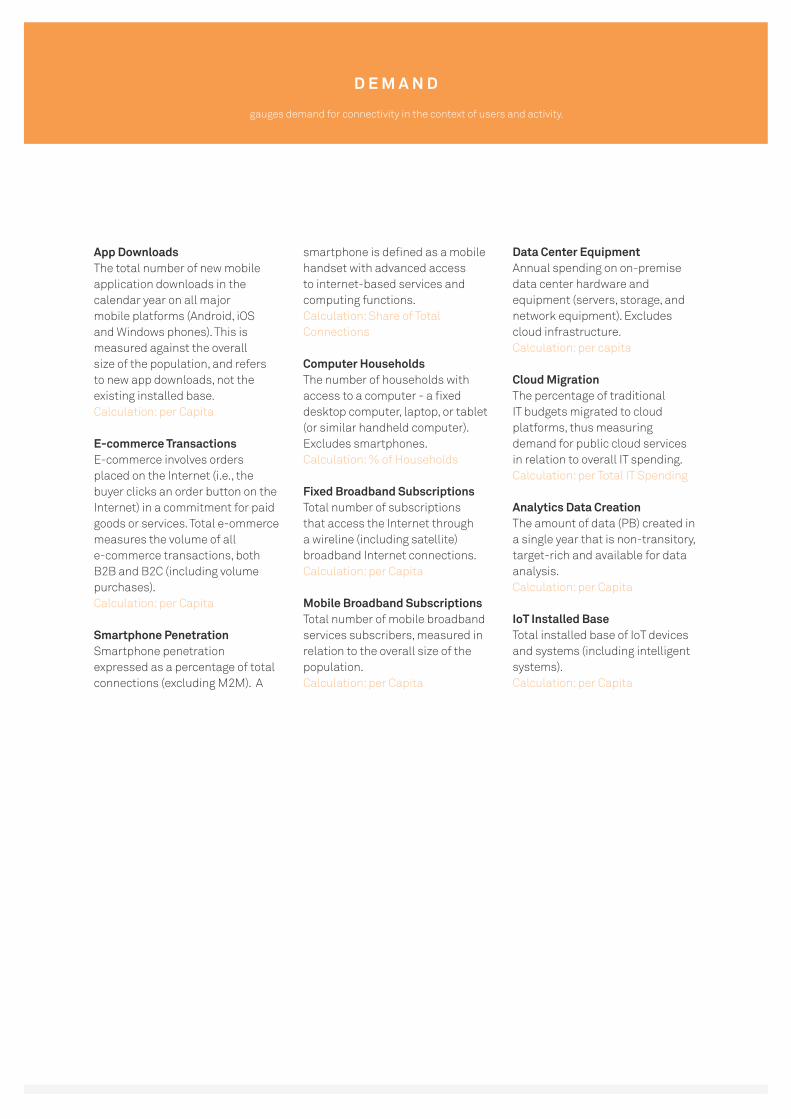
88
D E M A N D
App DownloadsThe total number of new mobile application downloads in the calendar year on all major mobile platforms (Android, iOS and Windows phones). This is measured against the overall size of the population, and refers to new app downloads, not the existing installed base. Calculation: per Capita
E-commerce TransactionsE-commerce involves orders placed on the Internet (i.e., the buyer clicks an order button on the Internet) in a commitment for paid goods or services. Total e-ommerce measures the volume of all e-commerce transactions, both B2B and B2C (including volume purchases). Calculation: per Capita
Smartphone PenetrationSmartphone penetration expressed as a percentage of total connections (excluding M2M). A
smartphone is defined as a mobile handset with advanced access to internet-based services and computing functions. Calculation: Share of Total Connections
Computer Households The number of households with access to a computer - a fixed desktop computer, laptop, or tablet (or similar handheld computer). Excludes smartphones. Calculation: % of Households
Fixed Broadband SubscriptionsTotal number of subscriptions that access the Internet through a wireline (including satellite) broadband Internet connections.Calculation: per Capita
Mobile Broadband SubscriptionsTotal number of mobile broadband services subscribers, measured in relation to the overall size of the population. Calculation: per Capita
Data Center EquipmentAnnual spending on on-premise data center hardware and equipment (servers, storage, and network equipment). Excludes cloud infrastructure. Calculation: per capita
Cloud MigrationThe percentage of traditional IT budgets migrated to cloud platforms, thus measuring demand for public cloud services in relation to overall IT spending. Calculation: per Total IT Spending
Analytics Data CreationThe amount of data (PB) created in a single year that is non-transitory, target-rich and available for data analysis. Calculation: per Capita
IoT Installed BaseTotal installed base of IoT devices and systems (including intelligent systems). Calculation: per Capita
gauges demand for connectivity in the context of users and activity.
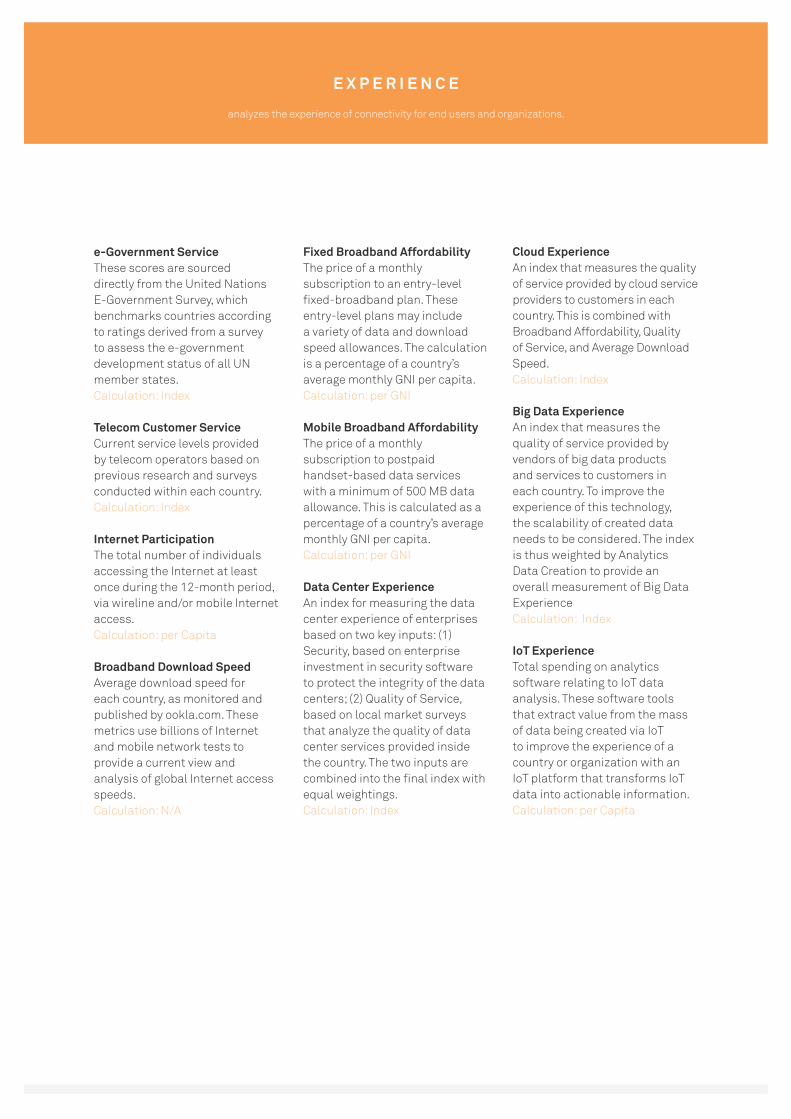
89
E X P E R I E N C E
e-Government ServiceThese scores are sourced directly from the United Nations E-Government Survey, which benchmarks countries according to ratings derived from a survey to assess the e-government development status of all UN member states. Calculation: Index
Telecom Customer ServiceCurrent service levels provided by telecom operators based on previous research and surveys conducted within each country. Calculation: Index
Internet ParticipationThe total number of individuals accessing the Internet at least once during the 12-month period, via wireline and/or mobile Internet access. Calculation: per Capita
Broadband Download SpeedAverage download speed for each country, as monitored and published by ookla.com. These metrics use billions of Internet and mobile network tests to provide a current view and analysis of global Internet access speeds. Calculation: N/A
Fixed Broadband AffordabilityThe price of a monthly subscription to an entry-level fixed-broadband plan. These entry-level plans may include a variety of data and download speed allowances. The calculation is a percentage of a country’s average monthly GNI per capita.Calculation: per GNI
Mobile Broadband AffordabilityThe price of a monthly subscription to postpaid handset-based data services with a minimum of 500 MB data allowance. This is calculated as a percentage of a country’s average monthly GNI per capita.Calculation: per GNI
Data Center ExperienceAn index for measuring the data center experience of enterprises based on two key inputs: (1) Security, based on enterprise investment in security software to protect the integrity of the data centers; (2) Quality of Service, based on local market surveys that analyze the quality of data center services provided inside the country. The two inputs are combined into the final index with equal weightings. Calculation: Index
Cloud ExperienceAn index that measures the quality of service provided by cloud service providers to customers in each country. This is combined with Broadband Affordability, Quality of Service, and Average Download Speed. Calculation: Index
Big Data ExperienceAn index that measures the quality of service provided by vendors of big data products and services to customers in each country. To improve the experience of this technology, the scalability of created data needs to be considered. The index is thus weighted by Analytics Data Creation to provide an overall measurement of Big Data Experience Calculation: Index
IoT ExperienceTotal spending on analytics software relating to IoT data analysis. These software tools that extract value from the mass of data being created via IoT to improve the experience of a country or organization with an IoT platform that transforms IoT data into actionable information. Calculation: per Capita
analyzes the experience of connectivity for end users and organizations.
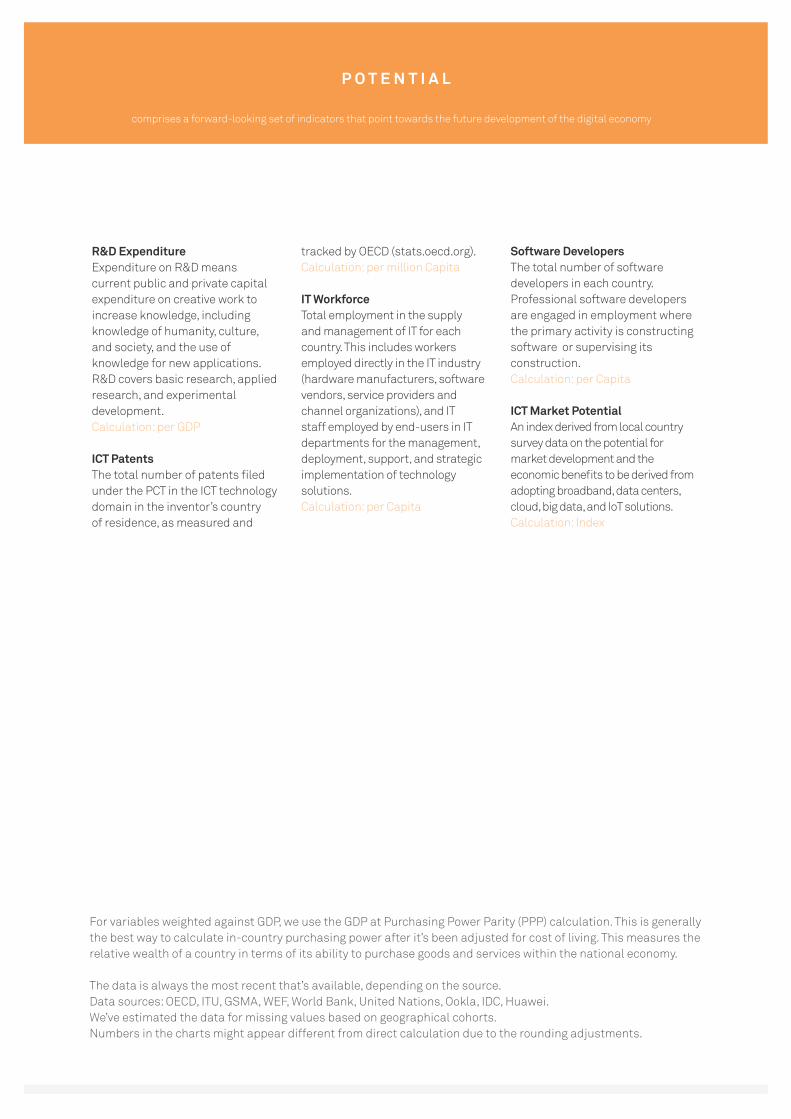
90
P O T E N T I A L
R&D ExpenditureExpenditure on R&D means current public and private capital expenditure on creative work to increase knowledge, including knowledge of humanity, culture, and society, and the use of knowledge for new applications. R&D covers basic research, applied research, and experimental development. Calculation: per GDP
ICT Patents The total number of patents filed under the PCT in the ICT technology domain in the inventor’s country of residence, as measured and
tracked by OECD (stats.oecd.org). Calculation: per million Capita
IT WorkforceTotal employment in the supply and management of IT for each country. This includes workers employed directly in the IT industry (hardware manufacturers, software vendors, service providers and channel organizations), and IT staff employed by end-users in IT departments for the management, deployment, support, and strategic implementation of technology solutions. Calculation: per Capita
Software DevelopersThe total number of software developers in each country. Professional software developers are engaged in employment where the primary activity is constructing software or supervising its construction. Calculation: per Capita
ICT Market Potential An index derived from local country survey data on the potential for market development and the economic benefits to be derived from adopting broadband, data centers, cloud, big data, and IoT solutions. Calculation: Index
comprises a forward-looking set of indicators that point towards the future development of the digital economy
For variables weighted against GDP, we use the GDP at Purchasing Power Parity (PPP) calculation. This is generally the best way to calculate in-country purchasing power after it’s been adjusted for cost of living. This measures the relative wealth of a country in terms of its ability to purchase goods and services within the national economy.
The data is always the most recent that’s available, depending on the source. Data sources: OECD, ITU, GSMA, WEF, World Bank, United Nations, Ookla, IDC, Huawei.We’ve estimated the data for missing values based on geographical cohorts.Numbers in the charts might appear different from direct calculation due to the rounding adjustments.

91
F R E Q U E N T L Y A S K E D Q U E S T I O N S
Q1: Why did Huawei create the GCI?
A1: Countries are increasingly aware that a solid digital infrastructure is the key to sustainable economic growth. With this in mind, Huawei began researching and releasing GCI reports in 2014.
The GCI provides a comprehensive and objective assessment of a country’s connectivity from both a national and business perspective, and assesses the current status, future trends, and challenges associated with digital transformation. It quantifies the value that connectivity generates for a country’s transformation into a digital economy, and serves as a reference for regional and national policy makers.
Huawei collaborates with leading universities, think tanks, and industry associations to provide an authoritative, objective, and quantitative assessment of how countries and industries are progressing with digital transformation.
2016 marks the third year that Huawei has released the GCI.
Q2: How is Huawei’s GCI different than other leading indexes?
A2: Huawei has developed a unique research model for the GCI comprising 40 indicators that can be analyzed in terms of four economic pillars and five technology enablers. Based on these 40 indicators, the GCI fully and objectively measures, analyzes, and forecasts the tracked economies; quantifies the digital transformation journey they’re undergoing; and provides a reference tool for policy makers.
The four economic pillars are ICT Supply, Demand, Experience, and Potential.
The five technology enablers are broadband, data centers, cloud services, big data, and the Internet of Things (IoT).
Q3: How has the GCI 2016 changed from GCI 2015?
A3: GCI 2016 continues on from GCI 2015, but it has two new indicators bringing the total up to 40. It also includes updated definitions (e.g., replacing 3G coverage with 4G coverage) based on advances in ICT.
Definitions of ICT maturity have been added that describe
the features of countries at different innovation stages through measurable indicators. For example, 4G coverage in the Foundation Innovation stage is less than 10% and ICT 4G spending less than 2 % of GDP. Therefore, these countries need to focus on building their ICT infrastructure.
Q4: What are the key findings of GCI 2016?
A4: 1. Digital infrastructure can promote sustainable
economic growth. A one-point increase in a country’s GCI rating correlates to the following increases: competitiveness, 2.1%; innovation, 2.2%; and productivity, 2.3%.
2. Most countries are on the road to realizing a digital economy, with the average score of the 50 countries in GCI 2016 increasing by two points (5%) compared with 2015. Developed economies saw the greatest increases, indicating a growing digital divide.
3. A score of 35 is the tipping point for a country during transformation into a digital economy. At this point, nations enter the fast track of digital economic development. They mainly focus on adopting cloud computing, building faster broadband networks, and exploring new business models through digital technologies.
4. The widespread adoption of the five key enablers (broadband, data centers, cloud computing, big data, and IoT) will propel national digital transformation. Countries need to develop ICT solutions based on their specific circumstances. Although there are no shortcuts on the digital economy journey, countries can invest in and use new technologies to speed up digital transformation.
5. The digital economy requires balanced development in supply, demand, experience, and potential. Countries with different levels of connectivity should have different development focuses.
6. GCI 2016 reveals that investing in broadband is the main requirement for industries to build a digital economy.
Q5: How have country rankings changed from last year?
A5: Twelve countries improved their standing, while four experienced a drop. The countries that improved their standing can thank sustained ICT investment, which has
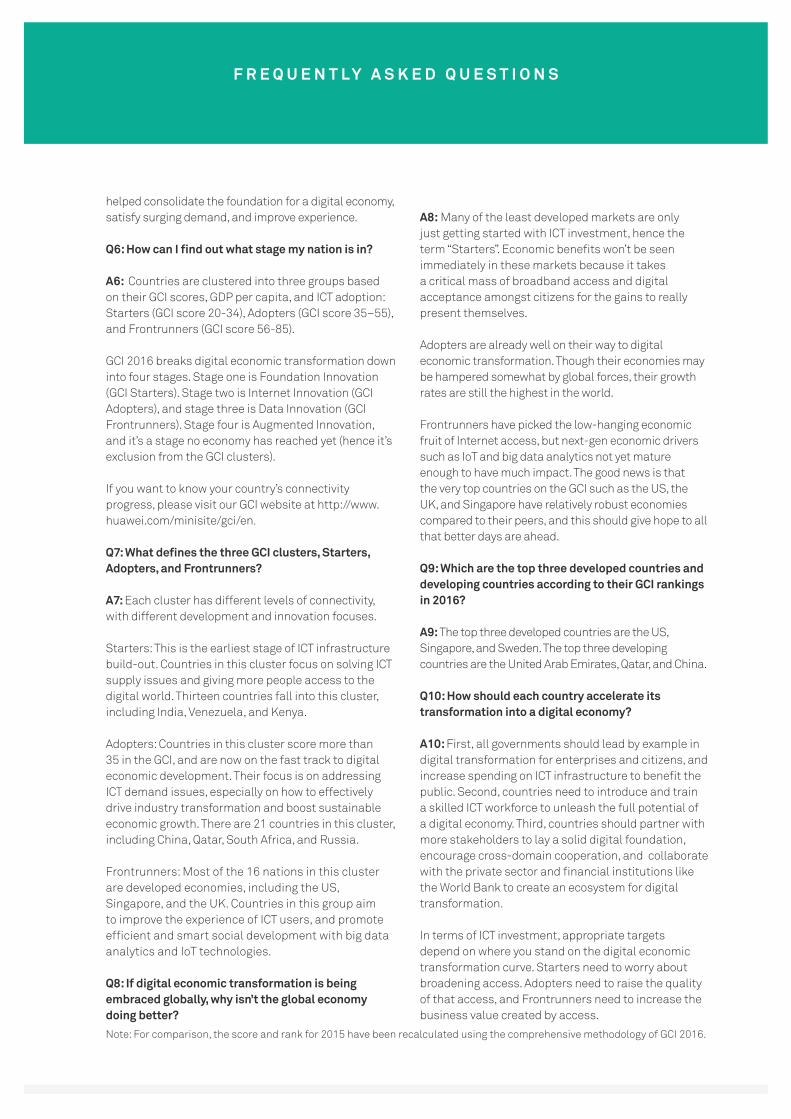
92
F R E Q U E N T L Y A S K E D Q U E S T I O N S
helped consolidate the foundation for a digital economy, satisfy surging demand, and improve experience.
Q6: How can I find out what stage my nation is in?
A6: Countries are clustered into three groups based on their GCI scores, GDP per capita, and ICT adoption: Starters (GCI score 20-34), Adopters (GCI score 35–55), and Frontrunners (GCI score 56-85).
GCI 2016 breaks digital economic transformation down into four stages. Stage one is Foundation Innovation (GCI Starters). Stage two is Internet Innovation (GCI Adopters), and stage three is Data Innovation (GCI Frontrunners). Stage four is Augmented Innovation, and it’s a stage no economy has reached yet (hence it’s exclusion from the GCI clusters).
If you want to know your country’s connectivity progress, please visit our GCI website at http://www.huawei.com/minisite/gci/en.
Q7: What defines the three GCI clusters, Starters, Adopters, and Frontrunners?
A7: Each cluster has different levels of connectivity, with different development and innovation focuses.
Starters: This is the earliest stage of ICT infrastructure build-out. Countries in this cluster focus on solving ICT supply issues and giving more people access to the digital world. Thirteen countries fall into this cluster, including India, Venezuela, and Kenya.
Adopters: Countries in this cluster score more than 35 in the GCI, and are now on the fast track to digital economic development. Their focus is on addressing ICT demand issues, especially on how to effectively drive industry transformation and boost sustainable economic growth. There are 21 countries in this cluster, including China, Qatar, South Africa, and Russia.
Frontrunners: Most of the 16 nations in this cluster are developed economies, including the US, Singapore, and the UK. Countries in this group aim to improve the experience of ICT users, and promote efficient and smart social development with big data analytics and IoT technologies.
Q8: If digital economic transformation is being embraced globally, why isn’t the global economy doing better?
A8: Many of the least developed markets are only just getting started with ICT investment, hence the term “Starters”. Economic benefits won’t be seen immediately in these markets because it takes a critical mass of broadband access and digital acceptance amongst citizens for the gains to really present themselves.
Adopters are already well on their way to digital economic transformation. Though their economies may be hampered somewhat by global forces, their growth rates are still the highest in the world.
Frontrunners have picked the low-hanging economic fruit of Internet access, but next-gen economic drivers such as IoT and big data analytics not yet mature enough to have much impact. The good news is that the very top countries on the GCI such as the US, the UK, and Singapore have relatively robust economies compared to their peers, and this should give hope to all that better days are ahead.
Q9: Which are the top three developed countries and developing countries according to their GCI rankings in 2016?
A9: The top three developed countries are the US, Singapore, and Sweden. The top three developing countries are the United Arab Emirates, Qatar, and China.
Q10: How should each country accelerate its transformation into a digital economy?
A10: First, all governments should lead by example in digital transformation for enterprises and citizens, and increase spending on ICT infrastructure to benefit the public. Second, countries need to introduce and train a skilled ICT workforce to unleash the full potential of a digital economy. Third, countries should partner with more stakeholders to lay a solid digital foundation, encourage cross-domain cooperation, and collaborate with the private sector and financial institutions like the World Bank to create an ecosystem for digital transformation.
In terms of ICT investment, appropriate targets depend on where you stand on the digital economic transformation curve. Starters need to worry about broadening access. Adopters need to raise the quality of that access, and Frontrunners need to increase the business value created by access.
F R E Q U E N T L Y A S K E D Q U E S T I O N S
Note: For comparison, the score and rank for 2015 have been recalculated using the comprehensive methodology of GCI 2016.

93
R E F E R E N C E S
https://ec.europa.eu/digital-single-market/en/desi
http://www.cnbc.com/2016/01/18/imf-cuts-global-outlook-sees-gradual-growth-in-2016.html
http://www.cnbc.com/2016/01/18/imf-cuts-global-outlook-sees-gradual-growth-in-2016.html
http://reports.weforum.org/global-competitiveness-report-2015-2016/
https://www.globalinnovationindex.org/content/page/GII-Home
http://www3.weforum.org/docs/WEFUSA_DigitalInfrastructure_Report2015.pdf
http://www.gsmamobileeconomy.com/GSMA_Global_Mobile_Economy_Report_2015.pdf
http://www.gsmamobileeconomy.com/GSMA_Global_Mobile_Economy_Report_2015.pdf
http://www.gsmamobileeconomy.com/GSMA_Global_Mobile_Economy_Report_2015.pdf
http://www.bjreview.com.cn/nation/txt/2015-02/16/content_669132_2.htm
http://uk.reuters.com/article/ntt-communications-idUSnBw086821a+100+BSW20151209
http://www.idc.com/getdoc.jsp?containerId=prUS40960516
http://www3.weforum.org/docs/WEFUSA_DigitalInfrastructure_Report2015.pdf
http://www3.weforum.org/docs/WEFUSA_DigitalInfrastructure_Report2015.pd
i
ii
iii
iv
v
vi
vii
viii
ix
x
xi
xii
xiii

Global Connectivity Index 2016 benchmarks where a country stands on the transformation journey into a digital economy. More importantly, it’s a tool that will help you see the connections that matter, and empower you to take action based on that intelligence.
Copyright © 2016 Huawei Technologies Co., Ltd. All rights reserved.


![SIGNATURES LORUS THERAPEUTICS INC. ANNUAL REPORT … · lorus therapeutics inc. annual report 2003 [being strong where it counts graphic] being strong where it counts lorus mission](https://img.dokumen.tips/doc/110x75/5f8f533e47778021d723def8/signatures-lorus-therapeutics-inc-annual-report-lorus-therapeutics-inc-annual.jpg)