Embed Size (px)
Citation preview
December 2000
© 2000, Elsevier Science Inc., 1040-6190/00/$–see front matter PII S1040-6190(00)00166-4
21
Congestion Pricing: Is a Load Flow-Based Pricing Approach Appropriate?
The move toward open markets and unbundling of transmission services has resulted in the need to assess the impact of a particular generator or load on the power system. The Line Flow Splitting method proposed here—which splits a given load flow into individual consumer load flows and allocates the ensuing congestion costs by extent of use—may serve as a load-flow-based cost allocation concept for congestion management.
Cornelia Kawann and Manfred Sakulin
I. Introduction
n a changing industry, system inputs such as generation and
demand may have significantly different patterns than in a regu-lated industry. If the transmission network is not congested, power is a commodity. When the full incen-tives of the market take hold, how-ever, patterns of network use may change rapidly and what has been an apparently uncongested and unconstrained system may shift in short order to one in which
congestion is an immediate and significant issue.
The resulting externalities require the independent system operator (ISO) to intervene in the market to assure that physical operations are consistent with transmission constraints. The most common, and ostensibly easiest way, to manage congestion is for the ISO to buy and sell energy as needed to relieve the congestion, and pass the costs through to all loads in a general system charge or uplift.
1
Cornelia Kawann
holds a position asa research and teaching assistant at
Graz University of Technology inAustria. She received her M.S.
in electrical engineering and Ph.D. inelectrical power systems from the Graz
University of Technology in Austria.She wrote this article while on a
sabbatical summer internship at theErnest Orlando Lawrence Berkeley
National Laboratory.
Manfred Sakulin
is SeniorResearcher and Vice Chairman of the
Department for Electric PowerSystems at Graz University of
Technology. He specializes primarily inthe fields of energy efficiency, power
quality, and reliability of
power systems.
I
22
© 2000, Elsevier Science Inc., 1040-6190/00/$–see front matter PII S1040-6190(00)00166-4
The Electricity Journal
However, because the real net-work utilization results from energy injections into, and with-drawals from, the grid, it is obvi-ous that the congestion fee should be—at least partly—based on actual utilization. The difficulty of this approach results from the fact that the grid as a whole takes part in transmission, even if only a sim-ple transaction between two points is considered. As a solution to this problem, we propose a Line Flow Splitting method that splits a pre-calculated load-flow and allocates the congestion costs according to individual consumer load flows.
2
A. Definitions
Congestion can be defined as the inability of the transmission sys-tem to accommodate the energy flows arising from an uncon-strained market settlement. Con-gestion may occur for several rea-sons, such as: (1) outages of generators, consumers or trans-mission facilities; (2) major changes in load flow situations due to increasing exports, imports and transits; or (3) loop flows. An extreme position is to only qualify as congestion a situation in which one has to curtail load. It is vital to measure congestion in an econom-ically useful way in order to give a meaningful price signal.
3
B. Transmission Capacity
Transmission capacity may vary over the seasons and according to the availability of equipment. However, in normal periods of operation, when all the transmis-sion lines are available, the trans-mission capacity from one region
to another depends critically on the configuration of load and gen-eration. Transmission networks are normally built and operated on the basis of security standards that specify the types of contingencies the system should be able to with-stand without causing a loss of supply to customers or a further security degradation. Generally, system operators manage their system according to the (
n
2
1) security-constrained dispatch. The
because of a specific contingency (e.g., a line or transformer). The need to be ready for the next con-tingency, more than current condi-tions, dominates the design and operation of transmission net-works.
4
Therefore, it is usually not the present flow through a line or transformer that limits allowable power transfers but rather the flow that would occur if another ele-ment fails, called (
n
2
1)-criterion.The calculation of transmission
capacity is therefore very com-plex. The capacity constraints on the transmission network—the key to achieving most of the eco-nomic benefits promised by restructuring—affect competition in electricity generation.
C. Transmission Before Deregulation
Monopolistic utilities invariably say that grid congestion is not a serious problem on their system, and they are usually right in the sense that grid congestion is easy to manage for a monopolist that controls all the generation on the system. The monopoly dispatcher simply instructs some plants to produce a bit more and some to pro-duce a bit less until the system is balanced within transmission con-straints, and none of them have much reason to resist because they all work for the same company and all costs are pooled. But things are very different in a competitive system, where affected power plants will resist requests to pro-duce more or less than the amount that maximizes their profits at the prevailing market prices.
With overcapacity in electric
Congestion occursmost frequently
because ofcontingency analysis
rather than current
line flows.
flow in all lines is kept away from the threshold by the need to retain a feasible dispatch in case of con-tingency. Other complications lie in the nature of the grid’s con-straints. Voltage constraints can be highly nonlinear, stability con-straints can apply to many lines at once, and first-contingency con-straints can multiply the number of physical constraints.
ongestion is not always related to the actual flows on
lines; it occurs most frequently because of contingency analysis rather than current line flows. The generation dispatch is modified because a line will overload
C
December 2000
© 2000, Elsevier Science Inc., 1040-6190/00/$–see front matter PII S1040-6190(00)00166-4
23
transmission, generation trading will tend to extend to wider geo-graphic regions. Less transmission expansion will lead to more grid constraints and increased conges-tion prices. Traditionally, transmis-sion upgrade decisions were domi-nated by local need, and pricing for wholesale transmission ser-vices was a secondary concern. With an increasingly open market, third-party uses of the transmis-sion system will predominate over time. Within the liberalized mar-ket, the transmitting utility is required to provide wholesale transmission services at rates, charges, terms, and conditions that permit the recovery of all costs incurred in connection with trans-mission and necessary associated services. These include any bene-fits to the transmission system of providing the transmission ser-vice, and the costs of any enlarge-ment of transmission facilities.
II. Transmission Congestion Pricing
As regional markets become more integrated, locational trans-mission prices that reflect trans-mission congestion will be ines-capable. Aside from congestion and its potential cost, there needs to be an identification process well before congestion actually affects operation of the system. This infor-mation can be used to report con-gestion and to compute nodal prices.
5
Hence, transmission prices should vary by location, reflecting transmission congestion. All sys-tem users, whether trading in the spot market or under bilateral con-
tracts, should pay these congestion prices. The need for congestion pricing will only increase as elec-tricity markets mature.
he physical transmission capacity of the electric net-
work depends on the loads, and so do the costs. Consumers should be confronted with prices that reflect the costs of their deci-sions, no more and no less. In the absence of transmission capacity constraints, the cost of transmis-
cated among all network partici-pants. This can be done with the Line Flow Splitting method, which is of a topological nature and works on the results of a load flow program. This method splits the load flows on each line in a meshed network, as is discussed in more detail in the next section.
III. The Line Flow Splitting Method
In general, the individual techni-cal and physical use of a meshed network is difficult to define, because the load flows result from the sum of all injections and with-drawals. Normally, a load-flow analysis is the solution of the nodal equations, subject to various constraints, in establishing the node voltage. At the same time, generator power outputs, trans-former tap settings, and branch power flows taken by voltage-sensitive loads are also deter-mined. But since injections and withdrawals from a transmission system do not affect that system equally, a better analogy is needed to properly identify and define transmission impacts. This model introduces a simple method of transmission service valuation based on a topological analysis of power flows in the network.
6
A. Model development
The Line Flow Splitting method investigated in this study allocates the usage of the transmission sys-tem on the basis of physically mea-surable and computable active power flows. An AC load flow cal-culation is used, in which the reac-
There needs to be an identification process well before congestion actually affects operation
of the system.
sion consists solely of the fixed cost and the line losses that occur during the transmission process. In the presence of transmission capacity constraints, however, congestion cost can be seen as an operational cost combined with a risk function of interruption. It can also include the cost of out-of-merit dispatch of generating units. Capacity constraints require replacement of cheap power with expensive power. Congestion costs are related to costs arising from the removal of constraints by intervention.
For that reason it is suggested that all congestion costs be allo-
T
24
© 2000, Elsevier Science Inc., 1040-6190/00/$–see front matter PII S1040-6190(00)00166-4
The Electricity Journal
tive power flows are not taken into account. This approach was taken because it is commonly used to determine congestion fees based on real power only.
he aim of this model is to indi-cate the rate of usage of each
customer on any transmission facility for a given, already-calcu-lated load flow. The quantities, which in fact do reflect the utiliza-tion, are the currents in the branches of the network. It can be shown
7
that the branch currents are a lin-ear combination of the port cur-rents (represented by generators and loads). Equation (3) in note 7 offers the basis by which to split the load flow on each line accord-ing to the in- and out-flowing port currents (generators and loads).
Having established the condi-tions for a certain load flow, the usage of each branch is appor-tioned among the loads that con-
tribute to this flow. These contribu-tions are determined by the assumption that every consumer is supplied proportionally by every generator. In that way it considers the option value of generation plus the option value of the network.
B. Individual Consumer Load Flows
For a numerical example, the procedure is described in two four-node models linked by an inter-connection line. All lines have identical electric characteristics and thermal limits (hereafter called the threshold) of 1,000 A, with the exception of the intercon-nection line, that has a threshold of 500 A. There are four plants located at the four upper nodes. For the sake of simplicity, these plants are referred to by the index of their location and their produc-tion
P
i
, where
i
5
A
,
B
,
E,
or
F
.
Power flows and transmission losses are modeled using an AC load flow model with
generator A
designated as the slack bus.
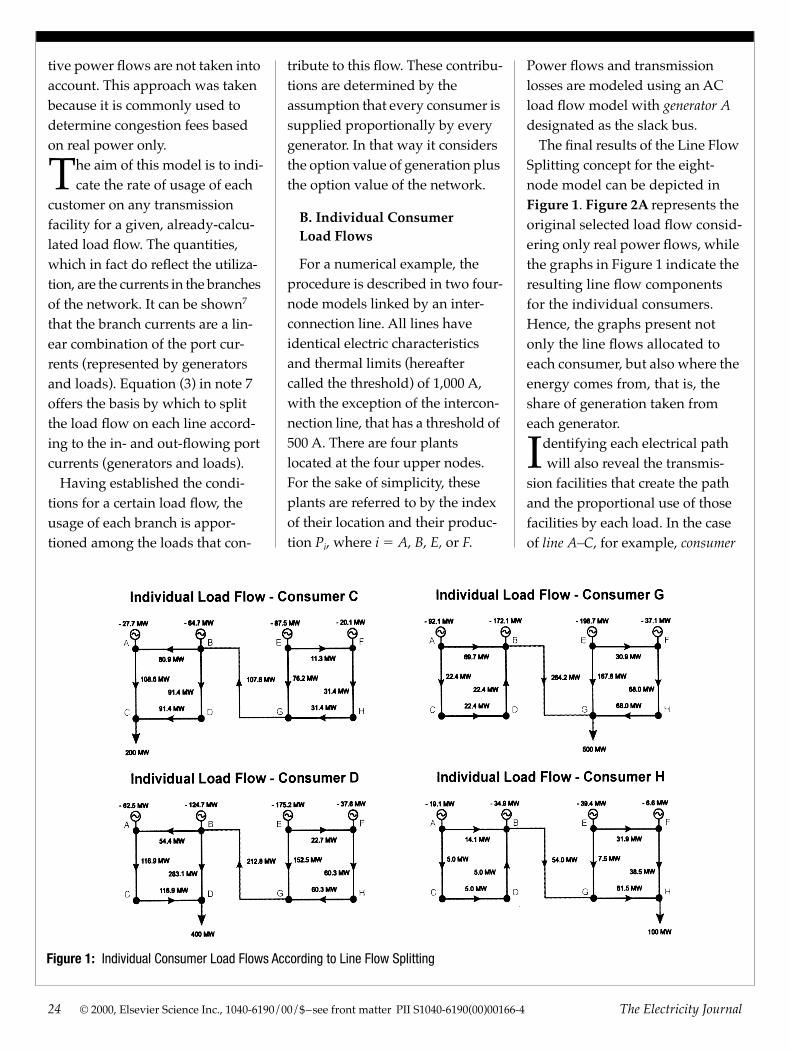
The final results of the Line Flow Splitting concept for the eight-node model can be depicted in
Figure 1
.
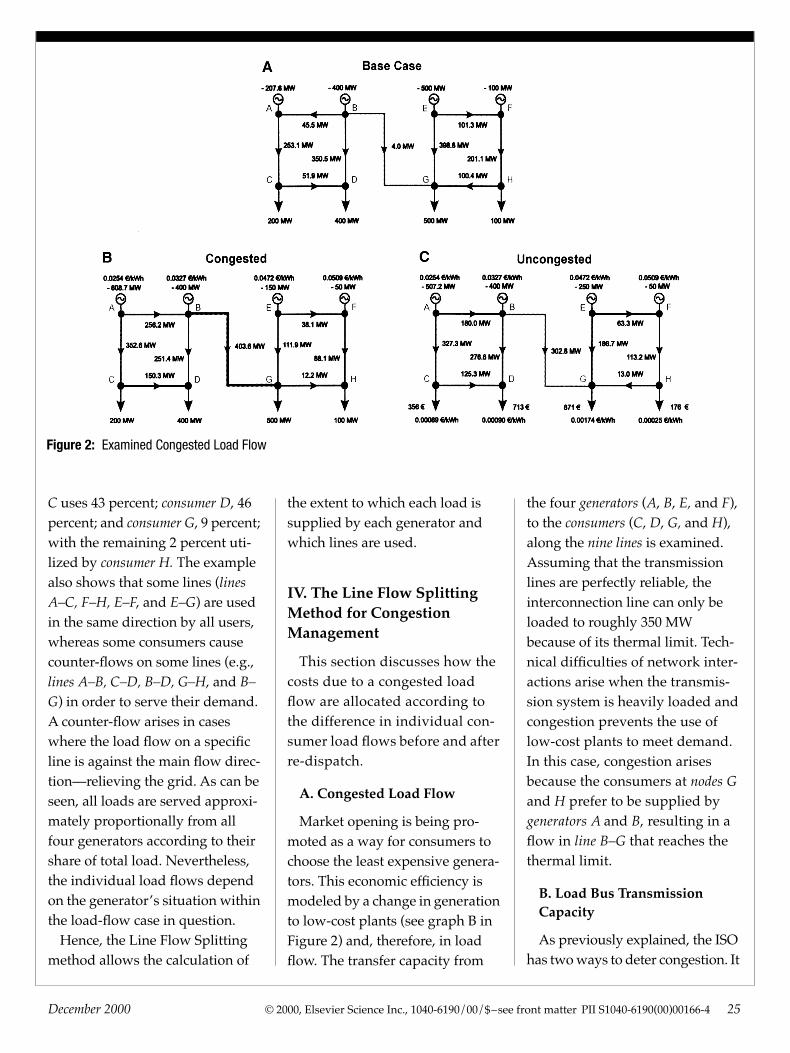
Figure 2A
represents the original selected load flow consid-ering only real power flows, while the graphs in Figure 1 indicate the resulting line flow components for the individual consumers. Hence, the graphs present not only the line flows allocated to each consumer, but also where the energy comes from, that is, the share of generation taken from each generator.
dentifying each electrical path will also reveal the transmis-
sion facilities that create the path and the proportional use of those facilities by each load. In the case of
line
A–C
, for example,
consumer
Figure 1: Individual Consumer Load Flows According to Line Flow Splitting
T
I
December 2000
© 2000, Elsevier Science Inc., 1040-6190/00/$–see front matter PII S1040-6190(00)00166-4
25
C
uses 43 percent;
consumer D
, 46 percent; and
consumer G
, 9 percent; with the remaining 2 percent uti-lized by
consumer H.
The example also shows that some lines (
lines A–C, F–H, E–F
, and
E–G
) are used in the same direction by all users, whereas some consumers cause counter-flows on some lines (e.g.,
lines A–B, C–D, B–D, G–H
, and
B–G
) in order to serve their demand. A counter-flow arises in cases where the load flow on a specific line is against the main flow direc-tion—relieving the grid. As can be seen, all loads are served approxi-mately proportionally from all four generators according to their share of total load. Nevertheless, the individual load flows depend on the generator’s situation within the load-flow case in question.
Hence, the Line Flow Splitting method allows the calculation of
the extent to which each load is supplied by each generator and which lines are used.
IV. The Line Flow Splitting Method for Congestion Management
This section discusses how the costs due to a congested load flow are allocated according to the difference in individual con-sumer load flows before and after re-dispatch.
A. Congested Load Flow
Market opening is being pro-moted as a way for consumers to choose the least expensive genera-tors. This economic efficiency is modeled by a change in generation to low-cost plants (see graph B in Figure 2) and, therefore, in load flow. The transfer capacity from
the four
generators
(
A
,
B
,
E,
and
F
), to the
consumers
(
C
,
D
,
G,
and
H
), along the
nine lines
is examined. Assuming that the transmission lines are perfectly reliable, the interconnection line can only be loaded to roughly 350 MW because of its thermal limit. Tech-nical difficulties of network inter-actions arise when the transmis-sion system is heavily loaded and congestion prevents the use of low-cost plants to meet demand. In this case, congestion arises because the consumers at
nodes G
and
H
prefer to be supplied by
generators A
and
B
, resulting in a flow in
line B–G
that reaches the thermal limit.
B. Load Bus Transmission Capacity
As previously explained, the ISO has two ways to deter congestion. It
Figure 2: Examined Congested Load Flow
26
© 2000, Elsevier Science Inc., 1040-6190/00/$–see front matter PII S1040-6190(00)00166-4
The Electricity Journal
can either curtail load or alter the given dispatch by restricting some generators’ dispatch. However, in both cases it must know the influ-ence of each network participant on the network and the load flow situ-ation. It is important to measure the actual flows and voltages in the net-work in order to capture the indi-vidual contribution of each transac-tion to each constraint. For that reason, the Load Bus Transmission Capacity (LBTC) is introduced. The LBTC is the real power received at a given network bus, at 1 MW above a given operating point, that can be securely transmitted through the network from all system generation buses. The LBTC defines the 1 MW incremental load that can be sup-plied by each generator to a partic-ular
bus, i.
Each generator is assumed to be free within its indi-vidual limits of operation.
n defining LBTC, it is assumed that the load at
bus i
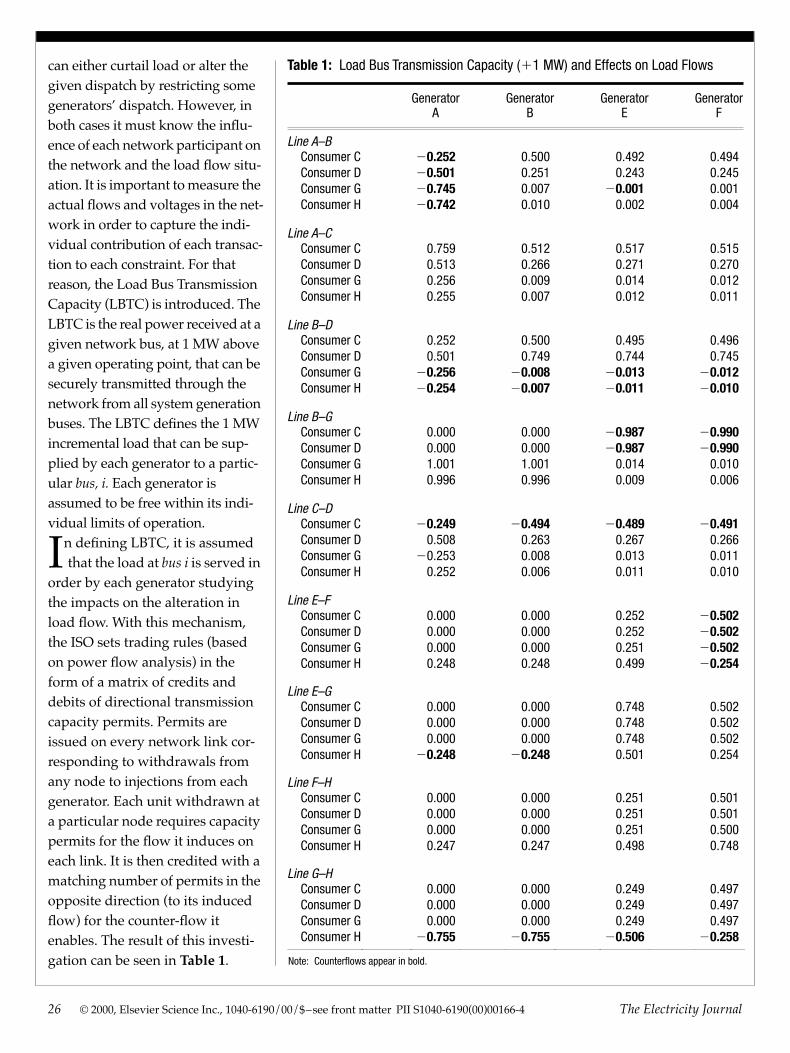
is served in order by each generator studying the impacts on the alteration in load flow. With this mechanism, the ISO sets trading rules (based on power flow analysis) in the form of a matrix of credits and debits of directional transmission capacity permits. Permits are issued on every network link cor-responding to withdrawals from any node to injections from each generator. Each unit withdrawn at a particular node requires capacity permits for the flow it induces on each link. It is then credited with a matching number of permits in the opposite direction (to its induced flow) for the counter-flow it enables. The result of this investi-gation can be seen in
Table 1
.
Table 1:
Load Bus Transmission Capacity (
1
1 MW) and Effects on Load Flows
GeneratorA
GeneratorB
GeneratorE
GeneratorF
Line A–B
Consumer C
2
0.252
0.500 0.492 0.494Consumer D
2
0.501
0.251 0.243 0.245Consumer G
2
0.745
0.007
2
0.001
0.001Consumer H
2
0.742
0.010 0.002 0.004
Line A–C
Consumer C 0.759 0.512 0.517 0.515Consumer D 0.513 0.266 0.271 0.270Consumer G 0.256 0.009 0.014 0.012Consumer H 0.255 0.007 0.012 0.011
Line B–D
Consumer C 0.252 0.500 0.495 0.496Consumer D 0.501 0.749 0.744 0.745Consumer G
2
0.256
2
0.008
2
0.013
2
0.012
Consumer H
2
0.254
2
0.007
2
0.011
2
0.010
Line B–G
Consumer C 0.000 0.000
2
0.987
2
0.990
Consumer D 0.000 0.000
2
0.987 20.990Consumer G 1.001 1.001 0.014 0.010Consumer H 0.996 0.996 0.009 0.006
Line C–DConsumer C 20.249 20.494 20.489 20.491Consumer D 0.508 0.263 0.267 0.266Consumer G 20.253 0.008 0.013 0.011Consumer H 0.252 0.006 0.011 0.010
Line E–FConsumer C 0.000 0.000 0.252 20.502Consumer D 0.000 0.000 0.252 20.502Consumer G 0.000 0.000 0.251 20.502Consumer H 0.248 0.248 0.499 20.254
Line E–GConsumer C 0.000 0.000 0.748 0.502Consumer D 0.000 0.000 0.748 0.502Consumer G 0.000 0.000 0.748 0.502Consumer H 20.248 20.248 0.501 0.254
Line F–HConsumer C 0.000 0.000 0.251 0.501Consumer D 0.000 0.000 0.251 0.501Consumer G 0.000 0.000 0.251 0.500Consumer H 0.247 0.247 0.498 0.748
Line G–HConsumer C 0.000 0.000 0.249 0.497Consumer D 0.000 0.000 0.249 0.497Consumer G 0.000 0.000 0.249 0.497Consumer H 20.755 20.755 20.506 20.258
Note: Counterflows appear in bold.
I
December 2000 © 2000, Elsevier Science Inc., 1040-6190/00/$–see front matter PII S1040-6190(00)00166-4 27
The positive and negative fig-ures in Table 1 indicate the impact of the individual loads and genera-tors on the load flow of each line. Looking at line B–G, for example, shows that only the reduction of generation in node E and F or a decrease of consumption in node G and H can be used to relieve con-gestion on this line. The numbers can be used to select the most appropriate (that is, the one with the highest influence) combination in case several options are avail-able. This means, for this example, that an increase of the output of generator F has a higher impact to release the congestion on line B–G than generator E, but the produc-tion costs of generator F are higher.
C. Re-dispatch
The system operator manages the grid in a secure way to ensure that excessive line loading is nor-mally avoided. The aforemen-tioned changes (shown in Figure 2B), however, lead to transmission constraints which require some form of coordination to maintain system security and efficiency.8 To model this phenomenon, the ISO has to manage the out-of-merit dis-patch. If the ISO does not want to curtail load, there is no choice but to generate more power with gen-erators E and F, and reduce the gen-eration at nodes A and B; otherwise the power flow along line B–G will exceed the maximum thermal limit. This change in dispatch will result in additional cost (conges-tion cost) of approximately 2,100 euros per hour. This sum reflects the cost incurred by the network operator in rearranging the gener-
ation pattern toward buses E and F and away from generation at buses A and B, in order to meet the trans-mission line B–G capacity con-straint. The extent to which the utility has to rearrange the genera-tion pattern to meet the flow con-straint can be appreciated in Fig-ure 2C, which shows line flows with generation re-dispatch.
In order to achieve efficient use of the transmission system, while respecting the constraints of reli-
parties is a complicated matter.9 The benefit that generators and consumers derive from the system is not a simple function of the amount of power that they inject or extract from the network. Whenever they are connected to the system, they make use of an infrastructure which was designed not only to transport power, but to do so securely and under extreme conditions.
onsequently, each user caus-ing contingency situations
should pay its “fair share” of the cost of releasing these constraints. If the generation is adjusted on the basis of an economic dispatch, constraints can occur in some branches. Hence, in order to remove congestion the genera-tion dispatch has to be changed. This results in additional cost that must be allocated among the users responsible for the conges-tion. Surcharges for transactions across congested areas could be introduced in order to give direct incentives to relieve congestion.
In terms of the eight-bus exam-ple, the congestion costs are allo-cated among the users according to their relative impact on conges-tion. In this case only line B–G is congested. This relative impact can be measured by observing the change in load flow on the con-gested line(s) according to re-dispatch or curtailments to flow schedules. With the Line Flow Splitting method the difference in each consumer load flow due to re-dispatch is determined and the congestion costs (determined in the previous section) are allocated among all network users accord-
ability, it becomes necessary to constantly monitor and accommo-date these interactions to match the pattern of load and achieve efficiency in the pattern of genera-tion. A generator or load-creating counter-flow on a congested link is entitled to get compensation when it relieves congestion. This type of tradeoff can be analyzed only by someone knowing all the uses of the system and, therefore, must be coordinated through the system operator.
D. Congestion Cost Allocation
The quantifying of the usage of a transmission system by different
A generator or load-creating counter-flow on a congested link is entitled to get compensation when it relieves congestion.
C
28 © 2000, Elsevier Science Inc., 1040-6190/00/$–see front matter PII S1040-6190(00)00166-4 The Electricity Journal
ingly. This results in congestion tariffs of 0.00089 Euro/kWh, 0.00090/kWh, 0.00174/kWh, and 0.00025/kWh for consumer C, D, G, and H, respectively (see Figure 2C), depending on their consumption. Loads that correspond to counter-flows and therefore reduce conges-tion are not given any credit.
This example shows that it is possible to implement nodal con-gestion charges. However, even with an eight-node system there are many ways of organizing sup-ply and demand and many ques-tions that are not addressed by this analysis. The numerical examples presented so far have focused on the variation of one parameter, namely generation output. However, congestion costs are also sensitive to changes in customer load and transmis-sion line availability. The actual capacity to move power will depend critically on the pattern of both loads and generation.
This eight-node model was
based on the assumption of a per-fectly reliable network. However, a more realistic system operation considers a dispatch satisfying the (n 2 1) security criterion. As the goal of this article was to explain the cost allocation procedure for congestion management according to the Line Flow Splitting method, a simple network configuration was selected. Because of the sim-plicity of the network any loss of any facility would automatically lead to an unsolvable load flow due to remaining overloaded lines and voltage problems in all nodes. A more realistic approach would con-sider double-line corridors, but this is beyond the scope of this study.
V. Conclusions
Historically, transmission grids were erected by vertically inte-grated electric utilities that per-formed the bundled merchant and transportation functions of provid-ing electricity for ultimate sale to
final customers (subject, of course, to public regulation of pricing and operations). In a monopolistic market, enhanced reliability pro-vided the usual motivation for development of the network. The grid owner had incentives to maxi-mize expansion investments, and in some systems the power qual-ity got too high. In a vertically integrated system, transmission congestion might be kept to a minimum by the monopolist and the incentives of pricing would have little or no effect. Therefore, some have argued that transmis-sion congestion is not a serious problem for the competitive market, but there are many signs to the contrary.
aced with transmission constraints, market prices
will sometimes differ substan-tially, reflecting the costs of sys-tem congestion from out-of-merit generation. The resulting trans-mission loss and congestion pric-ing provide the necessary signals
Even with an eight-node system there are many ways of organizing supply and demand.
F
December 2000 © 2000, Elsevier Science Inc., 1040-6190/00/$–see front matter PII S1040-6190(00)00166-4 29
for efficient use of the existing system and the proper incentives for efficient investment to locate new production or expand the transmission grid. The operation and central control of the grid should be limited to the techni-cal, and not the commercial, operation of the market. Genera-tion contracts between customers and producers can insure pro-ducer cash flow and provide the required support for financing new projects.10
That is why we have developed the Line Flow Splitting method for the allocation of congestion cost. Under this approach, the effective strategy employed by the network operator is one in which each consumer profits from the entire transmission net-work. Accordingly, each should contribute to relieving line load in the system. The routine calcu-lations involve simply comput-ing a set of load flows for differ-ent contingencies and checking the status of the various con-straints, without explicitly track-ing or decomposing the individ-ual transactions. Because of the network interactions, this implies that the capacity cannot be deter-mined by examining particular paths of individual transactions in the system. Prices can be given in accordance to the individual power flow according to the Line Flow Splitting method. The results indicate that the achieved nodal prices can be very sensitive to operating conditions and net-work characteristics and hence will provide useful economic sig-nals to consumers and generators
concerning network utilization in case of congestion. Transmission in one part of the grid may increase or decrease capacity for transmission in other parts of the grid. In a liberalized electricity market, the patterns of load and generation, and the resulting demand for transmission ser-vice, will be changing quickly and considerably.
hat can we conclude from the above analysis? Capac-
ity constraints on the transmission network affect competition in elec-tricity generation, and the trans-mission network holds the key to achieving most of the economic benefits promised by restructur-ing. In large meshed systems such as the ones in North America and Europe, transmission costs can make a desired power transfer eco-nomically infeasible. Economic efficiency requires a balance of measures that both accommodate proper use of the existing system, and provide incentives for innova-tion in and adaptation to the changing needs of the market. The
principal goal therefore is to design new rules that will promote efficient investment consistent with a more competitive market. And our most important recom-mendation, like that of many other commentators, is to increase trans-mission capacity whenever it is feasible in order to increase the competition in generation. j
Endnotes:
1. S. Harvey, W. Hogan, and S. Pope, Transmission Capacity Reservations Imple-mented Through a Spot Market with Trans-mission Congestion Contracts, Elec. J., Nov. 1996, at 42–45.
2. C. Kawann, Analysis of Load Flow-Based Transmission Pricing in the Austrian Electric-ity Market, doctoral thesis, Department of Electrical Power Systems, Graz University of Technology, Graz, Austria, March 2000.
3. Steven Stoft, Congestion Pricing with Fewer Prices Than Zones, Elec. J., May 1998, at 23–31.
4. H. Singh, S. Hao, and A. Papalexopou-los, Transmission Congestion Management in Competitive Electricity Markets, IEEE Transactions on Power Systems, May 1999, at 672–680.
5. Jacqueline Boucher, Benoit Ghilain, and Yves Smeers, Security-Constrained
W
Economic efficiency requires a balance of measures.
30 © 2000, Elsevier Science Inc., 1040-6190/00/$–see front matter PII S1040-6190(00)00166-4 The Electricity Journal
Dispatch Gives Financially and Economi-cally Significant Nodal Prices, Elec. J., Nov. 1998, at 53–59.
6. Supra note 2.
7. According to the nodal procedure, the load flow analysis is based on a port network, in which the ports represent the generators and the loads. The pas-sive network is formed by series and shunt impedances as well as capaci-tances, as shown by R. Muckenhuber, Electrical Power Systems 3 (available only in German), Department of Electrical Power Systems; Graz University of Technology, 1989. The nodal method is the simplest way to determine the volt-ages and currents of a network. Cur-rents are supposed to be negative when flowing into the system. The basic requirement for applying this method is the knowledge of the nodal admittance matrix, the apparent power and the voltages in any node resulting from a load flow calculation.
Thus, the necessary port currents can be calculated,
(1)
whereI 5 Impressed port current [A]
Sph* 5 Apparent power per phase (conjugate-complex) [MVAr]
Uph 5 Nodal phase voltage [kV]
The aim of this model is to indicate the rate of usage of each customer on any transmission facility for a given, already-calculated load flow. The quantities, which in fact do reflect the utilization, are the currents in the branches of the network. This can be achieved by
U 5 Y21 ? I 5 Z ? I, (2)
whereU 5 Port voltage vector [V]I 5 Port current vector [A]
Y 5 Admittance matrix [S]Z 5 Impedance matrix [V]
It is necessary to determine the branch currents (Ivm), as they depend on the currents in each port (Iv). Thus, all branch currents can be calculated by using the differences in nodal potentials:
ISph
*
U ph*
−−−−−−− ,5
Ivm 5 Yvm(Uv 2 Um)
5 Yvm (3)
wheren, m index port numbers.
Equation (3) shows that the branch currents are a linear combination of the port currents (superposition principle). Changes in port currents lead to changes in voltages, also resulting in changes in line currents (and consequently in the branch currents’ components). It shows
I1(Zv1 2 Zm1) 1I2(Zv2 2 Zm2) 1
? ? ?
Iv(Zvv 2 Zmv) 1? ? ?
In(Zvn 2 Zmm) 1
that the power flow throughout the power system is uniquely determined once the port currents have been speci-fied. Equation (3) offers the basis by which to split the line currents according to the in- and out-flowing port currents.
In order to compare the divided branch currents determined in Equation (3) with the actual load flow calculation results, the settled currents must be transformed into real power through multiplying by the average adjacent voltage. Because the voltages are only known in the linked nodes, the arith-metic mean value at the corresponding nodes was used.
Port currents are not independent from one another—the generator cur-rents including slack have to balance the currents of the loads plus shunt ele-ments. Splitting port currents into dependent and independent sources or sinks allows an approach to represent
the loads as independent sinks, expressed by their port currents respec-tively, power. In order to determine the proportionate generator currents for each consumer node the port currents of each generator are replaced by an equiv-alent admittance calculated from the S and U values according to the investi-gated load flow calculation, as in Figure 1. Based on this approach the equivalent admittance can be obtained by:
(4)
whereYG9 5 Equivalent generator admit-
tance [S]SG 5 Apparent power delivered by
the generator [MVAr]U 5 Voltage at generator node [V]
Applying this equivalent admittance to the Line Flow Splitting model yields a change in the nodal admittance matrix: The equivalent admittances have to be added to the main diagonal elements of the generator nodes in the matrix. The remaining system consists of a plain impedance network with port currents only for the loads. Equation (2) allows one to calculate for each load from which generator in what degree it is supplied, as well as which lines are used to what degree.
There always exists a degree of free-dom in choosing individual transac-tions for splitting an already-existing load flow. In this study, the equivalent admittance concept was introduced. The load flows assigned to the individ-ual loads are allocated according to the distributed slack bus method, which assumes that all loads are served pro-portionally by all generators. See A. Zobian and M.D. Ilic, Unbundling of Transmission and Ancillary Services: Part I: Technical Issues, IEEE Transactions on Power Systems, Oct. 1997, at 539–548.
8. H. Chao and H. Huntington, Design-ing Competitive Electricity Markets (Kluwer Academic Publishers, 1997).
9. H.H. Happ, Cost of Wheeling Methodol-ogies, IEEE Transactions on Power Systems, Feb. 1994, at 147–156.
10. J. Bialek, Tracing the Flow of Electricity, IEEE Proc.–Gen. Transm., July 1996, at 313–320.
YG9SG
U 2−−−−−5