Embed Size (px)
Citation preview
1
Chapter One
Conceptual Theory – “What Do You Know?” Final draft
Meir Russ
Associate Professor, Management and Marketing
Chair, Master of Management
Frederick E. Baer Professor in Business
Professional Programs in Business
University of Wisconsin - Green Bay
WH460, 2420 Nicolet Drive
Green Bay, WI 54311-7001, USA
Tel.: +1 920 465 2757 Fax: +1 920 465 2660
Robert Fineman
Independent Consultant
906 Ainsworth Street West
Lehigh Acres, FL 33974
Tel.: +1 239 369 8986
Jeannette K. Jones
American Intercontinental University – Main Campus
5550 Prairie Stone Parkway --Hoffman Estates, Illinois 60192
2
Abstract
This chapter will provide the reader with two definitions of knowledge, one at the
individual level, the other at the organizational level. This will be followed by connecting
the knowledge base of the organization to its sustainable competitive advantage by using
a multiple-layer framework of organizational knowledge. Then, the chapter will discuss
the frameworks of knowledge management vision, mission and goals for the
organization. Temporary and functional gap analysis frameworks will follow. The
chapter will end with a brief description of three tools developed by the authors.
Keywords: knowledge, knowledge-based strategy, framework, knowledge management
vision and mission, knowledge management goals, knowledge gaps.
3
Introduction
This chapter will provide the reader with a number of theoretical aspects that we consider
important as a background for understanding and effectively utilizing the later developed
subjects related to knowledge management strategy discussed by us later in this book. We
will begin this chapter by introducing you to three epistemologies that can and do frame
the discussion about knowledge and knowledge management. We will continue by
discussing two conceptual aspects of knowledge. We will define knowledge at the
individual (personal) level and then at the organizational level. Once these definitions
have been solidified, we will place these concepts into a practical application by
describing knowledge within an organization’s strategic discussion. In a practical
application, it is critical for an organization to understand where their knowledge should
be located. Some of this discussion might seem tedious at first, but we hope you will
commit to reading through the entire discussion to see for yourself that, while it might
sound theoretical or philosophical, it is actually very practical. We hope the examples
will illustrate why it is crucial for you to understand the foundation of our tools.
Following that, we will introduce you to vision, mission, and goals for KM as well as
gaps. We will close the chapter by briefly introducing three tools that we have developed
to make it easier for you and your organization to systematically manage knowledge as a
strategic asset to create value. A more in-depth discussion of those tools can be found in
this book in chapters 4, 7 and 9.
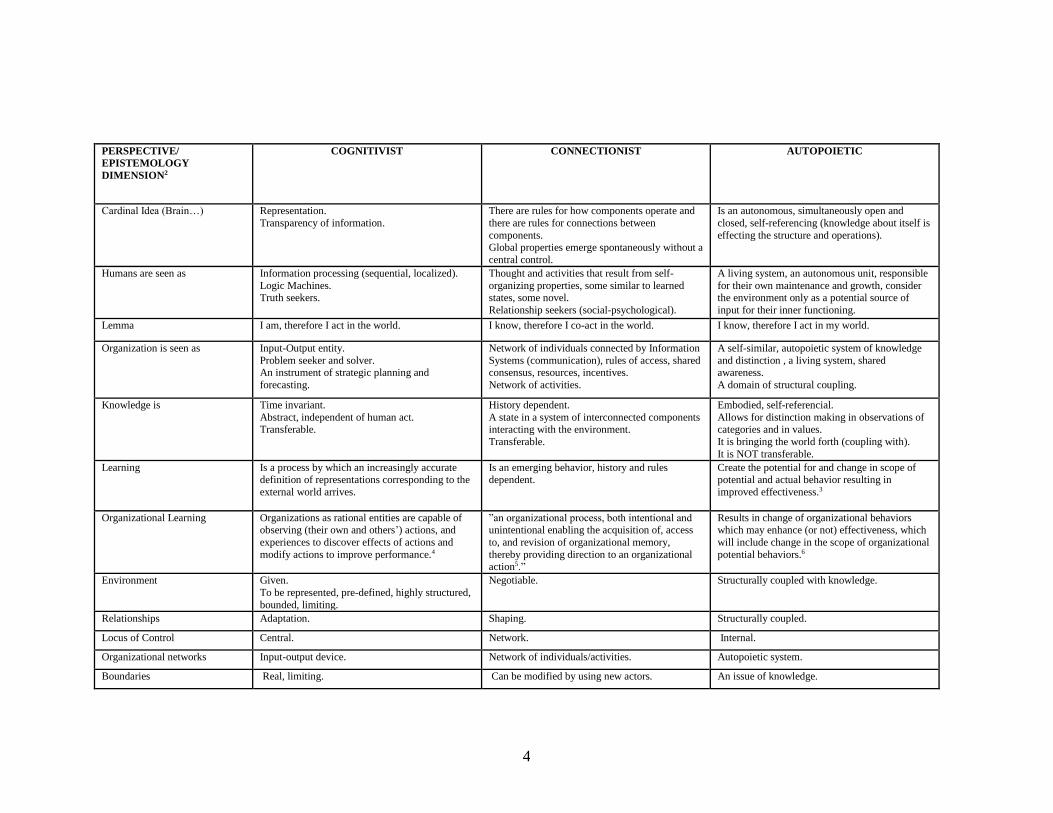
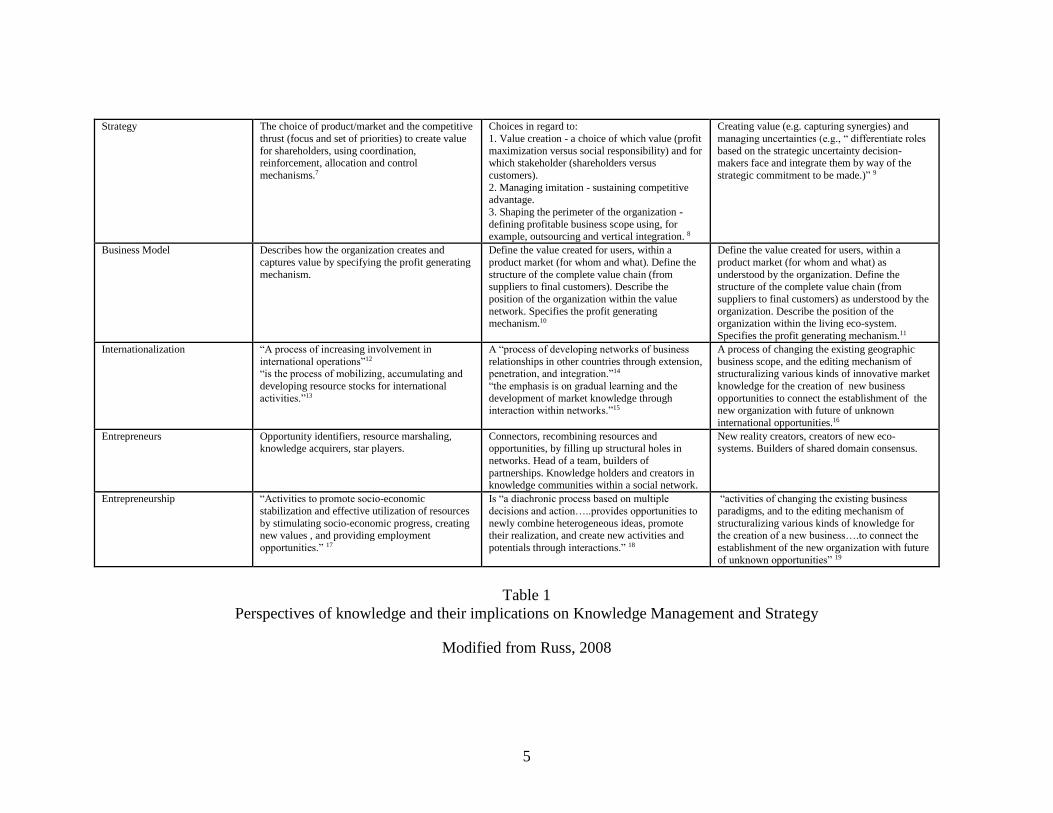
Knowledge as a Complex and Living System: Three epistemologies
Knowledge can be viewed from different perspectives (what academics call
epistemology1). The three epistemologies are: the cognitivist view, the connectionist view
and the autopoietic view. They are detailed and illustrated below in Table 1. We want the
reader to realize that there is more than one way to look at knowledge, and that by using
the three perspectives you can have more and richer opportunities to use knowledge
effectively. You will see the use of these three perspectives again in chapters 4, 7 and 9,
within this book.
4
PERSPECTIVE/
EPISTEMOLOGY
DIMENSION2
COGNITIVIST CONNECTIONIST AUTOPOIETIC
Cardinal Idea (Brain…) Representation.
Transparency of information.
There are rules for how components operate and
there are rules for connections between
components.
Global properties emerge spontaneously without a
central control.
Is an autonomous, simultaneously open and
closed, self-referencing (knowledge about itself is
effecting the structure and operations).
Humans are seen as Information processing (sequential, localized).
Logic Machines. Truth seekers.
Thought and activities that result from self-
organizing properties, some similar to learned states, some novel.
Relationship seekers (social-psychological).
A living system, an autonomous unit, responsible
for their own maintenance and growth, consider the environment only as a potential source of
input for their inner functioning.
Lemma I am, therefore I act in the world. I know, therefore I co-act in the world. I know, therefore I act in my world.
Organization is seen as Input-Output entity.
Problem seeker and solver. An instrument of strategic planning and
forecasting.
Network of individuals connected by Information
Systems (communication), rules of access, shared consensus, resources, incentives.
Network of activities.
A self-similar, autopoietic system of knowledge
and distinction , a living system, shared awareness.
A domain of structural coupling.
Knowledge is Time invariant.
Abstract, independent of human act. Transferable.
History dependent.
A state in a system of interconnected components interacting with the environment.
Transferable.
Embodied, self-referencial.
Allows for distinction making in observations of categories and in values.
It is bringing the world forth (coupling with).
It is NOT transferable.
Learning
Is a process by which an increasingly accurate definition of representations corresponding to the
external world arrives.
Is an emerging behavior, history and rules dependent.
Create the potential for and change in scope of potential and actual behavior resulting in
improved effectiveness.3
Organizational Learning Organizations as rational entities are capable of observing (their own and others’) actions, and
experiences to discover effects of actions and
modify actions to improve performance.4
”an organizational process, both intentional and unintentional enabling the acquisition of, access
to, and revision of organizational memory,
thereby providing direction to an organizational action5.”
Results in change of organizational behaviors which may enhance (or not) effectiveness, which
will include change in the scope of organizational
potential behaviors.6
Environment Given.
To be represented, pre-defined, highly structured,
bounded, limiting.
Negotiable. Structurally coupled with knowledge.
Relationships Adaptation. Shaping. Structurally coupled.
Locus of Control Central. Network. Internal.
Organizational networks Input-output device. Network of individuals/activities. Autopoietic system.
Boundaries Real, limiting. Can be modified by using new actors. An issue of knowledge.
5
Strategy The choice of product/market and the competitive
thrust (focus and set of priorities) to create value
for shareholders, using coordination, reinforcement, allocation and control
mechanisms.7
Choices in regard to:
1. Value creation - a choice of which value (profit
maximization versus social responsibility) and for which stakeholder (shareholders versus
customers).
2. Managing imitation - sustaining competitive advantage.
3. Shaping the perimeter of the organization -
defining profitable business scope using, for example, outsourcing and vertical integration. 8
Creating value (e.g. capturing synergies) and
managing uncertainties (e.g., “ differentiate roles
based on the strategic uncertainty decision-makers face and integrate them by way of the
strategic commitment to be made.)” 9
Business Model Describes how the organization creates and
captures value by specifying the profit generating
mechanism.
Define the value created for users, within a
product market (for whom and what). Define the
structure of the complete value chain (from suppliers to final customers). Describe the
position of the organization within the value
network. Specifies the profit generating mechanism.10
Define the value created for users, within a
product market (for whom and what) as
understood by the organization. Define the structure of the complete value chain (from
suppliers to final customers) as understood by the
organization. Describe the position of the organization within the living eco-system.
Specifies the profit generating mechanism.11
Internationalization “A process of increasing involvement in
international operations”12 “is the process of mobilizing, accumulating and
developing resource stocks for international
activities.”13
A “process of developing networks of business
relationships in other countries through extension, penetration, and integration.”14
“the emphasis is on gradual learning and the
development of market knowledge through interaction within networks.”15
A process of changing the existing geographic
business scope, and the editing mechanism of structuralizing various kinds of innovative market
knowledge for the creation of new business
opportunities to connect the establishment of the new organization with future of unknown
international opportunities.16
Entrepreneurs Opportunity identifiers, resource marshaling, knowledge acquirers, star players.
Connectors, recombining resources and opportunities, by filling up structural holes in
networks. Head of a team, builders of
partnerships. Knowledge holders and creators in knowledge communities within a social network.
New reality creators, creators of new eco-systems. Builders of shared domain consensus.
Entrepreneurship “Activities to promote socio-economic
stabilization and effective utilization of resources
by stimulating socio-economic progress, creating new values , and providing employment
opportunities.” 17
Is “a diachronic process based on multiple
decisions and action…..provides opportunities to
newly combine heterogeneous ideas, promote their realization, and create new activities and
potentials through interactions.” 18
“activities of changing the existing business
paradigms, and to the editing mechanism of
structuralizing various kinds of knowledge for the creation of a new business….to connect the
establishment of the new organization with future
of unknown opportunities” 19
Table 1
Perspectives of knowledge and their implications on Knowledge Management and Strategy
Modified from Russ, 2008
6
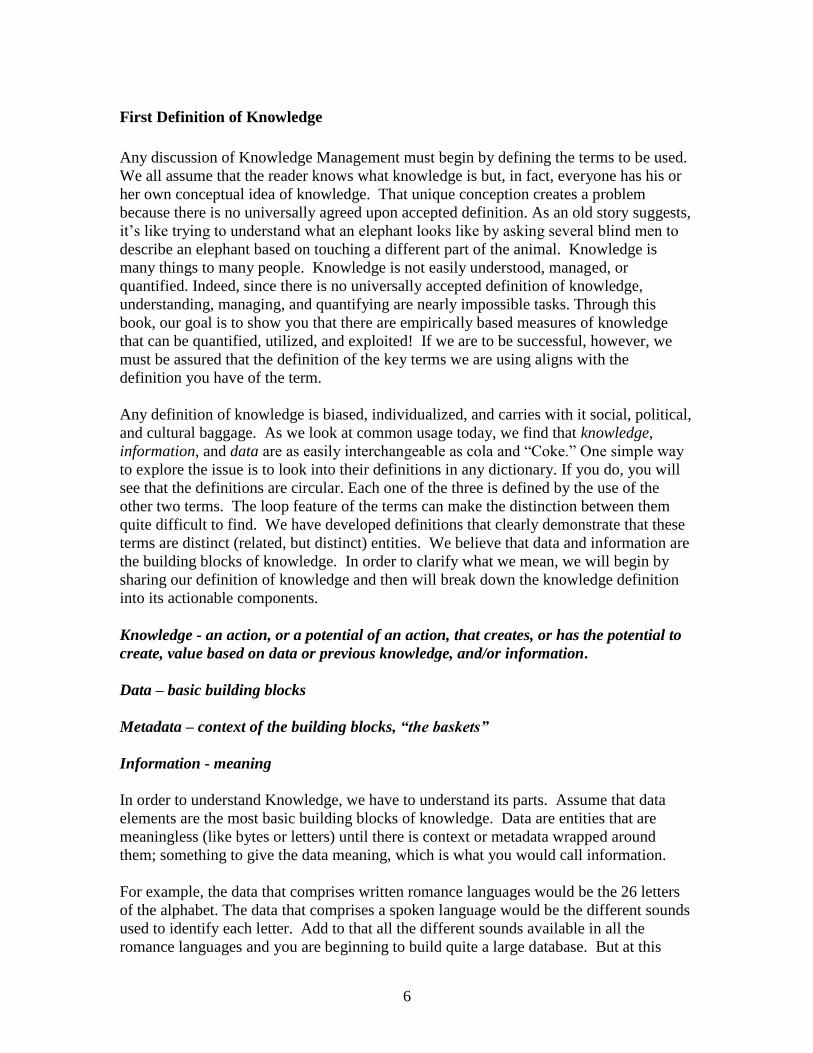
First Definition of Knowledge
Any discussion of Knowledge Management must begin by defining the terms to be used.
We all assume that the reader knows what knowledge is but, in fact, everyone has his or
her own conceptual idea of knowledge. That unique conception creates a problem
because there is no universally agreed upon accepted definition. As an old story suggests,
it’s like trying to understand what an elephant looks like by asking several blind men to
describe an elephant based on touching a different part of the animal. Knowledge is
many things to many people. Knowledge is not easily understood, managed, or
quantified. Indeed, since there is no universally accepted definition of knowledge,
understanding, managing, and quantifying are nearly impossible tasks. Through this
book, our goal is to show you that there are empirically based measures of knowledge
that can be quantified, utilized, and exploited! If we are to be successful, however, we
must be assured that the definition of the key terms we are using aligns with the
definition you have of the term.
Any definition of knowledge is biased, individualized, and carries with it social, political,
and cultural baggage. As we look at common usage today, we find that knowledge,
information, and data are as easily interchangeable as cola and “Coke.” One simple way
to explore the issue is to look into their definitions in any dictionary. If you do, you will
see that the definitions are circular. Each one of the three is defined by the use of the
other two terms. The loop feature of the terms can make the distinction between them
quite difficult to find. We have developed definitions that clearly demonstrate that these
terms are distinct (related, but distinct) entities. We believe that data and information are
the building blocks of knowledge. In order to clarify what we mean, we will begin by
sharing our definition of knowledge and then will break down the knowledge definition
into its actionable components.
Knowledge - an action, or a potential of an action, that creates, or has the potential to
create, value based on data or previous knowledge, and/or information.
Data – basic building blocks
Metadata – context of the building blocks, “the baskets”
Information - meaning
In order to understand Knowledge, we have to understand its parts. Assume that data
elements are the most basic building blocks of knowledge. Data are entities that are
meaningless (like bytes or letters) until there is context or metadata wrapped around
them; something to give the data meaning, which is what you would call information.
For example, the data that comprises written romance languages would be the 26 letters
of the alphabet. The data that comprises a spoken language would be the different sounds
used to identify each letter. Add to that all the different sounds available in all the
romance languages and you are beginning to build quite a large database. But at this
7
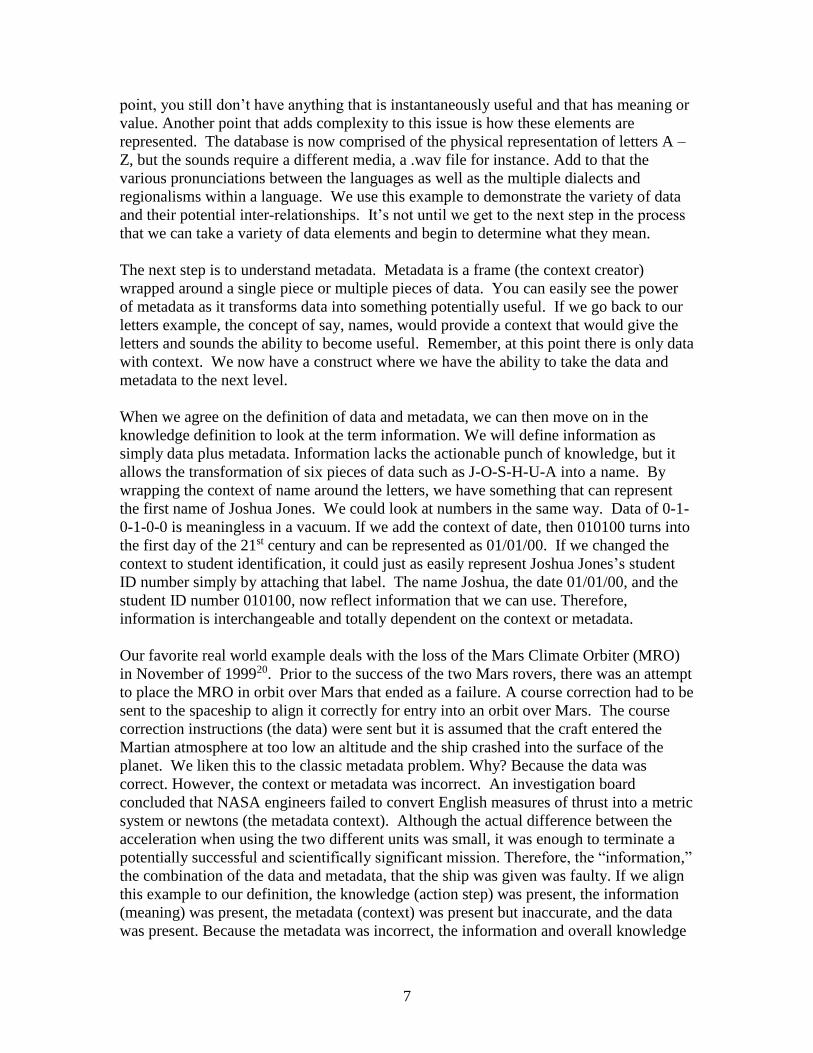
point, you still don’t have anything that is instantaneously useful and that has meaning or
value. Another point that adds complexity to this issue is how these elements are
represented. The database is now comprised of the physical representation of letters A –
Z, but the sounds require a different media, a .wav file for instance. Add to that the
various pronunciations between the languages as well as the multiple dialects and
regionalisms within a language. We use this example to demonstrate the variety of data
and their potential inter-relationships. It’s not until we get to the next step in the process
that we can take a variety of data elements and begin to determine what they mean.
The next step is to understand metadata. Metadata is a frame (the context creator)
wrapped around a single piece or multiple pieces of data. You can easily see the power
of metadata as it transforms data into something potentially useful. If we go back to our
letters example, the concept of say, names, would provide a context that would give the
letters and sounds the ability to become useful. Remember, at this point there is only data
with context. We now have a construct where we have the ability to take the data and
metadata to the next level.
When we agree on the definition of data and metadata, we can then move on in the
knowledge definition to look at the term information. We will define information as
simply data plus metadata. Information lacks the actionable punch of knowledge, but it
allows the transformation of six pieces of data such as J-O-S-H-U-A into a name. By
wrapping the context of name around the letters, we have something that can represent
the first name of Joshua Jones. We could look at numbers in the same way. Data of 0-1-
0-1-0-0 is meaningless in a vacuum. If we add the context of date, then 010100 turns into
the first day of the 21st century and can be represented as 01/01/00. If we changed the
context to student identification, it could just as easily represent Joshua Jones’s student
ID number simply by attaching that label. The name Joshua, the date 01/01/00, and the
student ID number 010100, now reflect information that we can use. Therefore,
information is interchangeable and totally dependent on the context or metadata.
Our favorite real world example deals with the loss of the Mars Climate Orbiter (MRO)
in November of 199920. Prior to the success of the two Mars rovers, there was an attempt
to place the MRO in orbit over Mars that ended as a failure. A course correction had to be
sent to the spaceship to align it correctly for entry into an orbit over Mars. The course
correction instructions (the data) were sent but it is assumed that the craft entered the
Martian atmosphere at too low an altitude and the ship crashed into the surface of the
planet. We liken this to the classic metadata problem. Why? Because the data was
correct. However, the context or metadata was incorrect. An investigation board
concluded that NASA engineers failed to convert English measures of thrust into a metric
system or newtons (the metadata context). Although the actual difference between the
acceleration when using the two different units was small, it was enough to terminate a
potentially successful and scientifically significant mission. Therefore, the “information,”
the combination of the data and metadata, that the ship was given was faulty. If we align
this example to our definition, the knowledge (action step) was present, the information
(meaning) was present, the metadata (context) was present but inaccurate, and the data
was present. Because the metadata was incorrect, the information and overall knowledge
8
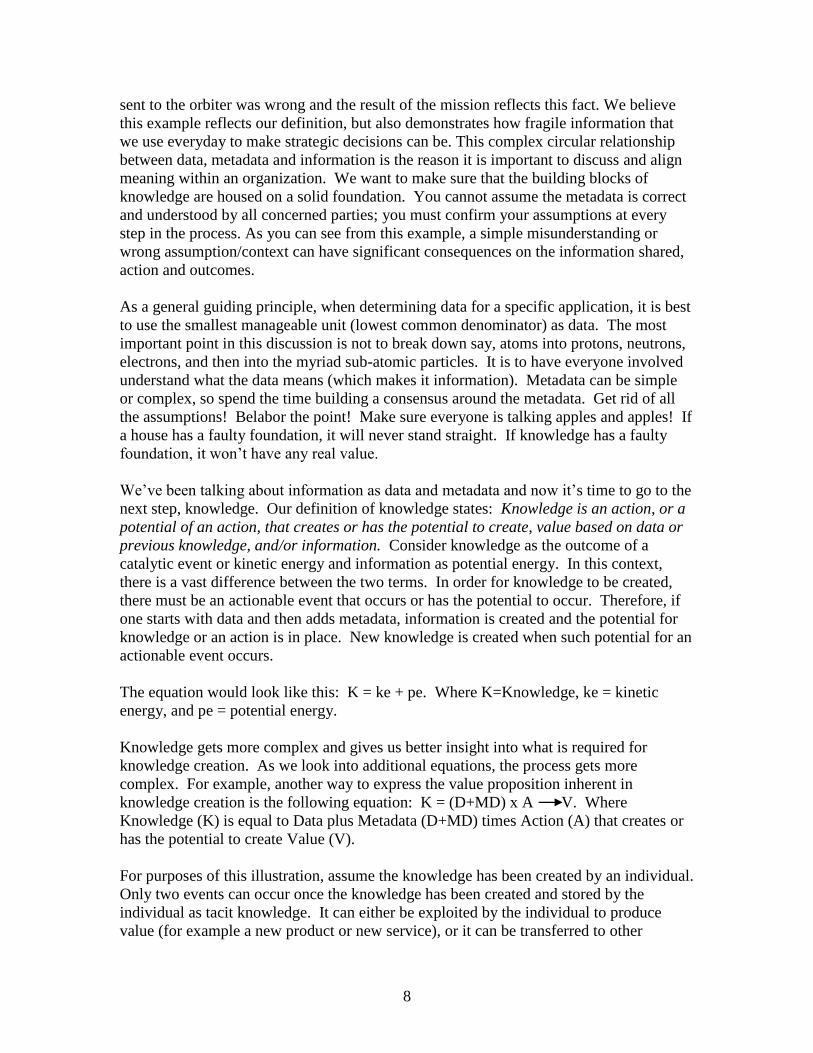
sent to the orbiter was wrong and the result of the mission reflects this fact. We believe
this example reflects our definition, but also demonstrates how fragile information that
we use everyday to make strategic decisions can be. This complex circular relationship
between data, metadata and information is the reason it is important to discuss and align
meaning within an organization. We want to make sure that the building blocks of
knowledge are housed on a solid foundation. You cannot assume the metadata is correct
and understood by all concerned parties; you must confirm your assumptions at every
step in the process. As you can see from this example, a simple misunderstanding or
wrong assumption/context can have significant consequences on the information shared,
action and outcomes.
As a general guiding principle, when determining data for a specific application, it is best
to use the smallest manageable unit (lowest common denominator) as data. The most
important point in this discussion is not to break down say, atoms into protons, neutrons,
electrons, and then into the myriad sub-atomic particles. It is to have everyone involved
understand what the data means (which makes it information). Metadata can be simple
or complex, so spend the time building a consensus around the metadata. Get rid of all
the assumptions! Belabor the point! Make sure everyone is talking apples and apples! If
a house has a faulty foundation, it will never stand straight. If knowledge has a faulty
foundation, it won’t have any real value.
We’ve been talking about information as data and metadata and now it’s time to go to the
next step, knowledge. Our definition of knowledge states: Knowledge is an action, or a
potential of an action, that creates or has the potential to create, value based on data or
previous knowledge, and/or information. Consider knowledge as the outcome of a
catalytic event or kinetic energy and information as potential energy. In this context,
there is a vast difference between the two terms. In order for knowledge to be created,
there must be an actionable event that occurs or has the potential to occur. Therefore, if
one starts with data and then adds metadata, information is created and the potential for
knowledge or an action is in place. New knowledge is created when such potential for an
actionable event occurs.
The equation would look like this: K = ke + pe. Where K=Knowledge, ke = kinetic
energy, and pe = potential energy.
Knowledge gets more complex and gives us better insight into what is required for
knowledge creation. As we look into additional equations, the process gets more
complex. For example, another way to express the value proposition inherent in
knowledge creation is the following equation: K = (D+MD) x A V. Where
Knowledge (K) is equal to Data plus Metadata (D+MD) times Action (A) that creates or
has the potential to create Value (V).
For purposes of this illustration, assume the knowledge has been created by an individual.
Only two events can occur once the knowledge has been created and stored by the
individual as tacit knowledge. It can either be exploited by the individual to produce
value (for example a new product or new service), or it can be transferred to other
9
individuals. In the latter instance, the knowledge must be codified as explicit knowledge
by the original knowledge creator and transferred as data to other individuals. Once they
receive the data, they must add metadata and create the knowledge for themselves.
Although this sounds counterintuitive, we contend that only data, metadata, and
information can be transferred, but knowledge has to be re-created individually. Lots of
information such as the speed of light, the number of feet in a mile, the number of days in
a year, is available. Lots of knowledge is also available. For example, we know how to
calculate the speed of light, we can measure the number of feet in a mile, and we have
standards that allow us to determine the number of days in any given year. The
difference between information and knowledge is an actionable event or the potential to
create an actionable event. That event is the catalyst that transforms potential energy into
kinetic energy and produces value. Therefore, using our definition, the information that
reduces uncertainty to allow an action is knowledge and that action creates value. The
same information, if it does not allow for an action as it has meaning to the user is NOT
knowledge. It is just useless information. Knowledge is dynamic. Data and Information
are static. Just because data and metadata are present does not mean that knowledge will
be created; it only supplies the necessary framework for knowledge to be created.
Remember an individual or organization does not have to re-invent the mousetrap; they
only have to make a better one.
Let us give you another example. In a recent book “Decoding the Universe,” Seife21
describes a number of examples of how information (knowledge by our definition)
creates value by reducing uncertainty. He describes Paul Revere’s scheme for sharing
information (knowledge) about the British intentions (pp. 60-61) and the story of
breaking the Japanese JN-25 code named AF (the attack on Midway, pp. 5-7). What he
misses completely is the metadata and the intentions that framed this information
(knowledge) and allowed this knowledge to create value. Just look into the misreading of
the weak signals preceding the 9-11 events, missing the early indications of the
Challenger and Discovery disasters in this country, or the Israelis missing the signals of
the coming Yom Kippur war and you will see the difference.
Our reasoning of presenting this variety of examples is to support the point that
information does NOT always translate to knowledge. Interestingly, we are NOT the first
ones to come up with this idea. von Baeyer22 in his recent book: “Information: The New
Language of Science” describes three levels of complexity of information (pp. 32-33)
developed originally by Shannon and Weaver23 in their classic book about information
theory. Shannon and Weaver suggest that knowledge is present only if it can answer the
following questions: 1. “How accurately can information be transmitted” (p. 32)? This is
what we refer to as data. 2. “How precisely do the symbols convey the desired meaning”
(p. 32)? This is what we refer to as information. 3. “How effectively does the received
meaning affect behavior in the desired way” (p. 32)? This is what we refer to as
knowledge. Unfortunately, most experts dealing with this subject (for example, Seife and
von Baeyer) refer to those three levels as nothing more than different aspects of
information, missing the importance of metadata (the context) and intentions (the
knowledge). For example, adding the metadata to the data will allow the sender to
convey the desired meaning, (see question 2 above) or, to answer question 3, adding
10
context and intention to the information will ensure the appropriate behavior by the
receiving entity.
The real issue here is the creation of value and you can clearly see that knowledge builds
on itself. In fact, as we move up the knowledge ladder, we build more and more complex
structures. Since our definition allows knowledge to be based on data and previous
knowledge, we have the ability to utilize existing knowledge to increase our knowledge
base.
A more detailed discussion regarding the actionable event that transforms data elements
into knowledge will be presented later in this chapter. Our intent for this chapter is to lay
a working definition foundation. The difference between Information and Knowledge as
we have just outlined is critically important. It is NOT simply an issue of semantics.
Thousands of business executives and hundreds of Information Systems (IS) companies
do NOT understand this issue. Organizations that purchase software and hardware
intending to create a Knowledge Based System can not use these tools to capture
knowledge as an asset by itself unless the system is embedded in the appropriate context.
While it might have the potential to utilize knowledge, unless the system is embedded in
the appropriate context, it is strictly information. This, at least to us, explains the failure
of the first generation of many of the KM initiatives. Companies that bought Knowledge
Based Systems assumed that the systems will work as indeed KNOWLEDGE based
systems, without comprehending that knowledge has human-systems interactive aspects
and is a social-technical phenomenon.
Knowledge is an asset. Good managers exploit their assets to position their companies
well within their particular environment. As you will see, the ability to determine where
your knowledge assets are and how to utilize those assets can start you on the road to
identifying and sustaining a competitive advantage. Our intention is to provide a
roadmap that will allow you and your organization to navigate the very tricky waters of
knowledge management. We don’t claim to have all the answers, but we hope to give the
reader what he or she needs to make the trip as smooth as possible.
Second Definition of Knowledge
Until now, we have been talking about knowledge as a stand-alone entity at the
individual level of analysis. If this is true, how can there be “smart” organizations and
“not-so-smart” organizations? Even within your own company there are “smart” teams
and “not-so-smart” teams. Although it would be easy to say that the best people are in
the “smart” teams and the worst are in the “not-so-smart” teams, we know that just isn’t
the case. You are smart and bring a lot of knowledge to any team. You have also been
on “good” teams and “not-so-good” teams. Shouldn’t your knowledge have brought the
“not-so-good” team to the level of a “good” team? Let’s examine this last piece of the
puzzle.
11
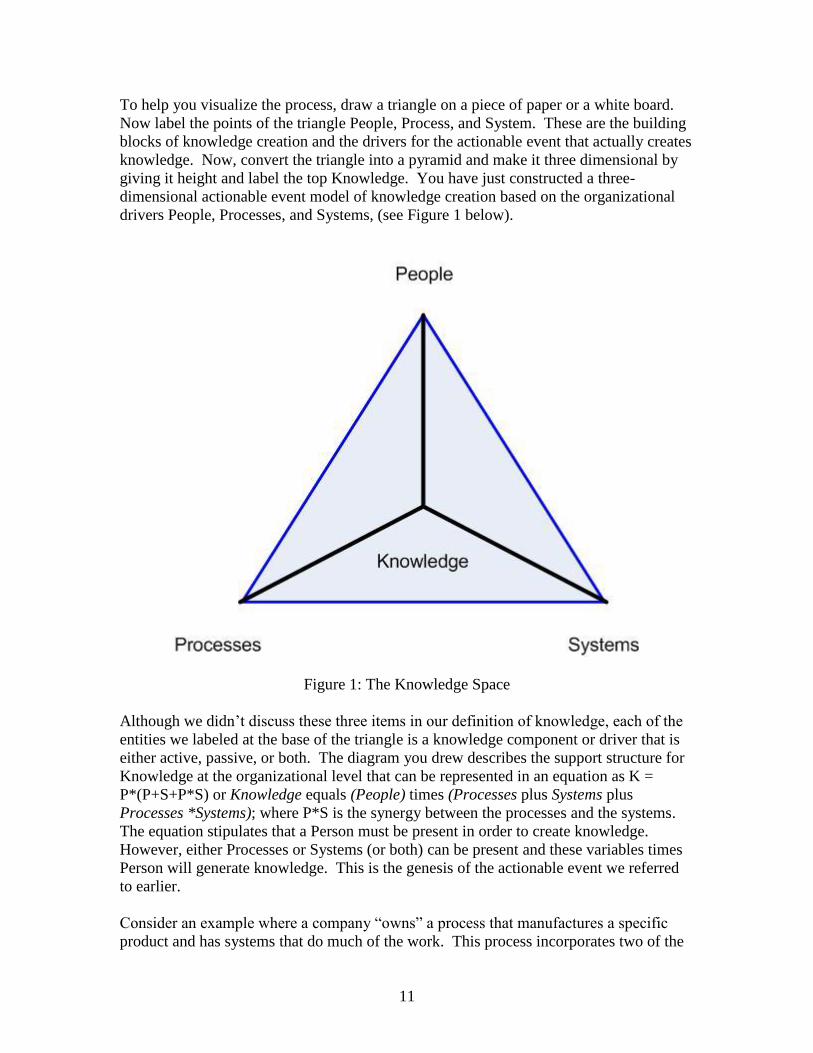
To help you visualize the process, draw a triangle on a piece of paper or a white board.
Now label the points of the triangle People, Process, and System. These are the building
blocks of knowledge creation and the drivers for the actionable event that actually creates
knowledge. Now, convert the triangle into a pyramid and make it three dimensional by
giving it height and label the top Knowledge. You have just constructed a three-
dimensional actionable event model of knowledge creation based on the organizational
drivers People, Processes, and Systems, (see Figure 1 below).
Figure 1: The Knowledge Space
Although we didn’t discuss these three items in our definition of knowledge, each of the
entities we labeled at the base of the triangle is a knowledge component or driver that is
either active, passive, or both. The diagram you drew describes the support structure for
Knowledge at the organizational level that can be represented in an equation as K =
P*(P+S+P*S) or Knowledge equals (People) times (Processes plus Systems plus
Processes *Systems); where P*S is the synergy between the processes and the systems.
The equation stipulates that a Person must be present in order to create knowledge.
However, either Processes or Systems (or both) can be present and these variables times
Person will generate knowledge. This is the genesis of the actionable event we referred
to earlier.
Consider an example where a company “owns” a process that manufactures a specific
product and has systems that do much of the work. This process incorporates two of the
12
three essential ingredients, Processes and Systems, however, if there are no people who
possess the knowledge to put the process and system to work (into action), the product
cannot be produced. There is an exception to this and it deals with embedding
knowledge into processes and systems. We’ll deal with embedded knowledge later in the
chapter, but a simplistic example would be driving a car. The mechanical knowledge to
actually get the car moving is embedded within the vehicle, all the driver has to know is
how to start the engine, how to put the car in gear and how to drive.
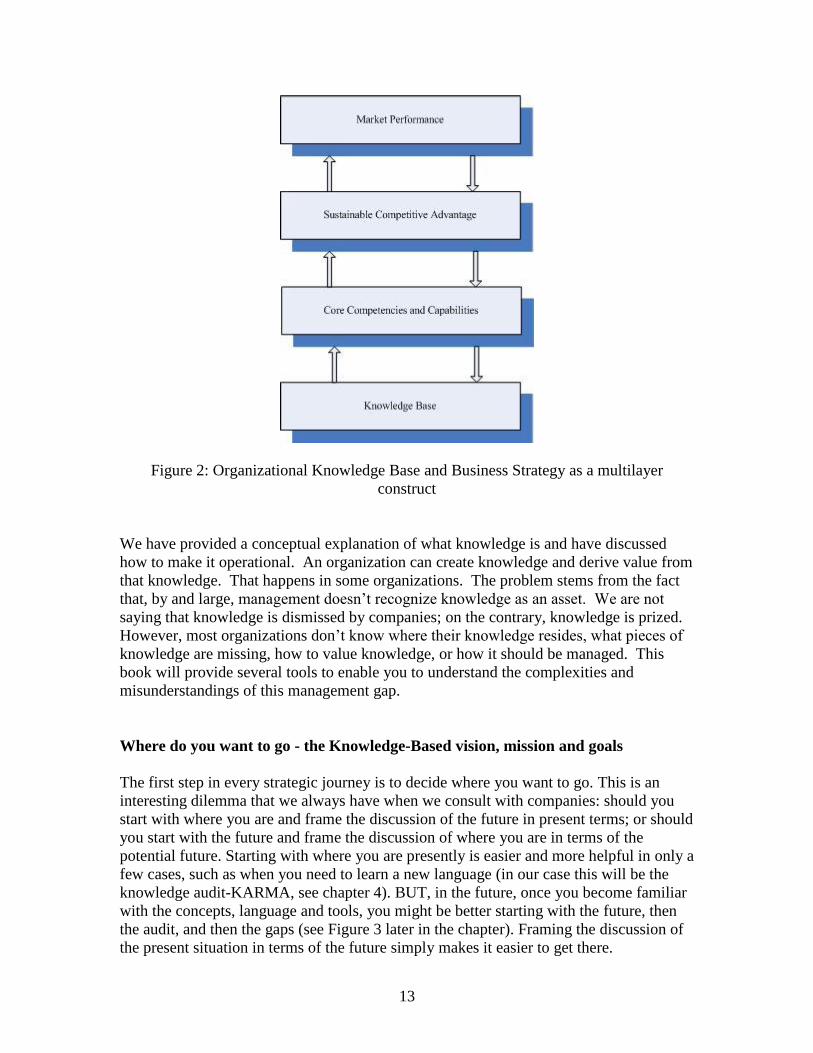
Organizational Knowledge-Base and Strategy
The definition of knowledge is complex at the individual level and organizational levels.
Incorporating knowledge management into the strategic discussion of an organization
adds yet another layer of complexity. We see the knowledge-base of the organization
feeding into the core competencies and capabilities of the organization. Those are the
core competencies and capabilities that allow the organization to develop a strategy and
its sustainable competitive advantage. This, in turn, results in performance in the
marketplace. So, the other aspect of knowledge that reinforces the complexity of
knowledge management’s processes is the multi-layering aspect of the interrelationships
between the four layers24 mentioned above (see also Figure 2 below). This complexity
increases due to the potential time lag between managing the knowledge at the bottom
layer and the final outcome at the top layer. There can be a time lag between the bottom
layer, (managing the knowledge base), to the top layer, (final market performance) of up
to 15 years. The time lag is caused by the slow movement through all four layers as they
build upon each other. An analogy that illustrates this aspect is the public education
system. Society is paying for education today with an expectation of a return for the next
generation of the workforce. However, there is no tool that allows us to quantify that X
dollars spent today will return Y dollars in the future. Additionally, there are no tools
available to allow us to see what type of education will be required for the workforce of
the future. Who could have predicted the explosion of programming skills that were
needed to fuel the Internet revolution?
13
Figure 2: Organizational Knowledge Base and Business Strategy as a multilayer
construct
We have provided a conceptual explanation of what knowledge is and have discussed
how to make it operational. An organization can create knowledge and derive value from
that knowledge. That happens in some organizations. The problem stems from the fact
that, by and large, management doesn’t recognize knowledge as an asset. We are not
saying that knowledge is dismissed by companies; on the contrary, knowledge is prized.
However, most organizations don’t know where their knowledge resides, what pieces of
knowledge are missing, how to value knowledge, or how it should be managed. This
book will provide several tools to enable you to understand the complexities and
misunderstandings of this management gap.
Where do you want to go - the Knowledge-Based vision, mission and goals
The first step in every strategic journey is to decide where you want to go. This is an
interesting dilemma that we always have when we consult with companies: should you
start with where you are and frame the discussion of the future in present terms; or should
you start with the future and frame the discussion of where you are in terms of the
potential future. Starting with where you are presently is easier and more helpful in only a
few cases, such as when you need to learn a new language (in our case this will be the
knowledge audit-KARMA, see chapter 4). BUT, in the future, once you become familiar
with the concepts, language and tools, you might be better starting with the future, then
the audit, and then the gaps (see Figure 3 later in the chapter). Framing the discussion of
the present situation in terms of the future simply makes it easier to get there.
14
One way to start this discussion is to define broad and specific goals for your
organization in business and KM terms. A second way is to have a discussion about your
KM vision and mission statements and how they relate to your business vision and
mission. Some people are better at developing the long term vision and mission before
they (or usually others) go into the detailed goals. Some are better the other way around--
they have the goals and they let the vision and mission bubble up. Regardless, before you
are done developing the picture of the future, you will need to clearly define the vision,
mission and goals. At this first stage you should develop the KM vision- mission and
relate it to the business. We rarely find companies that have an explicit vision-mission
statement for their KM, even when they have an explicit KM strategy, which again, few
have.
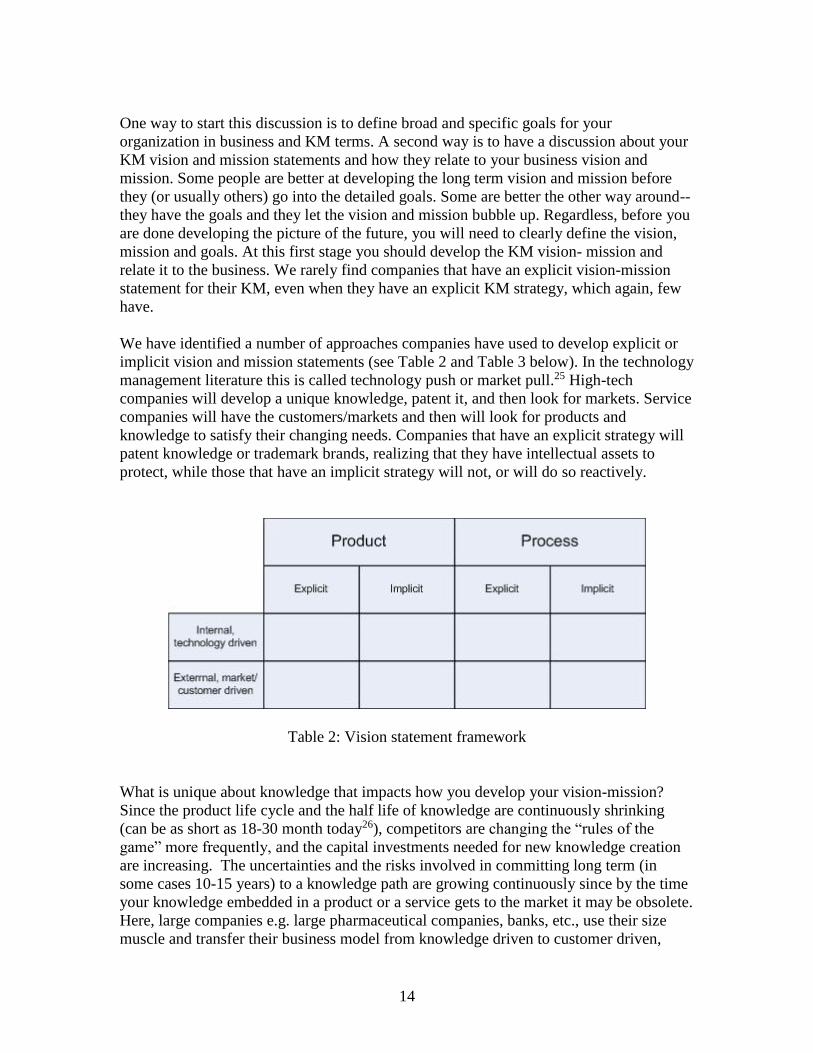
We have identified a number of approaches companies have used to develop explicit or
implicit vision and mission statements (see Table 2 and Table 3 below). In the technology
management literature this is called technology push or market pull.25 High-tech
companies will develop a unique knowledge, patent it, and then look for markets. Service
companies will have the customers/markets and then will look for products and
knowledge to satisfy their changing needs. Companies that have an explicit strategy will
patent knowledge or trademark brands, realizing that they have intellectual assets to
protect, while those that have an implicit strategy will not, or will do so reactively.
Table 2: Vision statement framework
What is unique about knowledge that impacts how you develop your vision-mission?
Since the product life cycle and the half life of knowledge are continuously shrinking
(can be as short as 18-30 month today26), competitors are changing the “rules of the
game” more frequently, and the capital investments needed for new knowledge creation
are increasing. The uncertainties and the risks involved in committing long term (in
some cases 10-15 years) to a knowledge path are growing continuously since by the time
your knowledge embedded in a product or a service gets to the market it may be obsolete.
Here, large companies e.g. large pharmaceutical companies, banks, etc., use their size
muscle and transfer their business model from knowledge driven to customer driven,
15
assuming (mostly correctly) that instead of gambling on technology, they will secure the
channels of distribution to the customers and that their size and power will allow them to
buy needed knowledge when risks are lower at a reasonable cost, and as such, they will
leave new knowledge development to small companies that are willing to take higher
risks. One problem for the large companies is that they are shifting their business models,
so pharmaceutical companies have to hire more marketing and sales people and less
PhDs in chemistry. In addition, if the large companies are completely losing their R&D
they are putting themselves at risk of losing knowledge. Their marketing people will now
have to talk to external PhDs of chemistry which sooner or later will give the knowledge
provider power. So here, we can predict a shift of power to Indian and Chinese R&D
companies in the long run. Also, the large companies now have to learn how to evaluate,
to negotiate with external partners and to develop partnerships and relationships within
the industry. This causes a shift from content/area knowledge to process knowledge-
which is also one of our six strategic dilemmas. As you can see, process knowledge is
tricky. American companies that tried to copy the Japanese process knowledge of TQM
and Six Sigma learned this the hard way. Process knowledge can be easily embedded in
some cultures but might be very difficult in others. Such knowledge is also more tacit and
embedded in people, even when you put it into policies and procedures.
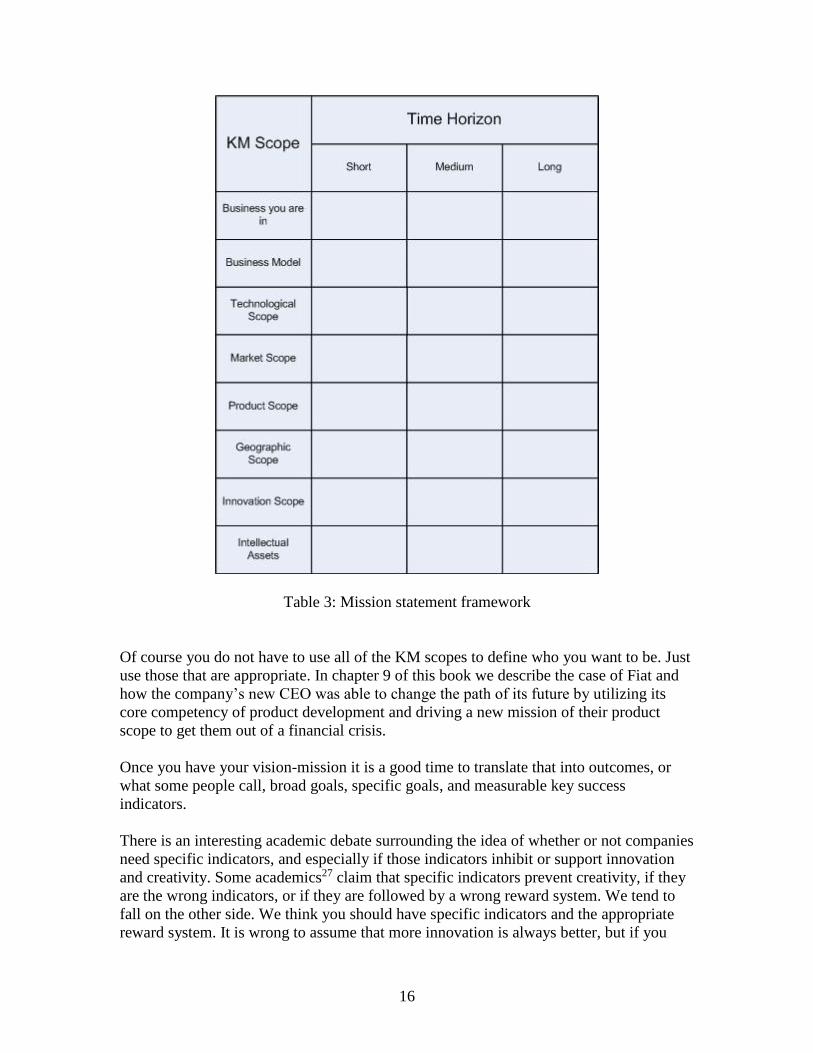
Once you know what kind of vision-mission you want to develop, you have to decide on
the time frames and specifics. Traditionally, vision is long term and less specific, while
mission is shorter term and includes specifics regarding the scope of KM in question. For
example, technological scope, market scope, product/service scope. We found the
following framework especially helpful in developing KM mission statements (see Table
3 below).
16
Table 3: Mission statement framework
Of course you do not have to use all of the KM scopes to define who you want to be. Just
use those that are appropriate. In chapter 9 of this book we describe the case of Fiat and
how the company’s new CEO was able to change the path of its future by utilizing its
core competency of product development and driving a new mission of their product
scope to get them out of a financial crisis.
Once you have your vision-mission it is a good time to translate that into outcomes, or
what some people call, broad goals, specific goals, and measurable key success
indicators.
There is an interesting academic debate surrounding the idea of whether or not companies
need specific indicators, and especially if those indicators inhibit or support innovation
and creativity. Some academics27 claim that specific indicators prevent creativity, if they
are the wrong indicators, or if they are followed by a wrong reward system. We tend to
fall on the other side. We think you should have specific indicators and the appropriate
reward system. It is wrong to assume that more innovation is always better, but if you
17
want that, CHANGE the indicators and the reward system but be sure to have some
indicators. Why? In our minds, the answer is simple: transparency (which happens to be
another strategic dilemma, see our discussion in chapter 7). We are confident that only
companies that are transparent (of course by and large-not absolutely) will be successful
in the future. As we will tell you later, this is probably the only way the markets (capital
and human) will be able to evaluate the value and decide if they want to invest money
(capital) or be employed (human), since the power is shifting from the demand side to the
supply side (both capital and talent). The other reason why measurable indicators are
crucial is that they force you to deal with gaps first (if you don’t measure, you don’t
know) and second, they force you to deal with real gaps, not perceived or imaginary gaps.
Our experience is telling us that many executives and managers will go a long way to
avoid measurable indicators because they want to avoid the accountability trap. If you
measure and you fail, someone is accountable. In the old economy this was a bad thing.
You could pay with your career. We suggest using failure as a trigger for learning, not for
execution. This does not mean that stupidity should be rewarded, nor does it mean that
failure should be punished. This is a tricky balance. If a nurse is being sued for criminal
negligence when mistakes happen, what do you think is the probability that the hospital
will be able to implement a six sigma initiative? In our humble opinion balance and
common sense are the answer, not a heavy-hand, regulated environment driven only by
judicial concerns. Why do we believe purely judicial is not the answer? Check the cost
and quality of the British healthcare system and compare it to the American and tell us
what you think.28
What are some of the dimensions of the outcomes that are affected by KB strategies
and/or are KM specific? In our consulting experience and academic research we
identified two frameworks that are of interest and relevance; the intellectual capital (e.g.,
Edvinsson and Malone, 1997) and the balanced scorecard (Kaplan and Norton, 1992).
We added a few additional potential outcomes to their recommendations, e.g., social
responsibilities and talent, and arrived at ten possible goals organizations might have.
Each of these possible goals is discussed in the following paragraphs.
Intellectual Property (IP)
Some of the most valuable assets companies in the knowledge economy have are
intellectual assets or intellectual properties like brands names, patents etc. The
intellectual asset/property values are relatively easy to quantify, since they are regulated
and have markets. They incur costs, and in some cases take a long time to build, but when
managed appropriately will have an enormous value. Cases of building value worth
billions of dollars by IBM (patents) and Coca Cola (brand equity) are well known but are
by no means unique. Companies can also choose other IPs like: trade secrets, copyrights,
trademarks, and internet domain names, among others.
Sales, Earnings, etc.
Some of the most import and simple to achieve results for KM are in the area of sales. As
such it should not be surprising that one of the first successful Knowledge Based Systems
18
successfully implemented by companies is Customer Relationship Management (CRM).
Recently companies moved into the next generation of CRM, one that allows them to use
analytics to improve sales force and customer service effectiveness as well as to acquire
the ability to identify new products or services, including after sale service. More and
more companies are realizing the potential of identifying the “big fat tail” of customer
markets and the potential for true one-to-one marketing and, as a result, increasing
revenues and profits (see also discussions in chapters 15 and 16).
Liability, Risk reduction
The value of the reduction of liabilities and risks is very hard to quantify, unless you have
to pay for a mistake someone made. Then the costs are clear, and unfortunately, in many
cases prohibitive. For example, 40% of Small and Medium Enterprises (SMEs)
companies hit by a disaster (fire, flood, etc.) do not survive the 5th year after being hit by
disaster29. The current (Nov. 2008) financial crisis is another example of financial and
other risks accrued by companies. The same can be said about liabilities encountered by
companies, in many cases without realizing the consequences. Foreign suppliers,
outsources, etc. that can provide the company with an enormous cost advantage, can also
create huge liabilities (see for example China30). Engineering knowledge is currently
required to manage risks and liabilities reduction when designers of new products are
using knowledge base tools and the risks can be quantified and the costs known. Taking
that kind of thinking to the business realm requires a change in scope and tools and, as
the current financial crisis illustrates, is not easy to accomplish.
Delivery Performance
At times, when Supply Chain Management (SCM) should be intertwined concurrently
with innovation while creating the business model at the inception of the new business, it
is seen as the next new “game breaker”. Having the right goals and indicators to manage
SCM could make or break a company. On time delivery and inventory management on
the go are legendary for making Wal-Mart and Dell what they are. Other delivery
performance indicators might be error elimination, rush orders, damaged goods, etc., (see
also the discussion in chapter 18).
Cost Savings
The simplest goal to document, the easiest to implement, and the most important at the
early stages of the KM journey for the organization’s set of goals and indicators is the
cost savings one. Early studies suggest that successful KM initiatives in this area have an
extremely high rate of ROI.
Quality
Quality initiatives, TQM and/or Six Sigma (you name the buzz word of the month) are
everywhere. Underlying quality is the knowledge and talent needed to support such
initiatives (see also the discussion in chapter 17) as the experience and tremendous
success of Toyota illustrates.31 The goals here can be quality improvement in processes
19
resulting in cost savings, or improving sales due to increased customer satisfaction. There
is one goal that we are strongly NOT recommending (which will not make us the
favorites of quality gurus) and that is the quality awards. If you want to know more, look
into how many quality awards Motorola32 received and the correlation this had with
market share of profitability. Or look into companies that tried to reengineer their
processes and on their journey to successful reengineering eliminated a whole slew of
middle managers and resulted in losing critical knowledge.33
Flexibility, Agility, Responsiveness
Knowledge embedded in process management can support flexible strategic (and
operational) moves, agility under attack and responsiveness to market, and customers’
opportunities (see also the discussion in chapter 3). Specific goals here might be, for
example, having a flexible manufacturing strategy that allows every facility in the world
to manufacture every car within a specific time frame (Honda34) or receiving
compliments from customers, translated into better location in stores or new orders from
customers (Blue Rhino35).
Innovation, Creativity
Probably the most difficult area in which to use KM, since the systems are not so helpful,
is at the fuzzy front end of the creativity and innovation process. Due to the time lag,
complexities, etc. it is easy to measure lagging indicators in this area like new product
sales but defining and validating leading indicators for innovation and creativity is much
more difficult.
Learning, Talent Improvement
In the knowledge economy the most import assets and the most difficult to measure are
related to human capital (HC), succession planning, and talent mentoring, just to mention
a few. Also, relationship or social capital, learning and forgetting, and investing in and
depreciation of HC are difficult to define and validate.
Social Responsibility, Sustainability
Social responsibility and sustainability have been recently accepted as an important set of
goals and indicators, are highly debatable and are not strongly and positively reinforced
by the markets and shareholders. For example, some companies are using the Leadership
in Energy and Environmental Design (LEED) building rating, or some investment
companies will only invest in companies that are socially responsible. So a company can
make a decision that x% of it s new buildings will be LEED platinum certified, or that by
a specific date it will have a chief ethics officer.
By no means is this a comprehensive list. You may want to add, eliminate, or modify it to
your specific needs. As always, too few or too many is a bad thing. You also have to
20
think about progression. It is really very hard to run unless you can walk (as any parent
with toddlers can tell you). This is what absorptive capacity36 talks about. In other words,
if you are a young start-up company you can run, BUT you must have legs, and since
yours have not had the time to grow and mature you have to get them from the outside:
buy, hire, etc.
To find the right set of outcomes for you, you will have to go through the whole cycle a
couple of times and each time refine, modify, etc. until you find what works for you. One
word of warning, though---You are NEVER done, since a accelerated pace of change is
the only constant.
The Knowledge-Based Gap Analysis
The next step is to identify the gaps between where you are and where you want to be.
Starting with the vision-mission takes us back to the discussion about assumptions, or
how you frame the discussion (e.g. present or future terms). Consider Amazon.com’s
strategic dilemma in the late 90’s: if you frame the discussion of vision-mission as
Amazon.com being a company selling books (present) the gaps are of one kind, BUT if
you frame the discussion in terms of the future (multilayer market, retailer) then you have
very different gaps. Of course, at the time only the top executives of the company were
aware of this dilemma, because the rest of us saw the actions. But, this is exactly the
point. What are the assumptions you have? In our opinion you are always better
documenting (codifying) your assumptions if you can37. This documentation process will
make your life easier in the future.
21
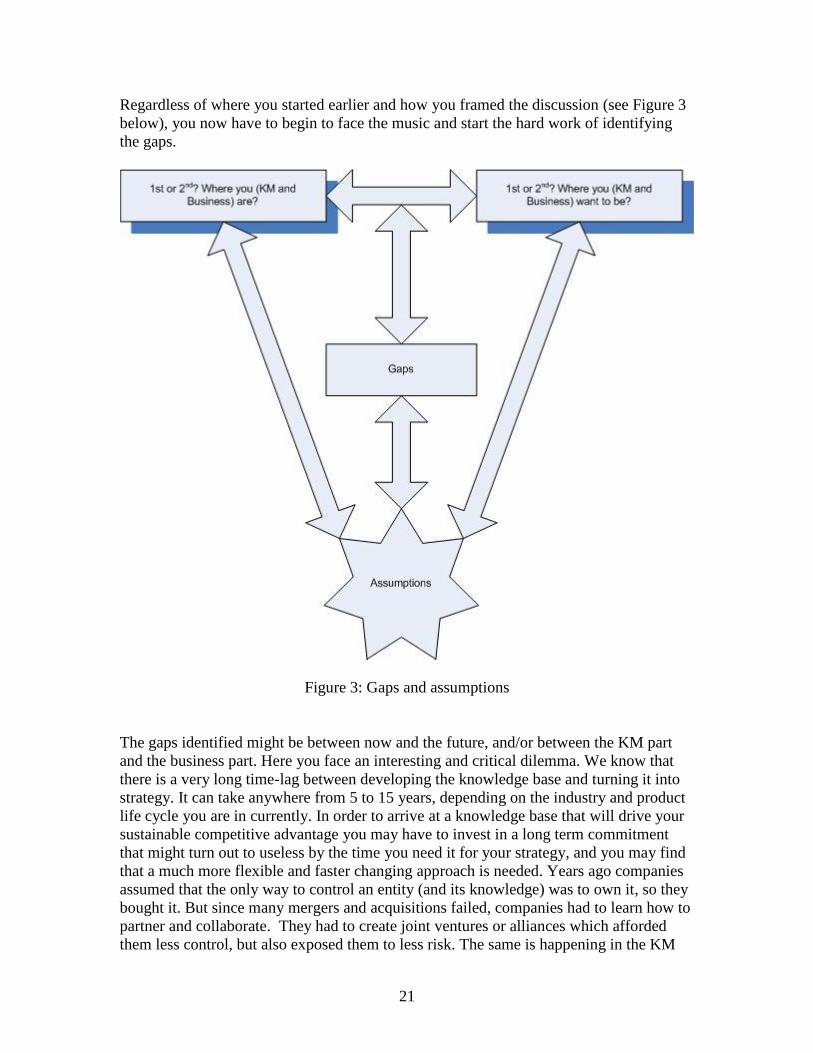
Regardless of where you started earlier and how you framed the discussion (see Figure 3
below), you now have to begin to face the music and start the hard work of identifying
the gaps.
Figure 3: Gaps and assumptions
The gaps identified might be between now and the future, and/or between the KM part
and the business part. Here you face an interesting and critical dilemma. We know that
there is a very long time-lag between developing the knowledge base and turning it into
strategy. It can take anywhere from 5 to 15 years, depending on the industry and product
life cycle you are in currently. In order to arrive at a knowledge base that will drive your
sustainable competitive advantage you may have to invest in a long term commitment
that might turn out to useless by the time you need it for your strategy, and you may find
that a much more flexible and faster changing approach is needed. Years ago companies
assumed that the only way to control an entity (and its knowledge) was to own it, so they
bought it. But since many mergers and acquisitions failed, companies had to learn how to
partner and collaborate. They had to create joint ventures or alliances which afforded
them less control, but also exposed them to less risk. The same is happening in the KM
22
area. Fewer companies are doing the research part of the R&D part and more are doing
the development. Also, not all companies that invest heavily in R&D are doing well (did
we mention Ford38?). What is this suggesting? Companies must rapidly learn what their
REAL gaps are and how they can close them quickly and at a reasonable price. If they do
not, bad things will likely happen.
Next, we will discuss the different types of gaps that you might identify. For example,
you might identify that you do not have an explicit KM strategy, but you do have an
explicit business strategy (most companies have) and you have a quality strategy (more
and more companies have). You also might be aware of innovation issues that you have,
and you begin to hear more and more about environmental issues, but you do not have
those strategies explicitly stated. First you have to identify the gaps you currently have
between your KM strategy, your business strategy and your quality strategy. For
example, is your reward system consistent with all of your explicit strategies? We rarely
find companies that have their reward system aligned with their strategies, so this is one
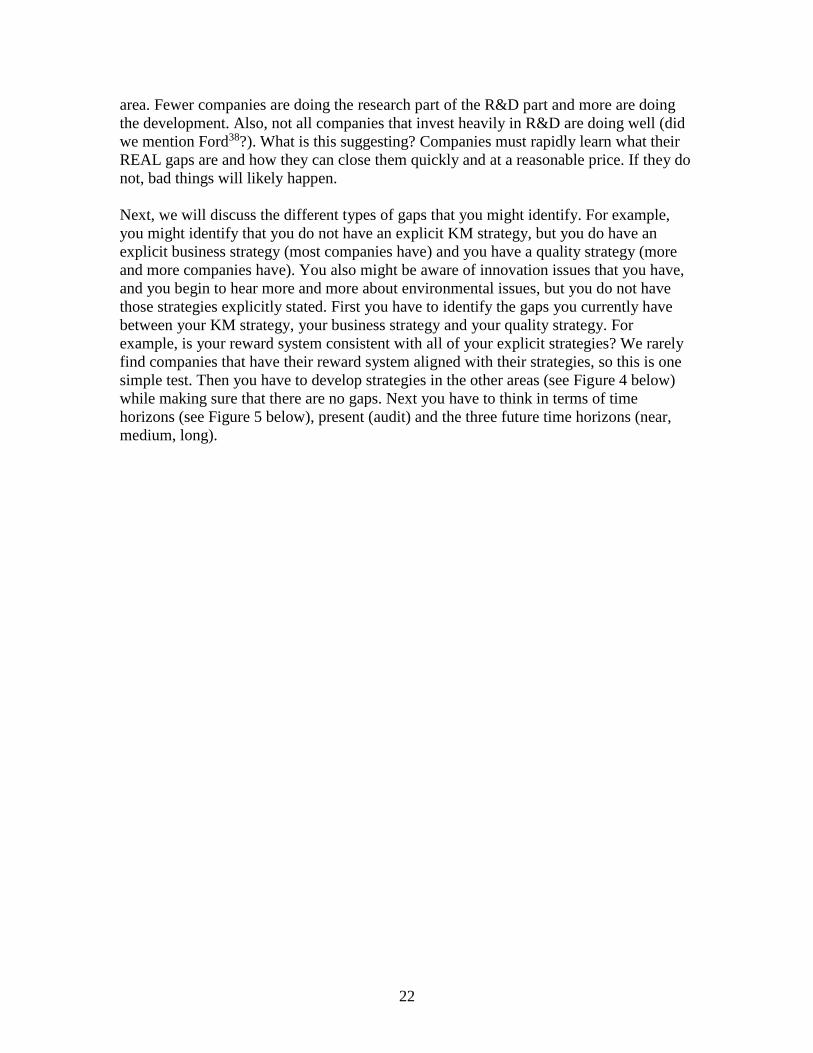
simple test. Then you have to develop strategies in the other areas (see Figure 4 below)
while making sure that there are no gaps. Next you have to think in terms of time
horizons (see Figure 5 below), present (audit) and the three future time horizons (near,
medium, long).
23
Figure 4: Framework A for gaps analysis
Business
Strategy
KM-KB
Strategy
Quality
Strategy
Environmental
Strategy
Innovation
Strategy
Supply Chain
Management
Strategy
MIS Strategy
Marketing
Strategy
HR Strategy
24
Some gaps are more important than others. For example at “Agresco” the gap that killed
KM was the one between MIS and KM. Paradoxally, KM was originally located within
MIS. The head of MIS was very supportive of KM and provided the KM team with
resources and operated as their mentor and sponsor. But along the way, information
security and hardware strategy were obstacles and issues that were difficult to resolve.
KM was never truly (in our opinion) incorporated into/with MIS strategy. And so, when
the team head retired and the sponsor moved on, the KM team was dissolved. This might
be an extreme, endearment/survival case, but it illustrates the point that some gaps are
more important than others. Obviously, over time, the relative importance changes. This
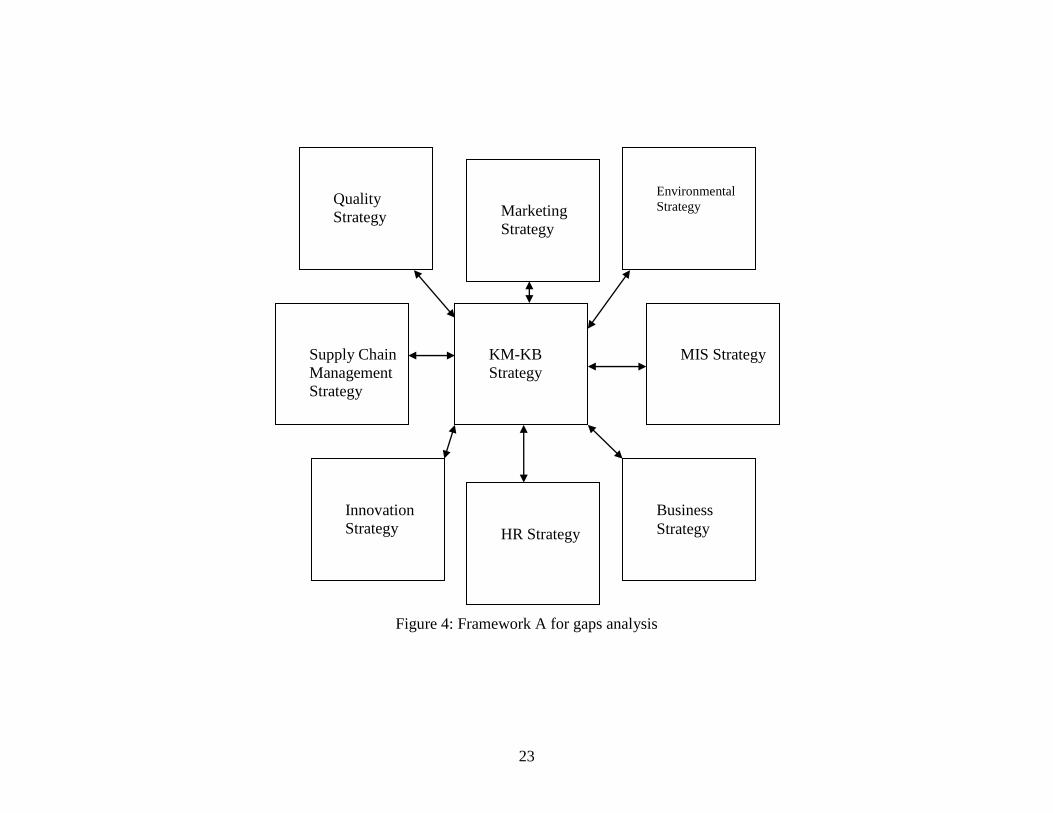
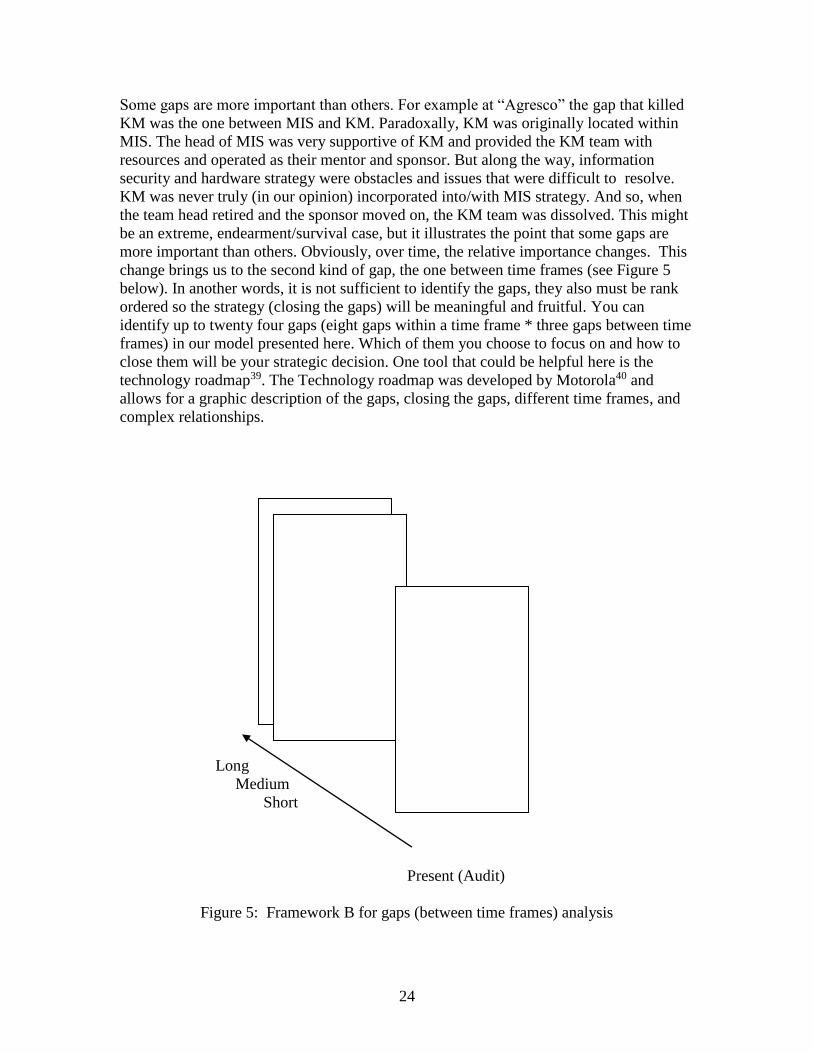
change brings us to the second kind of gap, the one between time frames (see Figure 5
below). In another words, it is not sufficient to identify the gaps, they also must be rank
ordered so the strategy (closing the gaps) will be meaningful and fruitful. You can
identify up to twenty four gaps (eight gaps within a time frame * three gaps between time
frames) in our model presented here. Which of them you choose to focus on and how to
close them will be your strategic decision. One tool that could be helpful here is the
technology roadmap39. The Technology roadmap was developed by Motorola40 and
allows for a graphic description of the gaps, closing the gaps, different time frames, and
complex relationships.
Long
Medium
Short
Present (Audit)
Figure 5: Framework B for gaps (between time frames) analysis
25
Finally, we want to take a moment to provide an overview of the tools we have created to
give a better understanding of how to utilize and value knowledge assets. Those tools will
be elaborated on later in chapters 4, 7 and 9 in this book.
The Tools
KARMA – The Audit
KARMA or the Knowledge Audit Review and Management Assessment has been
developed and utilized in over 70 organizations. Its purpose is to allow an organization to
systematically assess the current status of its knowledge base. For example, KARMA
allows organizations to understand what knowledge they possess as well as where their
knowledge assets reside. Most organizations don’t really know what knowledge they
have, and those that do, usually don’t know how to utilize that knowledge effectively. It
should be noted that most organizations that value and use their knowledge assets, do so
intuitively (not systematically). Our research affirms that there is no evidence that points
to a systematic evaluation and exploitation of knowledge to support strategic
management in companies.
We will take a more in depth look at KARMA in the next chapter but you should keep
the following issues in mind:
KARMA identifies where you have pockets of knowledge building blocks as well as
potential “Knowledge Gaps.”
KARMA is not the driver of your knowledge management systems or your strategic
plan.
KARMA can show you where you need additional knowledge; it can’t tell you how
to get that knowledge.
KARMA can show you where to put the “X.”
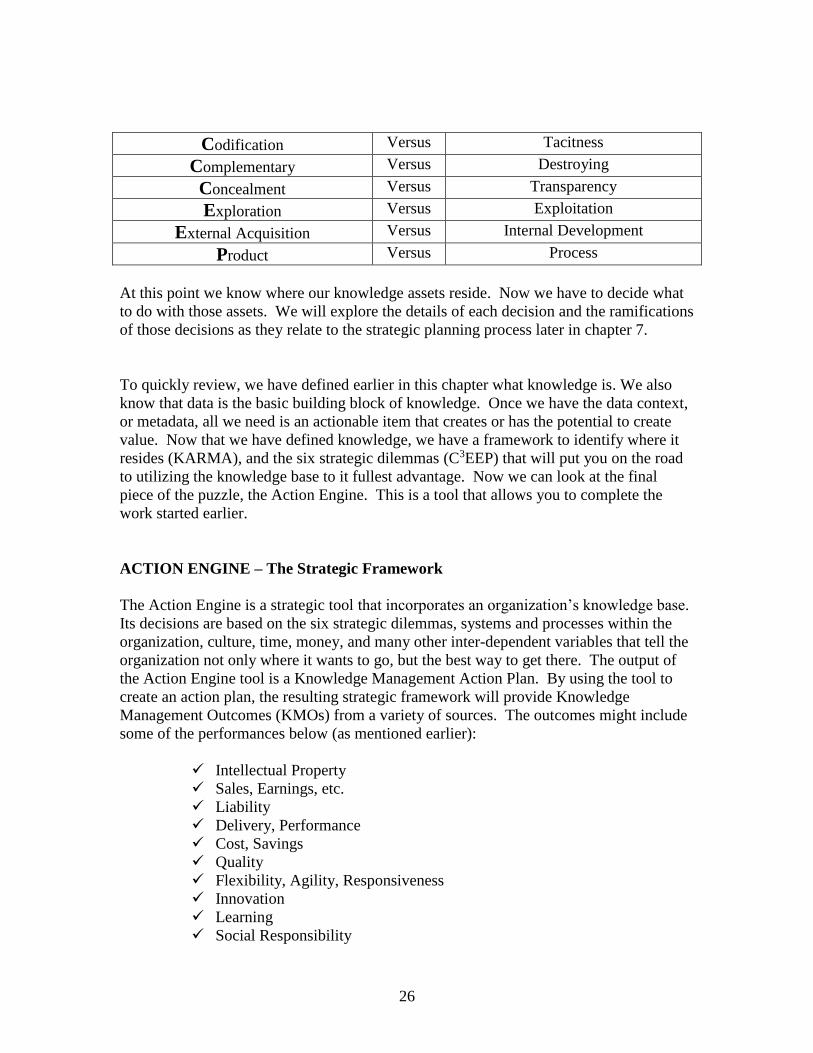
C3EEP – The Strategic Dilemma Matrix
C3EEP (Codification, Complementary, Concealment, Exploration, External Acquisition,
and Product dilemmas, see chart below) frames the data collected from KARMA and
presents management with specific questions based on the organization’s knowledge
base. Up to this point, we have mentioned strategic thinking but here is where it begins
to come into play. We have developed a matrix that requires management to focus on the
types of knowledge it possesses or would like to posses and begins to guide management
to make the most appropriate decisions based on “Where do you want to go”?
26
Codification Versus Tacitness
Complementary Versus Destroying
Concealment Versus Transparency
Exploration Versus Exploitation
External Acquisition Versus Internal Development
Product Versus Process
At this point we know where our knowledge assets reside. Now we have to decide what
to do with those assets. We will explore the details of each decision and the ramifications
of those decisions as they relate to the strategic planning process later in chapter 7.
To quickly review, we have defined earlier in this chapter what knowledge is. We also
know that data is the basic building block of knowledge. Once we have the data context,
or metadata, all we need is an actionable item that creates or has the potential to create
value. Now that we have defined knowledge, we have a framework to identify where it
resides (KARMA), and the six strategic dilemmas (C3EEP) that will put you on the road
to utilizing the knowledge base to it fullest advantage. Now we can look at the final
piece of the puzzle, the Action Engine. This is a tool that allows you to complete the
work started earlier.
ACTION ENGINE – The Strategic Framework
The Action Engine is a strategic tool that incorporates an organization’s knowledge base.
Its decisions are based on the six strategic dilemmas, systems and processes within the
organization, culture, time, money, and many other inter-dependent variables that tell the
organization not only where it wants to go, but the best way to get there. The output of
the Action Engine tool is a Knowledge Management Action Plan. By using the tool to
create an action plan, the resulting strategic framework will provide Knowledge
Management Outcomes (KMOs) from a variety of sources. The outcomes might include
some of the performances below (as mentioned earlier):
Intellectual Property
Sales, Earnings, etc.
Liability
Delivery, Performance
Cost, Savings
Quality
Flexibility, Agility, Responsiveness
Innovation
Learning
Social Responsibility
27
These performances are created by: KM Processes, KM/IS Systems, and KM Levers.
The KM processes might include Communities of Practice, Product Councils, Functional
Units, Project Teams, Informal Networks, etc. There is no predefined list and each
organization will dictate the processes that it deems appropriate. The systems might
include KM/IS Architecture, Security Policies, Access to Systems (internal and external),
Maintenance and Update Policies, etc. The levers might include HR hiring practices,
Reward Systems, Cross Functional Collaboration, Core Competencies, Top Management
Support, External Relationships, Culture, and Risk Tolerance. Again, the specifics of the
systems and levers will be dictated by the organization.
Think of these KMOs as the forces pulling up the KM Action Plan. If it were that simple,
a management team could create a strategic plan and be on its way to success. However,
there are also a number of forces pulling down from the bottom. An organization must
be very familiar with the pull downs as well since we all deal with them on a daily basis.
We’re talking about the pull downs of Resources and Constraints.
On the Resource side, you have things like Time, Money, Physical Plant Capacity, and
Real Estate for Human Resources (Offices and Cubes), Authorized Head Count, etc. On
the Constraint side, you have Time (again), Money (again), Reward Systems, HR
Policies, Top Management Support (or lack of), Culture, and (lack of) Risk Tolerance.
This is the most complex area to work in because there are interdependencies that
actually build the plan of action. This is where strategic action is actually put in place
and you can quickly see the implications and rewards of this kind of thinking. This is not
an easy road to travel. Organizations will find many bumps and potholes in the road.
The obstacles the organization may have to maneuver around may challenge some
closely held beliefs. When we discuss the concept of KARMA later in the book, we will
dig deeper into the specifics and mechanics.
Conclusions
To recap the highlights of this chapter, we would like to provide you with what we
believe are the most important concepts to assist in your understanding of the process:
Don’t assume metadata exists – verify and make the metadata explicit.
Managing knowledge is a complex process – use systems thinking as a framework
of reference.
Sharing data and information is not sharing knowledge – don’t confuse the three
definitions.
If there is no action (or potential for action) that creates (or has the potential to
create) value, there is no new knowledge created.
For a team or an organization to create knowledge, people, and systems (and/or)
processes working in tandem are required.
Watch for assumption when you are working on the audit (KARMA).
28
Frame your strategic discussions as a set of trade-offs/dilemmas.
Your Knowledge Management strategy should be driven by outcomes, supported
by People, Systems, Processes, and other KM levers, and mitigated by available
resources and other restraints.
The use of these tools, KARMA, the C3EEP Matrix, and the Action Engine, will give an
organization the means to create and sustain a competitive advantage. The results
obtained from the use of these tools may confirm management’s suspicions. The tool
results may point the organization in a direction that was different from its original
expectations. At the very least, the results should provide insights into an organization
that management never knew existed. The use of the tools may even surprise you by
exposing opportunities where none were thought to exist. The use of the tools may also
lead an organization to the realization that a process or technology it possesses isn’t as
valuable as once thought.
Acknowledgments
The first author wishes to acknowledge the Frederick E. Baer Professorship in Business
for partial financial support. The authors wish to thank Kelly Anklam for her assistance
in editing this chapter.
References
Adamson, I. (2005). Knowledge Management – The next generation of TQM? Total
Quality Management & Business Excellence, Oct./Nov. 16(8/9), 987-1000.
Ahokangas, P. (1998). Internationalization and resources: An analysis of processes in
Nordic SMSs, doctoral dissertation, Universitas Wasaensis, Vaasa.
Bowman, E. H. (1974). Epistemology, corporate strategy, and academe. Sloan
Management Review, 15, 35–50.
Brush, C. G., Greene, P. G., & Hart, M. M. (2001). From initial idea to unique advantage:
The entrepreneurial challenge of constructing a resource base. Academy of
Management Executive, 15(1), 64-78.
Chesbrough, H. W. (2007). Why companies should have open business models. MIT
Sloan Management Review, 48(2), 22-28.
Cohen, W. M., & Levinthal, D. A. (1990). Absorptive capacity: A new perspective on
learning and innovation. Administrative Science Quarterly, 35, 128–152.
Cooper, A.C., Woo, C.Y., & Dunkelberg, W.C. (1989). Entrepreneurship and the initial
size of firms. Journal of Business Venturing, 4(5), 317-332.
29
Edvinsson, L., & Malone, M. S. (1997). Intellectual Capital: Realizing Your Company’s
True Value by Finding its Hidden Brainpower. New York, NY: Harper Business.
Elenurm, T. (2003). Knowledge management development challenges of transition
economy organisations representing different value creation models. Electronic
Journal of Knowledge Management, 1(2), 47-56. Retrieved November 12, 2008, from
http://www.ejkm.com/volume-1/volume1-issue-2/issue2-art5-elenurm.pdf
Fiol, C. M., & Lyles, M. A. (1985). Organizational learning. Academy of Management
Review, 10(4), 803-813.
Frery, F. (2006). The fundamental dimensions of strategy. Sloan Management Review,
(Fall), 48(1), 71–75.
Garcia, M. L., & Bray, O.H. (1997). Fundamentals of Technology Roadmapping.
Strategic Business Development Department Sandia National Laboratories.
Hafeez, K., Zhang, Y., & Malak, N. (2002). Core competence for sustainable competitive
advantage: A structured methodology for identifying core competence. IEEE
Transactions on Engineering Management, 49, 28-35.
Holmes, J. S., & Glass, J.T. (2004). Internal R&D-Vital but only one piece of the
innovation puzzle. Research Technology Management, 47(5), 7-10.
Iaquinto, A. L. (1999). Can winners be losers? The case of the Deming prize for quality
and performance among large Japanese manufacturing firms. Managerial Auditing
Journal, 14(1/2): 28-35.
Ichijo, K., & Kohlbacher, F. (2007). The Toyota way of global knowledge creation the
‘learn local, act global’ strategy. International Journal of Automotive Technology and
Management, 7(2/3), 116-134.
Ichijo, K., & Kohlbacher, F. (2008). Tapping tacit local knowledge in emerging markets
– The Toyota way. Knowledge Management Research & Practice, 6, 173–186.
Johanson, J., & Mattsson, L.-G. (1993). Internationalization in industrial systems – A
network approach, strategies in global competition. In P. J. Buckley, & P. N. Ghauri
(Eds.), The Internationalization of the Firm: A Reader (pp.303-22). London:
Academic Press.
Johanson, J., & Vahlne, J. E. (1990). The mechanism of internationalization.
International Marketing Review, 7(4), 11-24.
Kagono, T. (1988). The Cognitive Theory of Organization. Tokyo: Chikura Shobou, (in
Japanese).
30
Kaplan, R. S., & Norton, D. P. (1992). The balanced scorecard - Measures that drive
performance. Harvard Business Review, January/February, 71-79.
Lin, L-H. (2009). Mergers and acquisitions, alliances and technology development: An
empirical study of the global auto industry. International Journal of Technology
Management, 48(3), 295-307.
Mikkola, J. H. (2001). Portfolio management of R&D projects: implications for
innovation management. Technovation, 21, 423–435.
Mooney, L. (2007). BPM – A whole new world of opportunity. KM World, January, 54-
55.
Mowery, D.C., & Rosenberg, N. (1979). The influence of market demand upon
innovation: A critical review of some empirical studies. Research Policy, 8, 102–153.
Pfeffer, J. (2001). Fighting the war for talent is hazardous to your organization’s health.
Organizational Dynamics, 29, 248-259.
Pfeffer, J. (2002). To Build a Culture of Innovation, Avoid Conventional Management
Wisdom. In F. Hesselbein, M. Goldsmith, & I. Somerville (Eds.), Leading for
Innovation: And Organizing for Results (pp. 95-104). San Francisco: Jossey-Bass.
Phaal, R., Farrukh, C., & Probert, D. (2001). Technology Roadmapping: Linking
technology resources to business objectives. Centre for Technology Management,
University of Cambridge.
Raynor, M. E. (2007). What is corporate strategy, really? Ivey Business Journal Online,
71(8), 1-6. Retrieved June 28, 2009, from ABI/INFORM Global. (Document
ID: 1451062821).
Robey, D., Boudrea, M-C., & Rose, G. M. (2000). Information technology and
organizational learning: A review and assessment of research. Accounting,
Management & Information Technology, 10, 125-155.
Russ M. (2008). Do we need a new theory, or a conceptual model to explain SME
Internationalization or do we need to apply existing theories and conceptual models
by using a different epistemology? Paper presented in the International Business
Symposium at the International Academy of Management and Business Conference
in San Diego, CA, January 28-30, 2008.
Ruzzier, M., Hisrich, R. D., & Antoncic, B. (2006). SME Internationalization Research: Past,
Present, and Future. Journal of Small Business and Enterprise Development, 13(4), 476-
497.
31
Shahabuddin, S. (2008). Six Sigma: Issues and problems. International Journal of
Productivity and Quality Management, 3(2), 145-160.
Shannon C. E., & Weaver, W. (1949). The Mathematical Theory of Information. Urbana,
IL: University of Illinois Press.
Siefe, C. (2006). Decoding the Universe: How the New Science of Information is
Explaining Everything in the Cosmos, from our Brains to Black Holes. New York,
NY: Viking.
Takahashi,T., & Vandenbrink, D. (2004). Formative knowledge: From knowledge
dichotomy to knowledge geography – Knowledge management transformed by the
ubiquitous information society. Journal of Knowledge Management, 8(1), 64-76.
Ulrich, D., & Smallwood, N. (2004). Capitalizing on capabilities. Harvard Business
Review, 82(6), 119-127.
von Baeyer, H. C. (2003). Information: The New Language of Science.
London:Weidenfeld and Nicolson.
von Krogh, G., & Roos, J. (1995). Organizational Epistemology. London: MacMillan.
Welch, L., & Luostarinen, R. (1993). Internationalization: Evolution of a concept. In P. J.
Buckley, & P. N. Ghauri (Eds), The Internationalization of the Firm: A Reader (pp.
155-171). London: Academic Press.
Willyard, C. H., & McClees, C. W. (1987). Motorola’s technology roadmap process.
Research Management, Sept.-Oct., 13-19.
Yamada, J. (2004). A multi-dimensional view of entrepreneurship: Towards a research
agenda on organisation emergence. Journal of Management Development, 23(4), 289-
320.
Zaun, T. (2003, April 28). In Asia, Honda Employs New Tactic in Building Cars. Wall
Street Journal (Eastern Edition), p. A.11. Retrieved June 28, 2009, from
ABI/INFORM Global. (Document ID: 329642741).
1 See Bowman, 1974, p. 49 for discussion of epistemology in the context of strategy. 2 Based on von Krogh and Roos, 1995. 3 Based on Robey et al., 2000. 4 Fiol and Lyles, 1985. 5 Robey, Boudreau, and Rose, 2000, p. 130. 6 Based on Robey et al., 2000. 7 Bowman, 1974, p. 46. 8 Frery, 2006. 9 Raynor, 2007, quoted, p. 3. 10 Chesbrough, 2007, p. 13, exhibit 1. 11 Modified from Chesbrough, 2007.
32
12 Welch and Luostarinen, 1993, p. 156. 13 Ahokangas, 1998; cited from Ruzzier et al. 2006, p. 479. 14 Johanson and Vahlne, 1990, p. 20. 15 Johanson and Mattson, 1990, cited from Ruzzier et al. 2006, p. 484. 16 Based on Kagono, 1988; cited from Yamada, 2004. 17 Yamada, 2004, p. 293. 18 Cooper et al., 1995; cited from Yamada, 2004, p. 295. 19 Kagono, 1988; cited from Yamada, 2004, p. 298. 20 See for example the discussion about NASA’s Mars Climate Orbiter in
http://mars.jpl.nasa.gov/msp98/news/mco990930.html 21 Seife, 2006, Decoding the universe. 22 Von Baeyer, 2003, Information: The new language of science. 23 Shannon and Weaver, 1949. 24 See discussion in Brush et al. (2001) and by Hafeez et al. (2002). 25 See for example Mowery and Rosenberg, 1979, or Phaal, Farrukh and Probert, 2001. 26 see for example Ulrich and Smallwood 2004, http://kwork.org/Stars/Ulrich/Capabilities.pdf 27 See for example Pfeffer, 2002. 28 You can see the answer in the article in Time Magazine, June 8, 2009, vol. 173, No. 22, pp. 44-45,
New Lessons From the Old World, by Eben Harrell. 29 http://jobfunctions.bnet.com/abstract.aspx?docid=66602 30 For example http://wistechnology.com/articles/4150/ 31 See discussion of Toyota KM and talent in for example: Pfeffer, 2001, Ichijo and Kohlbacher, 2007
and Ichijo and Kohlbacher, 2008. 32 See examples in http://www.answers.com/topic/motorola-inc or Iaquinto, 1999 and Shahabuddin,
2008. 33 See Adamson, 2005. 34 See discussion of Honda’s manufacturing strategy in Takahashi and Vandenbrink, 2004, or Zaun,
2003. 35 See Mooney, 2007. 36 Cohen and Levinthal, 1990. 37 See example of KM assumptions in Elenurm, 2003, available at http://www.ejkm.com/volume-
1/volume1-issue-2/issue2-art5-elenurm.pdf 38 See discussions about Ford R&D in: Mikkola, 2001, Lin, 2009, Holmes and Glass, 2004. 39 See example at Garcia & Bray, 1997 and in Phaal et al., 2001. 40 CH Willyard, CW McClees - Research Management, 1987.