Embed Size (px)
Citation preview
Journal of Educational Psychology1996, Vol. 88, No. 3, 572-585
Copyright 1996 by the American Psychological Association, Inc.0O22-0663/96/$3.OO
Conceptual Maps and Simulated Teaching Episodes as Indicators ofCompetence in Teaching Elementary Mathematics
Rebecca L. Gomez and O. D. HadfieldNew Mexico State University
Lynn D. HousnerWest Virginia University
Network representation was used to assess knowledge obtained during a teaching method-ology course in elementary mathematics. Participants were the course instructor, 4 teachereducators, and 53 prospective teachers. Relatedness ratings on key terms were used toconstruct associative networks. Teacher educator networks shared significant similarities tothe course instructor's network, and similarities between the teacher educator and prospectiveteacher networks were as predictive of course grades as similarity to the course instructor.Fourteen of the prospective teachers participated in a simulated teaching task. Networksimilarity predicted teaching for conceptual understanding, as did final course grade, and wasmore predictive than were either exams or lab scores. The advantage of associative networksmay be in representing patterns of concept relations underlying mental models of teaching.
Teaching for conceptual understanding has become oneof the fundamental components of reform movements inmathematics education. Educational researchers and profes-sional associations alike are advocating a greater emphasison the development of conceptual knowledge to comple-ment the traditional emphasis on procedural knowledge(Eisenhart et al., 1993; Even, 1993; Mathematical SciencesEducation Board, 1991; Mathematical Association ofAmerica, 1991; National Council of Teachers of Mathemat-ics, 1991).
Procedural knowledge is defined as knowledge of thesymbols, rules, and algorithms that are used for solvingmathematical problems (Eisenhart et al., 1993), whereasconceptual knowledge is defined as "the relationships andinterconnections of ideas that explain and give meaning tomathematics" (Eisenhart et al., 1993, p. 9). In short, con-ceptual knowledge is an understanding of the concepts thatunderlie procedures. A procedural approach to teachingdivision of fractions would emphasize a series of steps suchas (a) writing down the problem, (b) inverting the divisor,and (c) multiplying the resulting fractions. A conceptualapproach, in contrast, would use models and manipulatives(e.g., cuisenaire rods, fraction bars, drawings) to convey therelationships of concepts such as whole number division,
Rebecca L. Gomez, Department of Psychology, New MexicoState University; O. D. Hadfield, Department of Curriculum andInstruction, New Mexico State University; Lynn D. Housner,School of Physical Education, West Virginia University.
The alphabetical ordering of authorship reflects equal contribu-tions to this research. This research was supported in part by agrant from the Center for Teaching Excellence, Eastern NewMexico University. We would like to thank Roger Schvaneveldtfor his helpful comments regarding this article.
Correspondence concerning this article should be addressed toRebecca L. Gomez, Department of Psychology 3452, Box 30001,New Mexico State University, Las Cruces, New Mexico 88003.Electronic mail may be sent via Internet to [email protected].
multiplication, and fractions, to the concept division offractions. A conceptual approach might also emphasize therelation of fractions to proportions.
Educational researchers have also shown an increasedinterest in the relationship between subject matter knowl-edge and the instructional processes that teachers use inconveying such knowledge to learners. This idea has be-come known as pedagogical content knowledge. Accordingto Shulman (1987), pedagogical content knowledge is "thecapacity of a teacher to transform the content knowledge heor she possesses into forms that are pedagogically powerfulyet adaptive to the variations in ability and backgroundpresented by the students" (p. 15). Conveying subject matterin understandable forms is fundamental to the notion ofpedagogical content knowledge and involves constructingalternate ways of representing ideas to students. Shulmanadvocates the use of analogies, metaphors, examples, dem-onstrations, and simulations for this purpose.
Since the introduction of pedagogical content knowledge,educational researchers have embarked on research pro-grams for defining such knowledge in specific subject mat-ter areas. Research in mathematics education has focused onthe relationship between knowledge of the subject matterand the application of pedagogical content knowledge inprospective and experienced teachers (Ball, 1990; Ball &McDiarmid, 1988; Borko & Livingston, 1989; Cobb, Wood,& Yackel, 1990; Eisenhart et al., 1993; Even, 1993; Fen-nema, Frank, Carpenter, & Carey, 1993; Leinhardt & Smith,1985; Livingston & Borko, 1989, 1990; Tirosh & Graeber,1990). The research generally demonstrates that experi-enced teachers have richer, more well-instantiated cognitiverepresentations about subject matter, pedagogical contentknowledge, classrooms, and the nature of children than doinexperienced teachers. The breadth and depth of experi-enced teachers' knowledge enable them to provide instruc-tion that is at once comprehensive and responsive to studentneeds. Furthermore, experienced teachers are able to re-
572
CONCEPTUAL MAPS AS INDICATORS OF TEACHING SKILL 573
spond effectively to a diverse set of student learning prob-lems through flexible and improvisational application ofrobust, field-tested instructional routines and heuristics (i.e.,pedagogical content knowledge built up in memory as afunction of extensive teaching experience). In contrast, pro-spective and beginning teachers may have adequate subjectmatter knowledge, but when confronted with student com-prehension problems, they often have difficulty generatingalternate methods for conveying content knowledge. Fur-thermore, prospective and beginning teachers may believein the value of teaching mathematics conceptually but maylack a firm enough foundation in the subject matter or thepedagogical content knowledge to teach for conceptual un-derstanding. Finally, student teachers often encounter a con-flict between the views espoused by university teachereducators and school administrators and the actual imple-mentation of mathematics curricula in the schools. Forexample, teacher educators, central administrators, andprincipals may encourage teaching for conceptual under-standing, but a number of factors may work against suchefforts. Required standardized testing, management systemsbased on procedural knowledge, and the commitment ofsome cooperating teachers to teach "only" proceduralknowledge reduces the opportunities for student teachers toacquire the pedagogical content knowledge necessary forteaching conceptual knowledge (Eisenhart et al., 1993).
Statement of the Problem
Livingston and Borko (1989) suggest that educationalresearch should focus more on determining the types ofteacher education experiences that aid novices in develop-ing expert-like knowledge structures. Additionally, little isknown about the actual content and organization of teachereducator knowledge and how that knowledge is imparted toprospective teachers (Floden & Klinzing, 1990; Howey &Zimpher, 1990). Finally, research on prospective teachershas not assessed the substance and organization (or struc-ture) of knowledge obtained during teaching methodologyclasses in elementary mathematics. Instead, the researchconducted thus far has focused on observations of studentteachers and beginning teachers as they teach mathematicsto children, and then infers the nature of conceptual andpedagogical content knowledge from these observations.Direct assessments of conceptual mathematical knowledgeacquired during teacher education coursework and the ap-plication of this knowledge to student teaching has not beenforthcoming. An attempt to assess and compare the concep-tual and pedagogical content knowledge of teacher educa-tors and prospective teachers has potential for contributingto an understanding of novice-expert differences in elemen-tary math education, as well as methods for enhancing anddeveloping such knowledge in prospective teachers.
Structural-Based Assessment
Conceptual and pedagogical content knowledge can beassessed structurally using the Pathfinder network scaling
algorithm (Schvaneveldt, 1990; Schvaneveldt, Durso, &Dearholt, 1981, 1989) and an associated measure of net-work similarity. The Pathfinder network scaling algorithmgenerates empirically derived network representations ofthe associative structure among a set of concepts by takingrelatedness ratings as input to use in generating networkswhere each concept is represented by a node, and therelations between concepts are represented by links betweennodes. The algorithm operates by computing all paths be-tween two nodes and includes a link between those nodesonly if the link represents the most direct (or minimumlength) path between the two concepts. In Pathfinder net-works, highly related concepts are directly linked and lessrelated concepts are separated by two or more links. Thereader will recognize that Pathfinder networks are essen-tially semantic networks without labeled relations. Addi-tionally, the primary method for constructing semantic net-works is theoretical in nature (Collins & Loftus, 1975;Meyer & Schvaneveldt, 1976; Quillian, 1969), whereasPathfinder generates networks empirically from estimates ofpsychological distance.
The first step in the general procedure for producingPathfinder networks requires generating a list of conceptsrepresenting the domain of inquiry (in the present domainthe concepts reflect the course instructor's view of concep-tual and pedagogical content knowledge critical to elemen-tary math education). Then relatedness data are obtained byhaving participants rate every possible pair of concepts on anumerical scale. Once produced, the networks can be usedto compare and contrast differences in knowledge structureusing numerical indices of similarity and by means of visualinspection.
Pathfinder has been used for representing knowledge in anumber of domains, including basic research in memory(Cooke, 1992; Cooke, Durso, & Schvaneveldt, 1986), learn-ing (Gomez & Schvaneveldt, 1994), problem solving(Durso, Rea, & Dayton, 1994), representation of belief inpsychosomatic illness (Gomez, Schvaneveldt, & Stauden-mayer, 1996), representation of the cognitive structuresunderlying expertise (Cooke & Schvaneveldt, 1988), and ofparticular relevance to the present study, structural assess-ment of knowledge growth for academic subject matter(Acton, Johnson, & Goldsmith, 1994; Goldsmith, Johnson,& Acton, 1991; Gonzalvo, Canas, & Bajo, 1994; Housner,Gomez, & Griffey, 1993a, 1993b; Johnson, Goldsmith, &Teague, 1994).
For example, Goldsmith et al. (1991) used a set-theoreticmeasure, C, to assess the similarity between instructor andstudent Pathfinder networks in the context of a universitycourse on statistics and experimental design. C capitalizeson the degree to which a node in two graphs is connected tosimilar sets of nodes (see Goldsmith & Davenport, 1990, fora detailed discussion of the properties of this measure). Thecorrelation between C and exam scores (r = .74) was abetter predictor of performance than were correlations be-tween the untransformed relatedness ratings and examscores, or measures based on the use of multidimensionalscaling (another structural-based assessment approach).Given previous research suggesting that multidimensional

574 GOMEZ, HADFIELD, AND HOUSNER
scaling captures global properties of the relations amongconcepts whereas Pathfinder captures the local properties(Cooke et al., 1986), these findings suggested that reducingthe untransformed relatedness ratings to only the most sa-lient relations among concepts, as is done in Pathfinderanalysis, might be capitalizing on the "configural character"of domain knowledge. Goldsmith et al. (1991) argued that ifknowledge is indeed based on sensitivity to the relationshipsamong concepts, then a method that captures and representsthe configural character of these relationships should beparticularly useful.
Housner et al. (1993b) found similar results in a studyinvolving prospective teachers enrolled in pedagogycourses. Knowledge of key pedagogical concepts was orga-nized more consistently and was more similar to the instruc-tor's organization after completion of the course than it wasin the beginning of the course. Furthermore, Housner et al.(1993a) demonstrated that the prospective teachers' knowl-edge showed the same growth trend in relationship to thereferent structures of other teacher experts, and to a com-posite network based on these teachers, thus adding signif-icantly to the generalizability and content validity ofthis research (see Acton et al., 1994, for similar results inthe domain of computer programming, as well as a morethorough treatment of the issue of appropriate referentstructures).
Finally, Gonzalvo et al. (1994) used the configural prop-erties of Pathfinder networks to predict the acquisition ofconceptual knowledge in the domain of history of psychol-ogy. Gonzalvo et al. conducted a fine-grained analysis ofthe relationship of the concepts in Pathfinder networks tostudents' abilities to define these concepts. Each concept inthe instructor and student networks was assessed structur-ally in terms of the concepts to which it was directly linked.Well-structured concepts in the student networks were de-fined as those sharing greater degrees of similarity (in termsof direct links to the same set of concepts) with those linksfound in instructor networks. Ill-structured concepts weredefined as those sharing less student-instructor link simi-larity. Gonzalvo et al. found positive correlations betweenthe goodness of students' definitions of concepts and struc-tural similarity of their concepts to the concepts in theinstructor networks, as well as an increase in the number ofwell-structured concepts at the end as compared with thebeginning of the course.
In short, these studies suggest that a structural-basedapproach can provide a useful means for representing andassessing the growth of domain knowledge. Relatednessratings represent a more indirect, but possibly objective,approach to discovering the structure of knowledge than dostandard exams. Students are required to make a judgmentabout every pair of concepts; thus, they are tested over awider range of comparisons than would be possible on anessay or multiple-choice exam. Because no context is pro-vided other than that which arises from the relationshipbetween the two concepts, relatedness ratings are not re-stricted to the context implied by the test question. Relat-edness judgments also rely more on recognition than recalland thus are less susceptible to the problems associated with
recall (such as forgetting and selective remembering). An-other problem with standard exams has to do with devisingsimple and objective grading systems. This is especiallytrue in the case of percentage-based exam scores, wherestudent knowledge is assessed relative to other studentsrather than directly in relation to the course instructor. Thus,traditional exams may test the factual knowledge of onestudent relative to another but give little insight into howstudents organize knowledge in relation to the instructor orsome other referent (Goldsmith et al., 1991). On this view,the use of relatedness ratings in combination with tech-niques for determining the most salient relationships amongthe concepts may provide a means for better reflecting asystem of knowledge than would the more traditionalmethod of eliciting answers to specific questions on anexam.
Ironically, although the motivation for using structural-based assessment has been largely justified on the groundsthat traditional course exams are inadequate as indicators ofthe configural nature of knowledge (Goldsmith et al., 1991),validation of this approach has relied almost exclusively oncomparisons with traditional course performance measures.The use of course exams as the validation criterion is aserious limitation in research on structural assessment.Therefore, showing that network similarity is a valid indi-cator of teaching competence would be an important exten-sion of structural-based assessment approaches. It is alsoimportant to assess how exam scores fit into this relation-ship. Surprisingly little is known about how performance oncourse exams relates to the ability to generalize knowledgein an applied setting.
Participants in the present study were prospective mathteachers enrolled in an elementary mathematics methodscourse, the course instructor, and four other experiencedmath teacher experts. Given the results of previous researchusing the Pathfinder methodology, we expected to find apositive relationship between course performance and net-work similarity to the course instructor (Goldsmith et al.,1991; Housner et al., 1993b). We also expected to find ahigh degree of between-expert similarity and a positiverelationship between course performance and network sim-ilarity to a composite of the experts' network (Acton et al.,1994; Housner et al., 1993a). However, our primary re-search objective was to examine students' ability to applyknowledge obtained in a teaching methodology course inthe context of a simulated teaching task. We were particu-larly interested in determining the relationship between thelevel of subject matter understanding as reflected in networksimilarity and the ability to transform and convey thisknowledge in a teaching situation. In other words, wewanted to know how network similarity relates to proce-dural knowledge, conceptual understanding, and the abilityto apply pedagogical content knowledge. We took the nextreasonable step in a line of research (Acton et al., 1994;Goldsmith et al., 1991; Gonzalvo et al., 1994; Housner etal., 1993a, 1993b; Johnson et al., 1994) by moving beyondrecall of knowledge (as reflected in traditional course as-sessment measures) to the application of knowledge (asreflected in a simulated teaching task).

CONCEPTUAL MAPS AS INDICATORS OF TEACHING SKILL 575
Method
Participants
The course instructor. The course instructor taught an elemen-tary mathematics methods course at New Mexico State University.The instructor was selected because of his commitment to concep-tually based approaches to mathematics instruction and his exten-sive experience as a teacher educator (7 years) and as a teacher ofelementary children (11 years).
The teacher educators. Four mathematics teacher educatorsfrom different universities were recruited to participate. Each ofthe teacher educators had a doctorate in mathematics education, 5years experience as a teacher educator, and a commitment toconceptually based approaches to teaching mathematics.
The undergraduate students. Fifty-three students who wereenrolled in the elementary mathematics teaching methodologycourse participated.
The Teaching Methodology Course
The focus of the course was on conceptually based approachesto teaching elementary mathematics. The course consisted of as-signed readings, lectures, and class discussions. A critical compo-nent of the course was a laboratory section in which prospectiveteachers were provided with modeled teaching demonstrationspertaining to conceptually based approaches and were then re-quired to apply these ideas in microteaching experiences withfellow students. The prospective teachers also developed lessonplans and teacher-made activities in the laboratory and were givenappropriate feedback on these assignments relative to conceptuallybased teaching. The final course grade was based on performancein the laboratory sessions and objective exams. Performance in thelaboratory sessions accounted for 50% of the course grade; objec-tive exams accounted for the remaining 50%.
Materials
The initial step in the study was to delineate the knowledgestructure of the course instructor. The researchers conducted in-terviews with the course instructor, focusing on his perceptions ofeffective mathematics teaching. The critical knowledge identifiedby the course instructor consisted of 27 terms, including teachingtopics, concepts relevant to each topic, and manipulatives used forteaching concepts (see Table 1). For instance, concepts of impor-tance for teaching whole number operations are algorithms, re-grouping, partitive/measurement, and basic facts. Appropriate ma-nipulatives for demonstrating these concepts are cuisenaire rodsand arrays. Of the 27 terms identified, 7 were teaching topics, 13were concepts, and 7 were manipulatives. Manipulatives and ma-terials that can be used to convey more than one concept arerepeated in Table 1.
Procedure
Representing the course instructor's knowledge. The instructorused a computerized program to rate every possible pairwisecombination of the terms on a 9-point relatedness scale (1 =unrelated and 9 = highly related). The pairs were presented inrandom order for rating. Once the ratings were obtained, the datawere converted to distance measures by subtracting each ratingfrom 10. The Pathfinder network algorithm was then used togenerate a network representing the course instructor's organiza-tion of knowledge. The parameters used to compute the networkwere set at r = infinity and q = n - 1, where n refers to thenumber of terms in the data (in the present study, n = 27). The rparameter was chosen to match the ordinal properties of the data,and the q parameter was chosen for the purpose of generating thesparsest network possible from the given data. The first parameter,the Minkowski r metric, determines how distance between twonodes not directly linked is computed. When r = infinity, the
Table 1Key Math Concepts Used in the Experiment
TopicsPrenumeration
Place value
Whole number operations
Fractions
Decimals
Percents
Measurement
ConceptsClassification/sorting
comparison
One-to-many correspondenceProportional/nonproportional
AlgorithmsRegroupingBasic factsPartitive/measurement
LCM/GCFRename
Ratios and proportions
AreaVolume
Manipulatives/materialsAttribute/blocksDiscrete/continuous
materials
Base 10 blocks
Cuisenaire rodsArrays
Shaded bars/squares/circles
Shaded bars/squares/circles
Shaded bars/squares/circles
Color cubes
Note. LCM/GCF = lowest common multiple/greatest common factor.

576 GOMEZ, HADFIELD, AND HOUSNER
length of a path is equal to the magnitude of the maximum link onthe path. This means that only ordinal assumptions are required ofthe data because when r — infinity, the same links will be includedfor any monotonically increasing transformation of the data. Thesecond parameter, q, limits the number of links allowed in search-ing for shorter alternative paths. When q = n — 1, where n equalsthe number of concepts being compared, there is essentially nolimit on the number of links allowed in paths because the longestpossible path has n - 1 links (see Schvaneveldt et al., 1989, formore information on choosing r and q parameters).
Eliciting knowledge from the teaching educators. The fourexperienced math teacher educators rated the set of concepts usingthe same procedure as the course instructor. Pathfinder networkswere generated for each teacher educator in the same manner as forthe course instructor. A composite expert network was generatedby converting each teacher educator's ratings to z scores and thenaveraging the converted ratings. The individual and compositenetworks were then compared with the network structure gener-ated by the course instructor.
Eliciting knowledge from the prospective teachers. During thelast week of class, all 53 students in the math education courserated the same set of concepts as the course instructor and the mathteacher educators. The relatedness ratings were used to generatenetworks for all students in the class. A measure of networksimilarity (described below) was used to compare student net-works with the networks for the course instructor and the teachingeducators. Network similarity to the course instructor was used toidentify the top 10 and bottom 10 students in the class. Of these,7 in each group were recruited to participate in a simulatedteaching task. These students returned 3 months later to participatein the simulated teaching task and were each paid $15 for theirefforts.
In the simulated teaching task, the prospective teachers wereasked to explain and demonstrate how they would teach threespecific areas of elementary school mathematics lo elementaryschool children. The three areas of math concepts chosen for thistask were whole number operations, fractions, and measurementproblems. Three problems were generated for each math concept.The tasks and protocol for the simulated teaching are presented inTable 2. Students were told to use appropriate manipulatives toteach each concept and also to work each problem out by hand.The purpose of the latter instruction was to determine whether thestudents could produce the correct solution to the problem. Theparticipants were also asked to describe real-world situationswhere they would apply multiplication and division of fractionsand where they would have to find perimeter and volume. Partic-ipants were given their choice of eight types of manipulatives touse in teaching the problems in the simulated teaching task. Themanipulatives were Base 10 blocks, shaded fraction bars, colortiles, color cubes, cuisenaire rods, decimal squares, pattern blocks,and color counters. The latter three manipulatives were included asdistracter items. The experimenter read the problem to the studentand the students were videotaped as they simulated teaching theconcept lo the experimenter. Students were randomly assigned toeach of the three experimenters. The experimenters were "blind"as to whether the student was high or low on network similarity tothe course instructor.
Scoring
Simulated teaching task. After the simulated teaching taskswere videotaped, each tape was rated by four independent raterswho were paid for their efforts. Two of the raters were instructorsfor the elementary mathematics methods course at New Mexico
State University. The third rater taught math for education majorsin the mathematics department of the university, and the fourthrater was a public school teacher who had received awards formathematics teaching in the public school system. Each problemwas scored according to four levels of performance difficulty, asshown in Table 3. The first level of mastery reflects surfaceknowledge of the procedures in this particular domain of mathproblems. The second level reflects the ability to remember whichmanipulatives are used for teaching particular classes of problems,but provides no indication of whether the prospective teacher canuse the manipulative correctly. The third and fourth levels ofmastery reflect a deeper conceptual understanding in the ability touse manipulatives to explain math problems for conceptual under-standing (Level 3) and in the ability to generate real-world anal-ogies (Level 4). That is, Levels 3 and 4 reflect degree of concep-tual and pedagogical content knowledge, whereas Levels 1 and 2reflect surface and procedural knowledge. Interrater reliabilitybetween all pairs of observers ranged from .62 to .92, with a meanof .83. These levels of agreement were considered acceptable. Theobservers' ratings were then aggregated for each student by com-puting the average of the raters' scores for each problem, at eachlevel of performance.
Network similarity. Pathfinder networks were compared usinga network similarity index called NETSIM. NETSIM is based onthe expected similarity between networks and is computed in thefollowing manner. First, the observed similarity is computed bydividing the number of links shared by both networks (those in theintersection) by the number of links in either network (those in theunion). Next, because the probability that two networks (Net 1 andNet 2) will share k links can be computed from the hypergeometricprobability distribution, this information can be used to computethe expected similarity of two random networks.1 The expectedsimilarity is subtracted from the observed similarity between twonetworks to get the NETSIM index, which is relative to the chancelevel of similarity (or NETSIM = 0). For instance, with n - 27concepts, if two networks (Net 1 and Net 2) contain L} = 66 andL2 — 55 links, respectively, and if k = 21 of the links are shared,then there are 100 links in the union (i.e., 66 + 55 — 21 = 100).The probability of sharing 21 links is .00013, observed similarityis 0.210 (i.e., 21/100), expected similarity is .094, and NETSIM is
' Applying the hypergeometric probability distribution to graphsimilarity yields the equation,
/*/=*) =N
where maximum (0, L, + L^- N)^k^ minimumtL,, L2). In thisequation, p(I = k) refers to the probability that Net I and Net 2 willshare it links, N denotes the total number of links possible in anetwork (given n concepts, N = n(n - l)/2), and L, and L2 referto the number of links in Net 1 and Net 2, respectively. Expectedsimilarity, E[Sim], is then obtained by the usual method for com-puting expected values:
E[Sim]= PC/-*)1(L,
where E[Sim] = expected similarity, min (I) — maximum (0,1, +L2 — N) and max(/) = minimum (L,, ,L>).

CONCEPTUAL MAPS AS INDICATORS OF TEACHING SKILL 577
Table 2Problems Used in the Simulated Teaching Task
Task ProblemWhole number operations
Subtraction
Multiplication
Division
FractionsSubtractionMultiplication
Division
MeasurementPerimeter
Area
Volume
Show how the subtraction algorithm works using the problem: 53- 28 = ?
Show how the multiplication algorithm works using the problem:3 X 47 = ?
Show how the division algorithm works using the problem: 736- 3 = ?
Show how to subtract the fractions 1 Vi - Vi.Show how to multiply the fraction % X 3A. Describe a real world
situation where you would multiply two fractions like the oneshere.
Show what it means to divide the fractions 1% -=- Vs. Describe areal world situation where you would divide two fractions likethe ones here.
Demonstrate how you would teach the concept of perimeter usingthe given shape. (Students were given the outline of a T-shapedarea.) Describe a real world situation where you would find theperimeter of an irregular shape like the one here.
Demonstrate how you would teach the concept of area using thegiven shape. (Students were given the outline of an L-shapedarea.)
Demonstrate how you would teach the concept of volume usingthe given shape. (Students were given the outline of an L-shaped area.) Describe a real world situation where you wouldfind the volume of a shape like the one here.
0.116. A positive NETSIM value indicates a greater degree ofsimilarity between two networks than that expected by chance.Alternately, a negative NETSIM value means that the observednetwork similarity is less than that expected by chance. Statisticalsignificance can be used as a criterion for determining whether theNETSIM values statistically exceed the degree of network simi-larity expected by chance. Using this index, one would expect tofind a higher degree of network similarity between high-knowl-edge students and the course instructor or the teacher experts thanbetween low-knowledge students and the referent networks.
Although NETSIM is conceptually similar to the C measureused in previous research (see Acton et al., 1994; Goldsmith &Davenport, 1990; Goldsmith et al., 1991; Gonzalvo et al., 1994;Housner et al., 1993b; Johnson et al., 1994), it should be noted thatthe measures are not identical. The C measure is based on the
similarity of the "neighborhoods" of the corresponding nodes intwo networks, whereas NETSIM is derived from the similarity ofsets of links found in two networks. In the computation of C, theneighborhood of each node in a network is taken to be the set ofnodes connected to the node in the network. For the correspondingnodes in two networks, the similarity of their neighborhoods iscomputed by the ratio of the number of nodes that are in bothneighborhoods over the number of unique nodes in either neigh-borhood (the number of nodes in the intersection of the neighbor-hoods over the number in the union). These values are computedfor every node in the network, and C is the mean of thesenode-based values. NETSIM is similar in spirit, but the computa-tion is based on the networks as wholes rather than node by node.The primary advantage of NETSIM is that a chance value can becomputed, whereas attempts to find the distribution of C have not
Table 3Criteria Used by Expert Raters to Score Performance on the Simulated Teaching Task
Level of performance CriteriaLevel 1: Performed algorithm correctly 0 = No 1 = YesLevel 2: Selected appropriate manipulative 0 = No 1 = Fair 2 = BestLevel 3: Used manipulative to explain concept 0 = Ineffective
effectively
Level 4: Explained real world application ofconcept
1 = Moderately effective (some confusion,lacked confidence, did not relateexplanation to algorithm)
2 = Effective (clear, confident, and relatedexplanation to algorithm)
0 = None1 = Application suggested but lacked
accurate explanation2 = Application accompanied by accurate
and detailed explanation

578 GOMEZ, HADFIELD, AND HOUSNER
been successful. NETSIM values can be interpreted relative to astatistical distribution as well as relative to each other. C can beinterpreted only relative to other values. NETSIM values are quitesimilar to C, with mean correlations of .93 in this study (thecorrelations ranged from .80 to .99, depending on which referentnetworks were used in the comparison).
Results
The Pathfinder network generated from the course in-structor' s ratings is shown in Figure 1. The network reflectsmany of the same relationships shown in Table 1. This isparticularly interesting given that the course instructor con-structed the table analytically, whereas the network wasconstructed from the course instructor's judgments of relat-edness. For example, the concepts "LCM/GCF' (lowestcommon multiple/greatest common factor), "Rename," and"Shaded bars/squares/circles" are all related to the topic"Fractions" and these relationships also show up as links inthe course instructor's Pathfinder network. One expectssubstantial overlap between the table and the network, giventhat both representations were generated from the samesource (i.e., the course instructor's knowledge); however,the network shown in Figure 1 is an empirical demonstra-tion of this point. It should be noted that the primary sourceof information in Pathfinder networks is in the presenceor absence of a link. Spatial layout and link lengths aredetermined arbitrarily and therefore have no meaningfulinterpretation.
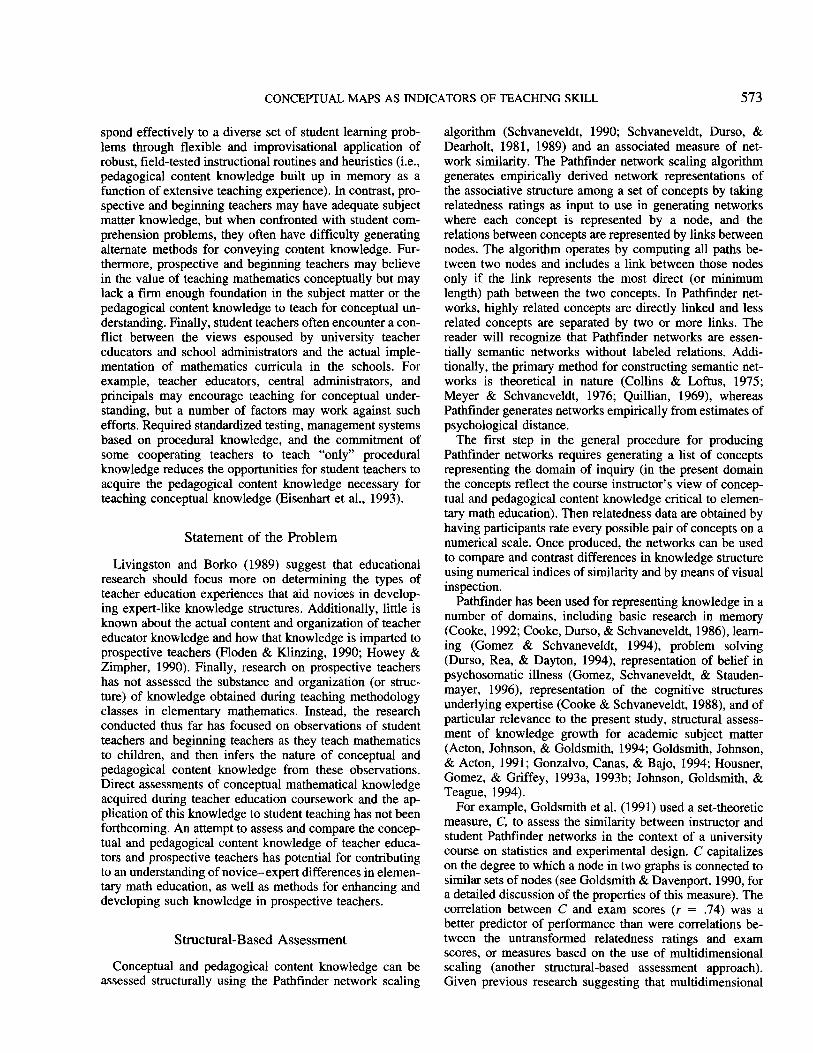
Next, the generalizability of the course instructor'sknowledge was assessed by comparing his knowledge struc-ture with those of the four other experienced teacher edu-cators. NETSIM values comparing the Pathfinder networksof the course instructor, the four experienced teacher edu-
cators, and the composite networks are shown in Table 4.The corresponding C values are also shown in Table 4. Theaveraged ratings used to compute the five different com-posite networks changed as a function of which teachereducator was the focus of the comparison. For example, thecomposite network used to compute network similarity incomparison with the course instructor was generated fromthe z-transformed ratings of Teacher Educators 1-4. Incontrast, the composite used to investigate network similar-ity for the first teacher educator was based on the ratingsobtained from the course instructor and Teacher Educators2-4. The probability of obtaining NETSIM values as largeor larger than those shown in Table 4 indicates levels ofagreement considerably above chance (all ps < .001).
Next, NETSIM values were computed for all 53 studentsin the math pedagogy course. Students' networks werecompared with the six referent networks: the course instruc-tor's network, those from the four teacher educators, and thecomposite network based on the averaged ratings of the fourteacher educators. The resulting NETSIM values are shownin Table 5. The analyses reported were all performed onNETSIM values. Analyses were also performed using Cvalues that, although not reported here, were consistent withthe analyses using NETSIM. Results for the seven studentswith the highest NETSIM scores and the seven studentswith the lowest NETSIM scores are shown in Table 5. TheNETSIM values shown in Table 5 were all statistically (p <.003) greater than baseline (NETSIM = 0). A repeatedmeasures ANOVA with six levels of referent structure wascomputed for all students to determine whether NETSIMvalues varied as a function of referent. The ANOVA re-vealed a significant main effect of referent, F(5, 260) =4.71, MSE = 0.0008, p < .001. Post hoc t tests were
Partitivemeasurement
DiscreteContinuousmaterials
Shaded barssquarescircles
Figure 1. Pathfinder network for the course instructor (q = n - \, r = infinity). LCM = leastcommon multiple; GCF = greatest common factor.
CONCEPTUAL MAPS AS INDICATORS OF TEACHING SKILL 579
Table 4NETSIM and C Values for Comparisons Between the Pathfinder Networks of theCourse Instructor, the Four Experienced Teacher Educators (TE 1-4), and theRespective Composite Networks
Teacher educators1. Instructor (42 links)2. TE 1 (55 links)
NETSIMC
3. TE 2 (66 links)NETSIMC
4. TE 3 (66 links)NETSIMC
5. TE 4 (91 links)NETSIMC
6. Composites (27-31 links)NETSIMC
NETSIM (Observed minus1
.154
.200
.288
.384
.176
.302
.165
.272
.249
.381
2
.116
.215
.104
.190
.128
.242
.133
.174
3
.190
.319
.219
.351
.222
.296
expected
4
208335
216312
similarity)
5 6
.166 —
.251 —Note. The number of links in a given network are shown in parentheses. NETSIM and C are bothnetwork similarity indexes.
conducted for the purpose of determining whether NETSIMto any one referent was better than NETSIM to the otherreferent structures. Because of the number of tests involvedin these comparisons, the significance criterion was ad-justed to control for familywise error rate {EF/k = .05/15 =.003). Post hoc t tests, comparing NETSIM to each referentwith NETSIM to every other referent, failed to result instatistically significant differences (all ps > .03). A similaranalysis was conducted using only the 14 students whoparticipated in the simulated teaching task. A 2 (knowledge:high vs. low) X 6 (referent structure) ANOVA, whereknowledge was treated as a between-subjects variable and
referent structure was a within-subject variable, resulted ina main effect of knowledge, F(l, 12) = 99.27, MSE =0.0022, p < .001; a main effect of referent, F(5, 60) = 2.74,MSE = 0.0006, p = .027; and a Knowledge X ReferentStructure interaction, F(5, 60) = 3.80, MSE = 0.0006, p =.005. As with the analysis using all 53 students, post hoc ttests were conducted to determine whether NETSIM wasstatistically higher to any one referent than to the otherreferents. With the significance criterion adjusted to controlfor familywise error rate {EF/k = .05/15 = .003), post hoct tests, comparing NETSIM to each referent with NETSIMto every other referent, resulted in only one difference. For
Table 5Means and Standard Deviations for NETSIM and C Comparisons to the Six ReferentNetworks, Presented Separately for All Students and for High- and Low-KnowledgeStudents
Group and valueCourse
instructor TE 1 TE2 TE3 TE4 TEs 1-4All students
(n = 53)NETSIMC
High-knowledgestudents
NETSIMC
Low-knowledgestudents(n = 7)NETSIMC
.12 (.06) .10 (.05) .11 (.05) .11 (.05) .12 (.04) .12 (.06)
.22 (.07) .20 (.05) .23 (.06) .23 (.05) .26 (.05) .20 (.06)
.19(.03) .13 (.03) .16 (.02) .16 (.05) .14 (.04) .16 (.03)
.28 (.02) .23 (.03) .28 (.03) .27 (.05) .29 (.05) .23 (.02)
.05 (.02) .04 (.02) .05 (.03) .06 (.01) .08 (.03) .05 (.01)
.14 (.01) .15 (.03) .18 (.03) .20 (.02) .24 (.05) .13 (.01)() () () ( 0 )Note. TE = teacher educator. NETSIM and C are both network similarity indexes. Numbers inparentheses are standard deviations.

580 GOMEZ, HADFIELD, AND HOUSNER
the high-knowledge students, NETSIM was significantlyhigher to the course instructor than to Teacher Educator 1,f(12) = 3.80, p = .003 (all other ps > .04). Post hoc t testsfor low-knowledge students showed no differences inNETSIM values as a function of referent structure (all ps >.03). Most important, there were no statistical differences inNETSIM values to the composite network compared withNETSIM values to the course instructor (for all or for high-or low-knowledge groups), suggesting that both networkswere equally predictive of course performance.
Pearson product-moment correlations were computed be-tween course performance measures and the students'NETSIM values. The correlations for the entire class andthe correlations for the 14 students participating in thesimulated teaching task are shown in Table 6 (note that thelatter correlations include two extreme groups of n = 7).Mean test average for all 53 students was 86.14 percentagepoints (SD = 8.68; range = 61.00-98.75), mean lab scorewas 96.80 (SD = 3.10; range = 87.10-100.00), and meanfinal grade was 91.47 (SD = 5.01; range = 75.98-99.22).Mean test average for the 14 students who participated inthe simulated teaching task was 87.39 percentage points (SD= 6.82; range = 70.75-95.00), mean lab score was 95.46(SD = 2.87; range = 88.39-99.35), and mean final gradewas 91.40 (SD = 3.87; range = 82.79-96.28). Althoughcorrelations between NETSIM and lab scores for the entireclass were numerically lower than correlations betweenNETSIM and the other two course performance measures,all but one correlation reached statistical significance. Thecorrelations between NETSIM and lab scores were some-what higher when only the 14 students participating in theteaching demonstration were included in the analysis; threeof the six correlations reached statistical significance(NETSIM to Teacher Educators 1 and 3 and to the com-posite network). When the entire class was included in theanalysis, all of the correlations of NETSIM with test aver-age and final grade were statistically significant. However,the correlations between test average and NETSIM werenumerically lower than the correlations between final gradeand NETSIM. NETSIM to the course instructor, and also tothe composite network, accounted for approximately 30%
of the variance in final course grade. Interestingly, thecorrelation of final grade with NETSIM to Teacher Educa-tor 2 was slightly higher than the correlations for final gradewith NETSIM to the course instructor and with the com-posite. When only the 14 students participating in the sim-ulated teaching task were included in the analyses, thecorrelations of test average with NETSIM were also numer-ically lower than were the correlations of final grade withNETSIM. In this case, NETSIM to the course instructoraccounted for 55% of the variance in final course grade andNETSIM to the composite network accounted for 50% ofthe variance in final course grade.
These results (for all students and for the 14 participatingin the teaching demonstration) replicate the findings re-ported by Acton et al. (1994) and Housner et al. (1993a) bydemonstrating how network similarity to a composite ofexperts can be as predictive of a course performance vari-able (such as final grade) as similarity to the course instruc-tor (rs = .74 and .71, respectively). Such a result is impor-tant because it rules out the possibility that the studentteachers are merely organizing their knowledge in terms ofthe particular views espoused by the course instructor. In-stead, this result suggests that student teachers are learningsomething more general with regard to the way teachereducators organize their knowledge.
Given that the present results replicate those found earlierin the literature, both in terms of predicting course perfor-mance (Goldsmith et al., 1991; Gonzalvo et al., 1994;Housner et al., 1993b) and in terms of generalizing to acomposite network based on experts other than the courseinstructor (Acton et al., 1994; Housner et al., 1993a), thenext objective was to assess performance on the simulatedteaching task and its relationship to network similarity.
Table 7 shows the percentage of points obtained for thehigh- and low-knowledge groups as a function of problemtype (whole number operations, measurement problems,and fractions) and performance on the simulated teachingtask (Levels 1-4). Note that the cell for Level 4 ("Exam-ple") is empty for whole number operations. This is becausestudents were not asked to provide real-world analogies tothese problems. Table 7 shows that students were generally
Table 6Correlations Between Course Performance Measures and NETSIM to the Six ReferentNetworks, for All Students and Those Participating in the Simulated Teaching Task
Courseperformance
variables
Final gradeTest averageLab scores
Final gradeTest averageLab scores
Courseinstructor
.55***
.52***
.32*
TE 1All
.31*
.28*
.20
TE2students (N =
.63***
.60***
.36**
Students participating in the simulated.74**.64*.48
.54*
.38
.57*
.72**
.66*
.37
TE353)
.54***
.50***
.35*
teaching task (n.61*.46.55*
TE4
.56***
.54***
.30*
= 14).60*.54*.34
TEs \-4
.54***51***.31*
.71**
.56*
.58*Note. TE = teacher educator. NETSIM is a network similarity index.' p < .05. ** p < .01. <p < .001.
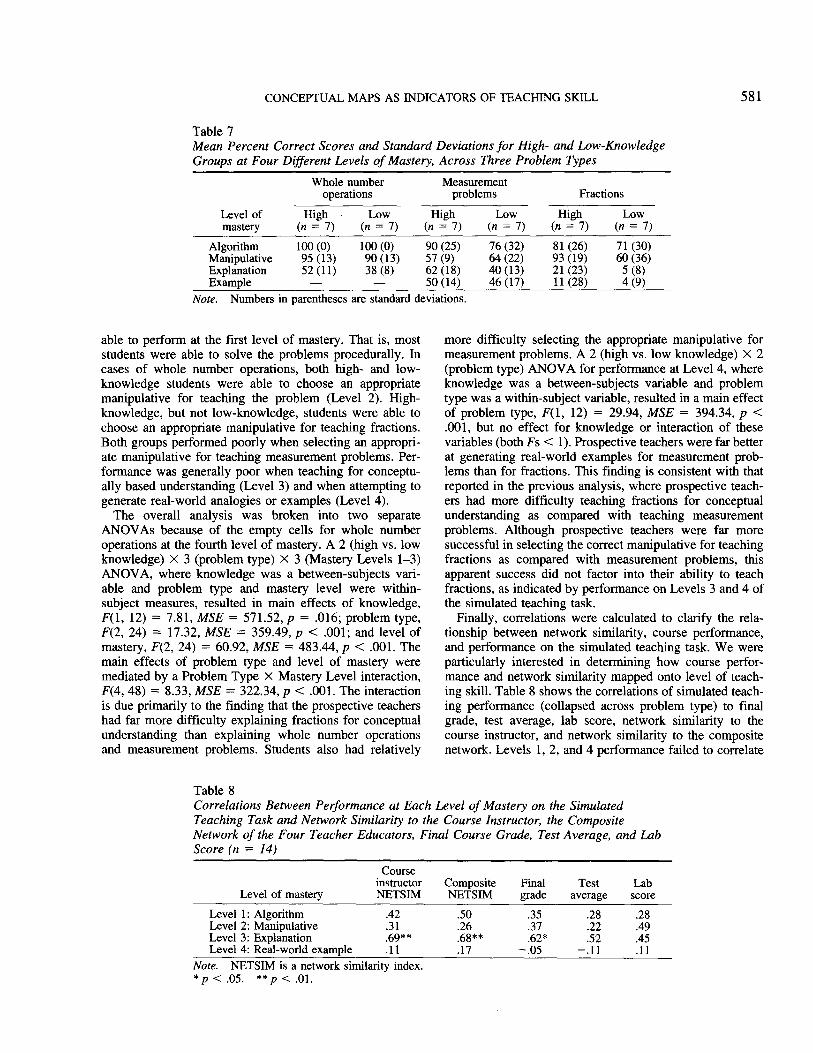
CONCEPTUAL MAPS AS INDICATORS OF TEACHING SKILL 581
Table 7Mean Percent Correct Scores and Standard Deviations for High- and Low-KnowledgeGroups at Four Different Levels of Mastery, Across Three Problem Types
Level ofmastery
Whole numberoperations
Measurementproblems Fractions
High Low High Low(n = 7) (n = 7) (n = 7) (n = 7)
High Low
(„ = 7) („ = 7)AlgorithmManipulativeExplanationExample
100(0)95 (13)52(11)
—
100(0)90 (13)38(8)
—
90 (25)57(9)62(18)50 (14)
76 (32)64(22)40(13)46 (17)
81 (26)93 (19)21 (23)11 (28)
71 (30)60 (36)
5(8)4(9)
Note. Numbers in parentheses are standard deviations.
able to perform at the first level of mastery. That is, moststudents were able to solve the problems procedurally. Incases of whole number operations, both high- and low-knowledge students were able to choose an appropriatemanipulative for teaching the problem (Level 2). High-knowledge, but not low-knowledge, students were able tochoose an appropriate manipulative for teaching fractions.Both groups performed poorly when selecting an appropri-ate manipulative for teaching measurement problems. Per-formance was generally poor when teaching for conceptu-ally based understanding (Level 3) and when attempting togenerate real-world analogies or examples (Level 4).
The overall analysis was broken into two separateANOVAs because of the empty cells for whole numberoperations at the fourth level of mastery. A 2 (high vs. lowknowledge) X 3 (problem type) X 3 (Mastery Levels 1-3)ANOVA, where knowledge was a between-subjects vari-able and problem type and mastery level were within-subject measures, resulted in main effects of knowledge,F(l, 12) = 7.81, MSE = 571.52, p = .016; problem type,F(2, 24) = 17.32, MSE = 359.49, p < .001; and level ofmastery, F(2, 24) = 60.92, MSE = 483.44, p < .001. Themain effects of problem type and level of mastery weremediated by a Problem Type X Mastery Level interaction,F(4, 48) = 8.33, MSE = 322.34, p < .001. The interactionis due primarily to the finding that the prospective teachershad far more difficulty explaining fractions for conceptualunderstanding than explaining whole number operationsand measurement problems. Students also had relatively
more difficulty selecting the appropriate manipulative formeasurement problems. A 2 (high vs. low knowledge) X 2(problem type) ANOVA for performance at Level 4, whereknowledge was a between-subjects variable and problemtype was a within-subject variable, resulted in a main effectof problem type, F(l, 12) = 29.94, MSE = 394.34, p <.001, but no effect for knowledge or interaction of thesevariables (both Fs < 1). Prospective teachers were far betterat generating real-world examples for measurement prob-lems than for fractions. This finding is consistent with thatreported in the previous analysis, where prospective teach-ers had more difficulty teaching fractions for conceptualunderstanding as compared with teaching measurementproblems. Although prospective teachers were far moresuccessful in selecting the correct manipulative for teachingfractions as compared with measurement problems, thisapparent success did not factor into their ability to teachfractions, as indicated by performance on Levels 3 and 4 ofthe simulated teaching task.
Finally, correlations were calculated to clarify the rela-tionship between network similarity, course performance,and performance on the simulated teaching task. We wereparticularly interested in determining how course perfor-mance and network similarity mapped onto level of teach-ing skill. Table 8 shows the correlations of simulated teach-ing performance (collapsed across problem type) to finalgrade, test average, lab score, network similarity to thecourse instructor, and network similarity to the compositenetwork. Levels 1, 2, and 4 performance failed to correlate
Table 8Correlations Between Performance at Each Level of Mastery on the SimulatedTeaching Task and Network Similarity to the Course Instructor, the CompositeNetwork of the Four Teacher Educators, Final Course Grade, Test Average, and LabScore (n = 14)
Level of masteryLevel 1: AlgorithmLevel 2: ManipulativeLevel 3: ExplanationLevel 4: Real-world example
CourseinstructorNETSIM
.42
.31
.69**
.11
CompositeNETSIM
.50
.26
.68**
.17
Finalgrade
.35
.37
.62*- .05
Testaverage
.28
.22
.52-.11
Labscore.28.49.45.11
Note. NETSIM is a network similarity index.*p<.05. * * / ? < . 0 1 .

582 GOMEZ, HADFIELD, AND HOUSNER
significantly with either NETSIM or course performancescores. However, the ability to teach for conceptually basedunderstanding (Level 3) was significantly correlated withthe two NETSIM measures and final course grade. NETSIMto the course instructor and the composite network ac-counted for 48% and 46% of the variance in Level 3performance, and final course grade accounted for 38% ofthe Level 3 performance variance.
To obtain a better understanding of the relationship be-tween network similarity and course grades as predictors ofsimulated teaching performance, we computed the partialcorrelations of Level 3 teaching performance with NETSIMto the course instructor, NETSIM to the composite, finalgrade, test average, and lab scores, with the variance con-tributed by the latter five indices individually held constant(see Table 9). If NETSIM is accounting for variance notaccounted for in course performance measures, thenNETSIM should continue to predict Level 3 teaching per-formance, even when the variance due to course measures ispartialled out. Alternately, if NETSIM shares a significantdegree of variance with a particular performance measure,then partialling the measure out should result in a loss ofpredictiveness. The second row in Table 9 shows the Level3 predictiveness of NETSIM to the course instructor, withNETSIM to the composite network, final course grade, testaverage, and lab score individually held constant. It can beseen that NETSIM to the course instructor correlates sig-nificantly with Level 3 performance when test average andlab scores are held constant, but not when NETSIM to thecomposite or final course grade are partialled out. The thirdrow in Table 9 shows a similar pattern of results. That is,NETSIM to the composite network is a significant predictorof performance on Level 3 of the simulated teaching taskwhen either test average or lab score is partialled out, butnot when NETSIM to the course instructor or final grade isheld constant. In contrast, the fourth, fifth, and sixth rows inTable 9 show how when either of the two NETSIM mea-sures is individually partialled out, course performancemeasures show no correlation with the ability to teach mathconcepts for understanding. This pattern of findings sug-gests that NETSIM measures based on comparisons ofPathfinder networks capture unique variance not captured inexams or lab scores.
Finally, NETSIM to the course instructor and final coursegrade were included in a multiple regression equation todetermine whether these factors together would be a betterpredictor of Level 3 teaching performance than either factortaken alone. Combining these two factors resulted in R =.71 (R2 = .51), F(2, 11) = 5.74, MSE = 65.06, p = .019.Although using either NETSIM or final course grade in theregression equation significantly predicted Level 3 teachingperformance, R2 = .48, F(l, 11) = 11.20, MSE = 65.06, p= .006 for NETSIM, and R2 = .38, F(l, 11) = 7.68, MSE= 65.06, p = .017 for final course grade, the additionalimprovement due to adding the other independent variablewas not large enough to be statistically significant, F(l, 11)= 0.29, MSE = 65.06, when adding final course grade toNETSIM, and F(l, 11) = 3.81, MSE = 65.06, when addingNETSIM to final course grade. Thus, these two variablesappear to convey overlapping information with regard tosimulated teaching performance.
Discussion
The objectives of the research reported here were two-fold. The first objective was to replicate previous researchusing the Pathfinder network scaling methodology (Schvane-veldt, 1990; Schvaneveldt et al, 1981), but in the domain ofmath education. The results showed that the course instruc-tor shared a high degree of structural knowledge with theother experienced teacher educators. Furthermore, networksimilarities to the composite network, generated from theexperienced teacher educators' concept ratings, were virtu-ally as predictive of the prospective teachers' course gradesas were network similarities to the course instructor, repli-cating the results of Acton et al. (1994) and Housner et al.(1993a). Network similarity to the four teacher educatorswas also predictive of course grades.
The second objective of the study was to take the nextlogical step in research on structural-based assessment byexamining the relationship between knowledge structureand the ability to apply this knowledge. Previous studieshave used course grades as validation criteria for structural-based assessment. However, as the research in this partic-ular study demonstrates, the relationship between course
Table 9Partial Correlations Between Knowledge Indexes as a Predictor of Performance on theExplanation Component (Level 3) of the Simulated Teaching Task With Every OtherKnowledge Index Held Constant (n = 14)
Knowledge index used aspredictor (Level 3:
Explanation)1. None2. NETSIM to instructor3. NETSIM to composite4. Final grade5. Test average6. Lab score
1
.69**
.68**
.62*
.52
.45
2
.03
.23
.15
.18
3
.22—.28.24.09
4
.44
.42—
-.21.20
5
.55*
.54*
.44—
.44
6
.61*
.57*
.52
.52—
Note. NETSIM is a network similarity index.*p < .05. **p < .01.

CONCEPTUAL MAPS AS INDICATORS OF TEACHING SKILL 583
performance and teaching skill is somewhat tenuous. Weassessed teaching performance on four different levels ofmastery and discovered that although most participantswere able to solve the problems procedurally and manywere able to select the correct manipulative for demonstrat-ing the problems, students generally had greater difficultytranslating their knowledge of procedures into conceptuallybased explanations and real-world analogies to problems.Interestingly, network similarity was as sensitive an indexof the ability to teach for conceptual understanding as wasfinal course grade, and more sensitive than were exams andlab scores. When test average and lab scores were individ-ually held constant in partial correlations, NETSIM to thecourse instructor and the composite network were predictiveof performance on the simulated teaching task, whereas theopposite was not true. That is, partialling out the variancedue to NETSIM to either referent network essentially erad-icated the relationship between test average, lab perfor-mance, and the ability to convey math problems for con-ceptual understanding. When final course grade was heldconstant, NETSIM to the course instructor and the compos-ite were no longer predictive of performance on the simu-lated teaching task, suggesting that NETSIM and finalcourse grade were tapping shared variance. These resultsdemonstrate two important points. The first is that networksimilarity can be useful for assessing a specific aspect ofknowledge, in this case conceptual and pedagogical contentknowledge. Secondly, the information captured using relat-edness ratings and the Pathfinder methodology was just aseffective at measuring key knowledge as final course grade.That Pathfinder was a more sensitive predictor of simulatedteaching performance than test average is consistent withthe view that standard exams may fail to represent theconfigural nature of knowledge captured in structural ap-proaches (Goldsmith et al., 1991).
A potential drawback of this study is in the use of twovery small groups on extreme ends of a continuum, witheach group consisting of only seven students. Given theresources we had available, it was possible to test only asmall number of participants. Twenty students (10 with lownetwork similarity to the course instructor and 10 with highnetwork similarity to the instructor) were originally targetedfor the simulated teaching task. It was impossible to obtainall 20 students due to the constraints that students either bein the upper or lower quadrant of NETSIM scores and notbe concurrently fulfilling their student teaching require-ments. The latter constraint served the purpose of avoidinga confound due to differential degrees of teaching experi-ence. Under any circumstances the use of such small groupsraises questions regarding the stability and generalizabilityof the results, but the fact that we show statistical differ-ences with such a small sample suggests that the effects aresizable. More important, however, the correlations of teach-ing performance with network similarity to the course in-structor accounted for nearly 50% of the variance observedin the data. Under such circumstances it is hard to imaginehow the use of additional participants could change theconclusions drawn from this study.
There may be another problem resulting from the selec-
tion procedure, as it relates to predicting simulated teachingperformance. Because high- and low-knowledge studentswere selected on the basis of NETSIM and not on the basisof course grades, there could be an advantage for the formercompared with the latter. If scores were more variable onNETSIM than on the traditional course measures, one mightexpect higher correlations between NETSIM and simulatedteaching than between course performance and simulatedteaching. However, when variance in NETSIM to the courseinstructor for students with the seven highest and sevenlowest final grades (M = .131, S2 = .00422) was comparedto that of the seven high- and seven low-knowledge students(M = .118, S2 = .00593), the difference was statisticallyindistinguishable, F(13, 13) = 0.71, p > .05.
Why would network similarity be a more sensitive indexof conceptually based understanding than exams or labscores? One explanation might be that microteacbing per-formance was assessed in the lab portion of the courseimmediately after new concepts were presented by thecourse instructor. This meant that students were relying onrecent memory to perform the lab exercises. Thus, the labscore was reflecting short-term retention whereas networksimilarity was reflecting longer term retention. However,this does not explain the failure of exams to contribute tomeasurement of teaching skill. A second factor could be alack of variance in exams or lab scores. However, exami-nation of the distributions associated with course perfor-mance suggests otherwise. Another explanation is that theexams in this class were clearly designed to tap declarativeknowledge, whereas the lab scores were based on proce-dures relevant to teaching skill. Some combination of de-clarative and procedural knowledge, reflected in finalcourse grade, is clearly more predictive of teaching skillthan either source of knowledge alone. Such a combinationmay also be more reliable because it is based on two"subtests," (i.e., labs and exams), rather than either one byitself. With regard to network similarity, associative net-works might provide a better means for representing amental model of a domain than does assessment based onshort-term retention and the declarative knowledge typicallymeasured in exams. That is, standard assessment measuresmay reflect factual knowledge in a domain, but may fail totap into the system of relations that hold among concepts.According to Johnson-Laird (1983), mental models arefunctional representations or mental replicas (Craik, 1943)of phenomena in the world. Mental models are used invision, control of movement, reasoning, and in communi-cation. In short, mental models are used not only to under-stand the world, but also to operate on the world. Mentalmodels are far more complex than associative networks,involving recursive procedures, propositions, inferences,analogies, images, and symbols, but at the core is the ideathat mental models capture the functional relationshipsamong ideas. Thus, the sensitivity of network representa-tions for the particular problem explored here, teachingelementary mathematics problems for conceptual under-standing, may lie in the power to represent the systems (orpatterns) of structural relations that characterize mentalmodels in this domain.

584 GOMEZ, HADFIELD, AND HOUSNER
The value of such an explanation may depend, however,on distinguishing between the strength of an association andits propositional meaning (or link label).2 One argumentagainst the methodology used here is that it representsknowledge by means of numerical relatedness when ulti-mately teachers must convey content knowledge in the formof propositions. That is, the measures of structural similarityused here may provide insight into the system of relationsamong concepts, but they are silent on the particular labelsparticipants use when making numerical ratings. Thus, astudent might see two concepts as being highly related butfor very different reasons than the course instructor. How-ever, the knowledge required for teaching, or any skill forthat matter, is complex and multifaceted, consisting of bothimplicitly and explicitly known relations (Greeno, 1983). Itis possible that strength of association better reflects im-plicit knowledge than knowledge that is readily verbalized.Strength of association may also serve to disambiguate linklabels in a way that propositions cannot. For example, theconcept pairs "dog-pet" and "mouse-pet" could share therelation "is a type of," but the former would likely receivea higher numerical rating than the latter. Given the impor-tance of distinguishing correct from incorrect propositionalknowledge in the domain of teaching skill, an importantextension of this work would be to investigate the nature ofthe conceptual relations that hold among concepts. Onemethod, which has been used in the past (Housner et al.,1993b), is to have prospective teachers label the links in anexpert's network and then compare the novices' link labelswith those assigned by an expert. Such an approach haspotential for providing a richer understanding of the pro-gression of knowledge underlying teaching skill, as well asa means for diagnosing the accuracy of pedagogical contentknowledge.
In summary, the findings reported here provide initialsupport for the use of associative network methodologies astools for capturing changes in the pedagogical knowledgestructures of prospective teachers. Associative networksappear to represent knowledge at a deeper conceptual levelthan is reflected in certain traditional assessment measures.In addition, the simulated teaching sessions used in thisstudy show promise as an in-depth method of assessingpedagogical knowledge in the area of elementary schoolmathematics. Both of these methods appear to be superior totraditional course examinations. Perhaps both methodscould be used in teacher education programs prior to thestudent teaching assignment as a means for determiningwhich students may need closer observation or assistanceduring their practicum. These methods could also be used toassess the progression of teaching skill as experience instudent teaching is obtained. This study extends past re-search on the structural assessment of classroom learning,not only by using teaching competence instead of coursegrades as the criterion variable, but also by investigating therelationship between knowledge structure and the applica-tion of knowledge in a simulated teaching task. It is impor-tant to note, however, that simulations may only approxi-mate the authentic nature of teaching. On this view, futureattempts to examine the application of mathematical knowl-
edge by beginning teachers must be extended to schools andclassrooms where the exigencies of real-world teaching arein operation.
We would like to thank an anonymous reviewer for raising thisissue.
References
Acton, W. H., Johnson, P. I , & Goldsmith, T. E. (1994). Structuralknowledge assessment: Comparison of referent structures. Jour-nal of Educational Psychology, 86, 303-311.
Ball, D. L. (1990). Prospective elementary and secondary teachers'understanding of division. Journal for Research in MathematicsEducation, 21, 132-144.
Ball, D., & McDiarmid, G. (1988). "Many moons": Understand-ing teacher learning from a teacher education perspective (IssuePaper 88-5). East Lansing, MI: National Center for Research onTeacher Education.
Borko, H., & Livingston, C. (1989). Cognition and improvisation:Differences in mathematics instruction by expert and noviceteachers. American Educational Research Journal, 26, 473-498.
Cobb, P., Wood, T., & Yackel, E. (1990). Classrooms as learningenvironments for teachers and researchers. In R. Davis (Ed.),Constructivist views on the teaching and learning of mathemat-ics. Journal for Research in Mathematics Education: Mono-graph No. 4. Reston, VA: National Council of Teachers ofMathematics.
Collins, A. M., & Loftus, E. F. (1975). A spreading activationtheory of semantic processing. Psychological Review, 82, 407-428.
Cooke, N. M. (1992). Predicting judgment time from measures ofpsychological proximity. Journal of Experimental Psychology:Learning, Memory, and Cognition, 18, 640-653.
Cooke, N. M., Durso, F. T., & Schvaneveldt, R. W. (1986). Recalland measures of memory organization. Journal of ExperimentalPsychology: Learning, Memory, and Cognition, 12, 538-549.
Cooke, N. M., & Schvaneveldt, R. W. (1988). Effects of computerprogramming experience on network representations of abstractprogramming concepts. International Journal of Man-MachineStudies, 29, 407-427.
Craik, K. (1943). The nature of explanation. Cambridge, England:Cambridge University Press.
Durso, F. T., Rea, C. B., & Dayton, T. (1994). Graph-theoreticconfirmation of restructuring during insight. Psychological Sci-ence, 5, 94-98.
Eisenhart, M., Borko, H., Underhill, R., Brown, C, Jones, D., &Agard, P. (1993). Conceptual knowledge falls through thecracks: Complexities of learning to teach mathematics for un-derstanding. Journal of Research in Mathematics Education, 24,8-40.
Even, R. (1993). Subject-matter knowledge and pedagogical con-tent knowledge: Prospective secondary teachers and the functionconcept. Journal of Research in Mathematics Education, 24,94-116.
Fennema, E., Frank, M. L., Carpenter, T. P., & Carey, D. A.(1993). Using children's knowledge in instruction. AmericanEducational Research Journal, 30, 555-583.
Floden, R. E., & Klinzing, H. G. (1990). What can research onteacher thinking contribute to teacher preparation? A secondopinion. Educational Researcher, 19, 15-20.
Goldsmith, T. E., & Davenport, D. M. (1990). Assessing structural

CONCEPTUAL MAPS AS INDICATORS OF TEACHING SKILL 585
similarity of graphs. In R. Schvaneveldt (Ed.), Pathfinder asso-ciative networks: Studies in knowledge organization (pp. 75-88). Norwood, NJ: Ablex.
Goldsmith, T. E., Johnson, P. I , & Acton, W. H. (1991). Assess-ing structural knowledge. Journal of Educational Psychology,83, 88-96.
Gomez, R. L., & Schvaneveldt, R. W. (1994). What is learnedfrom artificial grammars? A transfer test of simple associativeknowledge. Journal of Experimental Psychology: Learning,Memory, and Cognition, 20, 396-410.
Gomez, R. L., Schvaneveldt, R. W., & Staudenmayer, H. (1996).Assessing beliefs about environmental illness/multiple chemicalsensitivity. Journal of Health Psychology, 1, 107-123.
Gonzalvo, P., Canas, J., & Bajo, M. (1994). Structural represen-tations in knowledge acquisition. Journal of Educational Psy-chology, 86, 601-616.
Greeno, J. G. (1983). Response to Phillips. Educational Psychol-ogist, 18, 75-80.
Housner, L. D., Gomez, R. L., & Griffey, D. (1993a). A Pathfinderanalysis of pedagogical knowledge structures: A follow-up in-vestigation. Research Quarterly for Exercise & Sport, 64, 291-299.
Housner, L. D., Gomez, R. L., & Griffey, D. (1993b). Pedagogicalknowledge in prospective teachers: Relationships to perfor-mance in a teaching methodology course. Research Quarterlyfor Exercise & Sport, 64, 167-177.
Howey, K. R., & Zimpher, N. L. (1990). Professors and deans ofeducation. In W. R. Houston (Ed.), Research on teacher educa-tion (pp. 349-370). New York: Macmillan.
Johnson, P. J., Goldsmith, T. E., & Teague, K. W. (1994). Locusof the predictive advantage in Pathfinder-based representationsof classroom knowledge. Journal of Educational Psychology,86, 617-626.
Johnson-Laird, P. N. (1983). Mental models. Cambridge, MA:Harvard University Press.
Leinhardt, G., & Smith, D. (1985). Expertise in mathematicsinstruction: Subject matter knowledge. Journal of EducationalPsychology, 77, 247-271.
Livingston, C , & Borko, H. (1989). Expert-novice differences inteaching: A cognitive analysis and implications for teacher ed-ucation. Journal of Teacher Education, 40, 36-42.
Livingston, C , & Borko, H. (1990). High school mathematicsreview lessons: Expert-novice distinctions. Journal for Re-search in Mathematics Education, 21, 372-387.
Mathematical Association of America. (1991). A call for change:Recommendations for the mathematical preparation of teachersof mathematics. Washington, DC: Author.
Mathematical Sciences Education Board. (1991). Counting onyou: Actions supporting mathematics teaching standards. Wash-ington, DC: National Academy Press.
Meyer, D. E., & Schvaneveldt, R. W. (1976, April). Meaning,memory structure, and mental processes. Science, 192, 27-33.
National Council of Teachers of Mathematics. (1991). Profes-sional standards for teaching mathematics. Reston, VA: Author.
Quillian, M. R. (1969). The teachable language comprehender: Astimulation program and theory of language. Communications ofthe ACM, 12, 459-476.
Schvaneveldt, R. W. (Ed.). (1990). Pathfinder associative net-works: Studies in knowledge organization. Norwood, NJ: Ablex.
Schvaneveldt, R. W., Durso, F. T., & Dearholt, D. W. (1981, No-vember). General semantic networks. Paper presented at theannual meeting of the Psychonomic Society, Philadelphia, PA.
Schvaneveldt, R.W., Durso, F. T., & Dearholt, D. W. (1989).Network structures in proximity data. In G. H. Bower (Ed.), Thepsychology of learning and motivation: Advances in researchand theory (Vol. 24, pp. 249-284). New York: Academic Press.
Shulman, L. (1987). Knowledge and teaching: Foundations of thenew reform. Harvard Educational Review, 57, 1-22.
Tirosh, D., & Graeber, A. O. (1990). Evoking cognitive conflict toexplore preservice teachers' thinking about division. Journal forResearch in Mathematics Education, 21, 98-108.
Received June 14, 1995Revision received December 8, 1995
Accepted December 28, 1995 •
Acknowledgment of Ad Hoc Reviewers
The Journal wishes to thank persons who have reviewed manuscripts for this issue.(Numbers in parentheses indicate assistance with more than one manuscript.)
Philip AbramiMarilyn Jager AdamsLawrence AleamoniElisha Y. BabadJay BelskyJames R. Booth (2)Judith BoweyRobert H. BradleyEarl ButterfieldThomas P. CarpenterAllan S. CohenLyn CornoPeggy DeCorteSharon DenyPatrick DicksonBeverly Dretzke (2)
John DudaJohn FantuzzoDavid FeldmanMartin E. Ford (2)Mark GrabeRonald Johnson (2)Daniel KeatingTimothy Z. Keith (3)Kenneth A. KiewraClifford KonoldJames KulikBarbara G. Licht (2)Franklin R. Manis (2)Irene MiuraJames MoserWilliam E. Nagy
Michelle PerryArthur J. ReynoldsThomas RombergHollis ScarboroughLinda SiegelRobert E. SlavinM. J. SnowlingSteven A. StahlRobert SteinbergMichael SubkoviakDavid H. UttalPhilip VernonIrwin Waldman (2)Alvin Y. WangNoreen M. Webb