Embed Size (px)
Citation preview
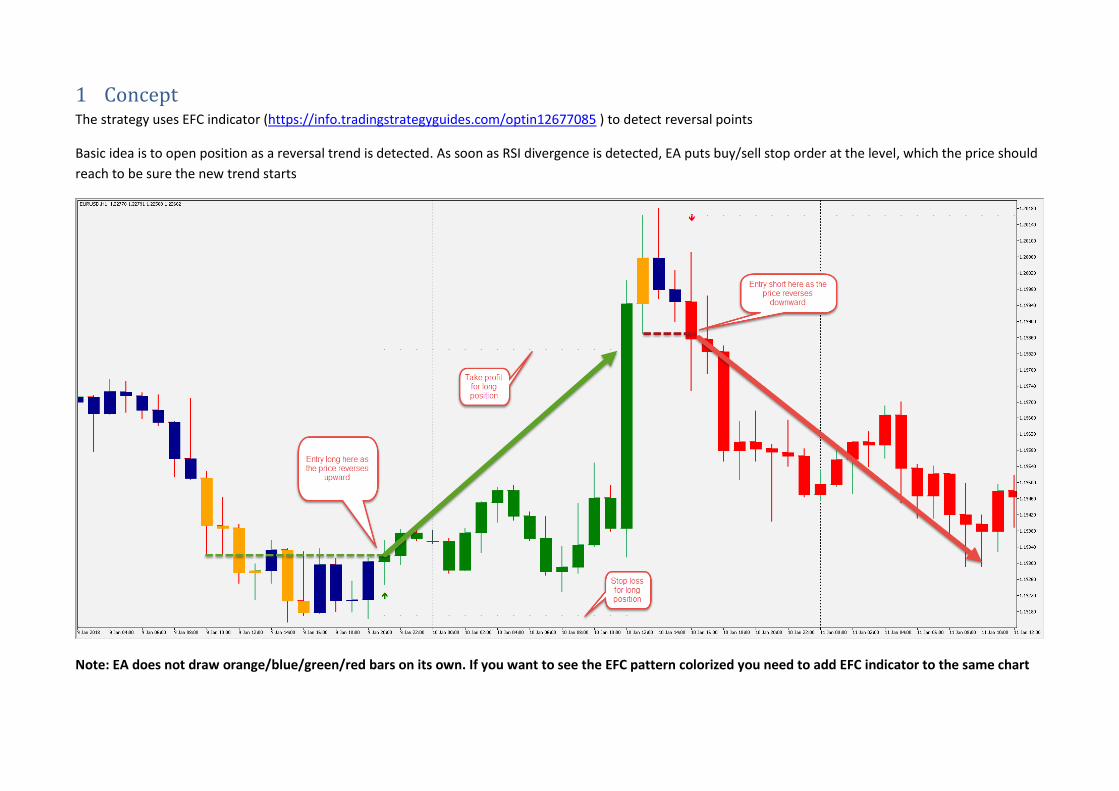
1 Concept The strategy uses EFC indicator (https://info.tradingstrategyguides.com/optin12677085 ) to detect reversal points
Basic idea is to open position as a reversal trend is detected. As soon as RSI divergence is detected, EA puts buy/sell stop order at the level, which the price should
reach to be sure the new trend starts
Note: EA does not draw orange/blue/green/red bars on its own. If you want to see the EFC pattern colorized you need to add EFC indicator to the same chart
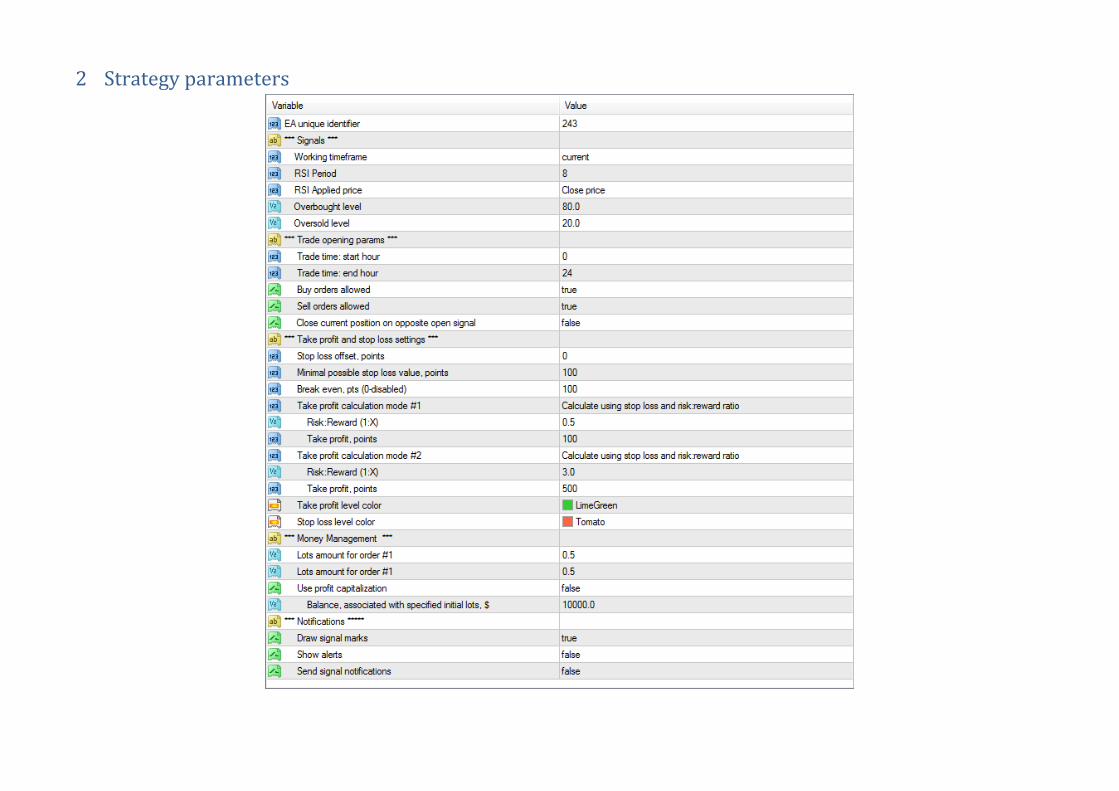
2 Strategy parameters
2.1 Signals
Working timeframe. By default, EA uses current timeframe of the chart, but you can fix the timeframe to the value you want. In this case EA will be using
specified timeframe all the time, no matter which current period of the chart is chosen
RSI Period, RSI Applied price, Overbought level, Oversold level. These parameters are similar to EFC Indicator’s parameters
2.2 Trade opening parameters
Trade time: start hour, end hour. By default EA works 27 hours a day. You can specify which hours are allowable for opening trade.
Buy/sell orders allowed. If you are sure that trend will go in certain direction and are no going to open opposite trades on retracements, you can disable buy or
sell orders. Be default, both type of orders are enabled
Close current position on opposite open signal. If set to true, EA will forcedly close current position (if it exists, of course) if the opposite signal will trigger. For
example, EA is going to put Buy stop order as it expects long trend coming soon. If the short position is still opened, EA closes it before putting buy stop order.
In fact, this case is very seldom. Usually, opposite position automatically closes much earlier than new opposite signal occurs.
2.3 Take profit and stop loss settings
Stop loss offset, points. By default, stop loss is set right to the highest/lowest price which was found during the pattern. For example, this is how the standard
stop loss is calculated
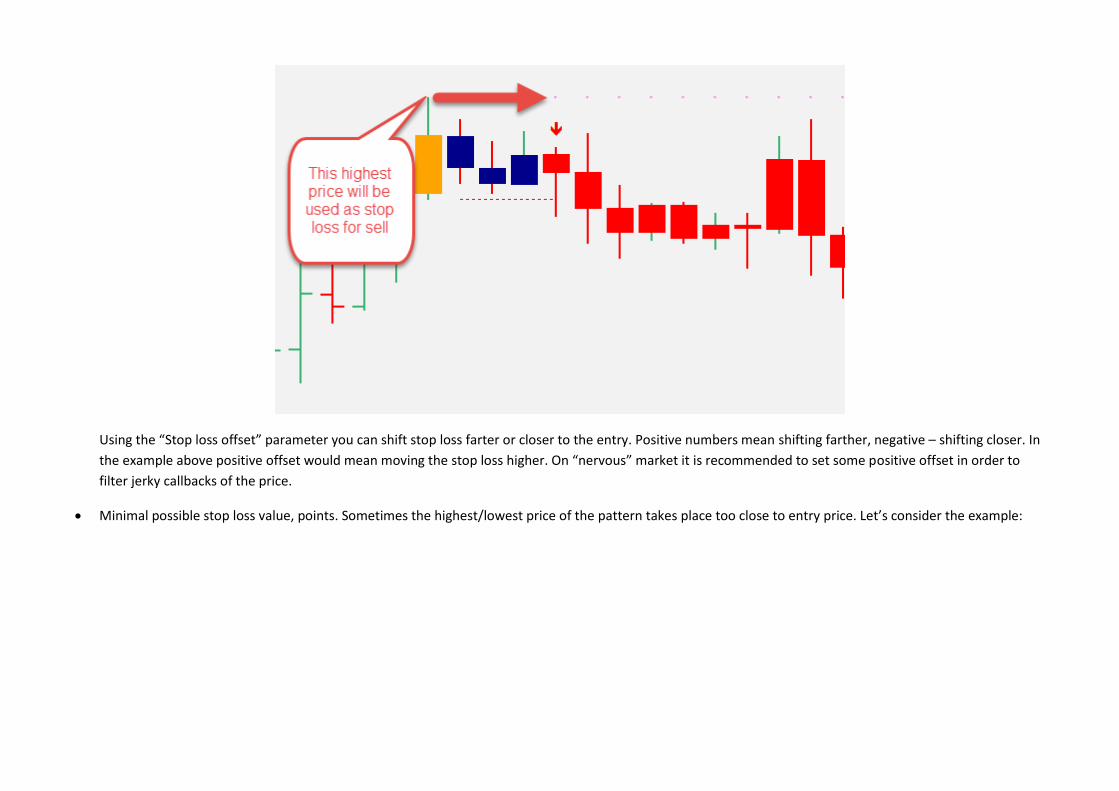
Using the “Stop loss offset” parameter you can shift stop loss farter or closer to the entry. Positive numbers mean shifting farther, negative – shifting closer. In
the example above positive offset would mean moving the stop loss higher. On “nervous” market it is recommended to set some positive offset in order to
filter jerky callbacks of the price.
Minimal possible stop loss value, points. Sometimes the highest/lowest price of the pattern takes place too close to entry price. Let’s consider the example:
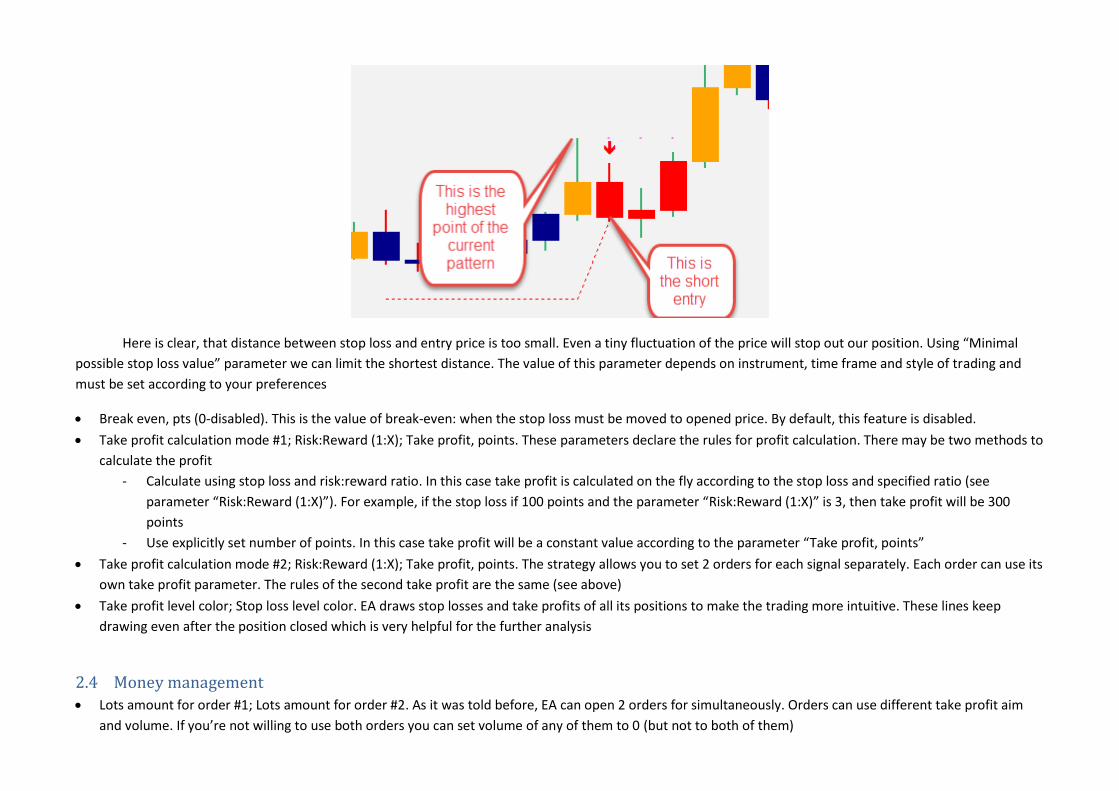
Here is clear, that distance between stop loss and entry price is too small. Even a tiny fluctuation of the price will stop out our position. Using “Minimal
possible stop loss value” parameter we can limit the shortest distance. The value of this parameter depends on instrument, time frame and style of trading and
must be set according to your preferences
Break even, pts (0-disabled). This is the value of break-even: when the stop loss must be moved to opened price. By default, this feature is disabled.
Take profit calculation mode #1; Risk:Reward (1:X); Take profit, points. These parameters declare the rules for profit calculation. There may be two methods to
calculate the profit
- Calculate using stop loss and risk:reward ratio. In this case take profit is calculated on the fly according to the stop loss and specified ratio (see
parameter “Risk:Reward (1:X)”). For example, if the stop loss if 100 points and the parameter “Risk:Reward (1:X)” is 3, then take profit will be 300
points
- Use explicitly set number of points. In this case take profit will be a constant value according to the parameter “Take profit, points”
Take profit calculation mode #2; Risk:Reward (1:X); Take profit, points. The strategy allows you to set 2 orders for each signal separately. Each order can use its
own take profit parameter. The rules of the second take profit are the same (see above)
Take profit level color; Stop loss level color. EA draws stop losses and take profits of all its positions to make the trading more intuitive. These lines keep
drawing even after the position closed which is very helpful for the further analysis
2.4 Money management
Lots amount for order #1; Lots amount for order #2. As it was told before, EA can open 2 orders for simultaneously. Orders can use different take profit aim
and volume. If you’re not willing to use both orders you can set volume of any of them to 0 (but not to both of them)
Use profit capitalization. When checked, initial lots will be corrected according to the profit achieved.
Balance, associated with specified initial lots, $. It is required to set the initial deposit, which is associated with specified lots amount. For example, the
deposit is $10 000 and initial lots amount = 1. When deposit becomes $11 000, lots for opening position will rise to 1.1 and so on
2.5 Notifications
Draw signal marks. If true, up and down arrows will be drawn at each bar where the buy/sell signal appears
Show alerts. If true, alerts will be generated for each buy/sell signal
Send signal notifications. If true, push notification will be sent on each signal generation
3 Examples of the EA working
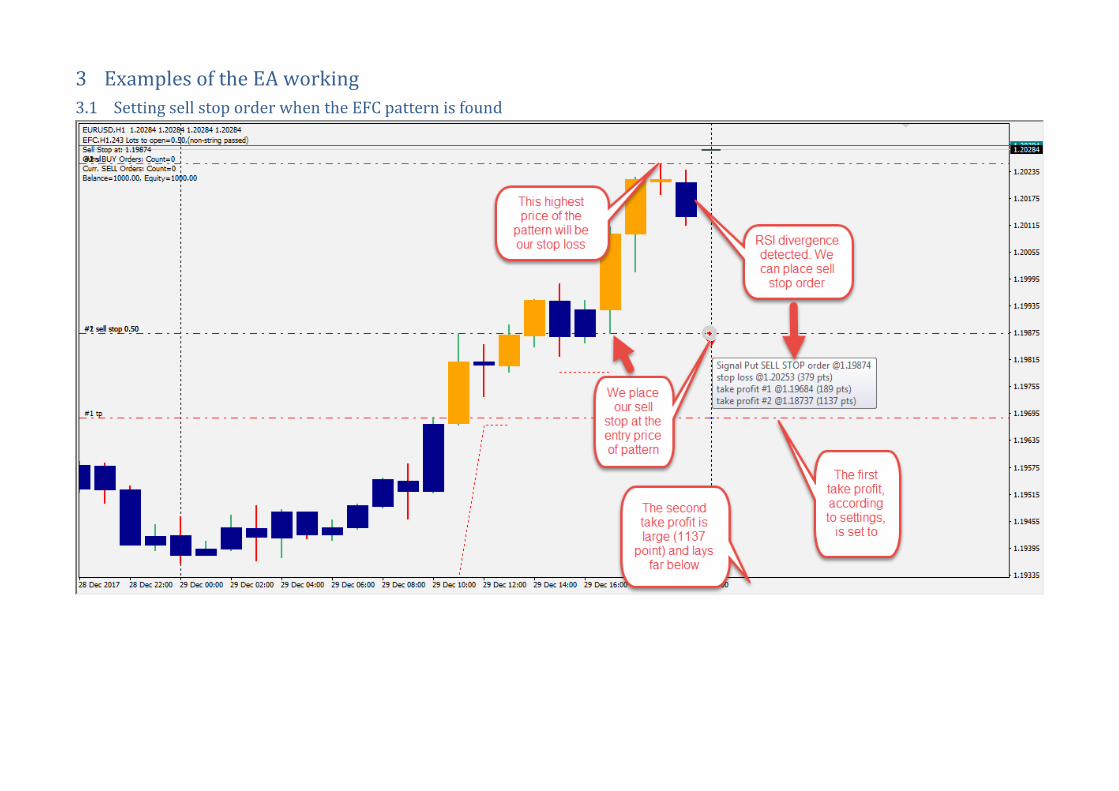
3.1 Setting sell stop order when the EFC pattern is found
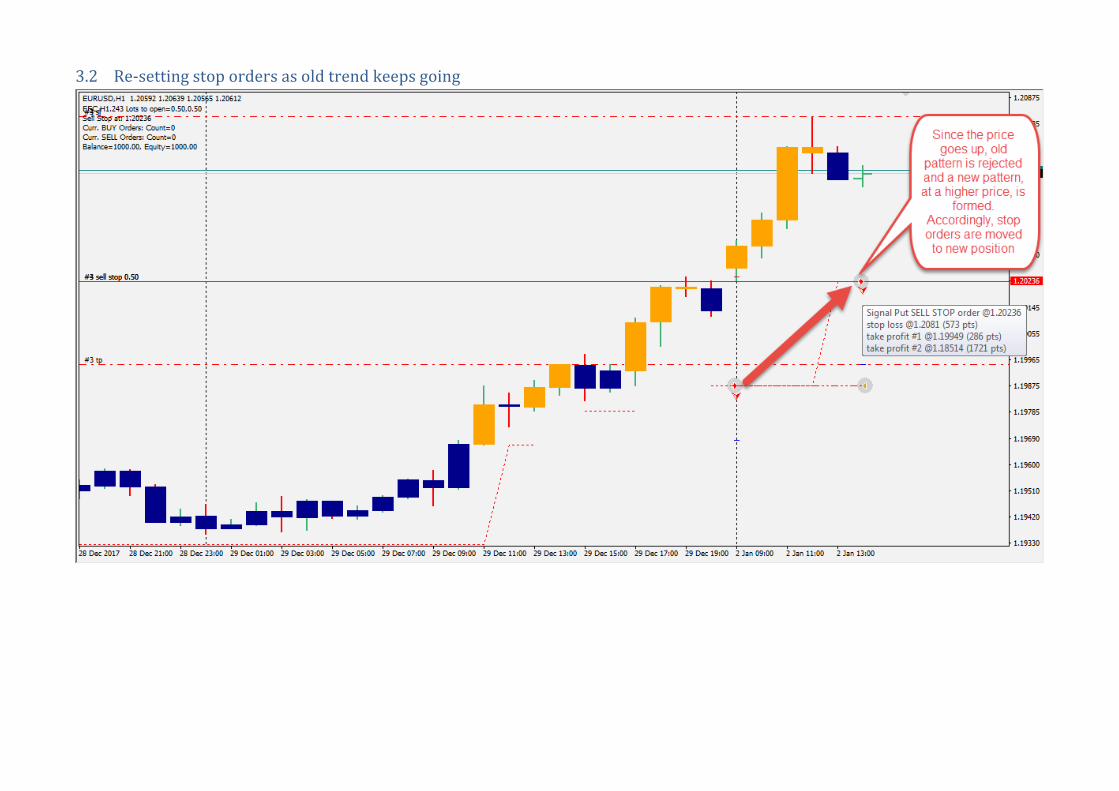
3.2 Re-setting stop orders as old trend keeps going
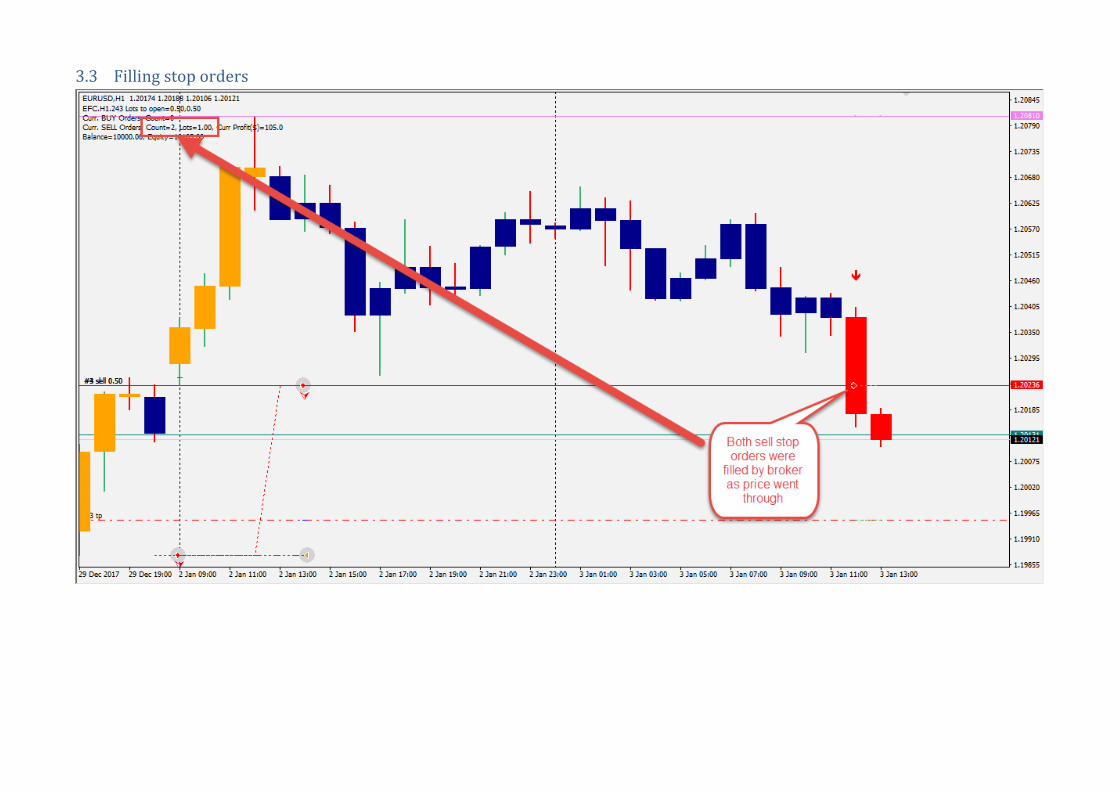
3.3 Filling stop orders
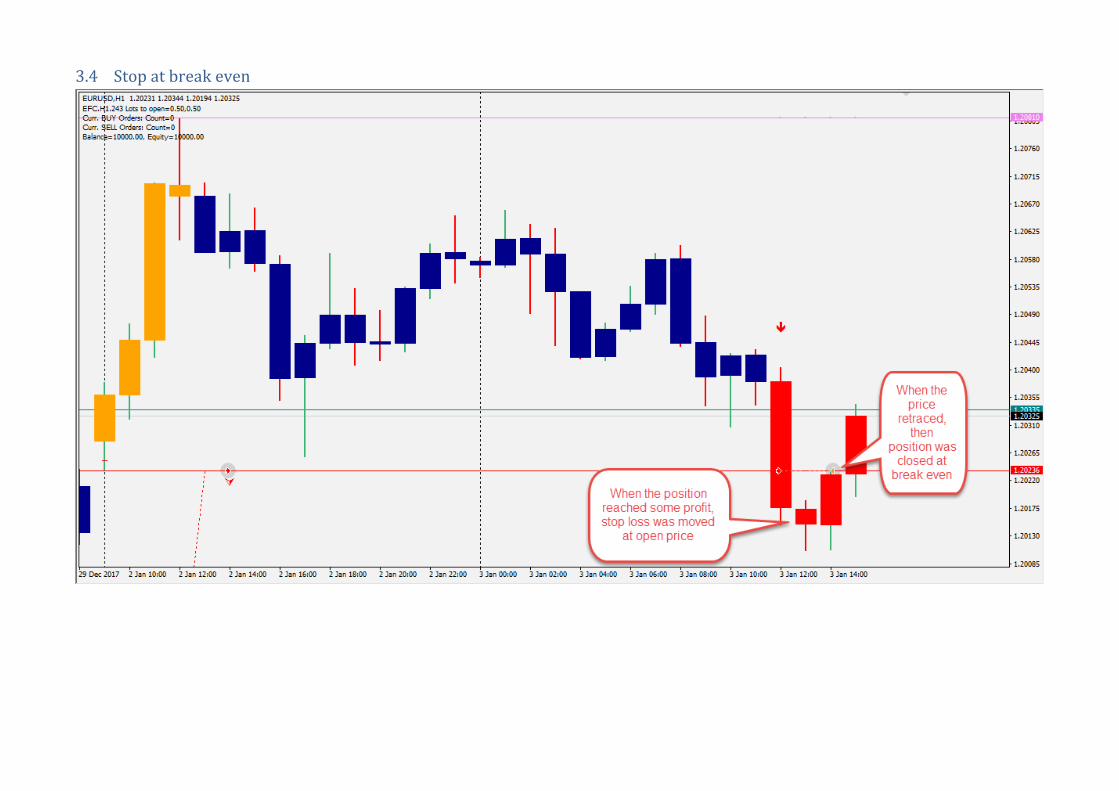
3.4 Stop at break even
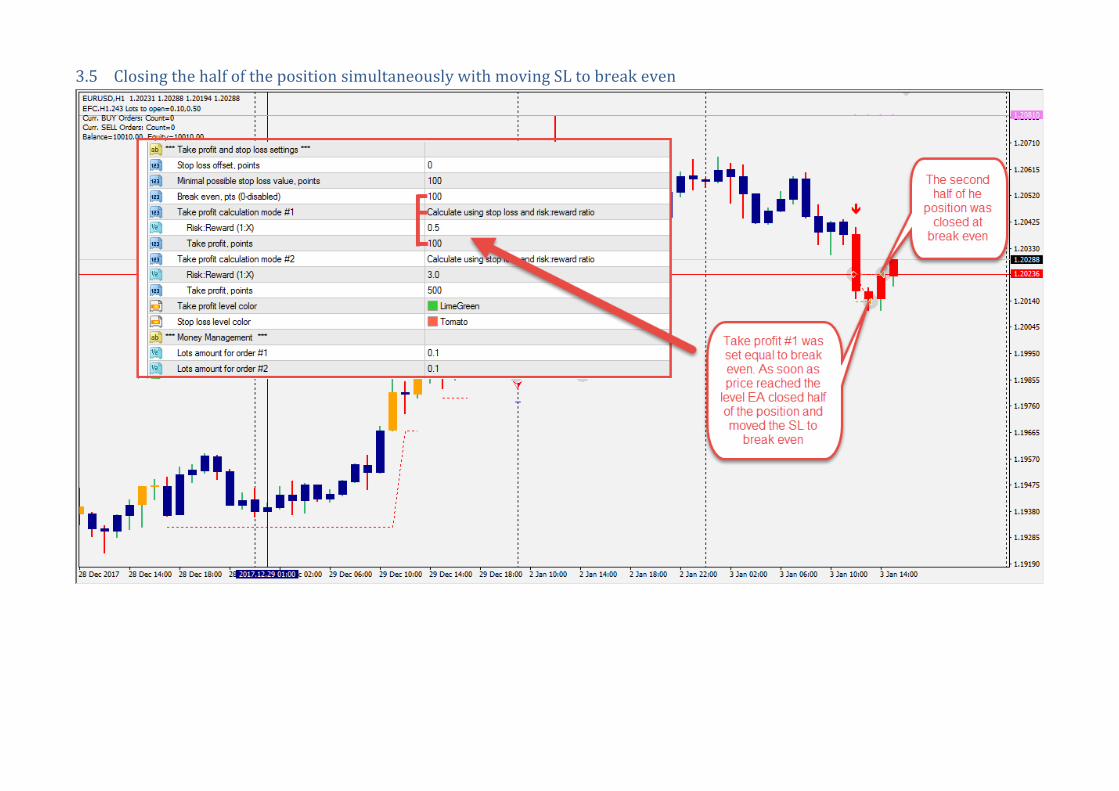
3.5 Closing the half of the position simultaneously with moving SL to break even
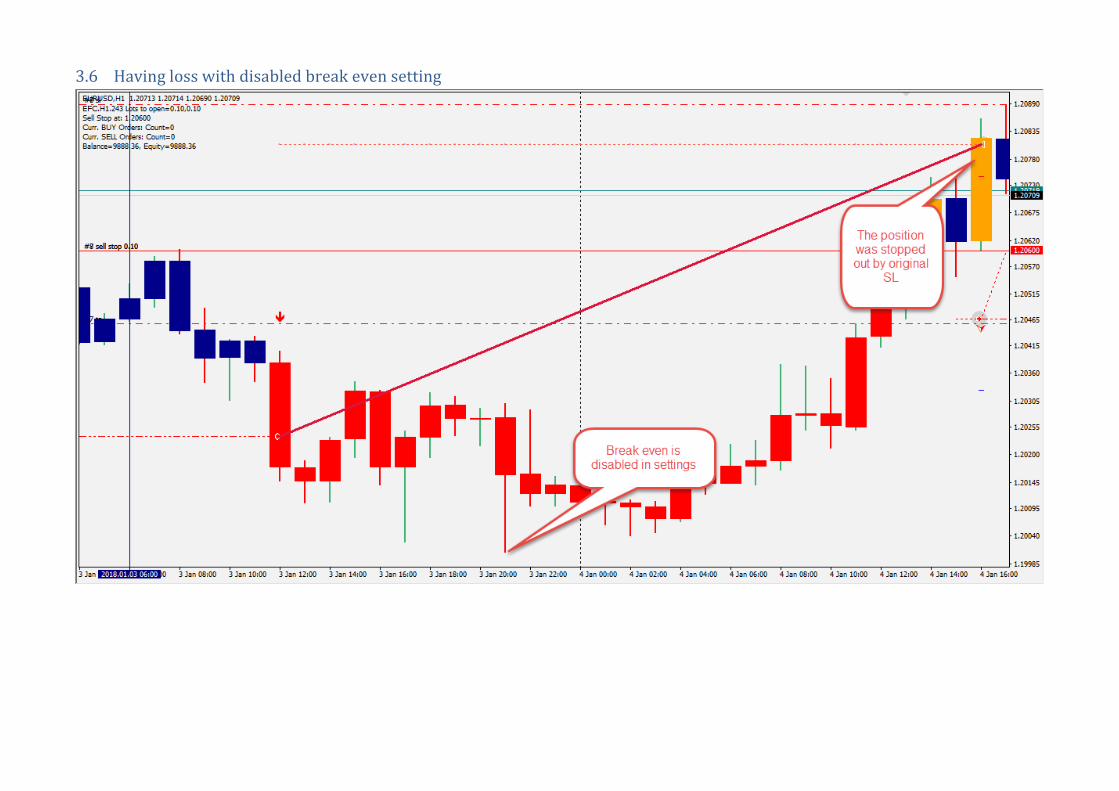
3.6 Having loss with disabled break even setting
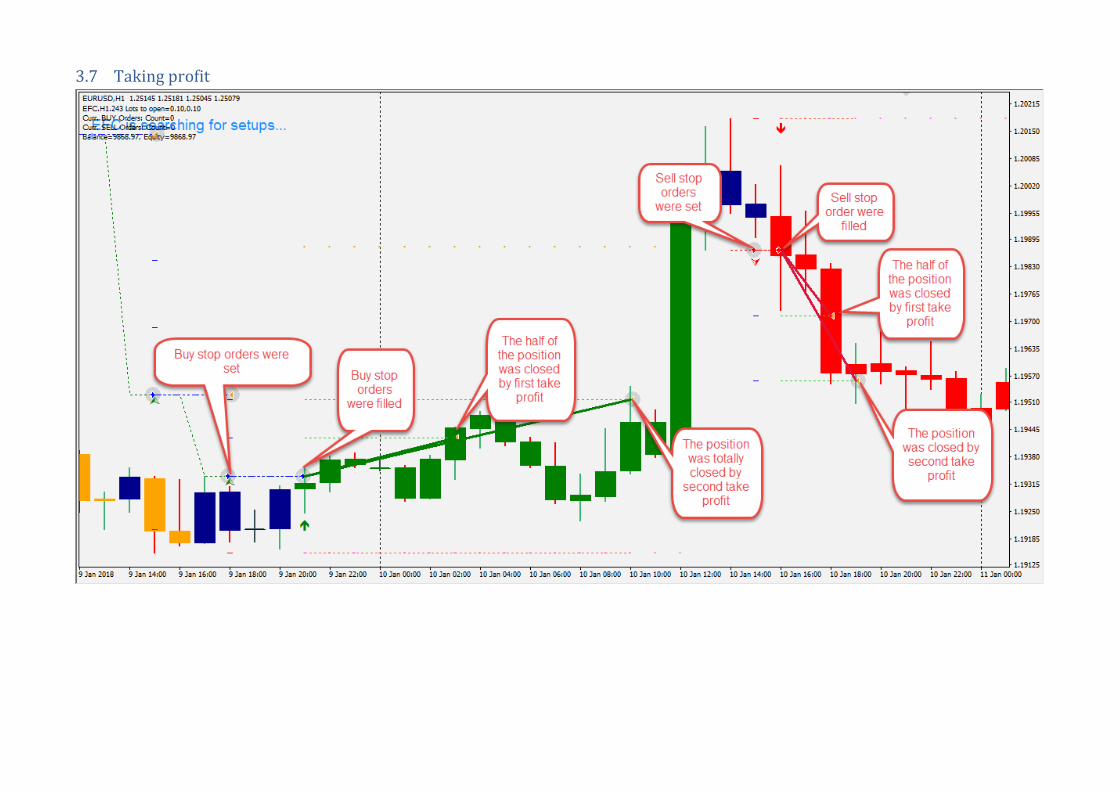
3.7 Taking profit
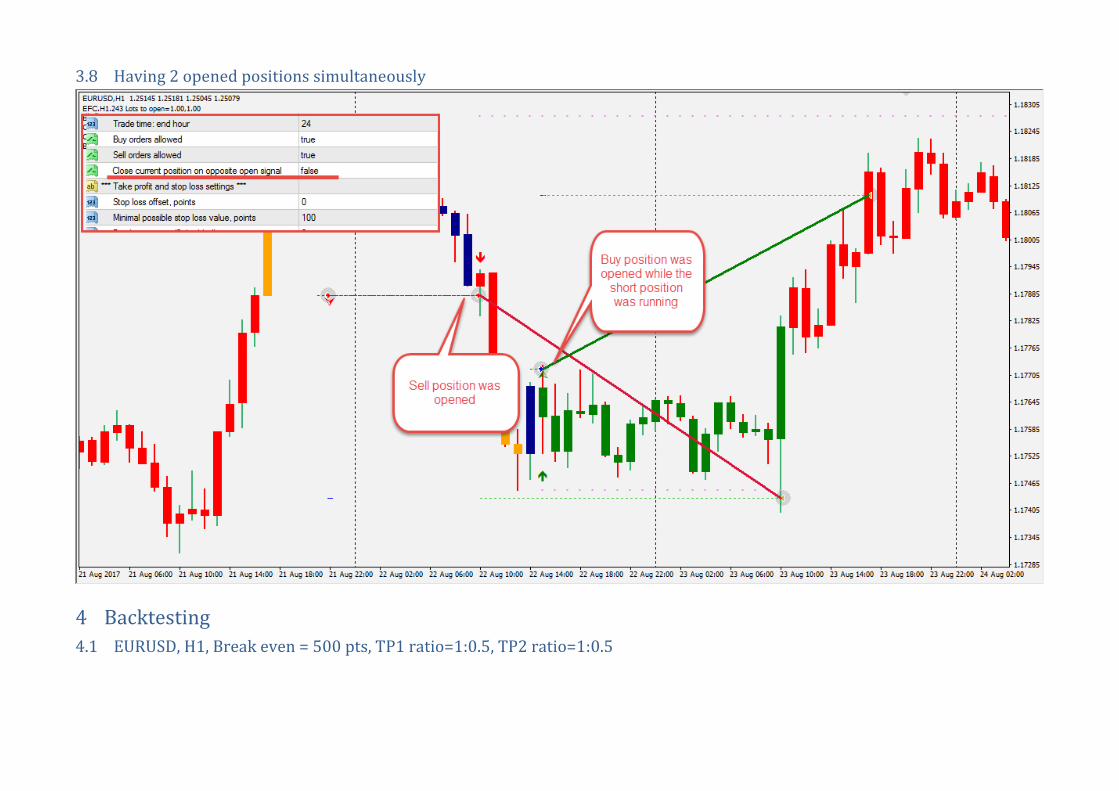
3.8 Having 2 opened positions simultaneously
4 Backtesting
4.1 EURUSD, H1, Break even = 500 pts, TP1 ratio=1:0.5, TP2 ratio=1:0.5
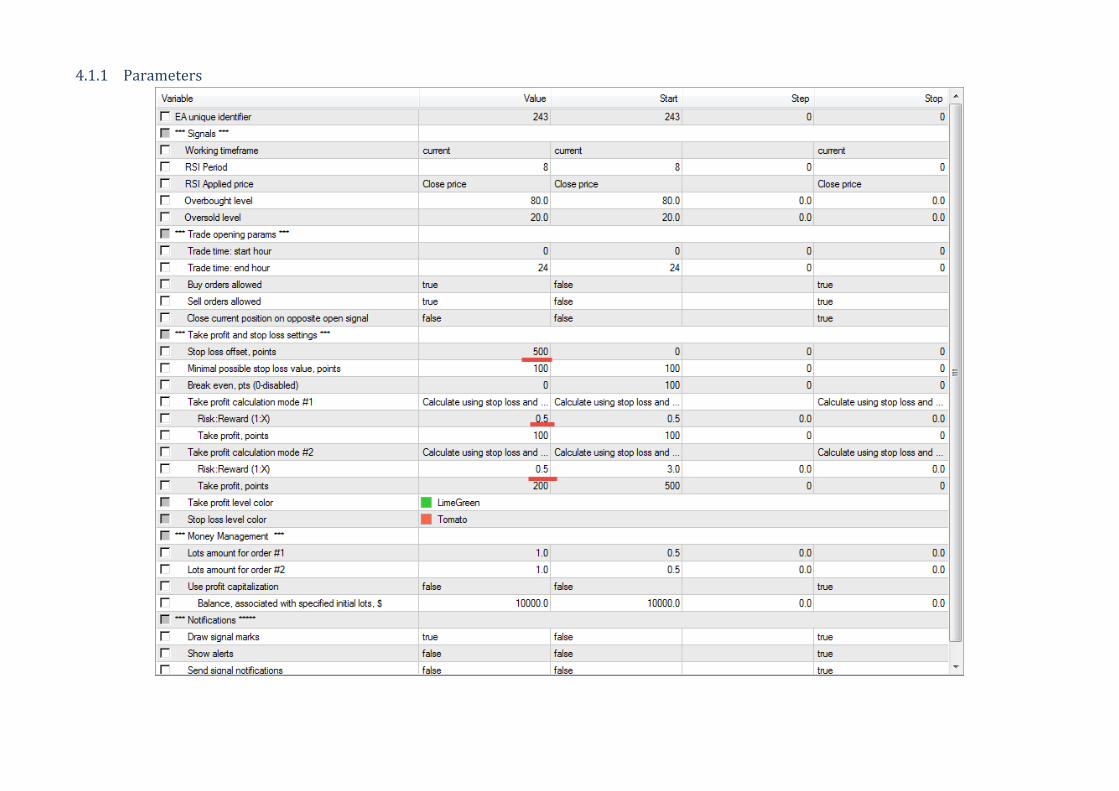
4.1.1 Parameters
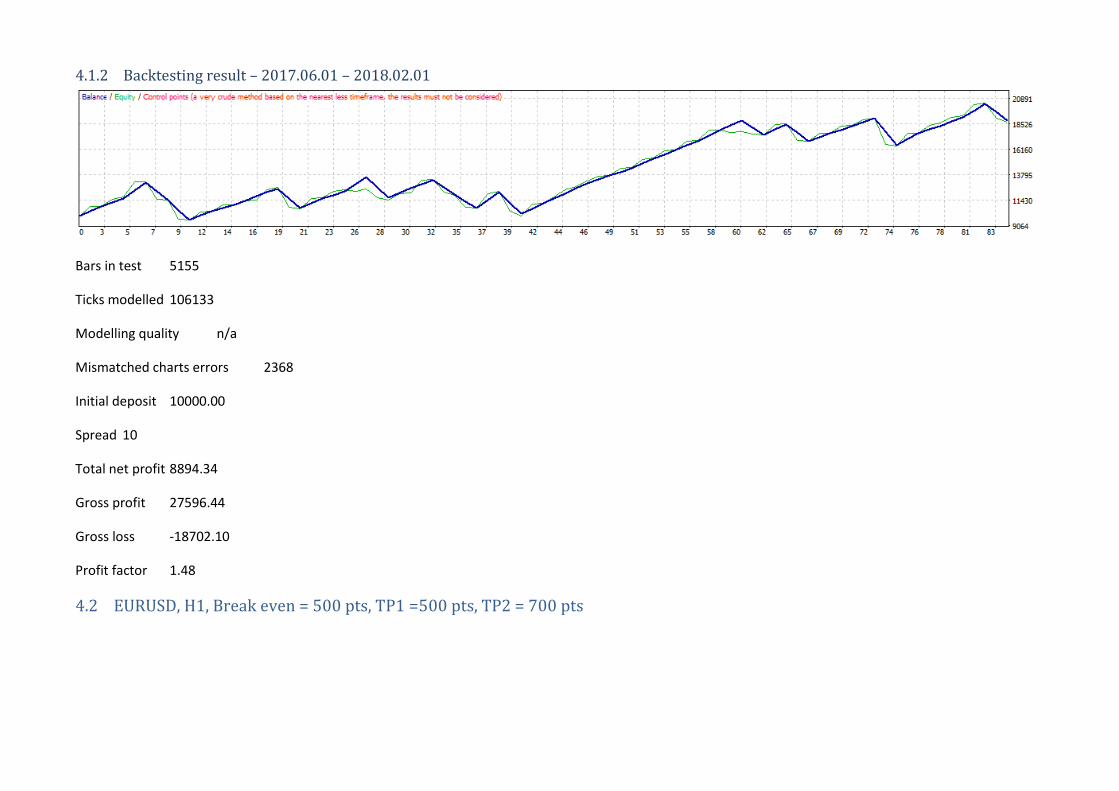
4.1.2 Backtesting result – 2017.06.01 – 2018.02.01
Bars in test 5155
Ticks modelled 106133
Modelling quality n/a
Mismatched charts errors 2368
Initial deposit 10000.00
Spread 10
Total net profit 8894.34
Gross profit 27596.44
Gross loss -18702.10
Profit factor 1.48
4.2 EURUSD, H1, Break even = 500 pts, TP1 =500 pts, TP2 = 700 pts
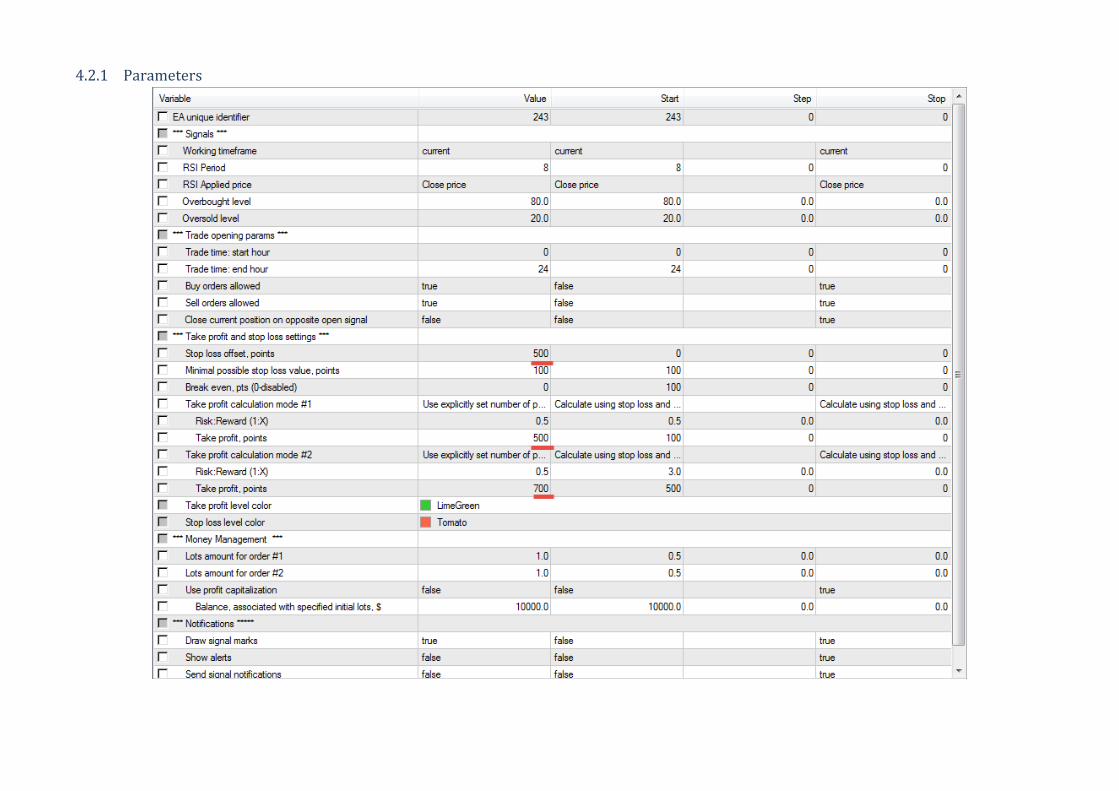
4.2.1 Parameters
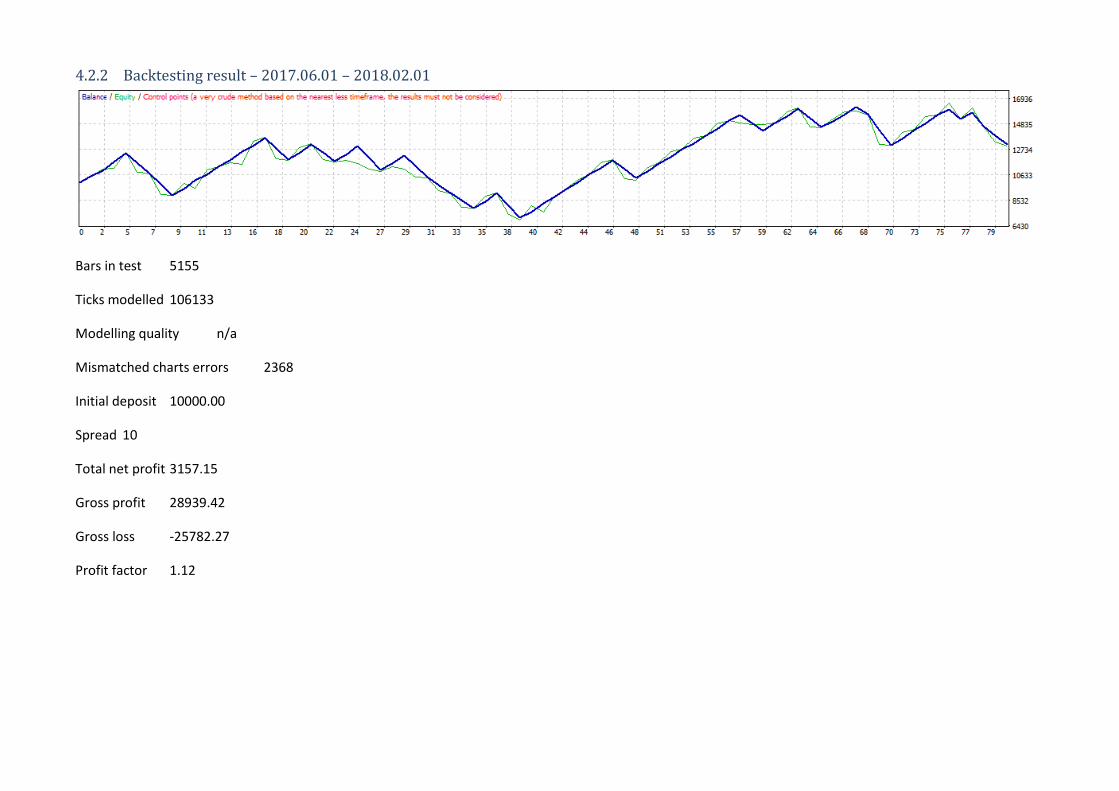
4.2.2 Backtesting result – 2017.06.01 – 2018.02.01
Bars in test 5155
Ticks modelled 106133
Modelling quality n/a
Mismatched charts errors 2368
Initial deposit 10000.00
Spread 10
Total net profit 3157.15
Gross profit 28939.42
Gross loss -25782.27
Profit factor 1.12