Embed Size (px)
Citation preview

International Journal of Pure and Applied Physics.
ISSN 0973-1776 Volume 13, Number 3 (2017), pp. 301-316
© Research India Publications
http://www.ripublication.com
Concentration Quenching Effects in Samarium
Doped Zinc Phosphate Glasses for Visible
Applications
B. Venkata Rao1,3, R. Jeevan Kumar2,3,, K. Venkata Rao4
1 Loyola Degree College, Pulivendula-516 390, A.P., India.
2Department of Physics, Sri Krishnadevaraya University, Anantapur- 517 003,
A.P., India.
3Department of Physics, JNTU University, Aanantapur-515 002, A.P., India.
4 S.B.V.R. Degree College, Badvel – 516 227, A.P., India.
Abstract
With interest in the luminescence properties of samarium, six series of
phosphate glass composition doped with samarium (0.1, 0.3, 0.5, 1.0, 1.5 and
2.0 mol%) were prepared by melt quenching method, and their luminescence
has been investigated. Structural properties are accomplished from XRD (X-
Ray Diffractometer) and Raman spectra. Spectroscopic properties are
investigated by measuring optical absorption spectra, excitation spectrum,
emission spectra and decay profiles. Environment of samarium in phosphate
host glass matrix can be accessed by Judd-Ofelt theoretical approach. This
theory gives three important parameters such as Ω2, Ω4 and Ω6. In turn these
parameters are further used to calculate emission properties certain Sm3+
transitions. Luminescence parameters such as stimulated emission cross-
sections (σp) and branching ratios (βexp) have been studied through
photoluminescence spectra. By adjusting the doping concentration in glass
system, the quenching and energy transfer effects of samarium were studied.
The optimal doping concentration of these phosphate glasses are 0.3 mol% of
samarium. The PL spectra for all glasses show four emission bands centred
between 564, 601, 643 and 706 nm, owing to the 4G5/2→6H5/2,
6H7/2, 6H9/2, and
6H11/2 transition of Sm3+ ions, respectively. Further, decay time constants are
Corresponding author email address: [email protected]

302 B. Venkata Rao, R.Jeevan Kumar & K. Venkata Rao
estimated from the decay profiles of Sm3+ doped different phosphate glasses.
An electric dipole–dipole interaction might be the dominant mechanism
involved in the energy transfer among between samarium ions, as it was
revealed from decay time data. This approach shows significant promise the
present prepared zinc phosphate glasses for use in reddish-orange lighting
applications.
Keywords: Rare earth doped glasses; Judd-Ofelt theory; Emission properties;
Absorption; Decay profiles; Raman spectrum.
1. INTRODUCTION
Various host lattices like glasses, crystals and polycrystalline doped with rare earth
ions show efficient emission. Choice of material and their combinations are possible
to dope rare earth ions. Glass is flexible and a good host for rare-earth (RE) ions. It
exhibit high optical transparency, good rare earth ion solubility, and it can be cast in a
variety of shapes or sizes. Luminescent glasses have attracted much attention in the
last decades, in particular for optical fibres, laser materials and optical amplifiers [1].
The native luminescence is enhanced by surrounding coordination environment and
its composition. We have different ways for getting high emission intensity in any
host by, (1) doping with single rare earth (RE) active ion into the suitable single host,
(2) co doping with suitable RE ions with different emissions into a single host matrix
and then excited simultaneously and, (3) co doping with different active ions in one
matrix and controlling the emission intensity through energy-transfer trend [2].
The choice of host materials is also an important task when one deals with improving
the efficiency of the luminescence processes. Phosphate glass has high mechanical,
good chemical and high thermal stability. Rare earth phosphates are significant due to
their bright properties, especially for optical. An extensive curiosity in phosphate
glass is confirmed by many publications on luminescence of RE ions in phosphate
glasses in recent years. For several applications, the information of the radiative
quantum efficiency and lifetime of the optical material are of important parameters.
For luminescence point of view, the colour intensity and appropriate doping impurity
with different rare-earth ions becomes important aspects [3].
However, drawback of phosphate glass is owing to easy attack towards hydroxyl
(OH) groups which dominates non-radiative emission of RE ions than radiative
emission. By addition of somewhat fluorine content reduces the OH level in
phosphate glasses [4]. The quantum efficiency of active RE ions can be increased by
decreasing of multiphonon relaxation rates and inturn increases their emission
lifetimes. In addition, phosphate glasses show an enhancement of RE radiative
emission properties due to their variety of sites available for the doping ions [5].

Concentration Quenching Effects in Samarium Doped Zinc Phosphate Glasses.. 303
The rare-earth ion samarium gained a great technological relevance. For useful
applications, the light produce at longer wavelength (red or orange) due to its 4G5/2
→6HJ (J = 5/2, 7/2, 9/2, 11/2) transitions, is the most suitable sources for solid state
lighting and display devices. Their red luminescence was, used in CRT tubes, optical
data storage media and plasma displays, and hence got important study [6]. Samarium
has been used as local structure probes [7] due to the electric-dipole (ED) character of
the 4G5/2→6H9/2 emissive hypersensitive transition whose intensity increases with
increase in environmental asymmetry around samarium ions.
Recently, Ramteke et al. [8] investigated spectroscopic studies of Sm3+/Dy3+ co-doped
lithium-boro silicate glasses. Zhongli Wu et al. [9] studied optical transition
properties, energy transfer mechanism and luminescent thermal stability of Sm3+-
doped silicate glasses .Franziska Steude et al. [10] highlighted quantum efficiency and
energy transfer processes in rare-earth doped borate glass for solid-state lighting.
Herrera et al. [11] prepared B2O3–PbO–Bi2O3–GeO2 glass doped with Sm3+ and gold
nanoparticles.
In this paper describes about the structure, optical and PL properties of samarium in
phosphate glasses. The influence of samarium impurity level on the PL properties was
investigated. By adjusting the doping concentration in glass system, to study the
quenching and energy transfer effects of samarium. Evaluation of the different
emission parameters from the luminescence dynamical process and fluorescence
lifetime measurements was done.
2. EXPERIMENTAL TECHNIQUES
Different zinc phosphate glasses were prepared by using raw materials (99.9%),
ammonium phosphate (NH4H2PO4), lithium fluoride (LiF), strontium oxide (SrO),
zinc oxide (ZnO) and samarium oxide (Sm2O3). The glass compositions details as
follows (mol%):
Precise amounts of the starting materials in mol% were weighed out and
grinded in an agate mortar. The mixtures were placed in porcelain crucibles and were
1 Sm01 59.9NH4H2PO4-10LiF-10SrO-20ZnO-0.1Sm2O3
2 Sm03 59.7NH4H2PO4-10LiF-10SrO-20ZnO-0.3Sm2O3
3 Sm05 59.5NH4H2PO4-10LiF-10SrO-20ZnO-0.5Sm2O3
4 Sm10 59.0NH4H2PO4-10LiF-10SrO-20ZnO-1.0Sm2O3
5 Sm15 58.5NH4H2PO4-10LiF-10SrO-20ZnO-1.5Sm2O3
6 Sm20 58.0NH4H2PO4-10LiF-10SrO-20ZnO-2.0Sm2O3

304 B. Venkata Rao, R.Jeevan Kumar & K. Venkata Rao
then heated in an electric furnace. After heating, the obtained liquid was poured on
brass plate and then pressed by another brass plate. The obtained glasses are used for
measurements.
Amorphous nature of prepared glasses was verified by SEIFERT X-RAY
diffractrometer. Raman spectrum is recorded JOBIN YVUON spectrometer. The
optical absorption spectral recording was done on ELICO SL 218 double beam
spectrophotometer. The excitation, photoluminescence spectra and decay curves of
Sm3+ doped glass samples were recorded using FLS-980 fluorescence spectrometer
with xenon lamp as excitation source.
3. RESULTS AND DISCUSSION
3.1 XRD analysis
XRD profile of 0.3 mol% of samarium doped phosphate glass is pictured in Fig.1.
From this figure, it is apparent that no characteristic diffraction peaks, indicating that
the prepared glasses are of amorphous in nature.
Fig.1. XRD pattern for 0.3 mol% Sm3+ doped zinc phosphate glass matrix
3.2. Raman spectra
Fig.2 shows Raman spectra of 0.3 mol% doped zinc phosphate glass matrix. The low
frequency band extended from 300-480 cm-1 region is related to the bending motion
of phosphate polyhedral PO4 units with cation like ZnO,SrO etc. as the modifier. The
Concentration Quenching Effects in Samarium Doped Zinc Phosphate Glasses.. 305
broad band at 773 cm-1 is due to symmetric stretching of (P–O–P) bridging oxygen
bonds in (P2O7)4 units. [12, 13, 14 ]. This peak is a convolution of two peaks i.e. one
may due to vibrations of the two joined Q2 units and the second one to those of Q1
units. Presence of last two bands indicates that due to addition of different modifiers
into glass matrix, long range order of network become cut down and formed chain
like units. This type of structural units increases glass strength.
Fig.2 Raman spectrum of 0.3 mol% Sm3+ doped zinc phosphate glass matrix
3.2 Absorption spectra and Judd-Ofelt theory
Absorption spectrum for 0.3mol% of samarium doped zinc phosphate glass is shown
in Fig.3a and 3b. From absorption spectrum, optical transitions are investigated. From
UV-NIR spectrum, the major absorption bands lies at 404 nm (Sm3+: 6H5/2→2P3/2) and
at 1250 nm (Sm3+: 6H5/2→6F7/2), which are characteristic for Sm3+ activated optical
glass materials. A weak feature at 17000 cm−1 is pertaining to transition in the near
NIR (Fig.3b). The absorption bands and their transition assignments from ground
state 6H5/2 to higher excited states are presented in the spectrum and these transitions
labelled according Ref [8, 9, 10]. In the present work, bands are appearing well in the
ultraviolet region relatively, even though absorption band of host glass lie in the
ultraviolet region and some of the transitions are overlapped with adjust levels.

306 B. Venkata Rao, R.Jeevan Kumar & K. Venkata Rao
(a)
(b)
Fig.3. (a) UV-VIS (b) NIR Absorption spectrum for 0.3 mol% Sm3+ doped zinc
phosphate glass matrix

Concentration Quenching Effects in Samarium Doped Zinc Phosphate Glasses.. 307
The oscillator strengths or spectral intensity for transitions, (from the absorption
spectrum) are considered and are used to evaluate the Judd-Ofelt parameters, using
least-squares fitting approach. The calculated (fcal) and experimental (fexp) spectral
intensities and their corresponding each transition are tabulated in Table 1. The details
of formulas are taken from Ref. [15, 16]. Table 1, depicts the spectral intensities of
Sm3+ for 0.3 mol% along with root mean square (RMS) deviations. RMS deviation is
a measure of difference between spectral intensity values of experimental (from
absorption spectra) and calculated (from JO theory) one. From Table 1, it is observed
that lower magnitude of RMS deviation indicating that calculation process is reliable.
Theory behind the work has been taken from Ref [17].
Table 1
Experimental (fexp) and calculated (fcal) spectral intensities (x10-6) and Judd-Ofelt
parameters (Ω λ x 10-20 cm2) of 0.3 mol% of Sm3+ doped zinc phosphate glass matrix
Transitions fexp fcal
4D3/2 0.14 0.72
6P7/2 1.39 1.31
6P3/2 3.98 4.08
6P5/2 0.36 0.62
4G9/2 0.23 0.06
4I11/2 1.19 1.00
6F11/2 0.30 0.29
6F9/2 2.20 2.30
6F7/2 3.72 3.54
6F5/2 2.38 2.27
6F3/2+6F1/2 1.17 1.14
RMS Deviation ±0.27
Ω2 0.51
Ω4 3.42
Ω6 2.51
308 B. Venkata Rao, R.Jeevan Kumar & K. Venkata Rao
The radiative transitions within the 4f2 configuration of Sm3+ ion can be analyzed by
the Judd-Ofelt theory based on the absorption spectrum of Sm3+ ion. Among the three
J-O parameters, Ω2 parameter is due to asymmetric potential of local environment or
covalency arises between Sm3+ and O2- ligand because of occupancy of samarium
ions in different coordination environment. Distortions at position of samarium site
may also contribute effectively to covalency or asymmetric environment. The other
two parameters viz., Ω4 and Ω6 are connected with the bulk properties such as rigidity,
viscosity and vibrational levels of the bonding of central samarium ions bound with
the surrounding oxygen/fluorine ligand atoms.
Judd-Ofelt intensity parameters Ωt (t = 2, 4 and 6) are derived to be 0.51x10⁻²⁰ cm2,
3.42x 10⁻²⁰ and 2.51x10⁻²⁰ cm2 for 0.3 mol% of samarium doped zinc phosphate glass
matrix, respectively and are included in Table 1. In the present glass system, JO
parameters follow the tendency as Ω4>Ω6>Ω2. Ω2 is higher than the values of
0.42x10⁻²⁰ cm2 in heavy metal borate [11] and 1.23x10⁻²⁰ cm2 in tellurite glass [18].
These magnitudes indicated that the prepared glasses have high covalent bond
between samarium and oxygen bond compared with above glass compositions. Ω2 is
lower than the values of 1.23x10⁻²⁰ cm2 in potassium yattrium double phosphates [19]
and 3.50x10⁻²⁰ cm2 in alkaline earth borate [20] glasses, showing a weak
asymmetrical and covalent environment around 0.3 mol% of Sm3+ doped glass
matrix. The differences in the distortion around the samarium position lead to
variation of covalency and asymmetry in the titled glass matrix. Such decrement or
weaker nature, there by decreases degree of disorder in the glass network. Weaker
field around Sm3+ ions causes to decrease the value of Ω2 parameter.
3.3. Emission analysis
For the Sm3+-doped Sm03 glass matrix, excitation spectrum is recorded and is shown
in Fig. 4. The five peaks are observed in the excitation spectrum represent the
transitions of dysprosium ion i.e. 6H5/2→4D1/2+
6P7/2(373 nm), 6H5/2→4F7/2 (401 nm),
6H5/2→4M19/2 (417 nm), 6H5/2→
4G9/2 (439 nm) and 6H5/2→4I11/2+
4I13/2+4M15/2 (470
nm). Approximately, 401 nm (6H5/2→4F7/2) excitation peak of samarium is selected as
the excitation wavelength to measure the luminescence spectra [21].

Concentration Quenching Effects in Samarium Doped Zinc Phosphate Glasses.. 309
Fig.4 Excitation spectrum of 0.3 mol% Sm3+ doped zinc phosphate glass matrix
Fig.5 Emission spectra of various concentrations of Sm3+ doped zinc phosphate
glasses

310 B. Venkata Rao, R.Jeevan Kumar & K. Venkata Rao
Samarium emission characteristic peak lines appeared as shown in Fig. 5 and the
corresponding characteristic emission peaks of samarium ion are most likely assigned
to 4G5/2→6H5/2 at 564 nm, 6H7/2 at 601 nm, 6H9/2 at 643 nm and 6H11/2 at 706 nm which
shows four characteristic Sm3+ emission bands. Four of these peaks originate from the
Sm3+ lowest emitting state 4G5/2. It is seen that a very strong visible signal is detected
in the reddish-orange (centered at λ ≈601 nm) and slightly less powerful signals at
708 nm. In the present work, from emission spectra it is observed that with increase of
nominal concentration of samarium, the emission intensity also increases. The higher
output luminescence intensity is reached for the content of the glass samarium ions
about 0.3 mol%. The bright luminescence observed for the Sm03 glass matrix is
reflective of a good optimization between composition-concentration and Sm3+
emissive states. While the 4G5/2→6H5/2 transition is does not appreciably depend on
the concentration of samarium doping in Fig. 3. However, the hypersensitive 4G5/2→
6H9/2 transition is magnetic dipole (MD) forbidden and electric-dipole (ED)
allowed and its intensity increases as the environmental asymmetry become higher.
Higher in the intensity ratio of emissions 4G5/2 →6H9/2 to 4G5/2→6H5/2 is indicating
that the higher in environmental asymmetry and covalency of the luminescent ions.
One can see that during increasing concentration from 0.1 mol% to 0.3 mol%, the
emission intensity is enhanced in three fold times and then decreases. The main
reason of such decrement should be due to the concentration quenching. Also, at
lower concentrations of samarium ions (up to 0.3 mol%) the samarium coordinates
with nonbridging oxygens which is responsible for the higher luminescence intensity.
At higher concentrations (>0.3 mol%), samarium ions coordinate with bridging
oxygens. The interaction between phosphate groups and oxygen groups through
samarium ions decreases, i.e. connectivity decreases. Hence, there is a possibility of
decreasing fluorescence intensity. The concentration clusters also be a principal for
the differences in the behaviour of the luminous. Due to the ion-ion interaction, some
transferring processes occurred in samarium doped zinc phosphate glass matrix.
From emission data, luminescence parameters like transition probabilities (AR),
luminescence branching ratios (βexp), effective emission bandwidths (Δλeff) and
stimulated emission cross-sections (σe) are calculated for all glasses [3,4] and is
presented in Table 2 for the Sm03 glass matrix. The emission transition, 4G5/2→6H7/2
shows the higher radiative transition rate (AR: 165 s-1) than other emission transitions.
The magnitude of branching ratios characterizes the lasing potential of an emission
transition. From Table 2, the 4G5/2→6H7/2 transition is showing higher branching
ratios (49%) which is highly suitable for than other transitions. The predicted βexp are
found to be higher for those transitions which are having maximum AR values. The
level having relatively large values of transition probability (AR), branching ratios (β)
and energy gap to next lower level may exhibit good and efficient emission properties
and are reported in Table 2.
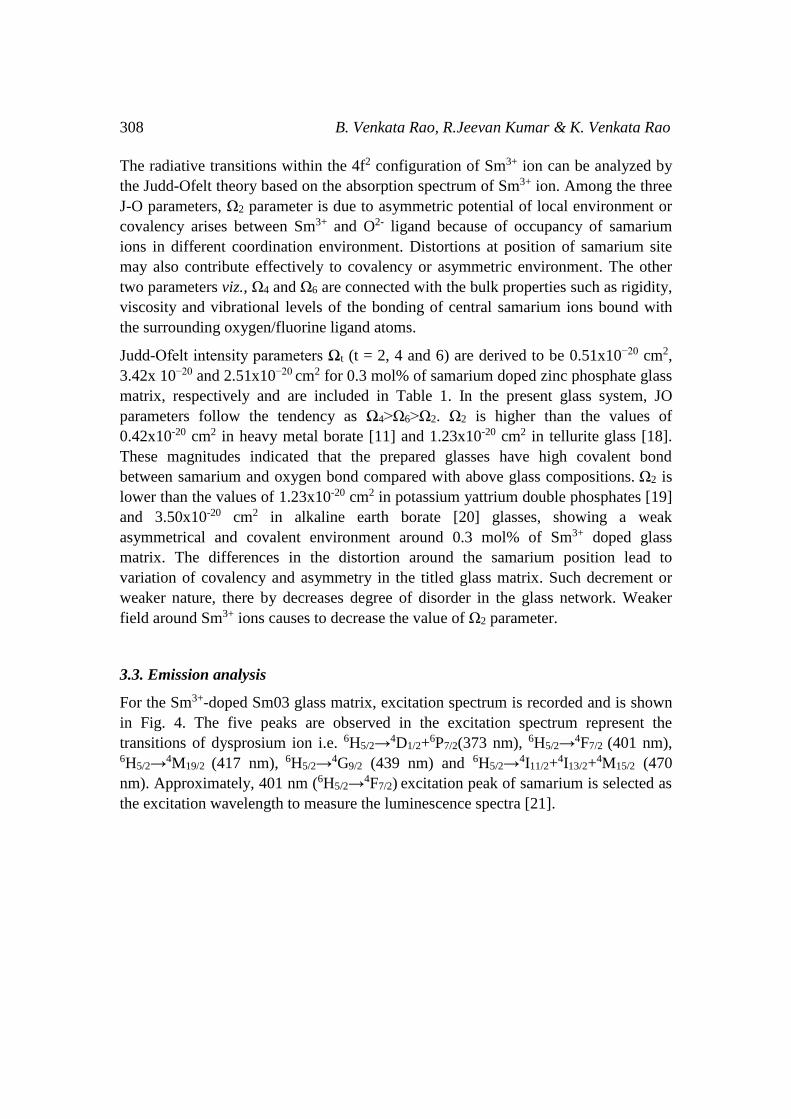
Concentration Quenching Effects in Samarium Doped Zinc Phosphate Glasses.. 311
Table 2
Emission band positions (λP, nm), effective bandwidths (Δλeff , nm), radiative
transition probabilities (AR, s-1), peak stimulated emission cross-sections (σP, x10-22
cm2),experimental branching ratios (βexp) of 4G5/2 state for the 0.3 mol% Sm3+ doped
zinc phosphate glass matrix
Transition
Parameters
Sm03
4G5/2→6H5/2
λP
Δλeff
AR
σP
βexp
564
9
113
6.65
0.07
4G5/2→6H7/2
λP
Δλeff
AR
σP
βexp
601
11
165
9.84
0.46
4G5/2→6H9/2
λP
Δλeff
AR
σP
βexp
643
13
135
8.69
0.38
4G5/2→6H11/2
λP
Δλeff
AR
σP
βexp
706
24
46
3.01
0.09
The stimulated emission cross-section parameter σ(λp)(J,J') for transitions between J
and J' level and a good luminescent transition should have larger σe magnitudes. The
materials with large σe are utilized to obtain CW laser action [3, 5]. Table 2 gives
stimulated emission cross-sections for the observed four emission transitions. Form
the table, it is observed that the stimulated emission cross-section is higher for 4G5/2→
6H7/2 transition (9.84x10⁻²² cm2) among the four transitions and indicating the
possible use of this transition for photonic purpose suitable for laser emission.
The ground state 6H5/2 of samarium was first excited to higher state 6P3/2 when
radiation is focused on the samarium glass samples. First, the 6P3/2 level is excited and

312 B. Venkata Rao, R.Jeevan Kumar & K. Venkata Rao
then the initial population relaxes non-radiatively to the lower 4G5/2 emitting level,
since the intermediate levels have small vibrational energy differences between the 6P3/2 and 4G5/2 levels. The 4 G5/2 level is separated from the next lower lying level
(6F11/2) by about 7200 cm-1 vibrational energy which is high, so that the multiphonon
relaxation (MPR) between these levels is inactive.
As determined from the PL spectrum, the lowest state energy is 22222 cm-1. There are
three Sm3+ excited states (4G7/2, 4F3/2 and 4G5/2) that can efficiently absorbs excitation
source energy from the lowest state. However, intense emission is only observed from
the 4G5/2 level. This is owing to the closeness of three states, which causes electrons
depopulated from the higher states to the 4G5/2 level, from which emission take place.
The energy level structure of samarium excited by 401 nm radiation is shown in the
Fig.6.
Fig.6 Energy level scheme of Sm3+ doped zinc phosphate glass matrix
The energy is lost due to nonradiative processes at higher concentrations. The average
Sm–O distance is expected to be relatively smaller in the glass sample containing 0.1
and 0.3 mol% of Sm3+ ions concentration and the concentration of higher than this
forms probable Sm3+ clusters that hinders PL emission intensity.
3.4. Decay analysis
Excited at 404 nm and monitored at 601 nm, the decay profiles of Sm3+ doped zinc
phosphate glasses are measured. Fig.7 shows the decay curves of zinc phosphate glass

Concentration Quenching Effects in Samarium Doped Zinc Phosphate Glasses.. 313
samples with different doping concentrations of samarium ion. From Fig.7, the decay
curves resolved with single exponential function for Sm01 amd Sm03 (0.1 and 0.3
mol%) and changed into non-exponential nature for Sm05, Sm10, Sm15 and Sm20
glasses. The emission intensities and decay times showing similar behaviour of
concentration quenching. The lifetimes are obtained by e folding times for the studied
glasses and presented in Table 3. The decay lifetimes are found to be 1.25, 1.03, 0.90,
0.81, 0.73 and 0.52 ms for 0.1, 0.3, 0.5, 1.0, 1.5 and 2.0 mol% containing zinc
phosphate glasses respectively. It is obviously observed that the decay times show the
regular decrease with concentration of samarium ions. The lifetimes decrease with
increasing the nominal content of samarium ion. The non-exponential character of the
decay curves indicate a dipole-dipole type of interaction behaviour in-between two
like Sm3+ ions due to higher doping level (>0.3 mol%).
Fig.7 Decay profiles for various concentrations of Sm3+ doped of zinc phosphate
glasses
At low level of samarium content, the involvement of ion–ion interaction to the decay
times is less and the relaxation is dominated by radiative emission transition. The role
of the relaxation phenomenon can be approximated through energy gap principle that
relates the multiphonon relaxation rate (MPR) and the no of phonons which are
needed to cross the energy difference between them. The 4G5/2 level possesses purely
radiative relaxation process as this level has higher energy gap (∼7,000 cm-1) with
respect to the next lower lying 6F11/2 level and negligible effect of MPR phenomenon.
Any non-exponential character of the fluorescence decay levels accompany by a fast
decrease of lifetimes is attributed to the energy transfer (ET) between two similar
314 B. Venkata Rao, R.Jeevan Kumar & K. Venkata Rao
samarium atoms. Rare earth ions including Sm3+ in amorphous zinc phosphate glass
systems form aggregates or clusters in which cross relaxation can give rise to non-
radiative de-excitation resulting in short lifetimes. Low intensity and short emission
lifetimes exhibited by the glass Sm20 indicates that the possible presence of larger
concentration of Sm3+ ion clusters that may cause luminescence quenching through
ET. In order to investigate the process involved in the ET mechanism, the non-
exponential decay curves for the 4G5/2 level of Sm3+ ions have been analyzed using
Inokuti–Hirayama (I-H) model [10]. Best fits of the experimental decays are obtained
for S=6 and indicating the ET through cross-relaxation is due to dipole–dipole type of
interaction between Sm3+ ions.
Acceptor and donor density become more means simultaneously increases
enhancement in ET through cross-relaxation (CR) behaviour seems to be appear. The
possible CR channels in the Sm3+ ion are: (4G5/2 6H5/2)-(
6F5/2, 6F11/2) and (4G5/2,
6H5/2)-
(6F9/2, 6F7/2). This CR is due to the ET from the Sm3+ ion in an excited 4G5/2 state to a
nearby Sm3+ ion in the ground 6H5/2 state (Fig. 6). This transfer leaves the first ion in
the intermediate level of 6F5/2 at around 7283 nm and the second one in 6F11/2 at
around 10582 cm-1. The lifetime of the 0.3 mol% doped glass system is longer
compared with other reported glass systems. As can be seen from Table 4, the decay
of 0.1 mol% and 1.0 mol% displayed short and long lived emissions, of samarium
doped phosphate glasses.
CONCLUSIONS
In the present investigation, the luminescence properties of samarium have been
investigated. Further, structural properties are also measured like XRD (X-Ray
Diffractometer) and Raman spectrum. It is confirmed that the prepared glasses are
amorphous character though XRD profiles. From Raman spectra, vibrational bands
were identified. Spectroscopic properties are investigated by measuring optical
absorption spectra, excitation spectrum, emission spectra and decay profiles.
Environment of samarium in zinc phosphate host glass matrix can be accessed by
Judd-Ofelt theoretical approach. In turn these parameters are further used to estimate
emission properties through photoluminescence spectra. Ω2 value indicates the change
in the asymmetric nature of Sm3+ in the zinc phosphate glass host which is also
clearly indicated by the asymmetry ratio. From emission spectra, in zinc phosphate
glasses showed a characteristic emission wavelength with a maximum at 601 nm. The
emission intensity of Sm3+ doped different zinc phosphate glasses around 601 nm
increased greatly at first and then decreased. Initially, the number of stimulated
electrons increased with increase in samarium concentration, the emission intensity of
the emission peak located at 601 nm increased greatly at first. Emission intensity
reach to the maximum at the Sm3+ concentration x=0.3 mol%, further the emission
Concentration Quenching Effects in Samarium Doped Zinc Phosphate Glasses.. 315
intensities decreases owing to concentration quenching process. The optimal
concentration of samarium is at 0.3m mol% in the prepared zinc phosphate glasses.
By adjusting the doping concentration in glass system, the quenching and ET effects
of samarium were studied. The double exponential profile can be attributed to the
different environments experienced by samarium ions within the glass matrix. These
results indicate that energy is lost due to cross relaxations. The obtained results in the
present case indicate that bright reddish-orange emission achieved at 0.3 mol%
samarium ion which has high luminescence intensity, high branching ratios, high
transition probability and high emission cross-sections under suitable excitation
wavelength.
REFERENCES
[1] F. Steude, S. Loos, Bernd Ahrens, S. Schweizer, J. Lumin. 170 (2016) 770–777.
[2] Alberto JoseFernandez-Carrion, Manuel Ocana, Jorge García-Sevillano,
Eugenio Cantelar, and Ana Isabel Becerro, J. Phys. Chem. C 118
(2014)18035−18043.
[3] Franziska Steudel, Sebastian Loos, Bernd Ahrens, Stefan Schweize , J. Lumin.
170 (2016) 770–777.
[4] F. Huang, X. Liu, L. Hu, D. Chen, Scientific Reports, 4 (2014) 1-9.
[5] R. Morea, A. Miguel, T.T. Fernandez, B. Maté, F.J. Ferrer, C. Maffiotte, J.
Fernandez , R. Balda , J. Gonzalo, J. Lumin. 170 (2016) 778–784.
[6] Xiang-lei Wang, Zhi-qiang Liu, Marion A. Stevens-Kalceff, Hans Riesen,
Inorg. Chem. 53 (2014) 8839−8841.
[7] J. Liao, Liangbin Liu, Hangying You, Haiping Huang, Weixiong You, Optik
123 (2012) 901– 905.
[8] D.D. Ramteke , Vijay Kumar, H.C. Swart, J. Non-Cryst. Solids 438 (2016) 49–
58.
[9] Z.i Wu, B. Chen, , X. Li, J. Zhang, J. Suna, H. Zhong, H. Zheng, L. Tong, H.
Xia, J. Alloys Compds. 663, (2016) 545–551.
[10] K. Linganna, Ch. Basavapoornima, C.K. Jayasankar, Optics Commun. 344
(2015) 100–105
[11] A. Herrera, S. Buchner, R.V. Camerini, C. Jacinto, N.M. Balzaretti, Opt. Mater.
52 (2016) 230–236.
[12] Pemberton J. E., Latifzadeh L., Fletcher J. P. and Risbud S. H., Chem. Mater.,
3 (1991) 195-200.
[13] Ilieva D., Jivov B., Bogacev G., Petkov C., Penkov I, Dimitriev Y., J. Non-
Cryst. Solids, 238 (2001) 195-202.
[14] P. Stoch, W. Szczerba, W. Bodnar, M. Ciecinska, Agata Stochd and Eberhard
Burkel, Phys. Chem. Chem. Phys., 2014, 16, 19917—19927.
[15] B.R. Judd, Phys. Rev. 127 (1962) 750.
316 B. Venkata Rao, R.Jeevan Kumar & K. Venkata Rao
[16] G.S. Ofelt, J. Chem. Phys. 37 (1962) 511.
[17] S. Selvi, K. Marimuthu, G. Muralidharan, J. Luminescence 159 (2015) 207–
218.
[18] A. Kumar, D.K. Rai, S.B. Rai, Spectrochimica Acta Part A 59 (2003) 917–925.
[19] M. Sobczyk, D. Szymański, M. Guzik, J. Legendziewicz, J. Lumin. 169 (2016)
794–798.
[20] L. F. Shen, B. J. Chen, E. Y. B. Pun, H. Lin, J. Lumine. 160 (2015) 138-144.
[21] D. Rajesh, A. Balakrishna, Y.C. Ratnakaram, Opt. Mater. 35 (2012) 108–116.