Embed Size (px)
DESCRIPTION
Computer Aided Diagnosis System for Lumbar Spinal Stenosis Using X-ray Images. Soontharee Koompairojn Kien A. Hua School of EECS University of Central Florida. Chutima Bhadrakom Department of Radiology Thai Nakarin Hospital Thailand. Outline. Background Methodology - PowerPoint PPT Presentation
Citation preview

1
Computer Aided Diagnosis System forComputer Aided Diagnosis System forLumbar Spinal Stenosis Lumbar Spinal Stenosis
Using X-ray ImagesUsing X-ray Images
Soontharee KoompairojnKien A. Hua
School of EECSUniversity of Central
Florida
Chutima Bhadrakom
Department of RadiologyThai Nakarin Hospital
Thailand

Outline
Background
Methodology Classifiers Construction Automatic diagnosis
Prototype
Experimental Studies
Conclusions2
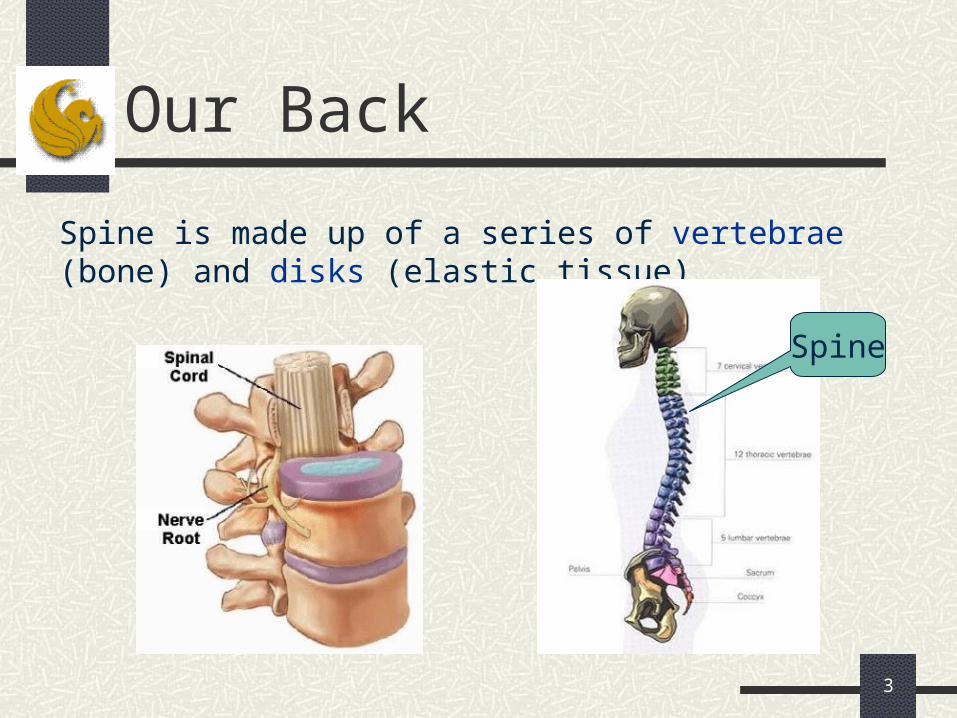
Our Back
Spine is made up of a series of vertebrae (bone) and disks (elastic tissue)
3
Spine

Facet Joints
• A joint is where two or more bones are joined
• Joints allow motion
• The joins in the spine are called Facet Joints
• Each vertebra has two set of facet joints. One pair faces upward and one downward
• Facet joints are hinge-like and link vertebrae together
4
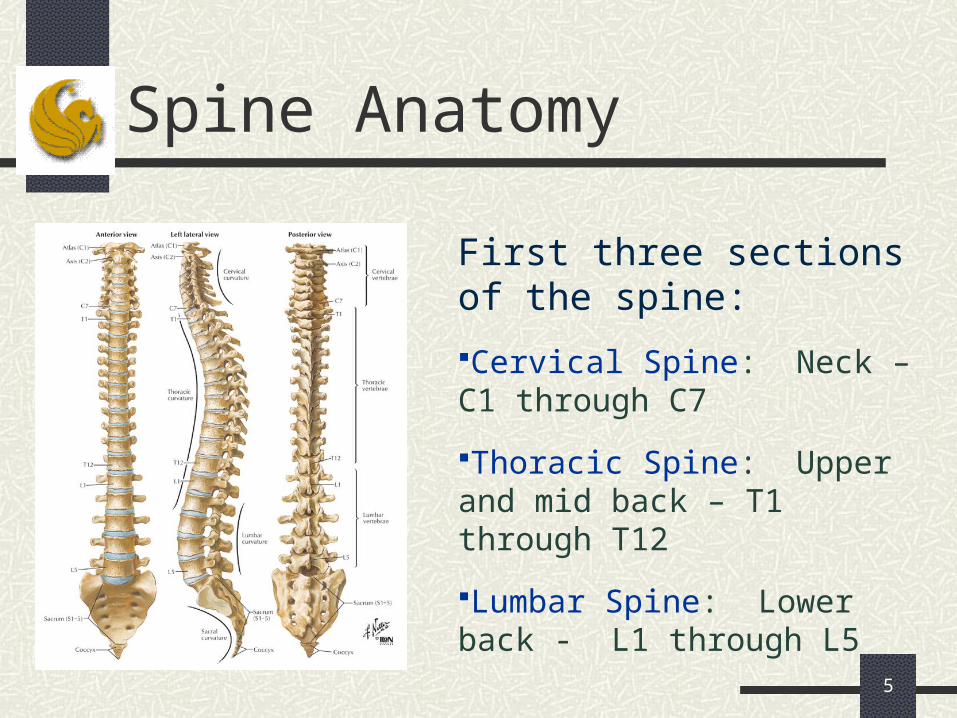
Spine Anatomy
First three sections of the spine:
Cervical Spine: Neck – C1 through C7
Thoracic Spine: Upper and mid back – T1 through T12
Lumbar Spine: Lower back - L1 through L5
5

Spinal Cord
Each vertebra has a hole through it
These holes line up to form the spinal canal
A large bundle of nerves called the spinal cord runs through the spinal canal
6
HoleHolesline up Tough
outershell
Jelly-likenucleus
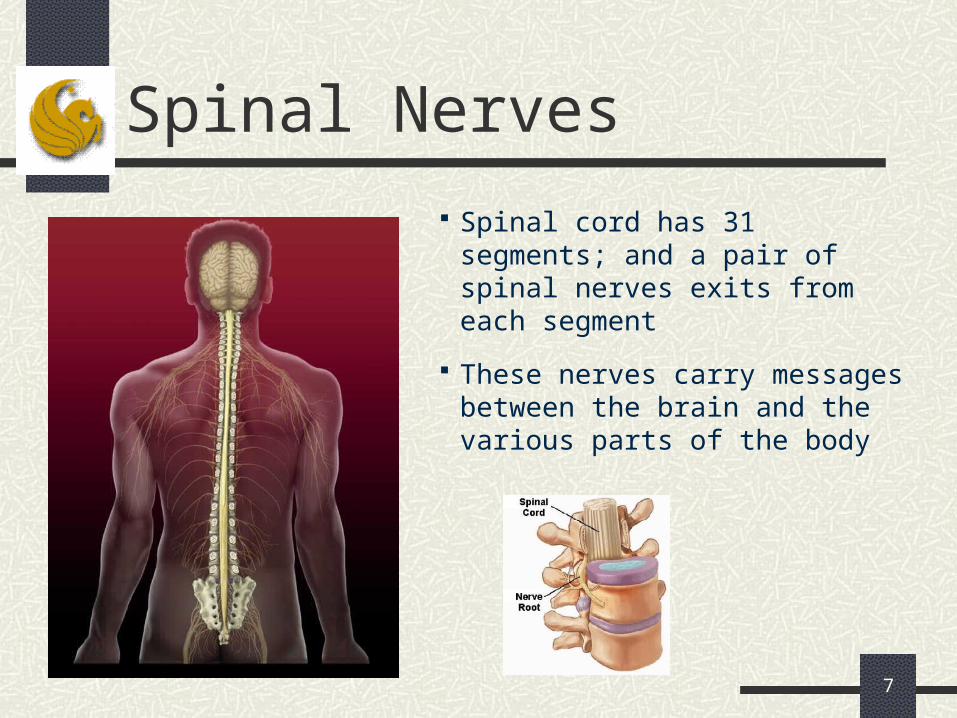
Spinal Nerves
Spinal cord has 31 segments; and a pair of spinal nerves exits from each segment
These nerves carry messages between the brain and the various parts of the body
7
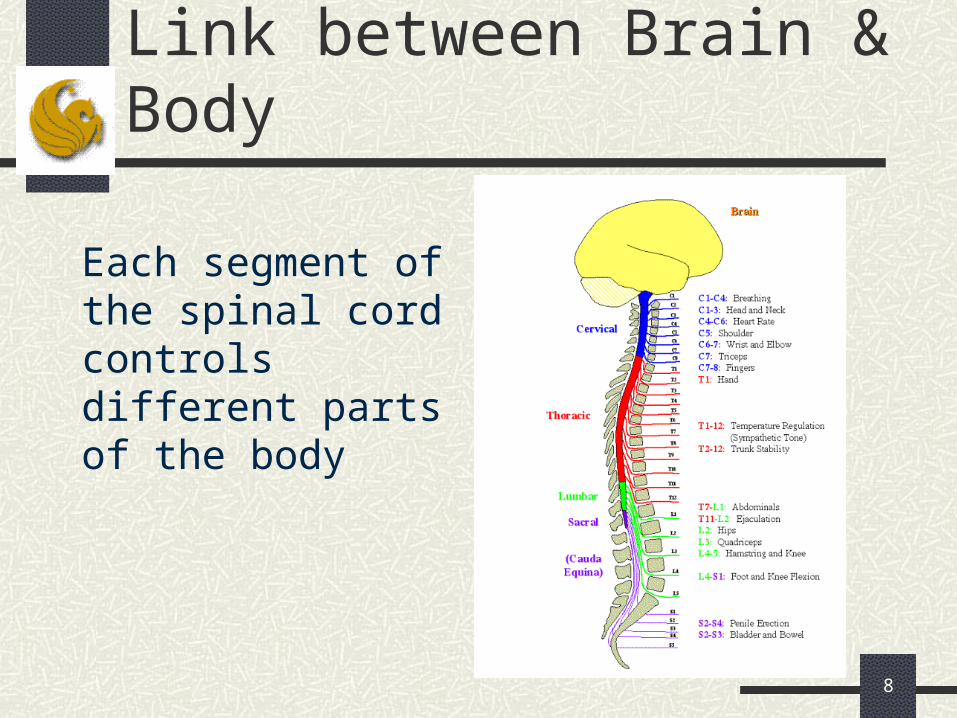
Link between Brain & Body
8
Each segment of the spinal cord controls different parts of the body
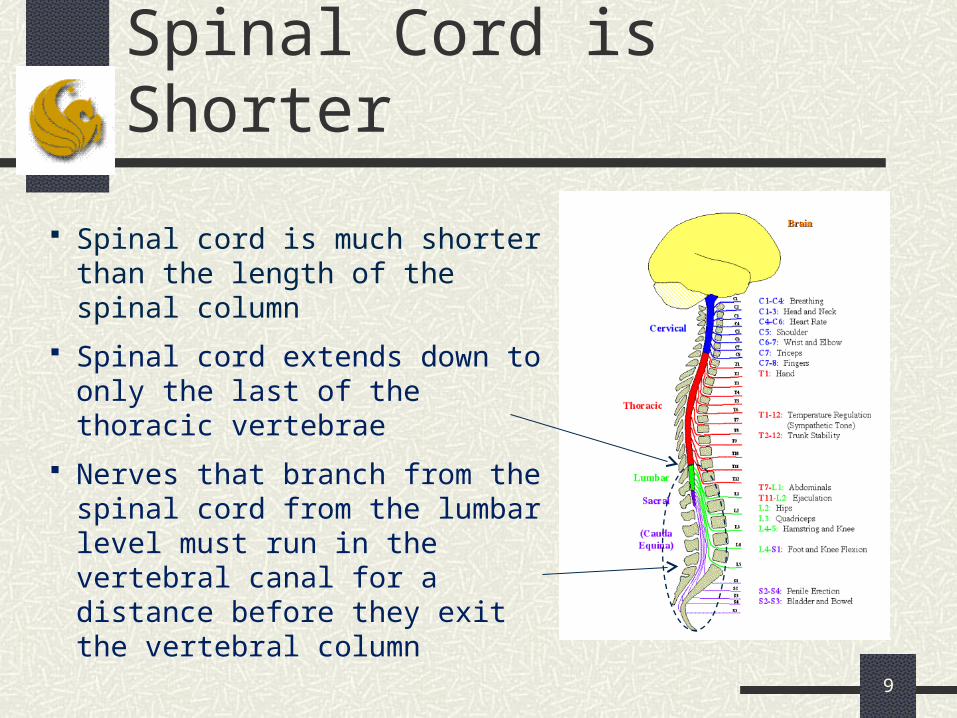
Spinal Cord is Shorter
Spinal cord is much shorter than the length of the spinal column
Spinal cord extends down to only the last of the thoracic vertebrae
Nerves that branch from the spinal cord from the lumbar level must run in the vertebral canal for a distance before they exit the vertebral column
9

Shape & Size of Spinal Segments
Nerve cell bodies are located in the “gray” matter
Axons of the spinal cord are located in the “white” matter. They carry messages.
Spinal segments closer to the brain have larger amount of “white” matter Because many axons go up to the brain from all levels
of the spinal cord
10
More “white”matter

Spinal Stenosis
Spinal stenosis is a progressive narrowing of the opening in the spinal canal, which places pressure on the spinal cord (nerve roots)
Pressure on nerve roots causes
11
chronic pain, and loss of control over
some functions because communication with the brain is interrupted

Spinal Stenosis
Cervical spinal stenosis: Stenosis (narrowing) is located in the neck
Lumbar Spinal Stenosis: Stenosis is located on the lower part of the spinal cord
75% of cases of spinal stenosis occur in the low back (lumbar spine), and legs are affected Produce pain in the legs with walking, and the
pain is relieved with sitting12

We focus on Lumbar Spine Stenosis
13
Diagnosis
Patients with lumbar spinal stenosis may feel pain, weekness, or numbness in the legs, calves or buttocks
Other conditions can cause similar symptoms Spinal tumors Disorders of the blood flow (circulatory disorders)
Spinal stenosis diagnosis is not easy
14
We Try to Detect These Conditions
Disc Space Narrowing
Abnormal Bony Growth (Posterior osteophytes)
Abnormality of FacetJoint (Posterior Apophyseal Arthropathy)
Vertibral Slippage (Spondylolisthesis)
15
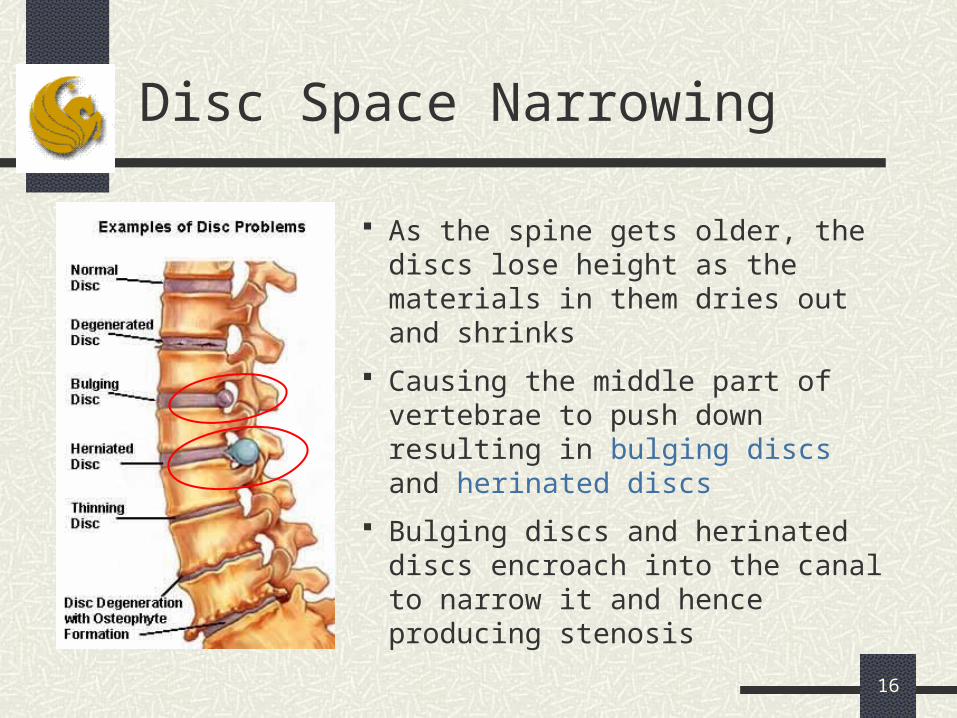
Disc Space Narrowing
As the spine gets older, the discs lose height as the materials in them dries out and shrinks
Causing the middle part of vertebrae to push down resulting in bulging discs and herinated discs
Bulging discs and herinated discs encroach into the canal to narrow it and hence producing stenosis
16

Posterior Apophyseal Arthropathy (abnormality of facet joint)
Disc space narrowing can also cause instability between vertebrae
The body attempts to reduce the instability by trying to fuse around the bad disc
The facet joints enlarge and the edges try to fuse together and hence producing stenosis
17

Osteophytes(abnormal bony outgrowth)
Osteophyte - Small abnormal bony outgrowth (bone spurs)
Anterior Osteophyte - Outgrowth at the front side of a vertebrae
Posterior Osteophyte - Outgrowth in the back side of a vertebrae
18
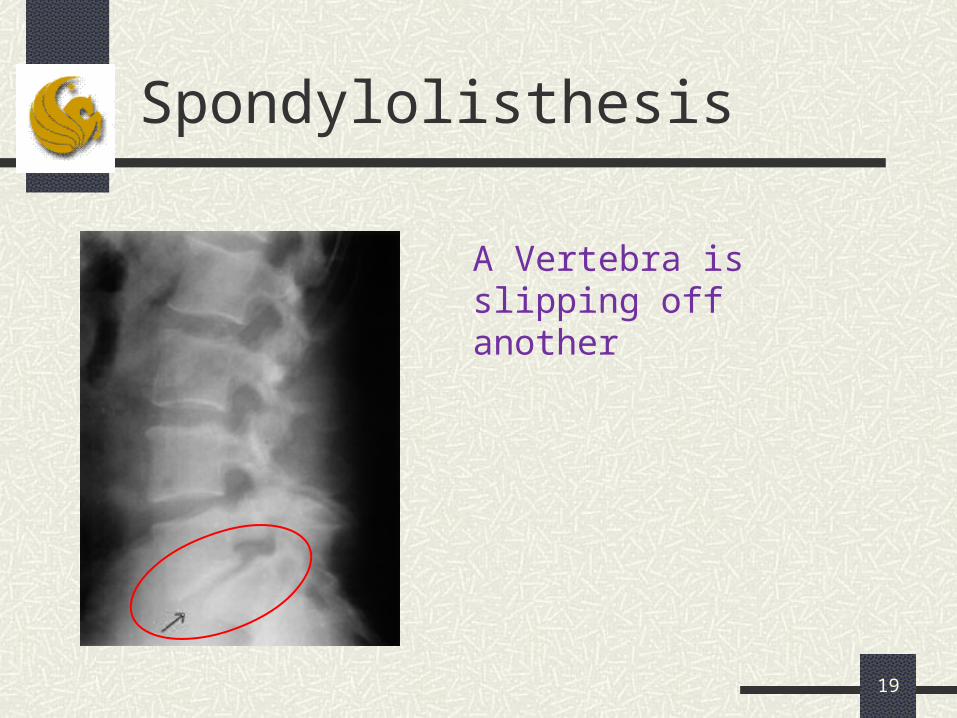
Spondylolisthesis
A Vertebra is slipping off another
19

Summary
Disc Space Narrowing – bulging and herinated discs
Posterior osteophytes – bone spurs
Posterior Apophyseal Arthropathy – abnormal growth on facet joints
Spondylolisthesis – vertebral slippage
20
We detect these conditions using X ray

Motivation
Prior studies need manually determined boundary for each individual vertebra
No computer-aided diagnosis (CAD) system for spinal stenosis
Develop a fully automatic CAD for spinal stenosis
Focus on X-rays as this is often the first test for spinal stenosis diagnosis
21

Imaging Technology
1. X-RAYS: These show (1) disc narrowing, (2) bone spurs (osteophytes), and (3) vertebrae slipping off another (spondylo-listhesis)
2. CAT SCAN: This is a computerized X ray that shows how much the diameter of the canal is reduced and how far out the discs are
3. M.R.I. (Magnetic Resonance Imaging): It produces picture like the CAT scan but they are generated using a magnetic field (instead of radiation) – not needed if the CAT scan shows the problems.
22

Features
23
B: Mid vertebral height
B
A: Anterior vertebral height
A
C: Posterior vertebral height
C G,H: Anteroposterior (A-P) width of usual spinal canal
H
G
I,J: Anteroposterior (A-P) width of unusual spinal canal
I
JD,E,F: Intervertebral disc space height D E F

Feature Extraction
Automatically determine the boundary points Using the Active
Appearance Model (AAM) technique
Measure the distances among the boundary points to extract the features
25
Boundary point

Active Appearance Model(morphable model)
An AAM contains a statistical model of the appearance of the object of interest (e.g., face) which can generalize to almost any valid example
The AAM can search for the structures from a displaced initial position
26
Initial position After 1 iteration After 2 iteration Convergence
Face modelBuilt from
400 images
Apply AAM to our Environment
1. A radiologist manually labels boundary points of training images
2. Apply the AAM technique to build a lumbar model (with boundary points)
3. Apply the lumbar model to determine the boundary points of the image under investigation
4. Measure the distances among the boundary points to obtain the feature values
27
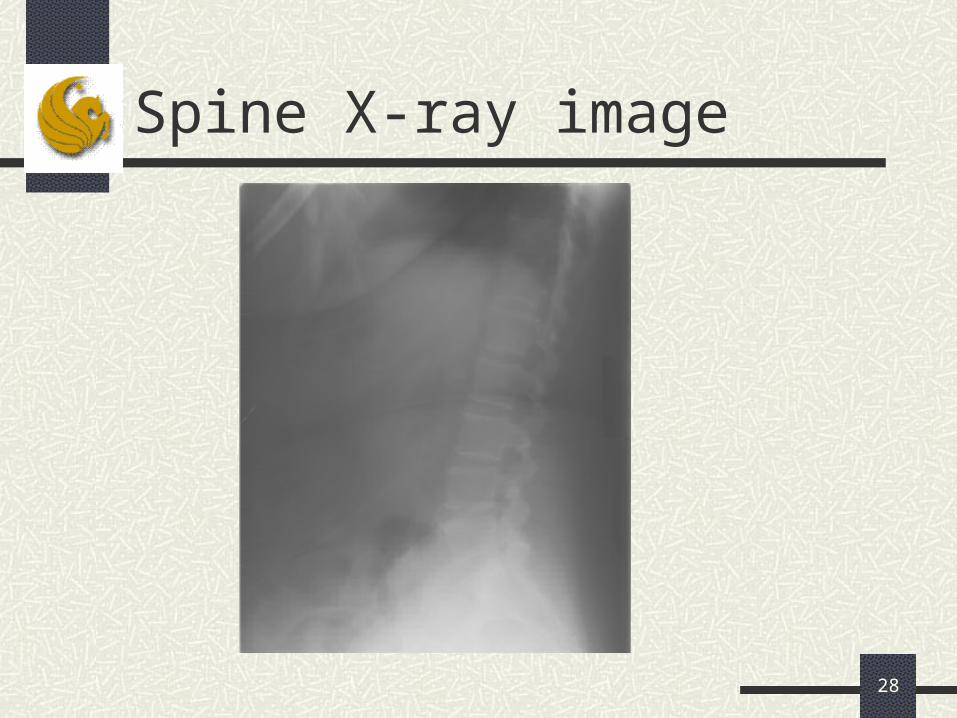
Spine X-ray image
28

Result from AAM
posterior osteophyte(bone spur)
apophyseal arthopathy(growth on facet joint)
29
spondylolisthesis(vertebral slippage)
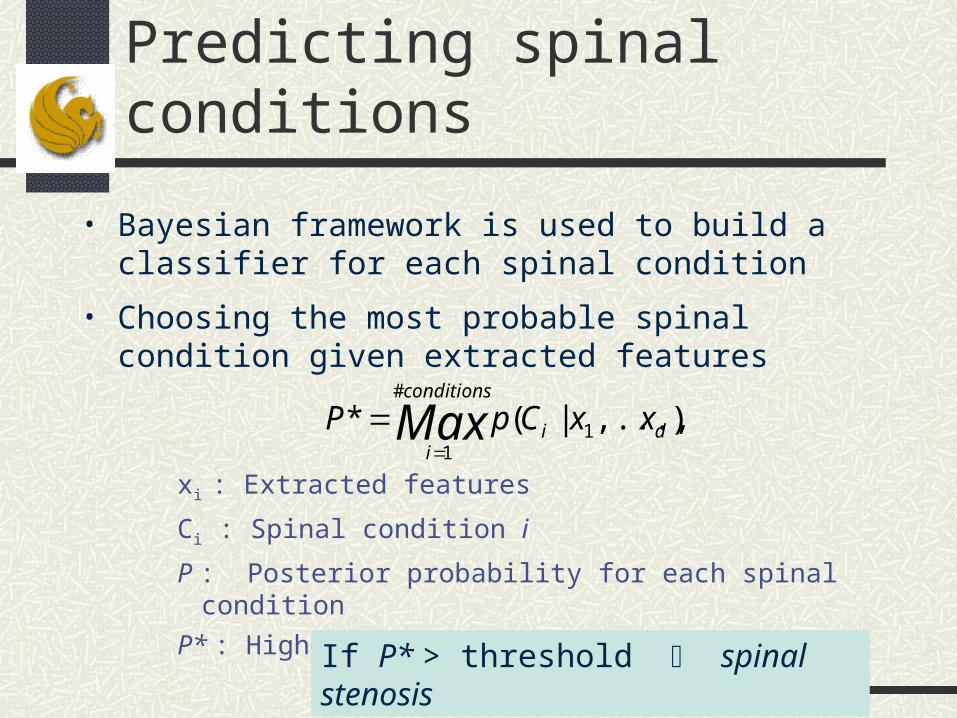
Predicting spinal conditions
• Bayesian framework is used to build a classifier for each spinal condition
• Choosing the most probable spinal condition given extracted features
xi : Extracted features
Ci : Spinal condition i
P : Posterior probability for each spinal condition
P* : Highest posterior probability
),...,|(* 1
#
1di
conditions
i
xxCpP Max
If P* > threshold spinal stenosis

Naïve Bayes Classifier (1)
• Prior Probability: Prior probabilities are based on previous experience
31
60
40
objects ofnumber Total
objectsGreen ofNumber GREENfor y probabilitPrior
60
20
objects ofnumber Total
objects RedofNumber for REDy probabilitPrior

Naïve Bayes Classifier (2)
• Likelihood: Likelyhood of X given Red/Green
32
40
1
casesGREEN ofnumber Total
of vicinity theinGREEN ofNumber GREEN given of Likelihood
XX
20
3
cases REDofnumber Total
of vicinity thein REDofNumber REDgiven of Likelihood
XX
X
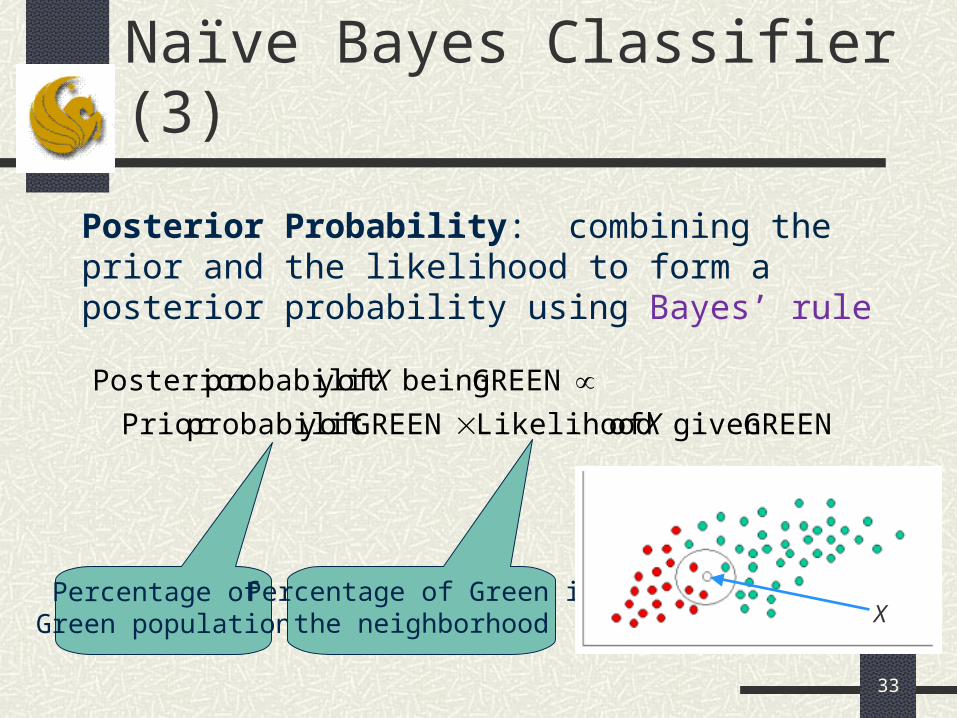
Naïve Bayes Classifier (3)
Posterior Probability: combining the prior and the likelihood to form a posterior probability using Bayes’ rule
33
GREENgiven of Likelihood GREEN ofy probabilitPrior
GREEN being ofy probabilitPosterior
X
X
Percentage of Green population
Percentage of Green inthe neighborhood X

Naïve Bayes Classifier (4)
34
60
1
40
1
6
4 GREENgiven of Likelihood GREEN ofy probabilitPrior
GREEN being ofy probabilitPosterior
X
X
20
1
20
3
6
2 REDgiven of d Likelihoo REDofy probabilitPrior
REDbeing ofy probabilitPosterior
X
X
We classify X as RED

Multiple Independent Variables
• Posterior probability for the event Cj among a set of possible outcomes C = {C1, C2, …, Cd)
35
CxxxCxxxC jdijdijppp |,...,,,...,,|
22
Posterior probability of class membership, i.e., the probability that X belongs to Cj
Likelihood
d
kjkjdij CxCxxxC ppp
12
|,...,,|
Conditional probability of independentVariables are statistically independent Likelihood
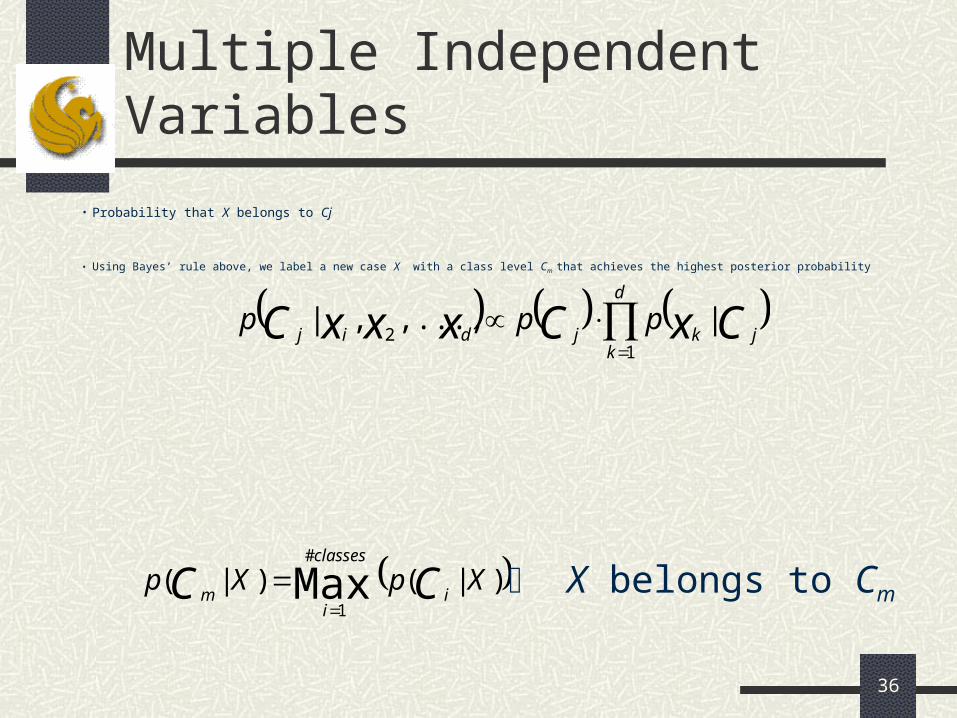
Multiple Independent Variables
• Probability that X belongs to Cj
• Using Bayes’ rule above, we label a new case X with a class level Cm that achieves the highest posterior probability
36
d
kjkjdij CxCxxxC ppp
12
|,...,,|
)|()|( Max#
1
XpXp CC i
classes
im
X belongs to Cm
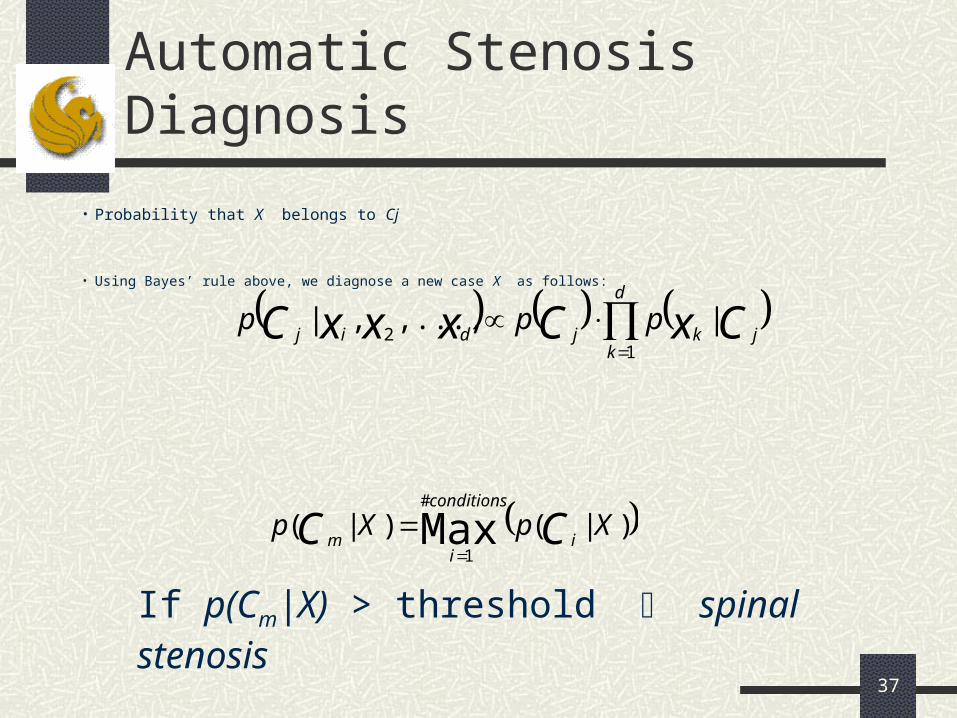
Automatic Stenosis Diagnosis
• Probability that X belongs to Cj
• Using Bayes’ rule above, we diagnose a new case X as follows:
37
d
kjkjdij CxCxxxC ppp
12
|,...,,|
)|()|( Max#
1
XpXp CC i
conditions
im
If p(Cm|X) > threshold spinal stenosis
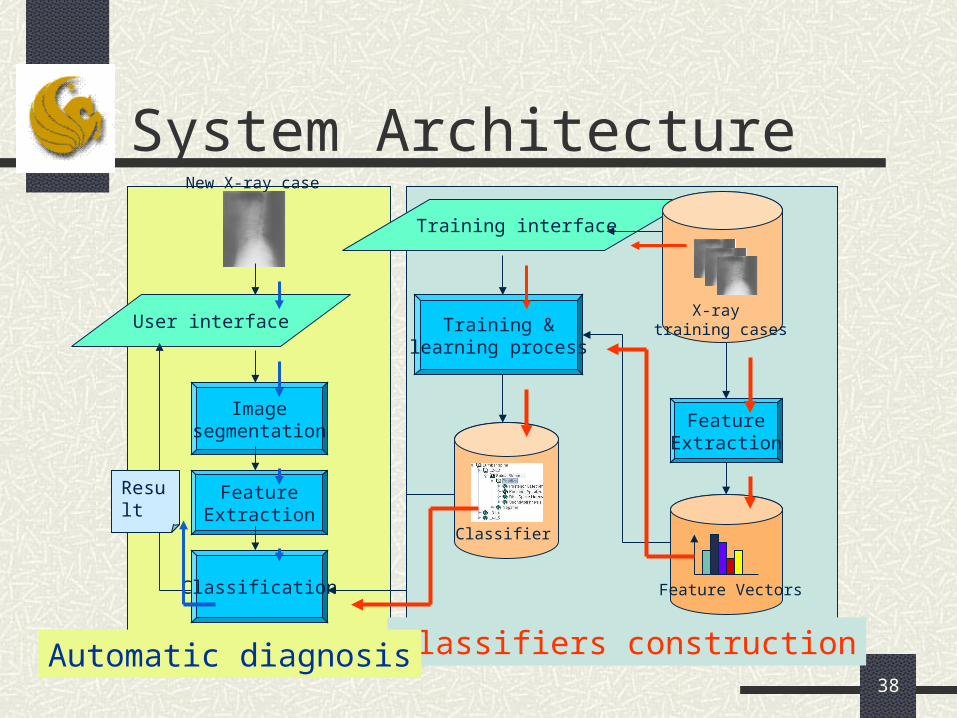
System Architecture
38
FeatureExtraction
Training &learning process
Feature Vectors
Training interface
User interface
Imagesegmentation
Classification
FeatureExtraction
Result
X-ray training cases
New X-ray case
Classifier
Classifiers constructionAutomatic diagnosis
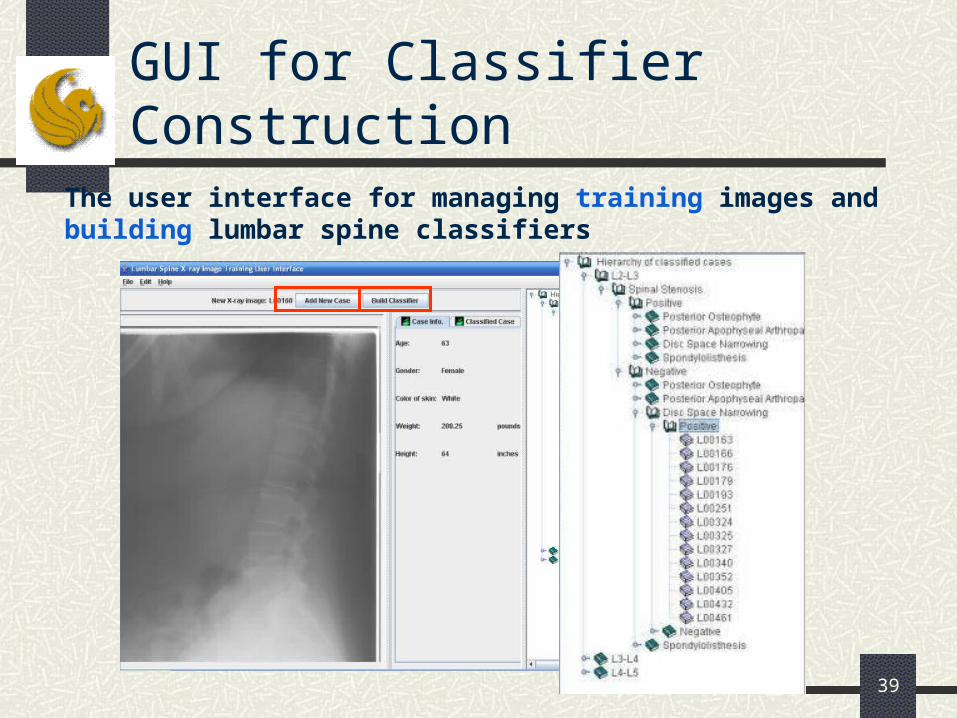
GUI for Classifier Construction
39
The user interface for managing training images and building lumbar spine classifiers

GUI for Stenosis Diagnosis
40
The user interface for submitting X-ray images for analysis of spinal conditions
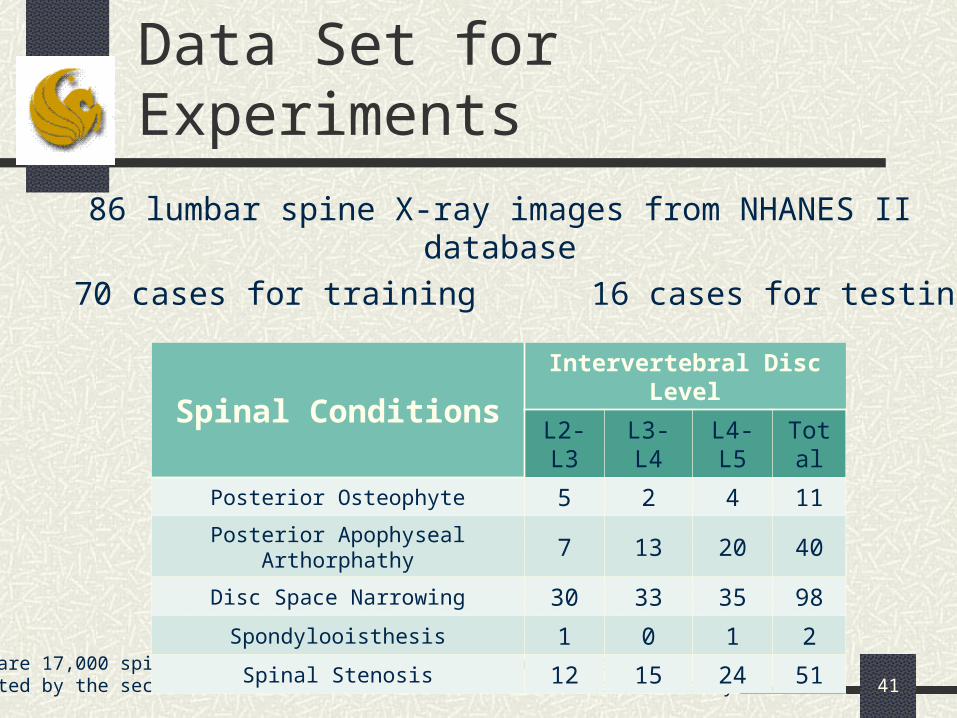
Data Set for Experiments
41
86 lumbar spine X-ray images from NHANES II database
70 cases for training 16 cases for testing
There are 17,000 spine X-ray images in the NHANES II databasecollected by the second National Health and Nutrition Examination Survey
Spinal ConditionsIntervertebral Disc Level
L2-L3 L3-L4 L4-L5 Total
Posterior Osteophyte 5 2 4 11
Posterior Apophyseal Arthorphathy 7 13 20 40
Disc Space Narrowing 30 33 35 98
Spondylooisthesis 1 0 1 2
Spinal Stenosis 12 15 24 51

Average Percentage of correct prediction of training images
42
Spinal ConditionsIntervertebral Disc Level
L2-L3 L3-L4 L4-L5 Total
Posterior Osteophyte 100.0 98.6 100.0 99.5
Posterior Apophyseal Arthorphathy 97.1 82.9 80.0 86.7
Disc Space Narrowing 84.3 87.1 80.0 83.8
Spondylooisthesis 100.0 100.0 100.0 100.0
Spinal Stenosis 100.0 95.7 97.1 97.6
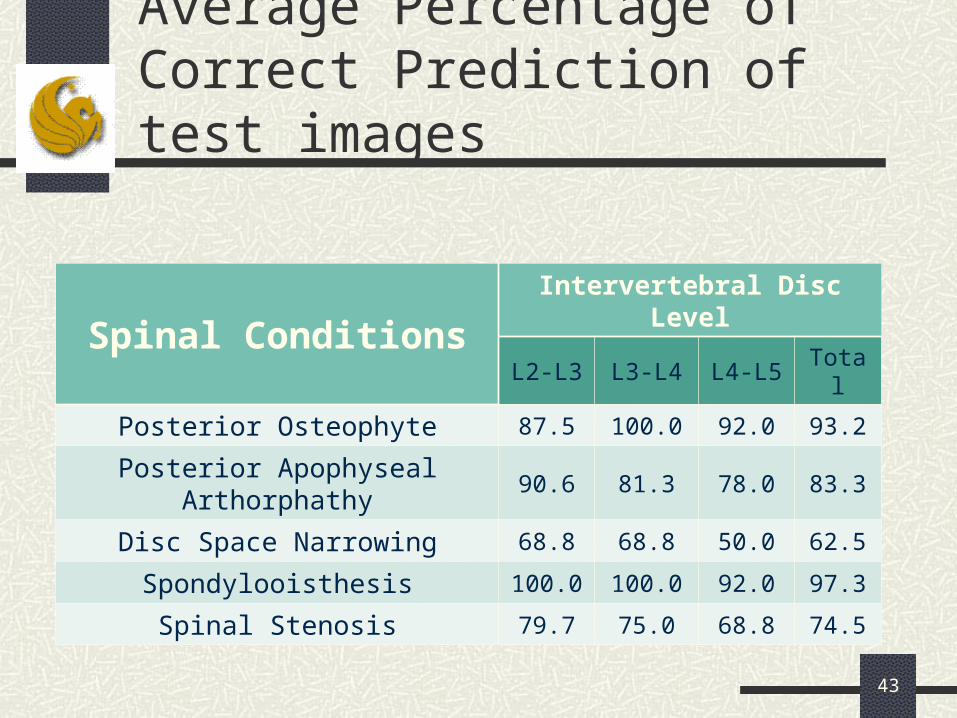
Average Percentage of Correct Prediction of test images
43
Spinal ConditionsIntervertebral Disc Level
L2-L3 L3-L4 L4-L5 Total
Posterior Osteophyte 87.5 100.0 92.0 93.2
Posterior Apophyseal Arthorphathy 90.6 81.3 78.0 83.3
Disc Space Narrowing 68.8 68.8 50.0 62.5
Spondylooisthesis 100.0 100.0 92.0 97.3
Spinal Stenosis 79.7 75.0 68.8 74.5
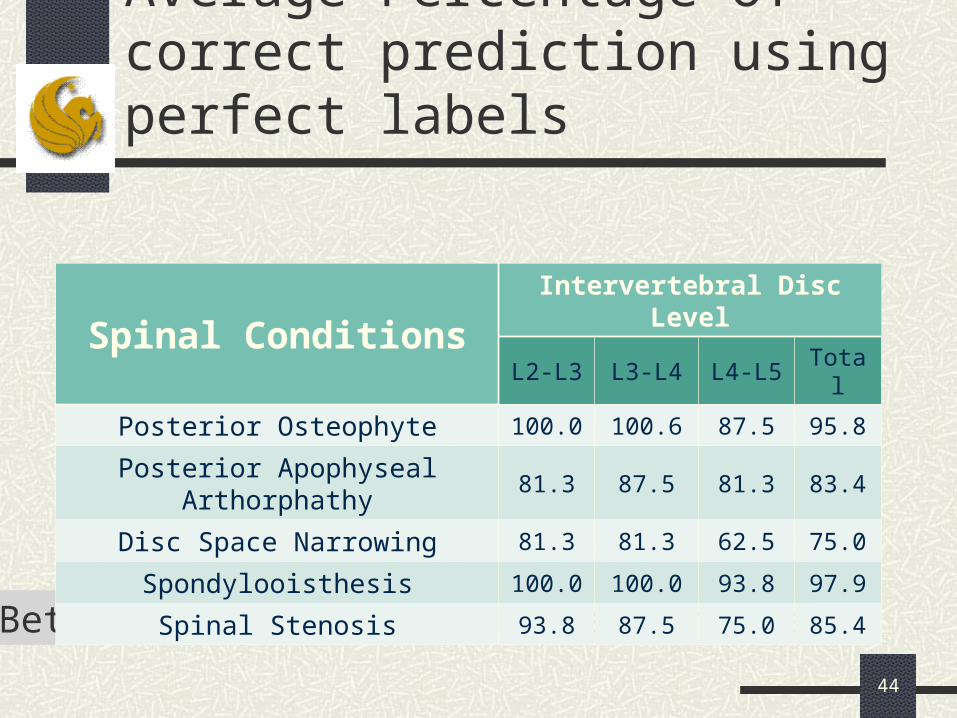
Average Percentage of correct prediction using perfect labels
44
Better labeling improves performance
Spinal ConditionsIntervertebral Disc Level
L2-L3 L3-L4 L4-L5 Total
Posterior Osteophyte 100.0 100.6 87.5 95.8
Posterior Apophyseal Arthorphathy 81.3 87.5 81.3 83.4
Disc Space Narrowing 81.3 81.3 62.5 75.0
Spondylooisthesis 100.0 100.0 93.8 97.9
Spinal Stenosis 93.8 87.5 75.0 85.4
Conclusions
A fully automatic CAD system for lumbar spinal stenosis
Not dependent on user’s knowledge and experience
Accuracy from 75 – 80%
Good enough for screening and initial diagnosis
Suitable for general practitioners
45
Do You Know ?
Giraffes and human have SEVEN vertebrae in their necks
46