Embed Size (px)
Citation preview
Computer
31C
Biology with Vernier 31C - 1
Photosynthesis and Respiration
Plants make sugar, storing the energy of the sun into chemical energy, by the process of photosynthesis. When they require energy, they can tap the stored energy in sugar by a process called cellular respiration.
The process of photosynthesis involves the use of light energy to convert carbon dioxide and water into sugar, oxygen, and other organic compounds. This process is often summarized by the following reaction:
6 H2O + 6 CO2 + light energy → C6H12O6 + 6 O2
Cellular respiration refers to the process of converting the chemical energy of organic molecules into a form immediately usable by organisms. Glucose may be oxidized completely if sufficient oxygen is available by the following equation:
C6H12O6 + 6 O2 → 6 H2O + 6 CO2 + energy All organisms, including plants and animals, oxidize glucose for energy. Often, this energy is used to convert ADP and phosphate into ATP.
OBJECTIVES In this experiment, you will
• Use an O2 Gas Sensor to measure the amount of oxygen gas consumed or produced by a plant during respiration and photosynthesis.
• Use a CO2 Gas Sensor to measure the amount of carbon dioxide consumed or produced by a plant during respiration and photosynthesis.
• Determine the rate of respiration and photosynthesis of a plant.
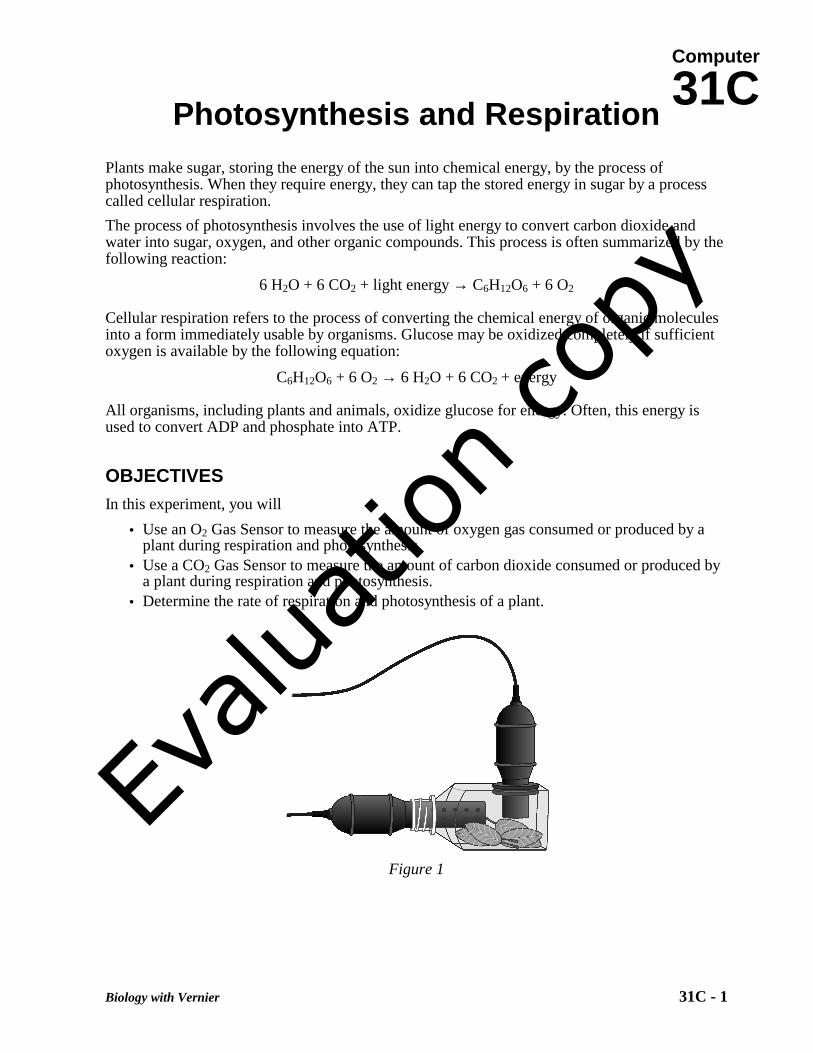
Figure 1
Evalua
tion co
py

Computer 31C
31C - 2 Biology with Vernier
MATERIALS computer plant leaves Vernier computer interface 500 mL tissue culture flask Logger Pro lamp Vernier O2 Gas Sensor aluminum foil Vernier CO2 Gas Sensor forceps BioChamber 250
PROCEDURE 1. If your CO2 Gas Sensor has a switch, set it to the Low (0–10,000 ppm) setting. Connect the
CO2 Gas Sensor to Channel 1 and the O2 Gas to Channel 2 of the Vernier computer interface.
2. Prepare the computer for data collection by opening the file “31C Photo (CO2 and O2)” from the Biology with Vernier folder of Logger Pro.
3. Obtain several leaves from the resource table and blot them dry, if damp, between two pieces of paper towel.
4. Place the leaves into the BioChamber 250, using forceps if necessary. Wrap the respiration chamber in aluminum foil so that no light reaches the leaves.
5. Place the O2 Gas Sensor into the BioChamber 250 as shown in Figure 1. Insert the sensor snugly into the grommet. The O2 Gas Sensor should remain vertical throughout the experiment. Place the CO2 Gas Sensor into the neck of the respiration chamber as shown in Figure 1.Wait 10 minutes before proceeding to Step 6.
6. Click to begin data collection. Collect data for fifteen minutes and click .
7. When data collection has finished, determine the rate of respiration:
a. Click anywhere on the CO2 graph. Move the mouse pointer to the point where the data values begin to increase. Hold down the left mouse button. Drag the pointer to the point where the data ceases to increase and release the mouse button.
b. Click on the Linear Fit button, , to perform a linear regression. A floating box will appear with the formula for a best fit line.
c. Record the slope of the line, m, as the rate of respiration in Table 1. d. Close the linear regression floating box. e. Repeat Steps 7a–d for the O2 graph. However, you will need to move the mouse pointer
to the point where the data values begin to decrease. Hold down the mouse button and drag to the point where the data ceases to decrease.
8. Move your data to a stored run. To do this, choose Store Latest Run from the Experiment
menu.
9. Remove the aluminum foil from around the respiration chamber.
10. Fill the tissue culture flask with water (not the respiration chamber) and place it between the lamp and the respiration chamber. The flask will act as a heat shield to protect the plant leaves.

Photosynthesis and Respiration
Biology with Vernier 31C - 3
11. Turn the lamp on. Place the lamp as close to the leaves as reasonable. Do not let the lamp touch the tissue culture flask. Note the time. The lamp should be on for 5 minutes prior to beginning data collection.
12. After the five-minute time period is up, click to begin data collection. Collect data for 15 minutes and click .
13. When data collection has finished, determine the rate of photosynthesis:
a. Click anywhere on the CO2 graph. Move the mouse pointer to the point where the data values begin to decrease. Hold down the left mouse button. Drag the pointer to the point where the data ceases to decrease and release the mouse button.
b. Click on the Linear Fit button, , to perform a linear regression. Choose “Latest CO2” and a floating box will appear with the formula for a best-fit line.
c. Record the slope of the line, m, as the rate of photosynthesis in Table 1. d. Close the linear regression floating box. e. Repeat steps 13a–d for the O2 graph. However, you will need to move the mouse pointer
to the point where the data values begin to increase, hold down the mouse button and drag to the point where the data ceases to increase.
14. Print a graph showing your photosynthesis and respiration data.
a. Label each curve by choosing Text Annotation from the Analyze menu. Enter “Photosynthesis” in the edit box. Repeat to create an annotation for the “Respiration” data. Drag each box to a position near its respective curve. Adjust the position of the arrow heads.
b. Print a copy of the graph, with both data sets displayed. Enter your name(s) and the number of copies of the graph you want.
15. Remove the plant leaves from the respiration chamber, using forceps if necessary. Clean and
dry the respiration chamber.
DATA
Table 1
Leaves CO2 rate of production/consumption
(ppt/min)
O2 rate of production/consumption
(ppt/min)
In the dark
In the light
QUESTIONS 1. Was either of the rate values for CO2 a positive number? If so, what is the biological
significance of this?
2. Was either of the rate values for O2 a negative number? If so, what is the biological significance of this?

Computer 31C
31C - 4 Biology with Vernier
3. Do you have evidence that cellular respiration occurred in leaves? Explain.
4. Do you have evidence that photosynthesis occurred in leaves? Explain.
5. List five factors that might influence the rate of oxygen production or consumption in leaves. Explain how you think each will affect the rate?
EXTENSIONS 1. Design and perform an experiment to test one of the factors that might influence the rate of
oxygen production or consumption in Question 5.
2. Compare the rates of photosynthesis and respiration among various types of plants.
Vernier Lab Safety Instructions Disclaimer
THIS IS AN EVALUATION COPY OF THE VERNIER STUDENT LAB. This copy does not include:
Safety information Essential instructor background information Directions for preparing solutions Important tips for successfully doing these labs
The complete Biology with Vernier lab manual includes 31 labs and essential teacher information. The full lab book is available for purchase at: http://www.vernier.com/cmat/bwv.html
Vernier Software & Technology
13979 S.W. Millikan Way • Beaverton, OR 97005-2886 Toll Free (888) 837-6437 • (503) 277-2299 • FAX (503) 277-2440
[email protected] • www.vernier.com