Embed Size (px)
Citation preview

6
Computational Flow Modelling of Multiphase Reacting Flow in Trickle-bed Reactors with Applications to the Catalytic Abatement of
Liquid Pollutants
Rodrigo J.G. Lopes and Rosa M. Quinta-Ferreira GERSE – Group on Environmental, Reaction and Separation Engineering
Department of Chemical Engineering, University of Coimbra Portugal
1. Introduction
The contemporary status of computational flow modelling encourages strongly the
application of modern CFD codes on the design and investigation of process equipment and
aims to accomplish novel and stringent environmental regulations on the decontamination
of high strength wastewaters. The application of CFD is envisaged as a prevailing tool to
gain more control in the delivery of reactants or energy and in the removal of products since
any chemical or physical transformation process requires the addition or removal of
different materials and energy. Therefore, the distribution of materials as well as the energy
within the process vessel is improved noticeably if one has the capability to predict and
control fluid dynamics by means of CFD. Instead of extensive and costly experimentation,
CFD models allow the optimization of process equipment to maximize industrial benefit
following rigorous environmental regulations. CFD enable the establishment of quantitative
relationships between the throughput and operating flow regime avoiding a massive
number of empirical parameters. Transport parameters such as heat- mass-transfer
coefficients and several hydrodynamic parameters including film structures and
thicknesses, boundary layer geometries, pressure drop, wetted area or even the residence
time distribution are investigated and optimized for multiple process configurations.
Consequently, CFD aids in the identification of most appropriate process configurations
from the large selection of alternatives.
In fact, in the realm of environmental reaction engineering, major improvements on active
and stable heterogeneous catalyst are intended to be realized in the near future. This fact
will allow substantial enhancements of catalytic wet oxidation technology to become
economically and environmentally feasible in comparison to most of the conventional
treatments. In this ambit, agro-food processing wastewaters will be undertaken as an
example of non-biodegradable and phytotoxic effluents. Polyphenolic compounds deserve
particular attention in what concerns the process performance at different levels as follows:
total organic carbon reduction, intermediate compounds formation, catalyst stability and
kinetic modelling. The kinetic parameters will be obtained taking into account the
www.intechopen.com
Computational Fluid Dynamics Technologies and Applications
162
generalized lumped kinetic model and this information will be further integrated into a
hydrodynamic model developed by means of CFD where the reaction aspects as well as the
transport mechanisms were accounted for a high-pressure trickle-bed reactor. Two
multiphase CFD frameworks – Euler-Euler and Volume-of-Fluid – will be evaluated for
either cold flow or reacting flow conditions. Axial and radial profiles of hydrodynamic and
reaction parameters will be thoroughly evaluated at different operating conditions. The
influence of gas and liquid flow rates as well as the effect of temperature and pressure will
be investigated in terms of total organic carbon conversions.
2. Literature review
In the field of environmental reaction engineering, long-established technologies have been
intensified during the last decade to demonstrate new potentialities and hindrances from a
process viewpoint. Having recognized the effect of technological threats generated by
dangerous substances on the environment, it is possible to identify a gap of knowledge on
how to provide consistent remediation technologies of contaminated air, soil and water. In
this regard, multiphase reactors such as trickle-bed reactors (TBRs) can then be evaluated on
its further deployment for the catalytic abatement of moderate- to high-strength
wastewaters if one takes into account modern and advanced simulation tools as CFD codes.
The specialized literature identified various dynamic circumstances in TBRs as a new breed
potential for performance enhancement arising from the interaction between the gas and
liquid phases in supplying reactants to the catalyst surface and pores. This fact is even
reinforced due to the multifaceted relationship between fluid dynamics, catalyst wetting
and chemical reaction. Multiphase reactors such as TBRs have been commonly designed and
operated under steady-state mode in the industrial applications. However, novel operating
modes under transient conditions has generated an emergent interest in view of the
significant performance enhancement encompassing chemical conversion and products
selectivity (Dudukovic et al., 1999; Boelhouwer et al., 2002; Silveston & Hanika, 2002, 2004).
The transient operation of TBR revealed key characteristics reinforced by the dynamic nature
of gas-liquid flow over the catalyst packing, which ultimately leads to the cumbersome non-
linearity behaviour of trickle beds (Khadilkar et al., 2005). Here, we pursue our prior efforts to
provide new insights on environmentally-based TBRs to detoxify hazardous polluted liquid
streams. This task is sought to be accomplished by the experimental work devoted to
investigate the suitability of this methodology as well as by state-of-the-art simulation tools
considered by CFD codes. The case study encompasses the application of a trickle-bed reactor
to the detoxification of phenolic wastewaters through a series of experimental runs
accompanied and validated by a multiphase Volume-of-Fluid (VOF) model formerly reported
(Lopes & Quinta-Ferreira, 2009). At a first glance, a brief prospect of literature on trickle-bed
reactor modelling and validation is presented at reaction conditions. Then, the application of
CFD is reinforced by its investigation on the minimization of hazardous materials.
Iliuta et al. (2006) investigated how plugging affect hydrotreating performance by
simulating simultaneous fines deposition under catalytic in hydrodesulfurization in TBRs.
The three-phase heterogeneous model developed to simulate the trickle bed performance
incorporates the concentration gradients inside the catalyst particle and solid deposit. The
model correctly handled the effect of the fine particles deposition process being identified
the bed plugging and the increase of the resistance to two-phase flow. Ayude et al. (2005)
www.intechopen.com
Computational Flow Modelling of Multiphase Reacting Flow in Trickle-bed Reactors with Applications to the Catalytic Abatement of Liquid Pollutants
163
presented a phenomenological approach to interpret the effect of liquid flow modulation in
TBRs at the particle scale. Dynamic reactant profiles inside the catalytic particle were
obtained for different cycling and system conditions being the experimental trends
explained with this approach. Liu et al. (2005) examined the periodically operated TBR for
ethylanthraquinones hydrogenation. A dynamic model was verified by simulating the effect
of cycle period and split on the conversion and the selectivity enhancement and compared
with the experimental results. An experimental and theoretical study of forced unsteady-
state operation of TBR was presented by Lange et al. (2004) in comparison to the steady-
state operation. The simulation studies demonstrate that the liquid flow variation has a
strong influence on the liquid hold-up oscillation and on the catalyst wetting efficiency.
Rajashekharam et al. (1998) developed a TBR model for the hydrogenation of 2,4
dinitrotoluene with experimental verification. The model incorporates the contributions of
partial wetting and stagnant liquid hold-up effects in addition to external and intraparticle
mass transfer resistances for a complex consecutive/ parallel reaction scheme under
consideration represented by Langmuir-Hinshelwood kinetics.
On the investigation of CFD for the risk assessments related to industrial environments,
Calay & Holdo (2008) have modelled the dispersion of flashing jets in where gas is kept in
liquid form under high-pressure. The authors presented reproducible results to those
phenomena related to turbulence, droplet transport, evaporation, break-up and coalescence
events. Gavelli et al. (2010) presented a reliable method to quantify and bound LNG vapour
dispersion hazard distances for regulatory purposes. The mathematical models encompass
conservative assumptions in the derivation of the LNG vapour source term. It is suggested
that sophisticated models could be used to predict the flow and vaporization of LNG by
numerical integration of the shallow water equations. Pontiggia et al. (2010) have assessed
the consequences of hazardous gas releases in urban areas through CFD simulations. Once
again, CFD has demonstrated its versatility to represent realistically such complex
geometries in detailed simulation models leading to three-dimensional flow fields that
strongly influence gas dispersion. The authors have pointed out that integral models can
both overestimate and underestimate the magnitude of consequences related to hazardous
material releases in urban areas.
From the above survey, CFD models can be trustfully applied in different frameworks,
nevertheless such approach has scarcely been reported to predict the reaction behaviour of
trickle beds. Apart from the hydrodynamic models evolved at cold flow conditions, we
extend our previous VOF model to gain further insight on how process parameters such as
liquid velocity, surface tension and wetting phenomena affect the multiphase flow in high-
pressure trickle-bed reactor. A Volume-of-Fluid model was developed to simulate the
multiphase reactive flow in the catalytic wet oxidation of mimicked agro-industry effluents.
As long as the temperature and liquid flow rate play a major role on the decontamination
rate of liquid pollutants, several computational runs have to be validated accordingly and
performed under transient conditions. This methodology provides a more fundamental
understanding of flow environment and TBR chemical behaviour.
3. Mathematical models
3.1 Governing flow equations
A trickle bed based on a cylindrical geometry (50 mmID×1.0 mLength) was modelled with a
specified void fraction and a set of fluid physical properties. The computational geometry
www.intechopen.com
Computational Fluid Dynamics Technologies and Applications
164
was designed so that a distance gap of about 3% of the sphere diameter facilitates the grid
generation avoiding numerical difficulties that arise in the calculation of convective terms as
described elsewhere (Lopes & Quinta-Ferreira, 2008; Nijemeisland & Dixon, 2001). The VOF
method was used to compute velocity field, liquid volume fraction distributions as well as
the total organic carbon concentration that was used to quantify the mineralization degree
of liquid pollutants. The multiphase flow is assumed to be vertical downward and
incompressible, with the mathematical description based on the Navier-Stokes equations for
momentum and mass conservation of a viscous fluid flow through a three-dimensional
catalytic bed The variable fields are shared by both phases and correspond to volume-
averaged values knowing the volume fraction, αq, of each phase, q, in the entire
computational domain. The volume fraction equation for the phase q is given by:
( ) ( )q q q q q with q g or lt
0α ρ α ρ∂
+ ∇ ⋅ = =∂
U (1)
where g and l denote, respectively, the gas and liquid phases, t, being the time, and through
the resolution of the momentum equation shared by the two considered fluids:
( ) ( )q q q q q q q q q q q q t q qp with q g or lt
,α ρ α ρ α α ρ α τ τ∂ + ∇ ⋅ = − ∇ + + ∇ ⋅ + + = ∂ U U U g I (2)
where p, g and the physical properties (density, ρ; and viscosity, μ) being determined by
volume-weighted averages. Iq is the interphase momentum exchange term and qτ and
t q,τ are, respectively, the viscous stress tensor and the turbulent stress tensor, defined as
follows:
( )tq q q q q q q I
2
3τ µ λ µ
= ∇ + ∇ + − ∇ U U U (3)
and
( ) ( )Ik qqtq
t
qqqtqt UUU ∇+−∇+∇= ,,,3
2µµτ
(4)
3.2 Free surface model: surface tension and wall adhesion
The continuum surface force model proposed by Brackbill et al. (1992) has been used to
compute the surface tension. The pressure drop across the surface depends upon the surface
tension coefficient, σ, and the surface curvature as measured by two radii in orthogonal
directions, R1 and R2, as expressed by Eq. 5.
p pR R
2 1
1 2
1 1σ
− = + (5)
where p1 and p2 are the pressures in the two fluids on either side of the interface. The surface
curvature is computed from local gradients in the surface normal at the interface. n is the
surface normal, defined as the gradient of αi : in α= ∇ . The curvature, κ , is defined in terms
of the divergence of the unit normal, n̂ : n̂κ = ∇ ⋅ where n n nˆ = . The forces at the surface
are expressed as a volume force using the divergence theorem assuming the form of Eq. 6.
www.intechopen.com
Computational Flow Modelling of Multiphase Reacting Flow in Trickle-bed Reactors with Applications to the Catalytic Abatement of Liquid Pollutants
165
( )
i i j j j j i ij ij
pairsij i ji j
F, 1
2
α ρ κ α α ρ κ ασ
ρ ρ<
∇ + ∇=
+ (6)
3.3 Species continuity and energy equations
The predicted flow field including velocities and volume fractions of both phases was
further used to solve species transport equations in the catalytic wet air oxidation of a model
phenolic solution in the trickle-bed reactor. These equations are expressed in the mass
balance equation for any species, i:
( ) ( )
iqqqiqmiqqiqqqq
iqqqSCDCu
t
C,,,,
, ραραραρα
+∇⋅∇=⋅∇+∂
∂
(7)
where, Cq,i is the concentration of species i in the qth phase (gas or liquid), ρq and αq is the
density and volume fraction of the qth phase. Sq,i is the source for species i in phase q. Volume
averaged properties of fluids were used for calculating the flux across the control cell. Two-
film theory was used for accounting mass transfer and the resistance in gas-liquid film was
considered as the rate limiting resistance (Bhaskar et al., 2004). Mass transfer coefficient was
computed according to the Satterfield et al. (1978) correlation and heat transfer coefficient
was calculated according to the correlation developed by Boelhouwer et al. (2001) as
expressed by equations 8 and 9, respectively.
Sh = 0.815 Re0.822 Sc1/ 3 (8)
Nu = 0.111 Re0.8 Pr1/ 3 (9)
The energy equation, also shared among the phases, is shown in equation 10:
( ) ( )( ) ( )eff hE v E p k T St
ρ ρ∂
+ ∇ ⋅ + = ∇ ⋅ ∇ +∂
(10)
The VOF model treats energy, E, and temperature, T, as mass-averaged variables:
n
q q q
q
n
q q
q
E
E1
1
α ρ
α ρ
=
=
= (11)
where Eq for each phase is based on the specific heat of that phase and the shared
temperature. The properties ρ and keff (effective thermal conductivity) are shared by the
phases. The source term, Sh, contains contributions from volumetric reaction heat sources,
which is given by the product ΔH×ρ×rTOC.
3.4 Two-phase k-ε turbulence model
Taking into account that the Reynolds numbers range for the gas phase is wide (min: 10,
max: 2500), the mixture k-ε approach is used for turbulence modelling (Elghobashi et al.,
1984). For incompressible flows, the turbulence parameters are calculated from equations
10-11:
www.intechopen.com
Computational Fluid Dynamics Technologies and Applications
166
( ) ( ) t mm m m k m m
k
u k k Gt
,,
µρ ε ρ ρ ε
σ
∂ ′+ ∇ ⋅ = ∇ ⋅ ∇ + − ∂ (12)
( ) ( ) ( )t m mm m m k m m
k m
u C G Ct k
,1 , 2ε ε
µ ερ ε ρ ε ε ρ ε
σ
∂ + ∇ ⋅ = ∇ ⋅ ∇ + × − ∂
(13)
and the turbulent viscosity μt,m and the production of turbulence kinetic energy, Gk,m are
computed from Eq. 14.
( )( )
qt q q
q
Tk m t m m m m
kC
G u u u
2
,
, , :
µµ ρε
µ
=
= ∇ + ∇ ∇
(14)
Cµ is equal to 0.09 and C1ε and C2ε are the constants of standard k-ε model: 1.44 and 1.92,
respectively, whereas σk and σε are the turbulent Prandtl numbers for k and ε, 1.0 and 1.3,
respectively.
3.5 Numerical simulation
The interstitial space of the trickle-bed reactor was designed through a tetrahedral mesh
representing that was created using the integrated solid modelling and meshing program
GAMBIT (2005) mimicking the characteristic dimensions of commercial catalyst N-140
supplied by the Süd-Chemie Group, Munich. The VOF method simulates free-surface flow
by means of a fluid fraction function, which has a value between unity and zero. The
discretization of the governing equations is done by the finite-volume method. The grid
independency was established after the evaluation of different mesh natures and apertures
in order to isolate mesh related discretization errors. All transport equations were
discretized to be at least second order accurate in space. A segregated implicit solver
available in commercial CFD package FLUENT 6 (2005) was employed to evaluate the
resulting linear system of equations. The conditions required for grid convergent results are
based on a 1% relative error criterion and the simulations accuracy has been assessed by
comparisons to experimental data available in the literature. At the interface, the additional
interaction conditions depend on interfacial velocity and gradient of the surface tension.
The CWAO kinetic parameters for the commercial catalyst N-140 were similarly derived to
the work developed by Lopes et al. (2007). The right-hand side term of Eq. 7, Si,q , include the
reaction rates in terms of the total organic carbon concentration of the lumped species A, B and C as represented by Eq. 15:
( )A
A A
BB B A
TOCTOC TOC
TOCTOC TOC TOC
dCr k k C
dtdC
r k C k Cdt
1 2
3 2
′ ′− = − = +
′ ′− = − = −
(15)
where first order reactions were assumed for each mechanism step of the Generalized
Kinetic Model. GKM considers three types of compounds: easier degraded reactants (A);
intermediates with difficult degradation (B) and desired end products, namely carbon
dioxide and water (C). In the oxidation process of the phenolic solutions with N-140 catalyst,
www.intechopen.com
Computational Flow Modelling of Multiphase Reacting Flow in Trickle-bed Reactors with Applications to the Catalytic Abatement of Liquid Pollutants
167
phenol and acetic acid were formed as intermediate compounds, being totally degraded
during the treatment and the overall TOC practically reduced to zero. After integrating
these equations a mathematical expression for TOC evolution is obtained in Eq 16:
( )TOC k k tk t
TOC
C k k ke e
C k k k k k k1 23
0
2 1 3
1 2 3 1 2 3
′ ′− −′−′ ′ ′−= +
′ ′ ′ ′ ′ ′+ − + − (16)
The activation energies and the pre-exponential factors were calculated by using the
Arrhenius plot for the N-140 kinetic studies. These values were used in the corresponding
expressions of the reaction rate constants k’1, k’2 , k’3 as a function of temperature, according
to Arrhenius law as described in Eq 17:
kT
kT
kT
31
1
31
2
36 1
3
3.121 10452 exp min ;
3.612 1028.1 exp min ;
9.814 104.32 10 exp min
−
−
−
×′ = ⋅ −
×′ = ⋅ −
×′ = × ⋅ −
(17)
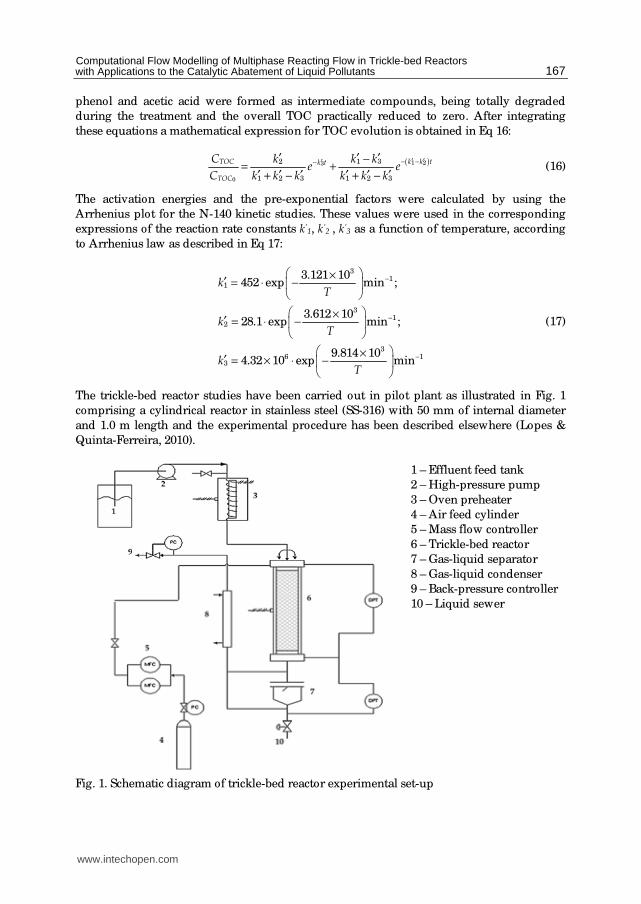
The trickle-bed reactor studies have been carried out in pilot plant as illustrated in Fig. 1
comprising a cylindrical reactor in stainless steel (SS-316) with 50 mm of internal diameter
and 1.0 m length and the experimental procedure has been described elsewhere (Lopes &
Quinta-Ferreira, 2010).
1 – Effluent feed tank
2 – High-pressure pump
3 – Oven preheater
4 – Air feed cylinder
5 – Mass flow controller
6 – Trickle-bed reactor
7 – Gas-liquid separator
8 – Gas-liquid condenser
9 – Back-pressure controller
10 – Liquid sewer
Fig. 1. Schematic diagram of trickle-bed reactor experimental set-up
www.intechopen.com
Computational Fluid Dynamics Technologies and Applications
168
4. Results and discussion
4.1 Mesh and time sensitivity tests
To check grid independence, several computational runs were carried out to figure out the
mesh density with different apertures. An introductory parametric optimization was also
accomplished querying the effect of different differencing schemes on the momentum and
volume fraction balance equations. High-order differencing schemes based on Compressive
Interface Capturing Scheme for Arbitrary Meshes (CICSAM) and High Resolution Interface
Capturing (HRIC) schemes were found to agree better with the experimental data from the
literature given that its formulation includes inherently the minimization of artificial
numerical dissipation as described elsewhere (Lopes & Quinta-Ferreira, 2009).
We begin with a base case querying the influence of numerical solution parameters
including different mesh apertures. The refinement is performed in eight levels: four levels
for the coarser meshes with 2×10⁵, 6×10⁵, 1×10⁶, 1.4×10⁶ of tetrahedral cells and four levels
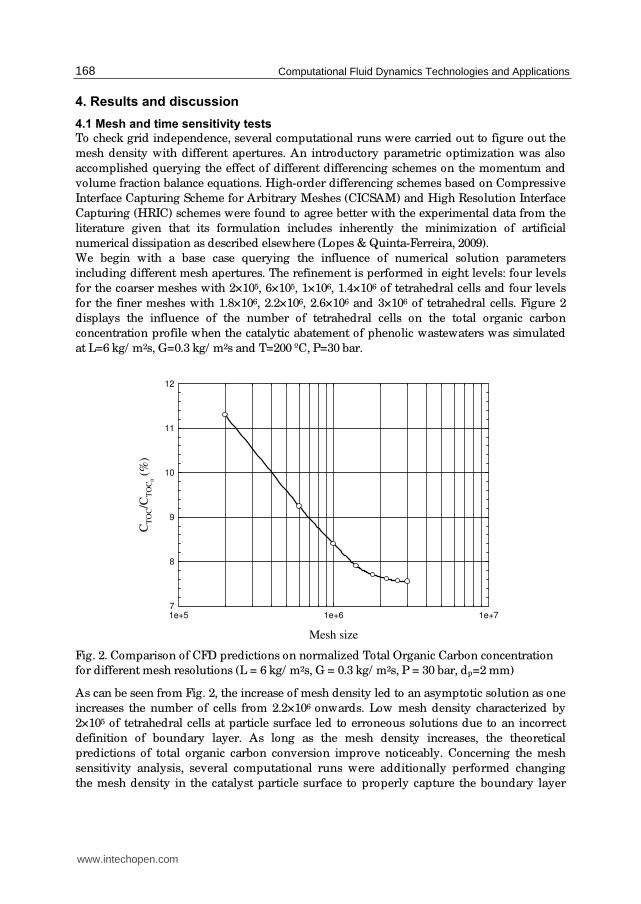
for the finer meshes with 1.8×10⁶, 2.2×10⁶, 2.6×10⁶ and 3×10⁶ of tetrahedral cells. Figure 2
displays the influence of the number of tetrahedral cells on the total organic carbon
concentration profile when the catalytic abatement of phenolic wastewaters was simulated
at L=6 kg/ m2s, G=0.3 kg/ m2s and T=200 ºC, P=30 bar.
Mesh size
1e+5 1e+6 1e+7
CT
OC/C
TO
C0 (
%)
7
8
9
10
11
12
Fig. 2. Comparison of CFD predictions on normalized Total Organic Carbon concentration
for different mesh resolutions (L = 6 kg/ m2s, G = 0.3 kg/ m2s, P = 30 bar, dp=2 mm)
As can be seen from Fig. 2, the increase of mesh density led to an asymptotic solution as one
increases the number of cells from 2.2×10⁶ onwards. Low mesh density characterized by
2×10⁵ of tetrahedral cells at particle surface led to erroneous solutions due to an incorrect
definition of boundary layer. As long as the mesh density increases, the theoretical
predictions of total organic carbon conversion improve noticeably. Concerning the mesh
sensitivity analysis, several computational runs were additionally performed changing
the mesh density in the catalyst particle surface to properly capture the boundary layer
www.intechopen.com
Computational Flow Modelling of Multiphase Reacting Flow in Trickle-bed Reactors with Applications to the Catalytic Abatement of Liquid Pollutants
169
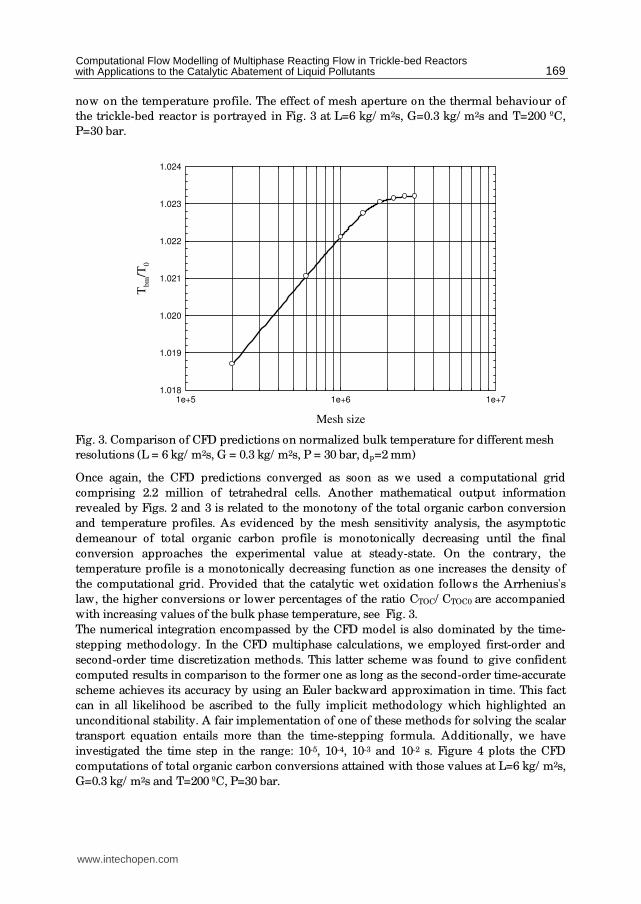
now on the temperature profile. The effect of mesh aperture on the thermal behaviour of
the trickle-bed reactor is portrayed in Fig. 3 at L=6 kg/ m2s, G=0.3 kg/ m2s and T=200 ºC,
P=30 bar.
Mesh size
1e+5 1e+6 1e+7
Tb
m/T
0
1.018
1.019
1.020
1.021
1.022
1.023
1.024
Fig. 3. Comparison of CFD predictions on normalized bulk temperature for different mesh
resolutions (L = 6 kg/ m2s, G = 0.3 kg/ m2s, P = 30 bar, dp=2 mm)
Once again, the CFD predictions converged as soon as we used a computational grid
comprising 2.2 million of tetrahedral cells. Another mathematical output information
revealed by Figs. 2 and 3 is related to the monotony of the total organic carbon conversion
and temperature profiles. As evidenced by the mesh sensitivity analysis, the asymptotic
demeanour of total organic carbon profile is monotonically decreasing until the final
conversion approaches the experimental value at steady-state. On the contrary, the
temperature profile is a monotonically decreasing function as one increases the density of
the computational grid. Provided that the catalytic wet oxidation follows the Arrhenius's
law, the higher conversions or lower percentages of the ratio CTOC/ CTOC0 are accompanied
with increasing values of the bulk phase temperature, see Fig. 3.
The numerical integration encompassed by the CFD model is also dominated by the time-
stepping methodology. In the CFD multiphase calculations, we employed first-order and
second-order time discretization methods. This latter scheme was found to give confident
computed results in comparison to the former one as long as the second-order time-accurate
scheme achieves its accuracy by using an Euler backward approximation in time. This fact
can in all likelihood be ascribed to the fully implicit methodology which highlighted an
unconditional stability. A fair implementation of one of these methods for solving the scalar
transport equation entails more than the time-stepping formula. Additionally, we have
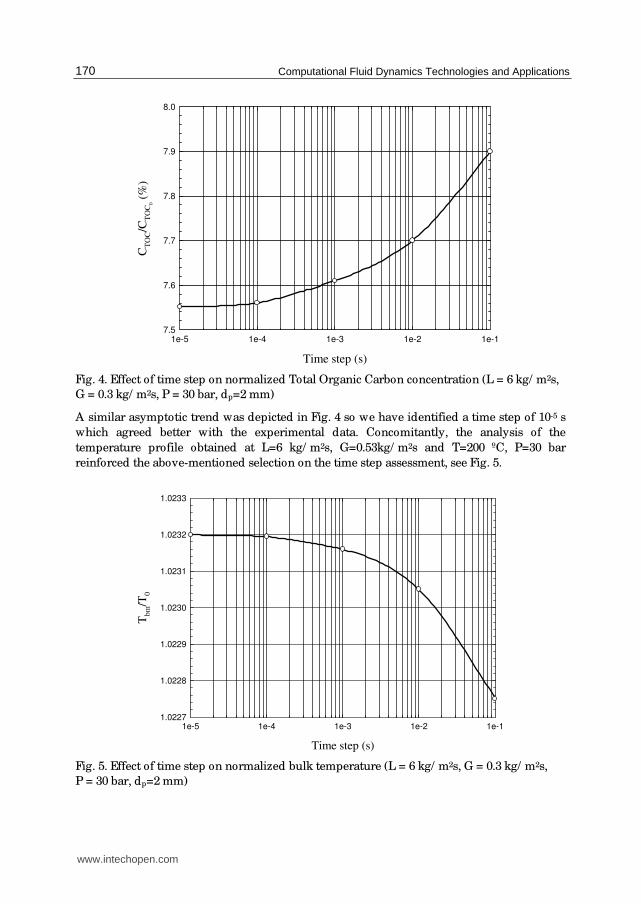
investigated the time step in the range: 10-5, 10-4, 10-3 and 10-2 s. Figure 4 plots the CFD
computations of total organic carbon conversions attained with those values at L=6 kg/ m2s,
G=0.3 kg/ m2s and T=200 ºC, P=30 bar.
www.intechopen.com
Computational Fluid Dynamics Technologies and Applications
170
Time step (s)
1e-5 1e-4 1e-3 1e-2 1e-1
CT
OC/C
TO
C0 (
%)
7.5
7.6
7.7
7.8
7.9
8.0
Fig. 4. Effect of time step on normalized Total Organic Carbon concentration (L = 6 kg/ m2s,
G = 0.3 kg/ m2s, P = 30 bar, dp=2 mm)
A similar asymptotic trend was depicted in Fig. 4 so we have identified a time step of 10-5 s
which agreed better with the experimental data. Concomitantly, the analysis of the
temperature profile obtained at L=6 kg/ m2s, G=0.53kg/ m2s and T=200 ºC, P=30 bar
reinforced the above-mentioned selection on the time step assessment, see Fig. 5.
Time step (s)
1e-5 1e-4 1e-3 1e-2 1e-1
Tb
m/T
0
1.0227
1.0228
1.0229
1.0230
1.0231
1.0232
1.0233
Fig. 5. Effect of time step on normalized bulk temperature (L = 6 kg/ m2s, G = 0.3 kg/ m2s,
P = 30 bar, dp=2 mm)
www.intechopen.com
Computational Flow Modelling of Multiphase Reacting Flow in Trickle-bed Reactors with Applications to the Catalytic Abatement of Liquid Pollutants
171
It is worthy to notice the reverse behaviour that featured the total organic carbon
concentration and temperature profiles illustrated in Figs. 4 and 5. As discussed earlier on
the monotonic nature of mesh density functions, this suggests again the Arrhenius's
temperature dependence of the rate constant for the chemical oxidation reaction.
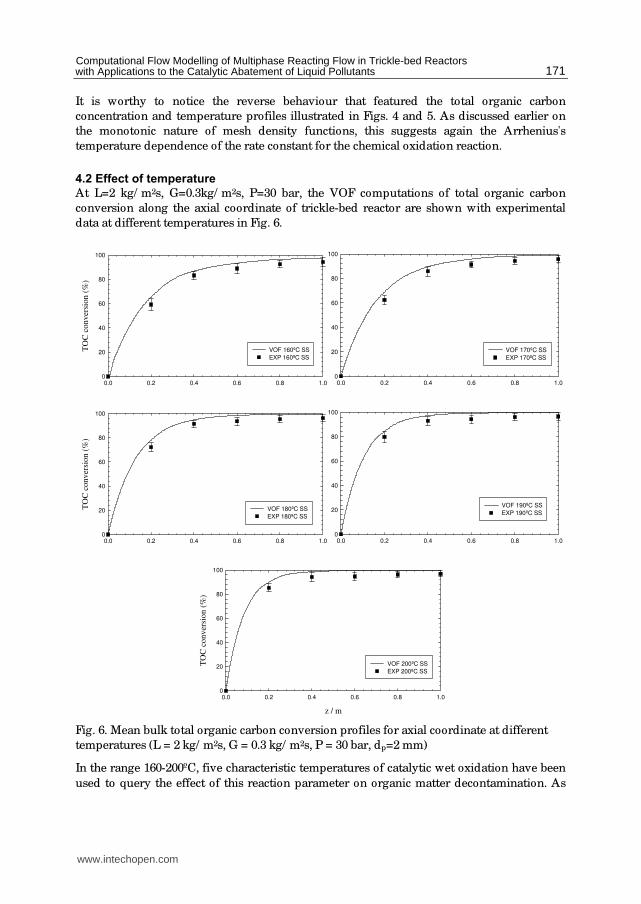
4.2 Effect of temperature
At L=2 kg/ m2s, G=0.3kg/ m2s, P=30 bar, the VOF computations of total organic carbon
conversion along the axial coordinate of trickle-bed reactor are shown with experimental
data at different temperatures in Fig. 6.
0.0 0.2 0.4 0.6 0.8 1.0
TO
C c
on
ver
sion
(%
)
0
20
40
60
80
100
VOF 160ºC SS
EXP 160ºC SS
0.0 0.2 0.4 0.6 0.8 1.0
0
20
40
60
80
100
VOF 170ºC SS
EXP 170ºC SS
0.0 0.2 0.4 0.6 0.8 1.0
TO
C c
on
ver
sion (
%)
0
20
40
60
80
100
VOF 180ºC SS
EXP 180ºC SS
0.0 0.2 0.4 0.6 0.8 1.0
0
20
40
60
80
100
VOF 190ºC SS
EXP 190ºC SS
z / m
0.0 0.2 0.4 0.6 0.8 1.0
TO
C c
onver
sio
n (
%)
0
20
40
60
80
100
VOF 200ºC SS
EXP 200ºC SS
Fig. 6. Mean bulk total organic carbon conversion profiles for axial coordinate at different
temperatures (L = 2 kg/ m2s, G = 0.3 kg/ m2s, P = 30 bar, dp=2 mm)
In the range 160-200ºC, five characteristic temperatures of catalytic wet oxidation have been
used to query the effect of this reaction parameter on organic matter decontamination. As
www.intechopen.com
Computational Fluid Dynamics Technologies and Applications
172
expected, conversion is favoured by increasing the temperature, hence we have the
complete mineralization of organic matter after one half of reactor length when the
simulation was carried out at the highest temperature (200ºC), see Fig. 6e. However, none
experimental measure on total organic carbon concentration has indicated that we have an
absolute depletion of organic pollutants from the liquid phase. Examination of successive
plots of Fig. 6, provides the ability to compare quantitatively CFD model predictions with
the corresponding experimental conversion either through the averaged relative or absolute
errors. At the lowest temperature (T=160ºC, see Fig. 6a), the averaged relative errors
obtained at z=0.2, 0.4, 0.6, 0.8 and 1m were 16.2, 24.6, 43.1, 46.4 and 44.8%, respectively.
Despite these values are remarkably increasing, the averaged absolute errors are decreasing
and we had achieved 5.9, 3.6, 3.8, 2.9, 2.1 for z=0.2, 0.4, 0.6, 0.8, 1m, respectively. In fact, the
magnitude of the relative errors can be explained by the narrow range of TOC
concentrations that were obtained at the reactor egress. At z=0.6 and 0.8m the TOC
conversions were higher than 90% which produced very low concentration ratios
CTOC/ CTOC0 as illustrated in Fig. 6. This behaviour on the complementary nature of both
averaged relative and absolute errors warned that every validation accomplished with VOF
multiphase model should follow a systematic comparison between those rating parameters.
Indeed, at T=170ºC the averaged relative errors obtained with CFD model were 18.6, 30.6,
57.8, 64.1 and 65.9% for z=0.2, 0.4, 0.6, 0.8 and 1m whereas the averaged absolute errors
were 6.4, 3.8, 4.1, 2.9, 2.1, respectively. Moreover, at the highest temperature the
magnitude of the averaged relative errors was enlarged hastily to 32.5, 78.4, 90.6, 90.9 and
91.4% albeit the averaged absolute errors kept almost the same intensity that was early
identified at lower temperatures as 4.1, 3.9, 3.8, 2.9 and 2.4 for z=0.2, 0.4, 0.6, 0.8 and 1m,
respectively.
According to all VOF computations that have been carried out at L=2 kg/ m2s, G=0.3kg/ m2s,
P=30 bar, one was able to identify the recurring overestimation of total organic carbon
conversion for every simulated temperature. Generally, it can be seen from Fig. 6 that
computed results agreed better with experimental data at the lower temperatures. This fact
has been explained by the formulation of enthalpy balance meaning that a separate enthalpy
equation for each phase in Eulerian models is more efficient on the prediction of
temperature, which is used to compute the species concentration, against the shared
formulation for enthalpy and temperature variables accounted by the current VOF model.
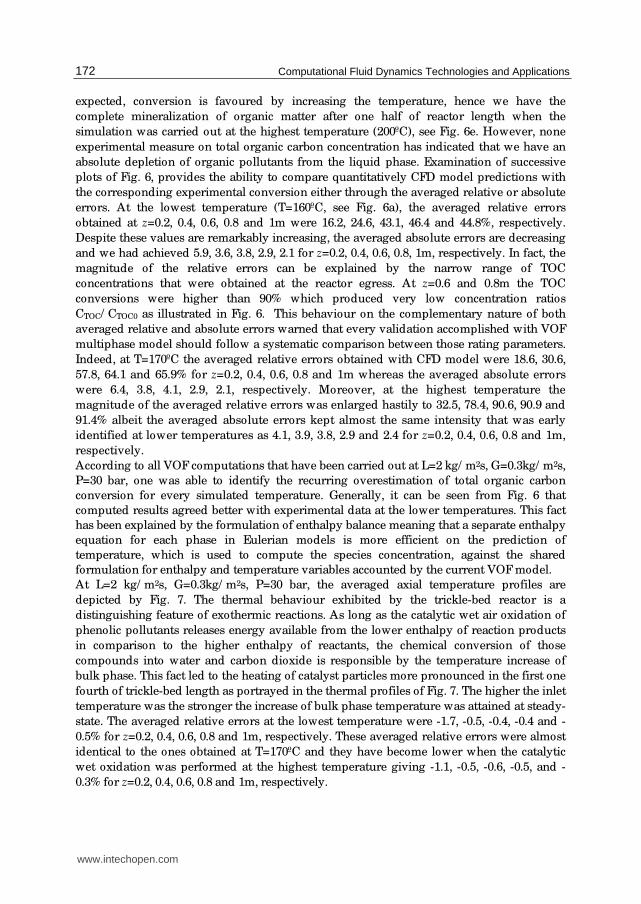
At L=2 kg/ m2s, G=0.3kg/ m2s, P=30 bar, the averaged axial temperature profiles are
depicted by Fig. 7. The thermal behaviour exhibited by the trickle-bed reactor is a
distinguishing feature of exothermic reactions. As long as the catalytic wet air oxidation of
phenolic pollutants releases energy available from the lower enthalpy of reaction products
in comparison to the higher enthalpy of reactants, the chemical conversion of those
compounds into water and carbon dioxide is responsible by the temperature increase of
bulk phase. This fact led to the heating of catalyst particles more pronounced in the first one
fourth of trickle-bed length as portrayed in the thermal profiles of Fig. 7. The higher the inlet
temperature was the stronger the increase of bulk phase temperature was attained at steady-
state. The averaged relative errors at the lowest temperature were -1.7, -0.5, -0.4, -0.4 and -
0.5% for z=0.2, 0.4, 0.6, 0.8 and 1m, respectively. These averaged relative errors were almost
identical to the ones obtained at T=170ºC and they have become lower when the catalytic
wet oxidation was performed at the highest temperature giving -1.1, -0.5, -0.6, -0.5, and -
0.3% for z=0.2, 0.4, 0.6, 0.8 and 1m, respectively.
www.intechopen.com
Computational Flow Modelling of Multiphase Reacting Flow in Trickle-bed Reactors with Applications to the Catalytic Abatement of Liquid Pollutants
173
0.0 0.2 0.4 0.6 0.8 1.0
Tb
m/T
0
1.00
1.02
1.04
1.06
1.08
1.10
VOF 160ºC SS
EXP 160ºC SS
0.0 0.2 0.4 0.6 0.8 1.0
1.00
1.02
1.04
1.06
1.08
1.10
VOF 170ºC SS
EXP 170ºC SS
0.0 0.2 0.4 0.6 0.8 1.0
Tb
m/T
0
1.00
1.02
1.04
1.06
1.08
1.10
VOF 180ºC SS
EXP 180ºC SS
0.0 0.2 0.4 0.6 0.8 1.0
1.00
1.02
1.04
1.06
1.08
1.10
VOF 190ºC SS
EXP 190ºC SS
z / m
0.0 0.2 0.4 0.6 0.8 1.0
Tb
m/T
0
1.00
1.02
1.04
1.06
1.08
1.10
VOF 200ºC SS
EXP 200ºC SS
Fig. 7. Mean bulk temperature profiles for axial coordinate at different temperatures
(L = 2 kg/ m2s, G = 0.3 kg/ m2s, P = 30 bar, dp=2 mm)
Having analysed quantitatively these findings, it can be argued that the VOF computations
of total organic carbon conversion agreed better with experimental data at lower
temperatures, whereas the computed VOF predictions of temperature profiles managed
better at higher ones.
4.3 Effect of liquid flow rate
The VOF multiphase model has also been used to query the effect of liquid flow rate on total
organic carbon conversion within the above-mentioned temperature range, 160-200ºC.
Figure 8 shows the axial profiles of total organic carbon conversion attained theoretically
and experimentally at L=6 kg/ m2s, G=0.3kg/ m2s, P=30 bar.
www.intechopen.com
Computational Fluid Dynamics Technologies and Applications
174
0.0 0.2 0.4 0.6 0.8 1.0
TO
C c
onver
sio
n (
%)
0
20
40
60
80
100
VOF 160ºC SS
EXP 160ºC SS
0.0 0.2 0.4 0.6 0.8 1.0
0
20
40
60
80
100
VOF 170ºC SS
EXP 170ºC SS
0.0 0.2 0.4 0.6 0.8 1.0
TO
C c
onv
ersi
on
(%
)
0
20
40
60
80
100
VOF 180ºC SS
EXP 180ºC SS
0.0 0.2 0.4 0.6 0.8 1.0
0
20
40
60
80
100
VOF 190ºC SS
EXP 190ºC SS
z / m
0.0 0.2 0.4 0.6 0.8 1.0
TO
C c
onv
ersi
on
(%
)
0
20
40
60
80
100
VOF 200ºC SS
EXP 200ºC SS
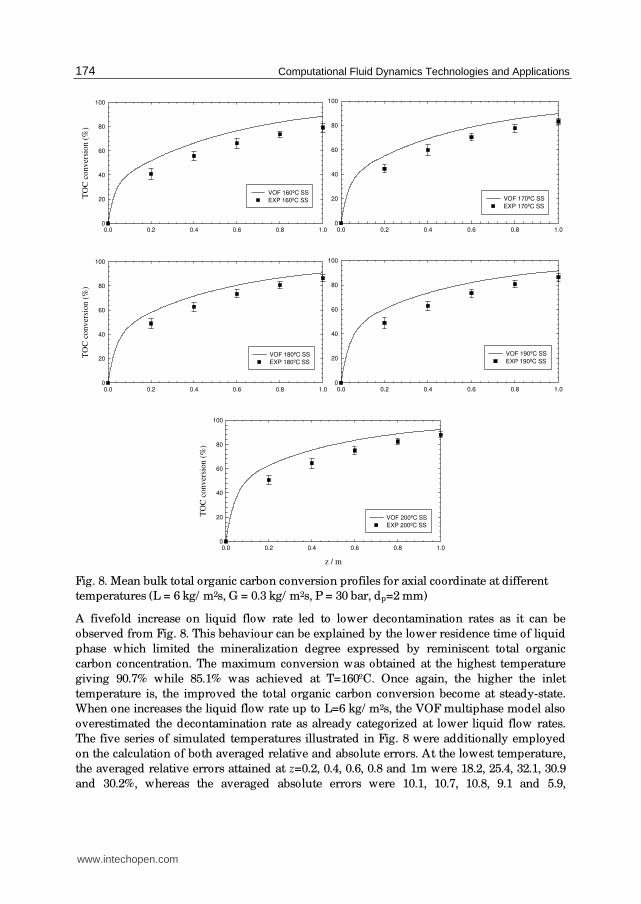
Fig. 8. Mean bulk total organic carbon conversion profiles for axial coordinate at different
temperatures (L = 6 kg/ m2s, G = 0.3 kg/ m2s, P = 30 bar, dp=2 mm)
A fivefold increase on liquid flow rate led to lower decontamination rates as it can be
observed from Fig. 8. This behaviour can be explained by the lower residence time of liquid
phase which limited the mineralization degree expressed by reminiscent total organic
carbon concentration. The maximum conversion was obtained at the highest temperature
giving 90.7% while 85.1% was achieved at T=160ºC. Once again, the higher the inlet
temperature is, the improved the total organic carbon conversion become at steady-state.
When one increases the liquid flow rate up to L=6 kg/ m2s, the VOF multiphase model also
overestimated the decontamination rate as already categorized at lower liquid flow rates.
The five series of simulated temperatures illustrated in Fig. 8 were additionally employed
on the calculation of both averaged relative and absolute errors. At the lowest temperature,
the averaged relative errors attained at z=0.2, 0.4, 0.6, 0.8 and 1m were 18.2, 25.4, 32.1, 30.9
and 30.2%, whereas the averaged absolute errors were 10.1, 10.7, 10.8, 9.1 and 5.9,
www.intechopen.com
Computational Flow Modelling of Multiphase Reacting Flow in Trickle-bed Reactors with Applications to the Catalytic Abatement of Liquid Pollutants
175
respectively, see Fig. 8a. Increasing the temperature up to T=180ºC, the averaged relative
errors became 20.7, 27.8, 33.2, 29.6 and 23.7% while the averaged absolute errors turned out
to be 10.9, 10.3, 8.7, 5.1 and 3.3 for z=0.2, 0.4, 0.6, 0.8 and 1m, respectively. If one increases
even further the reactor temperature up to T=200ºC, the computed averaged relative errors
were 24.7, 31.3, 35.7, 29.5 and 18.4 whereas the averaged absolute errors happened to be
11.8, 10.7, 8.8, 4.7 and 2.1, see Fig. 8e. This in return translates into an unbiased trend of
deviations between the computed results and experimental data in dissimilarity with
previous results obtained at the lower liquid flow rate, L=2 kg/ m2s, keeping invariable the
gas flow rate and operating pressure (G=0.3kg/ m2s, P=30 bar).
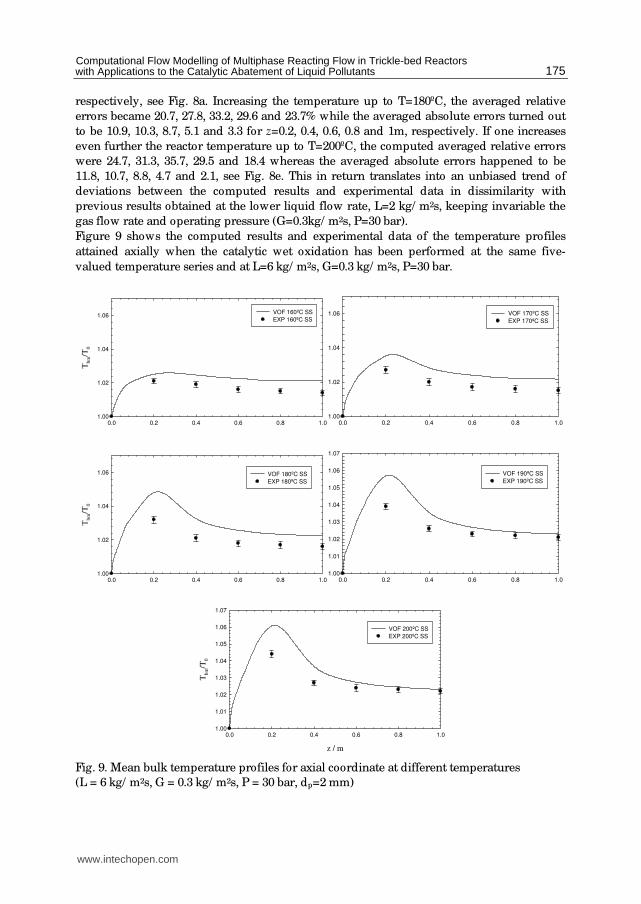
Figure 9 shows the computed results and experimental data of the temperature profiles
attained axially when the catalytic wet oxidation has been performed at the same five-
valued temperature series and at L=6 kg/ m2s, G=0.3 kg/ m2s, P=30 bar.
0.0 0.2 0.4 0.6 0.8 1.0
Tb
m/T
0
1.00
1.02
1.04
1.06VOF 160ºC SS
EXP 160ºC SS
0.0 0.2 0.4 0.6 0.8 1.0
1.00
1.02
1.04
1.06 VOF 170ºC SS
EXP 170ºC SS
0.0 0.2 0.4 0.6 0.8 1.0
Tb
m/T
0
1.00
1.02
1.04
1.06 VOF 180ºC SS
EXP 180ºC SS
0.0 0.2 0.4 0.6 0.8 1.0
1.00
1.01
1.02
1.03
1.04
1.05
1.06
1.07
VOF 190ºC SS
EXP 190ºC SS
z / m
0.0 0.2 0.4 0.6 0.8 1.0
Tb
m/T
0
1.00
1.01
1.02
1.03
1.04
1.05
1.06
1.07
VOF 200ºC SS
EXP 200ºC SS
Fig. 9. Mean bulk temperature profiles for axial coordinate at different temperatures
(L = 6 kg/ m2s, G = 0.3 kg/ m2s, P = 30 bar, dp=2 mm)
www.intechopen.com
Computational Fluid Dynamics Technologies and Applications
176
As suggested from the simulations displayed in Fig. 9, the temperature increase predicted
by the VOF multiphase model was always higher than the experimental value. As the
reactor operation is now simulated at higher liquid flow rate, one should expect a reduction
on the maximum temperature increase along the trickle-bed reactor. Indeed, the maximum
temperature increase obtained at L=2 kg/ m2s was 8.9% whereas it became 5.2% at L=6
kg/ m2s meaning that a lower residence time did not allow for such heating degree as one
observed for higher liquid phase residence time. At the lowest temperature, the averaged
relative errors were -0.2, -0.3, -0.5, -0.5 and -0.6% for z=0.2, 0.4, 0.6, 0.8 and 1m, respectively.
The magnitude of these decreased from the hotspot zone onwards with higher temperatures
so we obtained -0.2, -0.1 and -0.2% for z=0.6, 0.8 and 1m.
4.4 Evaluation of reaction map fields
Prominent research on continuous catalytic wet oxidation of hazardous compounds has
identified that hydrodynamics such as phase holdup, pressure drop, and liquid distribution
are fundamental criteria for the efficient design of trickle beds. In this ambit and as long as
the multiphase flow environment in trickle-bed reactors is strongly influenced by the local
phase distribution and the velocity of the gas and the liquid contained in them, here we
attempt to examine computationally the interstitial flow in environmentally-based trickle-
bed reactors given the inherent difficulties of conventional measurement methods which
mainly confer a global view on the trickle bed performance.
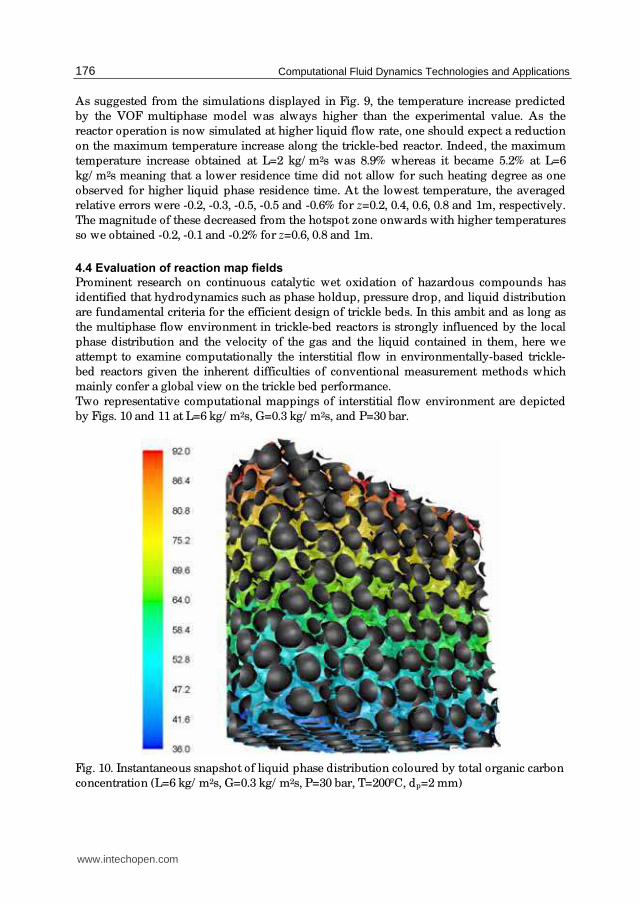
Two representative computational mappings of interstitial flow environment are depicted
by Figs. 10 and 11 at L=6 kg/ m2s, G=0.3 kg/ m2s, and P=30 bar.
Fig. 10. Instantaneous snapshot of liquid phase distribution coloured by total organic carbon
concentration (L=6 kg/ m2s, G=0.3 kg/ m2s, P=30 bar, T=200ºC, dp=2 mm)
www.intechopen.com
Computational Flow Modelling of Multiphase Reacting Flow in Trickle-bed Reactors with Applications to the Catalytic Abatement of Liquid Pollutants
177
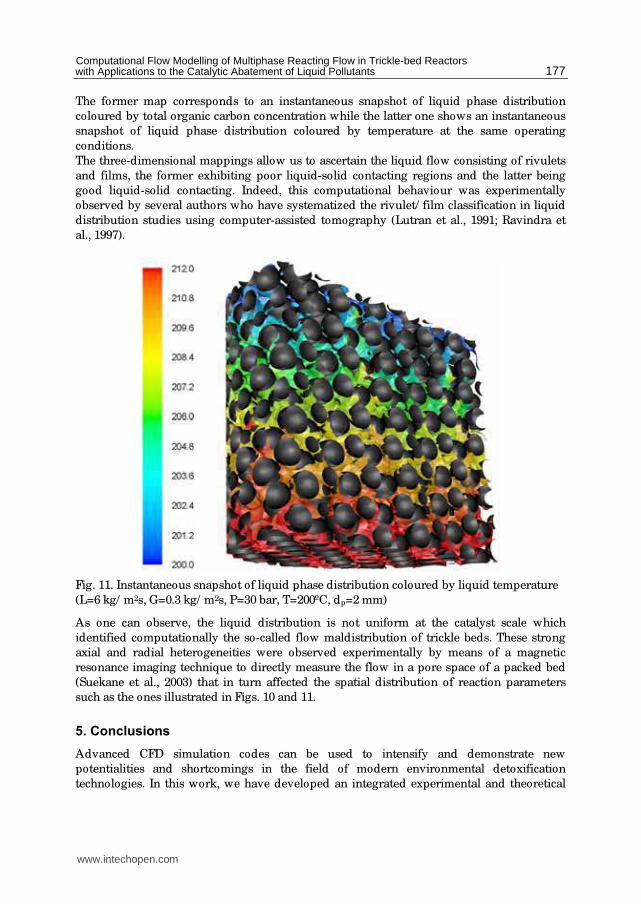
The former map corresponds to an instantaneous snapshot of liquid phase distribution
coloured by total organic carbon concentration while the latter one shows an instantaneous
snapshot of liquid phase distribution coloured by temperature at the same operating
conditions.
The three-dimensional mappings allow us to ascertain the liquid flow consisting of rivulets
and films, the former exhibiting poor liquid-solid contacting regions and the latter being
good liquid-solid contacting. Indeed, this computational behaviour was experimentally
observed by several authors who have systematized the rivulet/ film classification in liquid
distribution studies using computer-assisted tomography (Lutran et al., 1991; Ravindra et
al., 1997).
Fig. 11. Instantaneous snapshot of liquid phase distribution coloured by liquid temperature
(L=6 kg/ m2s, G=0.3 kg/ m2s, P=30 bar, T=200ºC, dp=2 mm)
As one can observe, the liquid distribution is not uniform at the catalyst scale which
identified computationally the so-called flow maldistribution of trickle beds. These strong
axial and radial heterogeneities were observed experimentally by means of a magnetic
resonance imaging technique to directly measure the flow in a pore space of a packed bed
(Suekane et al., 2003) that in turn affected the spatial distribution of reaction parameters
such as the ones illustrated in Figs. 10 and 11.
5. Conclusions
Advanced CFD simulation codes can be used to intensify and demonstrate new
potentialities and shortcomings in the field of modern environmental detoxification
technologies. In this work, we have developed an integrated experimental and theoretical
www.intechopen.com
Computational Fluid Dynamics Technologies and Applications
178
framework to give further insights into consistent, safer and cleaner remediation technology
of wastewaters contaminated with hazardous compounds by catalytic wet oxidation.
First, our case study encompassed the development of a CFD multiphase model which
accounts for the chemical kinetics and interphase coupling hydrodynamics in the
constitutive equations. On the optimization of mesh density and time step, the CFD model
correctly handled the effect of these numerical solution parameters on the computations of
TOC conversion and temperature. Second, particular attention was paid to the axial profiles
of temperature and TOC depletion rates. The CFD simulations have shown promising
results on how fluid dynamics can be correlated with chemical reaction, namely on the
prediction of total organic carbon conversions functionalized by nominal liquid flow rates
and attained at different temperatures. Finally, the interstitial flow was analysed by three-
dimensional computational mappings of gas-liquid distribution as well as TOC and thermal
representations highlighting the inhomogeneous reactive flow environment within the
trickle-bed reactor. This methodology encompassed a novel integrated tool which
empowered a secure estimation of reaction properties on the simulation of hazardous and
complex multiphase flows with adjustable parameters.
6. Acknowledgment
The authors gratefully acknowledged the financial support of Fundação para a Ciência e Tecnologia, Portugal.
7. References
Ayude, M. A.; Cassanello, M. C.; Martínez, O. M. & Haure, P.M. (2005). Phenomenological
approach to interpret the effect of liquid flow modulation in trickle bed reactors at
the particle scale. Chemical Engineering Science, Vol.60, pp.6262-6269, ISSN 0009-
2509.
Bhaskar, M.; Valavarasu, G.; Sairam, B.; Balaraman, K. S. & Balu, K. (2004). Three-Phase
Reactor Model to Simulate the Performance of Pilot-Plant and Industrial Trickle-
Bed Reactors Sustaining Hydrotreating Reactions. Industrial and Engineering Chemistry Research, Vol.43, pp.6654-6669, ISSN 0888-5885.
Boelhouwer, J. G.; Piepers, H. W. & Drinkenburg, A. A. H. (2001). Particle-Liquid Heat
Transfer in Trickle-Bed Reactors. Chemical Engineering Science, Vol.56, pp.1181-1187,
ISSN 0009-2509.
Boelhouwer, J. G. & Piepers, H. W.; Drinkenburg, A. A. H. (2002). Advantages of forced
non-steady operated trickle-bed reactors. Chemical Engineering Technology, Vol.25,
pp. 647-650, ISSN 0930-7516.
Brackbill, J. U.; Kothe, D. B. & Zemach, C. (1992). A Continuum Method for Modeling
Surface Tension. Journal of Computational Physics, Vol.100, pp.335-354, ISSN 0021-
9991.
Calay, R. K. & Holdo, A. E. (2008). Modelling the dispersion of flashing jets using CFD.
Journal of Hazardous Materials, Vol.154, pp.1198-1209, ISSN 0304-3894.
Dudukovic, M. P.; Larachi, F. & Mills, P. L. (1999). Multiphase reactors—revisited. Chemical Engineering Science, Vol.54, pp.1975-1995, ISSN 0009-2509.
www.intechopen.com
Computational Flow Modelling of Multiphase Reacting Flow in Trickle-bed Reactors with Applications to the Catalytic Abatement of Liquid Pollutants
179
Elghobashi, S.; Abou-Arab, T.; Rizk, M. & Mostafa, A. (1984). Prediction of the Particle-
Laden Jet with a Two-Equation Turbulence Model. International Journal of Multiphase Flow, Vol.10, pp.697-710, ISSN 0301-9322.
FLUENT 6.1. User’s Manual to FLUENT 6.1. (2005). Fluent Inc. Centrera Resource Park, 10
Cavendish Court, Lebanon, USA.
GAMBIT 2. User’s Manual to GAMBIT 2. (2005). Fluent Inc. Centrera Resource Park, 10
Cavendish Court, Lebanon, USA.
Gavelli, F.; Chernovsky, M. K.; Bullister, E. & Kytomaa, H. K. (2010). Modeling of LNG spills
into trenches. Journal of Hazardous Materials, Vol.180, pp.332-339, ISSN 0304-3894.
Iliuta, I.; Ring, Z. & Larachi, F. (2006). Simulating simultaneous fines deposition under
catalytic hydrodesulfurization in hydrotreating trickle beds—does bed plugging
affect HDS performance? Chemical Engineering Science, Vol.61, pp.1321-1333, ISSN
0009-2509.
Khadilkar, M. R.; Al-Dahhan, M. H. & Dudukovic, M. P. (2005). Multicomponent flow-
transport-reaction modeling of trickle bed reactors: application to unsteady state
liquid flow modulation. Industrial and Engineering Chemistry Research, Vol.44,
pp.6354-6370, ISSN 0888-5885.
Lange, R.; Schubert, M.; Dietrich, W. & Grünewald, M. (2004). Unsteady-state operation of
trickle-bed reactors. Chemical Engineering Science, Vol.59, pp.5355-5361, ISSN 0009-
2509.
Liu, G.; Duan, Y.; Wang, Y.; Wang, L. & Mi, Z. (2005). Periodically operated trickle-bed
reactor for EAQs hydrogenation: Experiments and modeling. Chemical Engineering Science, Vol.60, pp.6270-6278, ISSN 0009-2509.
Lopes, R. J. G.; Silva, A. M. T. & Quinta-Ferreira, R. M. (2007). Screening of Catalysts and
Effect of Temperature for Kinetic Degradation Studies of Aromatic Compounds
During Wet Oxidation. Applied Catalysis B: Environmental, Vol.73, pp.193-202, ISSN
0926-3373.
Lopes, R. J. G. & Quinta-Ferreira, R. M. (2008). Three-Dimensional Numerical Simulation of
Pressure Drop and Liquid Holdup for High-Pressure Trickle-Bed Reactor. Chemical Engineering Journal, Vol.145, pp.112-120, ISSN 1385-8947.
Lopes, R. J. G. & Quinta-Ferreira, R. M. (2009). VOF based Model for Multiphase Flow in
High-Pressure Trickle-Bed Reactor: Optimization of Numerical Parameters. AIChE Journal, Vol.55, pp.2920-2933, ISSN 1547-5905.
Lopes, R. J. G. & Quinta-Ferreira, R. M. (2010). Assessment of CFD Euler–Euler method for
trickle-bed reactor modelling in the catalytic wet oxidation of phenolic
wastewaters. Chemical Engineering Journal, Vol.160, pp.293-301, ISSN 1385-8947.
Lutran, P. G.; Ng, K. M. & Delikat, E. P. (1991). Liquid distribution in trickle-beds. An
experimental study using computer-assisted tomography. Industrial and Engineering Chemistry Research, Vol.30, pp.1270-1280, ISSN 0888-5885.
Nijemeisland, M. & Dixon, A. G. (2001). Comparison of CFD Simulations to Experiment for
Convective Heat Transfer in a Gas-Solid Fixed Bed. Chemical Engineering Science, Vol.82, pp.231-246, ISSN 0009-2509.
Pontiggia, M.; Derudi, M.; Alba, M.; Scaioni, M. & Rota, R. (2010). Hazardous gas releases in
urban areas: Assessment of consequences through CFD modelling. Journal of Hazardous Materials, Vol.176, pp.589-596, ISSN 0304-3894.
www.intechopen.com
Computational Fluid Dynamics Technologies and Applications
180
Rajashekharam, M. V.; Jaganathan, R. & Chaudhari, R. V. (1998). A trickle-bed reactor
model for hydrogenation of 2,4 dinitrotoluene: experimental verification. Chemical Engineering Science, Vol.53, pp.787-805, ISSN 0009-2509.
Ravindra, P. V.; Rao, D. P. & Rao, M. S. (1997). Liquid flow texture in trickle-bed reactors: an
experimental study. Industrial and Engineering Chemistry Research, Vol.36, 5133-5145,
ISSN 0888-5885.
Satterfield, C. N.; van Eek, M. W. & Bliss, G. S. (1978). Liquid-Solid Mass Transfer in Packed
Beds with Downward Concurrent Gas-Liquid Flow. AIChE Journal, Vol.24, pp.709-
717, ISSN 1547-5905.
Silveston, P. L. & Hanika, J. (2002). Challenges for the periodic operation of trickle-bed
catalytic reactors. Chemical Engineering Science, Vol.57, pp.3373-3385, ISSN 0009-
2509.
Silveston, P. L. & Hanika, J. (2004). Periodic operation of three-phase catalytic reactors.
Canadian Journal of Chemical Engineering, Vol.82, pp.1105-1142, ISSN 1939-019X.
Suekane, T.; Yokouchi, Y. & Hirai, S. (2003). Inertial flow structures in a simple-packed bed
of spheres. AIChE Journal, Vol.49, pp.10-17, ISSN 1547-5905.
www.intechopen.com
Computational Fluid Dynamics Technologies and ApplicationsEdited by Prof. Igor Minin
ISBN 978-953-307-169-5Hard cover, 396 pagesPublisher InTechPublished online 05, July, 2011Published in print edition July, 2011
InTech EuropeUniversity Campus STeP Ri Slavka Krautzeka 83/A 51000 Rijeka, Croatia Phone: +385 (51) 770 447 Fax: +385 (51) 686 166www.intechopen.com
InTech ChinaUnit 405, Office Block, Hotel Equatorial Shanghai No.65, Yan An Road (West), Shanghai, 200040, China
Phone: +86-21-62489820 Fax: +86-21-62489821
This book is planned to publish with an objective to provide a state-of-art reference book in the area ofcomputational fluid dynamics for CFD engineers, scientists, applied physicists and post-graduate students.Also the aim of the book is the continuous and timely dissemination of new and innovative CFD research anddevelopments. This reference book is a collection of 14 chapters characterized in 4 parts: modern principles ofCFD, CFD in physics, industrial and in castle. This book provides a comprehensive overview of thecomputational experiment technology, numerical simulation of the hydrodynamics and heat transfer processesin a two dimensional gas, application of lattice Boltzmann method in heat transfer and fluid flow, etc. Severalinteresting applications area are also discusses in the book like underwater vehicle propeller, the flow behaviorin gas-cooled nuclear reactors, simulation odour dispersion around windbreaks and so on.
How to referenceIn order to correctly reference this scholarly work, feel free to copy and paste the following:
Rodrigo J.G. Lopes and Rosa M. Quinta-Ferreira (2011). Computational Flow Modelling of MultiphaseReacting Flow in Trickle-bed Reactors with Applications to the Catalytic Abatement of Liquid Pollutants,Computational Fluid Dynamics Technologies and Applications, Prof. Igor Minin (Ed.), ISBN: 978-953-307-169-5, InTech, Available from: http://www.intechopen.com/books/computational-fluid-dynamics-technologies-and-applications/computational-flow-modelling-of-multiphase-reacting-flow-in-trickle-bed-reactors-with-applications-t


![Multiphase Reacting Flows[1]](https://img.dokumen.tips/doc/110x75/577c78321a28abe0548f08d8/multiphase-reacting-flows1.jpg)