Embed Size (px)
Citation preview
Comptroller’s
Report
For the Year Ended April 30
2016 Don Harrington, CPA, CA
University Comptroller
Our mission is to
create the premier
university
environment for our
students, faculty and
staff in which to
learn, work and live.
Table of Contents
Executive Summary .................................................................................................................................. 2
Basis of Accounting .................................................................................................................................. 3
Analysis of Major items on the Consolidated Statement of Financial Position ................................. 6
Analysis of Major items on Consolidated Statement of Operations and Change in Net Assets .. 11
Key Financial Indicators ......................................................................................................................... 14
Supplementary Information to the Notes to the Financial Statements .......................................... 18
Accounting for the Shared Risk Pension Plan .................................................................................. 18
Net Assets Restricted for Specific Purposes ..................................................................................... 18
Non-Pension Employee Benefit Costs ............................................................................................... 25
University of New Brunswick
Annual Comptroller’s Report
For the year ended April 30
2
2016
Executive Summary
I am pleased to present the Report of the Comptroller for the fiscal year ended
April 30, 2016.
This report is in addition to the University’s audited financial statements and offers
analysis and commentary with respect to the University’s financial results for the year
and the financial position at the end of the year. The audited financial statements
report on the operations and financial position of the entire University and were
prepared in accordance with Accounting Standards for Non-Profit organizations
(ASNPO) as issued by the Chartered Professional Accountants of Canada (CPA).
The financial statements have been audited by Deloitte, LLP and their Auditor’s Report
is part of the audited financial statement package. For the year ended April 30, 2016,
Deloitte has issued an unqualified audit opinion, meaning that according to their
independent audit, the financial statements express fairly the University's financial
position and results of operations in accordance with ASNPO.
In addition, a Statement of Management Responsibility, signed by the President and
Vice President (Administration & Finance), is also included with the financial statement
package. This statement acknowledges management’s responsibility for the
preparation of the financial statements and maintenance of a system of internal
controls to safeguard University assets and result in reliable accounting records.
The major highlights of the 2016 financial statements were:
The University reported an excess of expenses over revenues of $2.7 million. After
reflecting changes in net assets, this results in a net unrestricted operating deficit
of $3.1 million.
The net unrestricted operating deficit of $3.1 million is a result of the University
having a structural deficit and after accounting for changes in the Internally
Restricted Net Assets.
The University has an accumulated unrestricted operating deficit of $3.1 million,
the first since 2011.
The University’s total assets decreased by $5.7 million, primarily due to a decrease
in cash of $5.7 million.
Net assets increased by $2.6 million, up to $280.4 million, primarily due to an
increase in Endowed assets and Investment in Capital offset by decreases in
Unfunded employee benefits, Restricted for specific purpose and the
accumulated operating deficit.
University of New Brunswick
Annual Comptroller’s Report
For the year ended April 30
3
2016
Basis of Accounting The audited financial statements of the University of New Brunswick for the year ended
April 30, 2016 have been prepared in accordance with Accounting Standards for Non-
Profit organizations (ASNPO) issued by the Chartered Professional Accountants of
Canada (CPA). Canadian Universities generally apply either these standards or Public
Sector Accounting Standards depending on the level of control executed by the
government in the province where they reside.
Within the ASNPO standards, non-profit organizations have the option to adopt either the
deferral method of revenue recognition or the restricted method. UNB selected the
deferral method a number of years ago. Under this method the University is required to
report the operations of all Funds on a consolidated basis in the financial statements.
However, all contributions with external restrictions placed on their use are deferred and
recognized as revenue only in the period the funds are actually used for the intended
purposes. This includes such items as sponsored research revenue, contributions for
specific purposes, and contributions for fixed asset acquisitions. Contributions to the
Endowment Fund which are required by the donor to be held in perpetuity are credited
directly to the net assets and are not reflected as revenue.
The audited financial statements are one component of the financial reports used in the
management and oversight of the University operations. They offer a consolidated view
of operations and a basis for global comparisons with other universities. However, other
universities may use different accounting standards based on the degree of control by
their provincial government or may use different revenue recognition standards. In the
case of UNB the deferral accounting method results in some significant differences from
the funds format financial statements which are typically used throughout the year by
University management and the Board of Governors to assess operations. For example:
Donations and research grants received are reported as revenue in the year
received in the funds format financial statements but in the audited financial
statements, are only recognized to the extent the revenue is spent in the year.
Unspent amounts are deferred and reported on the statement of financial
position as unexpended deferred contributions until spent for the restricted
purpose.
Endowment contributions received are not recognized in the audited financial
statements as revenue but rather as a direct increase to endowed net assets.
Capital assets are expensed as acquired in the funds format financial statements
but are capitalized and amortized over their useful lives in the audited
financial statements.
Therefore, the two accounting methods result in significant differences in amounts
reported in the audited financial statements and the funds format financial statements.
The fund accounting approach used by management to monitor operations more
closely aligns with the approach to manage resources and is widely used in the University
and not-for-profit sectors:
University of New Brunswick
Annual Comptroller’s Report
For the year ended April 30
4
2016
It provides a central mechanism to ensure external and internal restrictions of
funds such as research grants, endowment contributions and restricted capital
grants are respected;
It provides an additional measure of expenditure control in that expenditures can
only be made when/if there are budgeted funds available in the account
The University operates the following three funds which are consolidated in the audited
financial statements prepared in accordance with ASNPO:
Trust and Endowment Fund - holds the endowed assets (contributions which are
required to be held in perpetuity) and other contributions which have legal
restrictions with respect to their use;
Restricted Fund - holds restricted research, capital project and other accounts
which are funded from internally and externally restricted sources as well as the
University’s capital assets;
Operating Fund - where the financial operations of the University are reported.
The audited financial statements include:
Statement of Management Responsibility where senior management
acknowledge their responsibility for preparing the financial statements and
maintaining adequate internal controls. In addition, it acknowledges the Board of
Governors’ responsibility for review of the audited financial statements primarily
through its Audit Committee.
Auditor’s Report which outlines the responsibilities of management and the
auditor. The auditor’s report for 2016 is unqualified.
Consolidated Statement of Financial Position which shows the financial position of
the University as at the end of the fiscal year. This includes the assets owned by
UNB less the liabilities, resulting in the Net Assets of the University;
Consolidated Statement of Operations and Changes in Net Assets which shows
the gross revenues and expenses of all University Funds, excluding deferred
amounts, resulting in the difference of revenues and expenses. This amount is then
adjusted for the amounts applicable to the various components of net assets,
ending in the change in the net unrestricted operating surplus or deficit for the
year.
Consolidated Statement of Changes in Net Assets which shows the changes in
each category of net assets.
Consolidated Statement of Cash Flows which shows the primary sources and uses
of cash during the fiscal year.
University of New Brunswick
Annual Comptroller’s Report
For the year ended April 30
5
2016
Notes to the financial statements which are audited and provide additional
disclosure and information to assist the reader in understanding the financial
results.
The Consolidated Statement o f Operations and Changes in Net Assets reports an
excess of expenses over revenues before changes in internally restricted net assets, of
$2.7 million (1.1% of revenues). This reflects all restricted and unrestricted activities of
the university. The $2.7 million is adjusted for the changes in net assets as outlined
below, illustrating the impact of various internal and external restrictions on net assets
and culminating in a net unrestricted operating deficit of $3.1 million.
The excess of expenses over revenues was increased by $5.0 million in the year
due to an increase in investment in capital assets. The increase resulted from $7.4
million in capital asset acquisitions funded from operations, decreases in financing
of capital assets of $1.8 million, $9.1 million amortization of deferred capital
contributions, all offset by $13.3 million in amortization of capital assets.
The excess of expenses over revenues was increased by $1.5 million related to
the difference between the actuarially determined employee future benefit
expense that is reported as an expense and the actual cash contributions.
The excess of expenses over revenues was reduced by $6.0 million relating to
adjustments to internally restricted net assets. These adjustments represent a net
decrease of carry forwards and reserves as some units have spent some of prior
year carry forward amounts. Two examples of this are the funding for recruitment
and marketing campaign and the budgeted reduction of the deficit, both of
which were planned reductions of the internally restricted net assets.
After the above-noted adjustments for changes in net assets, the Statement of
Revenues, Expenses and Changes in Net Assets reports a net unrestricted
operating deficit for the year of $3.1 million and a corresponding decrease in the
University’s accumulated unrestricted operating surplus from $42 thousand to a
deficit of $3.1 million.
University of New Brunswick
Annual Comptroller’s Report
For the year ended April 30
6
2016
Analysis of Major items on the Consolidated
Statement of Financial Position
The Consolidated Statement of Financial Position reports the assets owned and controlled by
the University; the Liabilities owed by UNB and the Net Assets of the University as at the end of
the fiscal year – April 30, 2016 (with comparative amounts from the prior year). Assets and
liabilities are categorized according to their liquidity, or how quickly they are expected to be
converted into cash or require the use of cash with assets and liabilities closest to cash being
classified as current and those with time horizons greater than one year shown as long term.
The following charts illustrate the values reported in various categories on the Consolidated
Statement of Financial Position for the past nine years. The balances of years previous to
2014/15 have been restated to reflect the change in accounting standards relative to
hedge accounting (2012/13) and the adoption of 3462 “Employee Future Benefits” (2013/14)
as well as the correction of prior period reporting of internally restricted research related
funds (2012/13).
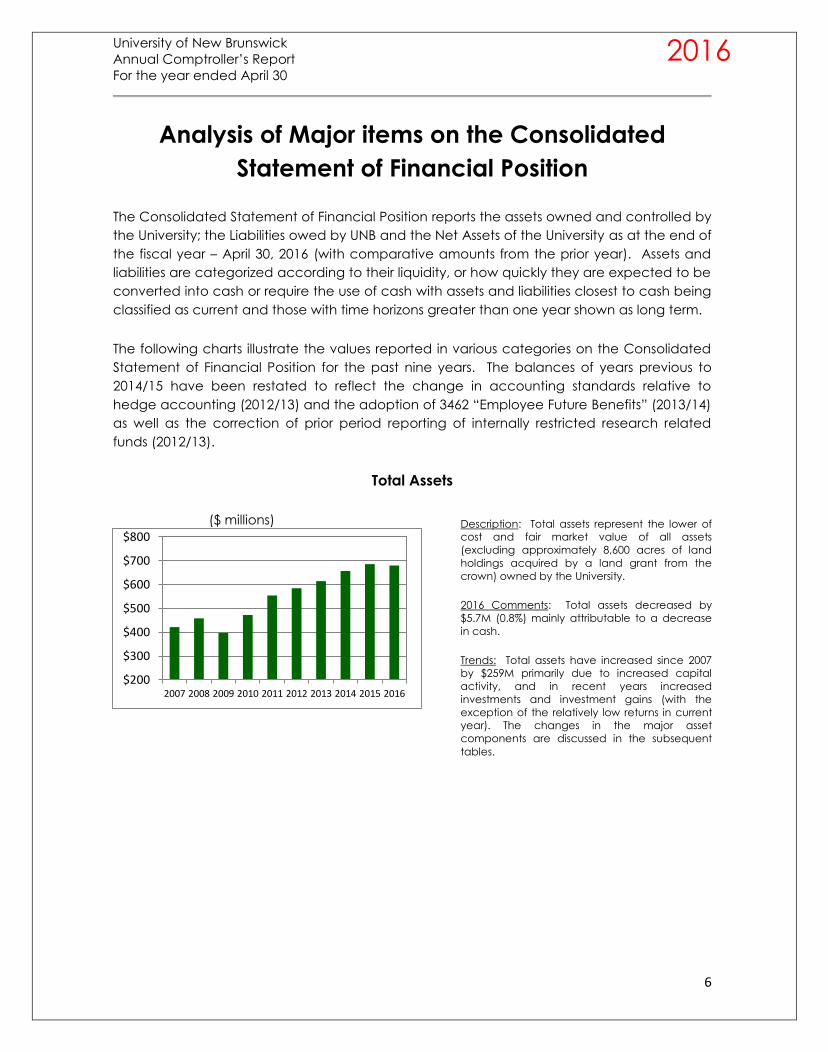
Total Assets
($ millions)
$200
$300
$400
$500
$600
$700
$800
2007 2008 2009 2010 2011 2012 2013 2014 2015 2016
Description: Total assets represent the lower of
cost and fair market value of all assets
(excluding approximately 8,600 acres of land
holdings acquired by a land grant from the
crown) owned by the University.
2016 Comments: Total assets decreased by
$5.7M (0.8%) mainly attributable to a decrease
in cash.
Trends: Total assets have increased since 2007
by $259M primarily due to increased capital
activity, and in recent years increased
investments and investment gains (with the
exception of the relatively low returns in current
year). The changes in the major asset
components are discussed in the subsequent
tables.
University of New Brunswick
Annual Comptroller’s Report
For the year ended April 30
7
2016
Total Liabilities
($ millions)
Total Net Assets
($ millions)
Current Assets
($ millions)
$100
$200
$300
$400
$500
2007 2008 2009 2010 2011 2012 2013 2014 2015 2016
$50
$100
$150
$200
$250
$300
2007 2008 2009 2010 2011 2012 2013 2014 2015 2016
$40
$90
$140
$190
2007 2008 2009 2010 2011 2012 2013 2014 2015 2016
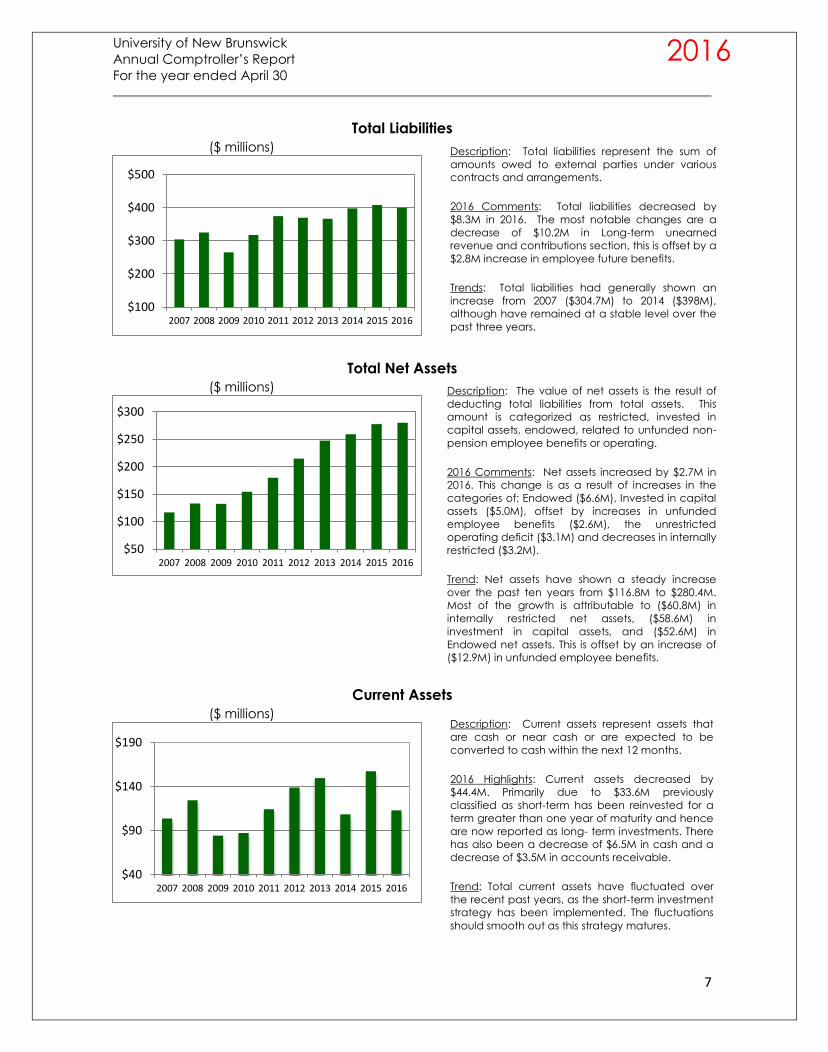
Description: Total liabilities represent the sum of
amounts owed to external parties under various
contracts and arrangements.
2016 Comments: Total liabilities decreased by
$8.3M in 2016. The most notable changes are a
decrease of $10.2M in Long-term unearned
revenue and contributions section, this is offset by a
$2.8M increase in employee future benefits.
Trends: Total liabilities had generally shown an
increase from 2007 ($304.7M) to 2014 ($398M),
although have remained at a stable level over the
past three years.
Description: The value of net assets is the result of
deducting total liabilities from total assets. This
amount is categorized as restricted, invested in
capital assets, endowed, related to unfunded non-
pension employee benefits or operating.
2016 Comments: Net assets increased by $2.7M in
2016. This change is as a result of increases in the
categories of; Endowed ($6.6M), Invested in capital
assets ($5.0M), offset by increases in unfunded
employee benefits ($2.6M), the unrestricted
operating deficit ($3.1M) and decreases in internally
restricted ($3.2M).
Trend: Net assets have shown a steady increase
over the past ten years from $116.8M to $280.4M.
Most of the growth is attributable to ($60.8M) in
internally restricted net assets, ($58.6M) in
investment in capital assets, and ($52.6M) in
Endowed net assets. This is offset by an increase of
($12.9M) in unfunded employee benefits.
Description: Current assets represent assets that
are cash or near cash or are expected to be
converted to cash within the next 12 months.
2016 Highlights: Current assets decreased by
$44.4M. Primarily due to $33.6M previously
classified as short-term has been reinvested for a
term greater than one year of maturity and hence
are now reported as long- term investments. There
has also been a decrease of $6.5M in cash and a
decrease of $3.5M in accounts receivable.
Trend: Total current assets have fluctuated over
the recent past years, as the short-term investment
strategy has been implemented. The fluctuations
should smooth out as this strategy matures.
University of New Brunswick
Annual Comptroller’s Report
For the year ended April 30
8
2016
Cash and Short Term Investments
($ millions)
Long Term Investments
($ millions)
Capital Assets
($ millions)
$40
$60
$80
$100
$120
$140
2007 2008 2009 2010 2011 2012 2013 2014 2015 2016
$100
$150
$200
$250
$300
$350
2007 2008 2009 2010 2011 2012 2013 2014 2015 2016
$50
$100
$150
$200
$250
$300
2007 2008 2009 2010 2011 2012 2013 2014 2015 2016
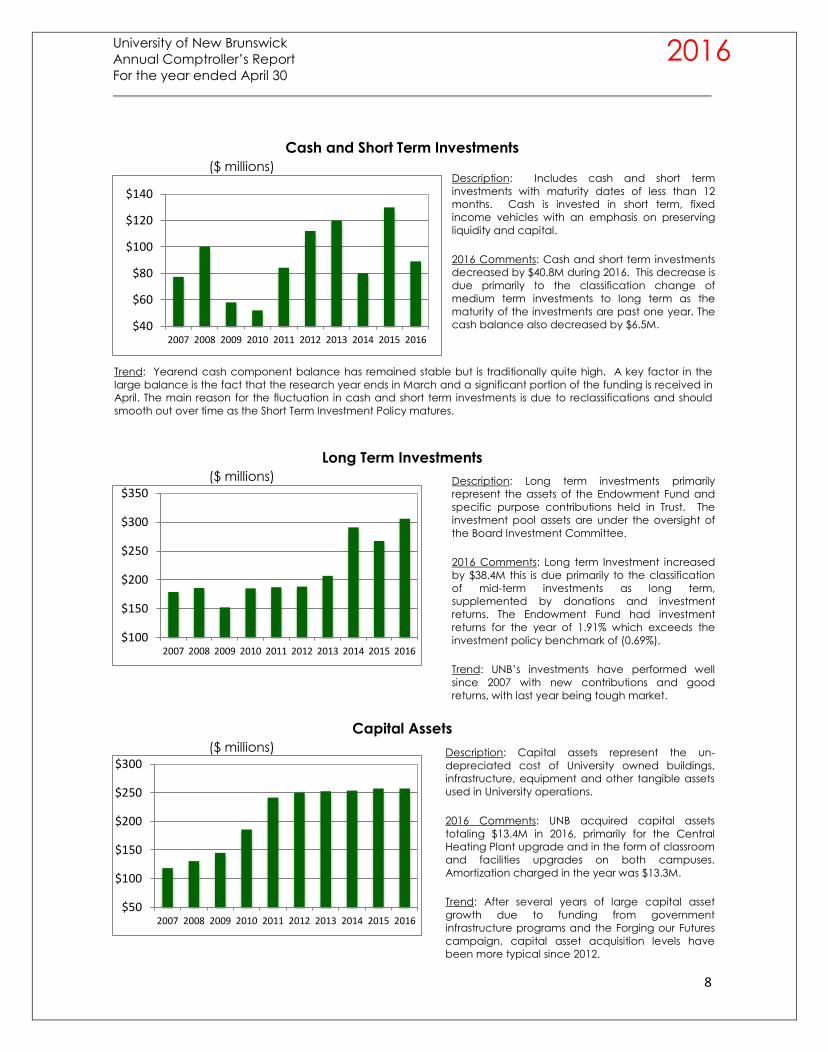
Description: Includes cash and short term
investments with maturity dates of less than 12
months. Cash is invested in short term, fixed
income vehicles with an emphasis on preserving
liquidity and capital.
2016 Comments: Cash and short term investments
decreased by $40.8M during 2016. This decrease is
due primarily to the classification change of
medium term investments to long term as the
maturity of the investments are past one year. The
cash balance also decreased by $6.5M.
Description: Long term investments primarily
represent the assets of the Endowment Fund and
specific purpose contributions held in Trust. The
investment pool assets are under the oversight of
the Board Investment Committee.
2016 Comments: Long term Investment increased
by $38.4M this is due primarily to the classification
of mid-term investments as long term,
supplemented by donations and investment
returns. The Endowment Fund had investment
returns for the year of 1.91% which exceeds the
investment policy benchmark of (0.69%).
Trend: UNB’s investments have performed well
since 2007 with new contributions and good
returns, with last year being tough market.
Description: Capital assets represent the un-
depreciated cost of University owned buildings,
infrastructure, equipment and other tangible assets
used in University operations.
2016 Comments: UNB acquired capital assets
totaling $13.4M in 2016, primarily for the Central
Heating Plant upgrade and in the form of classroom
and facilities upgrades on both campuses.
Amortization charged in the year was $13.3M.
Trend: After several years of large capital asset
growth due to funding from government
infrastructure programs and the Forging our Futures
campaign, capital asset acquisition levels have
been more typical since 2012.
Trend: Yearend cash component balance has remained stable but is traditionally quite high. A key factor in the
large balance is the fact that the research year ends in March and a significant portion of the funding is received in
April. The main reason for the fluctuation in cash and short term investments is due to reclassifications and should
smooth out over time as the Short Term Investment Policy matures.
University of New Brunswick
Annual Comptroller’s Report
For the year ended April 30
9
2016
Current Liabilities
($ millions)
Long Term Liabilities
($ millions)
Accumulated Unrestricted Operating Surplus (Deficit)
($ millions)
$0
$20
$40
$60
$80
$100
2007 2008 2009 2010 2011 2012 2013 2014 2015 2016
$60
$70
$80
$90
$100
2007 2008 2009 2010 2011 2012 2013 2014 2015 2016
-$7
-$5
-$3
-$1
$1
2007 2008 2009 2010 2011 2012 2013 2014 2015 2016
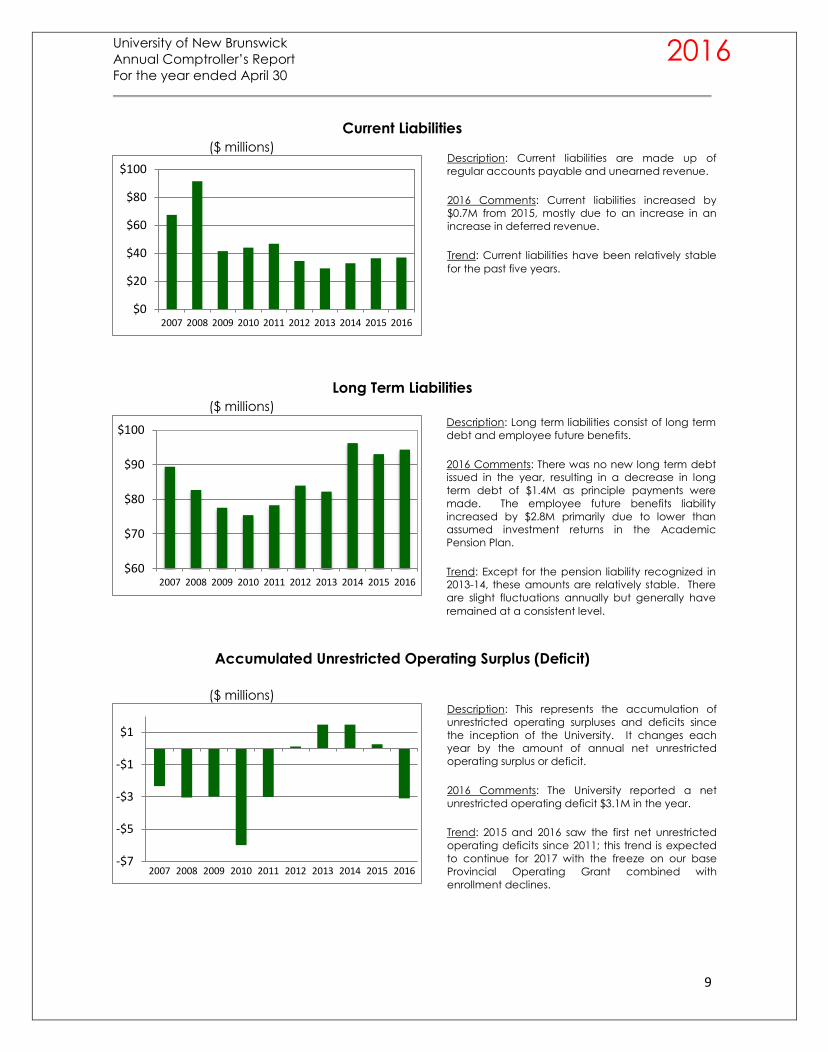
Description: Current liabilities are made up of
regular accounts payable and unearned revenue.
2016 Comments: Current liabilities increased by
$0.7M from 2015, mostly due to an increase in an
increase in deferred revenue.
Trend: Current liabilities have been relatively stable
for the past five years.
Description: Long term liabilities consist of long term
debt and employee future benefits.
2016 Comments: There was no new long term debt
issued in the year, resulting in a decrease in long
term debt of $1.4M as principle payments were
made. The employee future benefits liability
increased by $2.8M primarily due to lower than
assumed investment returns in the Academic
Pension Plan.
Trend: Except for the pension liability recognized in
2013-14, these amounts are relatively stable. There
are slight fluctuations annually but generally have
remained at a consistent level.
Description: This represents the accumulation of
unrestricted operating surpluses and deficits since
the inception of the University. It changes each
year by the amount of annual net unrestricted
operating surplus or deficit.
2016 Comments: The University reported a net
unrestricted operating deficit $3.1M in the year.
Trend: 2015 and 2016 saw the first net unrestricted
operating deficits since 2011; this trend is expected
to continue for 2017 with the freeze on our base
Provincial Operating Grant combined with
enrollment declines.
University of New Brunswick
Annual Comptroller’s Report
For the year ended April 30
10
2016
Net Assets Restricted for Specific Purposes
($ millions)
Unfunded Employee Benefits
($ millions)
$20
$40
$60
$80
$100
$120
2007 2008 2009 2010 2011 2012 2013 2014 2015 2016
$20
$30
$40
$50
$60
2007 2008 2009 2010 2011 2012 2013 2014 2015 2016
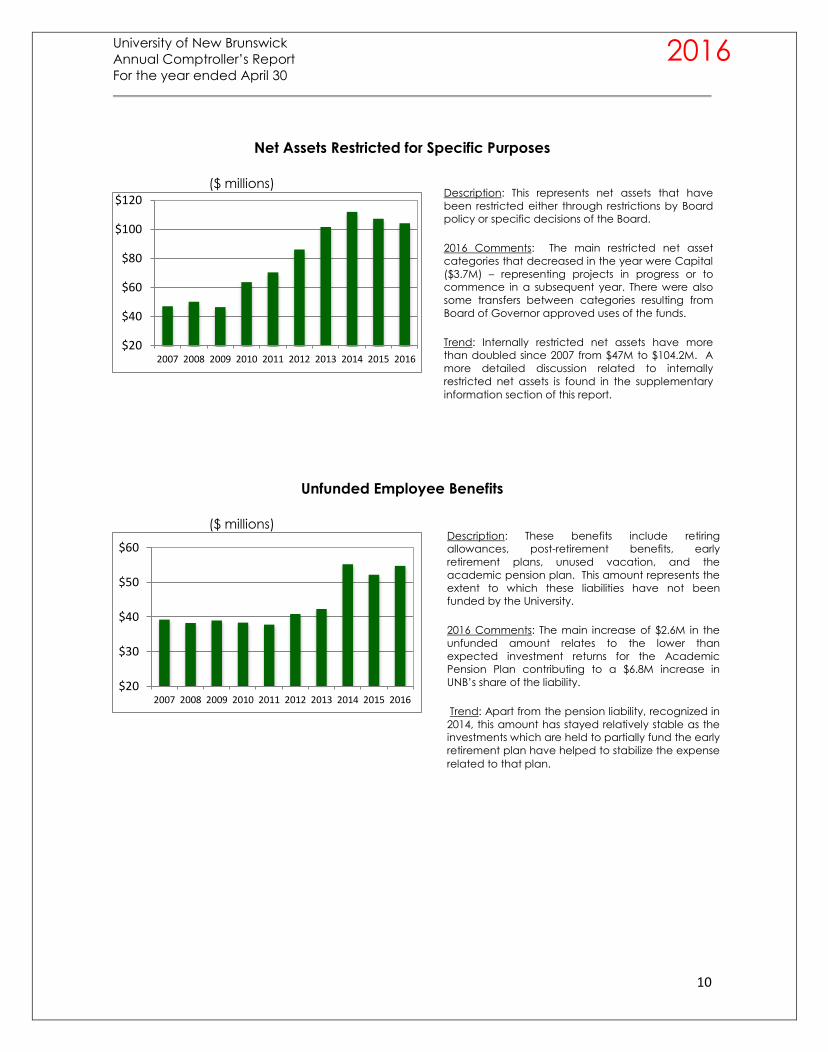
Description: This represents net assets that have
been restricted either through restrictions by Board
policy or specific decisions of the Board.
2016 Comments: The main restricted net asset
categories that decreased in the year were Capital
($3.7M) – representing projects in progress or to
commence in a subsequent year. There were also
some transfers between categories resulting from
Board of Governor approved uses of the funds.
Trend: Internally restricted net assets have more
than doubled since 2007 from $47M to $104.2M. A
more detailed discussion related to internally
restricted net assets is found in the supplementary
information section of this report.
Description: These benefits include retiring
allowances, post-retirement benefits, early
retirement plans, unused vacation, and the
academic pension plan. This amount represents the
extent to which these liabilities have not been
funded by the University.
2016 Comments: The main increase of $2.6M in the
unfunded amount relates to the lower than
expected investment returns for the Academic
Pension Plan contributing to a $6.8M increase in
UNB’s share of the liability.
Trend: Apart from the pension liability, recognized in
2014, this amount has stayed relatively stable as the
investments which are held to partially fund the early
retirement plan have helped to stabilize the expense
related to that plan.
University of New Brunswick
Annual Comptroller’s Report
For the year ended April 30
11
2016
Analysis of Major items on Consolidated Statement
of Operations and Change in Net Assets
The Consolidated Statement of Operations and Changes in Net Assets shows the gross
revenues and expenses of the University on a consolidated basis. This includes results from
the Restricted Fund (including Physical Plant), Endowment Fund and Operating Fund
accounted for according to Accounting Standards for Non-Profit organizations (ANSPO). As
previously discussed, these results are not merely a summation of the three funds because
the accounting policies require that some items, such as unspent restricted funds, be
deferred and brought into income when the funds are actually spent. In addition,
endowment contributions which are required to be held in perpetuity are reported as direct
increases in Endowed Net Assets in accordance with the accounting standards and are
never recognized as revenue.
Revenues are categorized on the Statement of Consolidated Revenues, Expenses and
changes in Net Assets according to the source of the revenue, such as Government grants,
Tuition and student fees, Research revenue, Donations and Investment income. Expenses
are categorized according to function such as Instruction, Research, Plant operations,
Administration, Student services, and Libraries. This presentation is consistent with prior years.
The following charts offer additional information with respect to revenues, expenses and the
net operating results for the past 9 years.
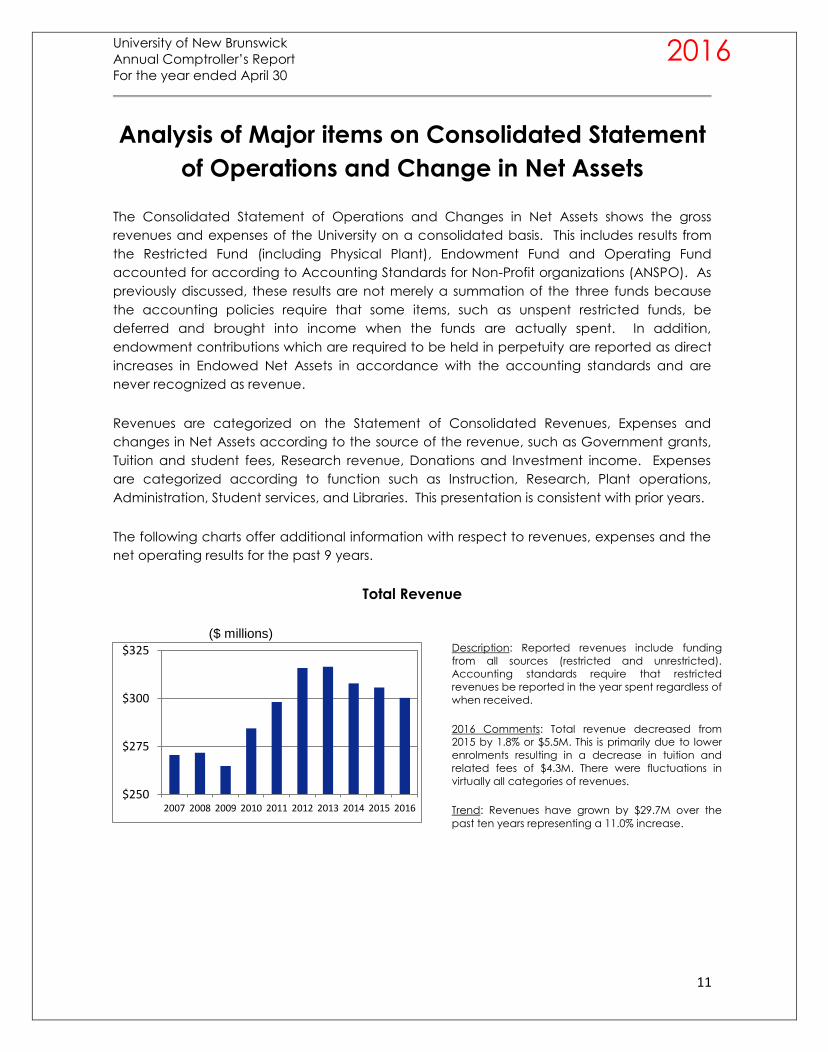
Total Revenue
($ millions)
$250
$275
$300
$325
2007 2008 2009 2010 2011 2012 2013 2014 2015 2016
Description: Reported revenues include funding
from all sources (restricted and unrestricted).
Accounting standards require that restricted
revenues be reported in the year spent regardless of
when received.
2016 Comments: Total revenue decreased from
2015 by 1.8% or $5.5M. This is primarily due to lower
enrolments resulting in a decrease in tuition and
related fees of $4.3M. There were fluctuations in
virtually all categories of revenues.
Trend: Revenues have grown by $29.7M over the
past ten years representing a 11.0% increase.
University of New Brunswick
Annual Comptroller’s Report
For the year ended April 30
12
2016
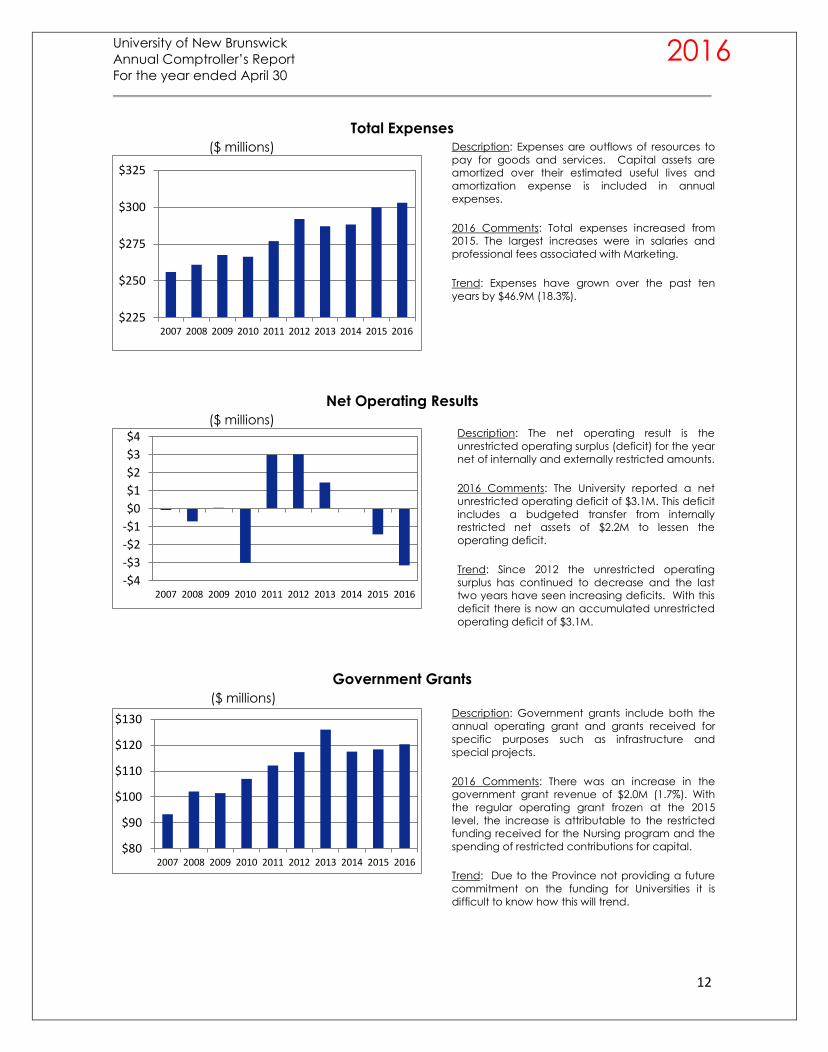
Total Expenses
($ millions)
Net Operating Results
($ millions)
Government Grants
$225
$250
$275
$300
$325
2007 2008 2009 2010 2011 2012 2013 2014 2015 2016
-$4
-$3
-$2
-$1
$0
$1
$2
$3
$4
2007 2008 2009 2010 2011 2012 2013 2014 2015 2016
$80
$90
$100
$110
$120
$130
2007 2008 2009 2010 2011 2012 2013 2014 2015 2016
($ millions)
Description: Expenses are outflows of resources to
pay for goods and services. Capital assets are
amortized over their estimated useful lives and
amortization expense is included in annual
expenses.
2016 Comments: Total expenses increased from
2015. The largest increases were in salaries and
professional fees associated with Marketing.
Trend: Expenses have grown over the past ten
years by $46.9M (18.3%).
Description: The net operating result is the
unrestricted operating surplus (deficit) for the year
net of internally and externally restricted amounts.
2016 Comments: The University reported a net
unrestricted operating deficit of $3.1M. This deficit
includes a budgeted transfer from internally
restricted net assets of $2.2M to lessen the
operating deficit.
Trend: Since 2012 the unrestricted operating
surplus has continued to decrease and the last
two years have seen increasing deficits. With this
deficit there is now an accumulated unrestricted
operating deficit of $3.1M.
Description: Government grants include both the
annual operating grant and grants received for
specific purposes such as infrastructure and
special projects.
2016 Comments: There was an increase in the
government grant revenue of $2.0M (1.7%). With
the regular operating grant frozen at the 2015
level, the increase is attributable to the restricted
funding received for the Nursing program and the
spending of restricted contributions for capital.
Trend: Due to the Province not providing a future
commitment on the funding for Universities it is
difficult to know how this will trend.
University of New Brunswick
Annual Comptroller’s Report
For the year ended April 30
13
2016
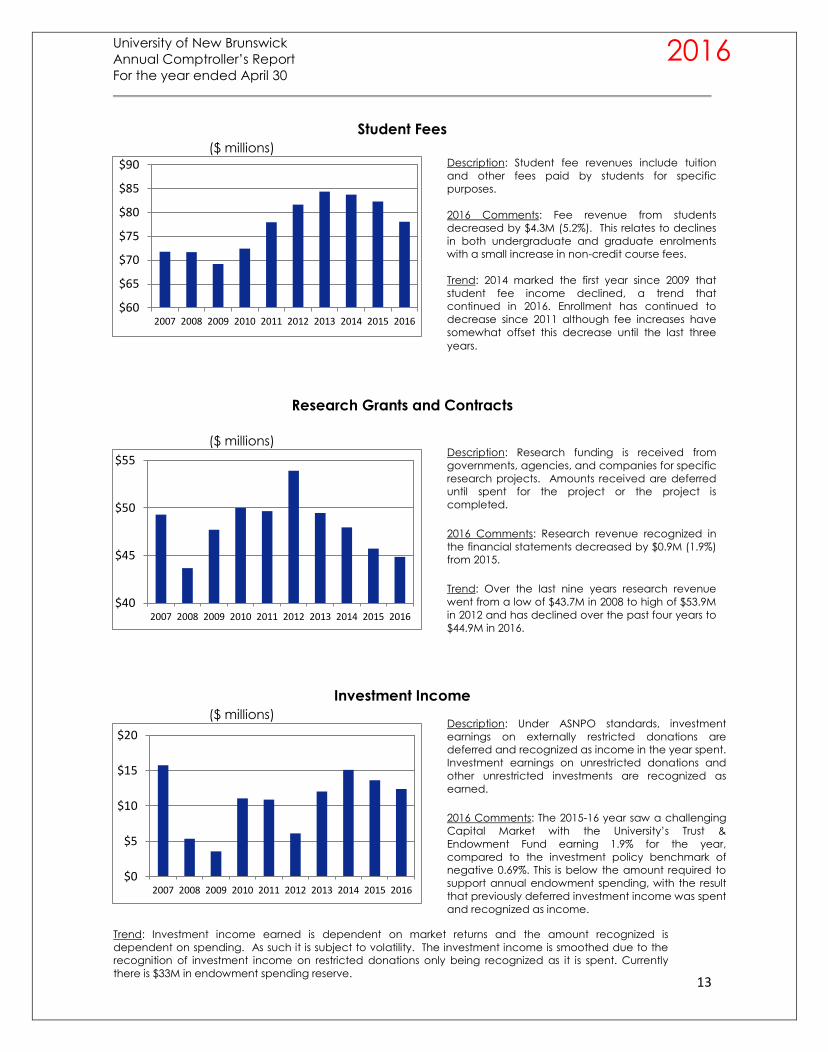
Student Fees
($ millions)
Research Grants and Contracts
($ millions)
Investment Income
($ millions)
$60
$65
$70
$75
$80
$85
$90
2007 2008 2009 2010 2011 2012 2013 2014 2015 2016
$40
$45
$50
$55
2007 2008 2009 2010 2011 2012 2013 2014 2015 2016
$0
$5
$10
$15
$20
2007 2008 2009 2010 2011 2012 2013 2014 2015 2016
Description: Under ASNPO standards, investment
earnings on externally restricted donations are
deferred and recognized as income in the year spent.
Investment earnings on unrestricted donations and
other unrestricted investments are recognized as
earned.
2016 Comments: The 2015-16 year saw a challenging
Capital Market with the University’s Trust &
Endowment Fund earning 1.9% for the year,
compared to the investment policy benchmark of
negative 0.69%. This is below the amount required to
support annual endowment spending, with the result
that previously deferred investment income was spent
and recognized as income.
Description: Student fee revenues include tuition
and other fees paid by students for specific
purposes.
2016 Comments: Fee revenue from students
decreased by $4.3M (5.2%). This relates to declines
in both undergraduate and graduate enrolments
with a small increase in non-credit course fees.
Trend: 2014 marked the first year since 2009 that
student fee income declined, a trend that
continued in 2016. Enrollment has continued to
decrease since 2011 although fee increases have
somewhat offset this decrease until the last three
years.
Description: Research funding is received from
governments, agencies, and companies for specific
research projects. Amounts received are deferred
until spent for the project or the project is
completed.
2016 Comments: Research revenue recognized in
the financial statements decreased by $0.9M (1.9%)
from 2015.
Trend: Over the last nine years research revenue
went from a low of $43.7M in 2008 to high of $53.9M
in 2012 and has declined over the past four years to
$44.9M in 2016.
Trend: Investment income earned is dependent on market returns and the amount recognized is
dependent on spending. As such it is subject to volatility. The investment income is smoothed due to the
recognition of investment income on restricted donations only being recognized as it is spent. Currently
there is $33M in endowment spending reserve.
University of New Brunswick
Annual Comptroller’s Report
For the year ended April 30
14
2016
Key Financial Indicators
Financial indicators have been developed as a quick assessment tool for use by
management and the Board to assess the financial position and condition of the University.
The following indicators have been selected by management as useful to assess a variety of
areas. Each indicator is briefly described below and analyzed in the context of the
University. Underlying financial statement amounts were restated in years prior to 2014 to
reflect the impact of an accounting standards change (2014) and the correction of the prior
period misstatement with respect to the classification of certain amounts as internally
restricted (2013).
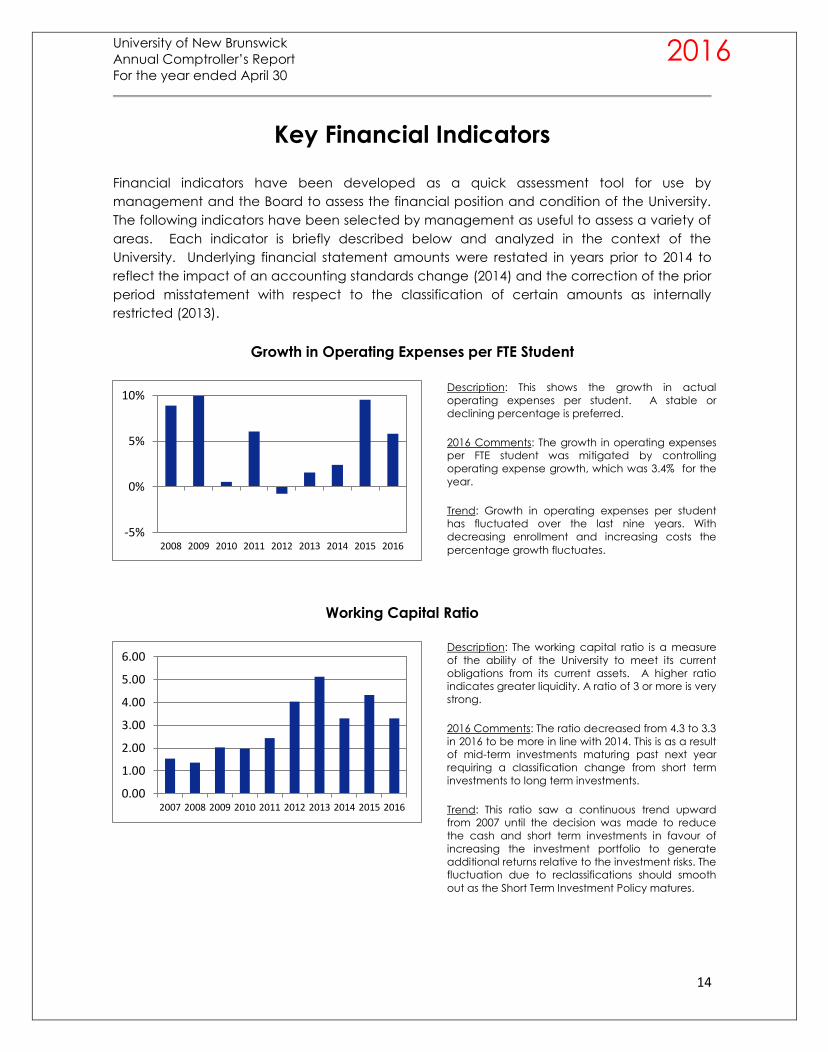
Growth in Operating Expenses per FTE Student
Working Capital Ratio
-5%
0%
5%
10%
2008 2009 2010 2011 2012 2013 2014 2015 2016
0.00
1.00
2.00
3.00
4.00
5.00
6.00
2007 2008 2009 2010 2011 2012 2013 2014 2015 2016
Description: This shows the growth in actual
operating expenses per student. A stable or
declining percentage is preferred.
2016 Comments: The growth in operating expenses
per FTE student was mitigated by controlling
operating expense growth, which was 3.4% for the
year.
Trend: Growth in operating expenses per student
has fluctuated over the last nine years. With
decreasing enrollment and increasing costs the
percentage growth fluctuates.
Description: The working capital ratio is a measure
of the ability of the University to meet its current
obligations from its current assets. A higher ratio
indicates greater liquidity. A ratio of 3 or more is very
strong.
2016 Comments: The ratio decreased from 4.3 to 3.3
in 2016 to be more in line with 2014. This is as a result
of mid-term investments maturing past next year
requiring a classification change from short term
investments to long term investments.
Trend: This ratio saw a continuous trend upward
from 2007 until the decision was made to reduce
the cash and short term investments in favour of
increasing the investment portfolio to generate
additional returns relative to the investment risks. The
fluctuation due to reclassifications should smooth
out as the Short Term Investment Policy matures.
University of New Brunswick
Annual Comptroller’s Report
For the year ended April 30
15
2016
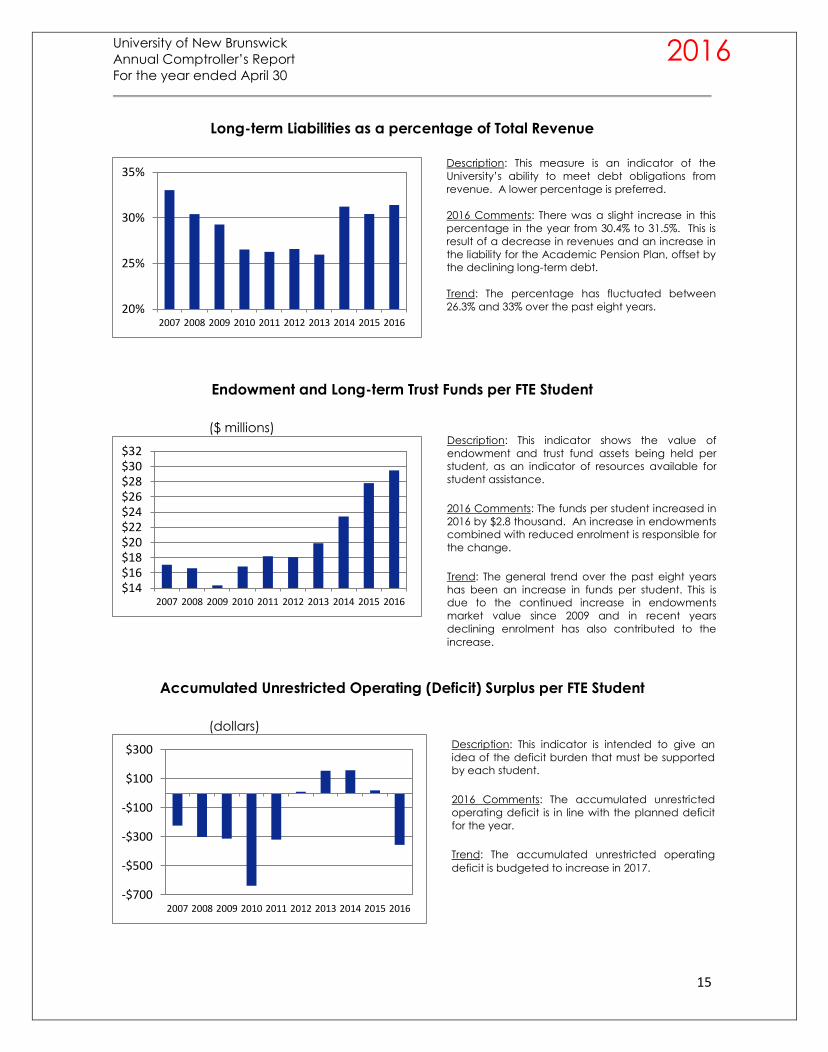
Long-term Liabilities as a percentage of Total Revenue
Endowment and Long-term Trust Funds per FTE Student
($ millions)
Accumulated Unrestricted Operating (Deficit) Surplus per FTE Student
(dollars)
20%
25%
30%
35%
2007 2008 2009 2010 2011 2012 2013 2014 2015 2016
$14$16$18$20$22$24$26$28$30$32
2007 2008 2009 2010 2011 2012 2013 2014 2015 2016
-$700
-$500
-$300
-$100
$100
$300
2007 2008 2009 2010 2011 2012 2013 2014 2015 2016
Description: This measure is an indicator of the
University’s ability to meet debt obligations from
revenue. A lower percentage is preferred.
2016 Comments: There was a slight increase in this
percentage in the year from 30.4% to 31.5%. This is
result of a decrease in revenues and an increase in
the liability for the Academic Pension Plan, offset by
the declining long-term debt.
Trend: The percentage has fluctuated between
26.3% and 33% over the past eight years.
Description: This indicator shows the value of
endowment and trust fund assets being held per
student, as an indicator of resources available for
student assistance.
2016 Comments: The funds per student increased in
2016 by $2.8 thousand. An increase in endowments
combined with reduced enrolment is responsible for
the change.
Trend: The general trend over the past eight years
has been an increase in funds per student. This is
due to the continued increase in endowments
market value since 2009 and in recent years
declining enrolment has also contributed to the
increase.
Description: This indicator is intended to give an
idea of the deficit burden that must be supported
by each student.
2016 Comments: The accumulated unrestricted
operating deficit is in line with the planned deficit
for the year.
Trend: The accumulated unrestricted operating
deficit is budgeted to increase in 2017.
University of New Brunswick
Annual Comptroller’s Report
For the year ended April 30
16
2016
Deferred Maintenance
Deferred maintenance (DM) refers to maintenance and repair activities that were not
performed when they should have been or were scheduled to be and which, therefore, put
off, or deferred, to a future period. Maintenance and repairs are activities directed toward
keeping capital assets in an acceptable condition. Activities include preventive
maintenance; replacement of parts, systems, or components; and other activities needed to
preserve or maintain the asset. Maintenance and repairs, as distinguished from capital
improvements, exclude activities directed towards expanding the capacity of an asset or
otherwise upgrading it to serve needs different from, or significantly greater than, its current
use. This indicator gives a picture of the condition of the capital assets and infrastructure of
the University with Canadian comparators. A high DM cost is an indicator of poor condition.
This measure is based on a cost per square foot.
As one of the oldest Universities in Canada, UNB is in a more challenging position than many
universities due to the age of many campus buildings. The University strategic plan
recognizes the importance of improving the condition of its capital assets and is developing
a long term capital plan to address the infrastructure issues in a sustainable manner.
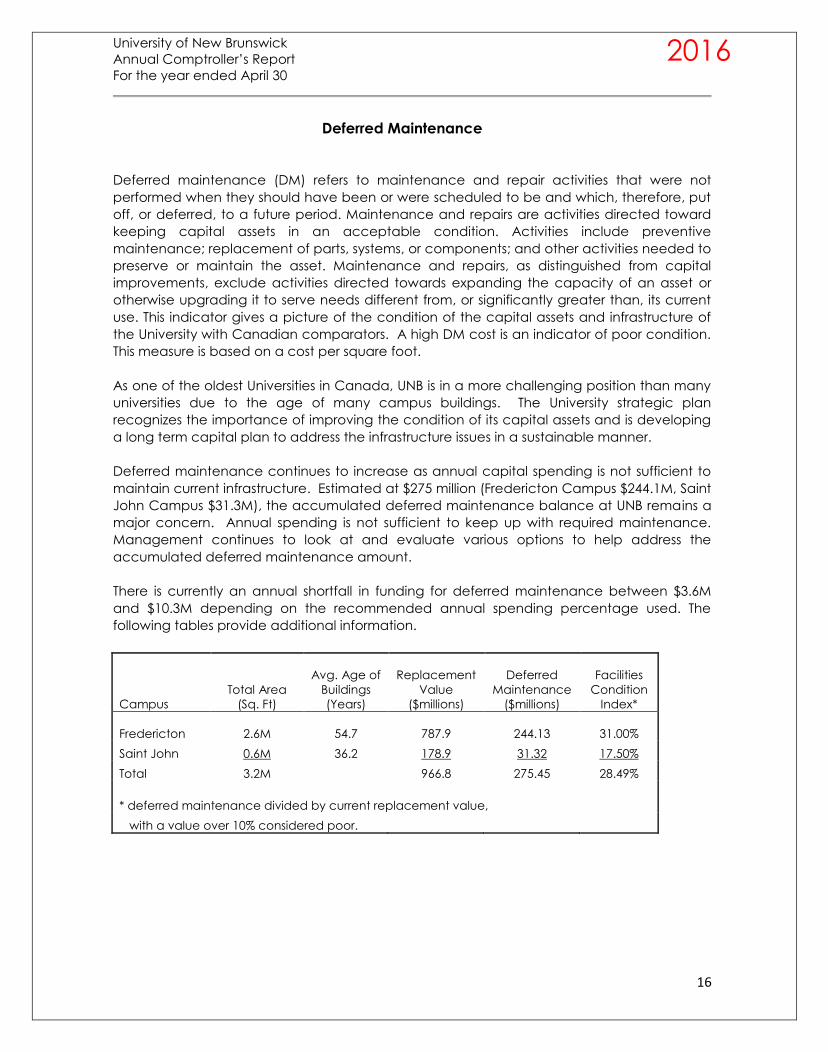
Deferred maintenance continues to increase as annual capital spending is not sufficient to
maintain current infrastructure. Estimated at $275 million (Fredericton Campus $244.1M, Saint
John Campus $31.3M), the accumulated deferred maintenance balance at UNB remains a
major concern. Annual spending is not sufficient to keep up with required maintenance.
Management continues to look at and evaluate various options to help address the
accumulated deferred maintenance amount.
There is currently an annual shortfall in funding for deferred maintenance between $3.6M
and $10.3M depending on the recommended annual spending percentage used. The
following tables provide additional information.
Campus
Total Area
(Sq. Ft)
Avg. Age of
Buildings
(Years)
Replacement
Value
($millions)
Deferred
Maintenance
($millions)
Facilities
Condition
Index*
Fredericton 2.6M 54.7 787.9 244.13 31.00%
Saint John 0.6M 36.2 178.9 31.32 17.50%
Total 3.2M
966.8 275.45 28.49%
* deferred maintenance divided by current replacement value,
with a value over 10% considered poor.
University of New Brunswick
Annual Comptroller’s Report
For the year ended April 30
17
2016
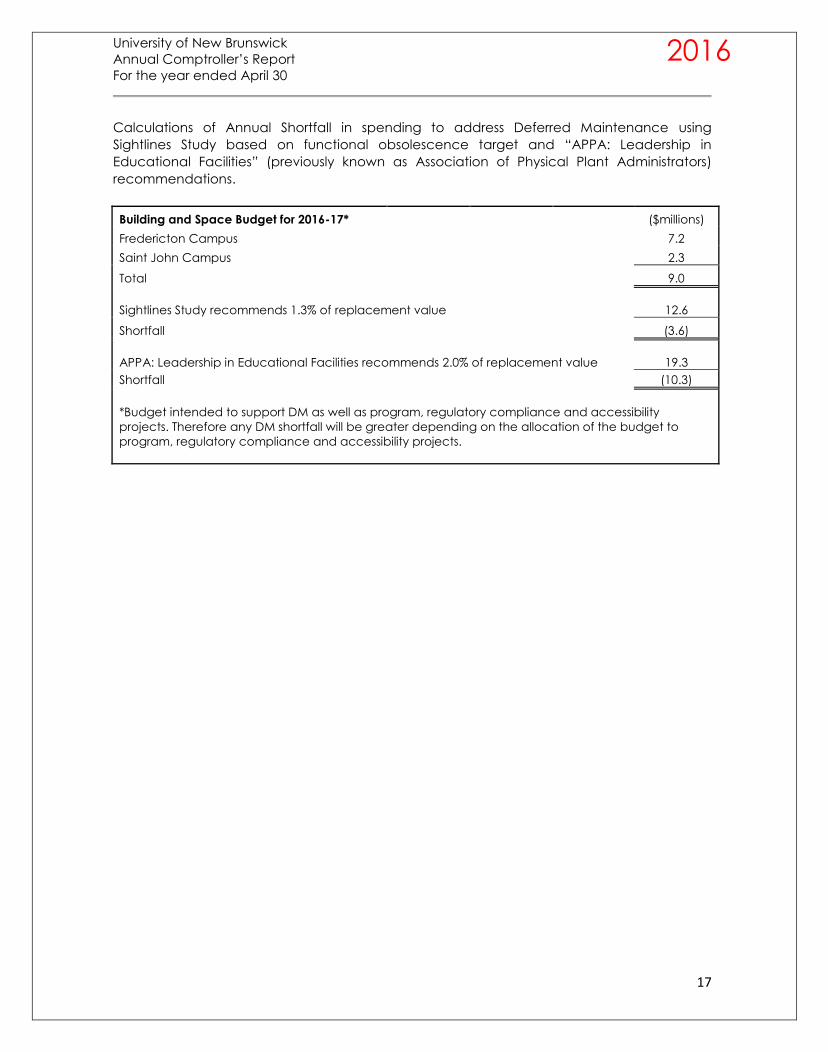
Calculations of Annual Shortfall in spending to address Deferred Maintenance using
Sightlines Study based on functional obsolescence target and “APPA: Leadership in
Educational Facilities” (previously known as Association of Physical Plant Administrators)
recommendations.
Building and Space Budget for 2016-17* ($millions)
Fredericton Campus
7.2
Saint John Campus
2.3
Total
9.0
Sightlines Study recommends 1.3% of replacement value
12.6
Shortfall
(3.6)
APPA: Leadership in Educational Facilities recommends 2.0% of replacement value 19.3
Shortfall
(10.3)
*Budget intended to support DM as well as program, regulatory compliance and accessibility
projects. Therefore any DM shortfall will be greater depending on the allocation of the budget to
program, regulatory compliance and accessibility projects.
University of New Brunswick
Annual Comptroller’s Report
For the year ended April 30
18
2016
Supplementary Information to the Notes to the
Financial Statements
Accounting for the Shared Risk Pension Plan
The former academic pension plan (AEPP) was converted to a shared risk plan (AESRP)
effective July 1, 2013 pursuant to an MOU signed March 31, 2014 by the AUNBT and UNB.
Under the AEPP both parties were only responsible for making contributions as agreed to
through the collective bargaining process with no liability to fund any deficit resting with UNB
parties agreed a change was required to make the plan sustainable in the future. The SRP
model was chosen because it provides some security over benefit payments to retirees while
also providing stability in contribution rates for both the employer and employees.
Because the plan is jointly governed by the University and the Faculty Association only 50% of
the actuarially determined plan deficit is recorded as a liability on the Statement of Financial
Position. Although the University does not “owe” this money to anyone, this is the accounting
treatment required under the standards as interpreted by the audit community in Canada.
Consistent with our accounting for non-pension employee benefit liabilities, this unfunded
amount has been disclosed separately in the Net assets section of the Statement of Financial
Position to identify that the liability is not funded. The University’s 50% share of the liability for
2016 is $20.6M which is an increase of $6.8 million from the 2015 liability.
In addition, accounting standards require that the actuarially determined annual expense
amount be reported partially on the Statement of Operations and partly as a direct charge
against net assets on the Statement of Financial Position. Note 23 to the financial statements
provides an overall summary of the plan, the expense and the liability.
Net Assets Restricted for Specific Purposes
As stated earlier, the University follows not-for-profit accounting standards as established by
the Chartered Professional Accountants of Canada (CPA Canada). These standards require
that funds received from external parties with restrictions on the spending of those funds be
accounted for differently than unrestricted funds. Externally restricted funds are reported as
deferred contributions and not recognized as revenue until the funds are spent for the
purpose specified by the external party. Funds with no external restrictions are recognized as
revenue immediately.
UNB, like almost all Canadian universities, places internal restrictions on some of the funds
received, or net operating surpluses earned, based on the priorities established by the Board,
management, faculties and departments. These are not external restrictions but they are still
binding as they have been approved by the governing body of the University – the Board of
Governors. These funds may be restricted according to a Board decision (for example
program fees, scholarships and bursaries, capital budget projects, risk mitigation reserves
and other University contingencies) or according to University policy or practice (operating
University of New Brunswick
Annual Comptroller’s Report
For the year ended April 30
19
2016
budget carry-forwards, contract overhead, surpluses in non-core operations).
From an accounting and reporting perspective, this means the amounts are first recognized
as revenue in the operating account and then internally restricted and reported as internally
restricted net assets on UNB’s Statement of Financial Position. Universities establish these
protocols in order to incent wise resource utilization; to provide a tool to facilitate long term
planning of programs and initiatives; to allow savings to accumulate over a number of years
to fund a project or initiative of a significant magnitude; to establish reserves to mitigate
against risks; as well as in recognition of the decentralized nature of many university
operations to promote self-sufficiency and budget management.
UNB has made efforts over the years to be transparent in disclosing the amount and nature
of both internally and externally restricted accounts. In the audited financial statements as
at 30 April 2016, UNB reported $127.3M in unspent deferred contributions (externally restricted
amounts received for specific purposes), $139.9M in deferred contribution invested in capital
assets (external funding for capital assets that is amortized to revenue over the life of the
asset the funds were used to acquire), $104.2M in internally restricted net assets (restricted by
Board of Governors policy or decision for specific purposes), and $139.5M in endowed net
assets ($128.8M externally endowed and $11.3M internally endowed). These funds must be
held in perpetuity with only investment income available for spending according to the
established criteria of the endowment.
Note 16 to the Consolidated Financial Statements presents the details of internally restricted
net assets. The presentation this is year is the same as was developed in 2012, with the
internally restricted net assets classified into eight categories. Total internally restricted net
assets at April 30, 2016 were $104.2M and at the end of the 2015 fiscal year totaled $107.4M.
Some additional information about the amounts in the various categories is provided below
as well as some details with respect to the types of items included in each category and
where the funds arose from.
Capital (2016 - $23.6M / 2015 - *$27.3M) –these funds come from various sources including
the operating account (budgeted), savings from the energy management program,
government grants, and Board of Governors decisions to internally restrict some operating
surplus monies in recent few years. This decision to restrict portions of past years’ operating
surpluses for capital purposes was made in an attempt to address the very serious issue of
accumulated deferred maintenance (ADM) at UNB which is currently estimated to be $275
million. The ADM is essentially the value of repairs, maintenance and replacement work
required to maintain the buildings and equipment on both campuses but was not done.
Internally restricted funds for capital purposes come from multiple sources.
* adjusted to correct misclassification of $448K in Scholarships, Bursaries and Awards that
should have been categorized as Capital last year.
University of New Brunswick
Annual Comptroller’s Report
For the year ended April 30
20
2016
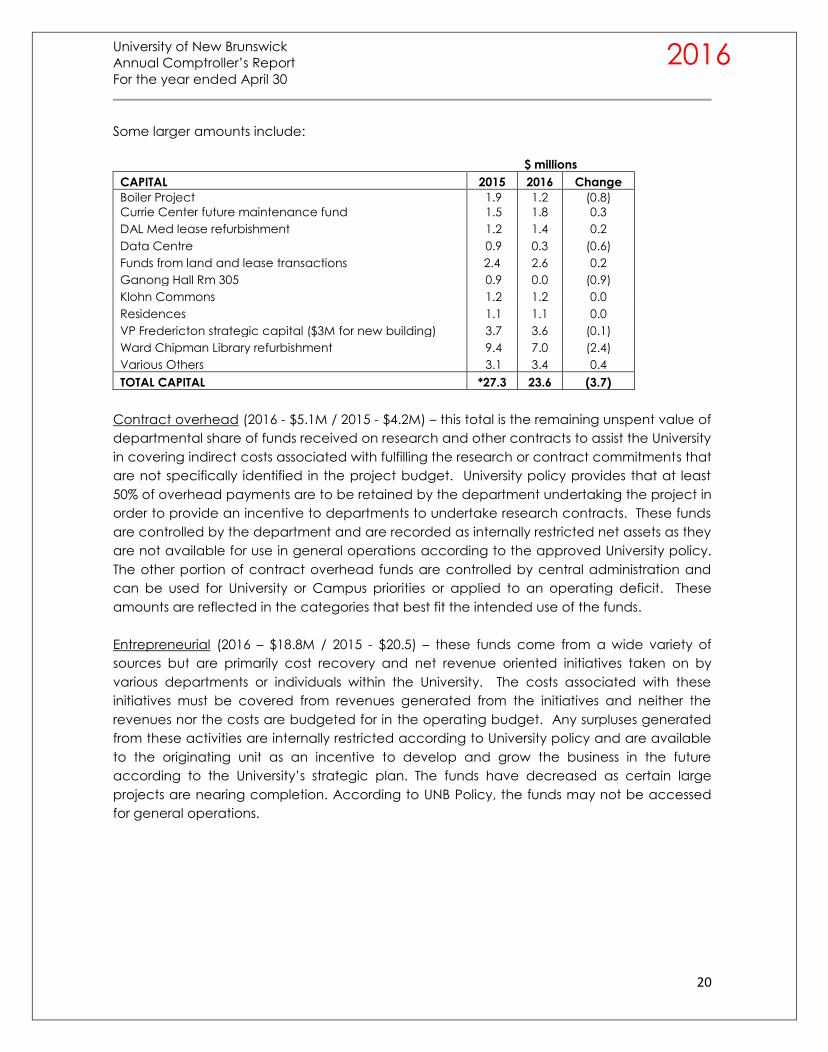
Some larger amounts include:
$ millions
CAPITAL 2015 2016 Change
Boiler Project
Currie Center future maintenance fund
1.9
1.5
1.2
1.8
(0.8)
0.3
DAL Med lease refurbishment 1.2 1.4 0.2
Data Centre 0.9 0.3 (0.6)
Funds from land and lease transactions 2.4 2.6 0.2
Ganong Hall Rm 305 0.9 0.0 (0.9)
Klohn Commons 1.2 1.2 0.0
Residences 1.1 1.1 0.0
VP Fredericton strategic capital ($3M for new building) 3.7 3.6 (0.1)
Ward Chipman Library refurbishment 9.4 7.0 (2.4)
Various Others 3.1 3.4 0.4
TOTAL CAPITAL *27.3 23.6 (3.7)
Contract overhead (2016 - $5.1M / 2015 - $4.2M) – this total is the remaining unspent value of
departmental share of funds received on research and other contracts to assist the University
in covering indirect costs associated with fulfilling the research or contract commitments that
are not specifically identified in the project budget. University policy provides that at least
50% of overhead payments are to be retained by the department undertaking the project in
order to provide an incentive to departments to undertake research contracts. These funds
are controlled by the department and are recorded as internally restricted net assets as they
are not available for use in general operations according to the approved University policy.
The other portion of contract overhead funds are controlled by central administration and
can be used for University or Campus priorities or applied to an operating deficit. These
amounts are reflected in the categories that best fit the intended use of the funds.
Entrepreneurial (2016 – $18.8M / 2015 - $20.5) – these funds come from a wide variety of
sources but are primarily cost recovery and net revenue oriented initiatives taken on by
various departments or individuals within the University. The costs associated with these
initiatives must be covered from revenues generated from the initiatives and neither the
revenues nor the costs are budgeted for in the operating budget. Any surpluses generated
from these activities are internally restricted according to University policy and are available
to the originating unit as an incentive to develop and grow the business in the future
according to the University’s strategic plan. The funds have decreased as certain large
projects are nearing completion. According to UNB Policy, the funds may not be accessed
for general operations.
University of New Brunswick
Annual Comptroller’s Report
For the year ended April 30
21
2016
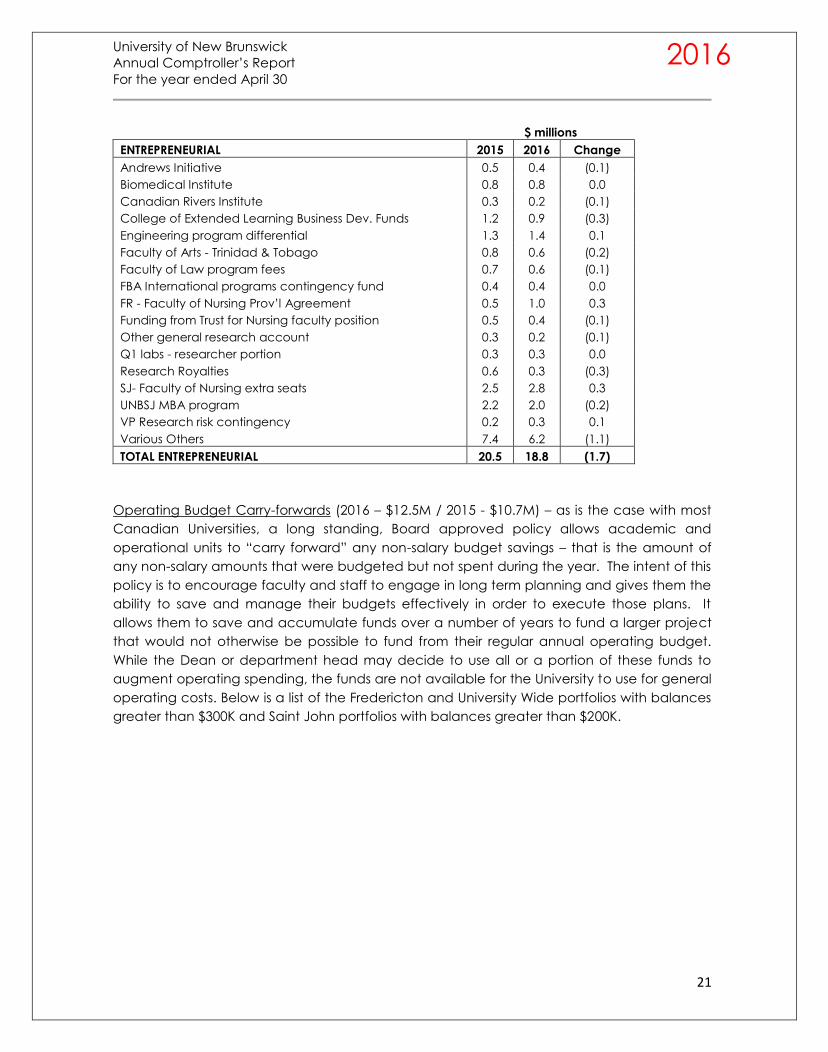
$ millions
ENTREPRENEURIAL 2015 2016 Change
Andrews Initiative 0.5 0.4 (0.1)
Biomedical Institute 0.8 0.8 0.0
Canadian Rivers Institute 0.3 0.2 (0.1)
College of Extended Learning Business Dev. Funds 1.2 0.9 (0.3)
Engineering program differential 1.3 1.4 0.1
Faculty of Arts - Trinidad & Tobago 0.8 0.6 (0.2)
Faculty of Law program fees 0.7 0.6 (0.1)
FBA International programs contingency fund 0.4 0.4 0.0
FR - Faculty of Nursing Prov’l Agreement 0.5 1.0 0.3
Funding from Trust for Nursing faculty position 0.5 0.4 (0.1)
Other general research account 0.3 0.2 (0.1)
Q1 labs - researcher portion 0.3 0.3 0.0
Research Royalties 0.6 0.3 (0.3)
SJ- Faculty of Nursing extra seats 2.5 2.8 0.3
UNBSJ MBA program 2.2 2.0 (0.2)
VP Research risk contingency 0.2 0.3 0.1
Various Others 7.4 6.2 (1.1)
TOTAL ENTREPRENEURIAL 20.5 18.8 (1.7)
Operating Budget Carry-forwards (2016 – $12.5M / 2015 - $10.7M) – as is the case with most
Canadian Universities, a long standing, Board approved policy allows academic and
operational units to “carry forward” any non-salary budget savings – that is the amount of
any non-salary amounts that were budgeted but not spent during the year. The intent of this
policy is to encourage faculty and staff to engage in long term planning and gives them the
ability to save and manage their budgets effectively in order to execute those plans. It
allows them to save and accumulate funds over a number of years to fund a larger project
that would not otherwise be possible to fund from their regular annual operating budget.
While the Dean or department head may decide to use all or a portion of these funds to
augment operating spending, the funds are not available for the University to use for general
operating costs. Below is a list of the Fredericton and University Wide portfolios with balances
greater than $300K and Saint John portfolios with balances greater than $200K.
University of New Brunswick
Annual Comptroller’s Report
For the year ended April 30
22
2016
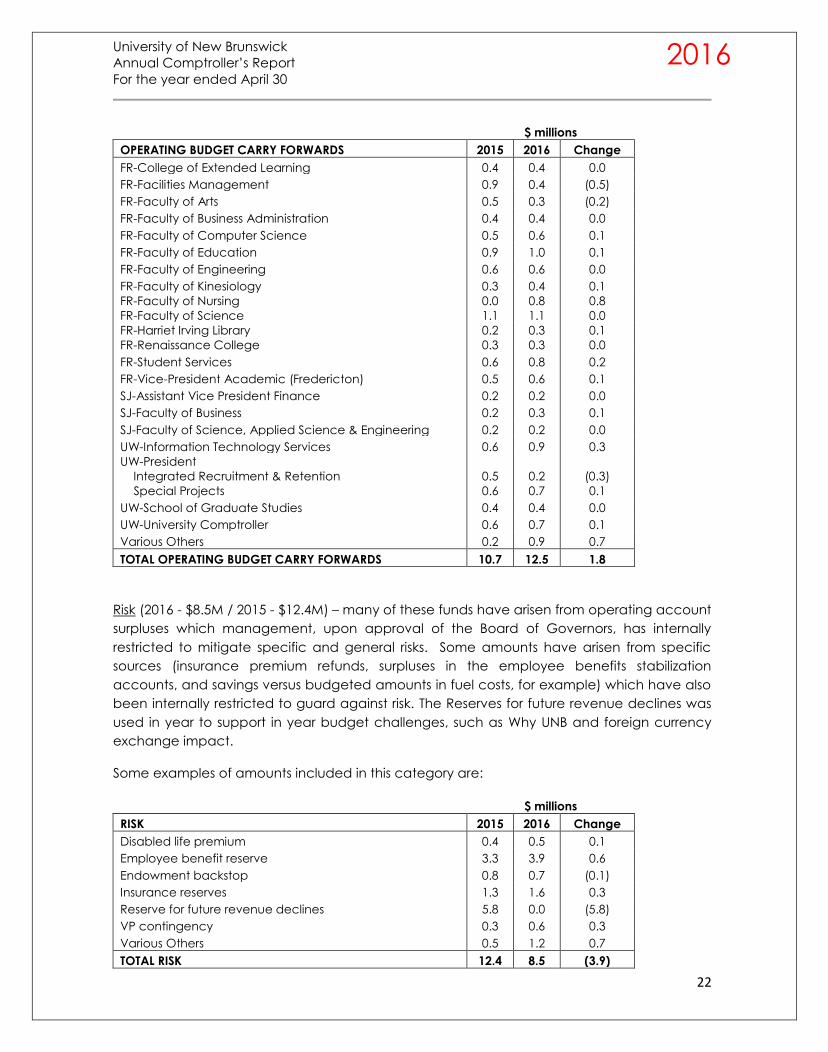
$ millions
OPERATING BUDGET CARRY FORWARDS 2015 2016 Change
FR-College of Extended Learning 0.4 0.4 0.0
FR-Facilities Management 0.9 0.4 (0.5)
FR-Faculty of Arts 0.5 0.3 (0.2)
FR-Faculty of Business Administration 0.4 0.4 0.0
FR-Faculty of Computer Science 0.5 0.6 0.1
FR-Faculty of Education 0.9 1.0 0.1
FR-Faculty of Engineering 0.6 0.6 0.0
FR-Faculty of Kinesiology 0.3 0.4 0.1
FR-Faculty of Nursing
FR-Faculty of Science
0.0
1.1
0.8
1.1
0.8
0.0
FR-Harriet Irving Library
FR-Renaissance College
0.2
0.3
0.3
0.3
0.1
0.0
FR-Student Services 0.6 0.8 0.2
FR-Vice-President Academic (Fredericton) 0.5 0.6 0.1
SJ-Assistant Vice President Finance 0.2 0.2 0.0
SJ-Faculty of Business 0.2 0.3 0.1
SJ-Faculty of Science, Applied Science & Engineering 0.2 0.2 0.0
UW-Information Technology Services 0.6 0.9 0.3
UW-President
Integrated Recruitment & Retention
Special Projects
0.5
0.6
0.2
0.7
(0.3)
0.1
UW-School of Graduate Studies 0.4 0.4 0.0
UW-University Comptroller 0.6 0.7 0.1
Various Others 0.2 0.9 0.7
TOTAL OPERATING BUDGET CARRY FORWARDS 10.7 12.5 1.8
Risk (2016 - $8.5M / 2015 - $12.4M) – many of these funds have arisen from operating account
surpluses which management, upon approval of the Board of Governors, has internally
restricted to mitigate specific and general risks. Some amounts have arisen from specific
sources (insurance premium refunds, surpluses in the employee benefits stabilization
accounts, and savings versus budgeted amounts in fuel costs, for example) which have also
been internally restricted to guard against risk. The Reserves for future revenue declines was
used in year to support in year budget challenges, such as Why UNB and foreign currency
exchange impact.
Some examples of amounts included in this category are:
$ millions
RISK 2015 2016 Change
Disabled life premium 0.4 0.5 0.1
Employee benefit reserve 3.3 3.9 0.6
Endowment backstop 0.8 0.7 (0.1)
Insurance reserves 1.3 1.6 0.3
Reserve for future revenue declines 5.8 0.0 (5.8)
VP contingency 0.3 0.6 0.3
Various Others 0.5 1.2 0.7
TOTAL RISK 12.4 8.5 (3.9)
University of New Brunswick
Annual Comptroller’s Report
For the year ended April 30
23
2016
Scholarships, Bursaries and Awards (2016 – $4.2M / 2015 - *$4.3M) – these amounts arose
partially from annual transfers from the operating account and partially from the proceeds
of property sales in past years. In both cases the funds represent decisions of management
and the Board to allocate funds for a specific purpose – in this case to augment scholarships
and bursaries funded from external restrictions and endowment accounts. Increasing funds
available for students is an objective in the strategic plan. These funds are not available for
general operating expenses.
* adjusted to correct misclassification of $448K in Scholarships, Bursaries and Awards that
should have been categorized as Capital last year.
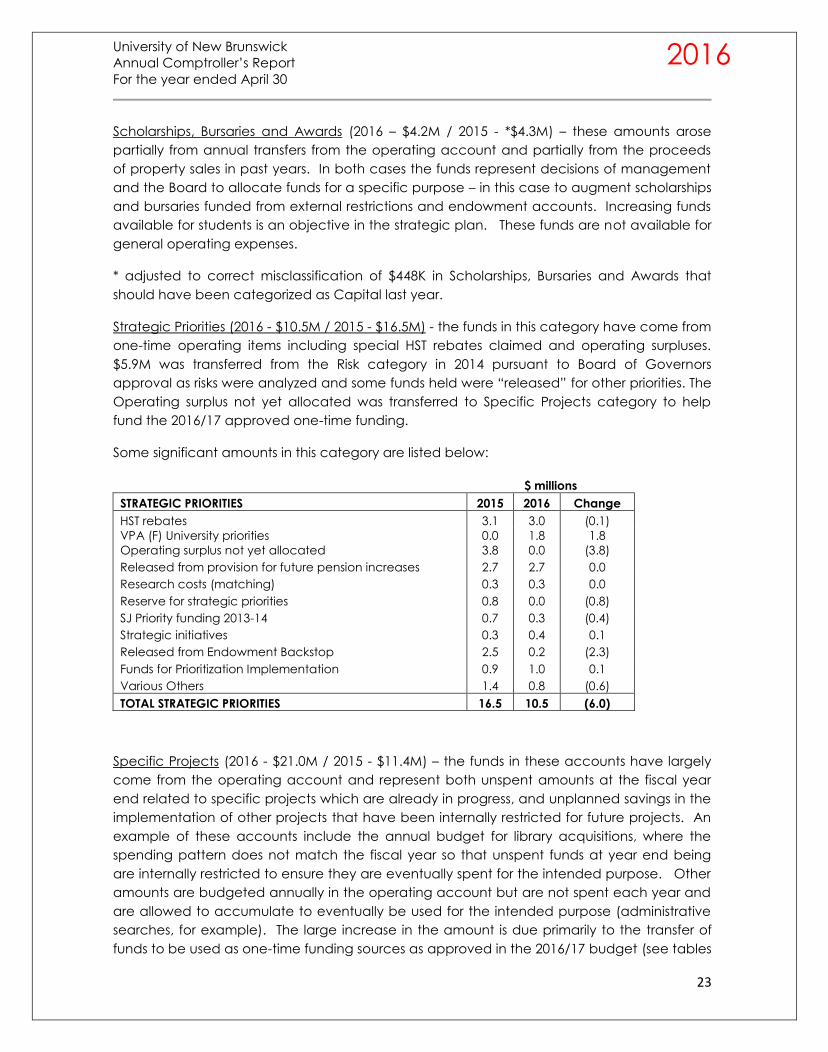
Strategic Priorities (2016 - $10.5M / 2015 - $16.5M) - the funds in this category have come from
one-time operating items including special HST rebates claimed and operating surpluses.
$5.9M was transferred from the Risk category in 2014 pursuant to Board of Governors
approval as risks were analyzed and some funds held were “released” for other priorities. The
Operating surplus not yet allocated was transferred to Specific Projects category to help
fund the 2016/17 approved one-time funding.
Some significant amounts in this category are listed below:
$ millions
STRATEGIC PRIORITIES 2015 2016 Change
HST rebates 3.1 3.0 (0.1)
VPA (F) University priorities
Operating surplus not yet allocated
0.0
3.8
1.8
0.0
1.8
(3.8)
Released from provision for future pension increases 2.7 2.7 0.0
Research costs (matching) 0.3 0.3 0.0
Reserve for strategic priorities 0.8 0.0 (0.8)
SJ Priority funding 2013-14 0.7 0.3 (0.4)
Strategic initiatives 0.3 0.4 0.1
Released from Endowment Backstop 2.5 0.2 (2.3)
Funds for Prioritization Implementation 0.9 1.0 0.1
Various Others 1.4 0.8 (0.6)
TOTAL STRATEGIC PRIORITIES 16.5 10.5 (6.0)
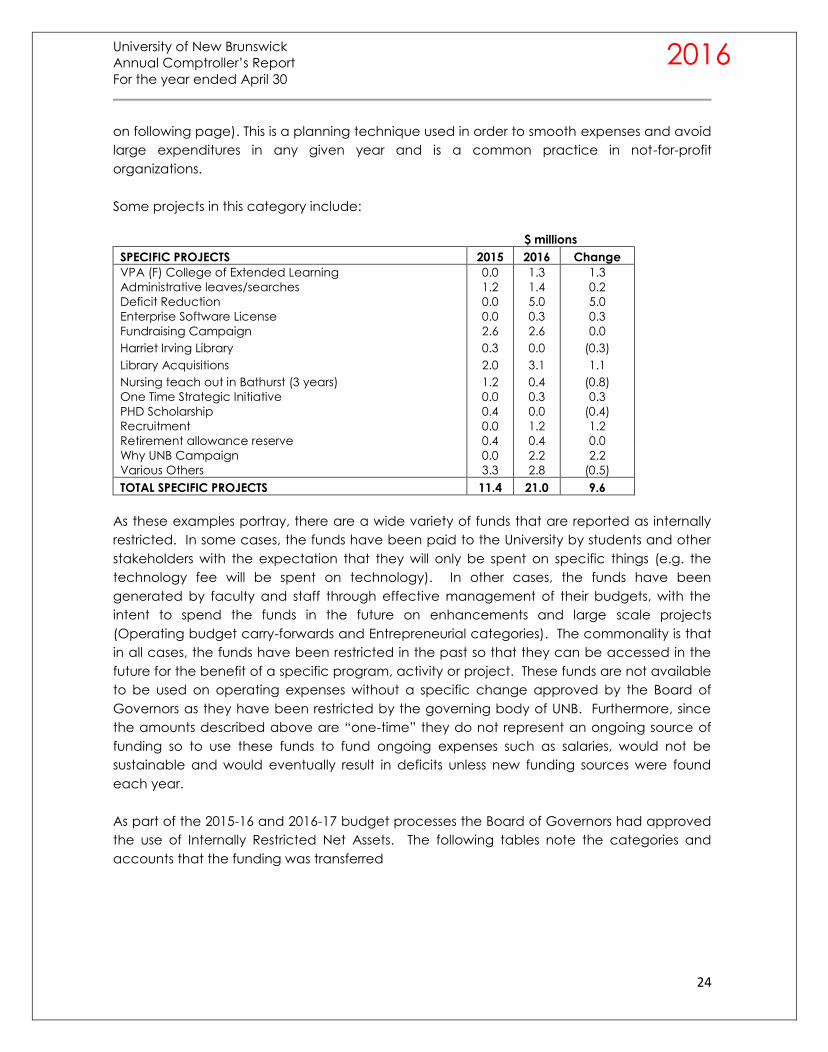
Specific Projects (2016 - $21.0M / 2015 - $11.4M) – the funds in these accounts have largely
come from the operating account and represent both unspent amounts at the fiscal year
end related to specific projects which are already in progress, and unplanned savings in the
implementation of other projects that have been internally restricted for future projects. An
example of these accounts include the annual budget for library acquisitions, where the
spending pattern does not match the fiscal year so that unspent funds at year end being
are internally restricted to ensure they are eventually spent for the intended purpose. Other
amounts are budgeted annually in the operating account but are not spent each year and
are allowed to accumulate to eventually be used for the intended purpose (administrative
searches, for example). The large increase in the amount is due primarily to the transfer of
funds to be used as one-time funding sources as approved in the 2016/17 budget (see tables
University of New Brunswick
Annual Comptroller’s Report
For the year ended April 30
24
2016
on following page). This is a planning technique used in order to smooth expenses and avoid
large expenditures in any given year and is a common practice in not-for-profit
organizations.
Some projects in this category include:
$ millions
SPECIFIC PROJECTS 2015 2016 Change
VPA (F) College of Extended Learning
Administrative leaves/searches
0.0
1.2
1.3
1.4
1.3
0.2
Deficit Reduction
Enterprise Software License
Fundraising Campaign
0.0
0.0
2.6
5.0
0.3
2.6
5.0
0.3
0.0
Harriet Irving Library 0.3 0.0 (0.3)
Library Acquisitions 2.0 3.1 1.1
Nursing teach out in Bathurst (3 years) 1.2 0.4 (0.8)
One Time Strategic Initiative
PHD Scholarship
0.0
0.4
0.3
0.0
0.3
(0.4)
Recruitment
Retirement allowance reserve
0.0
0.4
1.2
0.4
1.2
0.0
Why UNB Campaign
Various Others
0.0
3.3
2.2
2.8
2.2
(0.5)
TOTAL SPECIFIC PROJECTS 11.4 21.0 9.6
As these examples portray, there are a wide variety of funds that are reported as internally
restricted. In some cases, the funds have been paid to the University by students and other
stakeholders with the expectation that they will only be spent on specific things (e.g. the
technology fee will be spent on technology). In other cases, the funds have been
generated by faculty and staff through effective management of their budgets, with the
intent to spend the funds in the future on enhancements and large scale projects
(Operating budget carry-forwards and Entrepreneurial categories). The commonality is that
in all cases, the funds have been restricted in the past so that they can be accessed in the
future for the benefit of a specific program, activity or project. These funds are not available
to be used on operating expenses without a specific change approved by the Board of
Governors as they have been restricted by the governing body of UNB. Furthermore, since
the amounts described above are “one-time” they do not represent an ongoing source of
funding so to use these funds to fund ongoing expenses such as salaries, would not be
sustainable and would eventually result in deficits unless new funding sources were found
each year.
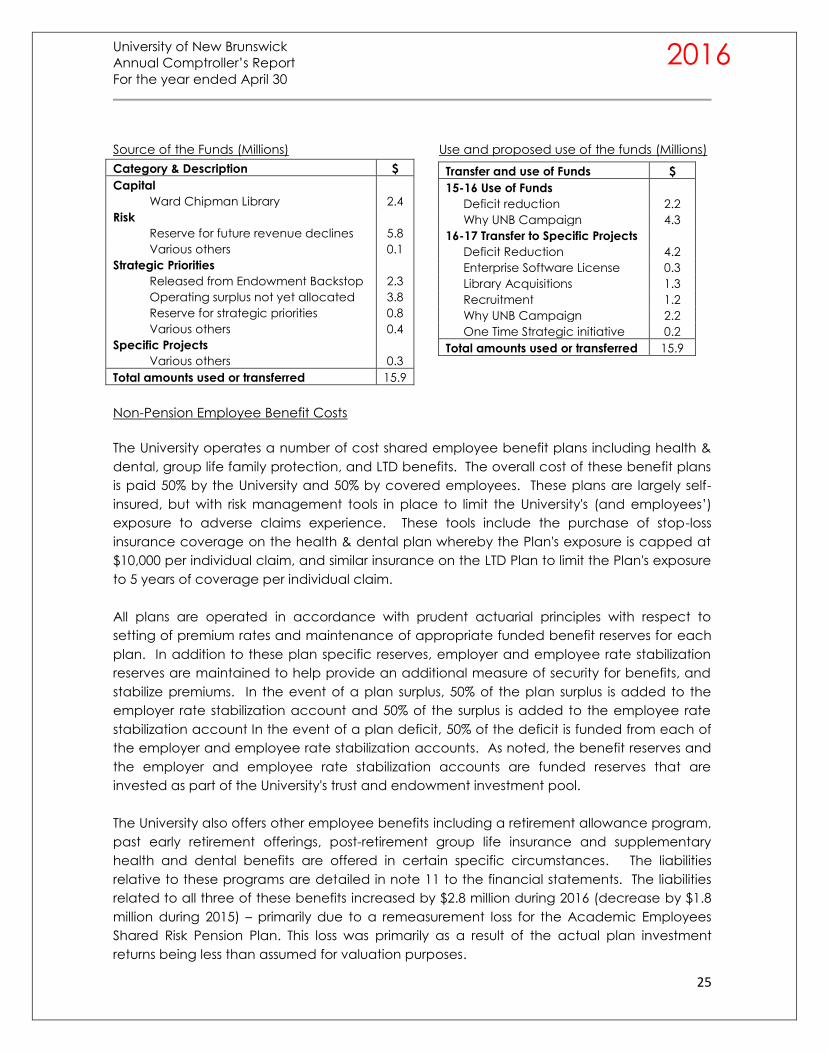
As part of the 2015-16 and 2016-17 budget processes the Board of Governors had approved
the use of Internally Restricted Net Assets. The following tables note the categories and
accounts that the funding was transferred
University of New Brunswick
Annual Comptroller’s Report
For the year ended April 30
25
2016
Source of the Funds (Millions) Use and proposed use of the funds (Millions)
Non-Pension Employee Benefit Costs
The University operates a number of cost shared employee benefit plans including health &
dental, group life family protection, and LTD benefits. The overall cost of these benefit plans
is paid 50% by the University and 50% by covered employees. These plans are largely self-
insured, but with risk management tools in place to limit the University's (and employees’)
exposure to adverse claims experience. These tools include the purchase of stop-loss
insurance coverage on the health & dental plan whereby the Plan's exposure is capped at
$10,000 per individual claim, and similar insurance on the LTD Plan to limit the Plan's exposure
to 5 years of coverage per individual claim.
All plans are operated in accordance with prudent actuarial principles with respect to
setting of premium rates and maintenance of appropriate funded benefit reserves for each
plan. In addition to these plan specific reserves, employer and employee rate stabilization
reserves are maintained to help provide an additional measure of security for benefits, and
stabilize premiums. In the event of a plan surplus, 50% of the plan surplus is added to the
employer rate stabilization account and 50% of the surplus is added to the employee rate
stabilization account In the event of a plan deficit, 50% of the deficit is funded from each of
the employer and employee rate stabilization accounts. As noted, the benefit reserves and
the employer and employee rate stabilization accounts are funded reserves that are
invested as part of the University's trust and endowment investment pool.
The University also offers other employee benefits including a retirement allowance program,
past early retirement offerings, post-retirement group life insurance and supplementary
health and dental benefits are offered in certain specific circumstances. The liabilities
relative to these programs are detailed in note 11 to the financial statements. The liabilities
related to all three of these benefits increased by $2.8 million during 2016 (decrease by $1.8
million during 2015) – primarily due to a remeasurement loss for the Academic Employees
Shared Risk Pension Plan. This loss was primarily as a result of the actual plan investment
returns being less than assumed for valuation purposes.
Category & Description $
Capital
Ward Chipman Library 2.4
Risk
Reserve for future revenue declines 5.8
Various others 0.1
Strategic Priorities
Released from Endowment Backstop 2.3
Operating surplus not yet allocated 3.8
Reserve for strategic priorities 0.8
Various others 0.4
Specific Projects
Various others 0.3
Total amounts used or transferred 15.9
Transfer and use of Funds $
15-16 Use of Funds
Deficit reduction 2.2
Why UNB Campaign 4.3
16-17 Transfer to Specific Projects
Deficit Reduction 4.2
Enterprise Software License 0.3
Library Acquisitions 1.3
Recruitment 1.2
Why UNB Campaign 2.2
One Time Strategic initiative 0.2
Total amounts used or transferred 15.9