Embed Size (px)
Citation preview
WILLIAM C. THOMPSON, JR. Comptroller
Deputy Comptroller / Chief of Staff First Deputy Comptroller Gayle M. Horwitz Adam M. Blumenthal Deputy Comptroller for Policy, Audit, Deputy Comptroller for BudgetContracts and Accountancy Andrew M. Joseph Greg Brooks
Deputy Comptroller for External Relations Budget Chief Eduardo Castell Eng-Kai Tan Chief Economist Project Coordinator John Tepper Marlin Manny Kwan Bureau Chief Assistant Director Tina Lubin Robert DeLaurentis
Staff Kettly Bastien Amitabha Basu Millicent Budhai Rosa Charles Basil Duncan Peter E. Flynn Michele Griffin Debbie Gutierrez Michael Hecht Farid Heydarpour Dahong Huang Hope Lendzian Irina Livshits Marcia Murphy Andrew Rosenthal Michael Zhang
TABLE OF CONTENTS
I. EXECUTIVE SUMMARY................................................................................................................................... iii
II. ADDRESSING THE OUTYEAR GAPS ........................................................................................................4 A. OUTYEAR RISKS .............................................................................................................................................6
Revenue Risks .......................................................................................................................................................6 Expenditure Risks .................................................................................................................................................7
III. THE STATE OF THE CITY’S ECONOMY .....................................................................................................8 A. THE U.S. ECONOMY .......................................................................................................................................8 B. THE NEW YORK CITY ECONOMY ...............................................................................................................8 C. FORECASTS OF THE U.S. AND NYC ECONOMIES ....................................................................................9
United States.........................................................................................................................................................9 New York City – Comptroller’s Office’s Forecast for 2004 through 2008........................................................10 New York City – Comments on the City’s Forecast............................................................................................10
IV. THE FYS 2005-2008 FINANCIAL PLAN .......................................................................................................12 A. REVENUE OUTLOOK....................................................................................................................................14
Tax Revenues ......................................................................................................................................................14 Miscellaneous Revenues .....................................................................................................................................18 Intergovernmental Aid ........................................................................................................................................20
B. EXPENDITURES..............................................................................................................................................21 Overtime .............................................................................................................................................................21 Pensions..............................................................................................................................................................24 Health Insurance ................................................................................................................................................27 Labor ..................................................................................................................................................................29 Judgments and Claims........................................................................................................................................30 Medical Assistance .............................................................................................................................................31 Public Assistance................................................................................................................................................33 Department of Education....................................................................................................................................34 Health and Hospitals Corporation .....................................................................................................................35 Debt Service........................................................................................................................................................36 Capital Plan........................................................................................................................................................39
APPENDIX – REVENUE AND EXPENDITURE DETAILS ...............................................................................41
GLOSSARY OF ACRONYMS ................................................................................................................................45
LISTS OF TABLES
TABLE 1. FYS 2005-2008 FINANCIAL PLAN................................................................................................ 1 TABLE 2. PLAN-TO-PLAN CHANGES, APRIL MODIFICATION VS. JUNE FINANCIAL PLAN ............................. 2 TABLE 3. FYS 2005-2008 FINANCIAL PLAN RISKS AND OFFSETS ............................................................... 3 TABLE 4. THE CITY’S PROPOSED FEDERAL AND STATE INITIATIVES THAT ADDRESS MAJOR
SPENDING GROWTH AREAS......................................................................................................... 6 TABLE 5. PROJECTED REAL GDP, PERCENT CHANGE, 2004-2008 ............................................................ 10 TABLE 6. FORECASTS OF PAYROLL JOBS, PERCENT CHANGE, 2004-2008 ................................................. 10 TABLE 7. NYC, PROJECTED REAL GCP AND PAYROLL JOBS, 2004-2008 ................................................. 10 TABLE 8. PROJECTED NYC GCP, PERCENT CHANGE, 2004-2008............................................................. 11 TABLE 9. PROJECTED PAYROLL JOBS, CHANGE IN THOUSANDS, 2004-2008............................................. 11 TABLE 10. PROJECTED REVENUE GROWTH ................................................................................................. 12 TABLE 11. PROJECTED EXPENDITURE GROWTH .......................................................................................... 13 TABLE 12. TAX REVENUE CHANGES FROM THE EXECUTIVE BUDGET, FYS 2005-2008............................... 14 TABLE 13. FORECAST TOTAL AND AVERAGE ANNUAL TAX REVENUE GROWTH, ADJUSTED AND
UNADJUSTED, FYS 2005-2008................................................................................................... 16 TABLE 14. FORECAST PROPORTION OF TOTAL TAX-REVENUE GROWTH AND ANNUAL CHANGES
FYS 2005-2008........................................................................................................................... 17 TABLE 15. FY 2005 PROPERTY VALUE GROWTH ........................................................................................ 18 TABLE 16. PROJECTED OVERTIME SPENDING, FY 2005 ............................................................................... 22 TABLE 17. UNIFORMED OVERTIME COSTS, FYS 1993-2004......................................................................... 24 TABLE 18. THE CITY’S PENSION CONTRIBUTIONS........................................................................................ 24 TABLE 19. THE CITY’S HEALTH INSURANCE EXPENDITURES (INCLUDING DOE AND CUNY) ..................... 28 TABLE 20. PERSONAL SERVICES EXPENDITURES, FYS 2005-08 ................................................................... 30 TABLE 21. DEBT SERVICE COSTS, FYS 2005-2008....................................................................................... 38
TABLE A1. FY 2005 ADOPTED BUDGET REVENUE DETAIL.......................................................................... 41 TABLE A2. FY 2005 ADOPTED BUDGET EXPENDITURE DETAIL................................................................... 43
LISTS OF CHARTS
CHART 1. CHANGES IN JOBS BY INDUSTRY SECTOR, DECEMBER 2003 TO MAY 2004, IN THOUSANDS......... 9 CHART 2. YEAR-OVER-YEAR CHANGE IN PIT COLLECTIONS ADJUSTED AND UNADJUSTED
FOR THE RATE INCREASE IN FY 2004 ...................................................................................... 15 CHART 3. YEAR-OVER-YEAR CHANGE IN SALES TAX REVENUE COLLECTIONS ADJUSTED
AND UNADJUSTED FOR POLICY CHANGES IN FY 2004............................................................. 16 CHART 4. MISCELLANEOUS REVENUE FORECAST ...................................................................................... 19 CHART 5. OVERTIME EXPENDITURES – ADOPTED VS. ACTUAL.................................................................. 23 CHART 6. THE CITY’S PENSION COSTS ....................................................................................................... 25 CHART 7. HEALTH EXPENDITURE IN DOLLARS AND AS A PERCENT OF TOTAL CITY EXPENDITURES ......... 28 CHART 8. HEALTH INSURANCE RATES AND NUMBERS OF EMPLOYEES AND RETIREES COVERED ............. 29 CHART 9. JUDGMENTS AND CLAIMS, FY 1993 TO FY 2003 ....................................................................... 31 CHART 10. GROWTH IN THE CITY’S MEDICAID SPENDING SINCE FY 1995 ...................................................... 32 CHART 11. TOTAL DEBT SERVICE AS PERCENT OF TAX REVENUES, FYS 1994-2014 ........................................ 37
ii
I. Executive Summary
The City has adopted a Fiscal Year 2005 budget that is likely to end the year in balance. The revenue and expenditure projections are reasonable estimates and the level of reserves available to the City appear to be sufficient to offset the risks previously identified by the Comptroller’s Office. However, the out-years of the Financial Plan continue to contain multi-billion dollar deficits because the City’s expenses continue to outpace the growth of its revenues.
In late June, the Mayor and the City Council adopted a $47.8 billion budget for FY 2005. To achieve budget balance, the City is utilizing $3 billion in non-recurring resources. These items include $1.9 billion in rolled-over budget surplus from Fiscal Year 2004, an expected lump-sum payment of $690 million from the Port Authority of New York and New Jersey as a result of a new lease agreement for City airports, a $502 million reimbursement to the City for Municipal Assistance Corporation debt service, and $150 million from the Battery Park City Authority for the sale of City-owned properties. The use of these non-recurring resources does not address the underlying imbalance between revenues and expenditures in FY 2005.
The reliance on non-recurring resources to balance the budget creates greater challenges for the City for Fiscal Year 2006 through 2008. The Comptroller’s Office projects a stronger economy with tax revenue forecasts projected to grow by 12.1 percent over the financial plan period. This growth is significantly higher than the 7.6 percent growth in expenditures. However, tax revenues account for only about sixty percent of the funds necessary to support City spending. Since non-tax revenues, such as federal and state aid, will likely remain unchanged over the term of the Financial Plan, the City will be confronted with persistent budget gaps despite a stabilized economic outlook.
The City Administration projects deficits of $3.7 billion in FY 2006, $4.5 billion in FY 2007, and $3.7 billion in FY 2008. To overcome these challenges, the City must devise a long-term financial plan that includes recurring savings and stable growth in revenues. The City has taken an important step in this regard by re-establishing a Budget Stabilization Account (BSA) for FY 2006. However, the BSA contains just $220 million, which will do little to mitigate the projected FY 2006 budget deficit. For the BSA to serve as an effective means of balancing the FY 2006 budget, the City should increase the funds in the BSA throughout FY 2005.
It is essential that we address fluctuations in the City’s pension fund contributions. The value of assets invested in the City’s pension funds tracks yearly changes in the financial markets. As a result, the high level of market volatility over the past decade created significant fluctuations in the level of annual pension contributions. Adjusting the method by which the City recognizes gains and losses in its pension investments may reduce its exposure to this market volatility. This adjustment is especially important because pension expenses tend to increase when City revenues decline.
iii
Another challenge concerns the City’s management of its capital plan. In FY 2005 alone, the City will make $4.46 billion in debt service payments, consuming 16 percent of local tax revenues. We must recognize that today’s capital commitments are financial liabilities for the future. Although the City must make necessary infrastructure improvements and other capital investments, it cannot borrow more than it can afford to pay. Striking a balance between these two needs is absolutely crucial for the City’s future.
The City’s budget situation is not as dire as it was two years ago. Nevertheless, the City must take immediate action to chart a prudent and responsible course to avert significant fiscal challenges in FY 2006.
iv
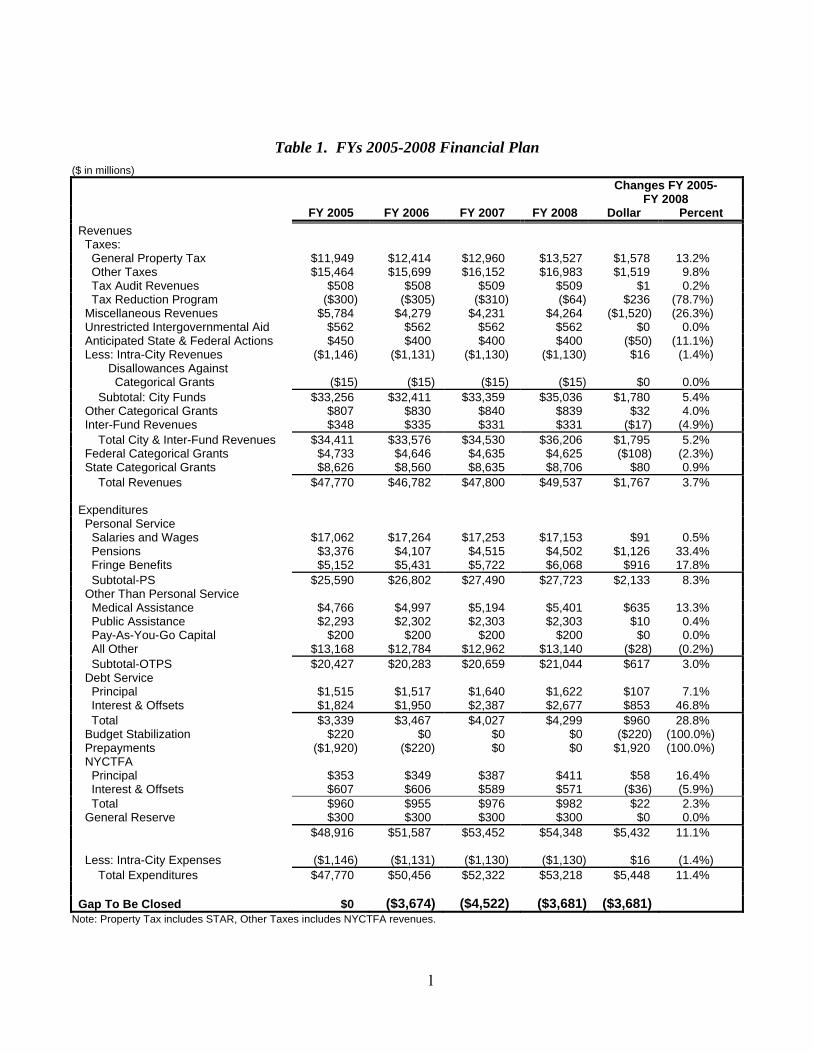
Table 1. FYs 2005-2008 Financial Plan ($ in millions)
Changes FY 2005- FY 2008
FY 2005 FY 2006 FY 2007 FY 2008 Dollar Percent Revenues Taxes: General Property Tax $11,949 $12,414 $12,960 $13,527 $1,578 13.2% Other Taxes $15,464 $15,699 $16,152 $16,983 $1,519 9.8% Tax Audit Revenues $508 $508 $509 $509 $1 0.2% Tax Reduction Program ($300) ($305) ($310) ($64) $236 (78.7%) Miscellaneous Revenues $5,784 $4,279 $4,231 $4,264 ($1,520) (26.3%) Unrestricted Intergovernmental Aid $562 $562 $562 $562 $0 0.0% Anticipated State & Federal Actions $450 $400 $400 $400 ($50) (11.1%) Less: Intra-City Revenues ($1,146) ($1,131) ($1,130) ($1,130) $16 (1.4%) Disallowances Against Categorical Grants ($15) ($15) ($15) ($15) $0 0.0% Subtotal: City Funds $33,256 $32,411 $33,359 $35,036 $1,780 5.4% Other Categorical Grants $807 $830 $840 $839 $32 4.0% Inter-Fund Revenues $348 $335 $331 $331 ($17) (4.9%) Total City & Inter-Fund Revenues $34,411 $33,576 $34,530 $36,206 $1,795 5.2% Federal Categorical Grants $4,733 $4,646 $4,635 $4,625 ($108) (2.3%) State Categorical Grants $8,626 $8,560 $8,635 $8,706 $80 0.9% Total Revenues $47,770 $46,782 $47,800 $49,537 $1,767 3.7% Expenditures Personal Service Salaries and Wages $17,062 $17,264 $17,253 $17,153 $91 0.5% Pensions $3,376 $4,107 $4,515 $4,502 $1,126 33.4% Fringe Benefits $5,152 $5,431 $5,722 $6,068 $916 17.8% Subtotal-PS $25,590 $26,802 $27,490 $27,723 $2,133 8.3% Other Than Personal Service Medical Assistance $4,766 $4,997 $5,194 $5,401 $635 13.3% Public Assistance $2,293 $2,302 $2,303 $2,303 $10 0.4% Pay-As-You-Go Capital $200 $200 $200 $200 $0 0.0% All Other $13,168 $12,784 $12,962 $13,140 ($28) (0.2%) Subtotal-OTPS $20,427 $20,283 $20,659 $21,044 $617 3.0% Debt Service Principal $1,515 $1,517 $1,640 $1,622 $107 7.1% Interest & Offsets $1,824 $1,950 $2,387 $2,677 $853 46.8% Total $3,339 $3,467 $4,027 $4,299 $960 28.8% Budget Stabilization $220 $0 $0 $0 ($220) (100.0%) Prepayments ($1,920) ($220) $0 $0 $1,920 (100.0%) NYCTFA Principal $353 $349 $387 $411 $58 16.4% Interest & Offsets $607 $606 $589 $571 ($36) (5.9%) Total $960 $955 $976 $982 $22 2.3% General Reserve $300 $300 $300 $300 $0 0.0% $48,916 $51,587 $53,452 $54,348 $5,432 11.1% Less: Intra-City Expenses ($1,146) ($1,131) ($1,130) ($1,130) $16 (1.4%) Total Expenditures $47,770 $50,456 $52,322 $53,218 $5,448 11.4% Gap To Be Closed $0 ($3,674) ($4,522) ($3,681) ($3,681)
Note: Property Tax includes STAR, Other Taxes includes NYCTFA revenues.
1
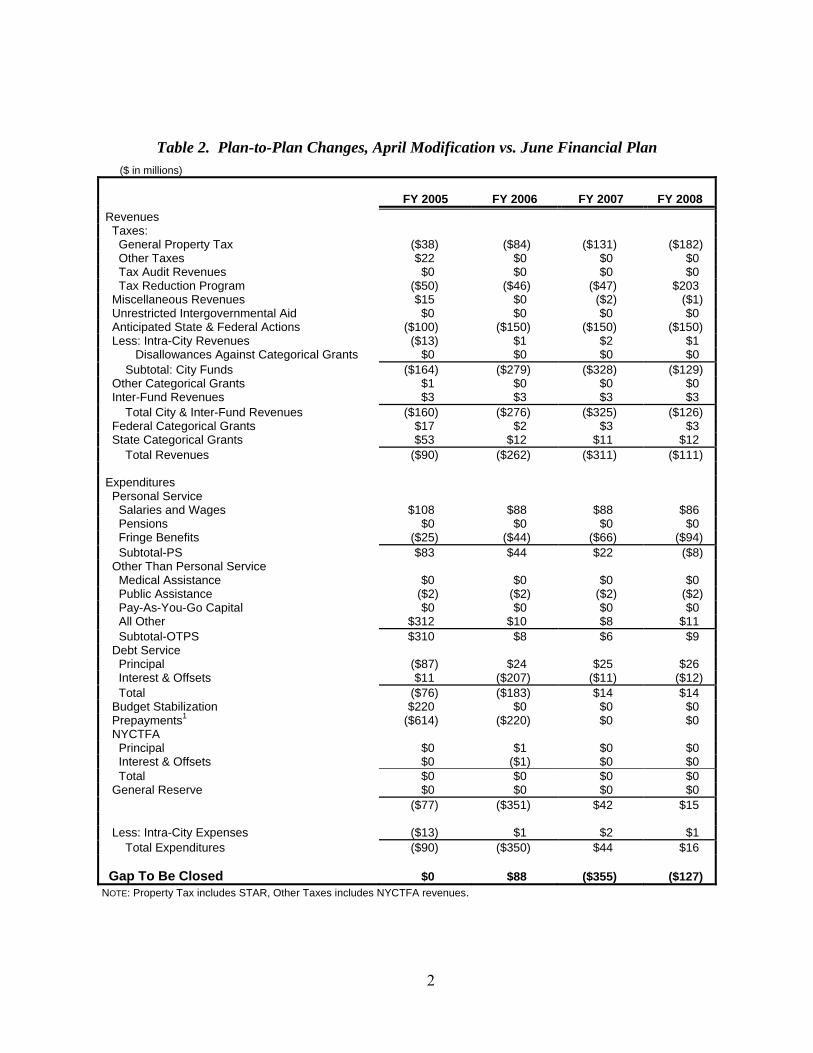
Table 2. Plan-to-Plan Changes, April Modification vs. June Financial Plan ($ in millions)
FY 2005 FY 2006 FY 2007 FY 2008 Revenues Taxes: General Property Tax ($38) ($84) ($131) ($182) Other Taxes $22 $0 $0 $0 Tax Audit Revenues $0 $0 $0 $0 Tax Reduction Program ($50) ($46) ($47) $203 Miscellaneous Revenues $15 $0 ($2) ($1) Unrestricted Intergovernmental Aid $0 $0 $0 $0 Anticipated State & Federal Actions ($100) ($150) ($150) ($150) Less: Intra-City Revenues ($13) $1 $2 $1 Disallowances Against Categorical Grants $0 $0 $0 $0 Subtotal: City Funds ($164) ($279) ($328) ($129) Other Categorical Grants $1 $0 $0 $0 Inter-Fund Revenues $3 $3 $3 $3 Total City & Inter-Fund Revenues ($160) ($276) ($325) ($126) Federal Categorical Grants $17 $2 $3 $3 State Categorical Grants $53 $12 $11 $12 Total Revenues ($90) ($262) ($311) ($111) Expenditures Personal Service Salaries and Wages $108 $88 $88 $86 Pensions $0 $0 $0 $0 Fringe Benefits ($25) ($44) ($66) ($94) Subtotal-PS $83 $44 $22 ($8) Other Than Personal Service Medical Assistance $0 $0 $0 $0 Public Assistance ($2) ($2) ($2) ($2) Pay-As-You-Go Capital $0 $0 $0 $0 All Other $312 $10 $8 $11 Subtotal-OTPS $310 $8 $6 $9 Debt Service Principal ($87) $24 $25 $26 Interest & Offsets $11 ($207) ($11) ($12) Total ($76) ($183) $14 $14 Budget Stabilization $220 $0 $0 $0 Prepayments1 ($614) ($220) $0 $0 NYCTFA Principal $0 $1 $0 $0 Interest & Offsets $0 ($1) $0 $0 Total $0 $0 $0 $0 General Reserve $0 $0 $0 $0 ($77) ($351) $42 $15 Less: Intra-City Expenses ($13) $1 $2 $1 Total Expenditures ($90) ($350) $44 $16 Gap To Be Closed $0 $88 ($355) ($127)
NOTE: Property Tax includes STAR, Other Taxes includes NYCTFA revenues.
2
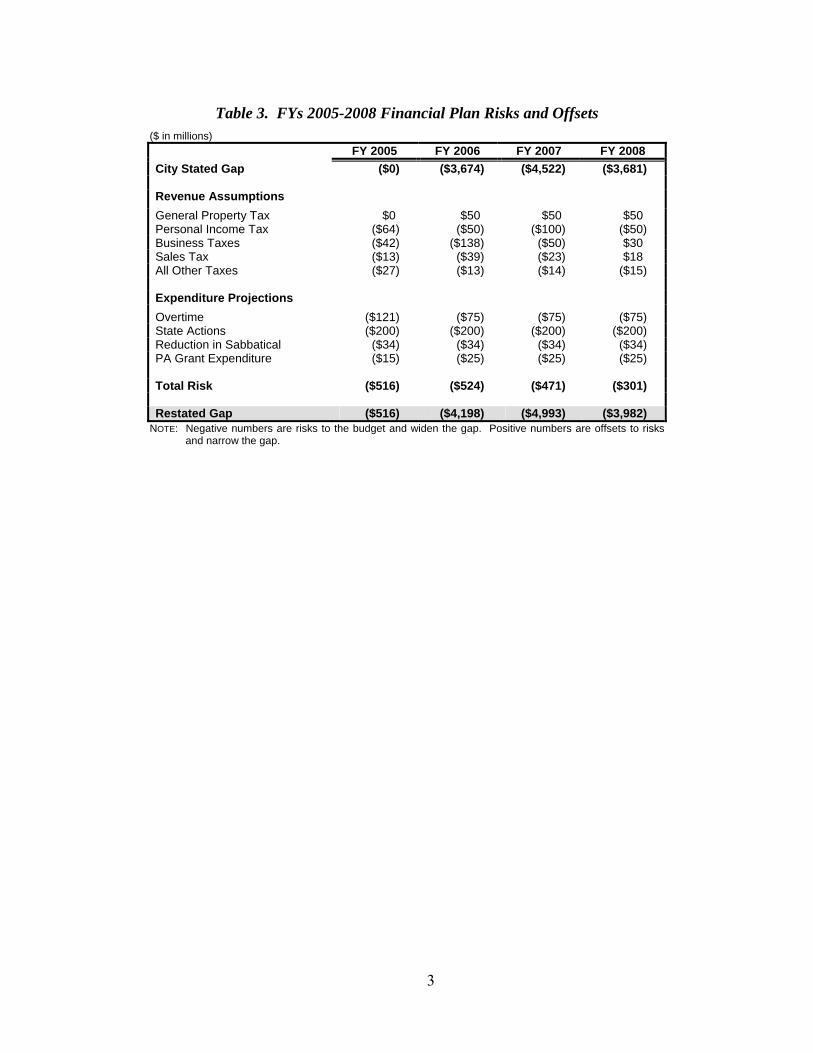
Table 3. FYs 2005-2008 Financial Plan Risks and Offsets ($ in millions) FY 2005 FY 2006 FY 2007 FY 2008 City Stated Gap ($0) ($3,674) ($4,522) ($3,681) Revenue Assumptions General Property Tax $0 $50 $50 $50 Personal Income Tax ($64) ($50) ($100) ($50) Business Taxes ($42) ($138) ($50) $30 Sales Tax ($13) ($39) ($23) $18 All Other Taxes ($27) ($13) ($14) ($15) Expenditure Projections Overtime ($121) ($75) ($75) ($75) State Actions ($200) ($200) ($200) ($200) Reduction in Sabbatical ($34) ($34) ($34) ($34) PA Grant Expenditure ($15) ($25) ($25) ($25) Total Risk ($516) ($524) ($471) ($301) Restated Gap ($516) ($4,198) ($4,993) ($3,982)
NOTE: Negative numbers are risks to the budget and widen the gap. Positive numbers are offsets to risks and narrow the gap.
3
II. Addressing the Outyear Gaps
The City’s FYs 2005-2008 Financial Plan shows that while the City expects FY 2005 to end with a modest surplus of $220 million, it continues to face multi-billion dollar gaps in the outyears. As Table 1 on page 1 shows, the City projects a deficit of $3.7 billion in FY 2006. The gap is then expected to grow to $4.5 billion in FY 2007 before narrowing to $3.7 billion by FY 2008.
To achieve budget balance in FY 2005, the City is utilizing more than $3 billion in non-recurring resources including $1.5 billion in non-recurring revenues and $1.9 billion in rolled-over budget surplus from FY 2004. Among the non-recurring revenues are the expected receipt of a lump-sum payment of $690 million from the Port Authority of New York and New Jersey as a result of a new lease agreement for City airports, the reimbursement to the City of the $502 million it paid in FY 2004 for Municipal Assistance Corporation debt service, and the expected receipt of $150 million from Battery Park City Authority for the sale of City-owned properties.
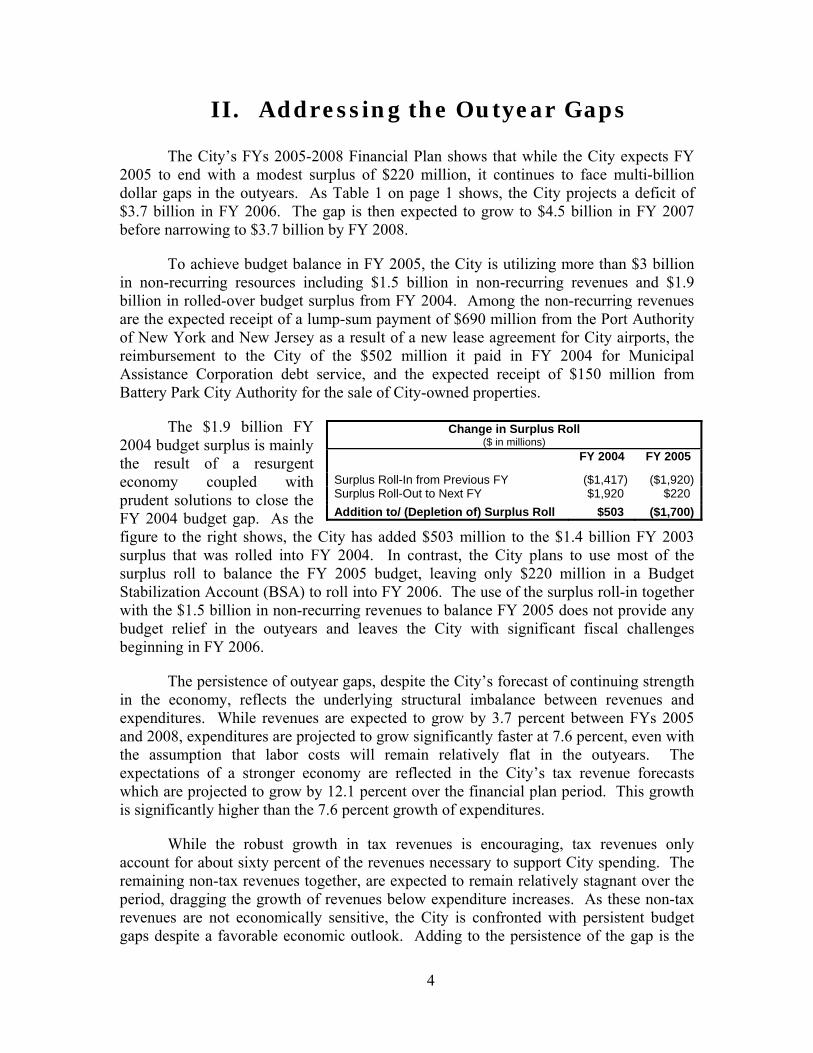
The $1.9 billion FY 2004 budget surplus is mainly the result of a resurgent economy coupled with prudent solutions to close the FY 2004 budget gap. As the figure to the right shows, the City has added $503 million to the $1.4 billion FY 2003 surplus that was rolled into FY 2004. In contrast, the City plans to use most of the surplus roll to balance the FY 2005 budget, leaving only $220 million in a Budget Stabilization Account (BSA) to roll into FY 2006. The use of the surplus roll-in together with the $1.5 billion in non-recurring revenues to balance FY 2005 does not provide any budget relief in the outyears and leaves the City with significant fiscal challenges beginning in FY 2006.
Change in Surplus Roll ($ in millions)
FY 2004 FY 2005
Surplus Roll-In from Previous FY ($1,417) ($1,920)Surplus Roll-Out to Next FY $1,920 $220 Addition to/ (Depletion of) Surplus Roll $503 ($1,700)
The persistence of outyear gaps, despite the City’s forecast of continuing strength in the economy, reflects the underlying structural imbalance between revenues and expenditures. While revenues are expected to grow by 3.7 percent between FYs 2005 and 2008, expenditures are projected to grow significantly faster at 7.6 percent, even with the assumption that labor costs will remain relatively flat in the outyears. The expectations of a stronger economy are reflected in the City’s tax revenue forecasts which are projected to grow by 12.1 percent over the financial plan period. This growth is significantly higher than the 7.6 percent growth of expenditures.
While the robust growth in tax revenues is encouraging, tax revenues only account for about sixty percent of the revenues necessary to support City spending. The remaining non-tax revenues together, are expected to remain relatively stagnant over the period, dragging the growth of revenues below expenditure increases. As these non-tax revenues are not economically sensitive, the City is confronted with persistent budget gaps despite a favorable economic outlook. Adding to the persistence of the gap is the
4
rapid growth in non-discretionary spending and debt service expenditures. Non-discretionary spending for pension contributions, judgments and claims (J&C), Medicaid and health insurance together with spending on debt service are projected to grow at 23.3 percent over the plan period, almost twice the growth of tax revenues.
The City needs to develop recurring solutions to address the structural imbalance. While there may be justification in using non-recurring resources as a bridge to fiscal stability in times of fiscal stress, the City should not rely on the use of the non-recurring resources, to the extent possible, to support recurring expenses, when the economy is showing strength and the fiscal outlook is improving. Rather, the City should develop recurring solutions to balance the FY 2005 budget. The recurring solutions would not only serve to reduce the outyear gaps to more manageable levels but would also allow the City to use the surplus roll-in to maintain a BSA at a time when fiscal conditions are stable. Prudent management of the BSA would allow the City to use it as a reserve to avoid or minimize the implementation of drastic gap-closing initiatives in response to any future deterioration in the City’s fiscal condition.
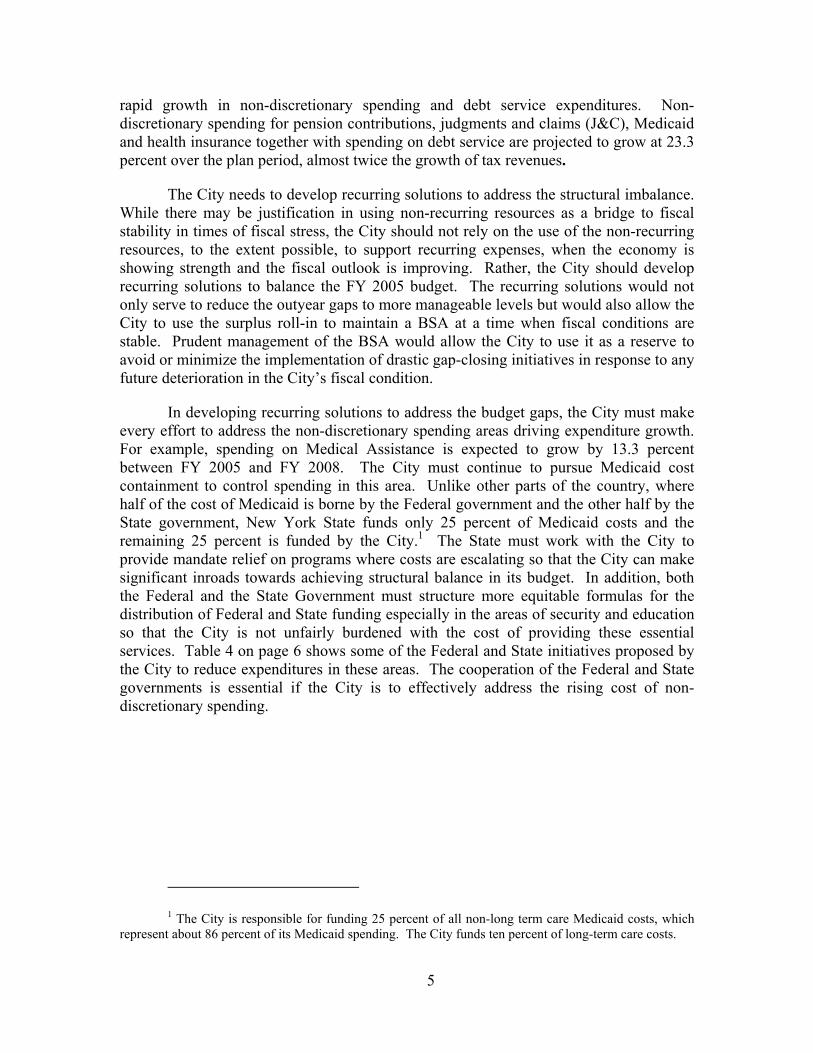
In developing recurring solutions to address the budget gaps, the City must make every effort to address the non-discretionary spending areas driving expenditure growth. For example, spending on Medical Assistance is expected to grow by 13.3 percent between FY 2005 and FY 2008. The City must continue to pursue Medicaid cost containment to control spending in this area. Unlike other parts of the country, where half of the cost of Medicaid is borne by the Federal government and the other half by the State government, New York State funds only 25 percent of Medicaid costs and the remaining 25 percent is funded by the City.1 The State must work with the City to provide mandate relief on programs where costs are escalating so that the City can make significant inroads towards achieving structural balance in its budget. In addition, both the Federal and the State Government must structure more equitable formulas for the distribution of Federal and State funding especially in the areas of security and education so that the City is not unfairly burdened with the cost of providing these essential services. Table 4 on page 6 shows some of the Federal and State initiatives proposed by the City to reduce expenditures in these areas. The cooperation of the Federal and State governments is essential if the City is to effectively address the rising cost of non-discretionary spending.
1 The City is responsible for funding 25 percent of all non-long term care Medicaid costs, which
represent about 86 percent of its Medicaid spending. The City funds ten percent of long-term care costs.
5
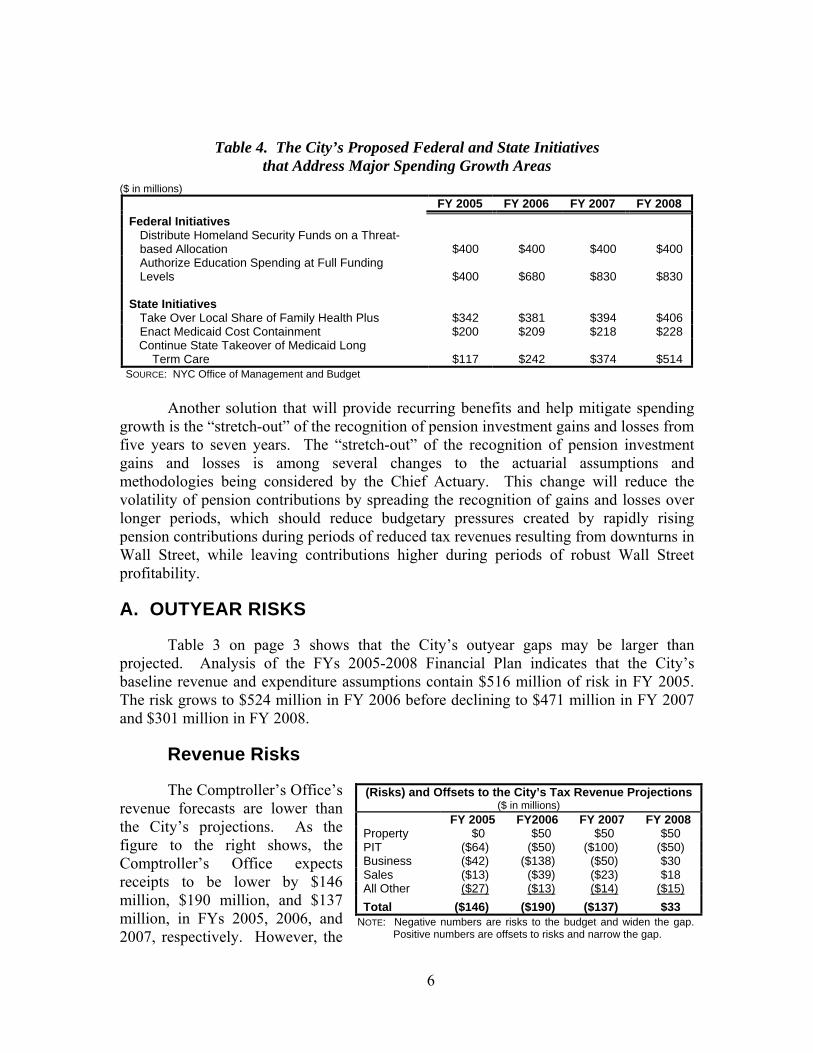
Table 4. The City’s Proposed Federal and State Initiatives that Address Major Spending Growth Areas
($ in millions) FY 2005 FY 2006 FY 2007 FY 2008 Federal Initiatives
Distribute Homeland Security Funds on a Threat-based Allocation $400 $400 $400 $400 Authorize Education Spending at Full Funding Levels $400 $680 $830 $830
State Initiatives
Take Over Local Share of Family Health Plus $342 $381 $394 $406 Enact Medicaid Cost Containment $200 $209 $218 $228
Continue State Takeover of Medicaid Long Term Care $117 $242 $374 $514 SOURCE: NYC Office of Management and Budget
Another solution that will provide recurring benefits and help mitigate spending
growth is the “stretch-out” of the recognition of pension investment gains and losses from five years to seven years. The “stretch-out” of the recognition of pension investment gains and losses is among several changes to the actuarial assumptions and methodologies being considered by the Chief Actuary. This change will reduce the volatility of pension contributions by spreading the recognition of gains and losses over longer periods, which should reduce budgetary pressures created by rapidly rising pension contributions during periods of reduced tax revenues resulting from downturns in Wall Street, while leaving contributions higher during periods of robust Wall Street profitability.
A. OUTYEAR RISKS
Table 3 on page 3 shows that the City’s outyear gaps may be larger than projected. Analysis of the FYs 2005-2008 Financial Plan indicates that the City’s baseline revenue and expenditure assumptions contain $516 million of risk in FY 2005. The risk grows to $524 million in FY 2006 before declining to $471 million in FY 2007 and $301 million in FY 2008.
Revenue Risks
The Comptroller’s Office’s revenue forecasts are lower than the City’s projections. As the figure to the right shows, the Comptroller’s Office expects receipts to be lower by $146 million, $190 million, and $137 million, in FYs 2005, 2006, and 2007, respectively. However, the
(Risks) and Offsets to the City’s Tax Revenue Projections ($ in millions)
FY 2005 FY2006 FY 2007 FY 2008 Property $0 $50 $50 $50 PIT ($64) ($50) ($100) ($50) Business ($42) ($138) ($50) $30 Sales ($13) ($39) ($23) $18 All Other ($27) ($13) ($14) ($15)Total ($146) ($190) ($137) $33
NOTE: Negative numbers are risks to the budget and widen the gap. Positive numbers are offsets to risks and narrow the gap.
6
Comptroller’s Office’s forecast for FY 2008 is higher than the City’s by $33 million. The risks are driven by differences between the Comptroller’s Office’s and the City’s projections of non-property tax revenues with the economically sensitive business tax, sales tax, and PIT revenues accounting for the bulk of these risks. The Comptroller’s Office projects a slower overall economic growth than the City.
Expenditure Risks
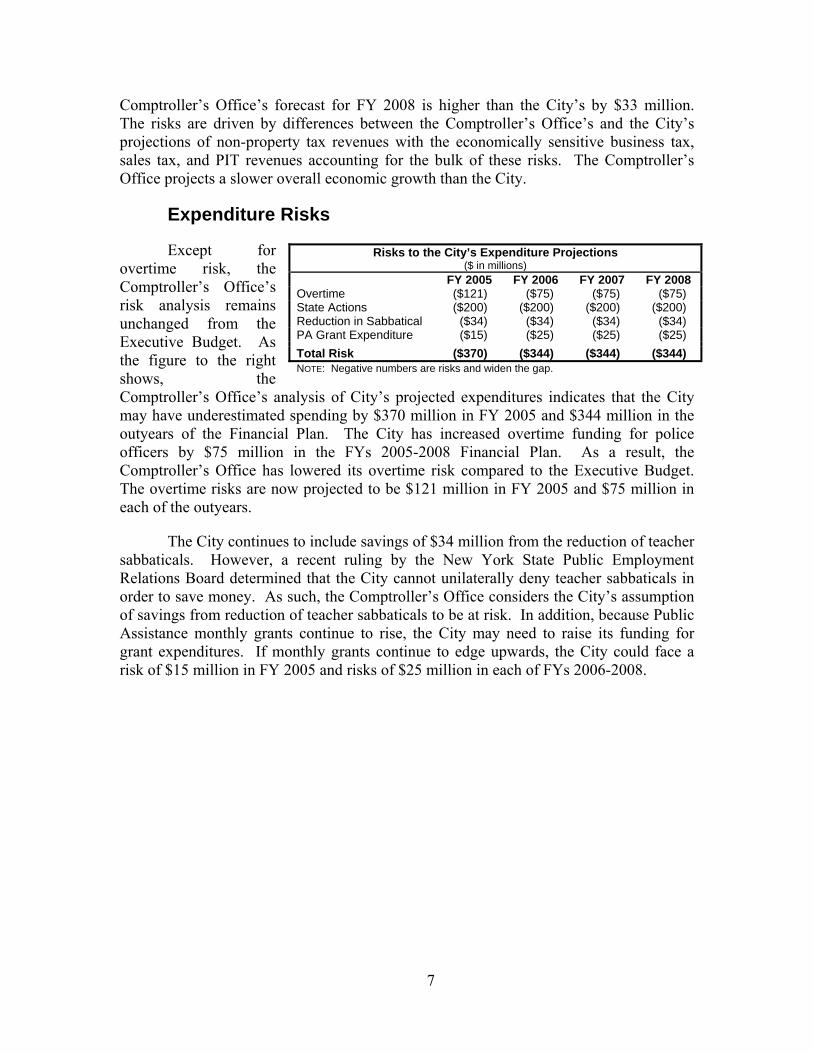
Except for overtime risk, the Comptroller’s Office’s risk analysis remains unchanged from the Executive Budget. As the figure to the right shows, the Comptroller’s Office’s analysis of City’s projected expenditures indicates that the City may have underestimated spending by $370 million in FY 2005 and $344 million in the outyears of the Financial Plan. The City has increased overtime funding for police officers by $75 million in the FYs 2005-2008 Financial Plan. As a result, the Comptroller’s Office has lowered its overtime risk compared to the Executive Budget. The overtime risks are now projected to be $121 million in FY 2005 and $75 million in each of the outyears.
Risks to the City’s Expenditure Projections ($ in millions)
FY 2005 FY 2006 FY 2007 FY 2008 Overtime ($121) ($75) ($75) ($75) State Actions ($200) ($200) ($200) ($200) Reduction in Sabbatical ($34) ($34) ($34) ($34) PA Grant Expenditure ($15) ($25) ($25) ($25) Total Risk ($370) ($344) ($344) ($344) NOTE: Negative numbers are risks and widen the gap.
The City continues to include savings of $34 million from the reduction of teacher sabbaticals. However, a recent ruling by the New York State Public Employment Relations Board determined that the City cannot unilaterally deny teacher sabbaticals in order to save money. As such, the Comptroller’s Office considers the City’s assumption of savings from reduction of teacher sabbaticals to be at risk. In addition, because Public Assistance monthly grants continue to rise, the City may need to raise its funding for grant expenditures. If monthly grants continue to edge upwards, the City could face a risk of $15 million in FY 2005 and risks of $25 million in each of FYs 2006-2008.
7
III. The State of the City’s Economy
A. THE U.S. ECONOMY
Real gross domestic product (GDP) grew 3.9 percent in the first quarter of 2004. The U.S. economy continues to show a recovery of jobs, as reported in May in the “Comptroller’s Comments on the Fiscal Year 2005 Executive Budget.” Payroll jobs grew at an annualized rate of two percent (about 1.27 million jobs) in the first six months of 2004. During this period, the U.S. unemployment rate averaged 5.8 percent, compared with 6.2 percent in the first six months of 2003.
U.S. manufacturing activity continues to recover, with the June Institute of Supply Management Index (ISM) at 61.1. Although lower than the 62.8 posted in May, this was the eighth consecutive month that the ISM was above 60. Consumer confidence soared to 101.9 in June from 93.2 in May.
As expected, the Federal Open Market Committee (FOMC) increased the target Federal Funds rate by 25 basis points in June and it is expected to raise the rate by at least another 75 basis points over the next four FOMC meetings. The risks to the economy continue to be a rise in oil prices, large trade and budget deficits, and the war in Iraq. Gasoline prices averaged $1.981 per gallon during the week ended June 21, 47.2 cents per gallon higher than in mid-December. For every one-cent increase in the price of gasoline, consumer disposable income declines by about $9 million per day. The first-half 2004 increase in prices therefore translates into an additional $424.8 million per day spent on gasoline nationally, compared to last December.
B. THE NEW YORK CITY ECONOMY
The City’s economy soared in the first quarter of 2004 and continued to show strength into the second quarter. Gross City Product (GCP) grew at an annualized rate of 6.8 percent in the first quarter, the highest growth rate since the first quarter of 1999. Payroll jobs grew at an annualized rate of 1.7 percent (24,100 jobs) in the first five months of 2004. Based on the five-month change in each industry, jobs declined in construction, manufacturing, trade, transportation and utilities, and government. The other industries added jobs, as shown in Chart 1.
The unemployment rate averaged 7.9 percent in the first five months of 2004, compared with 8.6 percent in the first five months of 2003. After adjusting for tax policy changes, personal income tax revenue, a proxy for personal income, rose 11.4 percent on a year-over-year basis in the first quarter of 2004. At the same time, the average inflation rate in the NYC metro area was 3.2 percent as of May, compared with the national average of 2.1 percent.
8
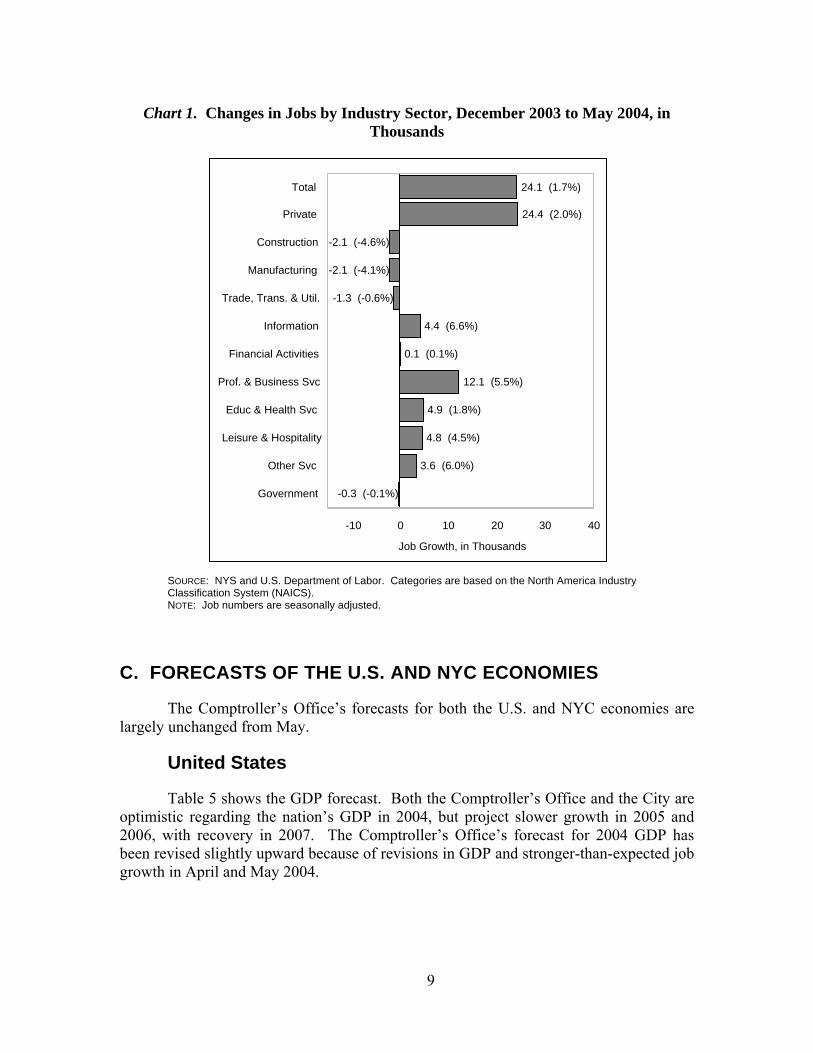
Chart 1. Changes in Jobs by Industry Sector, December 2003 to May 2004, in Thousands
24.1 (1.7%)
24.4 (2.0%)
-2.1 (-4.6%)
-2.1 (-4.1%)
-1.3 (-0.6%)
4.4 (6.6%)
0.1 (0.1%)
12.1 (5.5%)
4.9 (1.8%)
4.8 (4.5%)
3.6 (6.0%)
-0.3 (-0.1%)
Total
Private
Construction
Manufacturing
Trade, Trans. & Util.
Information
Financial Activities
Prof. & Business Svc
Educ & Health Svc
Leisure & Hospitality
Other Svc
Government
-10 0 10 20 30 40
Job Growth, in Thousands
SOURCE: NYS and U.S. Department of Labor. Categories are based on the North America Industry Classification System (NAICS). NOTE: Job numbers are seasonally adjusted.
C. FORECASTS OF THE U.S. AND NYC ECONOMIES
The Comptroller’s Office’s forecasts for both the U.S. and NYC economies are largely unchanged from May.
United States
Table 5 shows the GDP forecast. Both the Comptroller’s Office and the City are optimistic regarding the nation’s GDP in 2004, but project slower growth in 2005 and 2006, with recovery in 2007. The Comptroller’s Office’s forecast for 2004 GDP has been revised slightly upward because of revisions in GDP and stronger-than-expected job growth in April and May 2004.
9
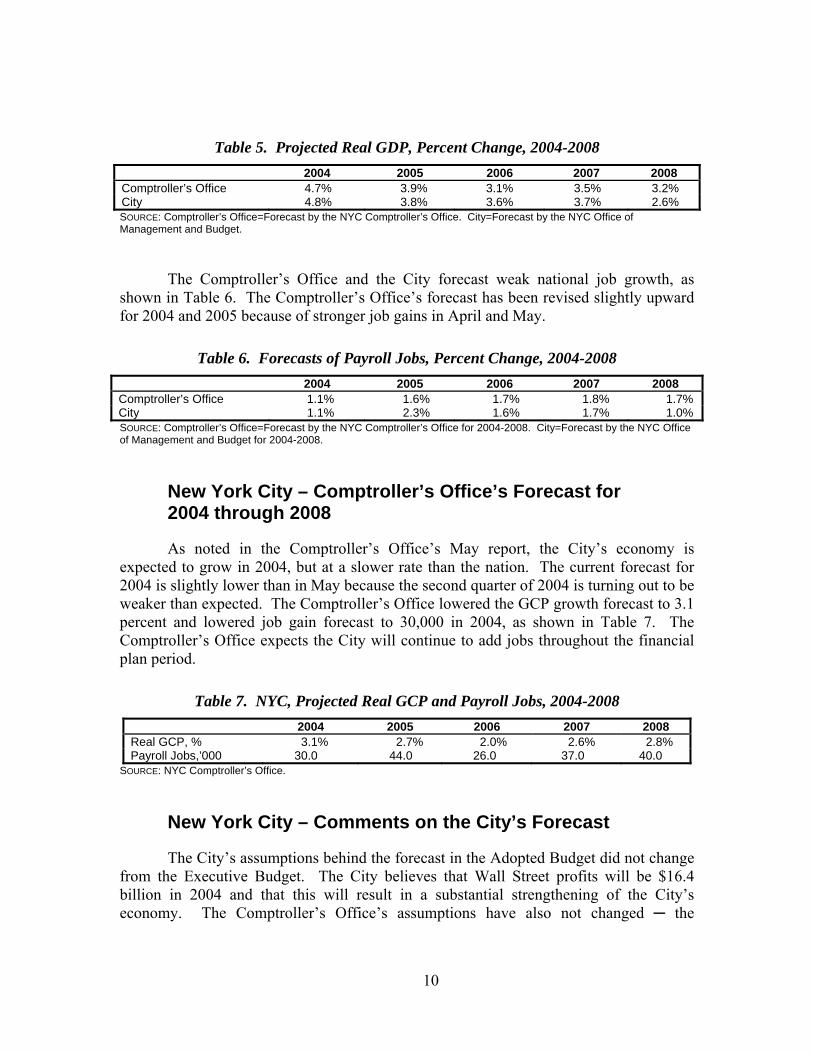
Table 5. Projected Real GDP, Percent Change, 2004-2008 2004 2005 2006 2007 2008 Comptroller’s Office 4.7% 3.9% 3.1% 3.5% 3.2% City 4.8% 3.8% 3.6% 3.7% 2.6% SOURCE: Comptroller’s Office=Forecast by the NYC Comptroller’s Office. City=Forecast by the NYC Office of Management and Budget.
The Comptroller’s Office and the City forecast weak national job growth, as shown in Table 6. The Comptroller’s Office’s forecast has been revised slightly upward for 2004 and 2005 because of stronger job gains in April and May.
Table 6. Forecasts of Payroll Jobs, Percent Change, 2004-2008 2004 2005 2006 2007 2008 Comptroller’s Office 1.1% 1.6% 1.7% 1.8% 1.7% City 1.1% 2.3% 1.6% 1.7% 1.0% SOURCE: Comptroller’s Office=Forecast by the NYC Comptroller’s Office for 2004-2008. City=Forecast by the NYC Office of Management and Budget for 2004-2008.
New York City – Comptroller’s Office’s Forecast for 2004 through 2008
As noted in the Comptroller’s Office’s May report, the City’s economy is expected to grow in 2004, but at a slower rate than the nation. The current forecast for 2004 is slightly lower than in May because the second quarter of 2004 is turning out to be weaker than expected. The Comptroller’s Office lowered the GCP growth forecast to 3.1 percent and lowered job gain forecast to 30,000 in 2004, as shown in Table 7. The Comptroller’s Office expects the City will continue to add jobs throughout the financial plan period.
Table 7. NYC, Projected Real GCP and Payroll Jobs, 2004-2008 2004 2005 2006 2007 2008
Real GCP, % 3.1% 2.7% 2.0% 2.6% 2.8% Payroll Jobs,’000 30.0 44.0 26.0 37.0 40.0
SOURCE: NYC Comptroller’s Office.
New York City – Comments on the City’s Forecast
The City’s assumptions behind the forecast in the Adopted Budget did not change from the Executive Budget. The City believes that Wall Street profits will be $16.4 billion in 2004 and that this will result in a substantial strengthening of the City’s economy. The Comptroller’s Office’s assumptions have also not changed ─ the
10
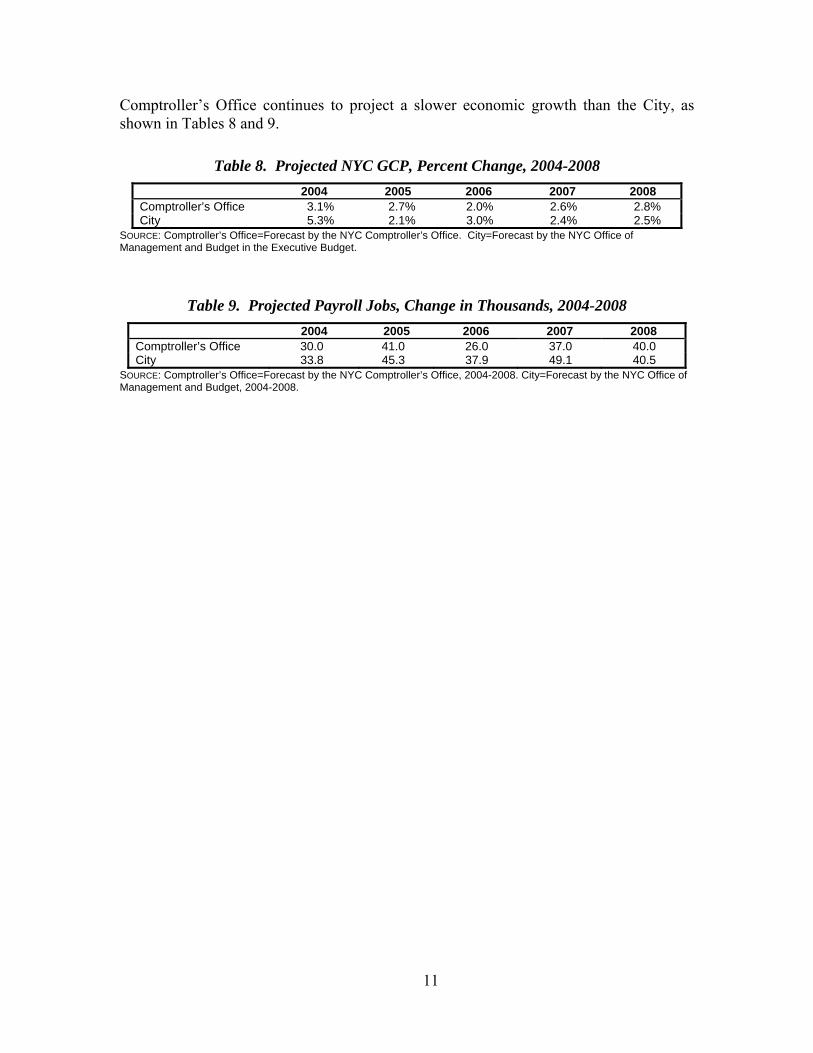
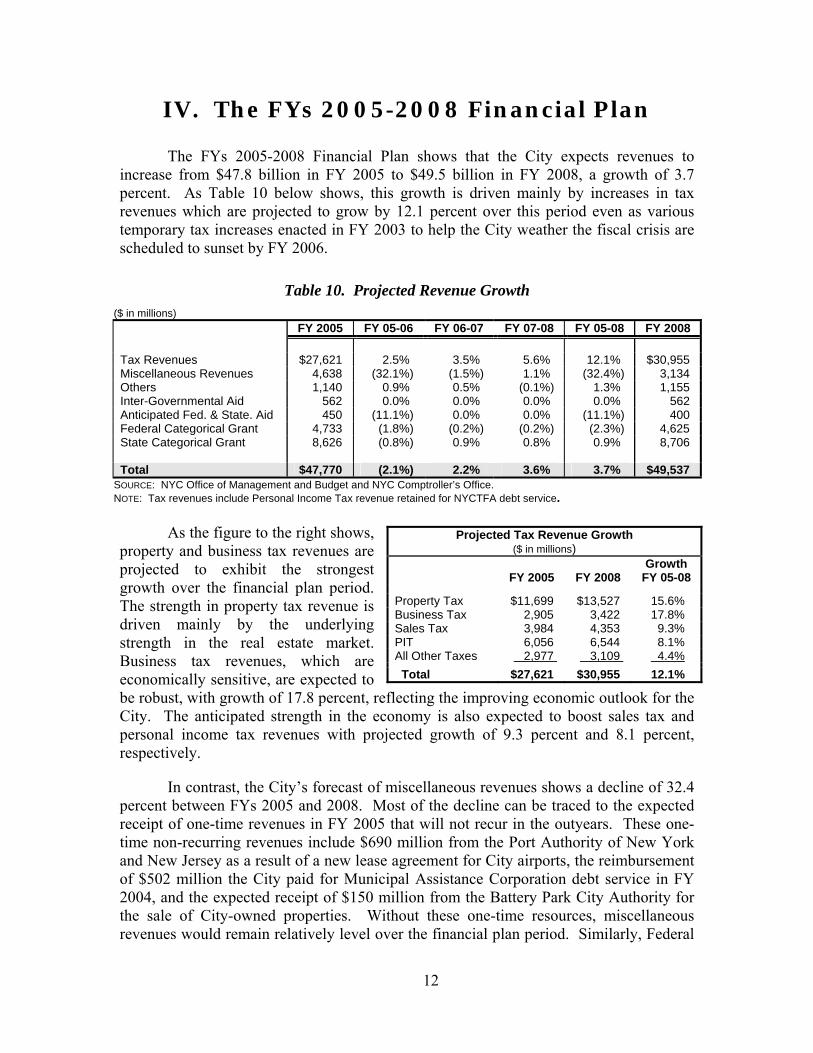
Comptroller’s Office continues to project a slower economic growth than the City, as shown in Tables 8 and 9.
Table 8. Projected NYC GCP, Percent Change, 2004-2008 2004 2005 2006 2007 2008
Comptroller’s Office 3.1% 2.7% 2.0% 2.6% 2.8% City 5.3% 2.1% 3.0% 2.4% 2.5%
SOURCE: Comptroller’s Office=Forecast by the NYC Comptroller’s Office. City=Forecast by the NYC Office of Management and Budget in the Executive Budget.
Table 9. Projected Payroll Jobs, Change in Thousands, 2004-2008 2004 2005 2006 2007 2008
Comptroller’s Office 30.0 41.0 26.0 37.0 40.0 City 33.8 45.3 37.9 49.1 40.5
SOURCE: Comptroller’s Office=Forecast by the NYC Comptroller’s Office, 2004-2008. City=Forecast by the NYC Office of Management and Budget, 2004-2008.
11
IV. The FYs 2005-2008 Financial Plan
The FYs 2005-2008 Financial Plan shows that the City expects revenues to increase from $47.8 billion in FY 2005 to $49.5 billion in FY 2008, a growth of 3.7 percent. As Table 10 below shows, this growth is driven mainly by increases in tax revenues which are projected to grow by 12.1 percent over this period even as various temporary tax increases enacted in FY 2003 to help the City weather the fiscal crisis are scheduled to sunset by FY 2006.
Table 10. Projected Revenue Growth ($ in millions) FY 2005 FY 05-06 FY 06-07 FY 07-08 FY 05-08 FY 2008 Tax Revenues $27,621 2.5% 3.5% 5.6% 12.1% $30,955 Miscellaneous Revenues 4,638 (32.1%) (1.5%) 1.1% (32.4%) 3,134 Others 1,140 0.9% 0.5% (0.1%) 1.3% 1,155 Inter-Governmental Aid 562 0.0% 0.0% 0.0% 0.0% 562 Anticipated Fed. & State. Aid 450 (11.1%) 0.0% 0.0% (11.1%) 400 Federal Categorical Grant 4,733 (1.8%) (0.2%) (0.2%) (2.3%) 4,625 State Categorical Grant 8,626 (0.8%) 0.9% 0.8% 0.9% 8,706 Total $47,770 (2.1%) 2.2% 3.6% 3.7% $49,537
SOURCE: NYC Office of Management and Budget and NYC Comptroller’s Office. NOTE: Tax revenues include Personal Income Tax revenue retained for NYCTFA debt service.
As the figure to the right shows, property and business tax revenues are projected to exhibit the strongest growth over the financial plan period. The strength in property tax revenue is driven mainly by the underlying strength in the real estate market. Business tax revenues, which are economically sensitive, are expected to be robust, with growth of 17.8 percent, reflecting the improving economic outlook for the City. The anticipated strength in the economy is also expected to boost sales tax and personal income tax revenues with projected growth of 9.3 percent and 8.1 percent, respectively.
Projected Tax Revenue Growth ($ in millions)
FY 2005 FY 2008
Growth FY 05-08
Property Tax $11,699 $13,527 15.6% Business Tax 2,905 3,422 17.8% Sales Tax 3,984 4,353 9.3% PIT 6,056 6,544 8.1% All Other Taxes 2,977 3,109 4.4% Total $27,621 $30,955 12.1%
In contrast, the City’s forecast of miscellaneous revenues shows a decline of 32.4 percent between FYs 2005 and 2008. Most of the decline can be traced to the expected receipt of one-time revenues in FY 2005 that will not recur in the outyears. These one-time non-recurring revenues include $690 million from the Port Authority of New York and New Jersey as a result of a new lease agreement for City airports, the reimbursement of $502 million the City paid for Municipal Assistance Corporation debt service in FY 2004, and the expected receipt of $150 million from the Battery Park City Authority for the sale of City-owned properties. Without these one-time resources, miscellaneous revenues would remain relatively level over the financial plan period. Similarly, Federal
12
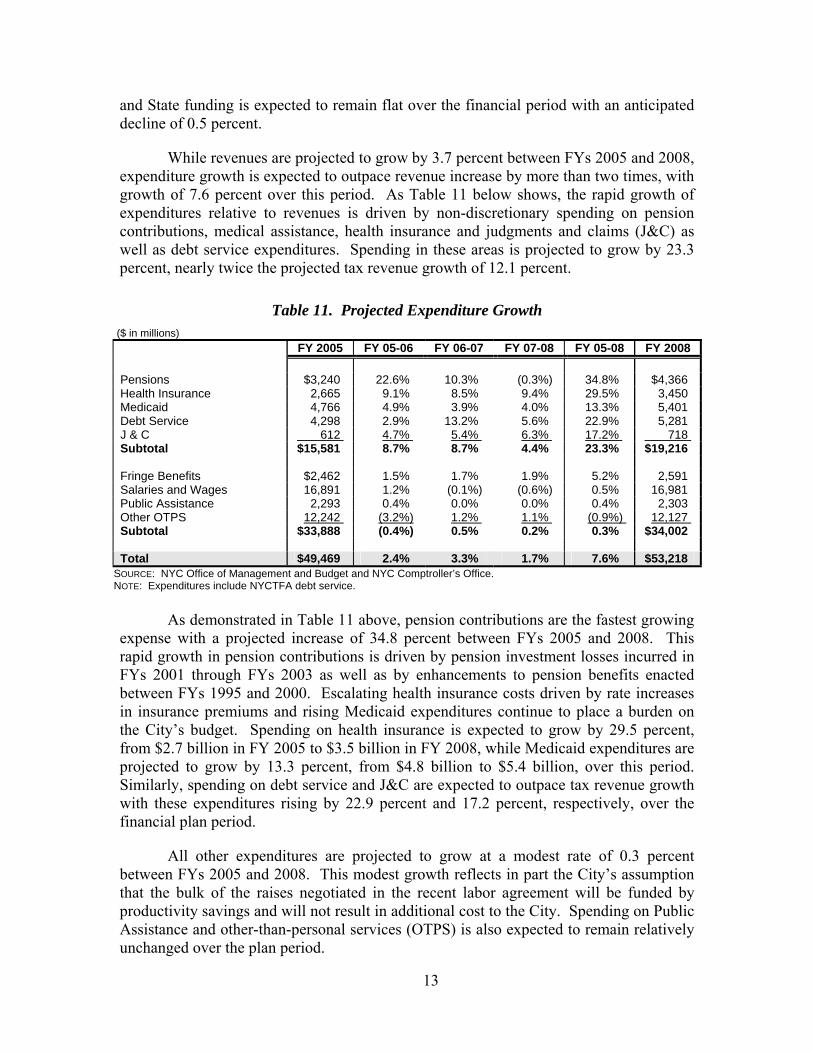
and State funding is expected to remain flat over the financial period with an anticipated decline of 0.5 percent.
While revenues are projected to grow by 3.7 percent between FYs 2005 and 2008, expenditure growth is expected to outpace revenue increase by more than two times, with growth of 7.6 percent over this period. As Table 11 below shows, the rapid growth of expenditures relative to revenues is driven by non-discretionary spending on pension contributions, medical assistance, health insurance and judgments and claims (J&C) as well as debt service expenditures. Spending in these areas is projected to grow by 23.3 percent, nearly twice the projected tax revenue growth of 12.1 percent.
Table 11. Projected Expenditure Growth ($ in millions) FY 2005 FY 05-06 FY 06-07 FY 07-08 FY 05-08 FY 2008 Pensions $3,240 22.6% 10.3% (0.3%) 34.8% $4,366 Health Insurance 2,665 9.1% 8.5% 9.4% 29.5% 3,450 Medicaid 4,766 4.9% 3.9% 4.0% 13.3% 5,401 Debt Service 4,298 2.9% 13.2% 5.6% 22.9% 5,281 J & C 612 4.7% 5.4% 6.3% 17.2% 718 Subtotal $15,581 8.7% 8.7% 4.4% 23.3% $19,216 Fringe Benefits $2,462 1.5% 1.7% 1.9% 5.2% 2,591 Salaries and Wages 16,891 1.2% (0.1%) (0.6%) 0.5% 16,981 Public Assistance 2,293 0.4% 0.0% 0.0% 0.4% 2,303 Other OTPS 12,242 (3.2%) 1.2% 1.1% (0.9%) 12,127 Subtotal $33,888 (0.4%) 0.5% 0.2% 0.3% $34,002 Total $49,469 2.4% 3.3% 1.7% 7.6% $53,218
SOURCE: NYC Office of Management and Budget and NYC Comptroller’s Office. NOTE: Expenditures include NYCTFA debt service.
As demonstrated in Table 11 above, pension contributions are the fastest growing
expense with a projected increase of 34.8 percent between FYs 2005 and 2008. This rapid growth in pension contributions is driven by pension investment losses incurred in FYs 2001 through FYs 2003 as well as by enhancements to pension benefits enacted between FYs 1995 and 2000. Escalating health insurance costs driven by rate increases in insurance premiums and rising Medicaid expenditures continue to place a burden on the City’s budget. Spending on health insurance is expected to grow by 29.5 percent, from $2.7 billion in FY 2005 to $3.5 billion in FY 2008, while Medicaid expenditures are projected to grow by 13.3 percent, from $4.8 billion to $5.4 billion, over this period. Similarly, spending on debt service and J&C are expected to outpace tax revenue growth with these expenditures rising by 22.9 percent and 17.2 percent, respectively, over the financial plan period.
All other expenditures are projected to grow at a modest rate of 0.3 percent between FYs 2005 and 2008. This modest growth reflects in part the City’s assumption that the bulk of the raises negotiated in the recent labor agreement will be funded by productivity savings and will not result in additional cost to the City. Spending on Public Assistance and other-than-personal services (OTPS) is also expected to remain relatively unchanged over the plan period.
13
A. REVENUE OUTLOOK
Tax Revenues
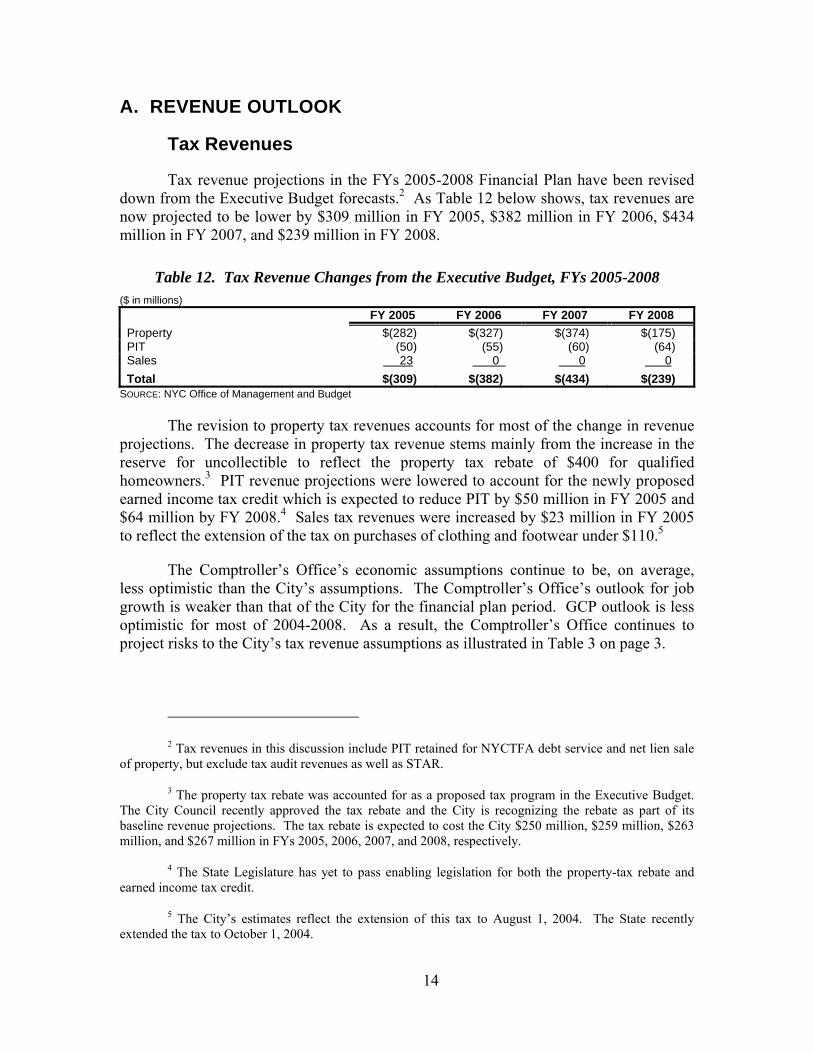
Tax revenue projections in the FYs 2005-2008 Financial Plan have been revised down from the Executive Budget forecasts.2 As Table 12 below shows, tax revenues are now projected to be lower by $309 million in FY 2005, $382 million in FY 2006, $434 million in FY 2007, and $239 million in FY 2008.
Table 12. Tax Revenue Changes from the Executive Budget, FYs 2005-2008 ($ in millions)
FY 2005 FY 2006 FY 2007 FY 2008 Property $(282) $(327) $(374) $(175) PIT (50) (55) (60) (64) Sales 23 0 0 0Total $(309) $(382) $(434) $(239)
SOURCE: NYC Office of Management and Budget
The revision to property tax revenues accounts for most of the change in revenue projections. The decrease in property tax revenue stems mainly from the increase in the reserve for uncollectible to reflect the property tax rebate of $400 for qualified homeowners.3 PIT revenue projections were lowered to account for the newly proposed earned income tax credit which is expected to reduce PIT by $50 million in FY 2005 and $64 million by FY 2008.4 Sales tax revenues were increased by $23 million in FY 2005 to reflect the extension of the tax on purchases of clothing and footwear under $110.5
The Comptroller’s Office’s economic assumptions continue to be, on average, less optimistic than the City’s assumptions. The Comptroller’s Office’s outlook for job growth is weaker than that of the City for the financial plan period. GCP outlook is less optimistic for most of 2004-2008. As a result, the Comptroller’s Office continues to project risks to the City’s tax revenue assumptions as illustrated in Table 3 on page 3.
2 Tax revenues in this discussion include PIT retained for NYCTFA debt service and net lien sale
of property, but exclude tax audit revenues as well as STAR.
3 The property tax rebate was accounted for as a proposed tax program in the Executive Budget. The City Council recently approved the tax rebate and the City is recognizing the rebate as part of its baseline revenue projections. The tax rebate is expected to cost the City $250 million, $259 million, $263 million, and $267 million in FYs 2005, 2006, 2007, and 2008, respectively.
4 The State Legislature has yet to pass enabling legislation for both the property-tax rebate and earned income tax credit.
5 The City’s estimates reflect the extension of this tax to August 1, 2004. The State recently extended the tax to October 1, 2004.
14
PIT Recovery and Sales Tax
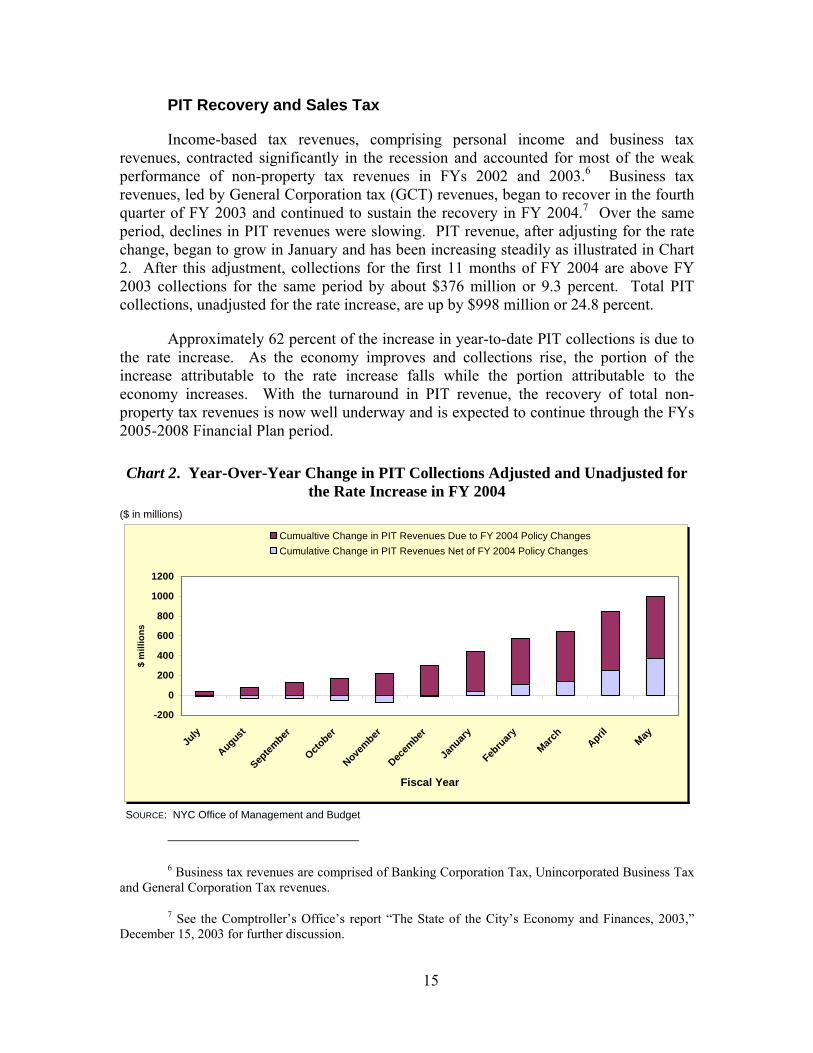
Income-based tax revenues, comprising personal income and business tax revenues, contracted significantly in the recession and accounted for most of the weak performance of non-property tax revenues in FYs 2002 and 2003.6 Business tax revenues, led by General Corporation tax (GCT) revenues, began to recover in the fourth quarter of FY 2003 and continued to sustain the recovery in FY 2004.7 Over the same period, declines in PIT revenues were slowing. PIT revenue, after adjusting for the rate change, began to grow in January and has been increasing steadily as illustrated in Chart 2. After this adjustment, collections for the first 11 months of FY 2004 are above FY 2003 collections for the same period by about $376 million or 9.3 percent. Total PIT collections, unadjusted for the rate increase, are up by $998 million or 24.8 percent.
Approximately 62 percent of the increase in year-to-date PIT collections is due to the rate increase. As the economy improves and collections rise, the portion of the increase attributable to the rate increase falls while the portion attributable to the economy increases. With the turnaround in PIT revenue, the recovery of total non-property tax revenues is now well underway and is expected to continue through the FYs 2005-2008 Financial Plan period.
Chart 2. Year-Over-Year Change in PIT Collections Adjusted and Unadjusted for the Rate Increase in FY 2004
($ in millions)
-200
0
200
400
600
800
1000
1200
July
August
Septem
ber
October
November
Decem
ber
January
Febru
aryMarc
hApril
May
Fiscal Year
$ m
illio
ns
Cumualtive Change in PIT Revenues Due to FY 2004 Policy ChangesCumulative Change in PIT Revenues Net of FY 2004 Policy Changes
SOURCE: NYC Office of Management and Budget
6 Business tax revenues are comprised of Banking Corporation Tax, Unincorporated Business Tax
and General Corporation Tax revenues.
7 See the Comptroller’s Office’s report “The State of the City’s Economy and Finances, 2003,” December 15, 2003 for further discussion.
15
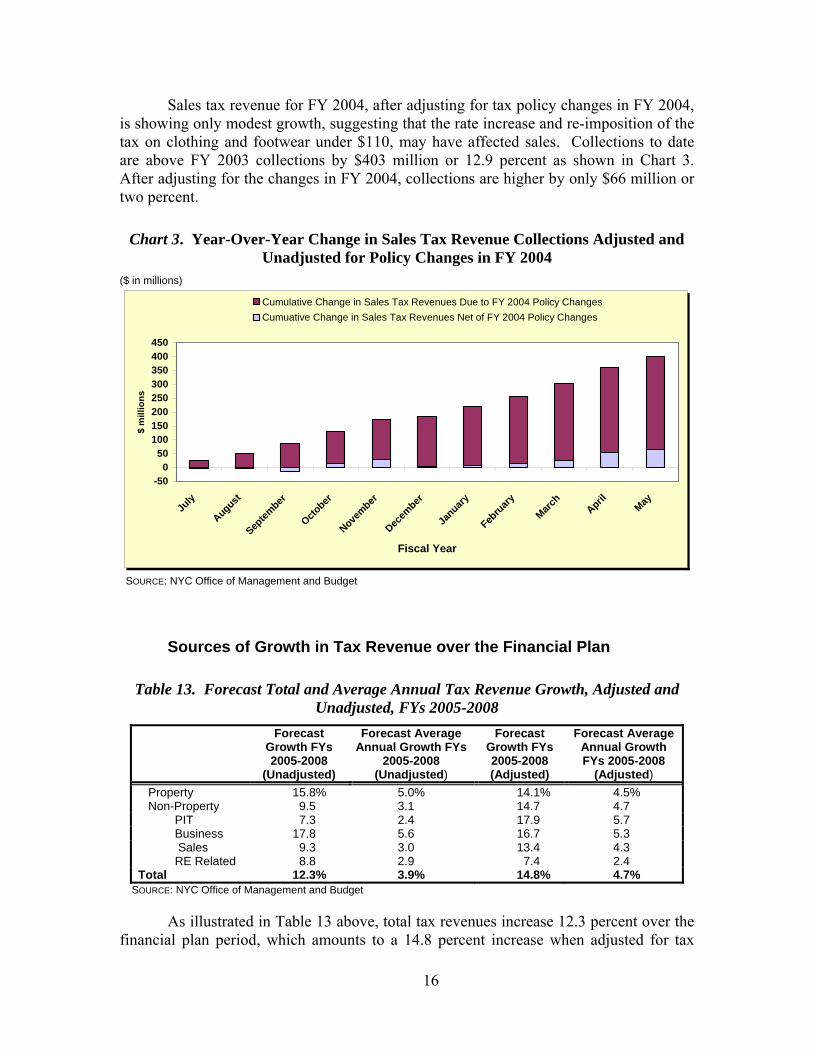
Sales tax revenue for FY 2004, after adjusting for tax policy changes in FY 2004, is showing only modest growth, suggesting that the rate increase and re-imposition of the tax on clothing and footwear under $110, may have affected sales. Collections to date are above FY 2003 collections by $403 million or 12.9 percent as shown in Chart 3. After adjusting for the changes in FY 2004, collections are higher by only $66 million or two percent.
Chart 3. Year-Over-Year Change in Sales Tax Revenue Collections Adjusted and Unadjusted for Policy Changes in FY 2004
($ in millions)
-500
50100150200250300350400450
July
August
Septem
ber
October
November
Decem
ber
January
Febru
aryMarc
hApril
May
Fiscal Year
$ m
illio
ns
Cumulative Change in Sales Tax Revenues Due to FY 2004 Policy ChangesCumuative Change in Sales Tax Revenues Net of FY 2004 Policy Changes
SOURCE: NYC Office of Management and Budget
Sources of Growth in Tax Revenue over the Financial Plan
Table 13. Forecast Total and Average Annual Tax Revenue Growth, Adjusted and Unadjusted, FYs 2005-2008
Forecast Growth FYs 2005-2008
(Unadjusted)
Forecast Average Annual Growth FYs
2005-2008 (Unadjusted)
Forecast Growth FYs 2005-2008 (Adjusted)
Forecast Average Annual Growth FYs 2005-2008
(Adjusted) Property 15.8% 5.0% 14.1% 4.5% Non-Property 9.5 3.1 14.7 4.7 PIT 7.3 2.4 17.9 5.7 Business 17.8 5.6 16.7 5.3 Sales 9.3 3.0 13.4 4.3 RE Related 8.8 2.9 7.4 2.4 Total 12.3% 3.9% 14.8% 4.7%
SOURCE: NYC Office of Management and Budget
As illustrated in Table 13 above, total tax revenues increase 12.3 percent over the financial plan period, which amounts to a 14.8 percent increase when adjusted for tax
16
policy changes. On an unadjusted basis, business and property tax revenues show the most rapid growth over the plan period. Projected growth of PIT and sales tax revenues is lower as the FY 2004 rate increases are phased out. Real-estate related tax revenues grow moderately well over the plan period despite anticipation of further interest rate increases. When adjusted for tax policy changes, all categories of taxes, except for the real-estate transaction taxes, are projected to experience double-digit growth as the economic outlook continues to improve.
Average annual tax-revenue growth for FYs 2005-2008 is forecast at 3.9 percent.8 Business tax revenues are projected to increase by 5.6 percent annually, followed by property tax revenues at five percent. Sales tax and PIT revenues are expected to grow more slowly with annual growth rates of 3.0 and 2.4 percent respectively as a result of new tax policies. Real-estate transaction tax revenues show an increase of only 2.9 percent annually, reflecting expectations of further tightening of monetary policy by the Federal Reserve. Tighter monetary policy will raise interest rates, thereby slowing real-estate and related activities.
Table 14. Forecast Proportion of Total Tax-Revenue Growth and Annual Changes FYs 2005-2008
($ in millions)
Forecast Annual Change
Percent of Total Increase
FYs 2005-2008 FY 2005 FY 2006 FY 2007 FY 2008 Change
FYs 2005-08 Property 56.3% $153 $464 $544 $817 $1,825 Non-Property 43.7% ($533) $224 $403 $790 $1,417 PIT 12.4% ($7) ($4) $26 $380 $402 Business 16.0% $150 $188 $167 $162 $517 Sales 11.4% $9 $45 $148 $176 $369 RE Related 3.9% ($628) ($9) $72 $63 $126 All Other 0.1% ($57) $4 ($10) $9 $4Total Change 100.0% ($380) $688 $947 $1,607 $3,242
SOURCE: NYC Office of Management and Budget
Property tax revenues are projected to be the main force driving tax-revenue growth, accounting for 56.3 percent of the $3.2 billion tax revenue increase projected over the financial plan period as illustrated in Table 14. Business tax revenues are expected to account for 16 percent of the total tax revenue growth while PIT and sales tax revenues are projected to account for 12.4 and 11.4 percent of overall growth respectively.
For FY 2005, tax revenues are projected to decline by $380 million, driven mainly by a drop of $628 million in real-estate transaction taxes, which slow as interest rates rise. The increase in property and business taxes is expected to partly offset this drop.
8 Tax-revenue growth is unadjusted for new tax policies. Average annual tax-revenue growth
adjusted for new tax policies is 4.7 percent.
17
The ‘Pipeline’
Every year the Department of Finance estimates the market value of properties in the City for tax purposes. Property is divided into four classes. Class 1 consists of one-, two-, and three-family homes, as well as small condominiums and co-ops. Class 2 consists of large rental residential units. Class 3 consists of utility properties and Class 4 is essentially commercial properties. Properties are assessed at a fraction of market value for tax purposes but legislation restricts the amount by which assessments for some classes of properties may increase. Class 4 and Class 2 properties with more than 11 units are not subject to assessment controls but changes to their assessments are phased-in over five years. Assessed value not yet phased-in for tax purposes is referred to as the ‘pipeline.’ This pipeline helps to stabilize the base or the billable assessed value of property on which the property tax rate is applied.
In FY 2005 market value increase of 17.2 percent far exceed trend growth.9 Most of this growth occurred in Class 1 and Class 2 properties with four to ten apartments. Both of these groups are subject to assessment caps each year. The surplus over the cap is not stored to be phased in later and is lost for that year. As a result, assessed values, which are estimated as a fraction of market values subject to the caps, did not increase as dramatically as market values did as illustrated in Table 15.
Table 15. FY 2005 Property Value Growth Class 1 Class 2 Class 3 Class 4 Total Market Value 21.7% 21.2% 3.3% 7.3% 17.2% Assessed Value 4.1% 6.8% 2.3% 8.2% 6.9% Billable Assessed Value 4.1% 6.6% 2.3% 6.2% 5.9%
SOURCE: NYC Department of Finance
For FY 2005, market value for Class 2 increases by 21.2 percent while the Class’s assessed value increases by only 6.8 percent. Market value for Class 4 increases by 7.3 percent compared with the double digit growth for Classes 1 and 2, hence there is no excessive growth to be phased in. Nevertheless, growth of 8.2 percent of assessed value in Class 4 is the highest since 1991 and growth of 6.8 percent for Class 2 is high compared with last year when assessed value for the Class increased by only 3.3 percent. This increase should add to the pipeline and help cushion the property-tax base from a possible slowdown in the property market in an environment of anticipated increases in both long and short term interest rates.
Miscellaneous Revenues
The non-tax revenue portion of City funds is referred to as miscellaneous revenues. These receipts include fees for licenses and franchises, rental income, water
9 For further discussion see the Comptroller’s Office’s report, “The Comptroller’s Comments on
the Preliminary Budget for Fiscal Year 2005 and the Financial Plan for Fiscal Years 2005-2008,” March 2004.
18
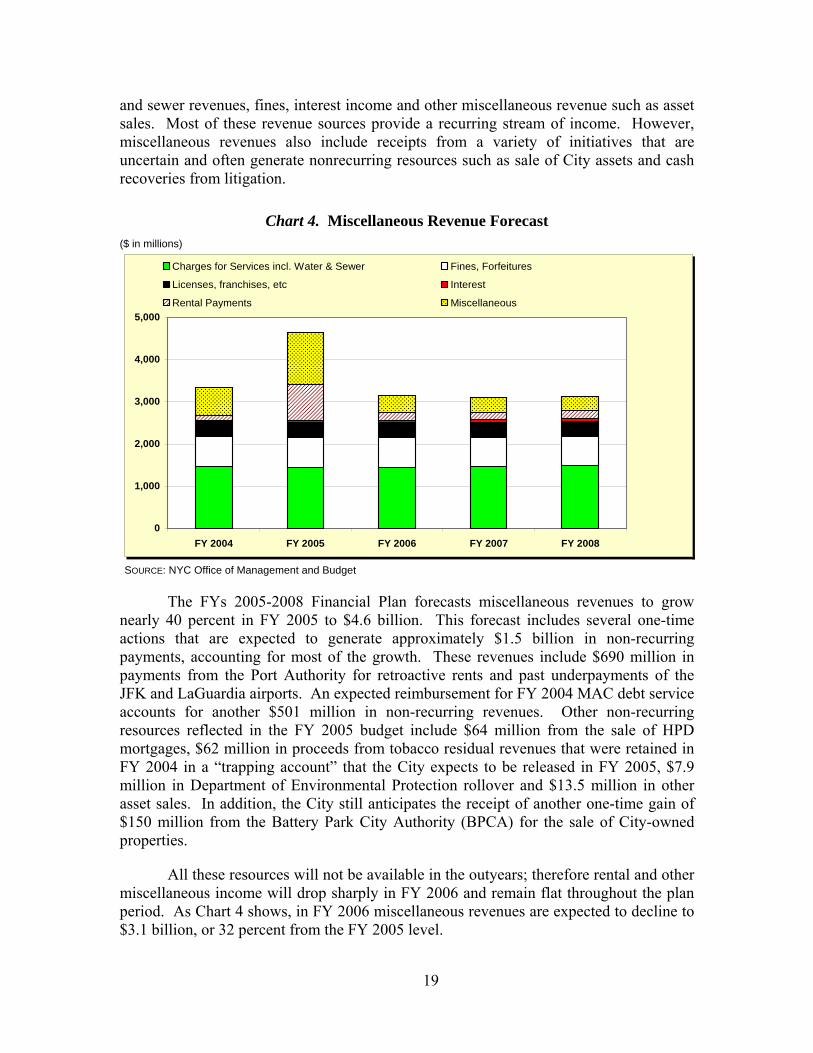
and sewer revenues, fines, interest income and other miscellaneous revenue such as asset sales. Most of these revenue sources provide a recurring stream of income. However, miscellaneous revenues also include receipts from a variety of initiatives that are uncertain and often generate nonrecurring resources such as sale of City assets and cash recoveries from litigation.
Chart 4. Miscellaneous Revenue Forecast ($ in millions)
0
1,000
2,000
3,000
4,000
5,000
FY 2004 FY 2005 FY 2006 FY 2007 FY 2008
Charges for Services incl. Water & Sewer Fines, Forfeitures
Licenses, franchises, etc Interest
Rental Payments Miscellaneous
SOURCE: NYC Office of Management and Budget
The FYs 2005-2008 Financial Plan forecasts miscellaneous revenues to grow nearly 40 percent in FY 2005 to $4.6 billion. This forecast includes several one-time actions that are expected to generate approximately $1.5 billion in non-recurring payments, accounting for most of the growth. These revenues include $690 million in payments from the Port Authority for retroactive rents and past underpayments of the JFK and LaGuardia airports. An expected reimbursement for FY 2004 MAC debt service accounts for another $501 million in non-recurring revenues. Other non-recurring resources reflected in the FY 2005 budget include $64 million from the sale of HPD mortgages, $62 million in proceeds from tobacco residual revenues that were retained in FY 2004 in a “trapping account” that the City expects to be released in FY 2005, $7.9 million in Department of Environmental Protection rollover and $13.5 million in other asset sales. In addition, the City still anticipates the receipt of another one-time gain of $150 million from the Battery Park City Authority (BPCA) for the sale of City-owned properties.
All these resources will not be available in the outyears; therefore rental and other miscellaneous income will drop sharply in FY 2006 and remain flat throughout the plan period. As Chart 4 shows, in FY 2006 miscellaneous revenues are expected to decline to $3.1 billion, or 32 percent from the FY 2005 level.
19
Charges for services such as tuition at community colleges are expected to yield on average $516 million annually while proceeds from water and sewer charges are expected to generate the bulk of the miscellaneous revenue between FY 2006 and FY 2008 ranging from $930 million to $967 million.10 Projections for licenses, franchises and permits are expected to remain flat throughout the financial plan, yielding on average $354 million annually. Interest income is projected to generate on average approximately two percent of miscellaneous revenue over the next four years ranging from $35 million in FY 2005 to $74 million in FY 2008.
Revenues from fines and forfeitures are expected to be $709 million in FY 2005 and drop slightly to $704 million in the outyears of the plan. Fine revenue alone accounts for 99.4 percent of this total. The City expects to collect $704 million in fine revenues in FY 2005 and around $700 million annually over the course of the plan. The City anticipates revenues from parking fines and red-light traffic violations will grow by $22 million in FY 2005 to $584 million due mainly to increased enforcement of parking regulations as well as the full year impact of the increase in the surcharge on parking fines.
Intergovernmental Aid
In the FY 2005 Adopted Budget, the City’s Federal and State grants assumptions have increased by $70 million, boosting Federal grants to $4.73 billion and State grants to $8.63 billion. State grants have risen by a total of $53 million in FY 2005, including $19 million from increased support for foster care spending, $12 million from a shift of recycling grants from FY 2004 into the current year, $11 million from greater CUNY community college aid, and $11 million from various health and mental health programmatic increases. The Adopted Budget also contains a modest increase in Federal grants of about $17 million, consisting mainly of an increase of $14 million in support for foster care expenditures.
In its gap-closing program, the City has reduced its assumptions of additional Federal and State support in the Adopted Budget. For FY 2005, the City now anticipates additional State and Federal support of $400 million and $50 million, respectively. These assumptions reflect a decline of $100 million in anticipated Federal actions compared with projections in the Executive Budget. The City is seeking to achieve these initiatives from its Federal and State agenda, a menu of actions totaling $2.2 billion that are evenly split between Federal and State proposals. The major components include State Medicaid reform of $659 million, enhanced homeland security funding of $400 million, and fully authorized Federal Title I education funding of $400 million.
The prospect of obtaining further assistance from these sources remains the same as in the Executive Budget. The lack of a State budget in the current year still casts
10 Water and Sewer revenues are used to defray the cost of providing water and waste water
services. Similarly, CUNY revenues are used to support CUNY’s expenditures. Both these revenues streams are not available for general operating purposes.
20
uncertainties over the City’s assumptions for additional State assistance. Under the Governor’s proposed budget, about half of the projected State support appears achievable. However, the State Legislature ended its recent session without producing a budget agreement. The principal issue which appears to be holding up State budget negotiations is the formulation of a plan to satisfy the mandate imposed by the Campaign for Fiscal Equity (CFE) court ruling.11 The State has until July 30 to develop a plan to revamp its education funding mechanism. Thus, it appears unlikely that there will be any progress in solving the current State budget impasse until the CFE issue is resolved.
Changes to the City’s baseline Federal and State grant assumptions are modest in the outyears of the plan. The June Plan incorporated increases of about $14 million annually in FYs 2006-2008, mostly for increased support for community college expenditures. The City projects State categorical grants of between $8.56 billion and $8.71 billion annually over this period, while Federal categorical grants are expected to stay in a narrow range of between $4.63 billion and $4.65 billion each year. Further, as part of its gap-closing effort, the City has removed its entire assumed additional Federal support of $150 million in each of the outyears. As a result, anticipated aid in this area will now consist solely of $400 million in expected budget relief from State actions.
B. EXPENDITURES
Overtime
The City has budgeted $637 million for overtime expenditures in FY 2005. This is $220 million lower than the forecast for FY 2004. However, the Comptroller’s Office’s analysis of overtime spending indicates that the City may have underestimated overtime spending by $121 million. As Table 16 on page 22 shows, uniformed police overtime is estimated to account for the bulk of the overtime risk. The Comptroller’s Office estimates that police uniformed overtime spending will total $356 million in FY 2005, $85 million over the City’s estimate or 70 percent of total overtime risk. Uniformed sanitation and correction officers’ overtime account for the remaining $16 million risk in uniformed overtime assumptions.
11 See “Department of Education” beginning on page 34 for a more detailed discussion of the
Campaign for Fiscal Equity court case.
21
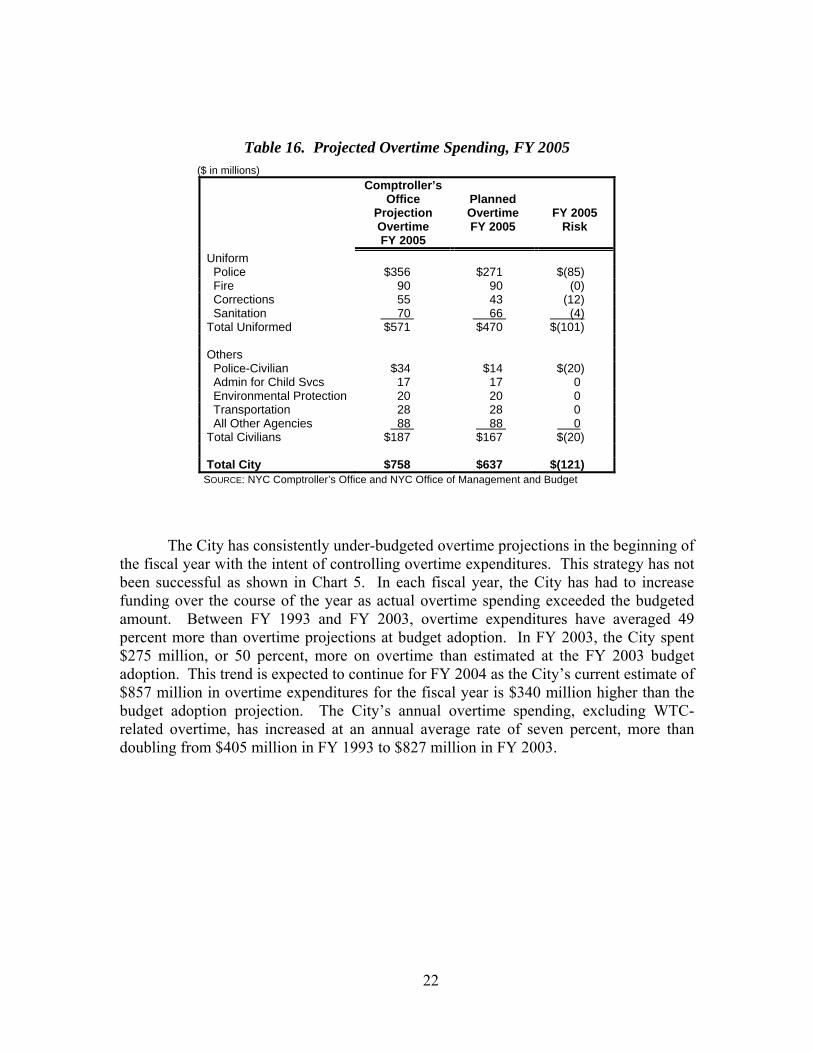
Table 16. Projected Overtime Spending, FY 2005 ($ in millions)
Comptroller’s Office
Projection Overtime FY 2005
Planned Overtime FY 2005
FY 2005 Risk
Uniform Police $356 $271 $(85) Fire 90 90 (0) Corrections 55 43 (12) Sanitation 70 66 (4)Total Uniformed $571 $470 $(101) Others Police-Civilian $34 $14 $(20) Admin for Child Svcs 17 17 0 Environmental Protection 20 20 0 Transportation 28 28 0 All Other Agencies 88 88 0Total Civilians $187 $167 $(20) Total City $758 $637 $(121)
SOURCE: NYC Comptroller’s Office and NYC Office of Management and Budget
The City has consistently under-budgeted overtime projections in the beginning of the fiscal year with the intent of controlling overtime expenditures. This strategy has not been successful as shown in Chart 5. In each fiscal year, the City has had to increase funding over the course of the year as actual overtime spending exceeded the budgeted amount. Between FY 1993 and FY 2003, overtime expenditures have averaged 49 percent more than overtime projections at budget adoption. In FY 2003, the City spent $275 million, or 50 percent, more on overtime than estimated at the FY 2003 budget adoption. This trend is expected to continue for FY 2004 as the City’s current estimate of $857 million in overtime expenditures for the fiscal year is $340 million higher than the budget adoption projection. The City’s annual overtime spending, excluding WTC-related overtime, has increased at an annual average rate of seven percent, more than doubling from $405 million in FY 1993 to $827 million in FY 2003.
22
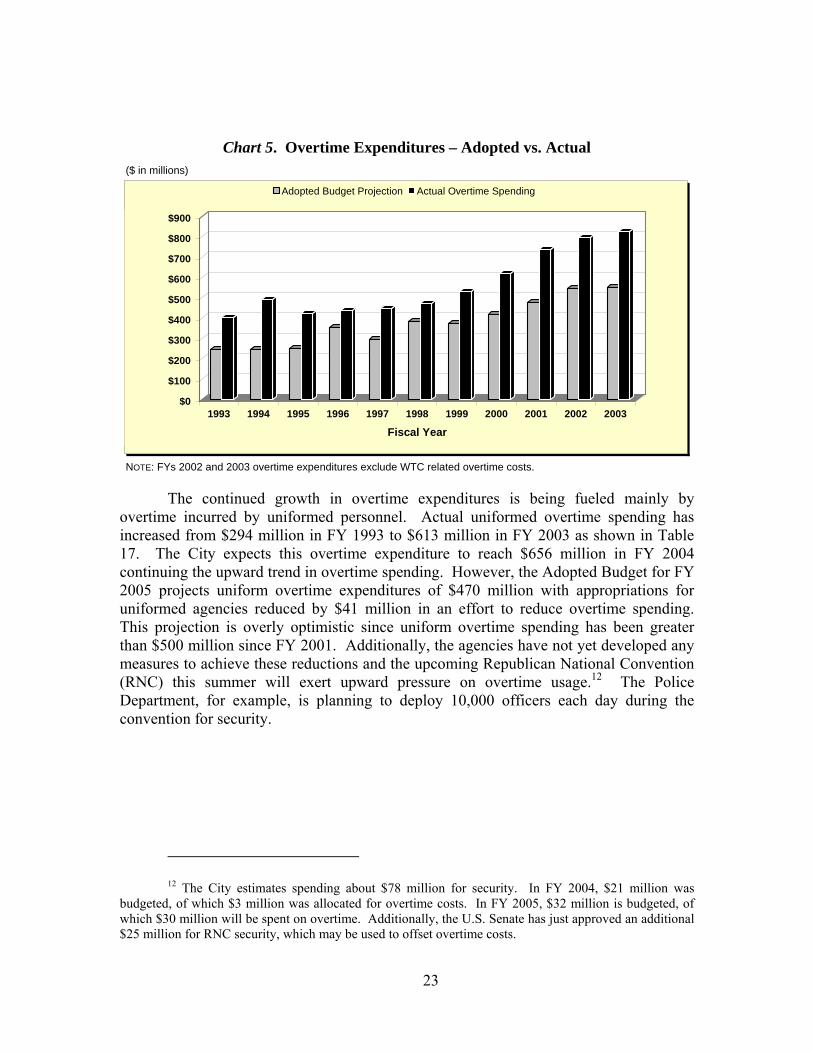
Chart 5. Overtime Expenditures – Adopted vs. Actual ($ in millions)
$0
$100
$200
$300
$400
$500
$600
$700
$800
$900
1993 1994 1995 1996 1997 1998 1999 2000 2001 2002 2003
Fiscal Year
Adopted Budget Projection Actual Overtime Spending
NOTE: FYs 2002 and 2003 overtime expenditures exclude WTC related overtime costs.
The continued growth in overtime expenditures is being fueled mainly by overtime incurred by uniformed personnel. Actual uniformed overtime spending has increased from $294 million in FY 1993 to $613 million in FY 2003 as shown in Table 17. The City expects this overtime expenditure to reach $656 million in FY 2004 continuing the upward trend in overtime spending. However, the Adopted Budget for FY 2005 projects uniform overtime expenditures of $470 million with appropriations for uniformed agencies reduced by $41 million in an effort to reduce overtime spending. This projection is overly optimistic since uniform overtime spending has been greater than $500 million since FY 2001. Additionally, the agencies have not yet developed any measures to achieve these reductions and the upcoming Republican National Convention (RNC) this summer will exert upward pressure on overtime usage.12 The Police Department, for example, is planning to deploy 10,000 officers each day during the convention for security.
12 The City estimates spending about $78 million for security. In FY 2004, $21 million was
budgeted, of which $3 million was allocated for overtime costs. In FY 2005, $32 million is budgeted, of which $30 million will be spent on overtime. Additionally, the U.S. Senate has just approved an additional $25 million for RNC security, which may be used to offset overtime costs.
23
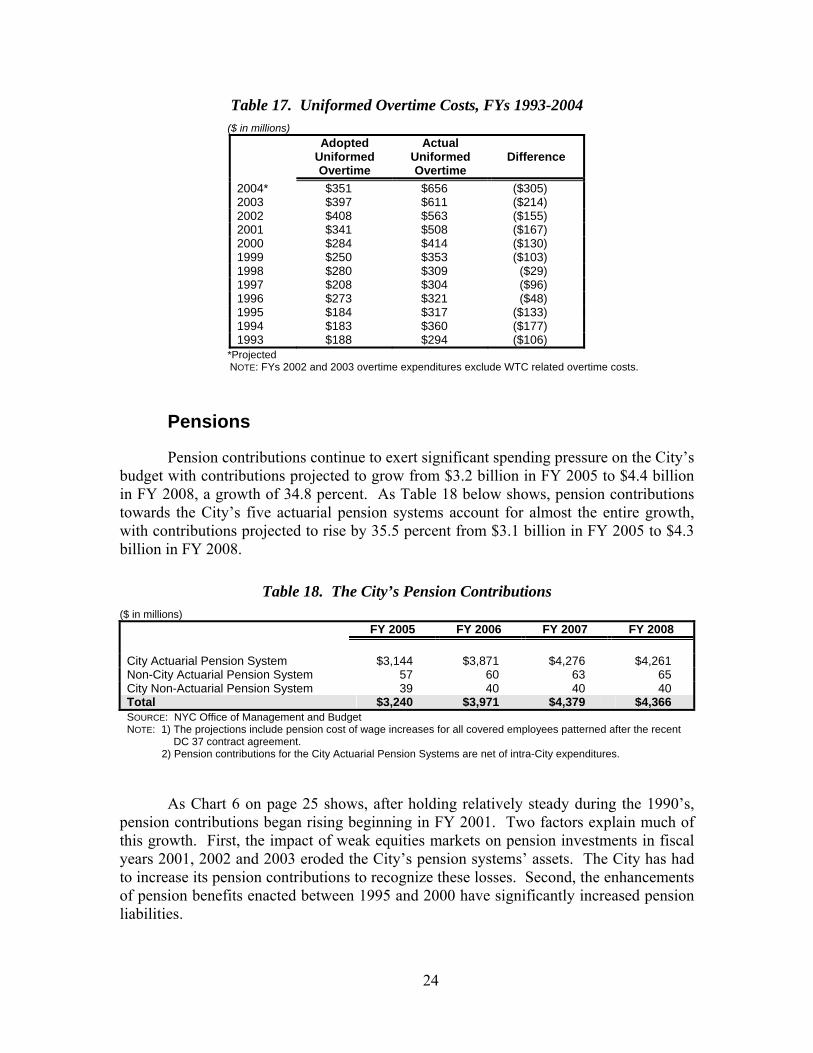
Table 17. Uniformed Overtime Costs, FYs 1993-2004 ($ in millions)
Adopted Uniformed Overtime
Actual Uniformed Overtime
Difference
2004* $351 $656 ($305) 2003 $397 $611 ($214) 2002 $408 $563 ($155) 2001 $341 $508 ($167) 2000 $284 $414 ($130) 1999 $250 $353 ($103) 1998 $280 $309 ($29) 1997 $208 $304 ($96) 1996 $273 $321 ($48) 1995 $184 $317 ($133) 1994 $183 $360 ($177) 1993 $188 $294 ($106)
*Projected NOTE: FYs 2002 and 2003 overtime expenditures exclude WTC related overtime costs.
Pensions
Pension contributions continue to exert significant spending pressure on the City’s budget with contributions projected to grow from $3.2 billion in FY 2005 to $4.4 billion in FY 2008, a growth of 34.8 percent. As Table 18 below shows, pension contributions towards the City’s five actuarial pension systems account for almost the entire growth, with contributions projected to rise by 35.5 percent from $3.1 billion in FY 2005 to $4.3 billion in FY 2008.
Table 18. The City’s Pension Contributions ($ in millions)
FY 2005 FY 2006 FY 2007 FY 2008 City Actuarial Pension System $3,144 $3,871 $4,276 $4,261 Non-City Actuarial Pension System 57 60 63 65 City Non-Actuarial Pension System 39 40 40 40 Total $3,240 $3,971 $4,379 $4,366 SOURCE: NYC Office of Management and Budget NOTE: 1) The projections include pension cost of wage increases for all covered employees patterned after the recent
DC 37 contract agreement. 2) Pension contributions for the City Actuarial Pension Systems are net of intra-City expenditures.
As Chart 6 on page 25 shows, after holding relatively steady during the 1990’s, pension contributions began rising beginning in FY 2001. Two factors explain much of this growth. First, the impact of weak equities markets on pension investments in fiscal years 2001, 2002 and 2003 eroded the City’s pension systems’ assets. The City has had to increase its pension contributions to recognize these losses. Second, the enhancements of pension benefits enacted between 1995 and 2000 have significantly increased pension liabilities.
24
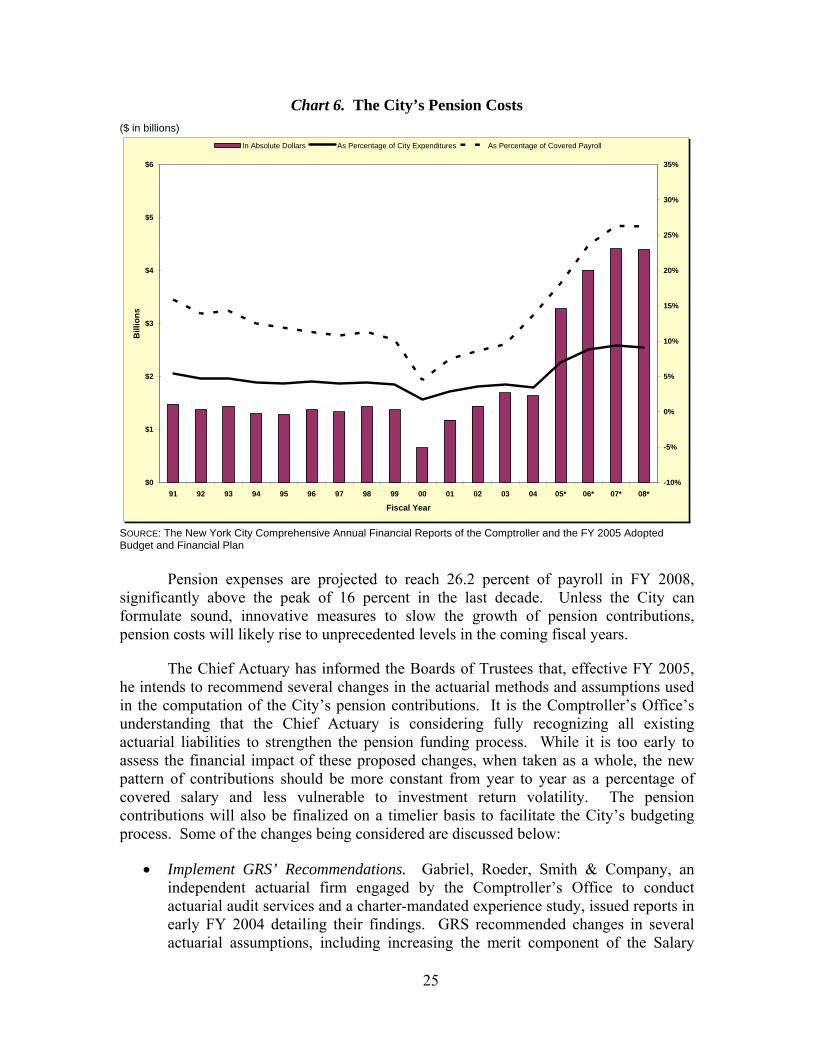
Chart 6. The City’s Pension Costs ($ in billions)
$0
$1
$2
$3
$4
$5
$6
91 92 93 94 95 96 97 98 99 00 01 02 03 04 05* 06* 07* 08*
Fiscal Year
Bill
ions
-10%
-5%
0%
5%
10%
15%
20%
25%
30%
35%
In Absolute Dollars As Percentage of City Expenditures As Percentage of Covered Payroll
SOURCE: The New York City Comprehensive Annual Financial Reports of the Comptroller and the FY 2005 Adopted Budget and Financial Plan
Pension expenses are projected to reach 26.2 percent of payroll in FY 2008, significantly above the peak of 16 percent in the last decade. Unless the City can formulate sound, innovative measures to slow the growth of pension contributions, pension costs will likely rise to unprecedented levels in the coming fiscal years.
The Chief Actuary has informed the Boards of Trustees that, effective FY 2005, he intends to recommend several changes in the actuarial methods and assumptions used in the computation of the City’s pension contributions. It is the Comptroller’s Office’s understanding that the Chief Actuary is considering fully recognizing all existing actuarial liabilities to strengthen the pension funding process. While it is too early to assess the financial impact of these proposed changes, when taken as a whole, the new pattern of contributions should be more constant from year to year as a percentage of covered salary and less vulnerable to investment return volatility. The pension contributions will also be finalized on a timelier basis to facilitate the City’s budgeting process. Some of the changes being considered are discussed below:
• Implement GRS’ Recommendations. Gabriel, Roeder, Smith & Company, an independent actuarial firm engaged by the Comptroller’s Office to conduct actuarial audit services and a charter-mandated experience study, issued reports in early FY 2004 detailing their findings. GRS recommended changes in several actuarial assumptions, including increasing the merit component of the Salary
25
Scale assumption in NYCERS, TRS and BERS; increasing the Baseline Overtime assumption in NYCERS; increasing the Withdrawal assumption in TRS; and increasing the Accidental Disability assumption in FIRE. If all of GRS’ recommendations are implemented, the City’s annual pension contributions could increase by $200 million to $250 million.
At this time, the Chief Actuary of the retirement systems, who is ultimately responsible for recommending changes to the Boards of Trustees and will determine whether to modify, ignore or add to GRS’ recommendations, has reviewed GRS’ reports and is formulating his own set of recommendations for change. Until his package of changes is finalized, the cost impact cannot be predicted.
• Recognize fully the liabilities created by the cost of living allowances (COLA) enacted by Chapter 125 of the Laws of 2000. Chapter 125 mandated that recognition of the liability created by the new COLA benefits be phased-in over five years. Subsequently, Chapter 278 of the Laws of 2002 extended the phase-in period to ten years. The Chief Actuary is considering seeking the discontinuance of the current ten-year phase-in and recognizing the full liability of the new COLA. Depending on the methodology used, this could increase the City’s annual pension contributions by $250 to $350 million.
• Introduce a one-year lag in the City’s pension contribution calculations. The proposal is to use data from a year earlier than currently mandated to compute employer pension contributions. Currently, the City’s contributions to the pension funds for a given fiscal year are based on data as of the last day of the prior fiscal year. For example, the contribution computations for FY 2004 are based on census data and actuarial asset values as of June 30, 2003.
This does not allow the computation of pension contributions to be finalized until the latter half of the fiscal year because of the size and complexity of the pension systems. As a result, when the pension contributions are finalized they may differ substantially from budget projections. If the final contributions are significantly higher than earlier projections the City will have limited flexibility in allocating funding for the additional contribution this late into the fiscal year.
The Chief Actuary is considering the possible introduction of a one-year-lag i.e., basing employer contribution calculations on data a year older than current practice on the theory that this would resolve these problems as pension contributions for any fiscal year would be known with certainty well before the start of the fiscal year. For example, if the FY 2005 pension contributions were to be based on June 30, 2003 data and actuarial asset values, the City would have known with certainty its required pension contributions for FY 2005 by April 2004, well before the adoption of the FY 2005 budget, and avoid surprises in the middle or the end of the fiscal year.
26
• Change the Five-year Phase-in in the Actuarial Asset Valuation Method to a Seven-year Phase-in. The City currently uses an actuarial asset valuation method that phases in “unexpected” investment returns over a five-year period. The bear markets earlier this decade have forced the City to realize that the five-year phase-in period does not adequately dampen the volatility of the City’s contributions over a full investment cycle – the Comptroller’s Office believes that a nine-year phase-in produces the best smoothing of investment volatility. Accordingly, the Chief Actuary is considering increasing the phase-in period to seven years to better match investment-market cycles and further lessens the volatility of the City’s pension contributions. If this change is implemented, it is expected to lower the rate of increase in the City’s pension contributions as compared to the Adopted Budget projections, not only because the recognition of “unexpected investment losses” suffered in FYs 2001-2003 will be further delayed, but also because those losses will have the opportunity to be offset by “unexpected investment gains” in subsequent years.13
Preliminary estimates indicate that FY 2004 pension fund investment returns averaged about 16.3 percent through June 30, 2004. Investment returns generally impact future City contributions. The Adopted Budget projections assume that investment returns will equal eight percent of actuarial asset value in each fiscal year from FY 2004 and beyond. To the extent investment returns are higher or lower than eight percent in any fiscal year, future contributions will decrease or increase under the current actuarial methodology used by the City. If all the changes discussed above are implemented, particularly the one-year lag, it is not clear at this point what the City’s FYs 2005 to 2008 pension contributions are going to be, or how those contributions will be affected by the FY 2004 investment returns.
Health Insurance
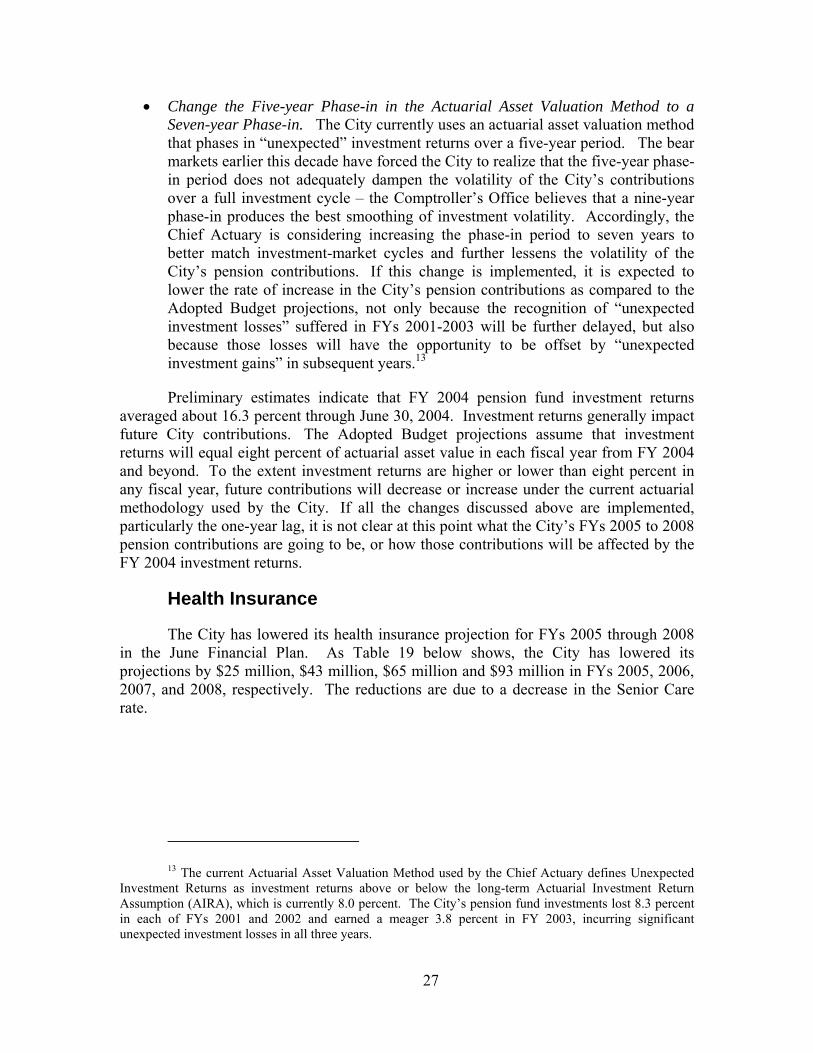
The City has lowered its health insurance projection for FYs 2005 through 2008 in the June Financial Plan. As Table 19 below shows, the City has lowered its projections by $25 million, $43 million, $65 million and $93 million in FYs 2005, 2006, 2007, and 2008, respectively. The reductions are due to a decrease in the Senior Care rate.
13 The current Actuarial Asset Valuation Method used by the Chief Actuary defines Unexpected
Investment Returns as investment returns above or below the long-term Actuarial Investment Return Assumption (AIRA), which is currently 8.0 percent. The City’s pension fund investments lost 8.3 percent in each of FYs 2001 and 2002 and earned a meager 3.8 percent in FY 2003, incurring significant unexpected investment losses in all three years.
27
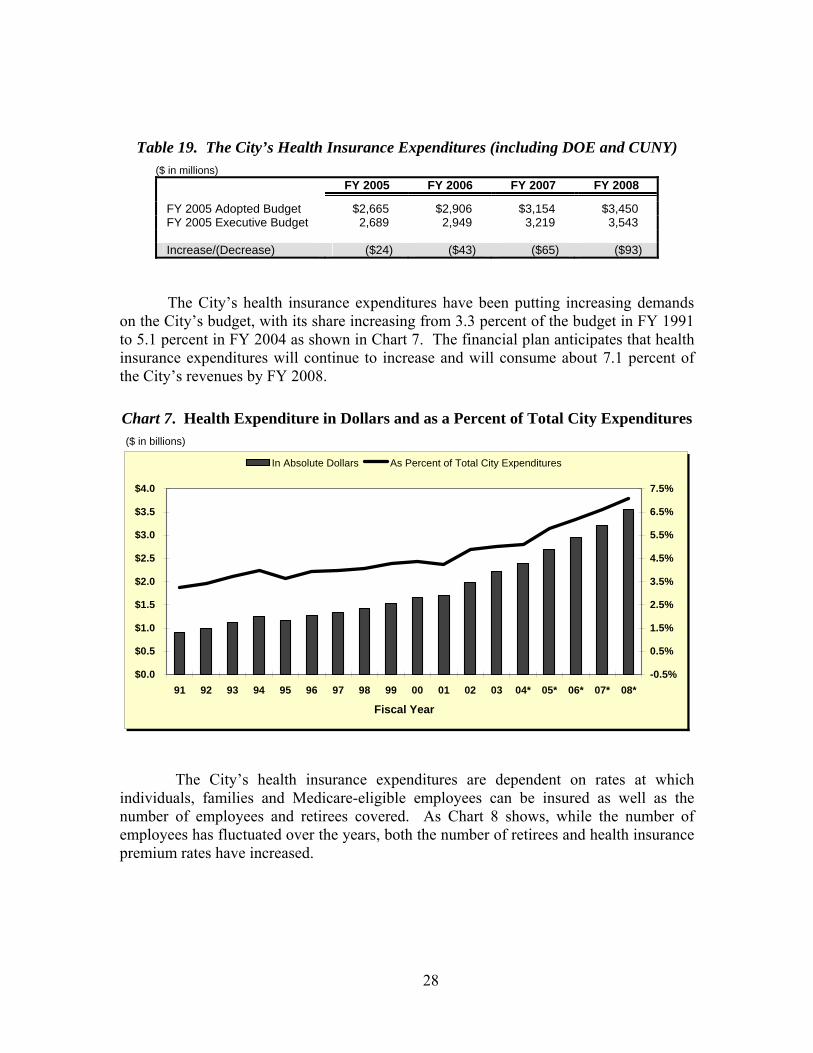
Table 19. The City’s Health Insurance Expenditures (including DOE and CUNY) ($ in millions)
FY 2005 FY 2006 FY 2007 FY 2008
FY 2005 Adopted Budget $2,665 $2,906 $3,154 $3,450 FY 2005 Executive Budget 2,689 2,949 3,219 3,543 Increase/(Decrease) ($24) ($43) ($65) ($93)
The City’s health insurance expenditures have been putting increasing demands on the City’s budget, with its share increasing from 3.3 percent of the budget in FY 1991 to 5.1 percent in FY 2004 as shown in Chart 7. The financial plan anticipates that health insurance expenditures will continue to increase and will consume about 7.1 percent of the City’s revenues by FY 2008.
Chart 7. Health Expenditure in Dollars and as a Percent of Total City Expenditures ($ in billions)
$0.0
$0.5
$1.0
$1.5
$2.0
$2.5
$3.0
$3.5
$4.0
91 92 93 94 95 96 97 98 99 00 01 02 03 04* 05* 06* 07* 08*
Fiscal Year
-0.5%
0.5%
1.5%
2.5%
3.5%
4.5%
5.5%
6.5%
7.5%
In Absolute Dollars As Percent of Total City Expenditures
The City’s health insurance expenditures are dependent on rates at which individuals, families and Medicare-eligible employees can be insured as well as the number of employees and retirees covered. As Chart 8 shows, while the number of employees has fluctuated over the years, both the number of retirees and health insurance premium rates have increased.
28
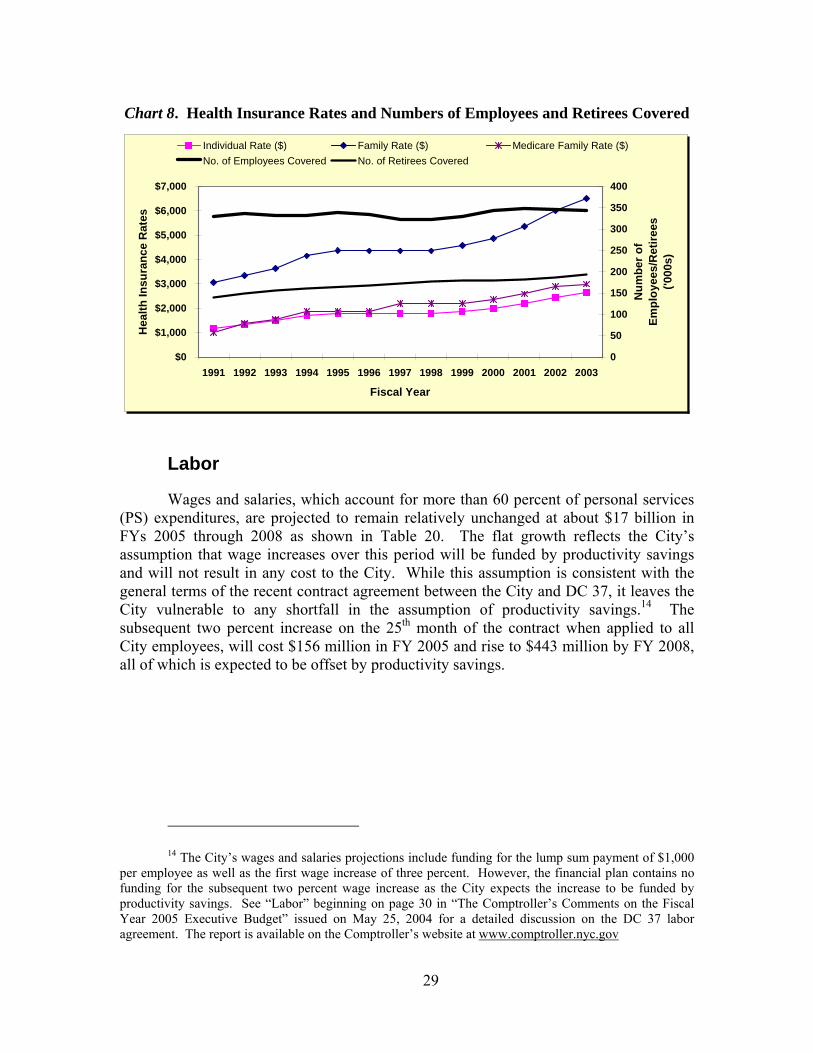
Chart 8. Health Insurance Rates and Numbers of Employees and Retirees Covered
$0
$1,000
$2,000
$3,000
$4,000
$5,000
$6,000
$7,000
1991 1992 1993 1994 1995 1996 1997 1998 1999 2000 2001 2002 2003
Fiscal Year
Hea
lth In
sura
nce
Rat
es
0
50
100
150
200
250
300
350
400
Num
ber o
f Em
ploy
ees/
Ret
irees
('0
00s)
Individual Rate ($) Family Rate ($) Medicare Family Rate ($)No. of Employees Covered No. of Retirees Covered
Labor
Wages and salaries, which account for more than 60 percent of personal services (PS) expenditures, are projected to remain relatively unchanged at about $17 billion in FYs 2005 through 2008 as shown in Table 20. The flat growth reflects the City’s assumption that wage increases over this period will be funded by productivity savings and will not result in any cost to the City. While this assumption is consistent with the general terms of the recent contract agreement between the City and DC 37, it leaves the City vulnerable to any shortfall in the assumption of productivity savings.14 The subsequent two percent increase on the 25th month of the contract when applied to all City employees, will cost $156 million in FY 2005 and rise to $443 million by FY 2008, all of which is expected to be offset by productivity savings.
14 The City’s wages and salaries projections include funding for the lump sum payment of $1,000
per employee as well as the first wage increase of three percent. However, the financial plan contains no funding for the subsequent two percent wage increase as the City expects the increase to be funded by productivity savings. See “Labor” beginning on page 30 in “The Comptroller’s Comments on the Fiscal Year 2005 Executive Budget” issued on May 25, 2004 for a detailed discussion on the DC 37 labor agreement. The report is available on the Comptroller’s website at www.comptroller.nyc.gov
29
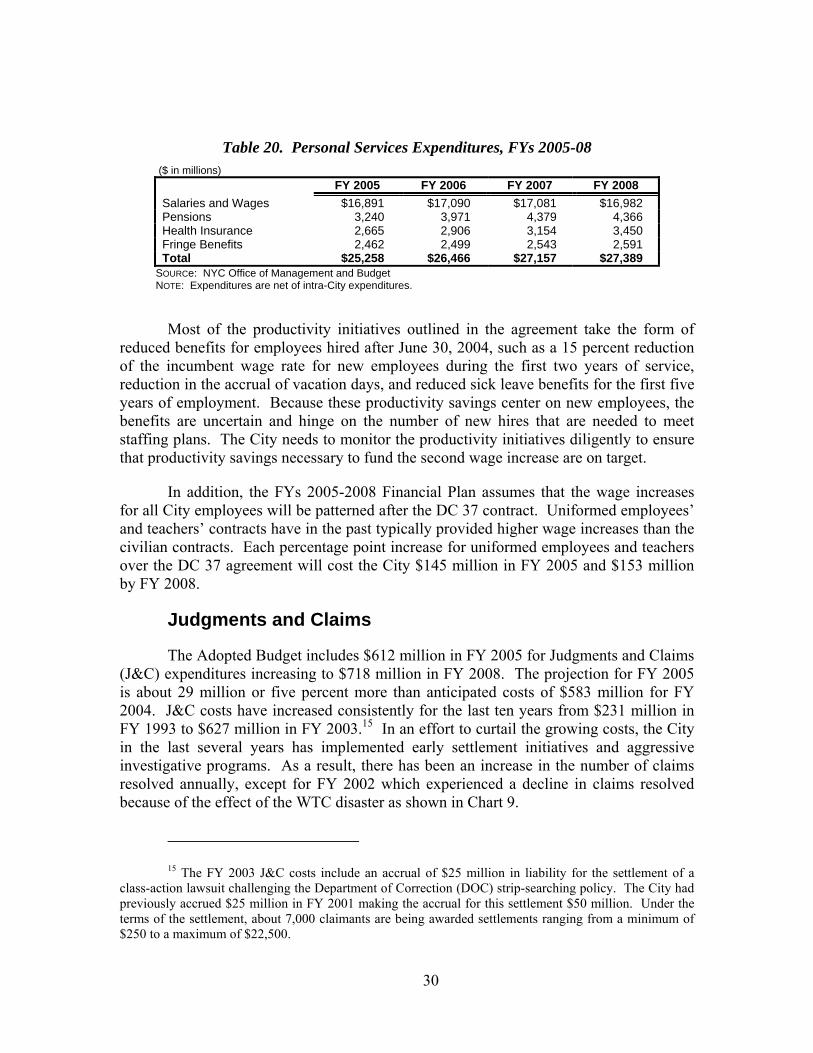
Table 20. Personal Services Expenditures, FYs 2005-08 ($ in millions) FY 2005 FY 2006 FY 2007 FY 2008 Salaries and Wages $16,891 $17,090 $17,081 $16,982 Pensions 3,240 3,971 4,379 4,366 Health Insurance 2,665 2,906 3,154 3,450 Fringe Benefits 2,462 2,499 2,543 2,591 Total $25,258 $26,466 $27,157 $27,389
SOURCe: NYC Office of Management and Budget NOTE: Expenditures are net of intra-City expenditures.
Most of the productivity initiatives outlined in the agreement take the form of reduced benefits for employees hired after June 30, 2004, such as a 15 percent reduction of the incumbent wage rate for new employees during the first two years of service, reduction in the accrual of vacation days, and reduced sick leave benefits for the first five years of employment. Because these productivity savings center on new employees, the benefits are uncertain and hinge on the number of new hires that are needed to meet staffing plans. The City needs to monitor the productivity initiatives diligently to ensure that productivity savings necessary to fund the second wage increase are on target.
In addition, the FYs 2005-2008 Financial Plan assumes that the wage increases for all City employees will be patterned after the DC 37 contract. Uniformed employees’ and teachers’ contracts have in the past typically provided higher wage increases than the civilian contracts. Each percentage point increase for uniformed employees and teachers over the DC 37 agreement will cost the City $145 million in FY 2005 and $153 million by FY 2008.
Judgments and Claims
The Adopted Budget includes $612 million in FY 2005 for Judgments and Claims (J&C) expenditures increasing to $718 million in FY 2008. The projection for FY 2005 is about 29 million or five percent more than anticipated costs of $583 million for FY 2004. J&C costs have increased consistently for the last ten years from $231 million in FY 1993 to $627 million in FY 2003.15 In an effort to curtail the growing costs, the City in the last several years has implemented early settlement initiatives and aggressive investigative programs. As a result, there has been an increase in the number of claims resolved annually, except for FY 2002 which experienced a decline in claims resolved because of the effect of the WTC disaster as shown in Chart 9.
15 The FY 2003 J&C costs include an accrual of $25 million in liability for the settlement of a
class-action lawsuit challenging the Department of Correction (DOC) strip-searching policy. The City had previously accrued $25 million in FY 2001 making the accrual for this settlement $50 million. Under the terms of the settlement, about 7,000 claimants are being awarded settlements ranging from a minimum of $250 to a maximum of $22,500.
30
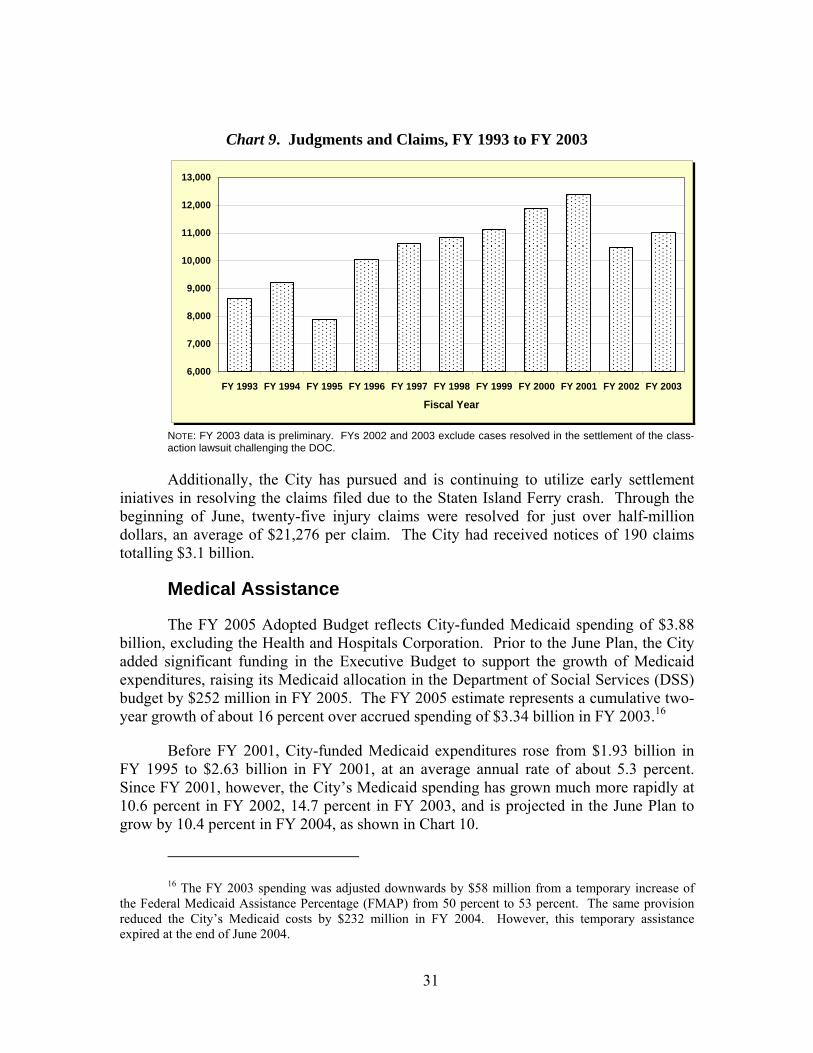
Chart 9. Judgments and Claims, FY 1993 to FY 2003
6,000
7,000
8,000
9,000
10,000
11,000
12,000
13,000
FY 1993 FY 1994 FY 1995 FY 1996 FY 1997 FY 1998 FY 1999 FY 2000 FY 2001 FY 2002 FY 2003
Fiscal Year
NOTE: FY 2003 data is preliminary. FYs 2002 and 2003 exclude cases resolved in the settlement of the class- action lawsuit challenging the DOC.
Additionally, the City has pursued and is continuing to utilize early settlement iniatives in resolving the claims filed due to the Staten Island Ferry crash. Through the beginning of June, twenty-five injury claims were resolved for just over half-million dollars, an average of $21,276 per claim. The City had received notices of 190 claims totalling $3.1 billion.
Medical Assistance
The FY 2005 Adopted Budget reflects City-funded Medicaid spending of $3.88 billion, excluding the Health and Hospitals Corporation. Prior to the June Plan, the City added significant funding in the Executive Budget to support the growth of Medicaid expenditures, raising its Medicaid allocation in the Department of Social Services (DSS) budget by $252 million in FY 2005. The FY 2005 estimate represents a cumulative two-year growth of about 16 percent over accrued spending of $3.34 billion in FY 2003.16
Before FY 2001, City-funded Medicaid expenditures rose from $1.93 billion in FY 1995 to $2.63 billion in FY 2001, at an average annual rate of about 5.3 percent. Since FY 2001, however, the City’s Medicaid spending has grown much more rapidly at 10.6 percent in FY 2002, 14.7 percent in FY 2003, and is projected in the June Plan to grow by 10.4 percent in FY 2004, as shown in Chart 10.
16 The FY 2003 spending was adjusted downwards by $58 million from a temporary increase of
the Federal Medicaid Assistance Percentage (FMAP) from 50 percent to 53 percent. The same provision reduced the City’s Medicaid costs by $232 million in FY 2004. However, this temporary assistance expired at the end of June 2004.
31
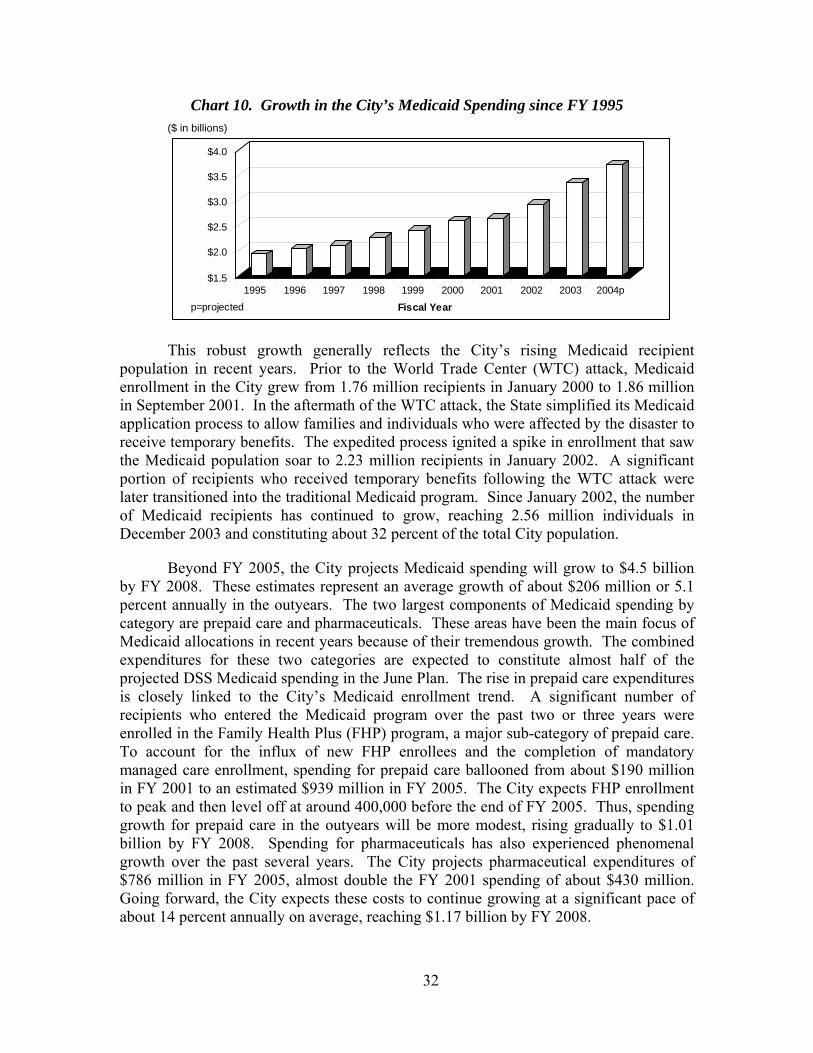
Chart 10. Growth in the City’s Medicaid Spending since FY 1995 ($ in billions)
$1.5
$2.0
$2.5
$3.0
$3.5
$4.0
1995 1996 1997 1998 1999 2000 2001 2002 2003 2004p
Fiscal Yearp=projected
This robust growth generally reflects the City’s rising Medicaid recipient population in recent years. Prior to the World Trade Center (WTC) attack, Medicaid enrollment in the City grew from 1.76 million recipients in January 2000 to 1.86 million in September 2001. In the aftermath of the WTC attack, the State simplified its Medicaid application process to allow families and individuals who were affected by the disaster to receive temporary benefits. The expedited process ignited a spike in enrollment that saw the Medicaid population soar to 2.23 million recipients in January 2002. A significant portion of recipients who received temporary benefits following the WTC attack were later transitioned into the traditional Medicaid program. Since January 2002, the number of Medicaid recipients has continued to grow, reaching 2.56 million individuals in December 2003 and constituting about 32 percent of the total City population.
Beyond FY 2005, the City projects Medicaid spending will grow to $4.5 billion by FY 2008. These estimates represent an average growth of about $206 million or 5.1 percent annually in the outyears. The two largest components of Medicaid spending by category are prepaid care and pharmaceuticals. These areas have been the main focus of Medicaid allocations in recent years because of their tremendous growth. The combined expenditures for these two categories are expected to constitute almost half of the projected DSS Medicaid spending in the June Plan. The rise in prepaid care expenditures is closely linked to the City’s Medicaid enrollment trend. A significant number of recipients who entered the Medicaid program over the past two or three years were enrolled in the Family Health Plus (FHP) program, a major sub-category of prepaid care. To account for the influx of new FHP enrollees and the completion of mandatory managed care enrollment, spending for prepaid care ballooned from about $190 million in FY 2001 to an estimated $939 million in FY 2005. The City expects FHP enrollment to peak and then level off at around 400,000 before the end of FY 2005. Thus, spending growth for prepaid care in the outyears will be more modest, rising gradually to $1.01 billion by FY 2008. Spending for pharmaceuticals has also experienced phenomenal growth over the past several years. The City projects pharmaceutical expenditures of $786 million in FY 2005, almost double the FY 2001 spending of about $430 million. Going forward, the City expects these costs to continue growing at a significant pace of about 14 percent annually on average, reaching $1.17 billion by FY 2008.
32
The City’s prospect of significantly reducing its Medicaid burden appears limited in the short term. While the Governor’s proposed budget contains savings actions totaling $130 million (including the phase-in takeover of long-term care and pharmaceutical cost containment), it also includes certain cost shifts to the City that would reduce the overall Medicaid savings to about $80 million annually. In addition, the President’s budget failed to include a proposal to extend the current temporary Federal Medicaid Assistance Percentage (FMAP) increase beyond June 2004, which would save the City over $230 million each year.
Public Assistance
The City has reported a modest increase in its public assistance caseload in May, rising by 971 recipients to 439,033. With just one month remaining in FY 2004, the City’s welfare rolls have grown by slightly over four percent from the FY 2003 year-end caseload of 421,546. The May caseload increase marked the sixth consecutive month that the City’s welfare caseload had risen, indicating that a reversal of the declining caseload trend seen in recent years is slowly emerging. Further evidence of this trend is the fact that the City’s welfare caseload will record its first year-to-year increase since FY 1994.17
The City’s share of public assistance expenditures has been rising even as caseload continued falling in recent years. Since reaching a low of about $30 million in September 2001, the City’s share of monthly public assistance grant expenditures gradually began to edge up, well before the turnaround in caseload trend in the past several months. In May, monthly grant expenditures reached $41.2 million, after topping the $42 million mark in March 2004. These figures represent an increase of approximately 40 percent since September 2001.
The rising grant expenditures are mainly attributable to growth in the Safety Net Assistance (SNA) population, due to increasing number of traditional SNA recipients and the transfer of former Family Assistance (FA) into the SNA-Time Limit category. At the same time, savings from the drop-off in FA caseload, mostly from the ongoing time-limit transfers, fail to fully offset the rising costs of the SNA program. The City funds half of the expenditures in the State-mandated SNA program and 25 percent of expenditures in the Federally mandated FA program. As a result, the City’s share of public assistance grant expenditures has jumped from 32 percent, prior to the implementation of time-limit transfers, to the current ratio of almost 39 percent.
The Adopted Budget estimates public assistance caseload to grow to 458,902 by June 2005 and then stabilize at this level in the outyears of the plan. In support of these projections, the City has provided $491 million for public assistance grant expenditures annually in FYs 2005-2008. While the City’s caseload projections appear reasonable, the
17 Compared with the historical peak caseload of 1,160,593, the May welfare rolls are still 62
percent below that mark, which was reached in March 1995. Similarly, monthly grants spending has fallen by about 57 percent over the same period.
33
trend in grant expenditures suggests that additional funding may be needed. If monthly grant expenditures continue to rise, the City could face a risk of $15 million in FY 2005 and annual risks of $25 million in FYs 2006-2008.
Department of Education
The Department of Education (DOE) will begin FY 2005 with a key funding issue still waiting to be resolved, pending the State’s plan to meet the court order imposed by the Campaign for Fiscal Equity (CFE) ruling. The Court ruling requires the State to develop a plan to implement reform in its education aid formulas that would provide more equitable education funding to high needs districts, such as New York City, enabling these districts to provide students with “a sound basic education.” Under the Court mandate, the State must present its corrective action plan by July 30, 2004. The resolution of this issue will have a major impact on the DOE budget as it will likely lead to a significant increase in education funding from the State, as well as a likely contribution from the City.
The Senate and Assembly have surfaced separate proposals to address the CFE issue through education aid increases of $6.3 billion and $6.1 billion, respectively, over the next five years. Under the Senate proposal, the City would receive $2.3 billion in additional assistance while requiring the City to contribute over $550 million in the next five years. The Assembly proposal, which is more generous to the City, would provide the City with $3.9 billion in increased operating support and $1.3 billion in capital grants over the same timeframe. The City would be required to increase its own education support by $1.2 billion under the Assembly plan. Despite the announcement of these proposals, the State recently concluded its latest legislative session without a plan to meet the court ruling.
The Adopted Budget has provided a net increase of $23 million to the DOE in FY 2005 for the funding of several initiatives. The most significant changes include an increase of $10 million in the Department’s budget for reducing class sizes in the early grades. The new funding of $10 million raises the incremental increase to $35 million between FY 2004 and FY 2005, which would provide the equivalent of over 200 new classes in kindergarten through the third grade. The Adopted Budget has also restored a previous budget cut of $16 million in the Teacher’s Choice program, providing teachers with up to $200 in reimbursement for the purchase of textbooks and classroom materials.
In the outyears, the June Financial Plan has decreased DOE projected funding by approximately $15 million to $36 million each year, resulting mainly from revised health insurance cost projections. Projected spending by the Department is expected to range between $13.2 billion in FY 2006 and $13.4 billion in FY 2008. The largest areas of growth during these years are fringe benefits expenditures, which are projected to rise from $2 billion in FY 2005 to $2.3 billion in FY 2008. This increase is driven almost exclusively by health insurance costs, growing at an average rate of 8.7 percent annually
34
from $996 million in FY 2005 to $1.28 billion in FY 2008.18 Another area that also figures in the DOE budget increase in the outyears is non-public school payments, rising from $759 million in FY 2005 to $832 million in FY 2008. This category includes expenditures for pre-school special education, which are projected to rise by almost ten percent to $489 million in FY 2008 over the course of the plan. The impact of the CFE court case will certainly have a profound impact on the current outyear projections for the Department. As with FY 2005, pending the outcome of the CFE action plan, DOE budget allocations could increase dramatically in each of FYs 2006-2008.
Health and Hospitals Corporation
In the Adopted Budget, the City projects the Health and Hospitals Corporation (HHC) will enter FY 2005 with an opening cash balance of $308 million, an increase of about $137 million from the Executive Budget. The higher opening cash balance results from the timing of certain financial support from the City that was previously designated for FY 2005. The City-funded support, consisting of $159 million in unrestricted subsidy and debt service, will now be shifted forward to subsidize operations in FY 2004 instead, leading to a higher cash balance that will be carried forward into FY 2005. Though the change is merely a timing issue and has no net impact on HHC’s cash basis budget across the two years, the projected budget deficit for FY 2005 has increased significantly.
The Corporation currently projects an operating deficit of $394 million for FY 2005, reflecting an increase of $121 million from the Executive Budget forecast of $273 million. The timing of City-funded support and higher cost projections have both contributed to the increased deficit in FY 2005. Projected disbursements have risen by $40 million to $4.48 billion, through increases of $14 million in personnel costs and $22 million in revised OTPS expenditures. These changes are partly offset by a modest improvement in HHC’s revenue projections. The realignment of Medicaid collections between fee-for-service and manage care produces a net increase of $64 million and projected Medicare revenue has jumped by $47 million. However, the Corporation’s revenue forecast shows a net increase of only $59 million from the Executive Budget because of lower projections of indigent care pool ($34 million) and other payor ($19 million) revenues. Despite the larger operating deficit, HHC estimates a closing cash balance of $246 million for FY 2005, which is $79 million more than its previous assumption of $167 million. The Corporation expects to achieve this by increasing its reliance on Federal and State gap-closing actions by an additional $62 million. As a result, its gap-closing program has risen from $270 million in the Executive Budget to the current projection of $332 million. No specific details have been provided on these proposed actions.
Moving forward, the Corporation faces sizable operating deficits in the outyears of the plan. Beginning in FY 2006, HHC’s operating deficit is expected to spike to $518
18 See “Health Insurance” beginning on page 27 for a more detailed discussion of the City’s health
insurance expenditures.
35
million, an increase of $124 million from the FY 2005 deficit. Thereafter, the operating deficit is projected at $511 million in FY 2007 and $548 million in FY 2008. The rising deficits are mainly a function of tepid revenue growth that lags significantly behind the Corporation’s higher cost structure. Revenue projections in the outyears are expected to grow to $4.18 billion by FY 2008, growing at an average of less than one percent each year from the FY 2005 projection of $4.08 billion. Meanwhile, disbursements are projected to reach $4.73 billion by FY 2008, at an average annual growth of almost two percent from the FY 2005 estimate of $4.48 billion, driven mainly by increases in personal services and fringe benefits costs.
To address the looming deficits in the outyears, HHC has proposed a variety of revenue and savings actions averaging at nearly $500 million annually to maintain positive cash balances of between $152 million and $164 million. The composition of HHC’s gap-closing initiatives is heavily reliant on Federal and State actions. On average, about 63 percent or $313 million of the gap-closing program in each of FYs 2006-2008 is based on Federal and State actions. While the Corporation draws most of its revenues from these sources, thereby making them likely targets for additional support, the heavy reliance on these actions raises concerns given that its baseline revenue projections are less optimistic. If these actions fail to materialize, the Corporation may need to seek budget relief through other sources such as additional City support. Other components that make up the remainder of HHC’s gap-closing program are productivity savings of $80 million annually and other revenue enhancements averaging over $100 million each year.
Debt Service
Debt service, which cost the City $2.73 billion in FY 1994, reached $3.43 billion by FY 2003, an increase of 25.6 percent.19 Over the past ten years, debt service averaged $3.20 billion per year. In FYs 2004 through 2008, debt service is projected to average $4.74 billion, or 48 percent greater, on average, than average debt service costs in FYs 1994-2003. As shown in Chart 11, debt service consumed 15 percent of local tax revenues in FY 1994 and declined to 14.6 percent by FY 2003 and is expected to increase to 15.3 percent in FY 2004. Debt service is projected to increase to 15.8 percent of local tax revenues in FY 2005 and to rise to 17.3 percent by FY 2008.
19 Includes GO, TFA, TSASC, Interest on Notes, and Lease-Purchase Debt.
36
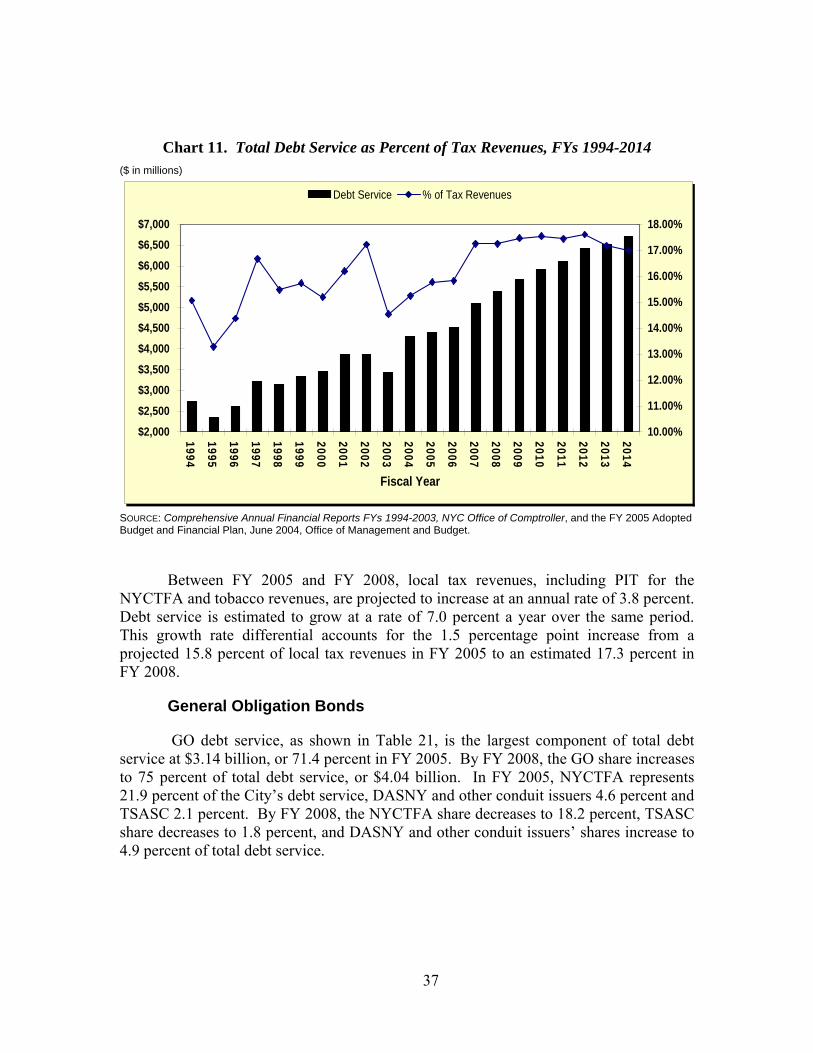
Chart 11. Total Debt Service as Percent of Tax Revenues, FYs 1994-2014 ($ in millions)
$2,000
$2,500
$3,000$3,500
$4,000
$4,500$5,000
$5,500
$6,000
$6,500$7,000
1994
1995
1996
1997
1998
1999
2000
2001
2002
2003
2004
2005
2006
2007
2008
2009
2010
2011
2012
2013
2014
Fiscal Year
10.00%
11.00%
12.00%
13.00%
14.00%
15.00%
16.00%
17.00%
18.00%
Debt Service % of Tax Revenues
SOURCE: Comprehensive Annual Financial Reports FYs 1994-2003, NYC Office of Comptroller, and the FY 2005 Adopted Budget and Financial Plan, June 2004, Office of Management and Budget.
Between FY 2005 and FY 2008, local tax revenues, including PIT for the NYCTFA and tobacco revenues, are projected to increase at an annual rate of 3.8 percent. Debt service is estimated to grow at a rate of 7.0 percent a year over the same period. This growth rate differential accounts for the 1.5 percentage point increase from a projected 15.8 percent of local tax revenues in FY 2005 to an estimated 17.3 percent in FY 2008.
General Obligation Bonds
GO debt service, as shown in Table 21, is the largest component of total debt service at $3.14 billion, or 71.4 percent in FY 2005. By FY 2008, the GO share increases to 75 percent of total debt service, or $4.04 billion. In FY 2005, NYCTFA represents 21.9 percent of the City’s debt service, DASNY and other conduit issuers 4.6 percent and TSASC 2.1 percent. By FY 2008, the NYCTFA share decreases to 18.2 percent, TSASC share decreases to 1.8 percent, and DASNY and other conduit issuers’ shares increase to 4.9 percent of total debt service.
37
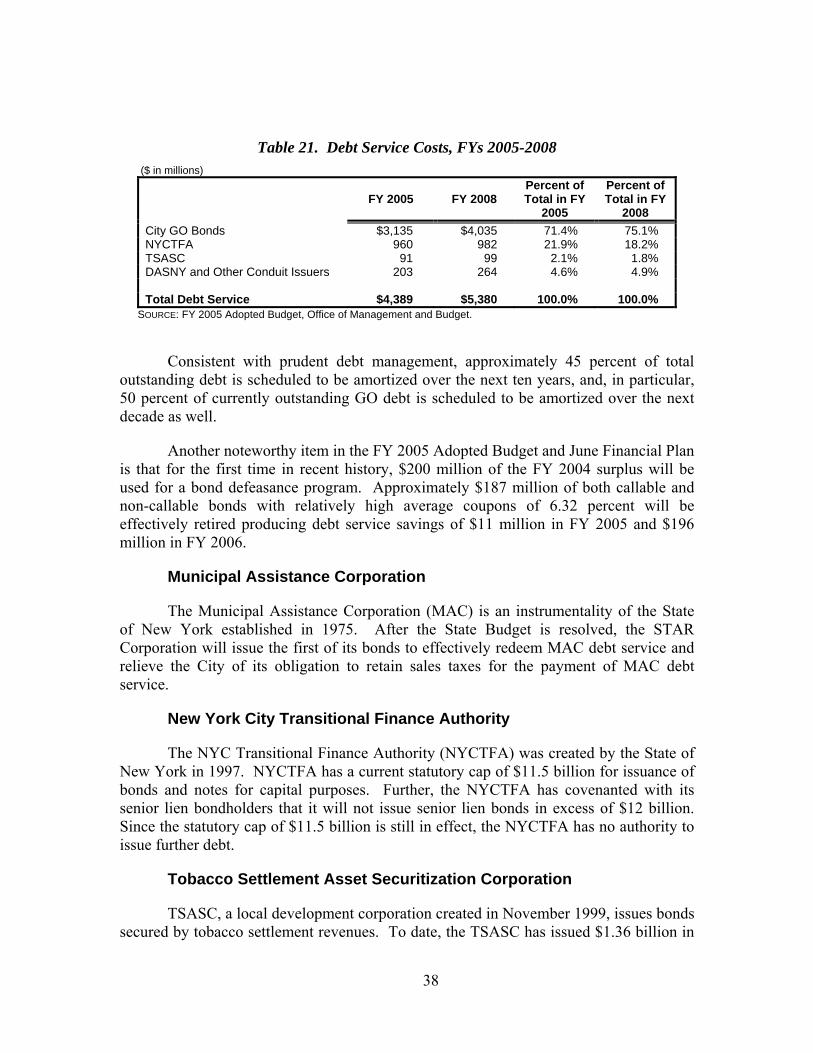
Table 21. Debt Service Costs, FYs 2005-2008 ($ in millions)
FY 2005
FY 2008
Percent of Total in FY
2005
Percent of Total in FY
2008 City GO Bonds $3,135 $4,035 71.4% 75.1% NYCTFA 960 982 21.9% 18.2% TSASC 91 99 2.1% 1.8% DASNY and Other Conduit Issuers 203 264 4.6% 4.9% Total Debt Service $4,389 $5,380 100.0% 100.0%
SOURCE: FY 2005 Adopted Budget, Office of Management and Budget.
Consistent with prudent debt management, approximately 45 percent of total outstanding debt is scheduled to be amortized over the next ten years, and, in particular, 50 percent of currently outstanding GO debt is scheduled to be amortized over the next decade as well.
Another noteworthy item in the FY 2005 Adopted Budget and June Financial Plan is that for the first time in recent history, $200 million of the FY 2004 surplus will be used for a bond defeasance program. Approximately $187 million of both callable and non-callable bonds with relatively high average coupons of 6.32 percent will be effectively retired producing debt service savings of $11 million in FY 2005 and $196 million in FY 2006.
Municipal Assistance Corporation
The Municipal Assistance Corporation (MAC) is an instrumentality of the State of New York established in 1975. After the State Budget is resolved, the STAR Corporation will issue the first of its bonds to effectively redeem MAC debt service and relieve the City of its obligation to retain sales taxes for the payment of MAC debt service.
New York City Transitional Finance Authority
The NYC Transitional Finance Authority (NYCTFA) was created by the State of New York in 1997. NYCTFA has a current statutory cap of $11.5 billion for issuance of bonds and notes for capital purposes. Further, the NYCTFA has covenanted with its senior lien bondholders that it will not issue senior lien bonds in excess of $12 billion. Since the statutory cap of $11.5 billion is still in effect, the NYCTFA has no authority to issue further debt.
Tobacco Settlement Asset Securitization Corporation
TSASC, a local development corporation created in November 1999, issues bonds secured by tobacco settlement revenues. To date, the TSASC has issued $1.36 billion in
38
debt since its inception: $709 million of bonds in November 1999, a $150 million loan agreement with the US Department of Transportation (USDOT) in December 2001, and $500 million in bonds in August 2002. There are no plans for further use of TSASC bonds as of the FY 2005 Adopted Budget.
Lease-Appropriation Debt Service
Over the years the City has diversified its financing sources by using conduit issuers such as the New York State Housing Finance Agency, the New York State Urban Development Corporation, and the Dormitory Authority of the State of New York (DASNY) for courts and hospital purposes. Between FYs 2005-2008, the City plans to issue $172 million of bonds through DASNY for Lincoln Center.
Capital Plan
The projected capital commitment plan over FYs 2005-2008 sums to $32.3 billion in all funds and $25.1 billion in City funds. After adjusting for the reserve for unattained commitments, the totals are $31.8 billion and $24.6 billion, respectively.20 The capital plan for FYs 2005-2008 continues to focus on three primary program areas: the Department of Education (DOE), Department of Environmental Protection (DEP), and transportation, including the City contribution for mass transit. These three areas together account for 66.5 percent of the projected all funds capital commitments, or $21.5 billion over the financial plan period. Projected commitments for education sum to $10.5 billion in all funds and $5.26 billion in City funds, or 32.5 percent of the total commitment plan. DEP’s projected commitments are $7.41 billion in all funds and $7.18 billion in City funds, or 22.9 percent of the total commitment plan. Transportation sums to $3.59 billion in all funds and $2.97 billion in City funds, or 11.1 percent of total commitments.
Off-Balance Sheet Items
The City is currently evaluating the viability of the development of the West Side of Manhattan between 27th and 43rd Streets, generally west of 8th Avenue. The major proposals include the Javits Center expansion, the New York Jets Sports Stadium, the extension of the No. 7 subway line westerly to 11th Avenue and southerly to 34th Street, the creation of a platform over the eastern rail yards from 30th to 33rd Streets between 10th and 11th Avenues, and miscellaneous infrastructure improvements, including new streets and parkland. While the City’s direct contribution is projected to be $650 million – $350 million related to the Javits Center, and $300 million related to the New York Jets stadium proposal – additional indebtedness by newly formed entities, the State of New York, and the Javits Center are expected to total approximately $5.6 billion. To the extent that revenue projections from newly proposed taxes, payments in lieu of taxes, and other projected revenue sources do not materialize, there could be a potential impact on
20 Reserve for unattained commitments is the estimated amount of commitments that will not be
made in a given fiscal year.
39
the City’s operating budget. The magnitude of this impact cannot be quantified at this time.
Financing Program
The City plans to borrow $15.4 billion of general obligation bonds and $7.2 billion of Water Finance Authority bonds between FYs 2005 and 2008. This borrowing is driven by both past capital contracts not yet paid and by a portion of currently planned commitments. In addition, there is $172 million of lease-purchase debt along with a $49 million drawdown of the USDOT loan related to reconstruction of the ferry terminals. Including GO, NYCTFA, and TSASC, principal redemptions are estimated to be $1.88 billion in FY 2005, $1.9 billion in FY 2006, $2.13 billion in FY 2007, and $2.23 billion in FY 2008. Planned borrowing, excluding Water Finance Authority bonds, is $3.4 billion in FY 2005, $3.8 billion in FY 2006, $4.2 billion in FY 2007, and $4 billion in FY 2008.
Thus, the excess borrowing over principal redemptions is estimated to be $1.5 billion in FY 2005, $1.9 billion in FY 2006, $2 billion in FY 2007, and $1.79 billion in FY 2008. The rate of debt growth is projected to be 3.3 percent from FYs 2004 to 2005, four percent from FYs 2005 to 2006, 4.1 percent from FYs 2006 to 2007, and 3.5 percent from FYs 2007 to 2008. These projected outstanding debt growth rates exceed the City’s inflation projections by an average of 1.4 percent per year. Thus, the City is issuing more debt than it is retiring, and the growth of debt outpaces inflation projections. However, the extent to which the change in outstanding debt exceeding the rate of inflation is deemed problematic will be determined, in large part, by the debt service to tax revenue ratio. As discussed earlier, this ratio is projected to be 15.8 percent in FY 2005 growing to 17.3 percent by 2008 and remaining flat through FY 2014. 21
21 Assumes a tax revenue growth rate of four percent per year between FYs 2009-2014.
40
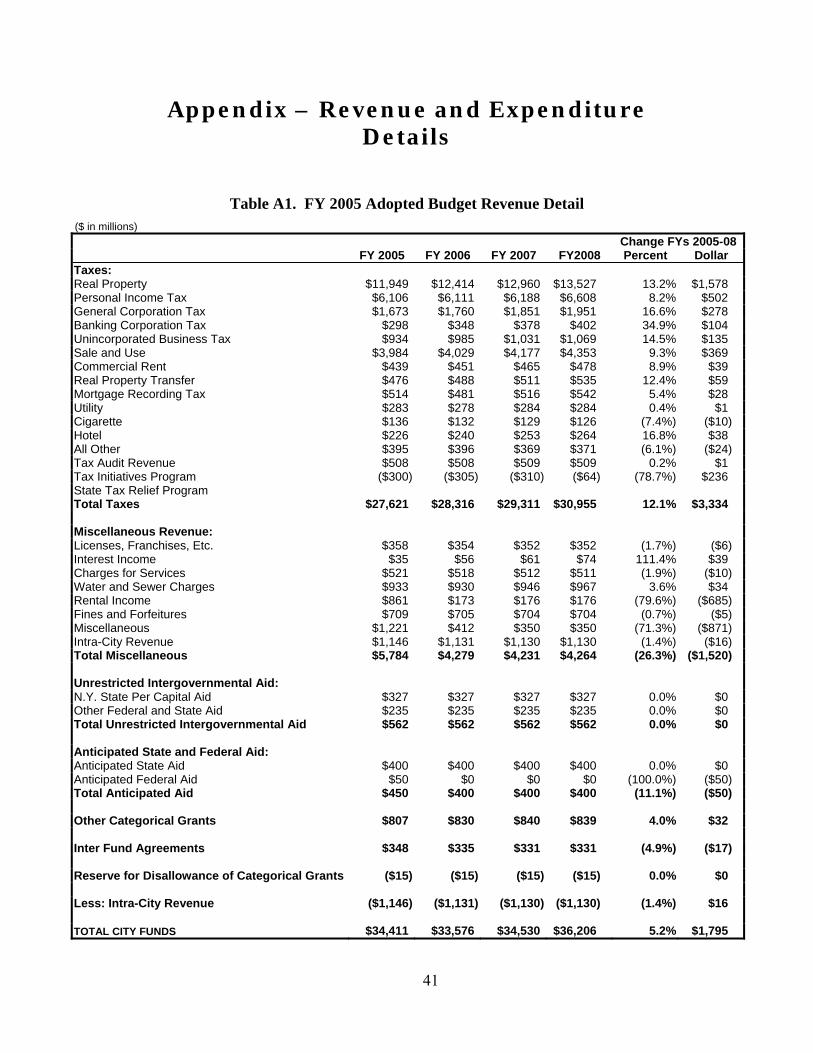
Appendix – Revenue and Expenditure Details
Table A1. FY 2005 Adopted Budget Revenue Detail ($ in millions)
Change FYs 2005-08 FY 2005 FY 2006 FY 2007 FY2008 Percent Dollar
Taxes: Real Property $11,949 $12,414 $12,960 $13,527 13.2% $1,578 Personal Income Tax $6,106 $6,111 $6,188 $6,608 8.2% $502 General Corporation Tax $1,673 $1,760 $1,851 $1,951 16.6% $278 Banking Corporation Tax $298 $348 $378 $402 34.9% $104 Unincorporated Business Tax $934 $985 $1,031 $1,069 14.5% $135 Sale and Use $3,984 $4,029 $4,177 $4,353 9.3% $369 Commercial Rent $439 $451 $465 $478 8.9% $39 Real Property Transfer $476 $488 $511 $535 12.4% $59 Mortgage Recording Tax $514 $481 $516 $542 5.4% $28 Utility $283 $278 $284 $284 0.4% $1 Cigarette $136 $132 $129 $126 (7.4%) ($10) Hotel $226 $240 $253 $264 16.8% $38 All Other $395 $396 $369 $371 (6.1%) ($24) Tax Audit Revenue $508 $508 $509 $509 0.2% $1 Tax Initiatives Program ($300) ($305) ($310) ($64) (78.7%) $236 State Tax Relief Program Total Taxes $27,621 $28,316 $29,311 $30,955 12.1% $3,334 Miscellaneous Revenue: Licenses, Franchises, Etc. $358 $354 $352 $352 (1.7%) ($6) Interest Income $35 $56 $61 $74 111.4% $39 Charges for Services $521 $518 $512 $511 (1.9%) ($10) Water and Sewer Charges $933 $930 $946 $967 3.6% $34 Rental Income $861 $173 $176 $176 (79.6%) ($685) Fines and Forfeitures $709 $705 $704 $704 (0.7%) ($5) Miscellaneous $1,221 $412 $350 $350 (71.3%) ($871) Intra-City Revenue $1,146 $1,131 $1,130 $1,130 (1.4%) ($16) Total Miscellaneous $5,784 $4,279 $4,231 $4,264 (26.3%) ($1,520) Unrestricted Intergovernmental Aid: N.Y. State Per Capital Aid $327 $327 $327 $327 0.0% $0 Other Federal and State Aid $235 $235 $235 $235 0.0% $0 Total Unrestricted Intergovernmental Aid $562 $562 $562 $562 0.0% $0 Anticipated State and Federal Aid: Anticipated State Aid $400 $400 $400 $400 0.0% $0 Anticipated Federal Aid $50 $0 $0 $0 (100.0%) ($50) Total Anticipated Aid $450 $400 $400 $400 (11.1%) ($50) Other Categorical Grants $807 $830 $840 $839 4.0% $32 Inter Fund Agreements $348 $335 $331 $331 (4.9%) ($17) Reserve for Disallowance of Categorical Grants ($15) ($15) ($15) ($15) 0.0% $0 Less: Intra-City Revenue ($1,146) ($1,131) ($1,130) ($1,130) (1.4%) $16 TOTAL CITY FUNDS $34,411 $33,576 $34,530 $36,206 5.2% $1,795
41
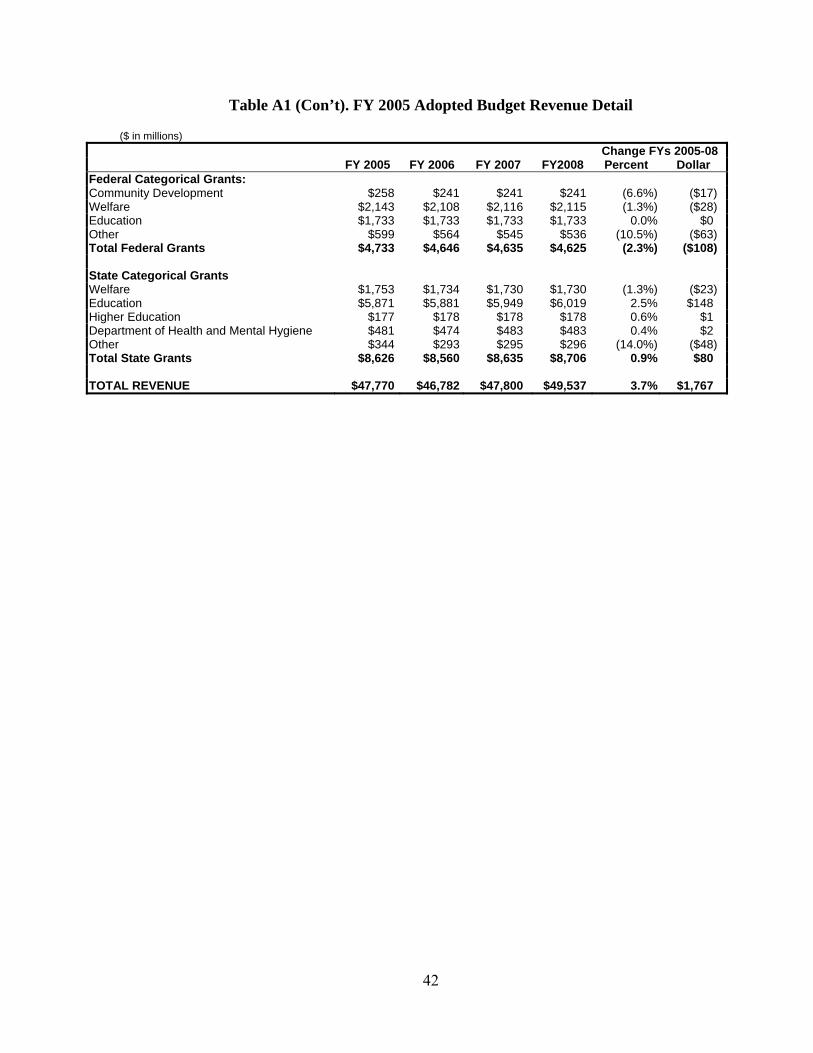
Table A1 (Con’t). FY 2005 Adopted Budget Revenue Detail
($ in millions) Change FYs 2005-08 FY 2005 FY 2006 FY 2007 FY2008 Percent Dollar
Federal Categorical Grants: Community Development $258 $241 $241 $241 (6.6%) ($17) Welfare $2,143 $2,108 $2,116 $2,115 (1.3%) ($28) Education $1,733 $1,733 $1,733 $1,733 0.0% $0 Other $599 $564 $545 $536 (10.5%) ($63) Total Federal Grants $4,733 $4,646 $4,635 $4,625 (2.3%) ($108) State Categorical Grants Welfare $1,753 $1,734 $1,730 $1,730 (1.3%) ($23) Education $5,871 $5,881 $5,949 $6,019 2.5% $148 Higher Education $177 $178 $178 $178 0.6% $1 Department of Health and Mental Hygiene $481 $474 $483 $483 0.4% $2 Other $344 $293 $295 $296 (14.0%) ($48) Total State Grants $8,626 $8,560 $8,635 $8,706 0.9% $80 TOTAL REVENUE $47,770 $46,782 $47,800 $49,537 3.7% $1,767
42
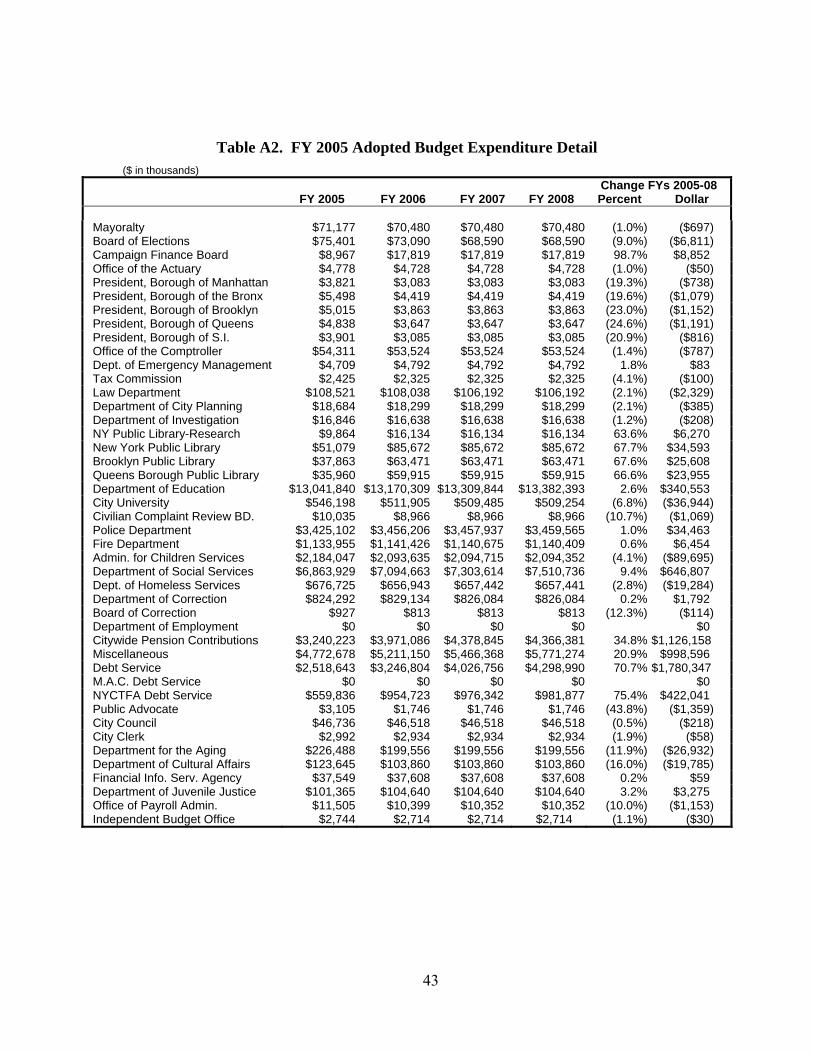
Table A2. FY 2005 Adopted Budget Expenditure Detail ($ in thousands)
Change FYs 2005-08 FY 2005 FY 2006 FY 2007 FY 2008 Percent Dollar
Mayoralty $71,177 $70,480 $70,480 $70,480 (1.0%) ($697) Board of Elections $75,401 $73,090 $68,590 $68,590 (9.0%) ($6,811) Campaign Finance Board $8,967 $17,819 $17,819 $17,819 98.7% $8,852 Office of the Actuary $4,778 $4,728 $4,728 $4,728 (1.0%) ($50) President, Borough of Manhattan $3,821 $3,083 $3,083 $3,083 (19.3%) ($738) President, Borough of the Bronx $5,498 $4,419 $4,419 $4,419 (19.6%) ($1,079) President, Borough of Brooklyn $5,015 $3,863 $3,863 $3,863 (23.0%) ($1,152) President, Borough of Queens $4,838 $3,647 $3,647 $3,647 (24.6%) ($1,191) President, Borough of S.I. $3,901 $3,085 $3,085 $3,085 (20.9%) ($816) Office of the Comptroller $54,311 $53,524 $53,524 $53,524 (1.4%) ($787) Dept. of Emergency Management $4,709 $4,792 $4,792 $4,792 1.8% $83 Tax Commission $2,425 $2,325 $2,325 $2,325 (4.1%) ($100) Law Department $108,521 $108,038 $106,192 $106,192 (2.1%) ($2,329) Department of City Planning $18,684 $18,299 $18,299 $18,299 (2.1%) ($385) Department of Investigation $16,846 $16,638 $16,638 $16,638 (1.2%) ($208) NY Public Library-Research $9,864 $16,134 $16,134 $16,134 63.6% $6,270 New York Public Library $51,079 $85,672 $85,672 $85,672 67.7% $34,593 Brooklyn Public Library $37,863 $63,471 $63,471 $63,471 67.6% $25,608 Queens Borough Public Library $35,960 $59,915 $59,915 $59,915 66.6% $23,955 Department of Education $13,041,840 $13,170,309 $13,309,844 $13,382,393 2.6% $340,553 City University $546,198 $511,905 $509,485 $509,254 (6.8%) ($36,944) Civilian Complaint Review BD. $10,035 $8,966 $8,966 $8,966 (10.7%) ($1,069) Police Department $3,425,102 $3,456,206 $3,457,937 $3,459,565 1.0% $34,463 Fire Department $1,133,955 $1,141,426 $1,140,675 $1,140,409 0.6% $6,454 Admin. for Children Services $2,184,047 $2,093,635 $2,094,715 $2,094,352 (4.1%) ($89,695) Department of Social Services $6,863,929 $7,094,663 $7,303,614 $7,510,736 9.4% $646,807 Dept. of Homeless Services $676,725 $656,943 $657,442 $657,441 (2.8%) ($19,284) Department of Correction $824,292 $829,134 $826,084 $826,084 0.2% $1,792 Board of Correction $927 $813 $813 $813 (12.3%) ($114) Department of Employment $0 $0 $0 $0 $0 Citywide Pension Contributions $3,240,223 $3,971,086 $4,378,845 $4,366,381 34.8% $1,126,158 Miscellaneous $4,772,678 $5,211,150 $5,466,368 $5,771,274 20.9% $998,596 Debt Service $2,518,643 $3,246,804 $4,026,756 $4,298,990 70.7% $1,780,347 M.A.C. Debt Service $0 $0 $0 $0 $0 NYCTFA Debt Service $559,836 $954,723 $976,342 $981,877 75.4% $422,041 Public Advocate $3,105 $1,746 $1,746 $1,746 (43.8%) ($1,359) City Council $46,736 $46,518 $46,518 $46,518 (0.5%) ($218) City Clerk $2,992 $2,934 $2,934 $2,934 (1.9%) ($58) Department for the Aging $226,488 $199,556 $199,556 $199,556 (11.9%) ($26,932) Department of Cultural Affairs $123,645 $103,860 $103,860 $103,860 (16.0%) ($19,785) Financial Info. Serv. Agency $37,549 $37,608 $37,608 $37,608 0.2% $59 Department of Juvenile Justice $101,365 $104,640 $104,640 $104,640 3.2% $3,275 Office of Payroll Admin. $11,505 $10,399 $10,352 $10,352 (10.0%) ($1,153) Independent Budget Office $2,744 $2,714 $2,714 $2,714 (1.1%) ($30)
43
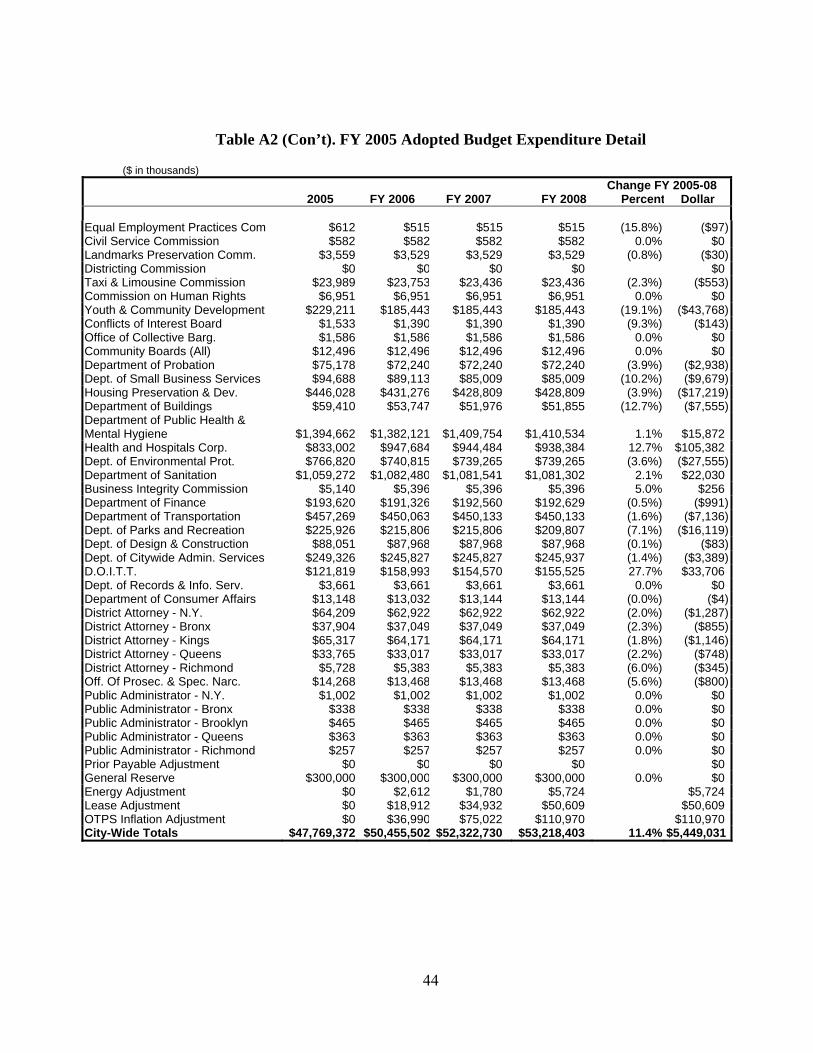
Table A2 (Con’t). FY 2005 Adopted Budget Expenditure Detail
($ in thousands) Change FY 2005-08 2005 FY 2006 FY 2007 FY 2008 Percent Dollar
Equal Employment Practices Com $612 $515 $515 $515 (15.8%) ($97)Civil Service Commission $582 $582 $582 $582 0.0% $0 Landmarks Preservation Comm. $3,559 $3,529 $3,529 $3,529 (0.8%) ($30)Districting Commission $0 $0 $0 $0 $0 Taxi & Limousine Commission $23,989 $23,753 $23,436 $23,436 (2.3%) ($553)Commission on Human Rights $6,951 $6,951 $6,951 $6,951 0.0% $0 Youth & Community Development $229,211 $185,443 $185,443 $185,443 (19.1%) ($43,768)Conflicts of Interest Board $1,533 $1,390 $1,390 $1,390 (9.3%) ($143)Office of Collective Barg. $1,586 $1,586 $1,586 $1,586 0.0% $0 Community Boards (All) $12,496 $12,496 $12,496 $12,496 0.0% $0 Department of Probation $75,178 $72,240 $72,240 $72,240 (3.9%) ($2,938)Dept. of Small Business Services $94,688 $89,113 $85,009 $85,009 (10.2%) ($9,679)Housing Preservation & Dev. $446,028 $431,276 $428,809 $428,809 (3.9%) ($17,219)Department of Buildings $59,410 $53,747 $51,976 $51,855 (12.7%) ($7,555)Department of Public Health & Mental Hygiene $1,394,662 $1,382,121 $1,409,754 $1,410,534 1.1% $15,872 Health and Hospitals Corp. $833,002 $947,684 $944,484 $938,384 12.7% $105,382 Dept. of Environmental Prot. $766,820 $740,815 $739,265 $739,265 (3.6%) ($27,555)Department of Sanitation $1,059,272 $1,082,480 $1,081,541 $1,081,302 2.1% $22,030 Business Integrity Commission $5,140 $5,396 $5,396 $5,396 5.0% $256 Department of Finance $193,620 $191,326 $192,560 $192,629 (0.5%) ($991)Department of Transportation $457,269 $450,063 $450,133 $450,133 (1.6%) ($7,136)Dept. of Parks and Recreation $225,926 $215,806 $215,806 $209,807 (7.1%) ($16,119)Dept. of Design & Construction $88,051 $87,968 $87,968 $87,968 (0.1%) ($83)Dept. of Citywide Admin. Services $249,326 $245,827 $245,827 $245,937 (1.4%) ($3,389)D.O.I.T.T. $121,819 $158,993 $154,570 $155,525 27.7% $33,706 Dept. of Records & Info. Serv. $3,661 $3,661 $3,661 $3,661 0.0% $0 Department of Consumer Affairs $13,148 $13,032 $13,144 $13,144 (0.0%) ($4)District Attorney - N.Y. $64,209 $62,922 $62,922 $62,922 (2.0%) ($1,287)District Attorney - Bronx $37,904 $37,049 $37,049 $37,049 (2.3%) ($855)District Attorney - Kings $65,317 $64,171 $64,171 $64,171 (1.8%) ($1,146)District Attorney - Queens $33,765 $33,017 $33,017 $33,017 (2.2%) ($748)District Attorney - Richmond $5,728 $5,383 $5,383 $5,383 (6.0%) ($345)Off. Of Prosec. & Spec. Narc. $14,268 $13,468 $13,468 $13,468 (5.6%) ($800)Public Administrator - N.Y. $1,002 $1,002 $1,002 $1,002 0.0% $0 Public Administrator - Bronx $338 $338 $338 $338 0.0% $0 Public Administrator - Brooklyn $465 $465 $465 $465 0.0% $0 Public Administrator - Queens $363 $363 $363 $363 0.0% $0 Public Administrator - Richmond $257 $257 $257 $257 0.0% $0 Prior Payable Adjustment $0 $0 $0 $0 $0 General Reserve $300,000 $300,000 $300,000 $300,000 0.0% $0 Energy Adjustment $0 $2,612 $1,780 $5,724 $5,724 Lease Adjustment $0 $18,912 $34,932 $50,609 $50,609 OTPS Inflation Adjustment $0 $36,990 $75,022 $110,970 $110,970 City-Wide Totals $47,769,372 $50,455,502 $52,322,730 $53,218,403 11.4% $5,449,031
44
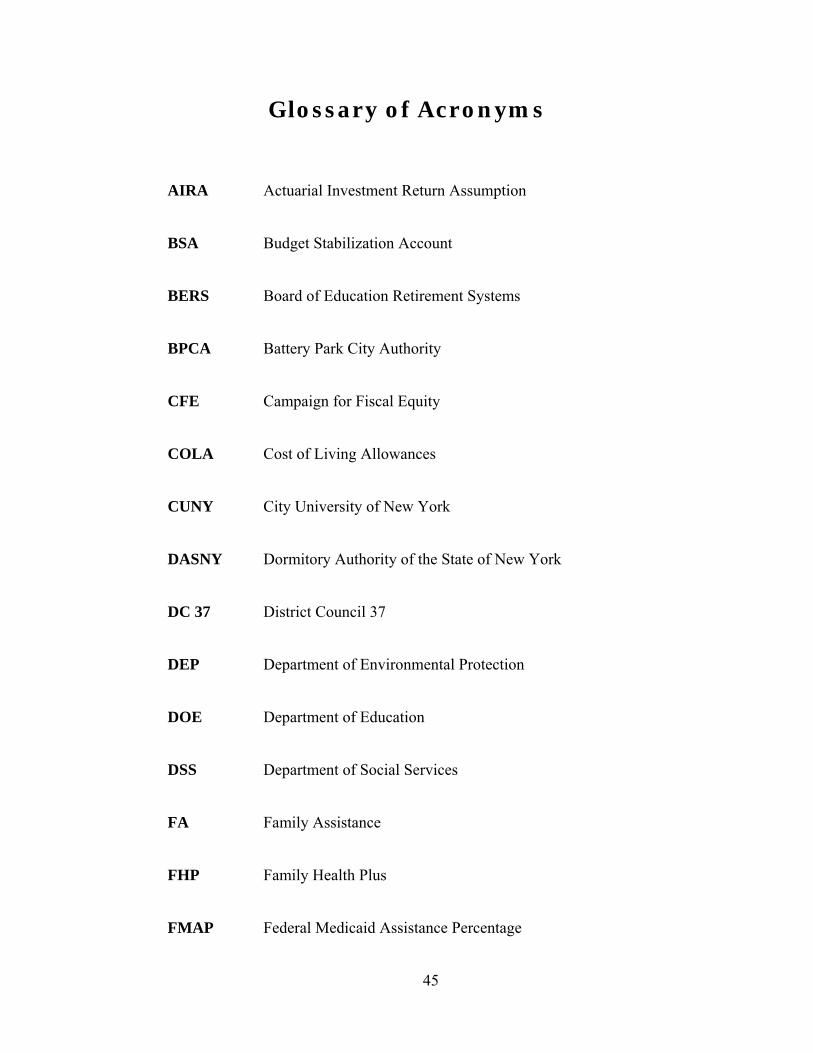
Glossary of Acronyms
AIRA Actuarial Investment Return Assumption
BSA Budget Stabilization Account
BERS Board of Education Retirement Systems
BPCA Battery Park City Authority
CFE Campaign for Fiscal Equity
COLA Cost of Living Allowances
CUNY City University of New York
DASNY Dormitory Authority of the State of New York
DC 37 District Council 37
DEP Department of Environmental Protection
DOE Department of Education
DSS Department of Social Services
FA Family Assistance
FHP Family Health Plus
FMAP Federal Medicaid Assistance Percentage
45
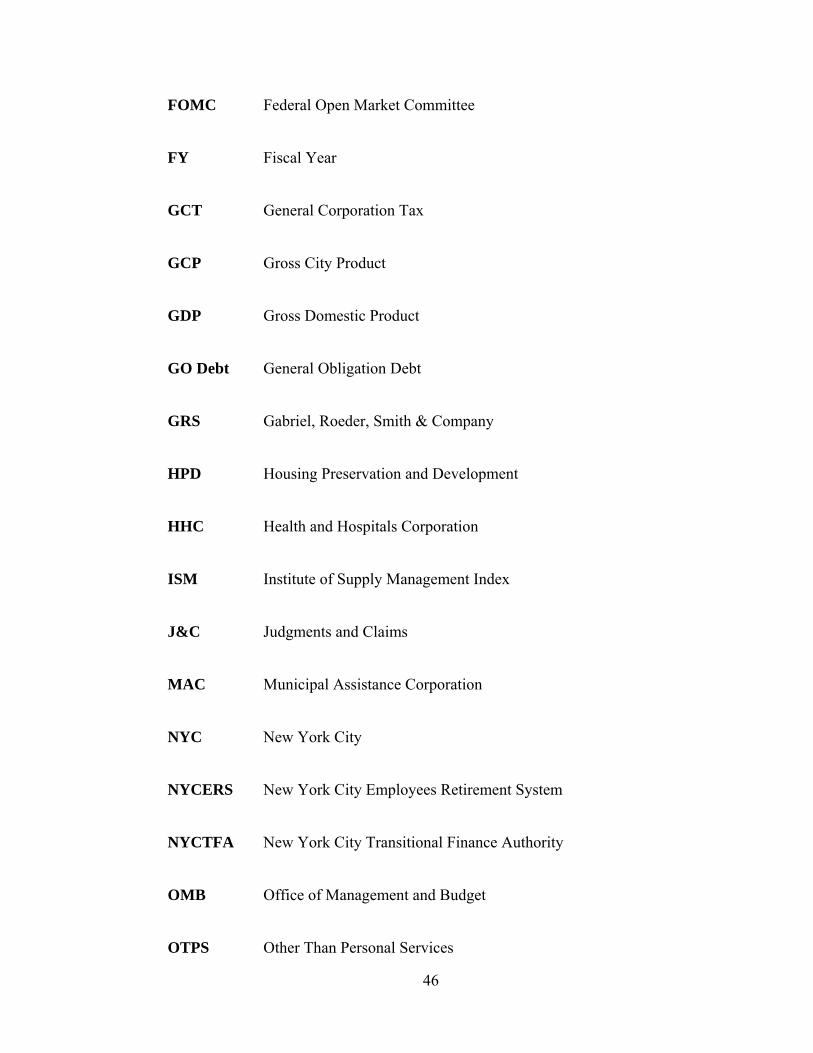
FOMC Federal Open Market Committee
FY Fiscal Year
GCT General Corporation Tax
GCP Gross City Product
GDP Gross Domestic Product
GO Debt General Obligation Debt
GRS Gabriel, Roeder, Smith & Company
HPD Housing Preservation and Development
HHC Health and Hospitals Corporation
ISM Institute of Supply Management Index
J&C Judgments and Claims
MAC Municipal Assistance Corporation
NYC New York City
NYCERS New York City Employees Retirement System
NYCTFA New York City Transitional Finance Authority
OMB Office of Management and Budget
OTPS Other Than Personal Services
46
PA Public Assistance
PIT Personal Income Tax
PS Personal Services
RNC Republican National Convention
SNA Safety Net Assistance
STAR Corp. Sales Tax Asset Receivable Corp.
STAR School Tax Relief Program
TRS Teachers Retirement System
TSR Tobacco Settlement Revenues
U.S. United States.
USDOT United States Department of Transportation
WTC World Trade Center
47