Embed Size (px)
Citation preview

2015
COMPREHENSIVE MOBILITY PLAN - SOLAPUR
Inception Report
Solapur Municipal Corporation

COMPREHENSIVE MOBILITY PLAN FOR SOLAPUR INCEPTION REPORT
Page | i
Quality Management
Revision Date Report Prepared
By
Report
Reviewed By
Report
Approved By
Description
1 22nd April,
2015
Harshita Sarma M N. Sheshadri First Draft
2 5th May, 2015 Harshita Sarma M RM Alagappan S.Ramakrishna Second Draft

COMPREHENSIVE MOBILITY PLAN FOR SOLAPUR INCEPTION REPORT
Page | ii
Disclaimer
This document has been prepared for the Comprehensive Mobility Plan, Solapur and should not be relied
upon or used for any other project without an independent check being carried out as to its suitability and
prior written authority of UMTC being obtained. UMTC accepts no responsibility or liability for the
consequence of this document being used for a purpose other than the purposes for which it was
commissioned. Any person using or relying on the document for such other purpose agrees, and will by
such use or reliance be taken to confirm his agreement to indemnify UMTC for all loss or damage
resulting there from. UMTC accepts no responsibility or liability for this document to any party other than
the person by whom it was commissioned.

COMPREHENSIVE MOBILITY PLAN FOR SOLAPUR INCEPTION REPORT
Page | iii
Table of Contents
CHAPTER 1. INTRODUCTION ................................................................................................................................ 1
1.1. PROJECT BACKGROUND ............................................................................................................................ 1
1.2. COMPREHENSIVE MOBILITY PLAN FOR SOLAPUR ........................................................................................ 1
1.3. OBJECTIVES AND SCOPE OF THE STUDY .................................................................................................... 1
1.4. ORGANIZATION OF THE REPORT ................................................................................................................ 2
CHAPTER 2. CITY PROFILE - SOLAPUR .............................................................................................................. 3
2.1. REGIONAL SETTING .................................................................................................................................. 3
2.2. ADMINISTRATIVE BOUNDARY ..................................................................................................................... 3
2.3. LOCATION AND CONNECTIVITY .................................................................................................................. 4
2.4. PHYSICAL AND GEOGRAPHICAL SETTING ................................................................................................... 5
2.5. SOCIO ECONOMIC PARAMETERS ............................................................................................................... 6
2.5.1. Demographic ..................................................................................................................................... 6
2.5.2. Economic .......................................................................................................................................... 7
2.6. SPATIAL SETTING AND LAND USE .............................................................................................................. 9
2.6.1. Growth Pattern .................................................................................................................................. 9
2.6.2. Spatial Growth Trends .................................................................................................................... 10
2.6.3. Land-use Analysis ........................................................................................................................... 11
2.7. TRAFFIC AND TRANSPORTATION SYSTEM ................................................................................................. 13
2.7.1. Connectivity .................................................................................................................................... 13
2.7.2. Road Network ................................................................................................................................. 13
2.7.3. Registered Vehicles in Solapur City ................................................................................................ 15
2.7.4. Accidents ........................................................................................................................................ 25
2.7.5. Pedestrian and NMV Facilities ........................................................................................................ 26
2.7.6. Parking Characteristics ................................................................................................................... 26
2.7.7. Public Transport Characteristics ..................................................................................................... 26
2.7.8. Issues .............................................................................................................................................. 27
2.8. OBSERVATIONS FROM CITY DEVELOPMENT PLAN, SOLAPUR .................................................................... 28
CHAPTER 3. APPROACH AND METHODOLOGY .............................................................................................. 30
3.1. MOBILIZATION AND RECONNAISSANCE ..................................................................................................... 31
3.1.1. Initial Consultations ......................................................................................................................... 31
3.1.2. Kick-Off Meeting ............................................................................................................................. 31
3.2. SCOPE OF WORK .................................................................................................................................... 31

COMPREHENSIVE MOBILITY PLAN FOR SOLAPUR INCEPTION REPORT
Page | iv
3.2.1. Task 1: Defining the Scope of CMP ................................................................................................ 32
3.2.2. Task 2: Data Collection and Analysis of the Existing Urban Transport and Environment. .............. 33
3.2.3. Task 3: Development of Business as Usual (BAU) Scenario .......................................................... 35
3.2.4. Task 4: Development of Business as Usual (BAU) Scenario .......................................................... 39
3.2.5. Task 5: Development of Urban Mobility Plan .................................................................................. 41
3.2.6. Task 6: Preparation of the Implementation Program ....................................................................... 46
CHAPTER 4. DATA COLLECTION PLAN ............................................................................................................ 48
4.1. COLLECTION AND REVIEW OF SECONDARY DATA ..................................................................................... 48
4.2. PRIMARY SURVEYS ................................................................................................................................. 48
4.2.1. Classified Volume Count Surveys at Screen-line Locations ........................................................... 49
4.2.2. Road side interview surveys at outer cordon locations ................................................................... 51
4.2.3. Road Network Inventory Surveys .................................................................................................... 53
4.2.4. Turning Movement counts at Intersections ..................................................................................... 55
4.2.5. Bus stop waiting, boarding-alighting survey & Bus stop OD Survey ............................................... 56
4.2.6. Bus/Rail OD Survey ........................................................................................................................ 57
4.2.7. Pedestrian Volume Count at Junctions and Midblock ..................................................................... 57
4.2.8. Speed and Delay at Peak hour and Off- Peak Hour ....................................................................... 59
4.2.9. Household Interview Survey ........................................................................................................... 60
4.2.10. Vehicle Operator Survey (Taxi, Goods, Auto) ................................................................................. 61
4.2.11. Parking Survey (on street & off street) ............................................................................................ 62
4.2.12. Environmental/Energy Surveys ....................................................................................................... 63
4.3. WAY FORWARD ....................................................................................................................................... 64
CHAPTER 5. WORK PLAN & DELIVERABLES ................................................................................................... 65
5.1. WORK PLAN, TIMELINE AND DELIVERABLES ............................................................................................. 65
5.2. QUALITY ASSURANCE PLAN .................................................................................................................... 65

COMPREHENSIVE MOBILITY PLAN FOR SOLAPUR INCEPTION REPORT
Page | v
List of Tables
Table 2-1: Population Trend of Solapur Municipal Corporation (SMC) ...................................................... 6
Table 2-2: Decade Wise Population and Density of Solapur Municipal Corporation (SMC) ....................... 7
Table 2-3: Sectorial Distribution of the Workers in Solapur ........................................................................ 7
Table 2-4: Workforce Participation Rate in Solapur .................................................................................... 8
Table 2-5: Chronology of events in expansion of Solapur Municipal Limits ................................................ 9
Table 2-6: Land Use Proposed in the Development Plan of Solapur ........................................................ 11
Table 2-7: Existing Land Use and Comparison with URDPFI Guidelines ................................................. 12
Table 2-8: Mode wise distribution of vehicles registered in Solapur City .................................................. 25
Table 2-9: Passenger and Fleet Details of Solapur Municipal Transport (SMT) ....................................... 27
List of Figures
Figure 2-1: Administrative Boundary of Solapur ......................................................................................... 3
Figure 2-2: Location of Solapur City ........................................................................................................... 4
Figure 2-3: Connectivity of Solapur to Major Urban Centers ...................................................................... 5
Figure 2-4: Growth Directions of Solapur City. ......................................................................................... 10
Figure 2-5: Road Network in Solapur City ................................................................................................ 14
Figure 2-6: Category of Roads in Solapur Municipal Corporation (SMC) area ......................................... 14
Figure 2-7: Growth of Vehicles in Solapur City ......................................................................................... 15
Figure 2-8: Accidents Trend in Solapur City ............................................................................................. 25
Figure 3-1: Study Methodology ................................................................................................................. 30
Figure 3-2: Broad Framework for Travel Demand Modelling .................................................................... 37
Figure 3-3: SIM- Air Program .................................................................................................................... 38
Figure 4-1: Screen Line Survey Locations ................................................................................................ 50
Figure 4-2: Outer Cordon Survey Locations ............................................................................................. 52
Figure 4-3: Road Network Inventory Surveys ........................................................................................... 54
Figure 4-4: Classified Turning Movement Counts Survey Locations ........................................................ 56
Figure 5-1: Study Deliverables ................................................................................................................. 65

COMPREHENSIVE MOBILITY PLAN FOR SOLAPUR INCEPTION REPORT
Page | 1
Chapter 1. Introduction
1.1. Project Background
Solapur is located in the Western Indian state of Maharashtra. It is an important node and plays a critical
role in the district as headquarter of Solapur district administration. Solapur houses all the administrative
offices of the district level administration and has a strong industrial presence. Solapur historically is
regarded as an industrial city prominently having the textile units. One of the key events triggering the
industrial growth was starting up the railway in Solapur in 1880.
Solapur was earlier known for its Shri. Siddheshwar temple but eventually emerged to be one of the
largest industrial towns in Maharashtra. The city is among the pioneers in India in development of co-
operative sugar factories. The western part of the city has cotton textile industries, power looms and
connectivity to the railway station. The eastern part has handlooms and oil industry on Akkalkot Road and
Hyderabad Road. The extension of railway line from Mumbai has contributed to industrial development of
Solapur also inviting in-migration from various parts of country especially laborers from Andhra Pradesh
region in the past decades.
As per the Census of India 2011, the population of Solapur was 9.51 lakh which is spread over an area of
178.57 Sq km. Solapur expected tremendous development in the late nineties which resulted in the city
limits getting expanded from 33.03 Sq km in 1989 to 178.57 Sq.km in the year 1992.
Solapur is well connected by road with major cities of Maharashtra as well as the adjoining State Capital
of Hyderabad and important cities in Karnataka through a network of road and rail network
1.2. Comprehensive Mobility Plan for Solapur
Solapur has been witnessing extremely rapid growth, yet the infrastructure has not been encouraging.
Urban Mass Transit Company Limited is given the mandate for conducting the Comprehensive Mobility
Plan which will prepare an overall transportation/mobility plan which is integrated with the land use plan
and through the projected mobility needs of the city spells out the manner in which such mobility needs
are to be met.
1.3. Objectives and Scope of the Study
Comprehensive Mobility Plan is a long term vision for desirable accessibility and mobility pattern for
people and goods in the city to provide, safe, secure, efficient, reliable and seamless connectivity that
supports and enhances economic, social and environmental sustainability.

COMPREHENSIVE MOBILITY PLAN FOR SOLAPUR INCEPTION REPORT
Page | 2
As per Ministry of Urban Development (MoUD) guidelines, a Comprehensive Mobility Plan for the Indian
cities should have following objectives:
To provide long term vision(s) and goals for desirable urban transport system and urban
development in Indian cities.
To illustrate a basic plan for urban development and include a list of proposed urban land use
and transport measures to be implemented within a time span of 20 years.
To ensure that the most appropriate, sustainable and cost effective implementation program is
undertaken in the urban transport sector.
The CMP should be integrated with the Master Plan, Comprehensive Development Plan and
Comprehensive Traffic and Transportation Study.
The scope of work for the preparation of the Comprehensive Mobility Plan is as follows;
a. Understand the present travel characteristics and forecast travel demand for the planning
horizon.
b. Estimate emissions from urban transport based on the travel demand and technological choices.
c. Integrate transport options with land use structure and develop alternative scenarios for
sustainable transport.
d. Work out the mobility plan which is economically, socially, environmentally and technologically
sustainable and be an integral part of development plans / master plans.
e. Suggest an implementation programme for a successful execution of the selected interventions.
1.4. Organization of the Report
This Inception Report of the study is organized in four sections including this introductory section. The
study area profile is presented in Chapter II. The study approach and methodology is described in
Chapter III and Work Plan or Schedule for the study is presented in chapter IV.

COMPREHENSIVE MOBILITY PLAN FOR SOLAPUR INCEPTION REPORT
Page | 3
Chapter 2. City Profile - Solapur
2.1. Regional Setting
Solapur is the 4th largest district in the western Indian state of Maharashtra in its southern region. Solapur
is an important node and plays a critical role in the district as headquarter for district administration.
Solapur houses all the administrative offices of the district level administration and has a strong industrial
presence. Solapur historically is regarded as an industrial city prominently having the textile units. One of
the key events triggering the industrial growth was starting up the railway in Solapur in 1880.
2.2. Administrative Boundary
Solapur lies in the basin of river Bhima and the municipal jurisdiction of the city encompasses an area of
178.57 km2. It accommodated a population of 8.72 lakh as per census 2001 which grew to 9.51 Lakh as
per Census 2011. The administrative boundary is shown in the Figure 2-1.
Figure 2-1: Administrative Boundary of Solapur
Source: City Development Plan, Solapur
COMPREHENSIVE MOBILITY PLAN FOR SOLAPUR INCEPTION REPORT
Page | 4
Solapur was earlier known for its Shri. Siddheshwar temple but eventually emerged to be one of the
largest industrial towns in Maharashtra. The city is among the pioneer in India in development of co-
operative sugar factories. The western part of the city has cotton textile industries, power looms and
connectivity to the railway station. The eastern part has handlooms and oil industry in the eastern part on
Akkalkot and Hyderabad road. The extension of railway line from Mumbai has contributed to industrial
development of Solapur also inviting in-migration from various parts of country especially labors from
Andhra Pradesh region in the past decades.
Solapur expected tremendous development in late nineties which resulted in the city limits expansion
from 33.03 km2 to 178.57 km2 in the year 1992 but the population growth was not contingent to the
increase in the area of the city. Important reasons for the low growth was decline in the Government
subsidy for cooperatives, inability of textile mills to switch to latest technologies led to shut down of textile
units in Solapur. Some of the prominent players in the textile industry like Vishnu Textile and Laxmi
Textile winded up their operations because of financial crisis, this has resulted into closing down of
dependent ancillary units, eventually increasing unemployment. Currently, the workers population is
354935 with a work participation rate of 37.3%. This is lower than the national average of 39.1% and
state average of 43.98%.
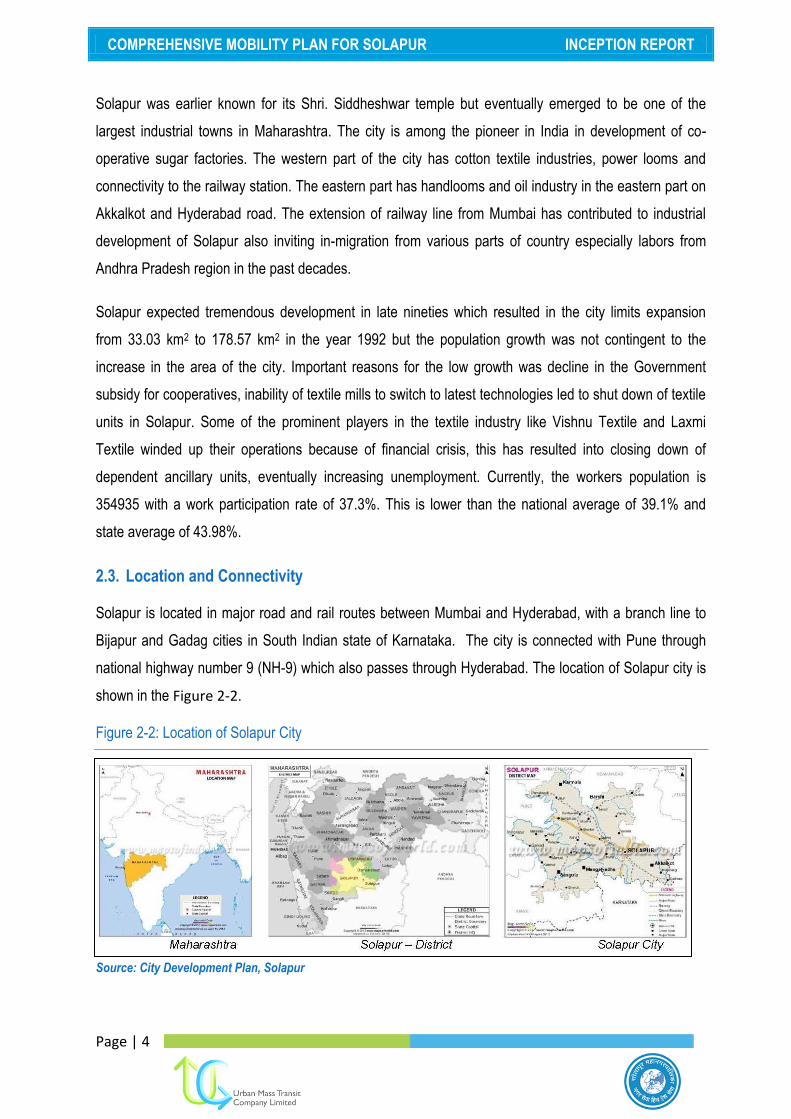
2.3. Location and Connectivity
Solapur is located in major road and rail routes between Mumbai and Hyderabad, with a branch line to
Bijapur and Gadag cities in South Indian state of Karnataka. The city is connected with Pune through
national highway number 9 (NH-9) which also passes through Hyderabad. The location of Solapur city is
shown in the Figure 2-2.
Figure 2-2: Location of Solapur City
Source: City Development Plan, Solapur

COMPREHENSIVE MOBILITY PLAN FOR SOLAPUR INCEPTION REPORT
Page | 5
The city lies centrally in the basin of river Bhima and the watershed of river Adila (a tributary of river
Sina). The city is rested on hard rock and acts as a gateway to Bhima and Krishna Basin. Solapur district
is surrounded by Ahmednagar district in North, Osmanabad and Andra Pradesh in the east, Sangli and
Karnataka to the south and Satara and Pune district to the west. It is located at 17°.10‟ and 18°.32‟
north-latitude and 74°.42‟ and 76°.15‟ east longitude. It has an average elevation of 457 meters above
mean sea level.
Solapur is well connected by roadways and railways to all major cities in Maharashtra and neighboring
states. The city is connected with Karnataka by four National Highways –9 via Pune and Vijayawada. NH-
13 to Mangalore; NH-211 to Dhule and NH-204 to Ratnagiri and Nagpur. It is also connected with
important cities in Maharashtra such as Nagpur, Sangli, Kolhapur, Nanded etc. Busses from Maharashtra
and Andhra Pradesh state transport corporation operate from the Solapur bus stand. The connectivity of
Solapur city to major urban centers is shown in the Figure 2-3.
Figure 2-3: Connectivity of Solapur to Major Urban Centers
Source: City Development Plan, Solapur
2.4. Physical and Geographical Setting
Solapur was ruled by various dynasties such as Andhrabhartyas, Chalukyas, Rashtrakutas, Yadavas and
Bahamanis. The word Solapur is said to have been derived from word “Sola” meaning sixteen and “Pur”

COMPREHENSIVE MOBILITY PLAN FOR SOLAPUR INCEPTION REPORT
Page | 6
meaning villages. The city is formed with a conglomeration of sixteen villages. The second theory is that
Solapur is not derived from sixteen villages but has a different history. The theory is that the town was
called Sonnalage in the inscriptions of Shivayogi Shri Shankaracharya. This eventually came to be
pronounced as Sonnalagi. Eventually with time with changes in the ruling dynasties the name changed
and it came to be called as Sandalpur during Mughal rule and eventually Solapur which was pronounced
by British as Solapur.
In the nineteenth century, the city was a part of Ahmednagar district. In 1930, the city enjoyed freedom
for three days when the British rule was overthrown in Solapur by the locals.
After independence in 1956, the city was a part of State of Bombay. In 1960, it became an independent
district in the state of Maharashtra.
Solapur has historic importance in contributing to the freedom of India; the municipal council was the first
to hoist our national flag in 1930. A lot of freedom fighters such as Shri Mallappa Dhanshetti, Shri.Kurban
Hussain, Shri.Jagnnath Shinde and Shri.Kisan Sarda fought for independence from Solapur. As mark of
respect, statues of freedom fighters were built in the cities‟ Hutatma Chowk.
2.5. Socio Economic Parameters
2.5.1. Demographic
2.5.1.1. Population
Solapur grew rapidly as an industrial town in 1970s. This is also reflected in the population growth during
the same period. The decadal growth was very high between 1971 and 1991, when the down turn of the
textile industry begun.
Table 2-1: Population Trend of Solapur Municipal Corporation (SMC)
Year Population Decadal Growth (%)
1971 3,98,361 -
1981 5,14,660 29.24
1991 6,04,215 17.36
2001 8,72,424 44.39
2011 9,51,558 9.07
Source: Census of India 2011
It can be observed from the Table 2-1 above table that the population growth of Solapur was at its
peak during 1981-91 owing to the industrialization of the city and opening up of new industries in the

COMPREHENSIVE MOBILITY PLAN FOR SOLAPUR INCEPTION REPORT
Page | 7
textile sector. The population growth during 1991-2001 cannot be considered because the city limits were
expanded in 1992 resulting to increase in population and thus higher growth rate of population. Due to
closure of these mills and diminishing industrial growth, the diminishing population growth is observed. In
the last decade (2001-11) growth of the population has come down to 9.07% from 44.39% in 1991-2001.
2.5.1.2. Population Density
Overall density of the core city has been high over the years until the increase in city limits in 1992. The
city area has been changing over the years in last four decades and hence the density pattern varies. In
1971 the density of the city was 17149 persons per km2 which increased to 20159 persons per km2 in
1981. In 1992, 13 villages adjoining to SMC were merged in the municipal area increasing the area of
SMC jurisdiction from 33.03 km2 to 178.57 km2. This increase in the municipal area resulted in decline in
the gross population density from 20159 to 4886 person per km2 in 2001 and further it increased to 5329
person per km2 in 2011. The Table 2-2 presents the change in the gross population density in the city
during last four decades.
Table 2-2: Decade Wise Population and Density of Solapur Municipal Corporation (SMC)
Year Population Area (Sq. Km) Gross Density
Persons per Sq.km Persons per hectare
1971 3,98,361 23.23 17,149 171
1981 5,14,660 25.23 20,159 202
1991 6,04,215 33.03 18,293 182
2001 8,72,424 178.57 4,886 49
2011 9,51,558 178.57 5,329 53
Source: Census of India & SMC
2.5.2. Economic
2.5.2.1. Occupational Structure
The composition of the work force conveys a picture of the way of life of the people and their social and
economic activities. The total work force is 3,54,935 in 2011. The majority of the work force is main
workers, 93% of the working population is main workers and 7 % are marginal workers.
Table 2-3: Sectorial Distribution of the Workers in Solapur
Year Sector Primary Secondary Tertiary Non Workers
1971 % of total population 0.82 15.02 12.62 71.54
% of working population 2.88 52.76 44.36 -

COMPREHENSIVE MOBILITY PLAN FOR SOLAPUR INCEPTION REPORT
Page | 8
Year Sector Primary Secondary Tertiary Non Workers
1981 % of total population 0.55 2.16 28.35 59.41
% of working population 1.76 6.95 91.29 -
1991 % of total population 0.75 14.62 15.68 32.72
% of working population 2.38 47.08 50.54 -
2001 % of total population 1.14 6.03 27.63 65.20
% of working population 3.26 17.32 79.42 -
2011 % of total population 1.28 4.04 31.98 62.70
% of working population 3.44 10.83 85.74 -
Source: Census of India 2011 and SMC CDP
From the Table 2-3, it can be inferred that the sectorial distribution of workers shows that the major
concentration is in the tertiary sector, owing to gradual shift from the secondary sector. It can be
observed from the data of the last decade that the percentage of secondary workers compared to the
total workers has reduced from 17.32% to 10.83%. The reasons behind this can be attributed to the
diminishing industrial growth resultant of the poor infrastructure conditions in the industrial area of SMC.
2.5.2.2. Work force Participation Rate
The worker population of the SMC has increased by decadal growth rate of 17% during the last decade
with an annual increase in the worker population of 1.57%. As compared to this the non-worker
population which contributes to 60-65% of the city‟s population has grown by a decadal growth of 4.88%
with an annual increase of 0.48%. According to the provisional Census of 2011, the workforce
participation rate (WPR) is SMC has improved marginally from 35% to 37% during the last decade. The
Table 2-4 below shows the WPR for Solapur.
Table 2-4: Workforce Participation Rate in Solapur
S.
No.
Details 2001 % of total
population
2011 % of total
population
Growth
(%)
CAGR
(%)
1 Total workers (main +
marginal) 303,590 34.80 354,935 37.30 16.91 1.57
2 Total Non-Workers 568,888 65.20 596,623 62.70 4.88 0.48
Work Force Participation
Rate (WFPR) 34.80 37.30
Source: Census of India 2011 and CDP, Solapur
COMPREHENSIVE MOBILITY PLAN FOR SOLAPUR INCEPTION REPORT
Page | 9
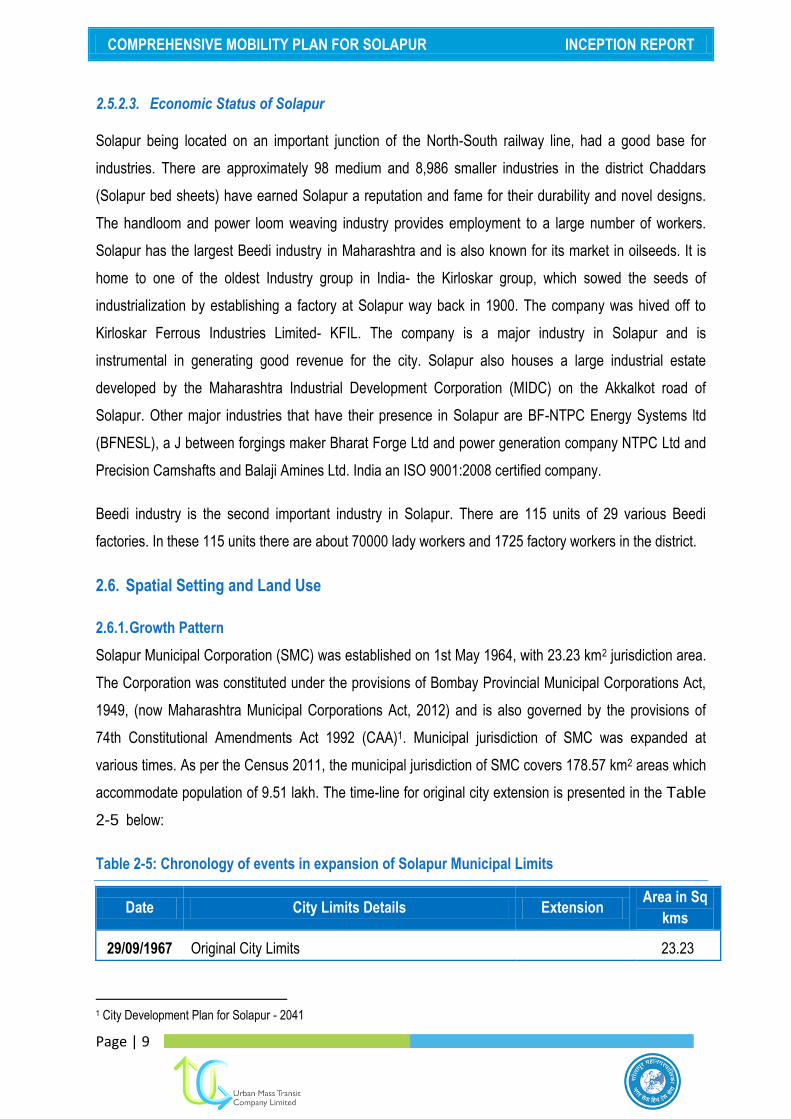
2.5.2.3. Economic Status of Solapur
Solapur being located on an important junction of the North-South railway line, had a good base for
industries. There are approximately 98 medium and 8,986 smaller industries in the district Chaddars
(Solapur bed sheets) have earned Solapur a reputation and fame for their durability and novel designs.
The handloom and power loom weaving industry provides employment to a large number of workers.
Solapur has the largest Beedi industry in Maharashtra and is also known for its market in oilseeds. It is
home to one of the oldest Industry group in India- the Kirloskar group, which sowed the seeds of
industrialization by establishing a factory at Solapur way back in 1900. The company was hived off to
Kirloskar Ferrous Industries Limited- KFIL. The company is a major industry in Solapur and is
instrumental in generating good revenue for the city. Solapur also houses a large industrial estate
developed by the Maharashtra Industrial Development Corporation (MIDC) on the Akkalkot road of
Solapur. Other major industries that have their presence in Solapur are BF-NTPC Energy Systems ltd
(BFNESL), a J between forgings maker Bharat Forge Ltd and power generation company NTPC Ltd and
Precision Camshafts and Balaji Amines Ltd. India an ISO 9001:2008 certified company.
Beedi industry is the second important industry in Solapur. There are 115 units of 29 various Beedi
factories. In these 115 units there are about 70000 lady workers and 1725 factory workers in the district.
2.6. Spatial Setting and Land Use
2.6.1. Growth Pattern
Solapur Municipal Corporation (SMC) was established on 1st May 1964, with 23.23 km2 jurisdiction area.
The Corporation was constituted under the provisions of Bombay Provincial Municipal Corporations Act,
1949, (now Maharashtra Municipal Corporations Act, 2012) and is also governed by the provisions of
74th Constitutional Amendments Act 1992 (CAA)1. Municipal jurisdiction of SMC was expanded at
various times. As per the Census 2011, the municipal jurisdiction of SMC covers 178.57 km2 areas which
accommodate population of 9.51 lakh. The time-line for original city extension is presented in the Table
2-5 below:
Table 2-5: Chronology of events in expansion of Solapur Municipal Limits
Date City Limits Details Extension Area in Sq
kms
29/09/1967 Original City Limits 23.23
1 City Development Plan for Solapur - 2041

COMPREHENSIVE MOBILITY PLAN FOR SOLAPUR INCEPTION REPORT
Page | 10
Date City Limits Details Extension Area in Sq
kms
01/07/1979 Vijapur and Hotgi Road Area included in SMC First Extension 2.30
01/04/1989 Salgarwadi, Beedi Kamgar Vasahat and S. No. 23 of
Shelgi added in SMC
Second
Extension 7.50
05/05/1992 Thirteen surrounding villages included in SMC Third Extension 145.54
Total Area as on 05/05/1992 178.57
Source: Solapur Development Plan, 1997-2017
2.6.2. Spatial Growth Trends
Solapur has access points from all the four direction. From the north Beed-Solapur highway is entering in
to city and in the south direction the national highway 13 connects Solapur with Managalore. The state
highway 151, which passes through the Solapur, connects Barshi with Akkalkot in Solapur district.
Figure 2-4: Growth Directions of Solapur City.
Based on the discussions with the town planning department of the SMC, it can be mentioned that the
city is growing in the direction along the roads connecting to Hyderabad and Akkalkot (Figure 2-4). The
main reason attributable to the growth direction may be the proximity to the MIDC located between the
Akkalkot road and Hyderabad road and major work force working in this industrial estate comes from
Andhra Pradesh and Karnataka. Also it should be noted that the growth of the city is happening at a very

COMPREHENSIVE MOBILITY PLAN FOR SOLAPUR INCEPTION REPORT
Page | 11
slow pace, as only 20% of the area has been developed when compared to the development plan
prepared in 1997 which was approved by the State Government in 2004.
2.6.3. Land-use Analysis
The development plan for Solapur city, prepared in 1997, describes the existing (1994) as well as the
proposed (2017) land use pattern for Solapur. As per the development plan, 25% of the city area was
developed and it comprised various urban amenities along with the residential area. The total
undeveloped area constituted about 75% of the total land under the jurisdiction of the SMC. This was
mainly due to the expansion of the city limit to 178.57 km2 including additional 13 villages and the area
around which remained undeveloped because of lack of infrastructure.
The Table 2-6 presents the land use break up in Solapur. Since the current land use break up for the
SMC area is not available, the prevailing land use presented in the development plan is presented here.
The development plan proposed an increase in the residential area from 1160.4 ha to 6513.41 ha an
aggregate increase of 461%. However as per the discussions with the department officials, there is no
significant development in the extended areas of the city due to lack of infrastructure and basic
amenities.
Table 2-6: Land Use Proposed in the Development Plan of Solapur
Land Use
Existing (1994) Proposed (2017)
Area (Ha) % of Total
Area
% of
developed
Area
Area (Ha) % of Total
Area
% of
Developed
Area
Residential 1160.4 6.50% 25.44% 6513.41 36.47% 59.59%
Mixed Use 121.1 0.68% 2.66% 1191.97 6.67% 10.36%
Industrial 287.2 1.61% 6.30% 452.76 2.54% 3.93%
Commercial 167.5 0.94% 3.67% 204.96 1.15% 1.78%
Transport and
Communication 896.2 5.02% 19.65% 1027.08 5.75% 8.92%
Public and
Semi Public 680.84 3.81% 14.93% 652.9 3.66% 5.67%
Public Utilities 40.96 0.23% 0.90% 75.48 0.42% 0.66%
Garden, Play
Ground 260.75 1.46% 2.27%
Burial
Cremation
Ground
76.96 0.43% 1.69% 84.81 0.47% 0.74%
Water Bodies 377.43 2.11% 8.27% 492.04 2.76% 4.28%

COMPREHENSIVE MOBILITY PLAN FOR SOLAPUR INCEPTION REPORT
Page | 12
Land Use
Existing (1994) Proposed (2017)
Area (Ha) % of Total
Area
% of
developed
Area
Area (Ha) % of Total
Area
% of
Developed
Area
Agricultural
Land 11926.61 66.79% - 6348.34 35.55% 55.16%
Vacant Land 1369.2 7.67% - -
SPA-I (MIDC
+MHADA) 460 2.58% 10.08% 553 3.10% 4.80%
SPA-II
(MHADA) 293 1.64% 6.42%
Total Area 17857.5 100.00% 17857.5 100.00%
Developed Area 4561.69 25.54% 11509.16 64.45%
Un Developed
Area 13295.81 74.46% 6348.34 35.55%
Source: Development Plan of Solapur (1997-2017)
2.6.3.1. Comparison with URDPFI Guidelines2
The land use of Solapur as provided in the development plan has been compared with urban and
regional development plan formulation and implementation (URDPFI) guidelines to assess the adequacy
of existing areas under various land uses. As indicated in the table below, the city lacks adequate land
use share under residential, industrial, public and semi-public, and recreational categories. Commercial
and transportation use is meeting URDPFI guidelines.
Table 2-7: Existing Land Use and Comparison with URDPFI Guidelines
Category URDPFI Guidelines Existing (1994)
Residential 40 – 45% 7.81%
Commercial 3 – 4 % 0.94%
Industrial 8 – 10% 5.83%
Public & Semi Public 10 – 12% 3.81%
Recreational 18 - 20%
Transportation 12 - 14% 5.02 %
Agricultural/Vacant/Forest
and Water Bodies
Balance 77%
From the Table 2-7, it could be observed that the road network constitutes 5.02% of the total Solapur
city area. As per the URDPFI Guidelines, the city should have an area under transportation between 12-
14%, which the city is not meeting the requirement. The core city is encompassed within two ring roads
2 For cities with population – 5 to 10 lakhs

COMPREHENSIVE MOBILITY PLAN FOR SOLAPUR INCEPTION REPORT
Page | 13
which if developed efficiently can resolve most of the congestion issues within the city. The roads
developed within the city area, are not adequate to accommodate the traffic load. These roads have also
been encroached in some parts of the city; the road network does not cater efficiently to the areas which
were merged in to the municipal limits in 1992.
2.7. Traffic and Transportation System
2.7.1. Connectivity
2.7.1.1. Road Connectivity:
Solapur is well-connected by road with major cities of Maharashtra as well as the adjoining State Capital
of Hyderabad and important cities in Karnataka by four National Highways namely;
NH 9 highway connecting Pune with Vijaywada via Hyderabad,
NH-13 connecting Solapur to Mangalore, Karnataka
NH-211 connecting Solapur to Dhule and;
NH 204 connecting Ratnagiri-Nagpur passes through city.
Recently, sanctioned National Highways- Solapur - Gulbarga and Ratnagiri-Solapur-Nagpur (Refer to
Figure 2-3).
2.7.1.2. Rail Connectivity
Solapur Railway Station is the main hub within the city. The Solapur Railway Division is an important
division connecting South India to Western and North West India. Trains from Ahmedabad, Jaipur, New
Delhi, Mumbai, Pune etc,. ply to Southern states (Telangana, Karnataka, Tamil Nadu & Kerala) via
Solapur.
It is served daily by Solapur Bangalore express, Solapur Nagpur, Solapur Pune Hutatma Express,
Solapur Mumbai, Solapur Jaipur Superfast express and Solapur Goa Express
2.7.1.3. Air Connectivity
Solapur Airport is located to the South of the Solapur city. At present it is not covered by any airline
operator.
2.7.2. Road Network
In SMC the city engineer department is responsible for the development if roads in the city. Solapur being
a city of industrial importance has a comprehensive road network in the city. Also the city is well
connected to the nearby regional centers like Pune, Aurangabad, Beed etc. Also there are certain
COMPREHENSIVE MOBILITY PLAN FOR SOLAPUR INCEPTION REPORT
Page | 14
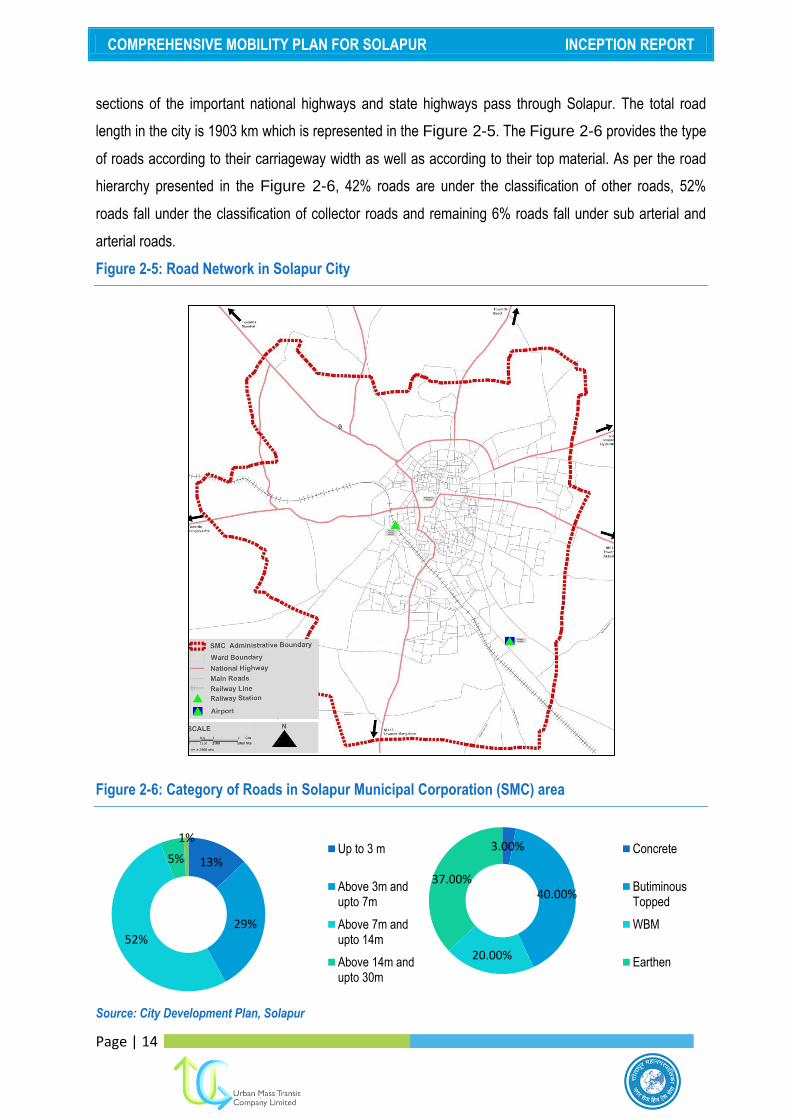
sections of the important national highways and state highways pass through Solapur. The total road
length in the city is 1903 km which is represented in the Figure 2-5. The Figure 2-6 provides the type
of roads according to their carriageway width as well as according to their top material. As per the road
hierarchy presented in the Figure 2-6, 42% roads are under the classification of other roads, 52%
roads fall under the classification of collector roads and remaining 6% roads fall under sub arterial and
arterial roads.
Figure 2-5: Road Network in Solapur City
Figure 2-6: Category of Roads in Solapur Municipal Corporation (SMC) area
Source: City Development Plan, Solapur
3.00%
40.00%
20.00%
37.00%
Concrete
ButiminousTopped
WBM
Earthen
13%
29% 52%
5%
1% Up to 3 m
Above 3m andupto 7m
Above 7m andupto 14m
Above 14m andupto 30m

COMPREHENSIVE MOBILITY PLAN FOR SOLAPUR INCEPTION REPORT
Page | 15
With regard to the condition of roads, as presented in the figure below, 63% roads are surfaced and 37%
roads are un-surfaced. Majority of these un-surfaced roads are in the extended city areas.
Some of the major junctions in Solapur are as follows:-
1. Railway Station Area;
2. Panjrapol (Bus Stand Area)
3. Sat Rasta
4. Lucky Chowk
5. Rangbhavan
6. Park Chowk
7. Kontam Chowk
8. Ashok Chowk
9. Shivaji Chowk
10. Chatrapati Sambhaji Chowk (on Pune
Solapur Road)
2.7.3. Registered Vehicles in Solapur City
Major mode of transportation used by the citizen of the city is two wheelers. The motor vehicle statistics
of the Solapur reveals that of the total 5,54,731 vehicle registered in the city till 31st March 2013, of
which 4,09,021 are two wheelers which constitute approximately 75% of the total vehicles in the city.
When the same figures for the subsequent year are assessed, it can be seen that the total vehicles in
the city has grown to 5,54,731 registering a growth rate of 9.35%. While the share of 2 Wheelers
remains at 80%. The Figure 2-7 & Table 2-8 represents the composition of the registered vehicles in
the city of Solapur
Figure 2-7: Growth of Vehicles in Solapur City
Year No. of Vehicles
Registered
Growth Rate
(%)
2006 314,376
2007 337,182 6.76%
2008 358,417 5.92%
2009 382,663 6.34%
2010 417,013 8.24%
2011 455,944 8.54%
2012 507,298 10.12%
2013 554,731 8.55%
Source: Motor Transport Statistics of Maharashtra 2010 – 2011, 2011-12 and 2012-13

COMPREHENSIVE MOBILITY PLAN FOR SOLAPUR INCEPTION REPORT
Page | 25
0
100
200
300
400
500
600
700
2005 2006 2007 2008 2009 2010 2011 2012 2013
No. of Accidents
No. of Persons Killed
No. of Persons Injured
Table 2-8: Mode wise distribution of vehicles registered in Solapur City
Vehicle Wise No. of
Registere
d Vehicles
2011
% Share
of
Vehicles
2011
No. of
Registere
d Vehicles
2012
% Share
of
Vehicle
s 2012
No. of
Registere
d Vehicles
2013
% Share
of
Vehicle
s 2013
Two Wheeler 364,806 80.03% 407,562 80.31% 409,021 73.73%
Four Wheeler 31,032 6.81% 34,448 6.79% 85,905 15.49%
Goods Vehicle 23,970 5.26% 25,279 4.98% 27,471 4.95%
Tractors 13,151 2.89% 16,612 3.27% 11,820 2.13%
Trailer 12,559 2.76% 12,962 2.55% 3,473 0.63%
Auto Rickshaws 8,614 1.89% 8,569 1.69% 8,538 1.54%
Taxis 984 0.22% 1,150 0.23% 4,610 0.83%
Buses 447 0.10% 404 0.08% 2,396 0.43%
Other Vehicles 247 0.05% 474 0.09% 1,497 0.27%
Total 455,810 100.00% 507,460 100.00% 554,731 100.00%
Source: Motor Transport Statistics of Maharashtra 2010 – 2011, 2011-12 and 2012-13
2.7.4. Accidents
The trend of motor vehicle accidents in Solapur from 2005 onwards is shown in the Figure 2-8 below.
Figure 2-8: Accidents Trend in Solapur City
Year No. of Accidents
No. of Persons
Killed
No. of Persons Injured
2005 492 84 408
2006 545 87 458
2007 590 78 512
2008 591 85 506
2009 496 99 397
2010 560 111 449
2011 465 87 378
2012 355 76 279
2013 292 85 207
Source: Motor Transport Statistics of Maharashtra 2010 – 2011, 2011-12 and 2012-13

COMPREHENSIVE MOBILITY PLAN FOR SOLAPUR INCEPTION REPORT
Page | 26
The mixed nature of roads, improper junction geometric and un-signalized junctions lead to major
accidents in Solapur. It has been observed that nearly 98% of the accidents occurred due to the rash
driving of motor vehicles. It can be observed from the above figure that the number of accidents in the
Solapur has decreased from 449 in 2010 to 207 in 2013. This shows that improvement measures w.r.t
the road conditions and traffic management in the city are taken by the traffic police department.
2.7.5. Pedestrian and NMV Facilities
The city has inadequate pedestrian infrastructure. There is no foot over bridges, sub-ways, pedestrian-
only traffic signals. In fact the city lacks in provisions for dedicated NMV lanes and dedicated parking
facilities for cycle rickshaws.
2.7.6. Parking Characteristics
Most of the internal road network specifically the network in the core city area faces major difficulty of
congestion and unavailability of the full right of way (RoW) due to encroachment by haphazard on-
street parking. The city lacks in provision of sufficient and dedicated off street parking facilities. Also the
on-street parking is not managed and maintained in structured manner. This is effectively reducing the
network capacity and further adding to the congestion level. Vijapur Road, Karkhana Road, Akkalkot
Road, Park Chowk, Zhila Parisad Road, Saraf Katta, Kontam Chowk Area, Station Road, Navi Peth are
the main areas crowded with unauthorized on-street parking.
2.7.7. Public Transport Characteristics
Before independence, the facilities for public transportation in Solapur were provided by private
companies. The Solapur Municipality had implemented the Bombay Municipal Burrows Act (1925) and
started local bus services in Solapur from 10-01-1949. In 1978 the services of bus transportation were
extended to Holgi Road, Industrial Places, Sugar Factories, Airport, MIDC, Vijapur Raoad and nearby
villages, while developing the city.
Currently the urban public transportation in Solapur is managed by the Solapur Municipal Transport
(SMT). SMT was established in April, 1965 based on the B.P.M.C Act 1949. Currently, SMT operates
106 own buses and 40 additional buses on hire basis. The ownership of the hired buses remains with
the private operator, however the manpower for running the operations is supplied by SMT. Based on
the daily ridership data collected from the SMT, it was observed that in the year 2012-13; 50,724
passengers used public transport, which essentially means that 5% of the city population use public
transportation facility. SMT operates city bus services on 39 routes. The age wise distribution of 106

COMPREHENSIVE MOBILITY PLAN FOR SOLAPUR INCEPTION REPORT
Page | 27
buses, around 70% of the fleet is at least 15 years old and face high operation cost, breakdowns and
high pollution levels.3
Solapur Municipal Transport (SMT) had submitted a detailed project report, to avail the funds under the
extended JnNURM Scheme, which has been duly approved by the Central Sanctioning and Monitoring
Committee (CSMC) meeting. This would imbibe 200 buses on the streets of Solapur.
2.7.7.1. Public Transportation Ridership
Table 2-9, there has been no substantial increase in the public transport ridership in SMC from 2007-08
to 2012-23 owing to the condition of the buses available with the SMT. Also, the available fleet of the
buses is not entirely owned by the SMT and is rented from the private agencies which puts the
additional financial burden on SMT. The total available fleet with the SMT (combined fleet from the
private operators as well as from the private suppliers) is 146 buses. As against this, the average daily
fleet available for the operations remains in the range of 65-80 buses i.e, 45% to 55% of the total
available fleet.
Table 2-9: Passenger and Fleet Details of Solapur Municipal Transport (SMT)
Year Total Fleet Average Daily Fleet Average Passenger
per day
2007-08 127 78 46148
2008-09 134 84 56356
2009-10 91 80 50230
2010-11 92 65 44326
2011-12 102 69 48900
2012-13 146 73 50724
Source: Detailed Project Report for Solapur Municipal Transport (SMT)
2.7.8. Issues
Based on the reconnaissance survey, the following observations were made with respect to the city‟s
traffic and transportation.
Land use
Road network constitutes 5.02% of the total Solapur city area. As per the URDPFI Guidelines,
the city should have an area under transportation between 12-14%.
3 Detailed Project Report for procurement of Buses under the extended JnNURM Scheme for Solapur

COMPREHENSIVE MOBILITY PLAN FOR SOLAPUR INCEPTION REPORT
Page | 28
Road Network
Major portion of the roads in the city are unpaved, i.e. 37% of the total roads in the city are un-
paved roads. Movement of vehicles on the un-paved roads leads to increase in soil particles to
rise and lead to increased air pollution in the city. Also the time taken for travel on the un-paved
roads is more compared to the paved roads.
Other road elements such as street lighting, footpaths, and faulty junction designs have been
missing.
In Solapur, 13 intersections are having the automated signal indicators. Considering the road
length of the city, additional 20 junctions / intersections in the city are to be provided with
automated signals.
There is no provision of street infrastructure for the differently abled people, who have been
completely neglected.
Public Transportation
Condition of public transportation in the city needs up-gradation, Of the total estimated
population of the city in 2013, only five percent of the population use public transport.
The SMC has a bus fleet of 146 buses for the public transportation in the city. As mentioned in
the section 70% of the buses are more than 15 years old. Of the total bus fleet in the city, only
50% is available for daily bus operations.
Parking
In absence of the dedicated parking spaces in the core city, and commercial activities in the
core city lead to use of the available row for on street parking reducing the available right of
way for traffic movement.
Non-Motorized Transport
Based on the reconnaissance survey, it was observed that majority of the people use cycles
and cycle rickshaws for their daily travel requirement, yet there is no provision of dedicated
NMV lanes within the city.
2.8. Observations from City Development Plan, Solapur
To make Solapur city a transportation node for the region with efficient road network and safe, reliable
public transport system, the following development goals were suggested in the CDP
Increase the share of public transport and minimize traffic congestion

COMPREHENSIVE MOBILITY PLAN FOR SOLAPUR INCEPTION REPORT
Page | 29
Minimize road accidents and improve the pedestrian related infrastructure.
To achieve the same the following strategies were suggested;
Prepare a comprehensive traffic and transportation plan for the city,
Undertake a road condition survey for the entire road network in the city,
Improve traffic management systems by diverting traffic and creating one way traffic systems in
congested roads,
Prepare an inventory of roads to be provided with footpaths,
Route rationalization of existing bus routes
Prepare a business plan for DMT
Develop a multi storied parking and paid parking at the identified locations at the earliest.
CDP has envisaged a total sectoral capital investment in the traffic and transportation for the horizon
year 2021 to be Rs 632.42 crores. The CDP also suggested the possibility of executing the identified
interventions through PPP mode.

COMPREHENSIVE MOBILITY PLAN FOR SOLAPUR INCEPTION REPORT
Page | 30
Chapter 3. Approach and Methodology
This chapter defines the approach and methodology of the study, based on the CMP Toolkit as
published by the Ministry of Urban Development (MoUD), Government of India (GoI). The Study shall
be accomplished through a series of tasks, which are explained in detail in the following sections. The
study methodology is shown in the Figure 3-1.
Figure 3-1: Study Methodology

COMPREHENSIVE MOBILITY PLAN FOR SOLAPUR INCEPTION REPORT
Page | 31
3.1. Mobilization and Reconnaissance
3.1.1. Initial Consultations
Before mobilizing the team and resources, UMTC has consulted the SMC Officials and discussed about
the project in detail to ensure that UMTC understood the agreement terms, the scope of work and the
expectations of the client team.
3.1.2. Kick-Off Meeting
The kick meeting with the client is an important activity. The kick off meeting would serve the following
purposes:
Introduction between UMTC and client team
Jointly identify the geographical scope of the study area for study purposes
Establish general communication and project progress reporting procedures
Establish coordination mechanism between different agencies involved in the Technical
Advisory Committee.
Review and assessment of project needs and Consultants approach and methodology,
team deployed, staffing schedule etc.
Undertake preliminary field reconnaissance along with client for understanding of issues
Identify key issues of the client and agree on the methodology to tackle them
Accordingly, the consultants had a kickoff meeting with the staff of SMC in Solapur on March 18-19,
2015 and met with other stakeholders like SMC, RTO etc.
3.2. Scope of Work
The tasks to be taken up as part of the study are mentioned below;
Task 1: Delineate the planning area and the planning horizon
Task 2: Data Collection and Analysis of the Existing Urban Transport and Environment
Task 3: Development of Business as Usual (BAU) Scenario
Task 4: Development of Sustainable Urban Transport Scenarios
Task 5: Development of Urban Mobility Plan
Task 6: Preparation of Implementation Program
The detailed methodology for performing each of these tasks is mentioned as under;

COMPREHENSIVE MOBILITY PLAN FOR SOLAPUR INCEPTION REPORT
Page | 32
3.2.1. Task 1: Defining the Scope of CMP
3.2.1.1. Delineate the Planning Area
The planning area for the study has been delineated based on the following parameters;
Existing growth pattern of city.
Existing urban agglomeration as identified in the master plan/regional plan of Solapur city.
Areas that forms the part of the urban settlements and fringe area limits.
Based on the afore-mentioned aspects and in consultation with the stakeholders including Solapur
Municipal Corporation (SMC), the city plan covers an area of 178.57 Sq. kms. The study area of
Solapur is shown in the Figure 2-1.
3.2.1.2. Determine Planning Horizons
CMP provides a roadmap for the development of transport-related infrastructure to provide desirable
level of mobility and reduction in carbon emissions. The plan relies on “avoid, shift and improve”
methodology, i.e., avoid motorized trips where possible or give options of using shared/public transport.
It encourages a shift to low carbon modes and an improvement in the overall efficiency of motorized
vehicles.
It has been ascertained that the overall goal of CMP Solapur can be realized over a long term horizon
period of 20 years. This timeframe has been divided into three time horizons. The three horizon periods
are divided as follows;
1. Short-term: The short-term time horizon will last for 0-3 years, starting from 2015-2019. It will
focus on short term planning measures that include intersection improvements, signalization of
intersections, improvement of non-motorized transport, improvement in pedestrian facilities,
traffic circulation plans, parking plans etc. the overall emphasis will remain on imporving the
safety and accessibility standards.
2. Medium term: The time period for this horizon will last for five to ten years, till 2025. The focus
will be on medium term planning projects such as NMT corridors, city bus networks and NMT
networks. The objective of medium term planning is to arrest the current trend of heavy
dependency on private vehicles and set ground for higher PT and NMT usage in the future.
3. Long term: This is a 20 year long term period, lasting up to 2035 with a long-term vision of
achieving overall low carbon mobility goals.

COMPREHENSIVE MOBILITY PLAN FOR SOLAPUR INCEPTION REPORT
Page | 33
3.2.1.3. Work Plan
The period of preparation of CMP for Solapur is estimated to be about 8 months for the current study
area of 178.57 Sq kms of Solapur Municipal Corporation (SMC).
3.2.2. Task 2: Data Collection and Analysis of the Existing Urban Transport and Environment.
3.2.2.1. Task 2-1: Review of the City Profile
The various aspects which define the profile of the study area are studied in this task. The likely points
are mentioned below and the CMP includes detailed study of these points;
Preliminary Reconnaissance: One of the first tasks that we would undertake to appreciate
the transport issues in proposed cities is to conduct a reconnaissance that covers;
o Location and area
o Population and Demographic Data
o Land Use
o Regional Linkages
o Socio economic data
o Environmental Issues such as natural conservation areas.
Review of Past Studies and Data Collection: A thorough review of the past studies, which
have significance to the current study, will be undertaken to understand the growth of transport
scenario in Solapur over the years. The study reports that will be reviewed include the
following;
o Earlier CTTS and other reports done, if any
o National Urban Transport Policy, Ministry of Urban Development and Poverty
Alleviation – 2006
o Study of Traffic and Transportation Policies and Strategies in Urban Areas in India
o City Development Plans, if any
o Land Use Master Plan, if any
o Ongoing DPRs, if any
o Any other related plans/studies
The Consultant team would extensively travel in the Study Area to appreciate the transport system
demand and supply scenario, problems, network deficiencies, understand the role of public transport
system and make a preliminary assessment of the same. Also, a list of all the concerned officers will be
prepared to establish a rapport and open-up communication and to train a few among them.

COMPREHENSIVE MOBILITY PLAN FOR SOLAPUR INCEPTION REPORT
Page | 34
3.2.2.2. Task 2-2: Delineation of Traffic Analysis Zones
For the purpose of analysis and development of travel demand forecasting model, the study area is
required to be sub-divided into smaller areas known as Traffic Analysis Zones (TAZ‟s). The TAZ‟s
would be delineated based on the factors such as administrative boundaries, physical barriers like
water bodies, railway lines, highways and homogeneous land uses.
3.2.2.3. Task 2-3: Review of Land use Pattern and Population Density
Keeping in view of Solapur City, existing and proposed future land use maps of the study area will be
plotted in an appropriate GIS platform like Arc Info and Arc GIS and following parameters would be
observed and analyzed;
The proportion of land use for various purposes i.e, Residential, Commercial, Institutional,
Recreational, Transportation etc.
Accessibility of people between different types of land use area.
Densities of each type of land use i.e. population density, employment density (number of
employment opportunities per commercial and land area used) etc.
The study of these trends gives a broad idea on the development pattern of the city.
3.2.2.4. Task 2-4: Review of the Existing Transport Systems
A review of existing transport infrastructure and facilities will be done for all the transport modes
including public transport (private and public), private vehicles, walking, cycling, cycle rickshaw, auto
rickshaw, shared auto rickshaw etc,.The data requirement of the same could be analyzed w.r.t the
previous studies, secondary data and primary surveys, which would be visually represented on maps
and tables.
3.2.2.5. Task 2-5: Study of Existing Travel Behavior.
The primary surveys conducted would cover the travel behaviors of all individuals within a household,
and the data should be segregated by mode and trip purpose. The detailed methodology for the
collection of travel demand data and the required primary surveys is explained in the following chapter.
3.2.2.6. Task 2-6: Review of Energy and Environment
Energy considerations are one of the key concerns of the “Smart city”. Quantifying the energy
consumptions for transport is important in estimating the CO2 and local air pollution emissions from
transport related activities. The vehicle stock can be obtained from the vehicle registration records
Hence the data shall be collected for the fuel sales in the study area and total fuel sold various gas

COMPREHENSIVE MOBILITY PLAN FOR SOLAPUR INCEPTION REPORT
Page | 35
stations in the study area shall give an approximation on the total energy consumed for the transport
sector in the study area.
3.2.2.7. Task 2-7: Service Level Benchmarks
Infrastructural data collected should be compared with the service level benchmarks to understand the
level of service provided to the citizen of certain specified parameters. Some of the indicators are as
mentioned below;
1. Public Transport Facilities
2. Pedestrian Infrastructure Facilities
3. Non-Motorized Transport (NMT) facilities
4. Level of Usage of Intelligent Transport System (ITS) facilities
5. Travel speed (motorized and mass transit) along the major corridors
6. Availability of Parking spaces
7. Road Safety
8. Pollution levels
9. Integrated Land use Transport system
10. Financial Sustainability of Public Transport by bus.
3.2.3. Task 3: Development of Business as Usual (BAU) Scenario
3.2.3.1. Task 3-1: Framework for Scenarios:
The scenario represents the future based on the continuation of past trends and is often used as a
reference point or benchmark for assessing the need for policy interventions. The BAU scenario
extrapolates existing trends and assumes no radical policy interventions for sustainable development
and emission mitigation. However, it does incorporate infrastructure development and land use
according to the Master Plans.
3.2.3.2. Task 3-2: Socio Economic Projections
The future demand for the system will be based on an estimation of the following socio-economic
aspects.
o Population Growth: It will be projected based on the trends available from studies conducted
in the past and census data.
o Economic Growth: The overall economic growth of the city will be projected based on the
growth trends of the Per Capita Income and the Gross Domestic Product (GDP). The relation

COMPREHENSIVE MOBILITY PLAN FOR SOLAPUR INCEPTION REPORT
Page | 36
between economic growth, particularly income growth with the increase in vehicle ownership
may be useful measure for projecting per capita carbon emission trends for different income
strata of the population.
o Vehicular Growth: The growth in number of private and public vehicles will be projected using
the vehicle registration records from the local Road Transport Office/Authority (RTO/RTA) in
Solapur.
o Sectoral Growth: The growth trends for primary, secondary and tertiary sectors of the
economy will need to be considered to present an overall growth of the Solapur city. Each of
these sectors lead to unique travel demands and expectations from the transportation system.
Therefore, each will need to be estimated for developing a comprehensive travel demand
model.
3.2.3.3. Task 3-3: Land Use Transitions
The objectives of a successful land use development and growth models is to identify where, how much
and what kind of land use will develop. When modelling urban developments, it is necessary to
consider changes from a vacant land to built-up, as well as changes in the land use itself, such as from
residential to commercial. The change in the land-use of different categories would be assessed and
projected for the future years, based on which the impact of land-use on transport would be analyzed.
3.2.3.4. Task 3-4: Transport Demand Analysis
The demand for the passenger transport can be estimated using a four stage model. A travel demand
model for Solapur will be developed to simulate the existing travel conditions, and forecast the future
travel demand and its impacts. This model developed using GIS based transportation softwares such
as VISUM/CUBE.
Broadly speaking, travel demand models are used to determine the number of trips (demand) on a
given network (supply) at any point of time. Travel demand forecasting models are used to predict the
change in travel pattern, magnitude and utilization of transportation system in response to the changes
in the regional development, demographic and transportation system. The broad framework for the
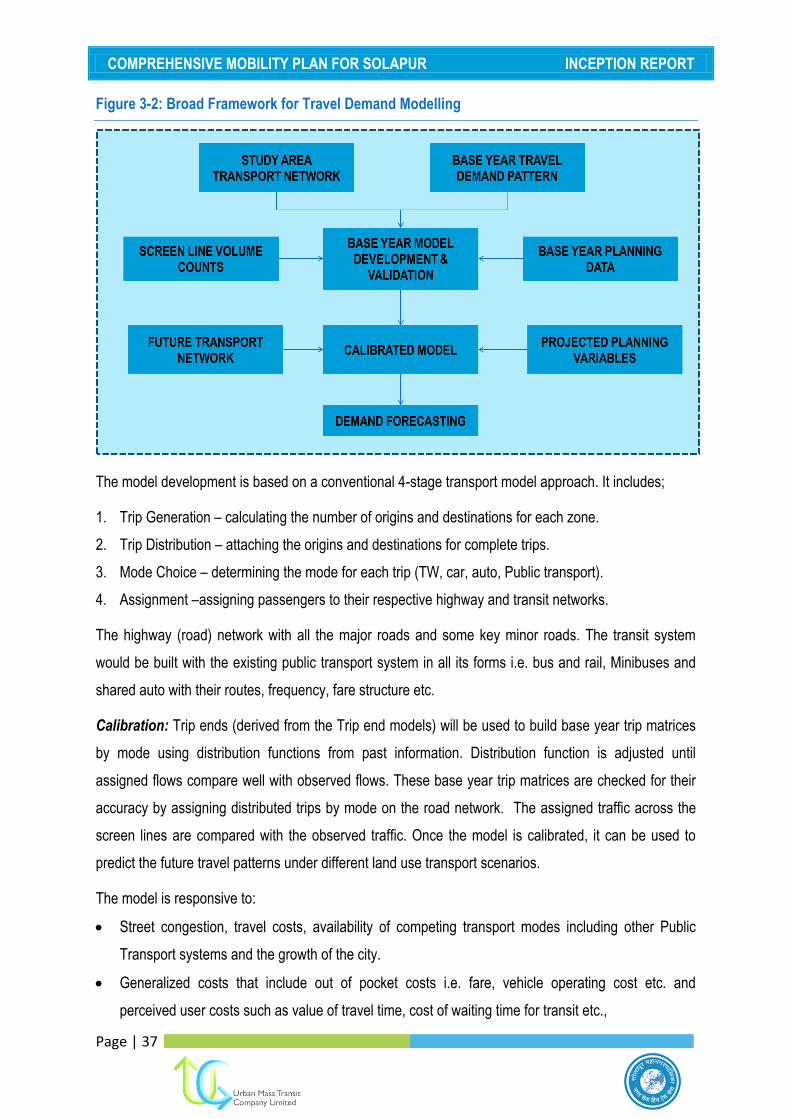
transport modelling is shown in the Figure 3-2.
COMPREHENSIVE MOBILITY PLAN FOR SOLAPUR INCEPTION REPORT
Page | 37
Figure 3-2: Broad Framework for Travel Demand Modelling
The model development is based on a conventional 4-stage transport model approach. It includes;
1. Trip Generation – calculating the number of origins and destinations for each zone.
2. Trip Distribution – attaching the origins and destinations for complete trips.
3. Mode Choice – determining the mode for each trip (TW, car, auto, Public transport).
4. Assignment –assigning passengers to their respective highway and transit networks.
The highway (road) network with all the major roads and some key minor roads. The transit system
would be built with the existing public transport system in all its forms i.e. bus and rail, Minibuses and
shared auto with their routes, frequency, fare structure etc.
Calibration: Trip ends (derived from the Trip end models) will be used to build base year trip matrices
by mode using distribution functions from past information. Distribution function is adjusted until
assigned flows compare well with observed flows. These base year trip matrices are checked for their
accuracy by assigning distributed trips by mode on the road network. The assigned traffic across the
screen lines are compared with the observed traffic. Once the model is calibrated, it can be used to
predict the future travel patterns under different land use transport scenarios.
The model is responsive to:
Street congestion, travel costs, availability of competing transport modes including other Public
Transport systems and the growth of the city.
Generalized costs that include out of pocket costs i.e. fare, vehicle operating cost etc. and
perceived user costs such as value of travel time, cost of waiting time for transit etc.,
COMPREHENSIVE MOBILITY PLAN FOR SOLAPUR INCEPTION REPORT
Page | 38
The economic development of the city. A comprehensive data on economic development in the
form of land-use and transport development proposals was collected.
Peak period models provide much more accurate indications of directional travel patterns during design
conditions than do daily models. However, the daily traffic forecasts can be estimated using peak today
expansion factor which is obtained from the traffic survey.
3.2.3.5. Task 3-5: Technology Transitions
An understanding of the vehicles, fuels and CO2 emissions from electricity use in transportation system
is essential to learning the implications of travel demand on CO2 emissions and air quality.
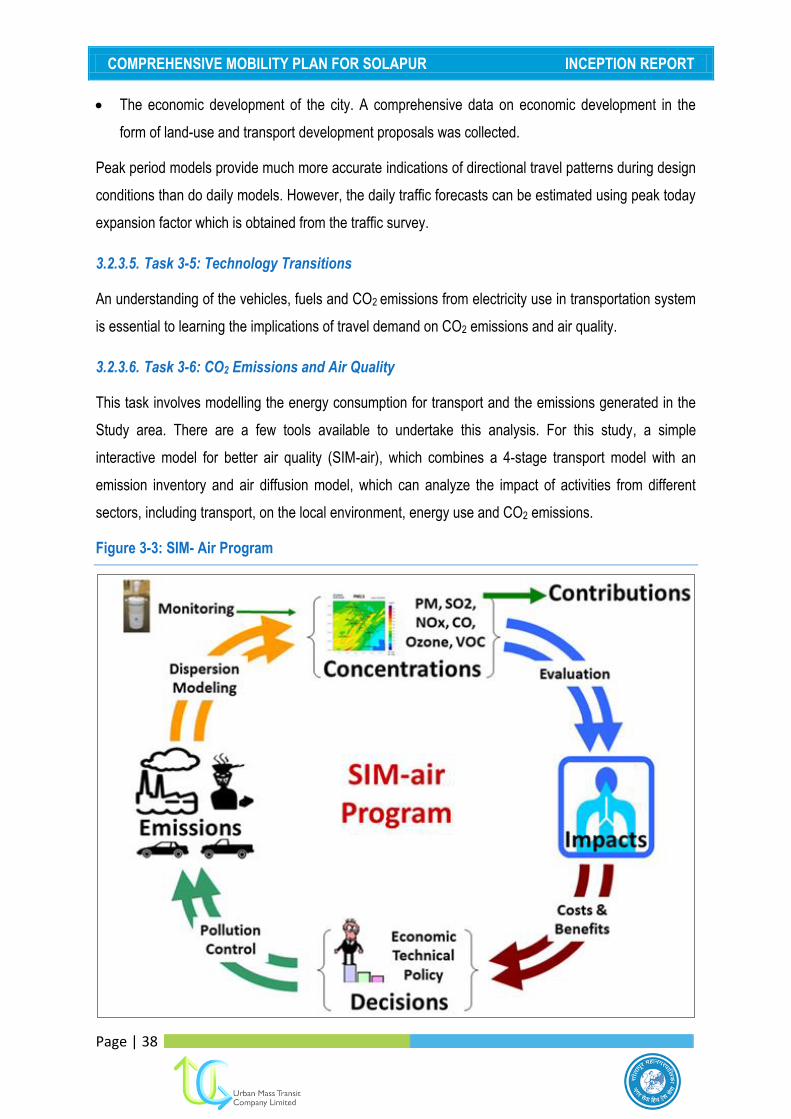
3.2.3.6. Task 3-6: CO2 Emissions and Air Quality
This task involves modelling the energy consumption for transport and the emissions generated in the
Study area. There are a few tools available to undertake this analysis. For this study, a simple
interactive model for better air quality (SIM-air), which combines a 4-stage transport model with an
emission inventory and air diffusion model, which can analyze the impact of activities from different
sectors, including transport, on the local environment, energy use and CO2 emissions.
Figure 3-3: SIM- Air Program

COMPREHENSIVE MOBILITY PLAN FOR SOLAPUR INCEPTION REPORT
Page | 39
3.2.3.7. Task 3-7: Analysis and Indicators
The indicators for the BAU scenario are similar to those estimated for the base year (Please refer to
3.2.2.7)
3.2.4. Task 4: Development of Business as Usual (BAU) Scenario
The study will develop four alternate scenarios for the horizon years, based on the four strategies that
have been identified in the terms of reference for introducing mitigations to the BAU scenario. The
scenarios will be analyzed to project the likely deviations from the BAU scenarios considering each
indicator. The four different strategies have been detailed below;
3.2.4.1. Task 4-1 Framework for Scenario
The existing structure of Indian cities is compact with high density and multi nuclei development. This
results in shorter trip length. However, the existing development strategies and plans might result in
increasing trip lengths. The following scenarios shall be developed and modelled in order to reduce trip
lengths.
3.2.4.2. Task 4-2 Strategies for Sustainable Urban Transport Scenario
CMP‟s must identify investment priorities to help achieve the sustainable city goals. The emphasis is
placed on improving technology in terms of efficiency and emissions. The key strategies are as
mentioned as below;
Alternate Scenario with mitigations in Urban Structure
a) Proposed Master Plan Scenario: Growth of the city will be assumed to be guided by the
existing master plan. The strengths and weaknesses of the master plan according to low
carbon targets will be evaluated.
b) Mixed Land Use Scenario: Structure of all new developments will be treated as mixed use.
Hence, the average trip length in old and new development would aggregate to a low value and
promote the use of non-motorized modes. This can arrest the creation of an activity center
which would form a core for congestion and indirectly lead to an increase in emissions.
c) Corridor Oriented Development Scenario: Such development is usually assigned along
major travel corridors. It promotes the use of high capacity public transport or mass transit
systems, which help achieve low carbon targets in the city.

COMPREHENSIVE MOBILITY PLAN FOR SOLAPUR INCEPTION REPORT
Page | 40
d) Growth of Satellite Cities: All new satellite cities will be treated as independent sub- cities
with individual central business districts. This can restrict the commute between the main city
and these satellite towns.
Alternate Scenario with Improvements in Public Transport
Improving public transport involves infrastructural improvements like reserving bus-lanes and tracks,
improving location and design of stops and operational improvements. The improvement in level of
service is likely to not only result in retaining the existing modal share of public transport but also cause
a shift from other modes to the use of public transport. The following scenarios will be developed:
a) City-Wide Bus Transport System: A comprehensive citywide bus network will be developed
and modelled to meet the travel demand. This network shall be evaluated against emissions
and low carbon objectives.
b) Adaptive Transit: Change in land use is usually very tough to implement in developed and old
areas of the city. Keeping in mind the nature of all areas with such land use, suitable transit
such as minibuses, para transit and motor and cycle rickshaws will provide connectivity in the
short and medium term.
c) Transit-Oriented Development: Major travel corridors will be identified in the city and mass
transit modes will be provided along these corridors. The rest of the road network will be built
around these major corridors by providing feeder services to them.
d) Combination of Transport Modes: A combination of the afore-mentioned three strategies will
be adopted.
Alternate Scenario with Improvements in Non-Motorized Transport
Improving non-motorized transport (NMT), which will involve development of a conducive environment
to provide barrier free, direct, continuous, comfortable, safe and secure movement. The likely shift in
modal share from motorized to non-motorized modes by providing a combination of these infrastructure
items will be modelled:
a) Footpaths along all arterial and sub arterial roads.
b) Exclusive cycle lanes along all arterial and sub arterial roads.
c) Traffic calming measures in residential zones.
d) Adequate street furniture to promote NMT modes and spaces for street hawkers and vendors.
e) Public bicycling and bicycling schemes.
Alternate Scenario with Advancements in Vehicle Technology

COMPREHENSIVE MOBILITY PLAN FOR SOLAPUR INCEPTION REPORT
Page | 41
Technological changes and their diffusion are determined at the national level and will be provided as
an input to the city level scenarios. The urban transport scenario can be improved by the following
improvements in technology:
a) Use of Intelligent Transport Systems (ITS) to manage all modes of traffic in an efficient and
better way.
b) Improvement in vehicle and fuel technology to reduce emissions of particular vehicles, such as
conversion of all public transport to low emission fuels, for example, CNG or bio-fuels.
3.2.4.3. Task 4-3 Transport Demand Analysis of Alternative Strategies for Sustainable Urban
Transport
The above mentioned scenario‟s aim is to improve transport infrastructure and increase the cost of
using personal motorized vehicles. Two methods can be used to estimate travel demand for different
modes under alternative scenarios;
In this method, a four-step model (as discussed in Task 3-4) is repeated, taking into account changes in
parameters associated with different modes such as cost, travel time, availability, comfort and safety.
These changes result in changed impedance to different modes and consequently, changes in the
people‟s transport choices.
3.2.4.4. Task 4-4 Technology Transitions under a Low Carbon Scenario
In this scenario, the fuel mix is expected to diversify further from BAU towards bio-fuels, electricity and
natural gas. Vehicle efficiency will also improve, and thus the overall demand for fuels will be lower.
This can be affected by central/state policy interventions.
3.2.4.5. Task 4-5 CO2 Emissions and Air Quality
The model framework is same as the BAU scenario for estimating CO2 emissions and air quality.
3.2.4.6. Task 4-6 Analysis and Indicators (Comparison with Benchmarks)
The various indicators for the sustainable urban transport scenario are similar to those estimated for the
base year (Task 2-8); which would be indeed compared.
3.2.5. Task 5: Development of Urban Mobility Plan
Based on the analysis of existing urban transport, BAU scenario, preferred land use and transport
scenario vision and strategy for development a detailed urban mobility plan for the city should be
prepared.
COMPREHENSIVE MOBILITY PLAN FOR SOLAPUR INCEPTION REPORT
Page | 42
With multiple modes, multiple choices and multiple costs for transport, transport itself is not a single
element entity. Solutions for transport, hence, must have a multi-pronged approach, which are
mentioned as under.
3.2.5.1. Task 5-1 Integrated Land Use and Urban Mobility Plan
Traffic patterns and volumes have been changing in the study area during the last several years.
Continued development and redevelopment within the proposed cities including commercial, industrial,
institutional and residential, is anticipated to affect traffic patterns and volumes to an even greater
extent.
The plan will be used to guide the development and maintenance of a safe, affordable and efficient
road network to meet the projected economic development and social needs of the study cities over the
next 20 years.
The proposed plan will focus on improving public safety, serving the regional economy and social
needs while complementing ongoing land development. The plan will recommend solutions with a view
to providing an efficient, economical, socially responsible and environmentally sustainable road network
in the study cities. The solutions are to be developed to a conceptual planning level (i.e., single line with
associated functional characteristics) with preliminary cost estimates. The plan will recommend
strategies that will contribute to sustainable transportation including alternative sources of funding for
the recommended solutions.
As part of Land-use integration and Network development, we will look into the following two strategies:
Strategy 1: Transit Oriented Development (TOD) – strengthening the mass transit system with
development focused on major transport nodes.
Strategy 2: Adaptive Transit- refers to the development of transport systems that can be
adopted to the existing city structure, typically for those with low density and spread out
development.
3.2.5.2. Task 5-2 Formulation of the Public Transport Improvement Plan
Based on the projected demand by various modes of transport, it will be assessed that other forms of
transportations systems may be required for meeting the demand in the horizon years. The
configuration and combination of various modes of transport which can meet the travel demand will be
decided based on the envisaged travel pattern.
Choices on public transit options are choices about a city‟s future. Multiple choices exist in mass transit
industry. The type of public transit system chosen for proposed cities will have a big impact on

COMPREHENSIVE MOBILITY PLAN FOR SOLAPUR INCEPTION REPORT
Page | 43
Traffic Congestion
Air and noise pollution
Transport affordability
Service availability to all
Public transport plan include measures to enhance the current bus systems, additional
low/medium/high mass transit options.
The Mass Rapid Transit Systems (MRTS) available can be broadly grouped into a „rail system‟ and a
„bus system‟ classification. The distinguishing characteristic is whether the transit vehicle can use city
streets without special modifications, or whether the vehicle requires special “guideways” to operate. In
simplest terms, the vehicles in the rail system must operate on rails, or other guideways that cannot be
used by automobiles. The bus system can have its own dedicated guideway, but these vehicles are
able to leave the guideway and use city streets. This distinction is important in areas where limited
right-of-way (ROW) is available. Within these rail and bus families, different technologies have different
performance characteristics and requirements to be implemented.
The different technologies can be compared based upon their performance characteristics, and the
requirements to construct and operate.
The following characteristics are important in identifying a suitable transit system for the proposed
cities:
Carrying Capacity - In determining what technology may be appropriate for a region, the first
item to be considered is the desired carrying capacity of the system. Some technologies can
carry many more riders than others. This capacity is measured in terms of the number of
passengers per hour per direction (PPHPD) that can be carried. This is calculated by simply
multiplying vehicle capacity times the number of buses or trains operating per hour passing a
given station. For most rail systems, the carrying capacity can be increased by adding
additional cars to the train, without requiring additional operators or improvements in the
signaling system. Buses offer some flexibility to use larger equipment, but significant
increases in carrying capacity will require more vehicles and operators, which increases
operating costs.
Geometric Constraints - Geometric (physical) constraints required of the technology include
estimated turning radius, space/right-of-way availability, profile grade, guideway length, and
station spacing.

COMPREHENSIVE MOBILITY PLAN FOR SOLAPUR INCEPTION REPORT
Page | 44
Capital and Operating Costs - Every project presents an unique set of costs including initial
capital investments to build and equip the system, periodic capital expenditures during its life
to renew certain project elements, and ongoing costs to operate the service and maintain all of
the system elements in good working order.
Several Mass Transit options are available that include both the rail system and the bus system. The
transit systems considered here include:
Heavy Rail Transit (HRT) or Subway or Metro
Monorail (MRL)
Light Rail Transit (LRT)
Commuter Rail (CR)
Bus Rapid Transit (BRT)
Potential to develop a Trunk and Feeder PT Network
Selection of a particular type of Mass Transit System for the Town will depend on the characteristics of
the options discussed above. The traffic projections from transportation model will give a picture about
the future demand. It will also identify the critical corridors where a Mass Rapid Transit System is
required. A detailed reconnaissance of these corridors will determine the practical feasibility of
introducing the type of transit system considered.
Availability of funding will also play a major role in starting up a particular type of transit operation. As
Consultants, we make a thorough study of all the factors, and based on that, will recommend a
particular Mass Rapid System for the city.
3.2.5.3. Task 5-3 Preparation of Road Network Development Plan
It is important to list out the road projects which are to be developed, strengthened, upgraded and inter-
connected including hierarchical road network, arterial road construction/widening projects, secondary
road construction/widening projects, intersection improvement projects, flyover projects, railway over
bridge or under pass projects. The hierarchical road network shall be based on the travel demand. The
strategies shall reflect induced demand effects to estimate the overall benefit of any new road capacity.
3.2.5.4. Task 5-4 Preparation of NMT Facility Improvement Plan
It is important that initiatives are taken to not only preserve but to enhance the share and safety of the
NMT. The NMT strategies would focus on the following:
Maintain path surfaces. Establish a system to quickly identify and correct problems.
COMPREHENSIVE MOBILITY PLAN FOR SOLAPUR INCEPTION REPORT
Page | 45
Establish connected walking networks.
Provide adequate walkway widths. Prevent vendors, pavement dwellers, vehicle parking and
other uses from blocking walkways.
Create bike lanes and bicycle boulevards (streets where bicycles have priority and motorists
must drive at low speeds) where appropriate.
Correct roadway hazards to non-motorized transport.
Use street furniture (e.g. benches) and pedestrian friendly design features
Provide bicycle safety education, law enforcement and encouragement.
Integrate cycling with transit.
Provide bicycle parking/rickshaw stands.
Address security concerns of pedestrians and cyclists
Address the tourism needs of each city with respect to its attraction as a tourist centre
Cycle Stands and Rickshaws Stands
Develop /encourage bike rentals/sharing
3.2.5.5. Task 5-5 Freight Movement Plan
The industrial growth of the study area would demand a suitable freight management strategy. Various
strategies of increasing the efficiency of freight and commercial transport include:
Segregation of long distance commercial vehicles from city roads
Decongesting the market areas
Route management of cargo movement
Truck/Freight terminals
Use of small and medium size vehicles with modern emission controls in the central city areas
Restricted movement of commercial vehicles in central business districts and other mobility
corridors.
3.2.5.6. Task 5-6 Mobility Management Measures
In CMP, traffic management plans cover parking management plans, traffic control measures, inter
modal facilities, demand management measures, traffic safety plan and ITS.

COMPREHENSIVE MOBILITY PLAN FOR SOLAPUR INCEPTION REPORT
Page | 46
3.2.5.7. Task 5-7 Development of Fiscal Measures
Fiscal Measures shall be considered to achieve the balanced modal split, and to secure the budget
necessary to implement urban transport projects. As fiscal measures usually correspond to institutional
and regulatory measures, the following aspects may have to be examined;
Fare policy for public transportation, intermediate public transport and parking;
Subsidy policy for public transport operators and intermediate transport operators;
Taxation on private vehicles and public transport vehicles;
Permits and regularization of intermediate public transport;
Potential for road congestion charging;
Influence private vehicle usage through parking and disincentavize free parking with private
developments;
Setting up of Unified Metropolitan Transport Authority to coordinate urban transport and related
issues in million plus cities;
Creating Special Purpose Vehicles particularly for Mass Transit System.
3.2.5.8. Task 5-8 Mobility Improvement Measures and NUTP Objectives
The land use and transport measures proposed in the CMP shall improve the mobility in the
metropolitan area and cover the critical issues addressed in the NUTP.
3.2.6. Task 6: Preparation of the Implementation Program
This task involves the preparation of a comprehensive implementation plan for the proposed measures.
The plan will include details on timeline for implementation and cost estimation. An assessment of
potential benefits arising from each proposed measure will be detailed out. In addition, agencies
responsible for each project will be identified as part of the implementation plan.
3.2.6.1. Task 6-1 Preparation of Implementation Programs
The above mentioned tasks involve the development of the various urban mobility measures as
discussed earlier. The necessary interventions for these measures include a set of actionable projects
to be implemented in the city and prioritized based on a linear timeframe. CMP‟s shall identify strategies
based on the following timeframe categories;
Immediate priority/actions (0 to 2 years)
Short Term (2-5 years)
Medium Term (5-10 years)

COMPREHENSIVE MOBILITY PLAN FOR SOLAPUR INCEPTION REPORT
Page | 47
Long Term (more than 10 years)
All the projects are presented to the city stakeholders and the implementing agency to identify the
priority of the projects.
3.2.6.2. Task 6-2 Identification and Prioritization of Projects
The following criteria will be used for prioritizing and phasing of projects:
Urgency of Implementation
Capital Investment
Ease of Implementation
Resource Availability
Environmental Impact Assessment
The phasing of projects will be done according to the long-Term, medium-term , short-term and
Immediate requirements.
Projects, which require minimal capital and resource allocation and are expected to provide instant
benefit to the traffic problems are given high priority and will fall under Immediate and Short-term
Projects. On the other hand, projects that require high amounts of capital inflow, provide longer-term
rather than immediate benefits and involve complex issues like land availability problems may be
identified for medium and long-term implementation.
3.2.6.3. Task 6-3 Funding of Projects
As the CMP is a long term vision for the city authority, the overall ownership of the CMP lies with the
ULB‟s. Given the ULB‟s dependence on funding, a city‟s CMP would make a resource assessment for
all projects listed in the CMP and would suggest the city authority, city-specific and project specific
indicative source of financing for the project.
3.2.6.4. Task 6-4 Monitoring of CMP Implementation
As per the MoUD advisory, CMP is the basis for approving projects, plans and various regulatory
measures within the city related to transport, and it is therefore important to monitor and measure the
impact of interventions taken as an outcome of CMP.

COMPREHENSIVE MOBILITY PLAN FOR SOLAPUR INCEPTION REPORT
Page | 48
Chapter 4. Data Collection Plan
Keeping in view of the Solapur city, which requires an immense amount of data specifically designed
and collected exclusively for it. The data shall be collected from secondary sources and various field
studies to elicit the traffic and transportation characteristics of Solapur City.
4.1. Collection and Review of Secondary Data
Information from secondary sources and other published reports are currently being reviewed. The
detailed information relating to city‟s physical, demographic and socio-economic profile; its transport
system characteristics; traffic and travel demand characteristics and trends; organizational set-up in the
transport sector, outlays and investment priorities in the city‟s transport system; etc. shall be compiled.
4.2. Primary Surveys
It is planned to conduct Traffic and Transportation Study (Comprehensive Mobility Plan (CMP)) in detail
for Solapur that will guide the urban development of the city for the future and to undertake identified
transport infrastructure projects to ease the existing congestion levels. It is therefore, necessary to have
an estimate of existing traffic condition and travel pattern through various traffic surveys obtained from
suitable selected traffic survey location in the study area. The following surveys would be taken up as
part of the study;
1. Classified Volume Count Surveys and Road Side Interview Surveys at Cordon Locations
2. Classified Volume Count Surveys at Screenline Locations
3. Road side interview surveys at outer cordon locations
4. Road Network Inventory Surveys
5. Turning Movement counts at Intersections
6. Bus stop waiting, boarding-alighting survey
7. Bus/Rail terminal passenger count survey (Boarding and Alighting)
8. Bus/Rail OD Survey
9. Pedestrian Volume Count at Junctions and Midblock
10. Speed and Delay at Peak hour and Off Peak Hour
11. Household Interview Survey
12. Vehicle Operator Survey (Taxi, Goods, Auto)
13. NMT opinion Survey
14. Parking Survey (on street & off street)

COMPREHENSIVE MOBILITY PLAN FOR SOLAPUR INCEPTION REPORT
Page | 49
15. Mode wise vehicle occupancy surveys.
16. Light meter surveys
17. Environmental/Energy Surveys
Primary Surveys would be carried out by UMTC. An illustrative list of surveys that would be conducted
by UMTC is as enlisted in this section. The survey formats are attached as Annexure 1.
4.2.1. Classified Volume Count Surveys at Screen-line Locations
4.2.1.1. Objective of the Survey
The main objective of the survey is to estimate the classified vehicular volumes crossing the screen
lines (imaginary lines drawn along water bodies/ railway lines etc) to be used for validation of the
transport model.
4.2.1.2. Scope of Survey
Defining the screen lines and designating the traffic count stations
Counting of vehicles classified by the type of vehicle crossing the screen lines for 16 hours
during the peak and the period preceding and succeeding the peak duration.
4.2.1.3. Conduct of the Survey
Manual traffic counts will be carried out at all locations where the road network cuts across the screen
lines. Map indicating screen line survey location is given below. The city has well defined railway track
(North – South) which can be used for model validation. Also an additional screen line (water body in
East – West direction) will be used for making model more robust. Traffic counts will be carried out on a
typical working day for 16 hours covering both morning and evening peak periods. At each identified
station, both directional counts will be carried out by vehicle type. i.e. cars, jeeps, vans, buses, trucks,
MAVs, LCV‟s tractors, motorized two wheelers and three wheelers, and slow moving vehicles. Screen
line locations identified for Solapur CMP is shown in Figure 4-1.
1. SC 1 – Kumthe Aherwadi Railway Crossing
2. SC 2 – Hatture Vastri Railway Crossing
3. SC 3 – Model Colony/Girija Colony Managal Karyalay Point
4. SC 4 – Asara Bridge, Konark Nagar Crossing
5. SC 5 – Solapur Mangalore Highway/ Patrakar Bhawan
6. SC 6 – Navi Peth Crossing
7. SC 7 – Modi Railway Crossing
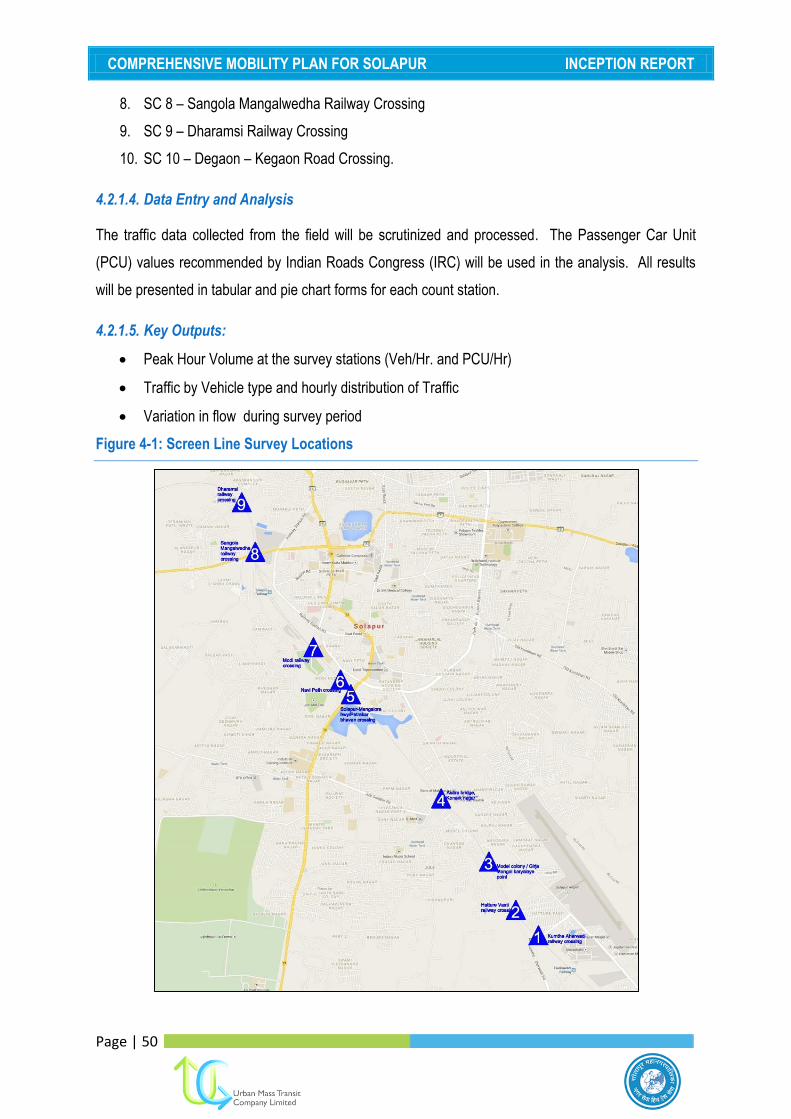
COMPREHENSIVE MOBILITY PLAN FOR SOLAPUR INCEPTION REPORT
Page | 50
8. SC 8 – Sangola Mangalwedha Railway Crossing
9. SC 9 – Dharamsi Railway Crossing
10. SC 10 – Degaon – Kegaon Road Crossing.
4.2.1.4. Data Entry and Analysis
The traffic data collected from the field will be scrutinized and processed. The Passenger Car Unit
(PCU) values recommended by Indian Roads Congress (IRC) will be used in the analysis. All results
will be presented in tabular and pie chart forms for each count station.
4.2.1.5. Key Outputs:
Peak Hour Volume at the survey stations (Veh/Hr. and PCU/Hr)
Traffic by Vehicle type and hourly distribution of Traffic
Variation in flow during survey period
Figure 4-1: Screen Line Survey Locations
COMPREHENSIVE MOBILITY PLAN FOR SOLAPUR INCEPTION REPORT
Page | 51
4.2.2. Road side interview surveys at outer cordon locations
4.2.2.1. Survey Objectives
The main objective of the survey is to derive the passenger and freight travel pattern by road. The
survey shall be conducted at the cordon points selected for the study area. These surveys will be aimed
at analyzing the traffic movement within the study area and also the interaction between outer and
within the study area (floating population). The data shall be used to validate the urban transport
demand model and to estimate the significance of bypass/ring roads for the study area.
Mode wise trip Characteristics such as origin, destination, trip purpose, trip frequency, etc shall be
elicited.
4.2.2.2. Scope of the Survey
The scope of the survey includes conducting interviews at selected locations in the study area along
the cordons identified in the study area. At all the locations, survey shall be carried out for 24 hours at
locations on the outer cordon and for a period of 16 hours at remaining locations on the inner cordon.
4.2.2.3. Conduct of the Survey
Interviews will be carried out on a sample basis on a typical working day (to cover regular trips) by
stopping the vehicles with the help of police. The objective will be to achieve minimum sample
coverage of 10 percent spread across the time of the day and type of vehicles proportionately.
Classified volume counts shall be carried out along with the interviews in order to calculate expansion
factors. The list of outer cordon survey location is presented below. The locations area also indicated in
Figure 4-2.
1. OC 1- Mumbai Highway
2. OC 2 – Solapur Akkalkot Road
3. OC 3 – Solapur Mangalore Highway
4. OC 4 – Solapur Mangalvedha Road
5. OC 5 – Near Singhad College Road
6. OC 6 – Solapur Barshi Road
7. OC 7 – Solapur Beedh Road
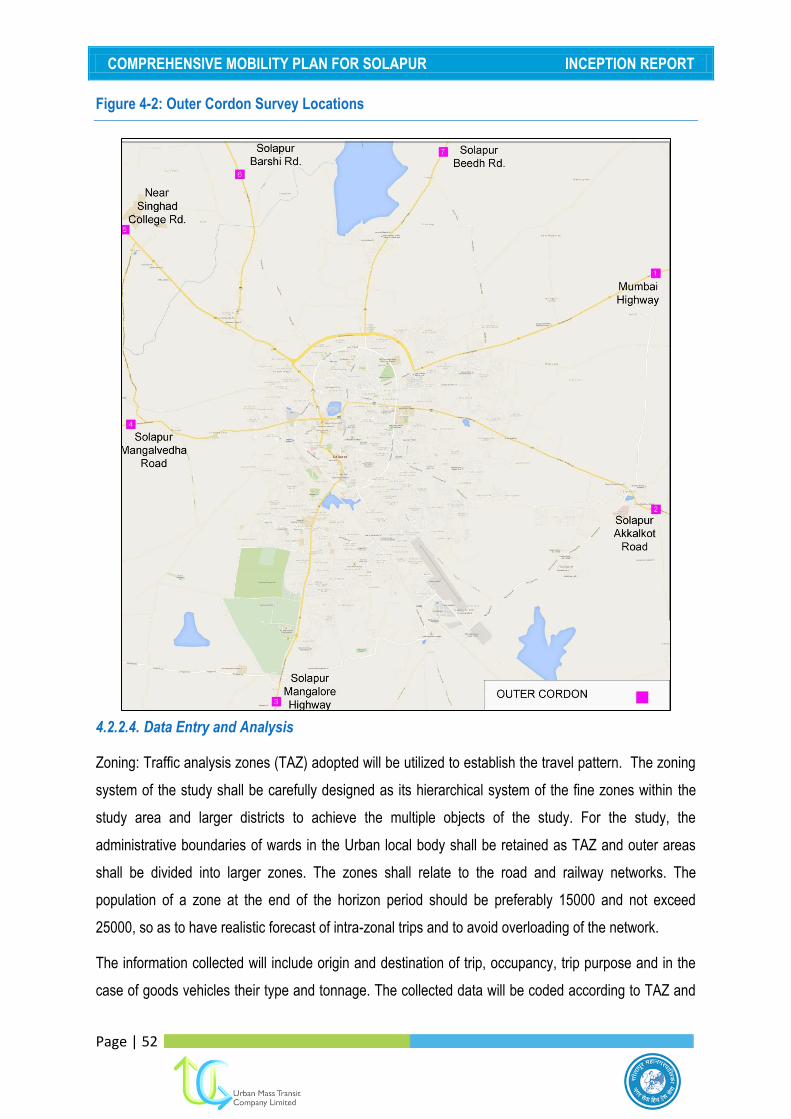
COMPREHENSIVE MOBILITY PLAN FOR SOLAPUR INCEPTION REPORT
Page | 52
Figure 4-2: Outer Cordon Survey Locations
4.2.2.4. Data Entry and Analysis
Zoning: Traffic analysis zones (TAZ) adopted will be utilized to establish the travel pattern. The zoning
system of the study shall be carefully designed as its hierarchical system of the fine zones within the
study area and larger districts to achieve the multiple objects of the study. For the study, the
administrative boundaries of wards in the Urban local body shall be retained as TAZ and outer areas
shall be divided into larger zones. The zones shall relate to the road and railway networks. The
population of a zone at the end of the horizon period should be preferably 15000 and not exceed
25000, so as to have realistic forecast of intra-zonal trips and to avoid overloading of the network.
The information collected will include origin and destination of trip, occupancy, trip purpose and in the
case of goods vehicles their type and tonnage. The collected data will be coded according to TAZ and

COMPREHENSIVE MOBILITY PLAN FOR SOLAPUR INCEPTION REPORT
Page | 53
processed to eliminate all illogical data and entry errors. The data will be processed and expanded to
total traffic using the expansion factors for each vehicle type. Desire line diagram will be prepared for
passenger and goods vehicles separately, from which the project influence area will be identified.
Location-wise and mode-wise OD matrices for peak period shall be merged to develop a single matrix
for the study area using suitable computer programs and the merged OD shall be used I developing the
urban transport model.
4.2.2.5. Key Outputs
Mode-wise OD matrices
Trip frequency
Trip purpose
Average Occupancy
4.2.3. Road Network Inventory Surveys
4.2.3.1. Objective of the Survey
Road network inventory will be aimed at developing and updating the network database with the
existing features of roadway sections. Details like link lengths, cross-sectional details, type and general
condition of the surface, pavement width, median type and width, on-street parking provision, traffic
control devices, etc., will be collected.
4.2.3.2. Scope of the Survey:
Validating the existing road network data available for the region
Collecting the road network details for those stretches whose details are not available
4.2.3.3. Conduct of the Survey
A full-scale inventory surveys will be undertaken to create a road network database. Inventories of the
following facilities will be undertaken as part of the task.
Road Network
Effective Road width
Quality of riding surface
Adjoining Land use and available Access control
Intersection Facilities
Pedestrian Facilities
Parking Facilities

COMPREHENSIVE MOBILITY PLAN FOR SOLAPUR INCEPTION REPORT
Page | 54
Traffic Control/management Measures like one -ways.
A team of two enumerators each shall traverse the road network and the datasheet to record the road
network details listed above. The network selected for road network inventory is shown in Figure 4.2.
4.2.3.4. Data Entry and Analysis
The road network attribute data collected from the field will be used to develop transport network
database. The database will be used in developing the base year network facilitating both qualitative
and quantitative evaluation of the present sufficiency of road networks vis-à-vis existing standards and
usage pattern.
4.2.3.5. Key Outputs
Transport Network database of study area.
Figure 4-3: Road Network Inventory Surveys
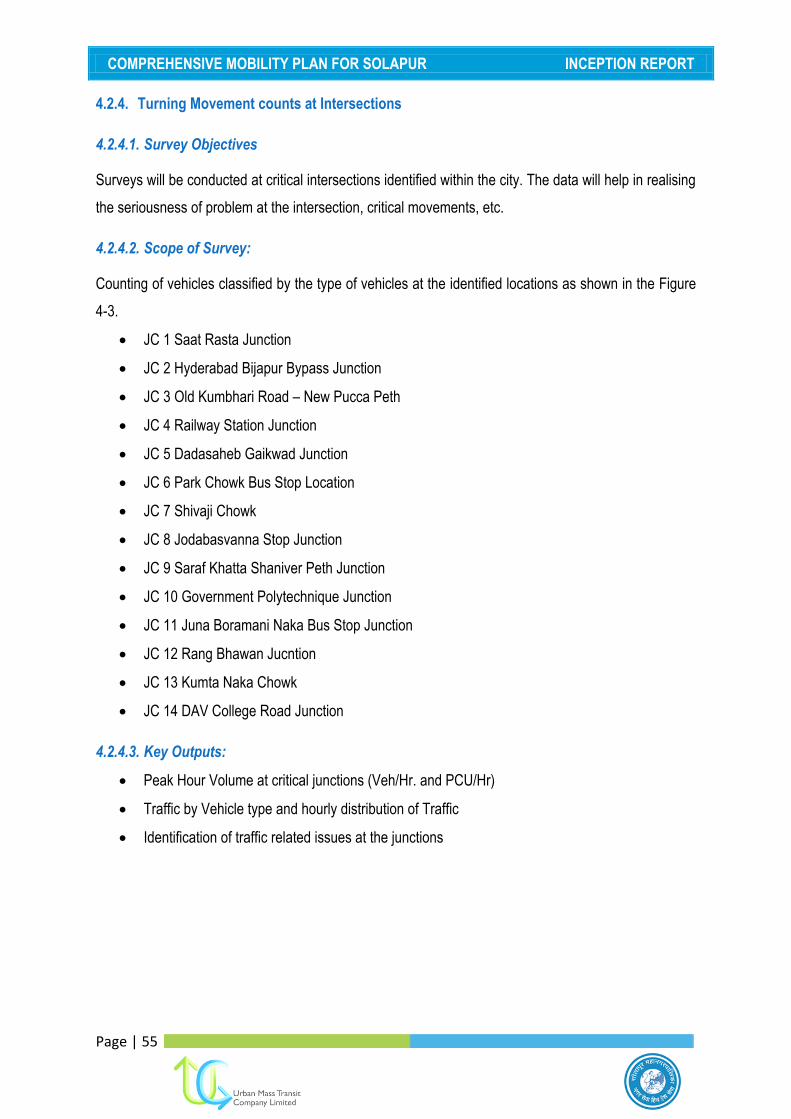
COMPREHENSIVE MOBILITY PLAN FOR SOLAPUR INCEPTION REPORT
Page | 55
4.2.4. Turning Movement counts at Intersections
4.2.4.1. Survey Objectives
Surveys will be conducted at critical intersections identified within the city. The data will help in realising
the seriousness of problem at the intersection, critical movements, etc.
4.2.4.2. Scope of Survey:
Counting of vehicles classified by the type of vehicles at the identified locations as shown in the Figure
4-3.
JC 1 Saat Rasta Junction
JC 2 Hyderabad Bijapur Bypass Junction
JC 3 Old Kumbhari Road – New Pucca Peth
JC 4 Railway Station Junction
JC 5 Dadasaheb Gaikwad Junction
JC 6 Park Chowk Bus Stop Location
JC 7 Shivaji Chowk
JC 8 Jodabasvanna Stop Junction
JC 9 Saraf Khatta Shaniver Peth Junction
JC 10 Government Polytechnique Junction
JC 11 Juna Boramani Naka Bus Stop Junction
JC 12 Rang Bhawan Jucntion
JC 13 Kumta Naka Chowk
JC 14 DAV College Road Junction
4.2.4.3. Key Outputs:
Peak Hour Volume at critical junctions (Veh/Hr. and PCU/Hr)
Traffic by Vehicle type and hourly distribution of Traffic
Identification of traffic related issues at the junctions
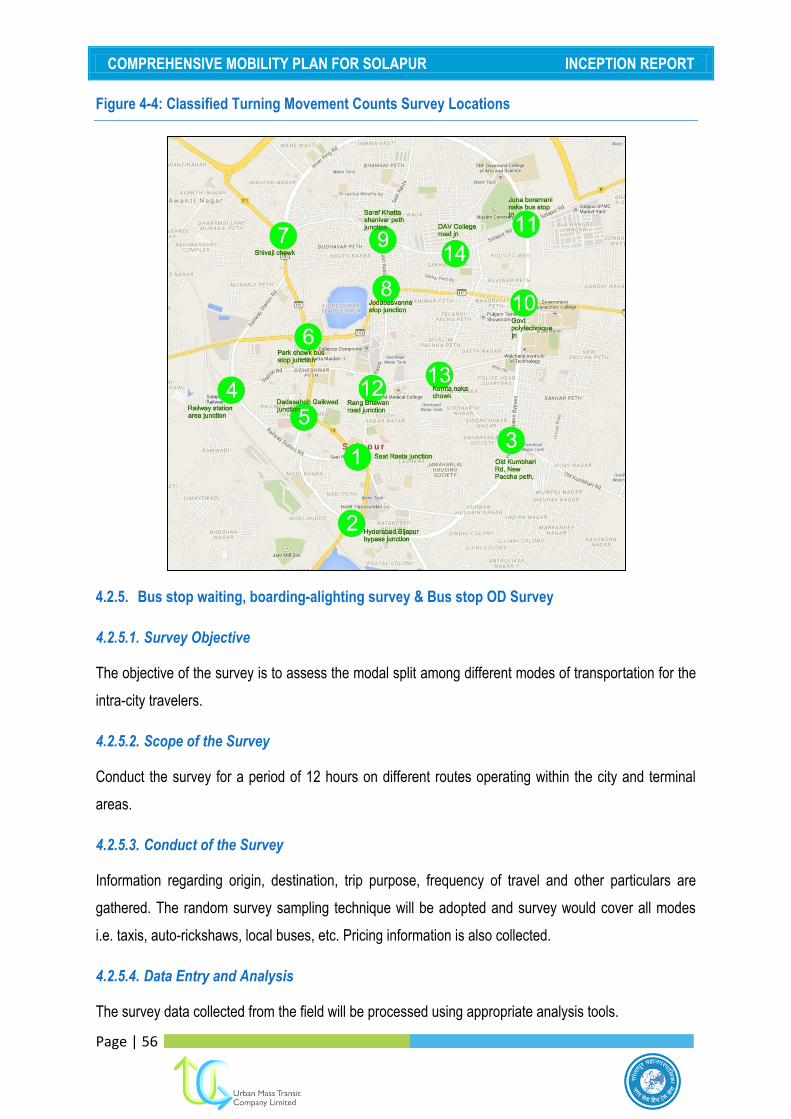
COMPREHENSIVE MOBILITY PLAN FOR SOLAPUR INCEPTION REPORT
Page | 56
Figure 4-4: Classified Turning Movement Counts Survey Locations
4.2.5. Bus stop waiting, boarding-alighting survey & Bus stop OD Survey
4.2.5.1. Survey Objective
The objective of the survey is to assess the modal split among different modes of transportation for the
intra-city travelers.
4.2.5.2. Scope of the Survey
Conduct the survey for a period of 12 hours on different routes operating within the city and terminal
areas.
4.2.5.3. Conduct of the Survey
Information regarding origin, destination, trip purpose, frequency of travel and other particulars are
gathered. The random survey sampling technique will be adopted and survey would cover all modes
i.e. taxis, auto-rickshaws, local buses, etc. Pricing information is also collected.
4.2.5.4. Data Entry and Analysis
The survey data collected from the field will be processed using appropriate analysis tools.

COMPREHENSIVE MOBILITY PLAN FOR SOLAPUR INCEPTION REPORT
Page | 57
4.2.5.5. Key Outputs:
Mode Choice Split
Trip Characteristics of Mass Transport User
4.2.6. Bus/Rail OD Survey
4.2.6.1. Survey Objective
The principal objective of the study is to assess the magnitude of the movements of passengers plying
between study area and the rest of the state and country.
4.2.6.2. Scope of the Survey
The survey will be planned for a period of 12 hours at intercity bus stations, railway stations, and at
outer cordon points.
4.2.6.3. Conduct of the Survey
Questionnaire shall be designed to broadly collect the following information.
Trip Characteristics – origin, destination trip purpose, access mode, cost, travel time to access the
terminal etc.
Enumerators will be stationed at terminals i.e. railway station, inter-city bus stations and private bus
stands to interview incoming and outgoing passengers on a sample basis. The details pertaining to the
trip information, further journey details, socio-economic data etc. will be collected during the interview.
Simultaneously, counts will also be carried throughout the survey duration to determine the sample size
interviewed. The concerned Railway authorities, Airport officials, private bus operators and other public
sector transport operators shall be contacted to get information on daily travel to expand the sample
data.
4.2.6.4. Key Outputs:
External O-D matrix by mode and purpose
Terminal Access mode choices/preferences
4.2.7. Pedestrian Volume Count at Junctions and Midblock
4.2.7.1. Survey Objective

COMPREHENSIVE MOBILITY PLAN FOR SOLAPUR INCEPTION REPORT
Page | 58
The objective of the survey is to identify critical locations for
pedestrian/Non-motorized vehicles movement.
4.2.7.2. Scope of the Survey
Pedestrian count surveys shall be proposed at critical locations
where heavy pedestrian movement (along and across the roads
and at intersections) is observed. The survey shall also cover
locations abutting major traffic attraction zones like malls and
major work centers.
4.2.7.3. Conduct of the Survey
Pedestrian counts will be carried out at intersection crosswalks, midblock crossings, or along sidewalks
for a period of eight hours covering peak periods. The survey shall be carried out by direction of each
pedestrian crossing the roadway and walking across the sidewalks. Identified locations for the
Pedestrian Surveys are as follows;
PC 1 Saat Rasta Junction
PC 2 Hyderabad Bijapur Bypass Junction
PC 3 Old Kumbhari Road – New Pucca Peth
PC 4 Railway Station Junction
PC 5 Dadasaheb Gaikwad Junction
PC 6 Park Chowk Bus Stop Location
PC 7 Shivaji Chowk
PC 8 Jodabasvanna Stop Junction
PC 9 Saraf Khatta Shaniver Peth Junction
PC 10 Government Polytechnique Junction
PC 11 Juna Boramani Naka Bus Stop Junction
PC 12 Rang Bhawan Jucntion
PC 13 Kumta Naka Chowk
PC 14 DAV College Road Junction
4.2.7.4. Data Analysis
Data from the Pedestrian counts conducted at several
locations on the selected stretches where pedestrians are
Restaurant
Commercial
Complex
Bank
Residential
Buildings
183
205
125
103
214 114
188
491
Restaurant
Commercial
Complex
Bank
Residential
Buildings
183
205
125
103
214 114
188
491

COMPREHENSIVE MOBILITY PLAN FOR SOLAPUR INCEPTION REPORT
Page | 59
exposed to risk of accidents will be determined. The stretches from the analysis where the movement of
the pedestrians is high will be marked and presented in a map. This will enable in identification of the
High Risk Pedestrian Zones on the corridor roads and will enable in improvement options for pedestrian
facilities
4.2.7.5. Key outputs:
Identification of critical locations for pedestrian/Non-motorized vehicles movement
Pedestrian Risk Zones
Finalization of potential sites for safe
4.2.8. Speed and Delay at Peak hour and Off- Peak Hour
4.2.8.1. Survey Objectives
The principle objective of the survey is to find out the running speed, journey speed and types of delay
such as stopped delay and operational delay to evaluate the level of service or quality of traffic flow of a
road or entire road network system. In relation to the model, the purpose of this survey is dual –
Journey speeds are used for validation of the urban transport model and to develop speed- flow
functions for different categories of road network in the study area.
4.2.8.2. Scope of Work
Carryout the surveys during peak and off-peak periods in both peak and off peak direction.
Collection of delay information on different road stretches and at intersections in the study area
Speed studies will be conducted on all critical corridors, identified in consultation with the Client. Any
additional links, which Consultants feel necessary for validation of the model, will be included.
4.2.8.3. Conduct of the Survey
There are several methods available for conducting this type of survey. Few of the methods are;
moving observer method, registration number plate method and Elevated observer method. Floating
car method is widely used in India. The enumerators shall note down the distance and time of travel
between two junctions and stopping time of the vehicle along the road stretches, at intersections and
the reasons for the same.
4.2.8.4. Key outputs:
Travel and journey speeds along the corridors
Delays along each of the selected corridors by type/reason
Intersection delays

COMPREHENSIVE MOBILITY PLAN FOR SOLAPUR INCEPTION REPORT
Page | 60
4.2.9. Household Interview Survey
4.2.9.1. Objective of the Survey
To establish and travel characteristics of the residents and the general socio-economic characteristics
of the household influencing trip making. The data shall be used to develop mode-wise OD matrices to
develop base year urban transport model for the study cities.
4.2.9.2. Scope of Work
The scope of the surveys includes:
Carry out house hold surveys covering an average sample size of 2% of the population spread
across the city.
Collection of data on socio-economic characteristics, household members and their travel
diary.
4.2.9.3. Conduct of the Survey
Analysis of recent electoral rolls / census details may provide a
basis of selection of the sample. Stratified random sampling
technique representing the entire population will be considered
for selecting the samples. A statistically valid basis for
expansion of the sample adequate to represent the total
population of the study area and the geographical distribution of
trips shall be adopted.
The survey questionnaire comprises of three sections, a) Socio-economic datasheet, b) Household
member characteristic datasheet, and c) the travel diary of each individual member of the household.
The travel diary section requests information for all trips made by each person in the household for the
previous day. This information includes the time of the trip, the trip purpose, the address of the trip
starting, ending place and the mode of travel. The respondents will also be given a set of stated
preference questions to provide additional detail about their mode choice preferences across a range of
travel conditions. A complete household survey script will be developed for client review Approved
script will be used to develop the survey instruments. While the interviewers will be trained in the details
of how to collect the survey data, the forms will be designed to be self-explanatory and to minimize the
chances of miscoding or omitting data.
COMPREHENSIVE MOBILITY PLAN FOR SOLAPUR INCEPTION REPORT
Page | 61
4.2.9.4. Ethical Issues
Utmost care will be taken during the field work to ensure total confidentiality of the responses. Field
operations will be carried out as per the accepted ethical standards and human dignity. The
respondents will be explained about the purpose of the study and interview before interviewing them.
4.2.9.5. Data Analysis
The household travel survey sample data thus collected will be expanded to represent the entire
population. A bi-proportional fitting method will be used to correct the socio-de9mographic
characteristics of the sample to the known distributions in the latest Census. Corrections for non-
response will be developed based on the data on the number of contacts needed to generate a
household response. Imputation methods that preserve the distribution of missing data elements will be
used wherever appropriate to fill in important pieces of missing information in the survey responses.
The household survey will be used to estimate mode splits and mode choice model parameters. The
trip diary information will provide descriptive information about current mode choices. Combined with
network information about available mode options, this information can also be used as “revealed
preference” data to estimate parameters of a mode choice model.
4.2.9.6. Key Outputs:
The outputs from the survey include
Average household trip rate for the study area.
Origin/destination trip matrix by mode
Mode share
Trip length distributions by mode
4.2.10. Vehicle Operator Survey (Taxi, Goods, Auto)
4.2.10.1. Survey Objective
Primary objective of the freight surveys is to establish the existing commercial vehicle quantum and
pattern in the study area.
4.2.10.2. Scope of Survey
Collection of regional freight movement data, their origins and destinations within and outside the study
area.

COMPREHENSIVE MOBILITY PLAN FOR SOLAPUR INCEPTION REPORT
Page | 62
Collect data on commodity-wise quantity of freight movement within the study area, their frequent
origins and destinations.
Collect the data on operations of industries and firms which transport goods within and outside the
study area producing the demand for goods movement.
Besides trucks, a survey of operators of taxis, auto-rickshaws will be conducted to determine the
operating costs, routes of operation etc.
4.2.10.3. Conduct of the Survey
Two types of field surveys will be conducted to obtain data about the goods movement:
The cordon line / screenline Roadside interview surveys will be carried out.
The survey of different categories of trucking companies operating in the study area and details
on companies generating bulk goods will be conducted. Data collection in the cordon survey is
limited to transport characteristics of the goods vehicle such as origin and destination, type of
commodity, quantity and frequency of travel. The survey of industries and trucking companies
is obviously a more detailed approach of collecting the information at the level of goods
demand generation process.
4.2.10.4. Key Outputs
Commercial vehicle O-D Matrix
Commercial Vehicle Operating Cost
Truck trip rates
4.2.11. Parking Survey (on street & off street)
4.2.11.1. Survey Objective
The principal objective of the study is to assess the demand
for parking, characteristics of the parked vehicles, present
parking supply, etc in the study area.
4.2.11.2. Scope of the Survey
Conduct the survey for a period of 12 hours on all major corridors of work centers, business centers,
shopping complexes and tourist places. The data shall be used to estimate the on-street parking
demand, supply and to identify suitable short and medium term measures to handle parking demand.

COMPREHENSIVE MOBILITY PLAN FOR SOLAPUR INCEPTION REPORT
Page | 63
4.2.11.3. Conduct of the Survey
Parking surveys will be carried out on all critical area. Enumerators are asked to note the vehicle type
and registration number of parked vehicles every half an hour. Information will also be collected on the
on associated parking fees and an inventory of the parking area also shall be carried out.
On street Parking Survey Locations:
During reconnaissance survey, central railway station and bus state transport terminal found as an
important locations for off street parking surveys. However, the mentioned on street and off street
locations will be finalized after discussion with SMC
4.2.11.4. Data Entry and Analysis
The parking data collected from the field will be processed using the appropriate analysis tools. The
results will be presented in tabular and pie chart forms for each location.
4.2.11.5. Key Outputs:
Peak Parking Demand Period and supply by Location
Parking Demand by Vehicle Type
Parking Duration Information
4.2.12. Environmental/Energy Surveys
In this phase, the available data on general and environmental profile will be collected from various
secondary sources. Information such as population, physical and climatic features, ambient
environmental quality, details of water bodies, ecological features, etc of the town comprising the area
coming under the local planning area, will be obtained.
The data will be collected from various government agencies such as the Municipal Corporation,
Karnataka Pollution Control Board, India Meteorological Department (IMD and published research
papers, past study reports etc.
In addition to the above secondary data, field reconnaissance surveys and discussions will also be held
with the stake holder agencies and institutions to understand the impacts of traffic and transportation
trends on the environmental quality of the town.
Collation and analysis of the above information will provide the environmental profile of the town and its
linkages with traffic and transportation.

COMPREHENSIVE MOBILITY PLAN FOR SOLAPUR INCEPTION REPORT
Page | 64
4.3. Way forward
Based on the information/data collected from the secondary and primary sources, a basic analysis of
the transport and traffic situation would be carried out, identifying characteristics and issues of the city,
which would include analysis of existing urban transport situation and traffic characteristics.
Based on the existing situation analysis of traffic and transportation, a travel demand model will be
developed to project future travel demand in order to estimate the likely consequences of several
alternatives taking into consideration the “Business as Usual”. Following the do nothing scenario the
travel demand forecasts will be carried out for different horizon years. The forecast will be for different
modes and in different alternate scenarios and for different time periods.
Based on the travel demand of the horizon years, a mobility plan for the city would be prepared with
Short Term, Medium Term and Long Term Strategies.

COMPREHENSIVE MOBILITY PLAN FOR SOLAPUR INCEPTION REPORT
Page | 65
Chapter 5. Work Plan & Deliverables
5.1. Work Plan, Timeline and Deliverables
UMTC will stay thoroughly engaged with the client at all points of the period of performance. The study
will take 8 months to complete. The work plan for the study is presented in the Annexure 2. The
deliverables are shown in Table 5-1.
Figure 5-1: Study Deliverables
Submission Deliverable Time
Inception Report & Detailed Work Plan M+1.5
Interim Report M+4
Draft Final Report M+6.5
Final Report M+8
*M – Date of signing the Agreement
5.2. Quality Assurance Plan
UMTC will check the consistency of the data collected and will carry out the analysis using the best
practices available. The deliverables will be produced in line with the Quality plan. The deliverables
shall include the following reports;
Inception Report & Detailed Work Plan
Interim report
Draft Final Report
Final Report

COMPREHENSIVE MOBILITY PLAN FOR SOLAPUR INCEPTION REPORT
Page | 1
Annexure 1
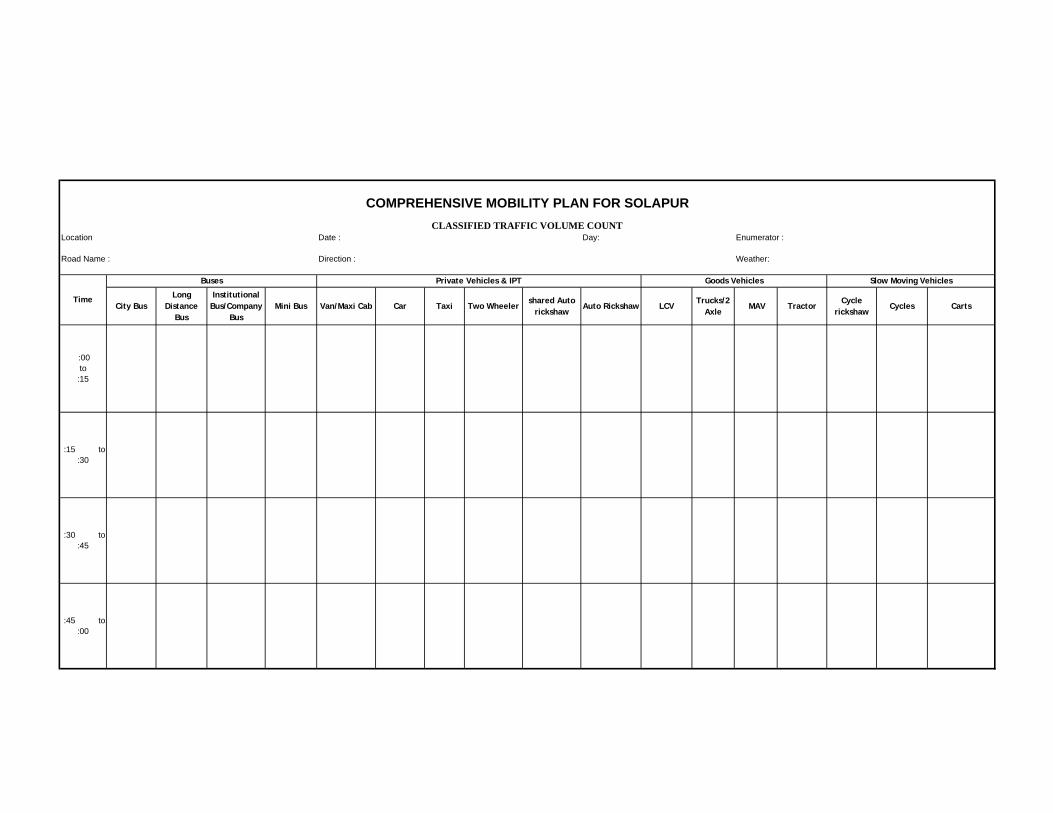
Location Date : Day: Enumerator :
Road Name : Direction : Weather:
City BusLong
Distance Bus
Institutional Bus/Company
BusMini Bus Van/Maxi Cab Car Taxi Two Wheeler
shared Auto rickshaw
Auto Rickshaw LCVTrucks/2
Axle MAV Tractor
Cycle rickshaw
Cycles Carts
COMPREHENSIVE MOBILITY PLAN FOR SOLAPUR
Slow Moving Vehicles
Time
Private Vehicles & IPT Goods VehiclesBuses
:00 to
:15
:15 to :30
:30 to :45
:45 to :00
CLASSIFIED TRAFFIC VOLUME COUNT

COMPREHENSIVE MOBILITY PLAN FOR SOLAPUR
TURNING VOLUME COUNT SURVEY
Junction Name : Date :
Enumerator:
Road name : Direction :
Weather :
Time
Buses Private Vehicles & IPT Goods Vehicles
Slow moving vehicles
City Bus
Long Distance
Bus
Institutional/Company
Bus
Mini bus
Van/Maxi Cab Car/jeep Two
wheeler
Shared Auto
rickshaw
Auto ricksha
w Truck
/2 Axle
3 Axle/MAV
LCV Tractor
Cycle Rickshaw Cycles Cart
:00 to :15
:15 to :30
:30 to :45
:45 to :00

Road name Date
Parking starting From: Enumerator
Parking ending at: Type of parking: Parallel/Angular/Perpendicular
Authorised/Unauthorised
Paid / FreeTime Time Time
Code Registration Number Code Registration Number Code Registration Number
No. Of Cycles/cycle rickshaws :
No. Of Cycles/cycle rickshaws :
No. Of Cycles/cycle rickshaws :
No. Of Carts : No. Of Carts : No. Of Carts :
Codes
CB - Car Big V- Van/Maxicab/Minibus T- Trucks
CS - Car Small B- Bus M - MAV
TW - Two Wheeler A - Auto Rickshaw L- LCV
Parking Duration Survey - On Street Parking
Parking type: Length Of Parking: Width Of Parking:
COMPREHENSIVE MOBILITY PLAN FOR SOLAPUR

Road Name : Date:
No of Lanes : Divided/Undivided: Oneway/Twoway: Day :
Direction: Time :
Trip No:
Sl. No. Time of survey From Node To Node Distance (km) Start Time in
minutesEnd Time in
minutes Time Delay (Sec) Purpose of delay
Purpose of delay: 1. Signal 2. Police control 3. Junction 4. Animal cross 5. Pedestrian cross 6. Traffic 7. Others
COMPREHENSIVE MOBILITY PLAN FOR SOLAPURSPEED AND DELAY SURVEY -Private vehicles
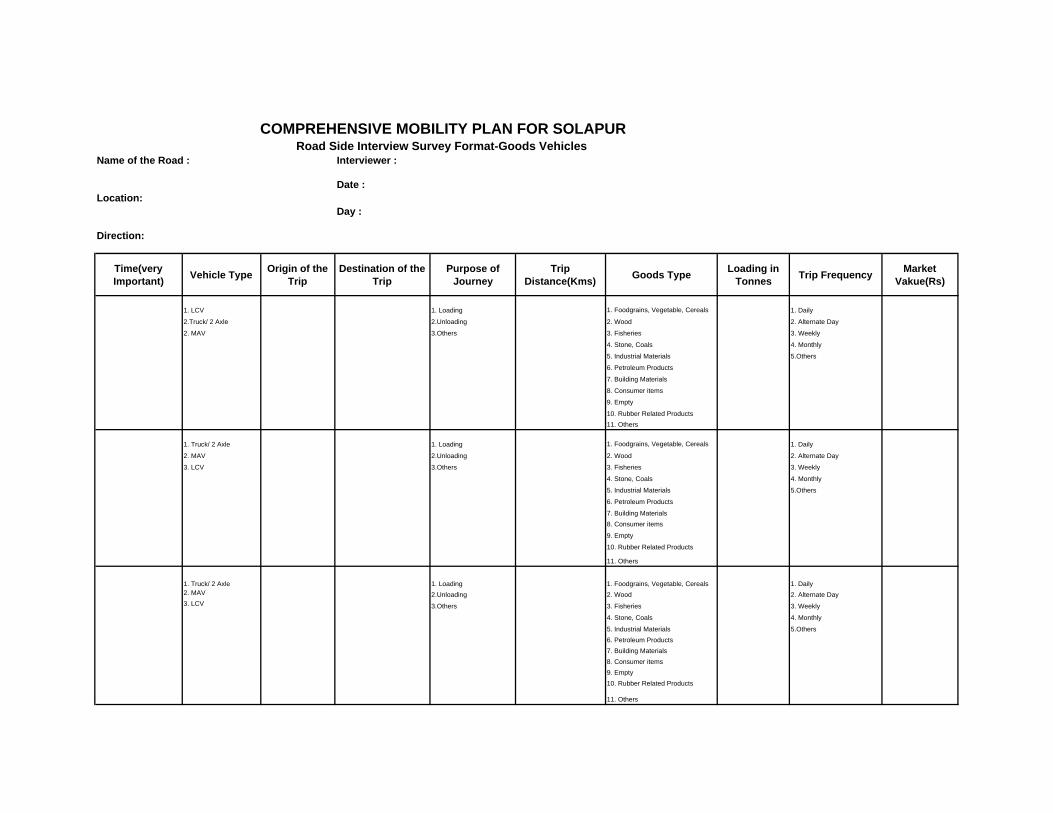
Name of the Road : Interviewer :
Date :Location:
Day :
Direction:
Time(very Important) Vehicle Type Origin of the
TripDestination of the
TripPurpose of
JourneyTrip
Distance(Kms) Goods Type Loading in Tonnes Trip Frequency Market
Vakue(Rs)
1. LCV 1. Loading 1. Foodgrains, Vegetable, Cereals 1. Daily
2.Truck/ 2 Axle 2.Unloading 2. Wood 2. Alternate Day
2. MAV 3.Others 3. Fisheries 3. Weekly
4. Stone, Coals 4. Monthly
5. Industrial Materials 5.Others
6. Petroleum Products
7. Building Materials
8. Consumer items
9. Empty
10. Rubber Related Products11. Others
1. Truck/ 2 Axle 1. Loading 1. Foodgrains, Vegetable, Cereals 1. Daily
2. MAV 2.Unloading 2. Wood 2. Alternate Day
3. LCV 3.Others 3. Fisheries 3. Weekly
4. Stone, Coals 4. Monthly
5. Industrial Materials 5.Others
6. Petroleum Products
7. Building Materials8. Consumer items
9. Empty
10. Rubber Related Products
11. Others
1. Truck/ 2 Axle 1. Loading 1. Foodgrains, Vegetable, Cereals 1. Daily2. MAV 2.Unloading 2. Wood 2. Alternate Day3. LCV 3.Others 3. Fisheries 3. Weekly
4. Stone, Coals 4. Monthly
5. Industrial Materials 5.Others6. Petroleum Products7. Building Materials8. Consumer items9. Empty10. Rubber Related Products
11. Others
Road Side Interview Survey Format-Goods VehiclesCOMPREHENSIVE MOBILITY PLAN FOR SOLAPUR

Name of the Road : Interviewer :
Date :Location:
Day :
Direction:
Time(Very Important ) Vehicle Type Occupancy Origin of the Trip Destination of the
Trip Purpose of Journey Trip Distance(Kms) Trip Frequency
1. Two Wheeler 1. Work 1. Daily
2. Car 2. Business 2. Alternate Day
3. Auto Rickshaw 3. Education 3. Weekly
4. Taxi 4. Social & Recreaton 4. Monthly
5. Tourism 5. Others
6. Others
1. Two Wheeler 1. Work 1. Daily
2. Car 2. Business 2. Alternate Day
3. Auto Rickshaw 3. Education 3. Weekly
4. Taxi 4. Social & Recreaton 4. Monthly
5. Tourism 5. Others
6. Others
1. Two Wheeler 1. Work 1. Daily
2. Car 2. Business 2. Alternate Day
3. Auto Rickshaw 3. Education 3. Weekly
4. Taxi 4. Social & Recreaton 4. Monthly
5. Tourism 5. Others
6. Others
1. Two Wheeler 1. Work 1. Daily
2. Car 2. Business 2. Alternate Day
3. Auto Rickshaw 3. Education 3. Weekly
4. Taxi 4. Social & Recreaton 4. Monthly
5. Tourism 5. Others
6. Others
1. Two Wheeler 1. Work 1. Daily
2. Car 2. Business 2. Alternate Day
3. Auto Rickshaw 3. Education 3. Weekly
4. Taxi 4. Social & Recreaton 4. Monthly
5. Tourism 5. Others
6. Others
Road Side Interview Survey Format-Passenger VehiclesCOMPREHENSIVE MOBILITY PLAN FOR SOLAPUR

Name of Bus stop: Road Name:
Date:
Direction:
Time( Hrs) Route No/Name Origin Destination Boarding Alighting Total
COMPREHENSIVE MOBILITY PLAN FOR SOLAPUR
BUS STOP PASSENGER COUNT SURVEY

COMPREHENSIVE MOBILITY PLAN FOR SOLAPUR
NON MOTORIZED TRANSPORT- OPINION SURVEY Date: Location: Day: Interviewer: 1. Age:
2. Sex: (Male: M, Female: F)
3. Trip Origin:
4. Trip Destination:
5. Distance of the trip in Km:
6. Time taken for the trip :
7. Trip Purpose: a)Work/Business b)Education c)Social d)Others
8. Trip Frequency : a)Daily b)Weekly c)Monthly d)Rarely
9. Travel & Maintenance cost per month :
10. Problems while riding your vehicle:
(Please rank as per your observation as 1,2,3,4,5,6 etc)
a) High Volume of Traffic
b) High Speed of Vehicles
c) Interference due to parking/pedestrians/bus stops
d) Bad condition of road/shoulders
e) Absence of proper lighting
f) Difficulty in crossing junctions
11. Your opinion on the necessity of separate track
a) Very essential
b) Desirable
c) Not required
g) No idea
12. Do you prefer exclusive track : Yes / No
Cycle Cycle Rickshaw
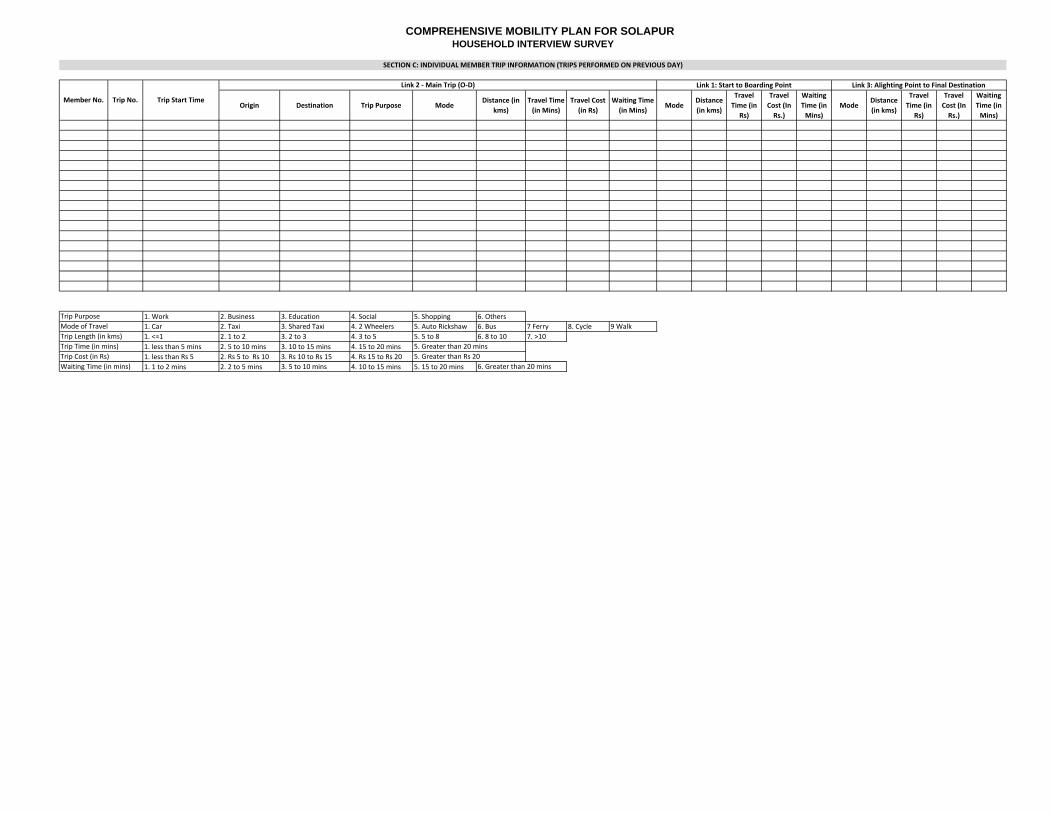
Origin Destination Trip Purpose ModeDistance (in
kms)Travel Time (in Mins)
Travel Cost (in Rs)
Waiting Time (in Mins)
Mode Distance (in kms)
Travel Time (in
Rs)
Travel Cost (In Rs.)
Waiting Time (in Mins)
Mode Distance (in kms)
Travel Time (in
Rs)
Travel Cost (In Rs.)
Waiting Time (in Mins)
1. Work 2. Business 3. Education 4. Social 5. Shopping 6. Others1. Car 2. Taxi 3. Shared Taxi 4. 2 Wheelers 5. Auto Rickshaw 6. Bus 7 Ferry 8. Cycle 9 Walk1. <=1 2. 1 to 2 3. 2 to 3 4. 3 to 5 5. 5 to 8 6. 8 to 10 7. >101. less than 5 mins 2. 5 to 10 mins 3. 10 to 15 mins 4. 15 to 20 mins1. less than Rs 5 2. Rs 5 to Rs 10 3. Rs 10 to Rs 15 4. Rs 15 to Rs 201. 1 to 2 mins 2. 2 to 5 mins 3. 5 to 10 mins 4. 10 to 15 mins 5. 15 to 20 minsWaiting Time (in mins)
HOUSEHOLD INTERVIEW SURVEYCOMPREHENSIVE MOBILITY PLAN FOR SOLAPUR
5. Greater than 20 mins5. Greater than Rs 20
6. Greater than 20 mins
Link 2 ‐ Main Trip (O‐D)
Member No. Trip No. Trip Start Time
Link 1: Start to Boarding Point Link 3: Alighting Point to Final Destination
SECTION C: INDIVIDUAL MEMBER TRIP INFORMATION (TRIPS PERFORMED ON PREVIOUS DAY)
Trip PurposeMode of TravelTrip Length (in kms)Trip Time (in mins)Trip Cost (in Rs)
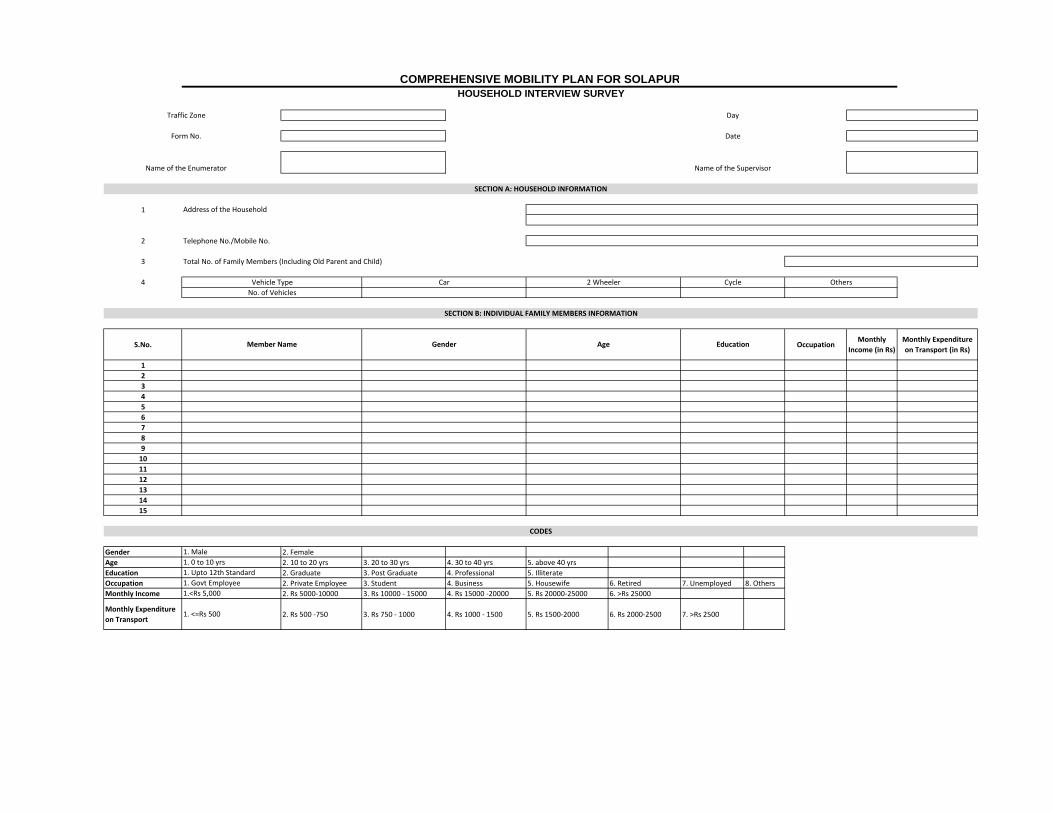
1
2 Telephone No./Mobile No.
3
4
S.No. OccupationMonthly
Income (in Rs)Monthly Expenditure on Transport (in Rs)
123456789101112131415
Gender 2. FemaleAge 2. 10 to 20 yrs 3. 20 to 30 yrs 4. 30 to 40 yrs 5. above 40 yrsEducation 2. Graduate 3. Post Graduate 4. Professional 5. IlliterateOccupation 2. Private Employee 3. Student 4. Business 5. Housewife 6. Retired 7. Unemployed 8. OthersMonthly Income 2. Rs 5000‐10000 3. Rs 10000 ‐ 15000 4. Rs 15000 ‐20000 5. Rs 20000‐25000 6. >Rs 25000
Monthly Expenditure on Transport
2. Rs 500 ‐750 3. Rs 750 ‐ 1000 4. Rs 1000 ‐ 1500 5. Rs 1500‐2000 6. Rs 2000‐2500 7. >Rs 2500
Day
Date
COMPREHENSIVE MOBILITY PLAN FOR SOLAPURHOUSEHOLD INTERVIEW SURVEY
Traffic Zone
Name of the Supervisor
SECTION A: HOUSEHOLD INFORMATION
Address of the Household
Form No.
Name of the Enumerator
SECTION B: INDIVIDUAL FAMILY MEMBERS INFORMATION
Total No. of Family Members (Including Old Parent and Child)
Vehicle Type Car 2 Wheeler Cycle Others
Member Name Gender Age Education
No. of Vehicles
CODES
1. Male1. 0 to 10 yrs1. Upto 12th Standard1. Govt Employee1.<Rs 5,000
1. <=Rs 500
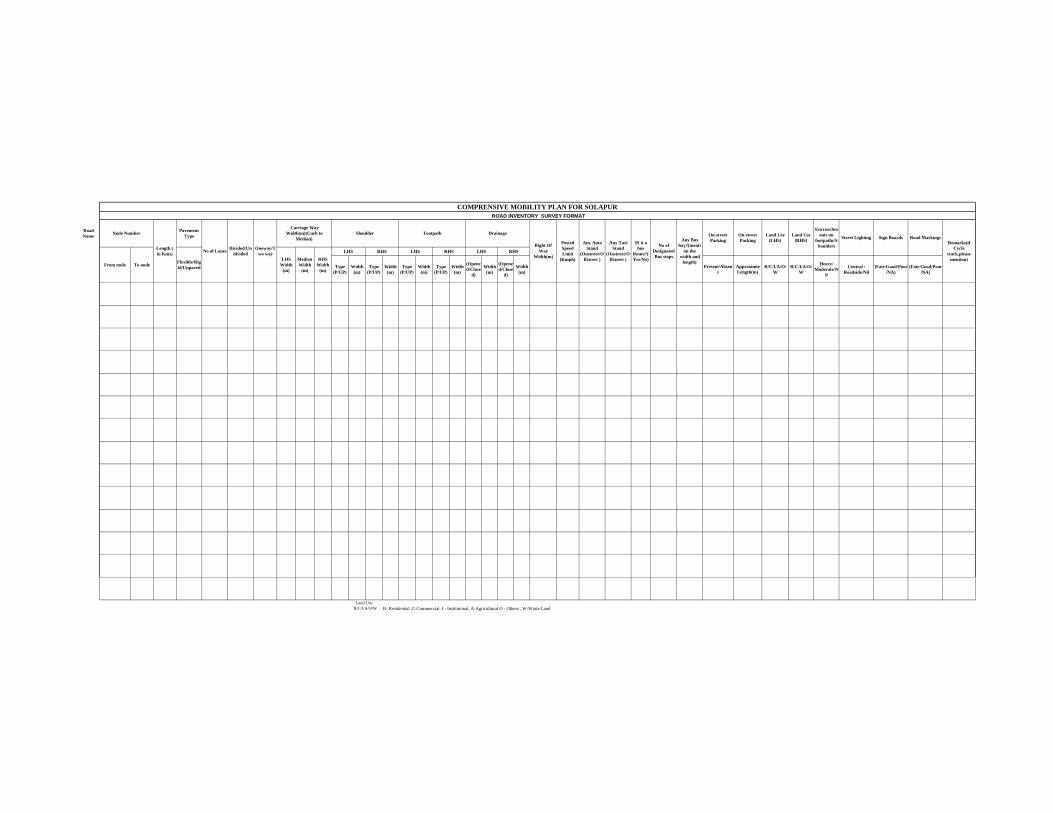
Road Name
Pavement Type
Type (P/UP)
Width (m)
Type (P/UP)
Width (m)
Type (P/UP)
Width (m)
Type (P/UP)
Width (m)
(Opened/Close
d)
Width (m)
(Opened/Close
d)
Width (m)
R/C/I/A/O/W
R/C/I/A/O/W
Heavy/ Moderate/N
il
Central / Roadside/Nil
(Fair/Good/Poor/NA)
(Fair/Good/Poor/NA)
R- Residential ,C-Commercial, I - Instituional ,A-Agricultural O - Others , W-Waste Land
IS it a bus
Route?(Yes/No)
COMPRENSIVE MOBILITY PLAN FOR SOLAPUR
Oneway/Two way
Length ( in Kms)
Road Markings
No of Designated Bus stops
No of Lanes Divided/Undivided
Any Auto Stand
(Onstreet/Offstreet )
Any Taxi Stand
(Onstreet/Offstreet )
Footpath
LHS RHS
Drainage
LHS RHS
Any Bus bay?(menti
on the width and
length)
Land Use - R/C/I/A/O/W
Node NumberCarriage Way
Width(m)(Curb to Median)
Right Of Way
Width(m)
Shoulder
LHS RHS
From node To node
ROAD INVENTORY SURVEY FORMAT
Flexible/Rigid/Unpaved
LHS Width
(m)
Median Width
(m)
RHS Width
(m)
Street LightingPosted Speed Limit
(Kmph)
Remarks(if Cycle
track,please mention)
On-street Parking Sign Boards
Encroachments on
footpaths/Shoulders
Present/Absent
Approximte Length(m)
On-street Parking
Land Use (LHS)
Land Use (RHS)

COMPREHENSIVE MOBILITY PLAN FOR SOLAPUR ------------------------------------------------------------------------------------------------------------------------------------------
TRUCK OPERATORS INTERVIEW SURVEY FORMAT ------------------------------------------------------------------------------------------------------------------------------------------
1. Name of the Operator 2. Garage Address
3. Number of vehicles owned : LCV MAV TRUCK
3. What is the route of operation?
1.______________________________________________________________________________________ 2.______________________________________________________________________________________
4. Frequency of Trips: 1.Daily 2. Alternate Days 3.Weekly 4. Monthly 5. Quarterly
5. Average trip distance:
6. Do you have any parking facilities/Garages? ( Yes / No)
7. If yes what is the size of parking facility?
8. If No, where do you park your vehicles?
9. What is the designated time duration for loading and unloading inside the city?
10. What are the truck operating routes in the city? 1.______________________________________________________________________________________ 2.______________________________________________________________________________________
11. Do you have any truck Laybys inside the city?
12. Please tick √ if any Operational difficulties given below are there.
1. No Parking facility 2. Ban on some roads or time 3. Poor quality of roads 4. Narrow roads 5. No terminal facilities 6. Lack of general facilities 7. No weighing facilities 8. Others

Detailed Trip Information:( Last day/Last week) Date of Travel: Day of Travel: Total Number of Trips per month:
Trip
No (1)
Origin Address
(2)
Destination Address
(3)
Time of start
(Hrs:Min) (4)
Time of finish(Hrs:Min)
(5)
Trip Distance
(6)
Trip Purpose
(7)
Commodity type (8)
Load Carried
(in Tonnes)
(9)
Market Value of
Commodity (in Rs)
Remarks (10)
Trip Purpose : 1-Loading, 2- Unloading, 3.Others Commodity Type: 1. Food grains, Vegetable, Cereals, 2. Wood 3. Fisheries 4. Stone, Coals 5. Industrial Materials 6. Petroleum Products. 7. Building Materials 8. Consumer items 9. Empty 10. Rubber Related Products 11. Others

Location: Time :
Boarding Passengers
Fare (Rs.)
Distance (Km) Time(Min) Distance (Km) Time(Min)
1
2
3
4
5
6
7
Alighting Passengers
Distance Travelled (Km)
Time Taken (Min) Distance (Km) Time(Min) Distance (Km) Time(Min)
1
2
3
4
5
6
7
Trip Purpose: Work = 1, Business = 2, Education = 3,Social & Recreation= 4, Tourism-5, Others=6
COMPREHENSIVE MOBILITY PLAN FOR SOLAPUR
BUS PASSENGER INTERVIEW SURVEY
Sno
Name of the Road:
Date: Direction:
OriginMode of Travel to
the Bus Stop
Distance travelled to arrive at the stop (Km.)
Fare for the trip (Rs.)
Purpose of journey
If the destination is not near the
bus stop, how do you go from there
Approximate Waiting time at the Bus stop(min.)
Fare (Rs.)
Approximate
Fare (Rs.)Sl.No.
Approximate Approximate Mode of travel
from the Bus StopDestinationWaiting time at the Bus stop(min.)
Fare - Trip(Rs.)
(Walk-1, Cycle-2,Cycle rickshaw-3 Motorcycle-4,Auto Rickshaw-5,Pvt-Car-6, Taxi-7, Bus-8, Others-9)
Fare (Rs.)Purpose of
journeyWaiting time at the
Bus stop(min.)Where are you
going (destination)
If the destination is not near the
bus stop, Which mode
do you take to go from there
Average Waiting time at the Bus stop(min.)
Approximate Approximate
Origin
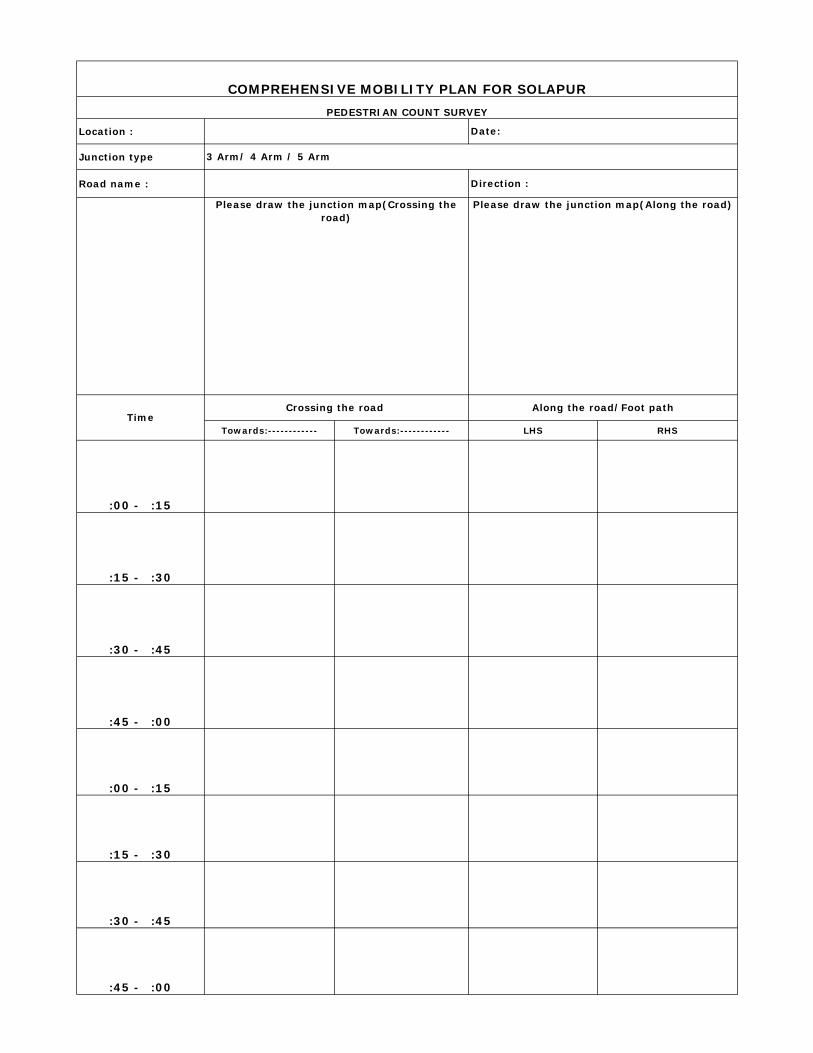
Location :
Junction type
Road name :
Towards:------------ Towards:------------ LHS RHS
:00 - :15
:15 - :30
:30 - :45
:45 - :00
:00 - :15
:15 - :30
:30 - :45
:45 - :00
Crossing the road Time
Along the road/Foot path
COMPREHENSIVE MOBILITY PLAN FOR SOLAPURPEDESTRIAN COUNT SURVEY
Date:
Direction :
Please draw the junction map(Along the road)Please draw the junction map(Crossing the road)
3 Arm/ 4 Arm / 5 Arm

COMPREHENSIVE MOBILITY PLAN FOR SOLAPUR Bus Occupancy Survey Format
Road Name: Bus Stop/Land mark: Direction: Bus Type- M- Mofussil Bus, C-City Bus
Bus Type
Route No Origin Destination Sitting
Standees
If Under Capacity Crush
Capacity ( )
Empty Full
None Full
Empty Full
None Full
Empty Full
None Full
Empty Full
None Full
Empty Full
None Full
Empty Full
None Full
Empty Full
None Full
Empty Full
None Full

Location: Time :
Boarding Passengers
Fare (Rs.)
Distance (Km) Time(Min) Distance (Km) Time(Min)
1
2
3
4
5
6
7
Alighting Passengers
Distance Travelled
(Km)Time Taken
(Min) Distance (Km) Time(Min) Distance (Km) Time(Min)
1
2
3
4
5
6
7
Trip Purpose: Work = 1, Business = 2, Education = 3,Social & Recreation= 4, Tourism-5, Others=6
Purpose of journey
Distance travelled to arrive at the station (Km.)
Fare (Rs.)
OriginMode of Travel to
the Railway station
Fare - Trip(Rs.)
Approximate
OriginWaiting time at the
Railway station(min.)
Approximate Approximate
Average Waiting time at the
station(min.)
Approximate Waiting time at
the station(min.)
Direction:
Fare for the trip (Rs.)
If the destination is not near the
railway station, how do you go
from there
(Walk-1, Cycle-2,Cycle rickshaw-3 Motorcycle-4,Auto Rickshaw-5,Pvt-Car-6, Taxi-7, Bus-8, Others-9)
Fare (Rs.)Purpose of
journeyWaiting time at the
Railway station(min.)Where are you
going (destination)
If the destination is not near the
railway station, Which mode do you take to go
from there
Approximate
Mode of Travel to the Railway
stationDestination
Approximate
Fare (Rs.)
COMPREHENSIVE MOBILITY PLAN FOR SOLAPUR
RAIL PASSENGER INTERVIEW SURVEY
Sno
Name of the Station:
Date:
Sl.No.
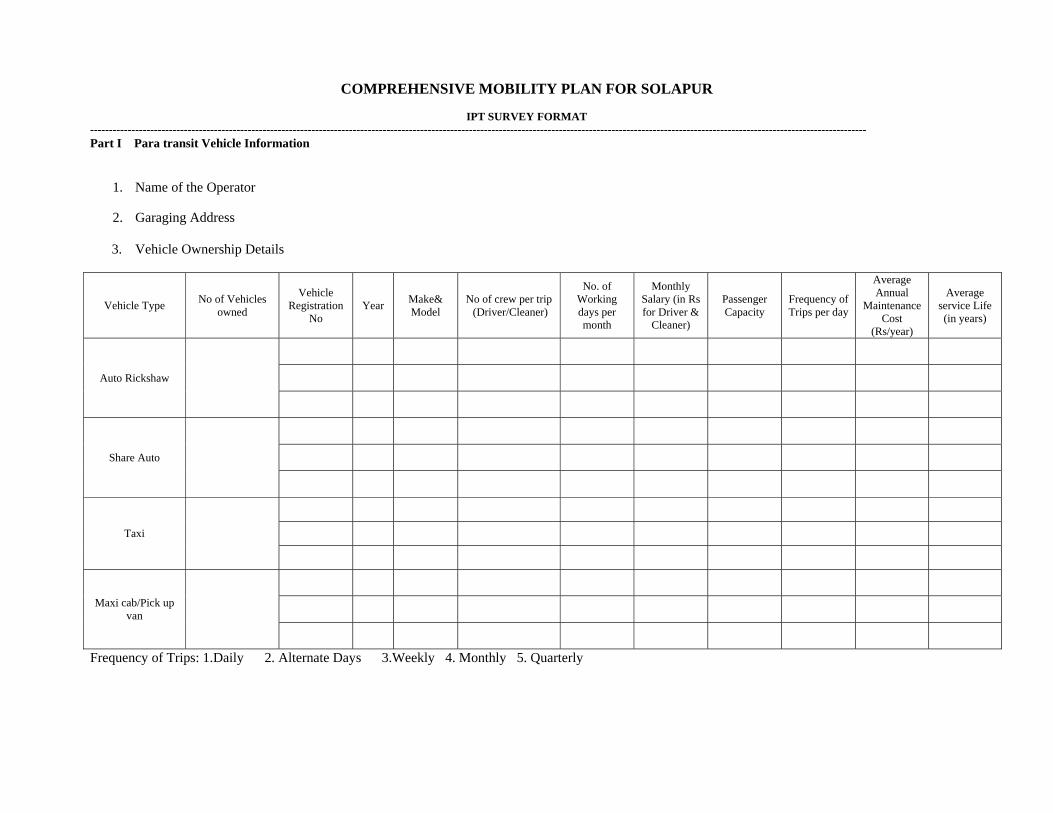
COMPREHENSIVE MOBILITY PLAN FOR SOLAPUR
IPT SURVEY FORMAT --------------------------------------------------------------------------------------------------------------------------------------------------------------------------------------------------------------- Part I Para transit Vehicle Information
1. Name of the Operator 2. Garaging Address
3. Vehicle Ownership Details
Vehicle Type No of Vehicles
owned
Vehicle Registration
No Year
Make& Model
No of crew per trip (Driver/Cleaner)
No. of Working days per month
Monthly Salary (in Rs for Driver &
Cleaner)
Passenger Capacity
Frequency of Trips per day
Average Annual
Maintenance Cost
(Rs/year)
Average service Life (in years)
Auto Rickshaw
Share Auto
Taxi
Maxi cab/Pick up van
Frequency of Trips: 1.Daily 2. Alternate Days 3.Weekly 4. Monthly 5. Quarterly

4. For Share Auto / Pick up van please mention the route of Trip:
Part II Trip Information:
Date of Travel: Day of Travel: Total Number of Trips per day: Approximate Distance Traveled (in Kms) on a travel day:
Trip No
Trip Origin Address
Trip Destination Address
Time of start (Hrs:Min)
Time of finish (Hrs:Min)
Trip Distance (in Kms)
Trip Purpose 1.Work 2.Business 3.Social 4.Education 5.Others
Number of passengers carried per
trip
Remarks
1.----------------------------------------------------------------------------------------------------------------------------------------------------------------------------- 2..----------------------------------------------------------------------------------------------------------------------------------------------------------------------------

Location: Shift: Day/ Night Date: Day:Weather: Sunny/ Cloudy/ Rainy Enumerator: Sheet No:
Hourly Total
Direction 2:Direction 1:
Comprehensive Mobility Plan for SOLAPURPedestrian Count Survey-Mid Block
Across the Road Along the Road (LHS) Along the Road (RHS)TIME Direction 2:Direction 2: Direction 1: Direction 1:
Wilbur Smith Associates

Location : Date
Entry Exit
Type of parking Enumerator
Start Time
End Time Car TW Cycles Others
Start Time
End Time Car TW Cycles Others
Parking Duration Survey - Off Street ParkingComprehensive Mobility Plan for SOLAPUR
PUNE-CMP Wilbur Smith Associates

COMPREHENSIVE MOBILITY PLAN FOR SOLAPUR INCEPTION REPORT
Page | 2
Annexure 2
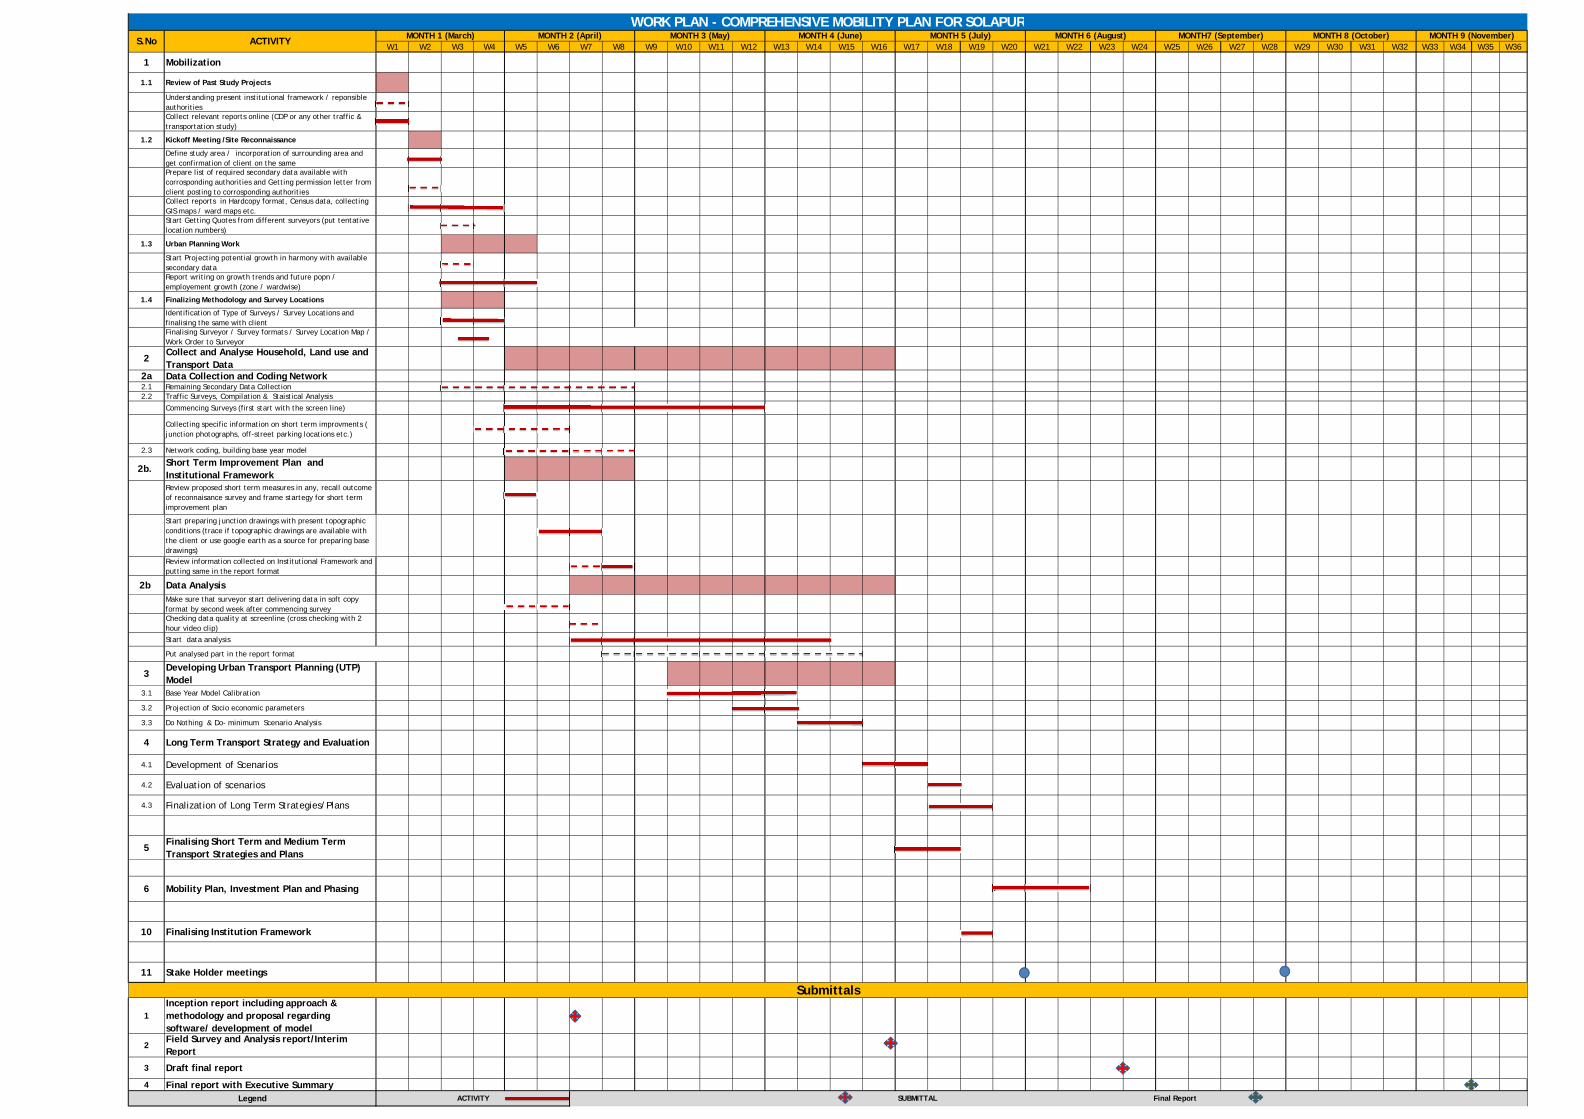
W1 W2 W3 W4 W5 W6 W7 W8 W9 W10 W11 W12 W13 W14 W15 W16 W17 W18 W19 W20 W21 W22 W23 W24 W25 W26 W27 W28 W29 W30 W31 W32 W33 W34 W35 W36
1 Mobilization
1.1 Review of Past Study Projects
Understanding present institutional framework / reponsible authorities Collect relevant reports online (CDP or any other traffic & transportation study)
1.2 Kickoff Meeting /Site Reconnaissance
Define study area / incorporation of surrounding area and get confirmation of client on the samePrepare list of required secondary data available with corrosponding authorities and Getting permission letter from client posting to corrosponding authorities Collect reports in Hardcopy format, Census data, collecting GIS maps / ward maps etc.Start Getting Quotes from different surveyors (put tentative location numbers)
1.3 Urban Planning Work
Start Projecting potential growth in harmony with available secondary data Report writing on growth trends and future popn / employement growth (zone / wardwise)
1.4 Finalizing Methodology and Survey Locations
Identification of Type of Surveys / Survey Locations and finalising the same with client Finalising Surveyor / Survey formats / Survey Location Map / Work Order to Surveyor
2Collect and Analyse Household, Land use and Transport Data
2a Data Collection and Coding Network 2.1 Remaining Secondary Data Collection2.2 Traffic Surveys, Compilation & Staistical Analysis
Commencing Surveys (first start with the screen line)
Collecting specific information on short term improvments ( junction photographs, off-street parking locations etc.)
2.3 Network coding, building base year model
2b. Short Term Improvement Plan and Institutional Framework Review proposed short term measures in any, recall outcome of reconnaisance survey and frame startegy for short term improvement plan
Start preparing junction drawings with present topographic conditions (trace if topographic drawings are available with the client or use google earth as a source for preparing base drawings)Review information collected on Institutional Framework and putting same in the report format
2b Data AnalysisMake sure that surveyor start delivering data in soft copy format by second week after commencing surveyChecking data quality at screenline (cross checking with 2 hour video clip)
Start data analysis
Put analysed part in the report format
3Developing Urban Transport Planning (UTP) Model
3.1 Base Year Model Calibration
3.2 Projection of Socio economic parameters
3.3 Do Nothing & Do- minimum Scenario Analysis
4 Long Term Transport Strategy and Evaluation
4.1 Development of Scenarios
4.2 Evaluation of scenarios
4.3 Finalization of Long Term Strategies/Plans
5Finalising Short Term and Medium Term Transport Strategies and Plans
6 Mobility Plan, Investment Plan and Phasing z
10 Finalising Institution Framework
11 Stake Holder meetings
1Inception report including approach & methodology and proposal regarding software/ development of model
2Field Survey and Analysis report/Interim Report
3 Draft final report
4 Final report with Executive Summary
WORK PLAN - COMPREHENSIVE MOBILITY PLAN FOR SOLAPURMONTH 9 (November)
Submittals
SUBMITTAL Final Report Legend ACTIVITY
S.No ACTIVITY MONTH 1 (March) MONTH 2 (April) MONTH 3 (May) MONTH 4 (June) MONTH 5 (July) MONTH 6 (August) MONTH7 (September) MONTH 8 (October)