Embed Size (px)
Citation preview
Comprehensive geriatric assessment for older adults
admitted to hospital (Review)
Ellis G, Whitehead MA, O’Neill D, Langhorne P, Robinson D
This is a reprint of a Cochrane review, prepared and maintained by The Cochrane Collaboration and published in The Cochrane Library2011, Issue 7
http://www.thecochranelibrary.com
Comprehensive geriatric assessment for older adults admitted to hospital (Review)
Copyright © 2011 The Cochrane Collaboration. Published by John Wiley & Sons, Ltd.
T A B L E O F C O N T E N T S
1HEADER . . . . . . . . . . . . . . . . . . . . . . . . . . . . . . . . . . . . . . .
1ABSTRACT . . . . . . . . . . . . . . . . . . . . . . . . . . . . . . . . . . . . . .
2PLAIN LANGUAGE SUMMARY . . . . . . . . . . . . . . . . . . . . . . . . . . . . . .
2BACKGROUND . . . . . . . . . . . . . . . . . . . . . . . . . . . . . . . . . . . .
3OBJECTIVES . . . . . . . . . . . . . . . . . . . . . . . . . . . . . . . . . . . . .
3METHODS . . . . . . . . . . . . . . . . . . . . . . . . . . . . . . . . . . . . . .
Figure 1. . . . . . . . . . . . . . . . . . . . . . . . . . . . . . . . . . . . . . 4
5RESULTS . . . . . . . . . . . . . . . . . . . . . . . . . . . . . . . . . . . . . . .
Figure 2. . . . . . . . . . . . . . . . . . . . . . . . . . . . . . . . . . . . . . 7
Figure 3. . . . . . . . . . . . . . . . . . . . . . . . . . . . . . . . . . . . . . 8
14DISCUSSION . . . . . . . . . . . . . . . . . . . . . . . . . . . . . . . . . . . . .
15AUTHORS’ CONCLUSIONS . . . . . . . . . . . . . . . . . . . . . . . . . . . . . . .
16ACKNOWLEDGEMENTS . . . . . . . . . . . . . . . . . . . . . . . . . . . . . . . .
16REFERENCES . . . . . . . . . . . . . . . . . . . . . . . . . . . . . . . . . . . . .
20CHARACTERISTICS OF STUDIES . . . . . . . . . . . . . . . . . . . . . . . . . . . . .
55DATA AND ANALYSES . . . . . . . . . . . . . . . . . . . . . . . . . . . . . . . . . .
Analysis 1.1. Comparison 1 CGA versus usual care, Outcome 1 Living at home (up to 6 months). . . . . . . . 57
Analysis 1.2. Comparison 1 CGA versus usual care, Outcome 2 Living at home (end of follow up). . . . . . . 59
Analysis 1.3. Comparison 1 CGA versus usual care, Outcome 3 Mortality (up to 6 months). . . . . . . . . . 60
Analysis 1.4. Comparison 1 CGA versus usual care, Outcome 4 Mortality (end of follow up). . . . . . . . . 62
Analysis 1.5. Comparison 1 CGA versus usual care, Outcome 5 Institutionalisation (up to 6 months). . . . . . 63
Analysis 1.6. Comparison 1 CGA versus usual care, Outcome 6 Institutionalisation (end of follow up). . . . . . 65
Analysis 1.7. Comparison 1 CGA versus usual care, Outcome 7 Dependence. . . . . . . . . . . . . . . 66
Analysis 1.8. Comparison 1 CGA versus usual care, Outcome 8 Death or dependence. . . . . . . . . . . . 67
Analysis 1.9. Comparison 1 CGA versus usual care, Outcome 9 Death or deterioration. . . . . . . . . . . 68
Analysis 1.10. Comparison 1 CGA versus usual care, Outcome 10 Activities of daily living. . . . . . . . . . 69
Analysis 1.11. Comparison 1 CGA versus usual care, Outcome 11 Cognitive function. . . . . . . . . . . . 70
Analysis 1.12. Comparison 1 CGA versus usual care, Outcome 12 Length of stay. . . . . . . . . . . . . 71
Analysis 1.13. Comparison 1 CGA versus usual care, Outcome 13 Readmissions. . . . . . . . . . . . . . 72
Analysis 2.1. Comparison 2 CGA versus usual care (targeting), Outcome 1 Living at home (up to 6 months). . . . 73
Analysis 2.2. Comparison 2 CGA versus usual care (targeting), Outcome 2 Living at home (end of follow up). . . 74
Analysis 3.1. Comparison 3 CGA versus usual care (timing of admission), Outcome 1 Living at home (up to 6 months). 76
Analysis 3.2. Comparison 3 CGA versus usual care (timing of admission), Outcome 2 Living at home (end of follow up). 78
Analysis 4.1. Comparison 4 CGA versus usual care (outpatient follow up), Outcome 1 Living at home (up to 6 months). 80
Analysis 4.2. Comparison 4 CGA versus usual care (outpatient follow up), Outcome 2 Living at home (end of follow up). 81
81APPENDICES . . . . . . . . . . . . . . . . . . . . . . . . . . . . . . . . . . . . .
83HISTORY . . . . . . . . . . . . . . . . . . . . . . . . . . . . . . . . . . . . . . .
83CONTRIBUTIONS OF AUTHORS . . . . . . . . . . . . . . . . . . . . . . . . . . . . .
84DECLARATIONS OF INTEREST . . . . . . . . . . . . . . . . . . . . . . . . . . . . . .
84SOURCES OF SUPPORT . . . . . . . . . . . . . . . . . . . . . . . . . . . . . . . . .
84DIFFERENCES BETWEEN PROTOCOL AND REVIEW . . . . . . . . . . . . . . . . . . . . .
iComprehensive geriatric assessment for older adults admitted to hospital (Review)
Copyright © 2011 The Cochrane Collaboration. Published by John Wiley & Sons, Ltd.
[Intervention Review]
Comprehensive geriatric assessment for older adultsadmitted to hospital
Graham Ellis1, Martin A Whitehead2, Desmond O’Neill3, Peter Langhorne4 , David Robinson5
1Medicine for the Elderly, Monklands Hospital, Airdrie, UK. 2Medicine for the Elderly, Wishaw General Hospital, Wishaw, UK.3Department of Medical Gerontology, Trinity Centre for Health Sciences, Adelaide and Meath Hospital, Dublin, Ireland. 4Academic
Section of Geriatric Medicine, University of Glasgow, Glasgow, UK. 5Department of Medical Gerontology, Adelaide and Meath
Hospital, Dublin, Ireland
Contact address: Graham Ellis, Medicine for the Elderly, Monklands Hospital, Monkscourt Avenue, Airdrie, Scotland, ML6 0JS, UK.
Editorial group: Cochrane Effective Practice and Organisation of Care Group.
Publication status and date: New, published in Issue 7, 2011.
Review content assessed as up-to-date: 7 June 2010.
Citation: Ellis G, Whitehead MA, O’Neill D, Langhorne P, Robinson D. Comprehensive geriatric assessment for older adults admitted
to hospital. Cochrane Database of Systematic Reviews 2011, Issue 7. Art. No.: CD006211. DOI: 10.1002/14651858.CD006211.pub2.
Copyright © 2011 The Cochrane Collaboration. Published by John Wiley & Sons, Ltd.
A B S T R A C T
Background
Comprehensive geriatric assessment (CGA) is a multidimensional, interdisciplinary diagnostic process to determine the medical,
psychological and functional capabilities of a frail elderly person in order to develop a co-ordinated and integrated plan for treatment
and long-term follow up.
Objectives
We sought to evaluate the effectiveness of CGA in hospital for older adults admitted as an emergency.
Search strategy
We searched the Cochrane Effective Practice and Organisation of Care (EPOC) Group Register, the Cochrane Central Register of
Controlled Trials (CENTRAL) (The Cochrane Library), the Database of Abstracts of Reviews of Effects (DARE), MEDLINE, EMBASE,
CINAHL and AARP Ageline, and handsearched high-yield journals.
Selection criteria
We searched for randomised controlled trials comparing CGA (whether by mobile teams or in designated wards) to usual care.
Data collection and analysis
Two review authors initially assessed eligibility and trial quality and extracted published data.
Main results
Twenty-two trials evaluating 10,315 participants in six countries were identified. Patients in receipt of CGA were more likely to be
alive and in their own homes at up to six months (OR 1.25, 95% CI 1.11 to 1.42, P = 0.0002) and at the end of scheduled follow up
(median 12 months) (OR 1.16, 95% CI 1.05 to 1.28, P = 0.003) when compared to general medical care. In addition, patients were
less likely to be institutionalised (OR 0.79, 95% CI 0.69 to 0.88, P < 0.0001). They were less likely to suffer death or deterioration
(OR 0.76, 95% CI 0.64 to 0.90, P = 0.001), and were more likely to experience improved cognition in the CGA group (OR 1.11,
95% CI 0.20 to 2.01, P = 0.02). Subgroup interaction in the primary outcomes suggests that the effects of CGA are primarily the result
of CGA wards.
1Comprehensive geriatric assessment for older adults admitted to hospital (Review)
Copyright © 2011 The Cochrane Collaboration. Published by John Wiley & Sons, Ltd.
Authors’ conclusions
Comprehensive geriatric assessment increases a patient’s likelihood of being alive and in their own home at up to 12 months.
P L A I N L A N G U A G E S U M M A R Y
Comprehensive geriatric assessment for older adults admitted to hospital
This review investigates whether specialist, organised and co-ordinated geriatric care (normally referred to as comprehensive geriatric
assessment or CGA) is better for patient outcomes than conventional care in a hospital setting. There is a clear and significant
improvement in the chances of a patient being alive and in their own home at up to a year after an emergency hospital admission if
they receive co-ordinated specialist services. This effect is consistently seen from trials of geriatric wards where patients are admitted to
a dedicated ward area and receive care from a specialist multidisciplinary team. This effect was not clearly seen where patients remained
in a general ward and received assessment from a visiting specialist multi-disciplinary team.
B A C K G R O U N D
Hospital admissions for emergencies have continued to increase
year on year. The largest increases have occurred in the over 65
age group (DOH 2006; OECD 2004; Wood 2001), leading some
epidemiologists to conclude that the future of inpatient emergency
medical care is the care of the older adult (Wood 2001).
Observing high rates of institutionalisation in the frail elderly pop-
ulation, Warren and colleagues identified the lack of a compre-
hensive assessment of the medical, social, functional or psycho-
logical needs of this high-risk group (Mathews 1984). They also
observed the inadequacy of provision for readily recognisable and
remedial problems. This observation led to the development of
one of the cornerstones of modern geriatric care: the comprehen-
sive geriatric assessment (CGA). Comprehensive geriatric assess-
ment is defined as a “multidimensional interdisciplinary diagnos-
tic process focused on determining a frail elderly person’s medical,
psychological and functional capability in order to develop a co-
ordinated and integrated plan for treatment and long term follow
up” (Rubenstein 1991).
Models of CGA have evolved in different healthcare settings and to
meet differing needs. Common to these interventions are several
key features that have been attributed with their effectiveness. The
key components include:
• co-ordinated multidisciplinary assessment;
• geriatric medicine expertise;
• identification of medical, physical, social and psychological
problems; and
• the formation of a plan of care including appropriate
rehabilitation.
In addition, several key components have been associated with
improved CGA outcomes (Stuck 1993). These were highlighted
in a systematic review as:
• the ability to directly implement treatment
recommendations made by the multidisciplinary team; and
• long-term follow up.
In 1993, Andreas Stuck and colleagues conducted a meta-analy-
sis of different service-based interventions for older people (Stuck
1993). This meta-analysis provided a framework for the definition
of inpatient and outpatient models of CGA. Inpatient CGA was
divided into two types. The first was delivered by a team in a dis-
crete ward, with control over the delivery of the multi-disciplinary
team recommendations (these are sometimes known as a Geri-
atric Evaluation and Management Units (GEMU) or alternatively
Acute Care for Elders Units (ACE)). The second was a multidis-
ciplinary team assessing patients and delivering recommendations
to the physicians caring for older patients (known as the Inpa-
tient Geriatric Consultation Service (IGCS)). Results of this meta-
analysis showed a benefit on short-term mortality, reduced insti-
tutionalisation and readmission, improved cognitive functioning
and, for some models, improved physical functioning. Since this
meta-analysis, a number of studies have reported trials of CGA
(Asplund 2000; Cohen 2002; Counsell 2000; Landefeld 1995;
Nikolaus 1999; Reuben 1995; Saltvedt 2002). In addition there
have been a number of systematic reviews and meta-analyses of
various subgroups of CGA. One meta-analysis looked specifically
at ACE units (Baztan 2009) and included case-control studies.
One evaluated a subgroup of postacute geriatric wards in combi-
nation with orthogeriatric rehabilitation units (Bachmann 2010).
2Comprehensive geriatric assessment for older adults admitted to hospital (Review)
Copyright © 2011 The Cochrane Collaboration. Published by John Wiley & Sons, Ltd.
A third has evaluated the subgroup of Geriatric Evaluation and
Management Units (GEMU) (Van Craen 2010). Other review
articles of in-hospital care for older people with or without meta-
analysis also exist (Bakker 2011; Ellis 2005). An updated and sys-
tematic review of all these subgroups and meta-analyses is now
required.
O B J E C T I V E S
To determine the effectiveness of inpatient comprehensive geriatric
assessment (CGA) for frail older adults admitted to hospital as an
unplanned emergency in comparison to routine or general medical
acute care in hospital.
M E T H O D S
Criteria for considering studies for this review
Types of studies
We only considered randomised controlled trials and cluster-ran-
domised trials.
Types of participants
We defined participants as adults 65 years or older admitted to
hospital care as an emergency with medical, psychological, func-
tional or social problems (or other similar admissions referred to
as ’non-elective’, ’urgent’, ’acute’, ’unplanned’ or ’unscheduled’).
Types of interventions
We looked for studies comparing comprehensive geriatric assess-
ment (CGA) with usual care, such as general medical ward care.
Comprehensive geriatric assessment (or CGA) is a simultaneous,
multi-level assessment of various domains by a multidisciplinary
team to ensure that problems are identified, quantified and man-
aged appropriately. This includes assessment of medical, psychi-
atric, functional and social domains followed by a management
plan including rehabilitation. Usually the multidisciplinary team
will include as a minimum experienced medical, nursing and ther-
apy staff. This care is usually delivered in two distinct forms. The
first is a discrete specialist (geriatric) ward. Patients are admitted
to this setting and their care is taken over by the specialist team.
This team would then conduct a formal assessment across a va-
riety of domains and may use standardised assessment tools to
gather information in a semi-structured fashion. This might in-
clude (for example) the Barthel scale for Activities of Daily Liv-
ing (Collin 1988), the Get Up and Go test for mobility assess-
ment (Mathias 1986), or the Mini Mental State Examination for
cognition (Folstein 1975). The team would then discuss the as-
sessment findings in a multidisciplinary meeting and a plan of
treatment would be developed. Members of that multidisciplinary
team would then be responsible for delivering the recommended
treatment or rehabilitation plan (such as physiotherapy input or
occupational therapy, diagnostics or medical treatment).
The second model is CGA delivered by a mobile or peripatetic
team who conduct a multidisciplinary assessment of a patient in
the general medical setting they are admitted to. They may use
similar domains of assessment such as medical, cognitive, func-
tional etc. and may use the same assessment tools to collect data.
This would then be discussed in a multidisciplinary team meeting
to develop a recommended plan for treatment. The team would
then pass on their recommendations to the parent team (medical
and nursing staff ) and may or may not be involved in delivering
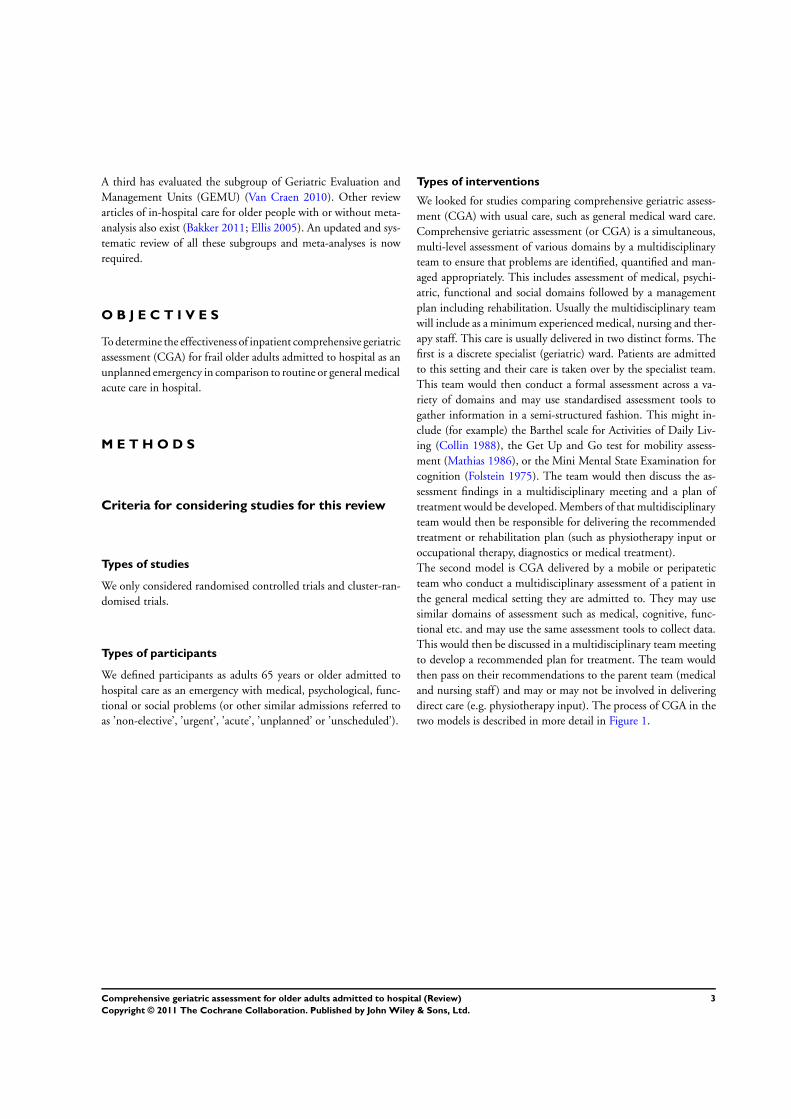
direct care (e.g. physiotherapy input). The process of CGA in the
two models is described in more detail in Figure 1.
3Comprehensive geriatric assessment for older adults admitted to hospital (Review)
Copyright © 2011 The Cochrane Collaboration. Published by John Wiley & Sons, Ltd.
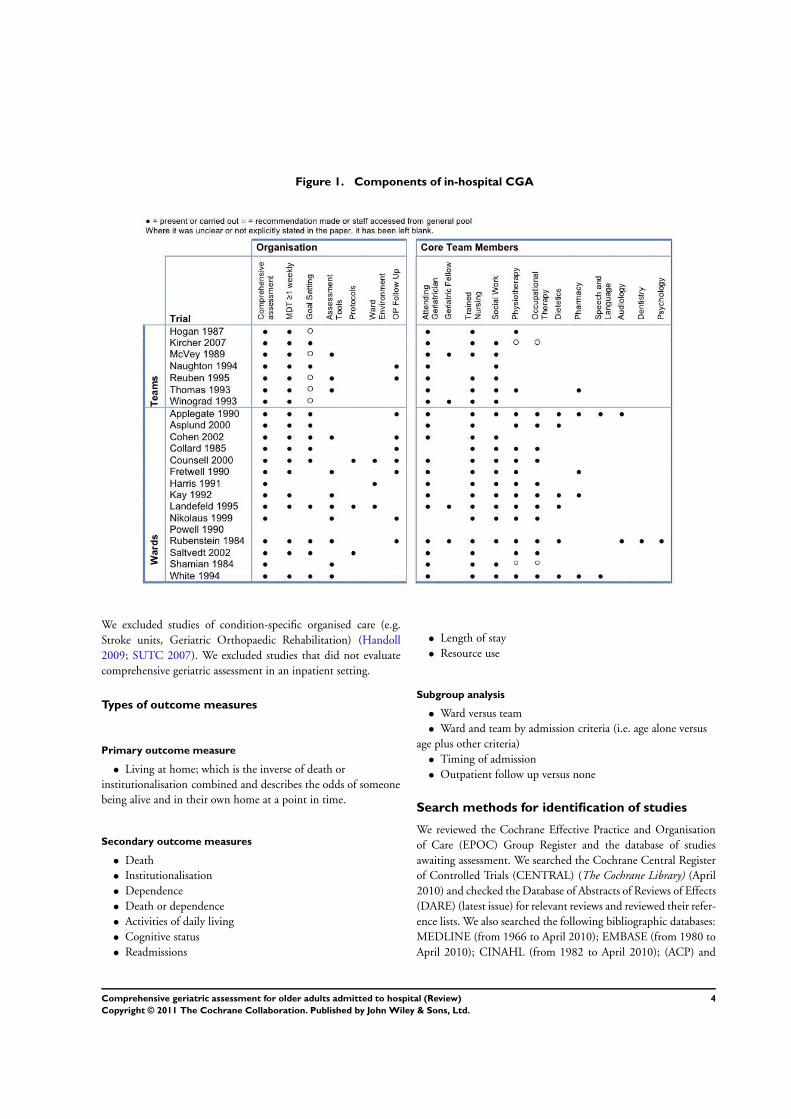
Figure 1. Components of in-hospital CGA
We excluded studies of condition-specific organised care (e.g.
Stroke units, Geriatric Orthopaedic Rehabilitation) (Handoll
2009; SUTC 2007). We excluded studies that did not evaluate
comprehensive geriatric assessment in an inpatient setting.
Types of outcome measures
Primary outcome measure
• Living at home; which is the inverse of death or
institutionalisation combined and describes the odds of someone
being alive and in their own home at a point in time.
Secondary outcome measures
• Death
• Institutionalisation
• Dependence
• Death or dependence
• Activities of daily living
• Cognitive status
• Readmissions
• Length of stay
• Resource use
Subgroup analysis
• Ward versus team
• Ward and team by admission criteria (i.e. age alone versus
age plus other criteria)
• Timing of admission
• Outpatient follow up versus none
Search methods for identification of studies
We reviewed the Cochrane Effective Practice and Organisation
of Care (EPOC) Group Register and the database of studies
awaiting assessment. We searched the Cochrane Central Register
of Controlled Trials (CENTRAL) (The Cochrane Library) (April
2010) and checked the Database of Abstracts of Reviews of Effects
(DARE) (latest issue) for relevant reviews and reviewed their refer-
ence lists. We also searched the following bibliographic databases:
MEDLINE (from 1966 to April 2010); EMBASE (from 1980 to
April 2010); CINAHL (from 1982 to April 2010); (ACP) and
4Comprehensive geriatric assessment for older adults admitted to hospital (Review)
Copyright © 2011 The Cochrane Collaboration. Published by John Wiley & Sons, Ltd.
AARP Ageline (from 1978 to April 2010). In addition, we checked
reference lists of all papers and reviews as well as conference pro-
ceedings of the American Geriatrics Society and the British Geri-
atrics Society.
The search strategy for MEDLINE is shown in Appendix 1 and for
EMBASE in Appendix 2. We adapted this for the other databases.
Data collection and analysis
Selection of studies
Three independent review authors (GE, DR and MW) screened
titles and abstracts of papers identified by the literature searches for
their potential relevance. We excluded any papers that did not meet
the inclusion criteria at this stage. Where there was a disagreement,
we considered the paper as potentially relevant and proceeded to
the next stage. We retrieved all papers of potential relevance and
three independent review authors (GE, DR and MW) assessed the
full text for inclusion in the review. Where there was disagreement,
GE and DO’N moderated; reasons for excluding full papers are
reported.
Data extraction
We performed data abstraction using a pre-designed data abstrac-
tion form on all studies that fulfilled the inclusion criteria. Two
review authors (DR and MW) abstracted the data independently,
including data on design characteristics, the study population, the
intervention, outcome measures used and length of follow up. We
determined classification of the intervention by characteristics of
the form of CGA used (discrete geographical unit versus mobile
team) and the components of the interventions. Disagreements
were resolved by the moderators (GE and DO’N).
Assessment of quality
We assessed all relevant trials to evaluate and record potential
sources of bias using recognised methods (Cochrane 2011; Hayden
2006). This included assessment of quality of randomisation pro-
cedure, concealment of treatment allocation and blinding of par-
ticipants.
Analysis
We considered study characteristics such as population, time to
enrolment and length of follow up in the analysis and grouped
studies based on these characteristics.
For the purpose of the outcome institutionalisation, we combined
the presence of the patient in a care home, a hospital ward or long-
term institutional care to avoid differences in outcomes related
to the healthcare system of the country in which the trial was
conducted. Only those discharged to their own home (rather than
residential care, etc.) were classified as at home.
The original intention in the protocol was to use a primary out-
come of independent survival. This combined outcome is the in-
verse of death, institutionalisation or disability together and might
be defined as the odds of someone surviving in the community
without being dependent. It was not possible to measure this as
many studies that reported disability did not report this separate
to institutionalisation. For this reason it was not possible to ex-
clude double-counting. Thus we performed the analysis using the
primary outcome ’living at home’ (the inverse of death or institu-
tionalisation) or the odds of a patient being alive and in their own
home at a defined time point.
Outcome measures were dichotomous, ordinal and continuous.
Many of the outcome scales were ordinal and where necessary,
we converted these to dichotomous data (e.g. in the calculation
of dependency). Results are presented separately for ’wards’ and
’teams’ for each domain of outcome and where it was possible to
dichotomise data, we calculated odds ratios and 95% confidence
intervals for each study and presented the results for each sub-
group. Where significant heterogeneity existed we applied a het-
erogeneity (I2 statistic) threshold of 70% as the level at which data
would not be pooled for analysis. No meta-analysis was performed
where grossly differing outcome measures precluded combination.
Where it was not possible to dichotomise the data, or continuous
scales were used, we attempted meta-analysis using weighted mean
differences. Results are presented with numbers needed to treat
where results are statistically significant, however it must be noted
that these must be interpreted as representing a pooled result and
will be dependent on the control event rate.
Subgroup interaction is reported only where the results of overall
analysis are significant and the differences between subgroups are
also statistically significant.
R E S U L T S
Description of studies
See: Characteristics of included studies; Characteristics of excluded
studies.
(See also Characteristics of included studies; Characteristics of
excluded studies).
We retrieved a total of 28,843 titles (search date April 2010, Figure
2). We reviewed 170 abstracts and selected 48 papers for full-
text screening. We excluded 26 studies. Eleven studies did not use
randomised controlled trial methodology (Boult 1994; Campion
1983; Gayton 1987; Hogan 1990; Ledesert 1994; Liem 1986;
Meissner 1989; Miller 1996; Mudge 2006; Reuben 1992). We
identified no cluster-randomised controlled trials. Six studies eval-
uated CGA in an outpatient or elective setting (Cunliffe 2004;
5Comprehensive geriatric assessment for older adults admitted to hospital (Review)
Copyright © 2011 The Cochrane Collaboration. Published by John Wiley & Sons, Ltd.

Epstein 1990; Gill 2003; Karppi 1995; Rubin 1992; Trentini
2001). Three studies compared postacute organised (CGA care)
with acute organised (CGA) care (Fleming 2004; Garåsen 2007;
Young 2005). Three studies evaluated organised (CGA) care for
subgroups of patients (e.g. dementia - Cole 1991; Volicer 1994;
cancer - Retornaz 2007). Two trials evaluated CGA teams prior to
patient transfer to CGA wards (Germain 1995; Harari 2007). One
trial evaluated a different multidisciplinary method of working
within a CGA environment (Landi 1997). We identified 22 rel-
evant randomised controlled trials giving information on 10,315
participants across six countries.
6Comprehensive geriatric assessment for older adults admitted to hospital (Review)
Copyright © 2011 The Cochrane Collaboration. Published by John Wiley & Sons, Ltd.
Figure 2.
7Comprehensive geriatric assessment for older adults admitted to hospital (Review)
Copyright © 2011 The Cochrane Collaboration. Published by John Wiley & Sons, Ltd.
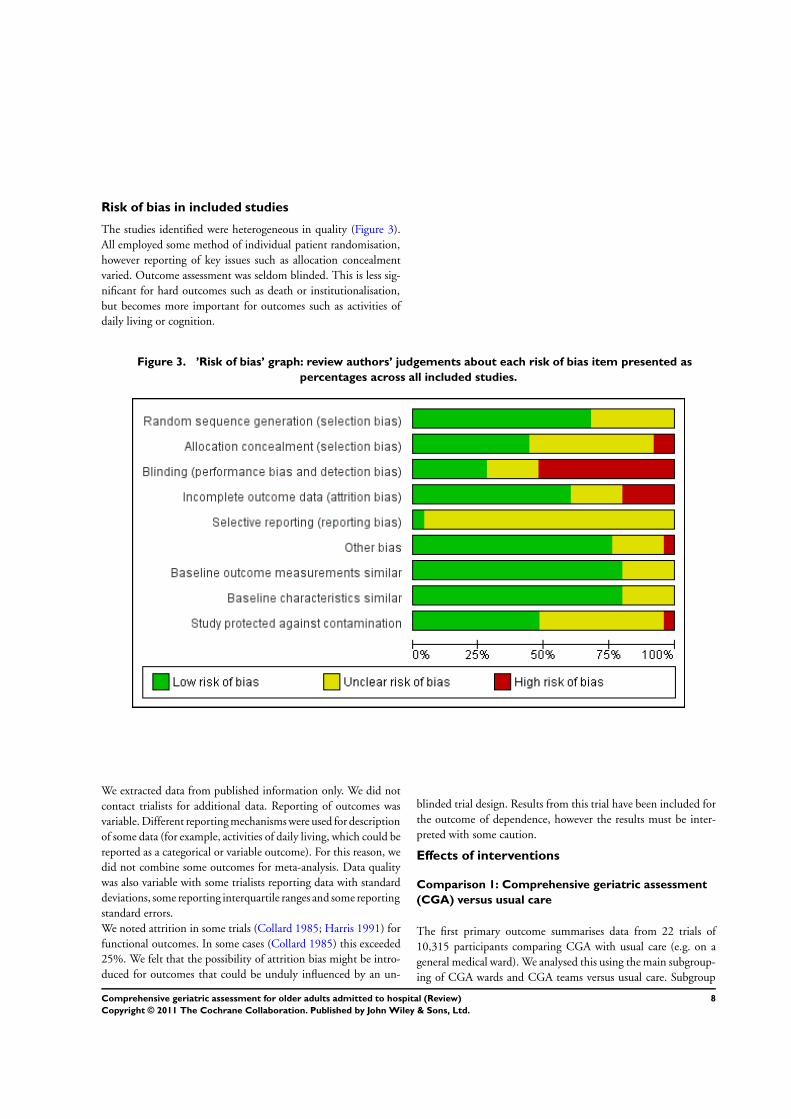
Risk of bias in included studies
The studies identified were heterogeneous in quality (Figure 3).
All employed some method of individual patient randomisation,
however reporting of key issues such as allocation concealment
varied. Outcome assessment was seldom blinded. This is less sig-
nificant for hard outcomes such as death or institutionalisation,
but becomes more important for outcomes such as activities of
daily living or cognition.
Figure 3. ’Risk of bias’ graph: review authors’ judgements about each risk of bias item presented as
percentages across all included studies.
We extracted data from published information only. We did not
contact trialists for additional data. Reporting of outcomes was
variable. Different reporting mechanisms were used for description
of some data (for example, activities of daily living, which could be
reported as a categorical or variable outcome). For this reason, we
did not combine some outcomes for meta-analysis. Data quality
was also variable with some trialists reporting data with standard
deviations, some reporting interquartile ranges and some reporting
standard errors.
We noted attrition in some trials (Collard 1985; Harris 1991) for
functional outcomes. In some cases (Collard 1985) this exceeded
25%. We felt that the possibility of attrition bias might be intro-
duced for outcomes that could be unduly influenced by an un-
blinded trial design. Results from this trial have been included for
the outcome of dependence, however the results must be inter-
preted with some caution.
Effects of interventions
Comparison 1: Comprehensive geriatric assessment
(CGA) versus usual care
The first primary outcome summarises data from 22 trials of
10,315 participants comparing CGA with usual care (e.g. on a
general medical ward). We analysed this using the main subgroup-
ing of CGA wards and CGA teams versus usual care. Subgroup
8Comprehensive geriatric assessment for older adults admitted to hospital (Review)
Copyright © 2011 The Cochrane Collaboration. Published by John Wiley & Sons, Ltd.
results are only reported where significant subgroup interaction
exists.
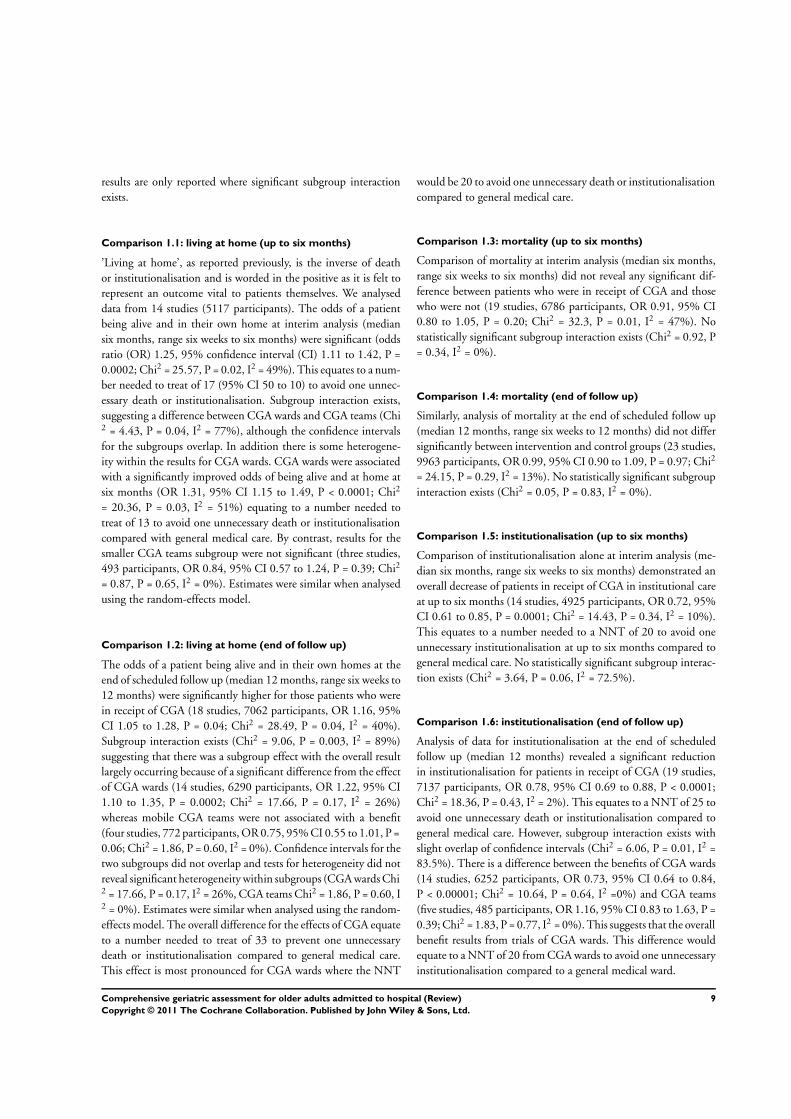
Comparison 1.1: living at home (up to six months)
’Living at home’, as reported previously, is the inverse of death
or institutionalisation and is worded in the positive as it is felt to
represent an outcome vital to patients themselves. We analysed
data from 14 studies (5117 participants). The odds of a patient
being alive and in their own home at interim analysis (median
six months, range six weeks to six months) were significant (odds
ratio (OR) 1.25, 95% confidence interval (CI) 1.11 to 1.42, P =
0.0002; Chi2 = 25.57, P = 0.02, I2 = 49%). This equates to a num-
ber needed to treat of 17 (95% CI 50 to 10) to avoid one unnec-
essary death or institutionalisation. Subgroup interaction exists,
suggesting a difference between CGA wards and CGA teams (Chi2 = 4.43, P = 0.04, I2 = 77%), although the confidence intervals
for the subgroups overlap. In addition there is some heterogene-
ity within the results for CGA wards. CGA wards were associated
with a significantly improved odds of being alive and at home at
six months (OR 1.31, 95% CI 1.15 to 1.49, P < 0.0001; Chi2
= 20.36, P = 0.03, I2 = 51%) equating to a number needed to
treat of 13 to avoid one unnecessary death or institutionalisation
compared with general medical care. By contrast, results for the
smaller CGA teams subgroup were not significant (three studies,
493 participants, OR 0.84, 95% CI 0.57 to 1.24, P = 0.39; Chi2
= 0.87, P = 0.65, I2 = 0%). Estimates were similar when analysed
using the random-effects model.
Comparison 1.2: living at home (end of follow up)
The odds of a patient being alive and in their own homes at the
end of scheduled follow up (median 12 months, range six weeks to
12 months) were significantly higher for those patients who were
in receipt of CGA (18 studies, 7062 participants, OR 1.16, 95%
CI 1.05 to 1.28, P = 0.04; Chi2 = 28.49, P = 0.04, I2 = 40%).
Subgroup interaction exists (Chi2 = 9.06, P = 0.003, I2 = 89%)
suggesting that there was a subgroup effect with the overall result
largely occurring because of a significant difference from the effect
of CGA wards (14 studies, 6290 participants, OR 1.22, 95% CI
1.10 to 1.35, P = 0.0002; Chi2 = 17.66, P = 0.17, I2 = 26%)
whereas mobile CGA teams were not associated with a benefit
(four studies, 772 participants, OR 0.75, 95% CI 0.55 to 1.01, P =
0.06; Chi2 = 1.86, P = 0.60, I2 = 0%). Confidence intervals for the
two subgroups did not overlap and tests for heterogeneity did not
reveal significant heterogeneity within subgroups (CGA wards Chi2 = 17.66, P = 0.17, I2 = 26%, CGA teams Chi2 = 1.86, P = 0.60, I2 = 0%). Estimates were similar when analysed using the random-
effects model. The overall difference for the effects of CGA equate
to a number needed to treat of 33 to prevent one unnecessary
death or institutionalisation compared to general medical care.
This effect is most pronounced for CGA wards where the NNT
would be 20 to avoid one unnecessary death or institutionalisation
compared to general medical care.
Comparison 1.3: mortality (up to six months)
Comparison of mortality at interim analysis (median six months,
range six weeks to six months) did not reveal any significant dif-
ference between patients who were in receipt of CGA and those
who were not (19 studies, 6786 participants, OR 0.91, 95% CI
0.80 to 1.05, P = 0.20; Chi2 = 32.3, P = 0.01, I2 = 47%). No
statistically significant subgroup interaction exists (Chi2 = 0.92, P
= 0.34, I2 = 0%).
Comparison 1.4: mortality (end of follow up)
Similarly, analysis of mortality at the end of scheduled follow up
(median 12 months, range six weeks to 12 months) did not differ
significantly between intervention and control groups (23 studies,
9963 participants, OR 0.99, 95% CI 0.90 to 1.09, P = 0.97; Chi2
= 24.15, P = 0.29, I2 = 13%). No statistically significant subgroup
interaction exists (Chi2 = 0.05, P = 0.83, I2 = 0%).
Comparison 1.5: institutionalisation (up to six months)
Comparison of institutionalisation alone at interim analysis (me-
dian six months, range six weeks to six months) demonstrated an
overall decrease of patients in receipt of CGA in institutional care
at up to six months (14 studies, 4925 participants, OR 0.72, 95%
CI 0.61 to 0.85, P = 0.0001; Chi2 = 14.43, P = 0.34, I2 = 10%).
This equates to a number needed to a NNT of 20 to avoid one
unnecessary institutionalisation at up to six months compared to
general medical care. No statistically significant subgroup interac-
tion exists (Chi2 = 3.64, P = 0.06, I2 = 72.5%).
Comparison 1.6: institutionalisation (end of follow up)
Analysis of data for institutionalisation at the end of scheduled
follow up (median 12 months) revealed a significant reduction
in institutionalisation for patients in receipt of CGA (19 studies,
7137 participants, OR 0.78, 95% CI 0.69 to 0.88, P < 0.0001;
Chi2 = 18.36, P = 0.43, I2 = 2%). This equates to a NNT of 25 to
avoid one unnecessary death or institutionalisation compared to
general medical care. However, subgroup interaction exists with
slight overlap of confidence intervals (Chi2 = 6.06, P = 0.01, I2 =
83.5%). There is a difference between the benefits of CGA wards
(14 studies, 6252 participants, OR 0.73, 95% CI 0.64 to 0.84,
P < 0.00001; Chi2 = 10.64, P = 0.64, I2 =0%) and CGA teams
(five studies, 485 participants, OR 1.16, 95% CI 0.83 to 1.63, P =
0.39; Chi2 = 1.83, P = 0.77, I2 = 0%). This suggests that the overall
benefit results from trials of CGA wards. This difference would
equate to a NNT of 20 from CGA wards to avoid one unnecessary
institutionalisation compared to a general medical ward.
9Comprehensive geriatric assessment for older adults admitted to hospital (Review)
Copyright © 2011 The Cochrane Collaboration. Published by John Wiley & Sons, Ltd.
Comparison 1.7: dependence
Eight studies (4128 participants) reported data on dependence. All
of the studies tested CGA wards. No usable dependence data were
recorded for CGA teams. There was no statistically significant dif-
ference between intervention and control groups for the outcome
of dependence (OR 0.94, 95% CI 0.81 to 1.10, P = 0.44; Chi2 =
9.68, P = 0.21, I2 = 28%). Trial data from one trial (Collard 1985)
have been included despite a significant dropout rate for this one
outcome. The results must be interpreted with caution. Analysis
without results for this trial does not alter the result significantly
(seven studies, 3669 participants, OR 0.89, 95% CI 0.76 to 1.06,
P = 0.19; Chi2 = 7.40, P = 0.29, I2 = 19%).
Comparison 1.8: death or dependence
There was no significant difference for the outcome of death or
dependence (three studies, 1212 participants, OR 0.98, 95% CI
0.77 to 1.25, P = 0.87; Chi2 = 0.57, P = 0.90, I2 = 0%). No usable
dependence data was recorded for CGA teams.
Comparison 1.9: death or deterioration
Death or deterioration is a combined outcome that looks at both
mortality and functional decline (measured as an increase in de-
pendence). Analysis is combined since a reduction in mortality in
one group may be offset by an increasing dependence in survivors
and so the two need to be considered together.
Analysis of data for the outcome of death or deterioration (five
studies, 2622 participants) revealed a significant reduction in death
or deterioration (OR 0.76, 95% CI 0.64 to 0.90, P = 0.001; Chi2 = 2.81, P = 0.59, I2 = 0%). This equates to a number needed to
treat of 17 to avoid one unnecessary death or deterioration com-
pared to general medical care. No statistically significant subgroup
interaction exists (Chi2 = 0.54, P = 0.46, I2 = 0%) although the
CGA teams subgroup (two studies, 317 participants) is consider-
ably smaller than the CGA wards subgroup (three studies, 2305
participants).
Comparison 1.10: activities of daily living (ADL)
Data for analysis of activities of daily living (ADL) were available
for five studies (1296 participants). The data did not reveal any
significant difference between groups (standardised mean differ-
ence (SMD) 0.06, 95% CI -0.06 to 0.17, P = 0.33; Chi2 = 4.35, P
= 0.50, I2 = 0%). No statistically significant subgroup interaction
exists (Chi2 = 2.05, P = 0.15, I2 = 51.1%).
Comparison 1.11: cognitive function
Data were more limited for this outcome (five studies, 3317 par-
ticipants), but did reveal an overall benefit on cognitive measures
(SMD 0.08, 95% CI 0.01 to 0.15, P = 0.02; Chi2 = 7.65, P =
0.11, I2 = 48%) for patients in receipt of CGA. There was no
statistically significant subgroup interaction (Chi2 0.05, P = 0.83,
I2 0%), although data were only available from one CGA ward
study (375 participants).
Comparison 1.12: length of stay
Length of stay data were analysed for 12 studies (4034 partici-
pants); there was significant heterogeneity (Tau2 = 12.67, Chi2 =
84.50, P < 0.00001, I2 = 86%) and for this reason meta-analysis
was not retained. For the ward subgroup length of stay ranged
from a mean reduction of -9.20 days to 9.00 days more, and for
the team subgroup length of stay ranged from a mean difference
of -0.79 days to an increase of 3.60 days for CGA.
Comparison 1.13: readmissions
No significant difference existed between the groups for the out-
come of re-admission to hospital (nine studies, 3822 participants,
OR 1.03, 95% CI 0.89 to 1.18, P = 0.72; Chi2 = 7.52, P = 0.48,
I2 = 0%). No statistically significant subgroup interaction exists
(Chi2 = 0.75, P = 0.39, I2 = 0%).
Comparison 1.14: resource use
Trials reported the costs of CGA differently and with differing
outcome measures. For this reason, we deemed combining these
costs in a meta-analysis impractical and it ran the risk of provid-
ing an incomplete picture. Instead, we have compiled a table with
the costs quoted by the papers that reported resource use with a
brief explanation of how they were reported Table 1. Most of the
costs reported are those incurred by the trial establishment (i.e.
the hospital) and only rarely have the costs of nursing home care
been taken into consideration. Most of the differences in cost in
the trials are attributed to differences in length of stay or differ-
ences in the type and number of investigations requested between
the intervention and the control group. Some institutions have
described environmental changes necessary to run the trial (e.g.
redecoration, installation of clocks and furnishings etc.) (Counsell
2000). In these cases the costs associated with this work have been
set against the intervention group. This may appear to overesti-
mate the costs of the intervention group. Many of the hospital
costs (although not exclusively) seem to demonstrate a reduction
in cost associated with CGA (Asplund 2000; Cohen 2002; Collard
1985; Counsell 2000; Fretwell 1990; Landefeld 1995; Naughton
1994). Some trials reported greater costs in the treatment group
(Applegate 1990; Hogan 1987). If nursing home costs are taken
into consideration, the potential benefit of CGA may be greater.
The few trials that reported these costs demonstrated reduced costs
in the CGA group (Applegate 1990; Cohen 2002; Nikolaus 1999;
Rubenstein 1984).
10Comprehensive geriatric assessment for older adults admitted to hospital (Review)
Copyright © 2011 The Cochrane Collaboration. Published by John Wiley & Sons, Ltd.
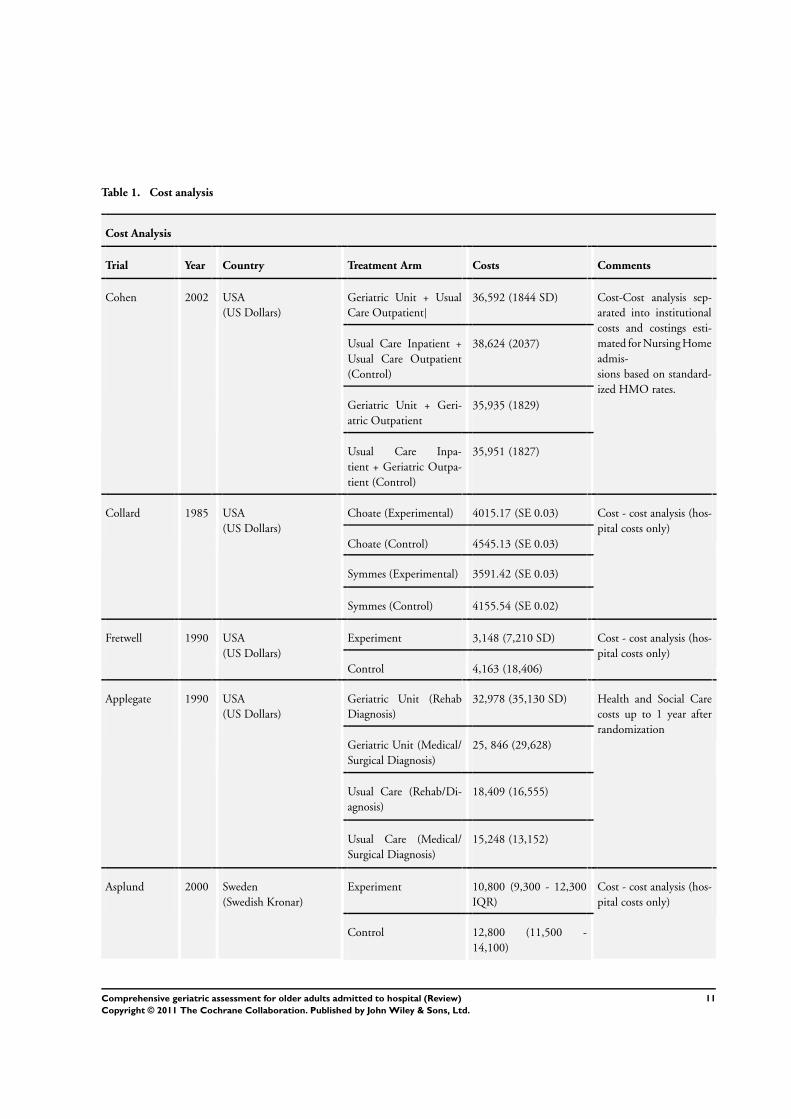
Table 1. Cost analysis
Cost Analysis
Trial Year Country Treatment Arm Costs Comments
Cohen 2002 USA
(US Dollars)
Geriatric Unit + Usual
Care Outpatient|
36,592 (1844 SD) Cost-Cost analysis sep-
arated into institutional
costs and costings esti-
mated for Nursing Home
admis-
sions based on standard-
ized HMO rates.
Usual Care Inpatient +
Usual Care Outpatient
(Control)
38,624 (2037)
Geriatric Unit + Geri-
atric Outpatient
35,935 (1829)
Usual Care Inpa-
tient + Geriatric Outpa-
tient (Control)
35,951 (1827)
Collard 1985 USA
(US Dollars)
Choate (Experimental) 4015.17 (SE 0.03) Cost - cost analysis (hos-
pital costs only)
Choate (Control) 4545.13 (SE 0.03)
Symmes (Experimental) 3591.42 (SE 0.03)
Symmes (Control) 4155.54 (SE 0.02)
Fretwell 1990 USA
(US Dollars)
Experiment 3,148 (7,210 SD) Cost - cost analysis (hos-
pital costs only)
Control 4,163 (18,406)
Applegate 1990 USA
(US Dollars)
Geriatric Unit (Rehab
Diagnosis)
32,978 (35,130 SD) Health and Social Care
costs up to 1 year after
randomization
Geriatric Unit (Medical/
Surgical Diagnosis)
25, 846 (29,628)
Usual Care (Rehab/Di-
agnosis)
18,409 (16,555)
Usual Care (Medical/
Surgical Diagnosis)
15,248 (13,152)
Asplund 2000 Sweden
(Swedish Kronar)
Experiment 10,800 (9,300 - 12,300
IQR)
Cost - cost analysis (hos-
pital costs only)
Control 12,800 (11,500 -
14,100)
11Comprehensive geriatric assessment for older adults admitted to hospital (Review)
Copyright © 2011 The Cochrane Collaboration. Published by John Wiley & Sons, Ltd.
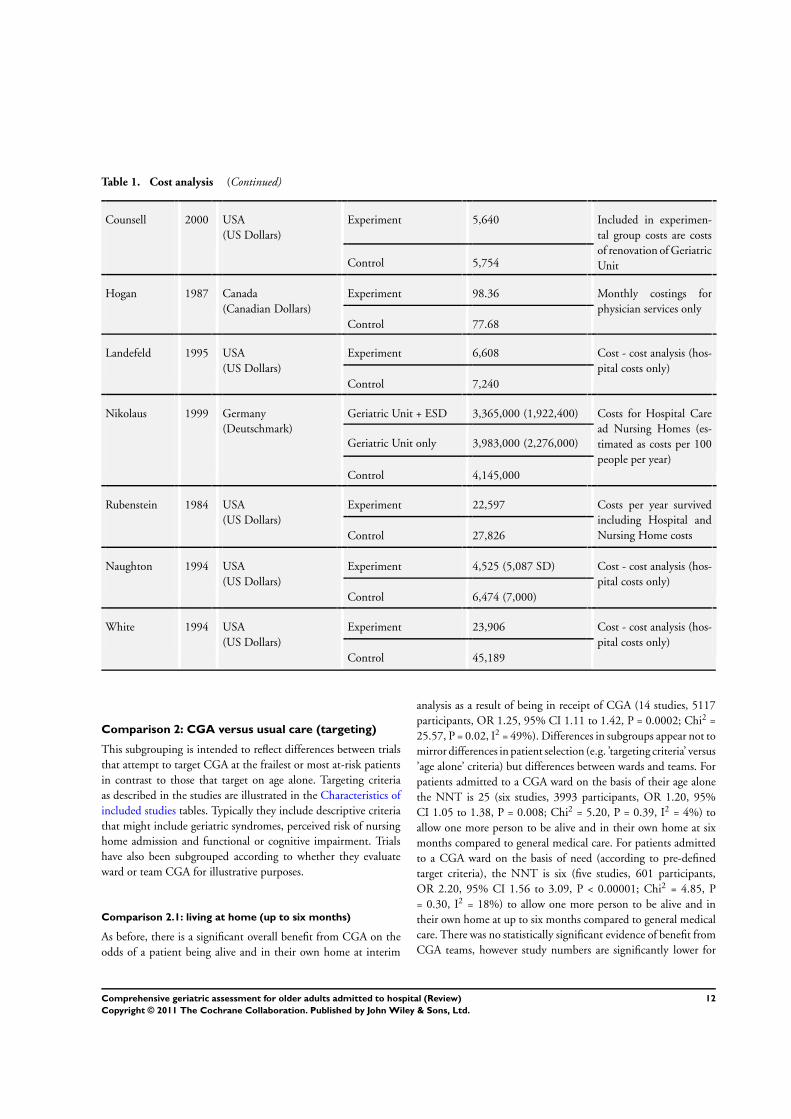
Table 1. Cost analysis (Continued)
Counsell 2000 USA
(US Dollars)
Experiment 5,640 Included in experimen-
tal group costs are costs
of renovation of Geriatric
UnitControl 5,754
Hogan 1987 Canada
(Canadian Dollars)
Experiment 98.36 Monthly costings for
physician services only
Control 77.68
Landefeld 1995 USA
(US Dollars)
Experiment 6,608 Cost - cost analysis (hos-
pital costs only)
Control 7,240
Nikolaus 1999 Germany
(Deutschmark)
Geriatric Unit + ESD 3,365,000 (1,922,400) Costs for Hospital Care
ad Nursing Homes (es-
timated as costs per 100
people per year)
Geriatric Unit only 3,983,000 (2,276,000)
Control 4,145,000
Rubenstein 1984 USA
(US Dollars)
Experiment 22,597 Costs per year survived
including Hospital and
Nursing Home costsControl 27,826
Naughton 1994 USA
(US Dollars)
Experiment 4,525 (5,087 SD) Cost - cost analysis (hos-
pital costs only)
Control 6,474 (7,000)
White 1994 USA
(US Dollars)
Experiment 23,906 Cost - cost analysis (hos-
pital costs only)
Control 45,189
Comparison 2: CGA versus usual care (targeting)
This subgrouping is intended to reflect differences between trials
that attempt to target CGA at the frailest or most at-risk patients
in contrast to those that target on age alone. Targeting criteria
as described in the studies are illustrated in the Characteristics of
included studies tables. Typically they include descriptive criteria
that might include geriatric syndromes, perceived risk of nursing
home admission and functional or cognitive impairment. Trials
have also been subgrouped according to whether they evaluate
ward or team CGA for illustrative purposes.
Comparison 2.1: living at home (up to six months)
As before, there is a significant overall benefit from CGA on the
odds of a patient being alive and in their own home at interim
analysis as a result of being in receipt of CGA (14 studies, 5117
participants, OR 1.25, 95% CI 1.11 to 1.42, P = 0.0002; Chi2 =
25.57, P = 0.02, I2 = 49%). Differences in subgroups appear not to
mirror differences in patient selection (e.g. ’targeting criteria’ versus
’age alone’ criteria) but differences between wards and teams. For
patients admitted to a CGA ward on the basis of their age alone
the NNT is 25 (six studies, 3993 participants, OR 1.20, 95%
CI 1.05 to 1.38, P = 0.008; Chi2 = 5.20, P = 0.39, I2 = 4%) to
allow one more person to be alive and in their own home at six
months compared to general medical care. For patients admitted
to a CGA ward on the basis of need (according to pre-defined
target criteria), the NNT is six (five studies, 601 participants,
OR 2.20, 95% CI 1.56 to 3.09, P < 0.00001; Chi2 = 4.85, P
= 0.30, I2 = 18%) to allow one more person to be alive and in
their own home at up to six months compared to general medical
care. There was no statistically significant evidence of benefit from
CGA teams, however study numbers are significantly lower for
12Comprehensive geriatric assessment for older adults admitted to hospital (Review)
Copyright © 2011 The Cochrane Collaboration. Published by John Wiley & Sons, Ltd.

these subgroups (teams with needs-related admission criteria, one
study, 197 participants, OR 0.71, 95% CI 0.38 to 1.33, P = 0.29)
and teams with age-related admission criteria (two studies, 296
participants, OR 0.94, 95% CI 0.57 to 1.55, P = 0.80; Chi2 =
0.41, P = 0.52, I2 = 0%) and this may represent under-powering.
Comparison 2.2: living at home (end of follow up)
Analysis of the subgroups for the odds of a patient being alive and
in their own home at the end of scheduled follow up (median
12 months) shows as before an improved outcome for patients
in receipt of CGA (18 studies, 7062 participants, OR 1.16, 95%
CI 1.05 to 1.28, P = 0.003; Chi2 = 28.49, P = 0.04, I2 = 40%).
As above, differences in subgroups appear to mirror differences
between wards and teams rather than differences in patient selec-
tion (e.g. ’targeting criteria’ versus ’age alone’ criteria). For patients
admitted to a CGA ward on the basis of need, the NNT would
be 13 (nine studies, 2564 participants, OR 1.36, 95% CI 1.16
to 1.60, P = 0.0001; Chi2 = 7.88, P = 0.44, I2 = 0%) to allow
one more patient to be alive and in their own home at the end of
follow up compared to a general medical ward. Earlier differences
in the odds of a patient being alive and at home for wards that
had ’age only’ admission criteria become non-significant at final
follow up, OR 1.13, 95% CI 0.98 to 1.29, P = 0.09; Chi2 = 6.58,
P = 0.16, I2 = 39%. There was no benefit on the odds of patients
being alive and in their own homes for CGA teams that used ’age
alone’ criteria (two studies, 296 participants, OR 0.74, 95% CI
0.45 to 1.20, P = 0.22; Chi2 = 1.70, P = 0.19, I2 = 41%) or those
that assessed according to predefined ’need’ (OR 0.75, 95% CI
.051 to 1.11, P = 0.15; Chi2 = 0.16, P = 0.69, I2 = 0%), but again
the numbers were significantly smaller in these subgroups and the
possibility exists of under powering for these subgroups.
Comparison 3: CGA versus usual care (timing of
admission)
We trichotomised trials into three distinct groups depending on
the timing of their intervention (whether admission to a CGA
ward or review by a CGA team). We analysed trials according
to whether they admitted directly from the Emergency Depart-
ment (’direct’), whether they admitted within 72 hours (’acute’)
or whether they admitted after this time (e.g. ’stepdown’).
Comparison 3.1: living at home (up to six months)
As before, there remains a significant benefit in the odds of be-
ing alive and in their own homes at interim analysis (median six
months) for patients in receipt of CGA (14 studies, 5117 partici-
pants, OR 1.25, 95% CI 1.11 to 1.42, P = 0.0002; Chi2 = 25.57,
P = 0.02, I2 = 49%). No statistically significant pattern emerged
between CGA by direct admission or stepdown admission. Previ-
ous differences remained between wards and teams. No data were
available for trials of acute admission CGA wards for this outcome.
Comparison 3.2: living at home (end of follow up)
Similarly, as before, the odds of a patient remaining alive and in
their own home at the end of scheduled follow up (median 12
months) remain significant (OR 1.16, 95% CI 1.05 to 1.28, P =
0.003; Chi2 = 28.49, P = 0.04, I2 = 40%). Significant differences
did not emerge in relation to the timing of CGA. The differences
observed between wards and teams remains. Interestingly, there is
an overlap between the use of admissions criteria and the timing
of assessment or admission to CGA. Trials of CGA wards that ad-
mitted direct from the Emergency Department used age criteria
alone. Trials of CGA wards that admitted in a stepdown fashion
(72 hours or more after admission) tended to have targeted admis-
sion/assessment criteria with the exception of one trial of a CGA
ward (Shamian 1984) based on age criteria alone that admitted
in the postacute phase. CGA assessment teams were less markedly
divided in the under 72 hour (’acute’) setting. Nevertheless, no
significant pattern emerges except the distinction between wards
and teams as before.
Comparison 4: CGA versus usual care (outpatient
follow up)
Outpatient follow up is suggested to be one of the key aspects of
CGA that benefits patients longer-term after their admission to
hospital as an emergency (Stuck 1993). We divided studies ac-
cording to whether they provided outpatient follow up or not,
including one study (Cohen 2002) that created subgroups in or-
der to test this hypothesis. A number of trials did not describe
explicit arrangements for CGA follow up and therefore could not
be categorised (Asplund 2000; Harris 1991; Hogan 1987; Kay
1992; Landefeld 1995; McVey 1989; Powell 1990; Thomas 1993).
There is therefore a risk that the results are not representative.
Comparison 4.1: living at home (up to six months)
There was significant heterogeneity when studies were combined
for this outcome (nine studies, 3542 participants, Chi2 = 21.93, P
= 0.005, I2 = 64%, range OR 4.33 to OR 0.71) and this becomes
more marked in the group with no outpatient follow up (Chi2 =
11.71, P = 0.008, I2 = 74%, range OR 4.33 to OR 0.71) and less
marked for the group with outpatient follow up (Chi2 = 6.46, P
= 0.17, I2 = 38%, range OR 1.02 to OR 2.37). For this reason,
meta-analysis has not been retained.
Comparison 4.2: living at home (end of follow up)
Similarly, no significant subgroup effect exists for the analysis of
outpatient follow up on the primary outcome, living at home at
the end of scheduled follow up (14 studies, 5754 participants, OR
1.17, 95% CI 1.05 to 1.30, P = 0.005; Chi2 = 22.23, P = 0.05, I2 =
42%). There was no statistically significant subgroup interaction,
however there was some heterogeneity within the ’no follow up’
group (Chi2 = 12.78, P = 0.05 I2 = 53%).
13Comprehensive geriatric assessment for older adults admitted to hospital (Review)
Copyright © 2011 The Cochrane Collaboration. Published by John Wiley & Sons, Ltd.

D I S C U S S I O N
Main analysis
This review investigates whether specialist, organised and co-or-
dinated geriatric care (normally referred to as comprehensive geri-
atric assessment or CGA) is effective in delivering better patient
outcomes than conventional care in a hospital setting.
There are some limitations to this meta-analysis. Firstly, for certain
outcomes in particular (e.g. living at home (up to six months))
there are differences in the size of the subgroups, with the smaller
subgroups (CGA teams) showing a non-significant result. The
possibility exists that these results represent under-powering in one
subgroup. Similarly for the analysis of cognition, data were only
available for one study in the CGA ward subgroup. Secondly, these
trials span a significant time period and a number of healthcare
settings. This does not preclude comparisons of complex interven-
tions (SUTC 2007) but may explain the heterogeneity that arises
when trying to compare lengths of stay.
Despite these limitations, there appears to be a clear and significant
improvement in the odds of a patient being alive and in their
own home if they receive CGA. This effect is consistently seen
from trials of geriatric wards and is not so clearly seen for geriatric
teams although it should be noted these subgroups are smaller.
As a consequence, whilst it is possible to conclude that CGA is
beneficial, the benefits appear to arise predominantly from trials
of geriatric wards.
This effect is very similar to the differences observed between
stroke wards and stroke teams (Evans 2001; SUTC 2007) and may
have multiple explanations. Firstly, a dedicated ward with more
time focused exclusively on older peoples’ care allows greater learn-
ing within the team, fostering the development of greater skills and
expertise. In addition, working in close proximity as a team allows
more efficient and effective multidisciplinary working and team-
building. Secondly, mobile teams often find it difficult to modify
the behaviour of other health professionals directly involved in the
patient’s care. As a consequence, recommendations for treatment
and therapy are not always carried through (Allen 1986) and hav-
ing control over this process seems to lead to a better outcome.
There is evidence that specialisation within the ward team (for ex-
ample, medical, physiotherapy and occupational therapy) is criti-
cal to the successful multidisciplinary team outcome and this may
be especially true in relation to gerontological nursing (Pound
1999). As with stroke wards, the role of nursing in delivering direct
care 24 hours a day may be critical to the success of care and can
include both the avoidance of complications and the creation of an
enabling therapeutic environment (Langhorne 2005). In addition
nursing staff are often the primary point of contact for communi-
cating with family members and patients and this may be key to
goal setting or discharge planning.
Other factors that appear to benefit discrete units include the de-
velopment of protocols of care for the management of key con-
ditions, which can be implemented and acted on with a higher
degree of consistency. Discharge-planning or goal-setting may be
better co-ordinated in a dedicated ward area that is able to enact
its own recommendations. Finally, a modified ward environment
more suitable for the promotion of independence or reducing the
risk of delirium is also important.
A summary of the key processes and staff in each study is provided
in Figure 1.
Analysis of the primary endpoint (’living at home’) at up to six
months as well as at the end of follow up might be deemed by some
to be an unnecessary distinction. Analysis at multiple time points
for the same outcome can risk over-representation of results. The
results are presented here without correction for multiple analysis.
It could be argued that improvements in final outcome (at one
year) could mask longer or higher rates of institutional care in
the short term (at up to six months). Patients might consider this
to be a high price to pay. Differences at up to six months might
reflect differences in clinical care for patients who are likely in some
instances to have extended lengths of stay, whereas differences in
outcomes at one year (or the end of scheduled follow up) are likely
to reflect differences in real clinical outcomes from organised care.
In a group with a high mortality rate, both time scales might be
considered important.
The evaluation spans trials in different healthcare systems across
different countries. Thus, rates of institutionalisation may vary
across different healthcare settings. Nevertheless, randomisation
makes comparisons within the same healthcare setting, and there-
fore reductions (for example in institutionalisation) can be trusted
to represent different patient outcomes derived from CGA itself.
Analysis of length of stay is complex for this patient group given
that a patient’s length of stay may span more than one ward or
institutional move. Wide variation in length of stay figures between
studies may reflect organisational differences, and because of this
heterogeneity firm conclusions cannot be safely drawn, requiring
further research.
Subgroup analysis
Comparison 2: targeting
We conducted comparison between inclusion criteria in order to
provide clarity over the question of who is appropriate for CGA.
The simplest method of dichotomising the data is to group trials
according to those that prioritise patients on the basis of ’age alone’
and those that include on the basis of ’need’ (defined as age plus a
number of specific criteria) as illustrated in the ’Characteristics of
included studies’ tables. These needs-related criteria are generally
descriptive, including classic geriatric presentations (falls, delir-
ium etc.) and some consideration of ’at risk’ criteria (such as func-
tional impairment or risk of nursing home admission). Analysis is
presented in wards and teams because these are intuitively sepa-
rate and subgroup interaction exists between these two subgroups.
14Comprehensive geriatric assessment for older adults admitted to hospital (Review)
Copyright © 2011 The Cochrane Collaboration. Published by John Wiley & Sons, Ltd.

Again, analysis suggested that where subgroup interaction exists,
it is between wards and teams. Both geriatric wards that admit
patients on an age-related basis and those that admit on a needs-
related basis appear to result in improved outcomes. Similarly, the
teams that reviewed patients on an age-only basis and those that
reviewed on a needs-related basis did not significantly benefit pa-
tient care.
Comparison 3: timing of admission
Analysis by timing of admission was felt to be appropriate given
that, traditionally, many feel that the appropriate place for CGA
is after an acute illness has settled (in a postacute setting). Trials of
acute geriatric wards (sometimes called ACE Units) demonstrate
improved patient outcomes when compared to general medical
settings at up to six months. Direct comparison between acute
geriatric wards and postacute wards is not possible from this anal-
ysis. In addition, the consistent subgroup heterogeneity that exists
is between geriatric wards and geriatric teams. Further, the trials
of acute geriatric wards and postacute geriatric wards (sometimes
called Geriatric Evaluation and Management Units) in this anal-
ysis differ in their admission criteria. Trials evaluating direct ad-
mission from the Emergency Department all have an ’age-related’
admission criteria whereas trials evaluating postacute care all have
’needs-related’ criteria (the exception being Shamian 1984) where
no outcome data were available for the primary endpoint. This
makes comparison difficult. It may be that the optimal model of
CGA for hospitals includes both acute and postacute models.
Comparison 4: outpatient follow up
Follow up of elderly patients discharged from the acute hospital
setting has been cited as a key part of CGA. Despite this, we
could not find a clear indication of a link between the presence
of outpatient follow up and an improved outcome. It should be
noted, however, that a number of studies were not clear in their
published information as to whether they included CGA follow
up. For this reason the results may be incomplete. In addition there
was significant heterogeneity for the outcome of living at home at
up to six months. Accepting these limitations means that caution
must be exercised about any conclusions; the available data do not
suggest a definite relationship.
Costs and benefits
Analysis of costs was conducted in a number of trials. Differences
in reporting mechanisms meant that meta-analysis was not at-
tempted. However, these costs analyses have been set out in Table
1. Precise costs will not be reflective of current healthcare costs (de-
pending on when they were reported), nevertheless, inter-patient
costs are relevant. Reporting mechanisms varied depending on
whether the healthcare organisation also billed for nursing home
care. Most chose to report direct costs to the host organisation
(hospital costs). For this reason, gains in nursing home avoidance
and reduced dependence on paid support were not included in
most analyses. Despite this, most trials reported equitable or cost-
effective care from CGA in a hospital setting. Most of the vari-
ability on costs described was from differences in length of stay,
multidisciplinary staff costs, prescribing or variations in diagnostic
test requests.
Further economic evaluation is worthwhile considering the demo-
graphic changes and potential societal costs from healthcare for an
ageing population.
A U T H O R S ’ C O N C L U S I O N S
Implications for practice
More older patients are likely to survive and return home if they
receive comprehensive geriatric assessment (CGA) whilst an in-
patient. Fewer will suffer death or deterioration. These effects are
consistently demonstrated from trials of geriatric wards, but not
replicated from trials of mobile peripatetic geriatric consultation
teams on general wards although trial and participant numbers
are much lower for this subgroup. CGA also appears to result in
improved cognitive functioning.
Timing of admission is less critical than place of admission and
there is evidence of benefit from trials recruiting in the acute
stage (admission from the Emergency Department) through to
the postacute stage (step down rehabilitation wards). The benefit
of CGA is adequate to justify the reorganisation of services where
possible. This does not appear to result in increased costs to hos-
pitals and from a societal standpoint appears to result in potential
cost reductions. Systems evaluating compliance with best care are
required to ensure healthcare providers are accountable for the de-
livery of in-hospital CGA for this growing sector of society.
Implications for research
Further evaluation of CGA teams in isolation seems difficult to
justify, although due to the possibility that CGA team subgroups in
the analysis are under-powered, the potential benefit of these forms
of CGA cannot be entirely ruled out. Comparisons of different
forms of CGA with each other seems reasonable (e.g. ward versus
teams) but comparisons with usual care seem difficult to justify.
Whilst the question of where patients should be treated appears
relatively clear, the question of ’who’ should optimally be treated
with CGA remains. We have attempted in this analysis to compare
trials that have treated ’all comers’ over a certain age from those
who have tried to differentiate patients on the basis of a need (e.g.
classic geriatric syndromes, functional impairment etc.). Consis-
tent objective and reproducible methods of identifying those most
appropriate for CGA do not exist at present.
15Comprehensive geriatric assessment for older adults admitted to hospital (Review)
Copyright © 2011 The Cochrane Collaboration. Published by John Wiley & Sons, Ltd.
Comparison between admission in the acute setting to CGA wards
and in the postacute setting is not possible with existing trials.
Questions remain as to when patients should be optimally treated.
The evidence across the spectrum of the patient journey appears to
point to a benefit from CGA and some may feel that this question
is irrelevant. It would appear necessary for healthcare organisations
to justify their provision of adequate geriatric beds both in the
acute and stepdown settings. Further delineating the roles of acute
and stepdown models of CGA would be justified.
Further evaluation of these remaining questions is warranted. The
contact author would be happy to hear from trialists addressing
these questions or further trials of in-hospital CGA.
A C K N O W L E D G E M E N T S
The authors would like to acknowledge the patient help and sup-
port of the Cochrane Effective Practice and Organisation of Care
(EPOC) editorial group. Cochrane Effective Practice and Organi-
sation of Care (EPOC) editorial group. We would like to acknowl-
edge the peer review contribution from Pierre Durieux, Stephen
Chalcroft, Sasha Shepperd and Craig Ramsay.
R E F E R E N C E S
References to studies included in this review
Applegate 1990 {published data only}
Applegate WB, Miller ST, Graney MJ, Elam JT, Burns R,
Akins DE. A randomized, controlled trial of a geriatric
assessment unit in a community rehabilitation hospital.
New England Journal of Medicine 1990;322:1572–8.
Miller ST, Applegate WB, Elam JT, Graney MJ. Influence
of diagnostic classification on outcomes and charges in
geriatric assessment and rehabilitation. Journal of the
American Geriatrics Society 1994;42:11–5.
Asplund 2000 {published data only}
Asplund K, Gustafsen Y, Jacobsson C, Bucht G, Wahlin A,
Peterson J, et al.Geriatric-based versus general wards for
older acute medical patients: a randomised comparison
of outcomes and use of resources. Journal of the American
Geriatrics Society 2000;48:1381–8.
Cohen 2002 {published data only}
Cohen HJ, Feussner JR, Weinberger M, Carnes M, Hamdy
RC, Hseih F, et al.A controlled trial of inpatient and
outpatient geriatric evaluation and management. New
England Journal of Medicine 2002;346:905–12.
Phibbs CS, Holty JEC, Goldstein MK, Garber AM, Wang
Y, Feussner JR, et al.The effect of geriatrics evaluation and
management on nursing home use and health care costs.
Results from a randomised trial. Medical Care 2006;44(1):
91–5.
Cohen 2002 GEMC {published data only}∗ Cohen HJ, Feussner JR, Weinberger M, Carnes M,
Hamdy RC, Hsieh F, et al.A controlled trial of inpatient
and outpatient geriatric evaluation and management. New
England Journal of Medicine 2002;346:905–12.
Cohen 2002 UCOP {published data only}∗ Cohen HJ, Feussner JR, Weinberger M, Carnes M,
Hamdy RC, Hsieh F, et al.A controlled trial of inpatient
and outpatient geriatric evaluation and management. New
England Journal of Medicine 2002;346:905–12.
Collard 1985 {published data only}
Bachman SS, Collard AF, Greenberg JN, Fountain E,
Huebner TW, Kimball B, et al.An innovative approach
to geriatric acute care delivery: the Choate-Symmes
experience. Hospital & Health Services Administration 1987;
November:509–20.
Collard AF, Bachman SS, Beatrice DF. Acute care delivery
for the geriatric patient: an innovative approach. Quarterly
Review Bulletin 1985;June:180–5.
Counsell 2000 {published data only}
Counsell SR, Holder CM, Liebenauer LL, Palmer
RM, Fortinsky RH, Kresevic DM, et al.Effects of a
multicomponent intervention on functional outcomes
and process of care in hospitalised older patients: a
randomised controlled trial of acute care for elders (ACE)
in a community hospital. Journal of the American Geriatrics
Society 2000;48:1572–81.
Fretwell 1990 {published data only}
Fretwell MD, Raymond PM, McGarvey ST, Owens N,
Traines M, Silliman RA, et al.The senior care study. A
controlled trial of a consultative / unit based geriatric
assessment program in acute care. Journal of the American
Geriatrics Society 1990;38:1073–81.
Silliman RA, McGarvey ST, Raymond PM, Fretwell MD.
Senior care study: does inpatient interdisciplinary geriatric
assessment help the family caregivers of acutely ill older
patients?. Journal of the American Geriatrics Society 1990;38
(4):461–6.
Harris 1991 {published data only}
Harris RD, Henschke PJ, Popplewell PY, Radford AJ, Bond
MJ, Turnbull RJ, et al.A randomised study of outcomes
in a defined group of acutely ill elderly patients managed
in a geriatric assessment unit or a general medical unit.
Australian and New Zealand Journal of Medicine 1991;21:
230–4.
Hogan 1987 {published data only}
Hogan DB, Fox RA, Badley BWD, Mann OE. Effect of a
geriatric consultation service on management of patients in
16Comprehensive geriatric assessment for older adults admitted to hospital (Review)
Copyright © 2011 The Cochrane Collaboration. Published by John Wiley & Sons, Ltd.

an acute care hospital. Canadian Medical Association Journal
1987;April:713–7.
Kay 1992 {published data only}
Kay G, MacTavish M, Moffat C, Lau G. Development and
evaluation of a geriatric assessment unit in a community
hospital. Fall 1992;16(3):2–9.
Kircher 2007 {published data only}
Kircher TJ, Wormstall H, Muller PH, Schwarzler F,
Buchkremer G, Wild K, et al.A randomised trial of a
geriatric evaluation and management consultation services
in frail hospitalised patients. Age & Ageing 2007;36:36–42.
[MEDLINE: 932]
Landefeld 1995 {published data only}
Covinsky KE, King JT, Quinn LM, Siddique R, Palmer R,
Kresevic DM, et al.Do acute care for elders units increase
hospital costs? A cost analysis using the hospital perspective.
Journal of the American Geriatrics Society 1997;45:729–34.
[MEDLINE: 941]
Covinsky KE, Palmer R, Kresevic DM, Kahana E, Counsell
C, Fortinsky RH, et al.Improving functional outcomes
in older patients: lessons from an acute care for elders
unit. Journal on Quality Improvement 1998;24(2):63–76.
[MEDLINE: 942]
Landefeld CS, Palmer RM, Krescevic DM, Fortinsky
RH, Kowal J. A randomised trial of care in a hospital
medical unit especially designed to improve the functional
outcomes of acutely ill older patients. New England Journal
of Medicine 1995;332:1338–44.
McVey 1989 {published data only}
Allen CA, Becker PM, McVey LJ, Saltz CC, Feussner
JR, Cohen HJ. A randomized, controlled clinical trial
of a geriatric consultation team. Compliance with
recommendations. JAMA 1986;255(19):2617–21.
[MEDLINE: 929]
Becker PM, McVey LJ, Saltz CC, Feussner JR, Cohen HJ.
Hospital-acquired complications in a randomised controlled
clinical trial of a geriatric consultation team. JAMA 1987;
17:2313–7.
McVey LJ, Becker PM, Saltz CC, Feussner JR, Cohen HJ.
Effect of a geriatric consultation team on functional status
of elderly hospitalized patients. Annals of Internal Medicine
1989;110(1):79–84. [MEDLINE: 927]
Saltz CC, McVey LJ, Becker PM, Feussner JR, Cohen
HJ. Impact of a geriatric consultation team on discharge
placement and repeat hospitalization. The Gerontologist
1988;28(3):344–50. [MEDLINE: 928]
Naughton 1994 {published data only}
Naughton BJ, Moran MB, Feinglass J, Falconer J, Williams
ME. Reducing hospital costs for the geriatric patient
admitted from the emergency department: a randomized
trial. Journal of the American Geriatrics Society 1994;41:
1045–9.
Nikolaus 1999 plus ESD {published data only}
Nikolaus T, Specht-Leible N, Bach M, Oster P, Schuerf G.
A randomised trial of comprehensive geriatric assessment
and home intervention in the care of hospitalised patients.
Age & Ageing 1999;28:543–50.
Nikolaus 1999 Ward {published data only}
Nikolaus T, Specht-Leible N, Bach M, Oster P, Schuerf G.
A randomised trial of comprehensive geriatric assessment
and home intervention in the care of hospitalised patients.
Age & Ageing 1999;28:543–50.
Powell 1990 {published data only}
Powell C, Montgomery P. The age study: the admission of
geriatric patients through emergency. Age & Ageing 1990;
19(Suppl):21–2. [MEDLINE: 933]
Reuben 1995 {published data only}
Reuben DB, Borok GM, Wolde-Tsadik G, Ershoff DH,
Fishman LK, Ambrosini VL, et al.A randomised trial
of comprehensive geriatric assessment in the care of
hospitalised patients. New England Journal of Medicine
1995;332:1345–50.
Rubenstein 1984 {published data only}
Rubenstein LZ, Josephson KR, Harker JO, Miller DK,
Wieland DG. The Sepulveda GEU Study revisited: long-
term outcomes, use of services, and costs. Ageing Clinical &
Experimental Research 1995;7:212–7. [MEDLINE: 936]
Rubenstein LZ, Josephson KR, Wieland DG, English PA,
Sayre JA, Kane RL. Effectiveness of a Geriatric Evaluation
Unit. New England Journal of Medicine 1984;311:1664–70.
[MEDLINE: 935]
Rubenstein LZ, Wieland GD, Josephson KR, Rosbrook
B, Sayre J, Kane RL. Improved survival for frail elderly
inpatients on a geriatric evaluation unit (GEU): who
benefits?. Journal of Clinical Epidemiology 1988;41:441–9.
Saltvedt 2002 {published data only}
Saltvedt I, Jordhoy M, Opdahl Mo ES, Fayers P, Kaasa S,
Sletvold O, et al.Randomised trial of in-hospital geriatric
intervention: impact on function and morale [Sletvold O].
Gerontology 2006;52:223–30.
Saltvedt I, Opdahl Mo ES, Fayers P, Kaasa S, Sletvold
O. Reduced mortality in treating acutely sick, frail older
patients in a geriatric evaluation and management unit.
A prospective randomised trial. Journal of the American
Geriatrics Society 2002;50:792–8.
Saltvedt I, Spigset O, Ruths S, Fayers P, Kaasa S, Sletvold O.
Patterns of drug prescription in a geriatric evaluation and
management unit as compared with the general medical
wards: a randomised study. European Journal of Clinical
Pharmacology 2005;61:921–8.
Satvedt I, Saltnes T, Opdahl Mo ES, Fayers P, Kaasa S,
Sletvold O. Acute geriatric intervention increases the
number of patients able to live at home. A prospective
randomised study. Aging Clinical and Experimental Research
2004;16(4):300–6.
Shamian 1984 {published data only}
Shamian J, Clarfield AM, Maclean J. A randomized trial of
intra-hospital relocation of geriatric patients in a tertiary-
care teaching hospital. Journal of the American Geriatrics
Society 1984;32:794–800. [MEDLINE: 937]
17Comprehensive geriatric assessment for older adults admitted to hospital (Review)
Copyright © 2011 The Cochrane Collaboration. Published by John Wiley & Sons, Ltd.
Thomas 1993 {published data only}
Thomas DR, Brahan R, Haywood BP. Inpatient
community-based geriatric assessment reduces subsequent
mortality. Journal of the American Geriatrics Society 1993;
41:101–4.
White 1994 {published data only}
White SJ, Powers JS, Knight JR, Harrell D, Varnell L,
Vaughn C, et al.Effectiveness of an inpatient geriatric service
in a university hospital. Journal of the Tennessee Medical
Association 1994;87:425–8.
Winograd 1993 {published data only}
Winograd CH, Gerety MB, Lai NA. A negative trial
of inpatient geriatric consultation. Archives of Internal
Medicine 1993;153:2017–23.
References to studies excluded from this review
Borok 1994 {published data only}
Borok GM, Reuben DB, Zendle LJ, Ershoff DH,
Wolde-Tsadik G. Rationale and design of a multi-centre
randomized trial of comprehensive geriatric assessment
consultation for hospitalised patients in an RMO. Journal of
the American Geriatrics Society 1994;42(5):536–44.
Boult 1994 {published data only}
Boult C, Boult L, Murphy C, Ebbitt B, Luptak M.
Controlled trial of outpatient geriatric evaluation and
management. Journal of the American Geriatrics Society
1994;42(5):465–70.
Campion 1983 {published data only}
Campion EW, Jette A, Berkman B. Interdisciplinary
geriatric consultation service: a controlled trial. Journal of
the American Geriatrics Society 1983;31(12):792–6.
Cole 1991 {published data only}
Cole MG, Fenton FR, Engelsmann F, Mansouri I.
Effectiveness of geriatric psychiatry consultation in an acute
care hospital: a randomized clinical trial. Journal of the
American Geriatrics Society 1991;39(12):1183–8.
Cunliffe 2004 {published data only}
Cunliffe AL, Gladman JRF, Husbands SL, Miller P, Dewey
ME, Harwood RH. Sooner and healthier: a randomised
controlled trial and interview study of an early discharge
rehabilitation service for older people. Age & Ageing 2004;
33:246–52.
Epstein 1990 {published data only}
Epstein AM, Hall JA, Fretwell M, Feldstein M, DeCiantis
ML. Consultative geriatric assessment for ambulatory
patients. JAMA 1990;263(4):538–44.
Fleming 2004 {published data only}
Fleming SA, Blake H, Gladman JRF, Hart E, Lymberry
M, Dewey ME, et al.A randomised controlled trial of
a care home rehabilitation service to reduce long-term
institutionalisation for elderly people. Age & Ageing 33;4:
384–90.
Garåsen 2007 {published data only}
Garåsen H, Windspoll R, Johnsen R. Intermediate care at a
community hospital as an alternative to prolonged general
hospital care for elderly patients: a randomised controlled
trial. BMC Public Health 2007;7:68.
Gayton 1987 {published data only}
Gayton D, Wood-Dauphinee S, de Lorimer M, Tousignant
P, Hanley J. Trial of a geriatric consultation team in an
acute care hospital. Journal of the American Geriatrics Society
1987;35(8):726–36.
Germain 1995 {published data only}
Germain M, Knoeffel F, Wieland D, Rubenstein LZ. A
geriatric assessment and intervention team for hospital
inpatients awaiting transfer to a geriatric unit: a randomized
trial. Aging - Clinical and Experimental Research 1995;7(1):
55–60.
Gill 2003 {published data only}
Gill TM, Baker DI, Gottschalk M, Gahbauer EA,
Charpentier PA, de Regt PT, et al.A rehabilitation
programme for physically frail community living older
persons. Archives of Physical Medicine and Rehabilitation
2003;84:394–404.
Gill TM, McGloin JM, Gahbauer EA, Shepard DM,
Bianco LM. Two recruitment strategies for a clinical trial of
physically frail community-living older persons. Journal of
the American Geriatrics Society 2001;49:1039–45.
Harari 2007 {published data only}
Harari D, Martin FC, Buttery A, O’Neill S, Hopper A.
The older persons’ assessment and liaison team ’OPAL’:
evaluation of comprehensive geriatric assessment in acute
medical inpatients. Age & Ageing 2007;36(6):670–5.
Hogan 1990 {published data only}
Hogan DB. Impact of geriatric consultation services for
elderly patients admitted to acute care hospitals. Canadian
Journal on Aging 1990;9(1):35–44.
Hogan DB, Fox RA. A prospective controlled trial of a
geriatric consultation team in an acute-care hospital. Age &
Ageing 1990;19:107–13.
Karppi 1995 {published data only}
Karppi P. Effects of a geriatric inpatient unit on elderly
home-care patients: a controlled trial. Aging Clinical and
Experimental Research 1995;7:207–11.
Karppi P, Tilvis R. Effectiveness of a Finnish geriatric
inpatient assessment. Two-year follow-up of a randomized
clinical trial on community-dwelling patients. Scandinavian
Journal of Primary Health Care 1995;13(2):93–8.
Landi 1997 {published data only}
Landi F, Zuccala G, Bernabei R, Cocchi A, Manigrasso L,
Tafani A, et al.Physiotherapy and occupational therapy: a
geriatric experience in the acute care hospital. American
Journal of Physical Medicine and Rehabilitation 1997;76(1):
38–42.
Ledesert 1994 {published data only}
Ledesert B, Lombrail P, Yeni P, Carbon C, Brodin M. The
impact of a comprehensive multi-dimensional geriatric
assessment programme on duration of stay in a French acute
medical ward. Age & Ageing 1994;23:223–7.
18Comprehensive geriatric assessment for older adults admitted to hospital (Review)
Copyright © 2011 The Cochrane Collaboration. Published by John Wiley & Sons, Ltd.

Liem 1986 {published data only}
Liem PH, Chernoff R, Carter WJ. Geriatric rehabilitation
unit: a 3-year outcome evaluation. Journal of Gerontology
1986;41(1):44–50.
Meissner 1989 {published data only}
Meissner P, Andolsek K, Mears PA, Fletcher B. Maximising
the functional status of geriatric patients in an acute
community hospital setting. The Gerontologist 1989;29(4):
524–8.
Miller 1996 {published data only}
Miller DK, Lewis L, Nork MJ, Morley JE. Controlled
trial of a geriatric case-finding and liaison service in an
emergency department. Journal of the American Geriatrics
Society 1996;44(5):513–20.
Mudge 2006 {published data only}
Mudge A, Laracy S, Richter K, Denaro C. Controlled
trial of multidisciplinary care teams for acutely ill medical
inpatients: enhanced multidisciplinary care. Internal
Medicine Journal 2006;36:558–63.
Retornaz 2007 {published data only}
Retornaz F, Seux V, Sourial N, Braud AC, Monette J,
Bergman H, et al.Comparison of health and functional
status between older inpatients with and without cancer
admitted to a Geriatric/Internal Medicine Unit. The
Journals of Gerontology 2007;62A:917–22.
Reuben 1992 {published data only}
Reuben DB, Wolde-Tsadik G, Pardamean B, Hammond
B, Borok GM, Rubenstein LZ, et al.The use of targeting
criteria in hospitalized HMO patients: results from the
demonstration phase of the Hospitalised Older Persons
Evaluation (HOPE) study. Journal of the American Geriatrics
Society 1992;40:482–8.
Rubin 1992 {published data only}
Rubin CD, Sizemore MT, Loftis PA, Adams-Huet B,
Anderson RJ. The effect of geriatric evaluation and
management on medicare reimbursement in a large public
hospital: a randomized clinical trial. Journal of the American
Geriatrics Society 1992;40:989–95.
Rubin CD, Sizemore MT, Loftis PA, Loret de Mola
N. Randomized controlled trial of outpatient geriatric
evaluation and management in a large public hospital.
Journal of the American Geriatrics Society 1993;41(10):
1023–8.
Trentini 2001 {published data only}
Trentini M, Semeraro S, Motta M. Effectiveness of geriatric
evaluation and care. One-year results of a multicenter
randomized clinical trial. Aging - Clinical and Experimental
Research 2001;13(5):395–405.
Volicer 1994 {published data only}
Volicer L, Collard A, Hurley A, Bishop C, Kern D, Karon
S. Impact of special care unit for patients with advanced
Alzheimer’s disease on patients discomfort and costs. Journal
of the American Geriatrics Society 1994;42:597–603.
Young 2005 {published data only}
Green J, Young J, Forster A. Background to the post-acute
care trial of community hospital rehabilitation for older
people. International Journal of Therapy and Rehabilitation
2006;13(2):66–73.
Green J, Young J, Forster A, Mallinder K, Bogle S, Lowson
K, et al.Effects of locality based community hospital care
on independence in older people needing rehabilitation:
randomised controlled trial. BMJ 2005;331:317–22.
O’Reilly J, Lowson K, Young J, Forster A, Green J, Small N.
A cost effectiveness analysis within a randomised controlled
trial of post-acute care of older people in a community
hospital. BMJ 2006;333:228.
Small N, Green J, Spink J, Forster A, Lowson K, Young J.
The patient experience of community hospital-the process
of care as a determinant of satisfaction. Journal of Evaluation
in Clinical Practice 2007;13(1):95–101.
Young J, Forster A, Green J, Bogle S. Post-acute transfer of
older people to intermediate care services: the sooner the
better?. Age & Ageing 2007;36(5):589–92.
Young J, Green J, Forster A, Small N, Lowson K, Bogle S, et
al.Postacute care for older people in community hospitals:
a multicenter randomized, controlled trial. Journal of the
American Geriatrics Society 2007;55(12):1995–2002.
Additional references
Allen 1986
Allen CA, Becker PM, McVey LJ, Saltz CC, Feussner
JR, Cohen HJ. A randomized, controlled clinical trial
of a geriatric consultation team. Compliance with
recommendations. Journal of the American Medical
Association 1986;255(19):2617–21. [MEDLINE: 929]
Bachmann 2010
Bachmann S, Finger C, Huss A, Egger M, Stuck AE,
Clough-Gorr KM. In patient rehabilitation specifically
designed for geriatric patients: systematic review and meta-
analysis of randomised controlled trials. BMJ 2010;340:
c1718.
Bakker 2011
Bakker FC, Robben SHM, Olde Rikkert MGM. Effects of
hospital-wide interventions to improve care for frail older
inpatients: a systematic review. BMJ Quality and Safety
2011;doi:10.1136:/bmjqs.2010.047183.
Baztan 2009
Baztán JJ, Suárez-García FM, López-Arrieta J, Rodríguez-
Mañas L, Rodríguez-Artalejo F. Effectiveness of acute
geriatric units on functional decline, living at home, and
case fatality among older patients admitted to hospital for
acute medical disorders: meta-analysis. BMJ 2009;338:b50.
Cochrane 2011
Higgins JPT, Green S (editors). Cochrane Handbook for
Systematic Reviews of Interventions Version 5.1.0 [updated
March 2011]. The Cochrane Collaboration, 2011 Vol. .
Available from http://www.cochrane–handbook.org/.
Collin 1988
Collin C, Wade DT, Davies S, Horne V. The Barthel ADL
Index: a reliability study. International Disability Studies
1988;10(2):61–3.
19Comprehensive geriatric assessment for older adults admitted to hospital (Review)
Copyright © 2011 The Cochrane Collaboration. Published by John Wiley & Sons, Ltd.

DOH 2006
National Statistics (UK). Population. http://
www.statistics.gov.uk/cci/nugget.asp?ID=949 (accessed 31
Mach 2011).
Ellis 2005
Ellis G, Langhorne P. Comprehensive geriatric assessment
for older hospital patients. British Medical Bulletin 2005;
71:45–59.
Evans 2001
Evans A, Perez I, Harraf H, Melbourn A, Steadman
J, Donaldson N, et al.Can differences in management
processes explain different outcomes between stroke unit
and stroke team care?. Lancet 2001;358:86–92.
Folstein 1975
Folstein MF, Folstein SE, McHugh PR. “Mini-mental
state”. A practical method for grading the cognitive state
of patients for the clinician. Journal of Psychiatric Research
1975;12(3):189–98.
Handoll 2009
Handoll HHG, Cameron ID, Mak JCS, Finnegan TP.
Multidisciplinary rehabilitation for older people with hip
fractures. Cochrane Database of Systematic Reviews 2009,
Issue 4. [DOI: 10.1002/14651858.CD007125.pub2]
Hayden 2006
Hayden JA, Cote P, Bombardier C. Evaluation of the quality
of prognosis studies in systematic reviews. Annals of Internal
Medicine 2006;144:427–37.
Langhorne 2005
Langhorne P, Dey P, Woodman M, Kalra L, Wood-
Dauphinee S, Patel N, et al.Is stroke unit care portable? A
systematic review of the clinical trials. Age and Ageing 2005;
34:324–30.
Mathews 1984
Mathews DA. Dr Marjory Warren and the origin of British
geriatrics. Journal of the American Geriatrics Society 1984;
32:253–8.
Mathias 1986
Mathias S, Nayak USL, Isaacs B. Balance in elderly patients;
the “Get Up and Go” test. Archives of Physical Medicine and
Rehabilitation 1986;67:387–9.
Nikolaus 1999
Nikolaus T, Specht-Leible N, Bach M, Oster P, Schuerf G.
A randomised trial of comprehensive geriatric assessment
and home intervention in the care of hospitalised patients.
Age & Ageing 1999;28:543–50.
OECD 2004
OECD Health. Ageing societies and the Looming Pension
Crisis. Paris: OECD, 2004.
Pound 1999
Pound P, Sabin C, Ebrahim S. Observing the process of
care: a stroke unit, elderly care unit and general medical
ward compared. Age & Ageing 1999;28(5):433–40.
Rubenstein 1991
Rubenstein LZ, Stuck AE, Siu AL, Wieland D. Impact
of geriatric evaluation and management programs on
defined outcomes: overview of the evidence. Journal of the
American Geriatrics Society. 1991; Vol. 39:8S–16S.
Stuck 1993
Stuck AE, Siu AL, Wieland D, Adams J, Rubenstein LZ.
Comprehensive geriatric assessment: a meta-analysis of
controlled trials. Lancet 1993;342:1032–6.
SUTC 2007
Stroke Unit Trialists’ Collaboration. Organised inpatient
(stroke unit) care for stroke. Cochrane Database of
Systematic Reviews 2007, Issue 4. [DOI: 10.1002/
14651858.CD000197.pub2]
Van Craen 2010
Van Craen K, Braes T, Wellens N, Denhaerynck K,
Flamaing J, Moons P, et al.The effectiveness of inpatient
geriatric evaluation and management units: a systematic
review and meta-analysis. Journal of the American Geriatrics
Society 2010;58:83–92.
Wood 2001
Wood R, Bain MRS. The Health and Well-being of Older
People in Scotland: Insights from National Data.. The
health and well-being of older people in Scotland: insights
from national data. Edinburgh: Information and Statistics
Division, 2001.∗ Indicates the major publication for the study
20Comprehensive geriatric assessment for older adults admitted to hospital (Review)
Copyright © 2011 The Cochrane Collaboration. Published by John Wiley & Sons, Ltd.

C H A R A C T E R I S T I C S O F S T U D I E S
Characteristics of included studies [ordered by study ID]
Applegate 1990
Methods Year: 1990
Location: Memphis, USA (1500-bed rehabilitation hospital)
Team/ward?: ward
Timing: stepdown
Trial methodology: randomised controlled trial
Participants Numbers (total): 155
Mean age: 78.8
Male:female ratio: 24% male
Inclusion criteria: over 65, at risk for nursing home placement and/or functional im-
pairment
Some patients under 65 were considered if they met the criteria
Exclusion criteria: unstable medical conditions; short-term monitoring required; sur-
vival less than 6 months; serious chronic mental impairment; nursing home placement
inevitable
Patient selection criteria: selected
Interventions Team members: specialist nurse, ward nurses, social workers, physiotherapists, occupa-
tional therapists, dieticians, speech and language pathologists, audiologists, psycholo-
gists
Team organisation: comprehensive assessment, multidisciplinary meetings at least
weekly, regular use of standard assessment tools
Outcomes Outcomes: mortality, ADL, days spent in nursing homes, mood, and cognition at 6
months and 1 year
Trial conclusions: improved function and reduced nursing home admission
Notes
Risk of bias
Bias Authors’ judgement Support for judgement
Random sequence generation (selection
bias)
Low risk Computer-generated random number se-
quences stratified by patient risk of nursing
home admission
Allocation concealment (selection bias) Unclear risk No data available
Blinding (performance bias and detection
bias)
All outcomes
Unclear risk Patient and staff were not blinded to al-
location. Outcome assessments were con-
ducted by staff not involved in routine care
but blinding of outcome assessors to treat-
ment allocation is not clear.
21Comprehensive geriatric assessment for older adults admitted to hospital (Review)
Copyright © 2011 The Cochrane Collaboration. Published by John Wiley & Sons, Ltd.
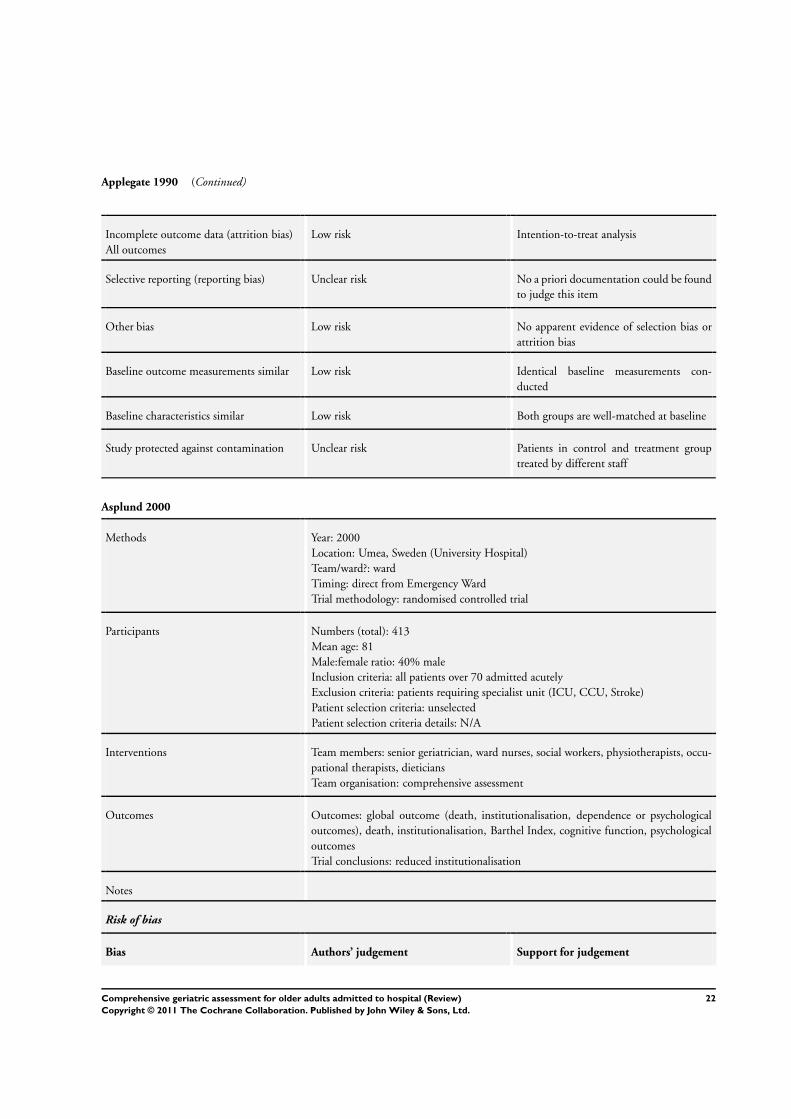
Applegate 1990 (Continued)
Incomplete outcome data (attrition bias)
All outcomes
Low risk Intention-to-treat analysis
Selective reporting (reporting bias) Unclear risk No a priori documentation could be found
to judge this item
Other bias Low risk No apparent evidence of selection bias or
attrition bias
Baseline outcome measurements similar Low risk Identical baseline measurements con-
ducted
Baseline characteristics similar Low risk Both groups are well-matched at baseline
Study protected against contamination Unclear risk Patients in control and treatment group
treated by different staff
Asplund 2000
Methods Year: 2000
Location: Umea, Sweden (University Hospital)
Team/ward?: ward
Timing: direct from Emergency Ward
Trial methodology: randomised controlled trial
Participants Numbers (total): 413
Mean age: 81
Male:female ratio: 40% male
Inclusion criteria: all patients over 70 admitted acutely
Exclusion criteria: patients requiring specialist unit (ICU, CCU, Stroke)
Patient selection criteria: unselected
Patient selection criteria details: N/A
Interventions Team members: senior geriatrician, ward nurses, social workers, physiotherapists, occu-
pational therapists, dieticians
Team organisation: comprehensive assessment
Outcomes Outcomes: global outcome (death, institutionalisation, dependence or psychological
outcomes), death, institutionalisation, Barthel Index, cognitive function, psychological
outcomes
Trial conclusions: reduced institutionalisation
Notes
Risk of bias
Bias Authors’ judgement Support for judgement
22Comprehensive geriatric assessment for older adults admitted to hospital (Review)
Copyright © 2011 The Cochrane Collaboration. Published by John Wiley & Sons, Ltd.
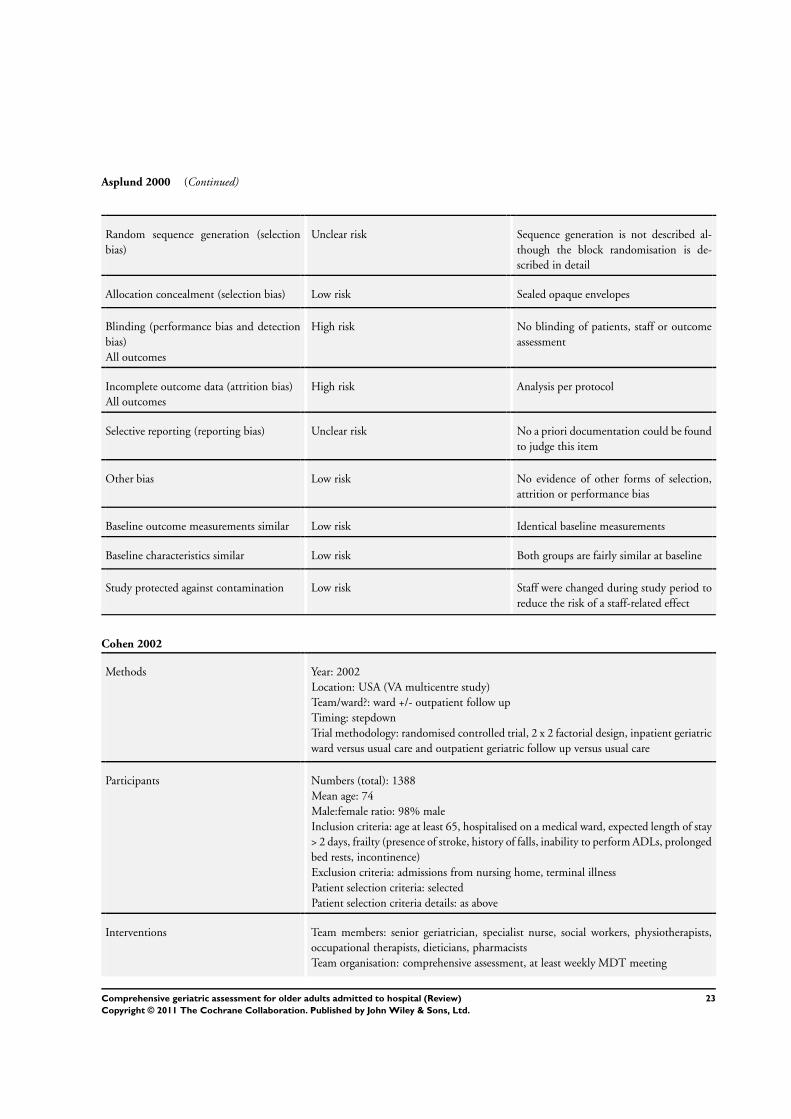
Asplund 2000 (Continued)
Random sequence generation (selection
bias)
Unclear risk Sequence generation is not described al-
though the block randomisation is de-
scribed in detail
Allocation concealment (selection bias) Low risk Sealed opaque envelopes
Blinding (performance bias and detection
bias)
All outcomes
High risk No blinding of patients, staff or outcome
assessment
Incomplete outcome data (attrition bias)
All outcomes
High risk Analysis per protocol
Selective reporting (reporting bias) Unclear risk No a priori documentation could be found
to judge this item
Other bias Low risk No evidence of other forms of selection,
attrition or performance bias
Baseline outcome measurements similar Low risk Identical baseline measurements
Baseline characteristics similar Low risk Both groups are fairly similar at baseline
Study protected against contamination Low risk Staff were changed during study period to
reduce the risk of a staff-related effect
Cohen 2002
Methods Year: 2002
Location: USA (VA multicentre study)
Team/ward?: ward +/- outpatient follow up
Timing: stepdown
Trial methodology: randomised controlled trial, 2 x 2 factorial design, inpatient geriatric
ward versus usual care and outpatient geriatric follow up versus usual care
Participants Numbers (total): 1388
Mean age: 74
Male:female ratio: 98% male
Inclusion criteria: age at least 65, hospitalised on a medical ward, expected length of stay
> 2 days, frailty (presence of stroke, history of falls, inability to perform ADLs, prolonged
bed rests, incontinence)
Exclusion criteria: admissions from nursing home, terminal illness
Patient selection criteria: selected
Patient selection criteria details: as above
Interventions Team members: senior geriatrician, specialist nurse, social workers, physiotherapists,
occupational therapists, dieticians, pharmacists
Team organisation: comprehensive assessment, at least weekly MDT meeting
23Comprehensive geriatric assessment for older adults admitted to hospital (Review)
Copyright © 2011 The Cochrane Collaboration. Published by John Wiley & Sons, Ltd.

Cohen 2002 (Continued)
Outcomes Outcomes: death, perceived health status, basic and extended ADL, costs
Trial conclusions: no overall effects on survival. Improved physical function with inpa-
tient care, improved cognitive function with outpatient care
Notes This trial was subdivided into 4 groups in a 2 x 2 factorial design. It explored the
hypothesis that CGA out-patient follow up was associated with a significantly improved
outcome.
The first subgroup of the trial evaluated Geriatric Evaluation and Management Clinic
(GEMC) follow up post-discharge from inpatient care. This splitting of the data has
been done to enable meta-analysis for the outpatient follow up subgroup.
The second subgroup of the trial evaluated Usual Care Outpatient (UCOP) follow up
following discharge from inpatient care
Risk of bias
Bias Authors’ judgement Support for judgement
Random sequence generation (selection
bias)
Low risk Computerised random numbers in two-by-
two factorial design with stratification ac-
cording to functional status
Allocation concealment (selection bias) Low risk Randomisation remote at co-ordinating
centre
Blinding (performance bias and detection
bias)
All outcomes
Low risk Blinding of outcome assessor only
Incomplete outcome data (attrition bias)
All outcomes
Low risk Intention-to-treat analysis
Selective reporting (reporting bias) Unclear risk No a priori documentation could be found
to judge this item
Other bias Low risk No evidence to suggest selection, perfor-
mance or attrition bias
Baseline outcome measurements similar Low risk Identical baseline assessments
Baseline characteristics similar Low risk Similar baseline characteristics
Study protected against contamination Low risk Care conducted on different units with dif-
ferent groups of staff
24Comprehensive geriatric assessment for older adults admitted to hospital (Review)
Copyright © 2011 The Cochrane Collaboration. Published by John Wiley & Sons, Ltd.
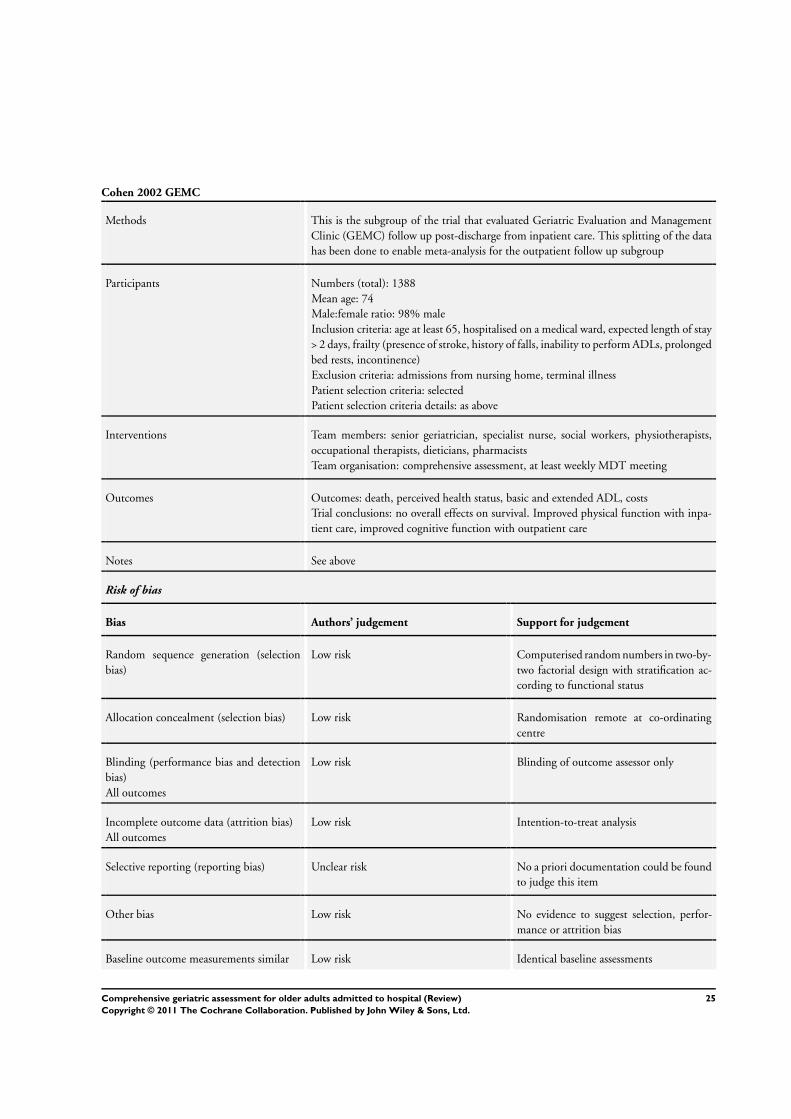
Cohen 2002 GEMC
Methods This is the subgroup of the trial that evaluated Geriatric Evaluation and Management
Clinic (GEMC) follow up post-discharge from inpatient care. This splitting of the data
has been done to enable meta-analysis for the outpatient follow up subgroup
Participants Numbers (total): 1388
Mean age: 74
Male:female ratio: 98% male
Inclusion criteria: age at least 65, hospitalised on a medical ward, expected length of stay
> 2 days, frailty (presence of stroke, history of falls, inability to perform ADLs, prolonged
bed rests, incontinence)
Exclusion criteria: admissions from nursing home, terminal illness
Patient selection criteria: selected
Patient selection criteria details: as above
Interventions Team members: senior geriatrician, specialist nurse, social workers, physiotherapists,
occupational therapists, dieticians, pharmacists
Team organisation: comprehensive assessment, at least weekly MDT meeting
Outcomes Outcomes: death, perceived health status, basic and extended ADL, costs
Trial conclusions: no overall effects on survival. Improved physical function with inpa-
tient care, improved cognitive function with outpatient care
Notes See above
Risk of bias
Bias Authors’ judgement Support for judgement
Random sequence generation (selection
bias)
Low risk Computerised random numbers in two-by-
two factorial design with stratification ac-
cording to functional status
Allocation concealment (selection bias) Low risk Randomisation remote at co-ordinating
centre
Blinding (performance bias and detection
bias)
All outcomes
Low risk Blinding of outcome assessor only
Incomplete outcome data (attrition bias)
All outcomes
Low risk Intention-to-treat analysis
Selective reporting (reporting bias) Unclear risk No a priori documentation could be found
to judge this item
Other bias Low risk No evidence to suggest selection, perfor-
mance or attrition bias
Baseline outcome measurements similar Low risk Identical baseline assessments
25Comprehensive geriatric assessment for older adults admitted to hospital (Review)
Copyright © 2011 The Cochrane Collaboration. Published by John Wiley & Sons, Ltd.
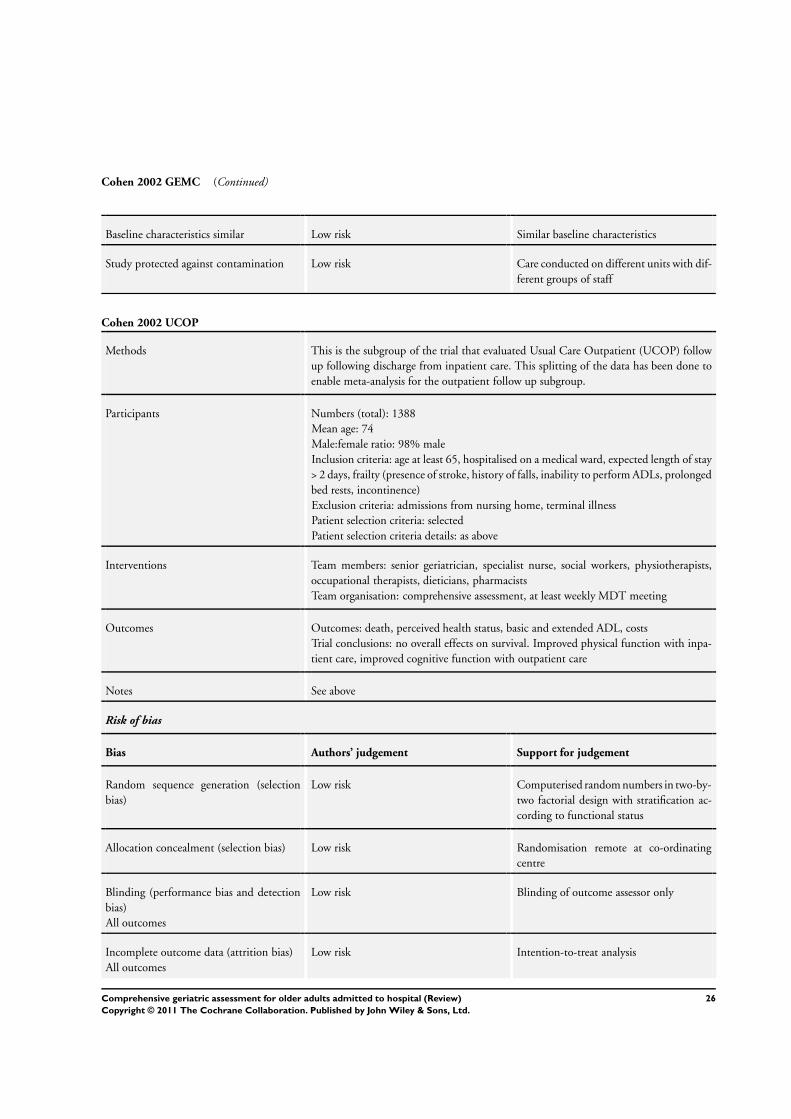
Cohen 2002 GEMC (Continued)
Baseline characteristics similar Low risk Similar baseline characteristics
Study protected against contamination Low risk Care conducted on different units with dif-
ferent groups of staff
Cohen 2002 UCOP
Methods This is the subgroup of the trial that evaluated Usual Care Outpatient (UCOP) follow
up following discharge from inpatient care. This splitting of the data has been done to
enable meta-analysis for the outpatient follow up subgroup.
Participants Numbers (total): 1388
Mean age: 74
Male:female ratio: 98% male
Inclusion criteria: age at least 65, hospitalised on a medical ward, expected length of stay
> 2 days, frailty (presence of stroke, history of falls, inability to perform ADLs, prolonged
bed rests, incontinence)
Exclusion criteria: admissions from nursing home, terminal illness
Patient selection criteria: selected
Patient selection criteria details: as above
Interventions Team members: senior geriatrician, specialist nurse, social workers, physiotherapists,
occupational therapists, dieticians, pharmacists
Team organisation: comprehensive assessment, at least weekly MDT meeting
Outcomes Outcomes: death, perceived health status, basic and extended ADL, costs
Trial conclusions: no overall effects on survival. Improved physical function with inpa-
tient care, improved cognitive function with outpatient care
Notes See above
Risk of bias
Bias Authors’ judgement Support for judgement
Random sequence generation (selection
bias)
Low risk Computerised random numbers in two-by-
two factorial design with stratification ac-
cording to functional status
Allocation concealment (selection bias) Low risk Randomisation remote at co-ordinating
centre
Blinding (performance bias and detection
bias)
All outcomes
Low risk Blinding of outcome assessor only
Incomplete outcome data (attrition bias)
All outcomes
Low risk Intention-to-treat analysis
26Comprehensive geriatric assessment for older adults admitted to hospital (Review)
Copyright © 2011 The Cochrane Collaboration. Published by John Wiley & Sons, Ltd.
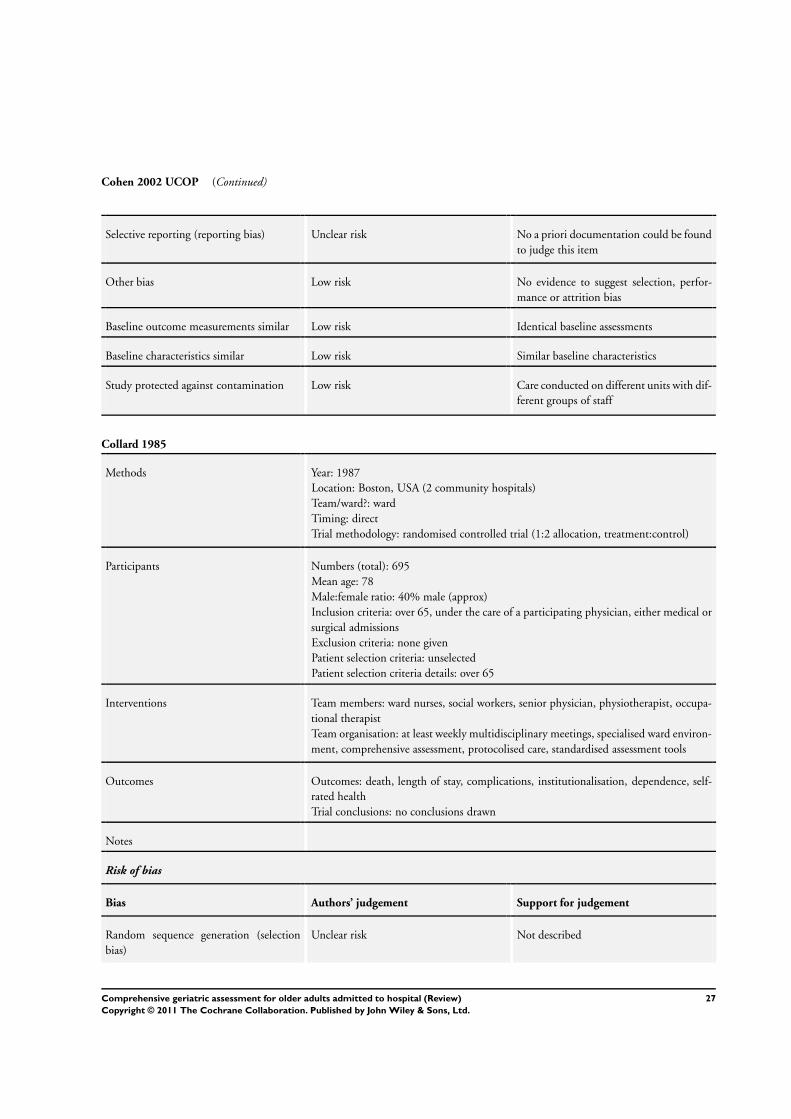
Cohen 2002 UCOP (Continued)
Selective reporting (reporting bias) Unclear risk No a priori documentation could be found
to judge this item
Other bias Low risk No evidence to suggest selection, perfor-
mance or attrition bias
Baseline outcome measurements similar Low risk Identical baseline assessments
Baseline characteristics similar Low risk Similar baseline characteristics
Study protected against contamination Low risk Care conducted on different units with dif-
ferent groups of staff
Collard 1985
Methods Year: 1987
Location: Boston, USA (2 community hospitals)
Team/ward?: ward
Timing: direct
Trial methodology: randomised controlled trial (1:2 allocation, treatment:control)
Participants Numbers (total): 695
Mean age: 78
Male:female ratio: 40% male (approx)
Inclusion criteria: over 65, under the care of a participating physician, either medical or
surgical admissions
Exclusion criteria: none given
Patient selection criteria: unselected
Patient selection criteria details: over 65
Interventions Team members: ward nurses, social workers, senior physician, physiotherapist, occupa-
tional therapist
Team organisation: at least weekly multidisciplinary meetings, specialised ward environ-
ment, comprehensive assessment, protocolised care, standardised assessment tools
Outcomes Outcomes: death, length of stay, complications, institutionalisation, dependence, self-
rated health
Trial conclusions: no conclusions drawn
Notes
Risk of bias
Bias Authors’ judgement Support for judgement
Random sequence generation (selection
bias)
Unclear risk Not described
27Comprehensive geriatric assessment for older adults admitted to hospital (Review)
Copyright © 2011 The Cochrane Collaboration. Published by John Wiley & Sons, Ltd.
Collard 1985 (Continued)
Allocation concealment (selection bias) Unclear risk Not described
Blinding (performance bias and detection
bias)
All outcomes
High risk No patient, staff or outcome assessment
blinding
Incomplete outcome data (attrition bias)
All outcomes
High risk There were significant differences in the
outcome rates for some outcomes. Mortal-
ity was recorded at the end of follow up as
was institutionalisation for other outcomes
such as dependence was incomplete with
high dropout rates.
Selective reporting (reporting bias) Unclear risk No a priori documentation could be found
to judge this item
Other bias Unclear risk No evidence to exclude performance bias
but no clear attrition bias
Baseline outcome measurements similar Unclear risk Measurements at baseline are similar but
differences exist in the reporting numbers
Baseline characteristics similar Unclear risk Baseline characteristics are broadly similar
however because of differences in baseline
numbers it is not entirely clear if the pop-
ulations are identical
Study protected against contamination Low risk Care is delivered in different physical units
with separate staffing arrangements
Counsell 2000
Methods Year: 2000
Location: Akron City, Ohio, USA (Community Teaching Hospital)
Team/ward?: ward
Timing: direct (ACE)
Trial methodology: randomised controlled trial
Participants Numbers (total): 1531
Mean age: 80
Male:female ratio: 40% male (approximately)
Inclusion criteria: community-dwelling persons aged 70 or older admitted to medical or
family practice service
Exclusion criteria: transferred from other hospital, nursing home, required speciality unit
admission, elective admissions, LOS < 2 days
Patient selection criteria: unselected
28Comprehensive geriatric assessment for older adults admitted to hospital (Review)
Copyright © 2011 The Cochrane Collaboration. Published by John Wiley & Sons, Ltd.
Counsell 2000 (Continued)
Interventions Team members: senior geriatrician, specialist nurse, ward nurses, social workers, phys-
iotherapists
Team organisation: comprehensive assessment, at least weekly multidisciplinary meet-
ings, standardised assessment tools, specialised ward environment, protocolised care
Outcomes Outcomes: death, activities of daily living, institutionalisation, dependence
Trial conclusions: improved combined outcomes of functional decline or nursing home
admission in intervention group
Notes
Risk of bias
Bias Authors’ judgement Support for judgement
Random sequence generation (selection
bias)
Low risk Computer-generated random number
Allocation concealment (selection bias) Low risk Numbered sequential opaque envelopes
Blinding (performance bias and detection
bias)
All outcomes
High risk No patient or staff blinding. No blinding
of outcome assessor
Incomplete outcome data (attrition bias)
All outcomes
Low risk Intention-to-treat and analysis per protocol
described
Selective reporting (reporting bias) Unclear risk No a priori documentation could be found
to judge this item
Other bias Low risk No evidence to suggest attrition bias, selec-
tion bias or performance bias
Baseline outcome measurements similar Low risk Identical baseline measurements
Baseline characteristics similar Low risk Similar baseline characteristics
Study protected against contamination Unclear risk Patients treated in separate units
29Comprehensive geriatric assessment for older adults admitted to hospital (Review)
Copyright © 2011 The Cochrane Collaboration. Published by John Wiley & Sons, Ltd.
Fretwell 1990
Methods Year: 1990
Location: Providence, Rhode Island, USA (Teaching Hospital)
Team/ward?: ward
Timing: direct
Trial methodology: randomised controlled trial
Participants Numbers (total): 436
Mean age: 83
Male:female ratio: 28% male
Inclusion criteria: > 75, physician given consent, did not require CCU or ICU
Exclusion criteria: none given
Patient selection criteria: unselected
Patient selection criteria details: over 75s
Interventions Team members: specialist nurses, ward nurses, senior geriatrician, pharmacist, physio-
therapist, dietician, social worker
Team organisation: at least weekly multidisciplinary meetings, goal-setting, standardised
assessment tools
Outcomes Outcomes: death, cognition, dependence, mood, costs, institutionalisation
Trial conclusions: no significant difference observed between the groups
Notes
Risk of bias
Bias Authors’ judgement Support for judgement
Random sequence generation (selection
bias)
Unclear risk Not described
Allocation concealment (selection bias) Unclear risk Not described
Blinding (performance bias and detection
bias)
All outcomes
High risk Patients and staff were not blinded to al-
location. Outcome assessor not apparently
blinded
Incomplete outcome data (attrition bias)
All outcomes
Low risk Attrition rates also described and com-
pared. Intention-to-treat analysis
Selective reporting (reporting bias) Unclear risk No a priori documentation could be found
to judge this item
Other bias Low risk No apparent evidence of attrition, perfor-
mance or selection bias evident
Baseline outcome measurements similar Low risk Identical baseline measurements
Baseline characteristics similar Low risk Similar baseline characteristics
30Comprehensive geriatric assessment for older adults admitted to hospital (Review)
Copyright © 2011 The Cochrane Collaboration. Published by John Wiley & Sons, Ltd.
Fretwell 1990 (Continued)
Study protected against contamination Low risk Care delivered in discrete units by separate
staff
Harris 1991
Methods Year: 1991
Location: Adelaide, Australia
Team/ward?: ward
Timing: direct from emergency department
Trial methodology: randomised controlled trial
Participants Numbers (total): 267
Mean age: 78
Male:female ratio: 40% male (approximately)
Inclusion criteria: over 70 years of age, non-elective, not re-admitted, non-nursing home
dwellers, resident in Southern Health Region
Exclusion criteria: none given
Patient selection criteria: unselected
Patient selection criteria details: no selection criteria
Interventions Team members: senior geriatrician, social workers, occupational therapists, physiother-
apists, ward nurses
Team organisation: not specified
Outcomes Outcomes: death, institutionalisation, dependency, cognitive status, length of stay
Trial conclusions: no evidence of benefit from admission to a Geriatric Assessment Unit
for unselected adults over 70 years.
Notes
Risk of bias
Bias Authors’ judgement Support for judgement
Random sequence generation (selection
bias)
Unclear risk Not clearly described
Allocation concealment (selection bias) High risk Cards selected in sequence, however these
were open and error rates are recorded
Blinding (performance bias and detection
bias)
All outcomes
High risk No blinding of patients, staff or outcome
assessment
Incomplete outcome data (attrition bias)
All outcomes
Unclear risk Analysis by intention-to-treat
31Comprehensive geriatric assessment for older adults admitted to hospital (Review)
Copyright © 2011 The Cochrane Collaboration. Published by John Wiley & Sons, Ltd.
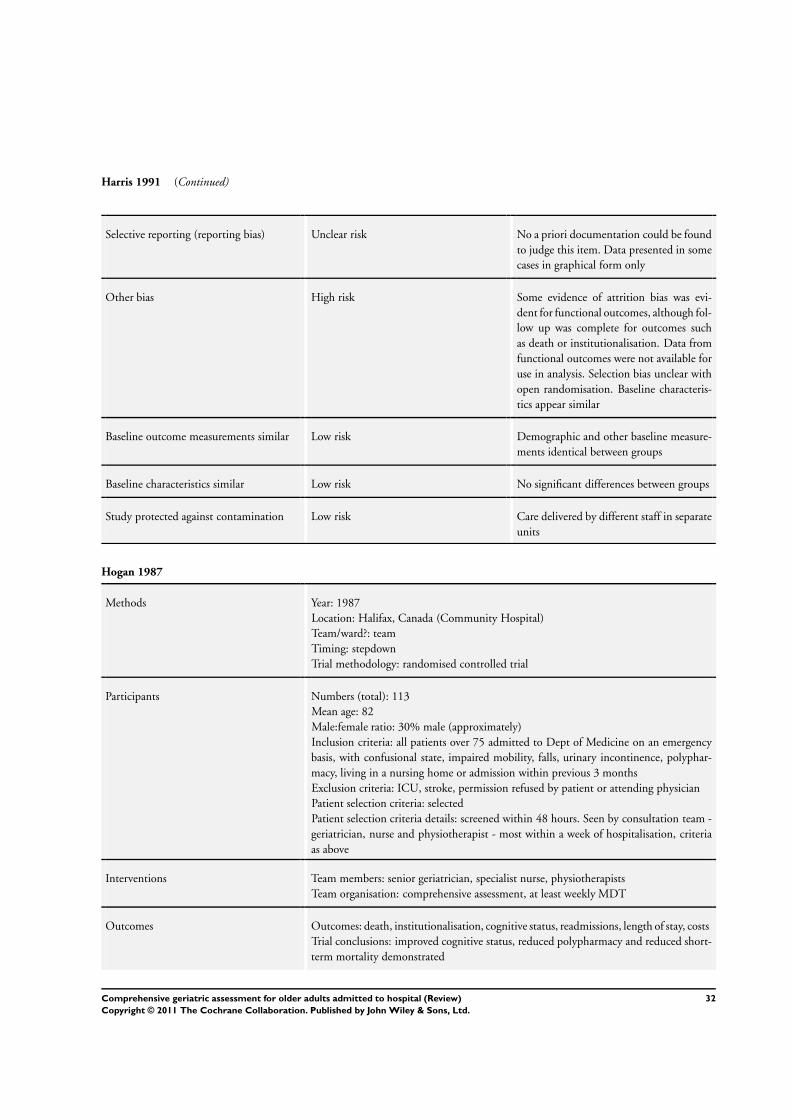
Harris 1991 (Continued)
Selective reporting (reporting bias) Unclear risk No a priori documentation could be found
to judge this item. Data presented in some
cases in graphical form only
Other bias High risk Some evidence of attrition bias was evi-
dent for functional outcomes, although fol-
low up was complete for outcomes such
as death or institutionalisation. Data from
functional outcomes were not available for
use in analysis. Selection bias unclear with
open randomisation. Baseline characteris-
tics appear similar
Baseline outcome measurements similar Low risk Demographic and other baseline measure-
ments identical between groups
Baseline characteristics similar Low risk No significant differences between groups
Study protected against contamination Low risk Care delivered by different staff in separate
units
Hogan 1987
Methods Year: 1987
Location: Halifax, Canada (Community Hospital)
Team/ward?: team
Timing: stepdown
Trial methodology: randomised controlled trial
Participants Numbers (total): 113
Mean age: 82
Male:female ratio: 30% male (approximately)
Inclusion criteria: all patients over 75 admitted to Dept of Medicine on an emergency
basis, with confusional state, impaired mobility, falls, urinary incontinence, polyphar-
macy, living in a nursing home or admission within previous 3 months
Exclusion criteria: ICU, stroke, permission refused by patient or attending physician
Patient selection criteria: selected
Patient selection criteria details: screened within 48 hours. Seen by consultation team -
geriatrician, nurse and physiotherapist - most within a week of hospitalisation, criteria
as above
Interventions Team members: senior geriatrician, specialist nurse, physiotherapists
Team organisation: comprehensive assessment, at least weekly MDT
Outcomes Outcomes: death, institutionalisation, cognitive status, readmissions, length of stay, costs
Trial conclusions: improved cognitive status, reduced polypharmacy and reduced short-
term mortality demonstrated
32Comprehensive geriatric assessment for older adults admitted to hospital (Review)
Copyright © 2011 The Cochrane Collaboration. Published by John Wiley & Sons, Ltd.

Hogan 1987 (Continued)
Notes
Risk of bias
Bias Authors’ judgement Support for judgement
Random sequence generation (selection
bias)
Low risk Random number generation
Allocation concealment (selection bias) High risk Not described. Allocation by assessor not
responsible for delivering care.
Blinding (performance bias and detection
bias)
All outcomes
Unclear risk Outcome assessment only
Incomplete outcome data (attrition bias)
All outcomes
Low risk Analysis appears to be per protocol
Selective reporting (reporting bias) Unclear risk No a priori documentation could be found
to judge this item
Other bias Unclear risk Evidence of selection bias unclear due to
lack of clarity in description of randomisa-
tion method
Baseline outcome measurements similar Low risk Measurements appear similar
Baseline characteristics similar Low risk Slight differences exist in the male:female
proportion which may reflect the small
sample size
Study protected against contamination Unclear risk Four patients in the control group were re-
moved from analysis after a review was re-
quested from the intervention team accord-
ing to clinical need
Kay 1992
Methods Year: 1992
Location: Toronto, Canada (Community Hospital)
Team/ward?: ward
Timing: stepdown
Trial methodology: randomised controlled trial (patients ’randomly assigned’)
Participants Numbers (total): 59
Mean age: 81
Male:female ratio: 45% male
33Comprehensive geriatric assessment for older adults admitted to hospital (Review)
Copyright © 2011 The Cochrane Collaboration. Published by John Wiley & Sons, Ltd.
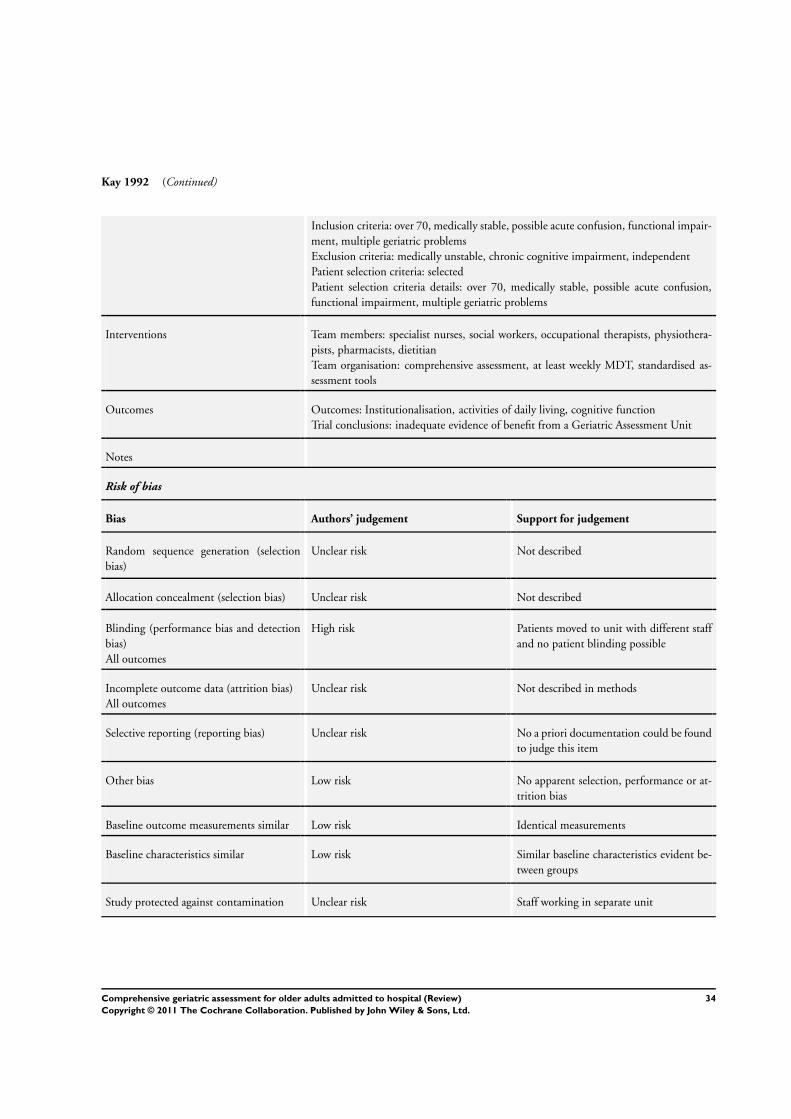
Kay 1992 (Continued)
Inclusion criteria: over 70, medically stable, possible acute confusion, functional impair-
ment, multiple geriatric problems
Exclusion criteria: medically unstable, chronic cognitive impairment, independent
Patient selection criteria: selected
Patient selection criteria details: over 70, medically stable, possible acute confusion,
functional impairment, multiple geriatric problems
Interventions Team members: specialist nurses, social workers, occupational therapists, physiothera-
pists, pharmacists, dietitian
Team organisation: comprehensive assessment, at least weekly MDT, standardised as-
sessment tools
Outcomes Outcomes: Institutionalisation, activities of daily living, cognitive function
Trial conclusions: inadequate evidence of benefit from a Geriatric Assessment Unit
Notes
Risk of bias
Bias Authors’ judgement Support for judgement
Random sequence generation (selection
bias)
Unclear risk Not described
Allocation concealment (selection bias) Unclear risk Not described
Blinding (performance bias and detection
bias)
All outcomes
High risk Patients moved to unit with different staff
and no patient blinding possible
Incomplete outcome data (attrition bias)
All outcomes
Unclear risk Not described in methods
Selective reporting (reporting bias) Unclear risk No a priori documentation could be found
to judge this item
Other bias Low risk No apparent selection, performance or at-
trition bias
Baseline outcome measurements similar Low risk Identical measurements
Baseline characteristics similar Low risk Similar baseline characteristics evident be-
tween groups
Study protected against contamination Unclear risk Staff working in separate unit
34Comprehensive geriatric assessment for older adults admitted to hospital (Review)
Copyright © 2011 The Cochrane Collaboration. Published by John Wiley & Sons, Ltd.
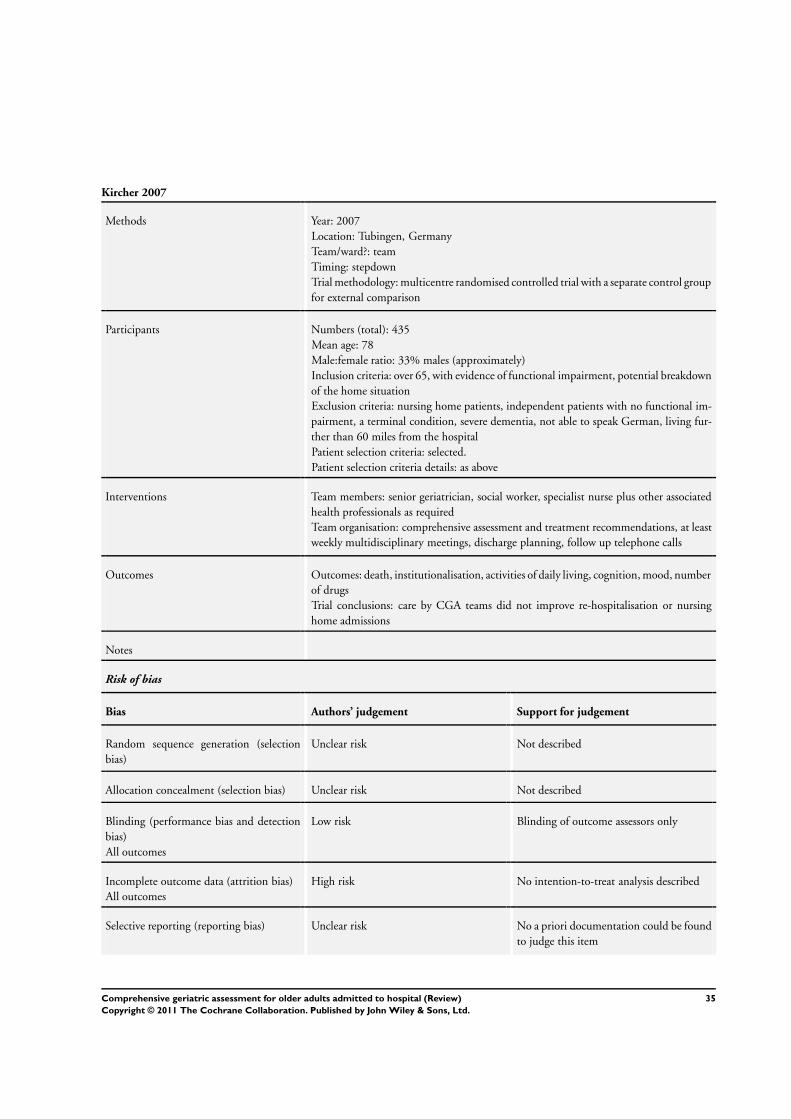
Kircher 2007
Methods Year: 2007
Location: Tubingen, Germany
Team/ward?: team
Timing: stepdown
Trial methodology: multicentre randomised controlled trial with a separate control group
for external comparison
Participants Numbers (total): 435
Mean age: 78
Male:female ratio: 33% males (approximately)
Inclusion criteria: over 65, with evidence of functional impairment, potential breakdown
of the home situation
Exclusion criteria: nursing home patients, independent patients with no functional im-
pairment, a terminal condition, severe dementia, not able to speak German, living fur-
ther than 60 miles from the hospital
Patient selection criteria: selected.
Patient selection criteria details: as above
Interventions Team members: senior geriatrician, social worker, specialist nurse plus other associated
health professionals as required
Team organisation: comprehensive assessment and treatment recommendations, at least
weekly multidisciplinary meetings, discharge planning, follow up telephone calls
Outcomes Outcomes: death, institutionalisation, activities of daily living, cognition, mood, number
of drugs
Trial conclusions: care by CGA teams did not improve re-hospitalisation or nursing
home admissions
Notes
Risk of bias
Bias Authors’ judgement Support for judgement
Random sequence generation (selection
bias)
Unclear risk Not described
Allocation concealment (selection bias) Unclear risk Not described
Blinding (performance bias and detection
bias)
All outcomes
Low risk Blinding of outcome assessors only
Incomplete outcome data (attrition bias)
All outcomes
High risk No intention-to-treat analysis described
Selective reporting (reporting bias) Unclear risk No a priori documentation could be found
to judge this item
35Comprehensive geriatric assessment for older adults admitted to hospital (Review)
Copyright © 2011 The Cochrane Collaboration. Published by John Wiley & Sons, Ltd.
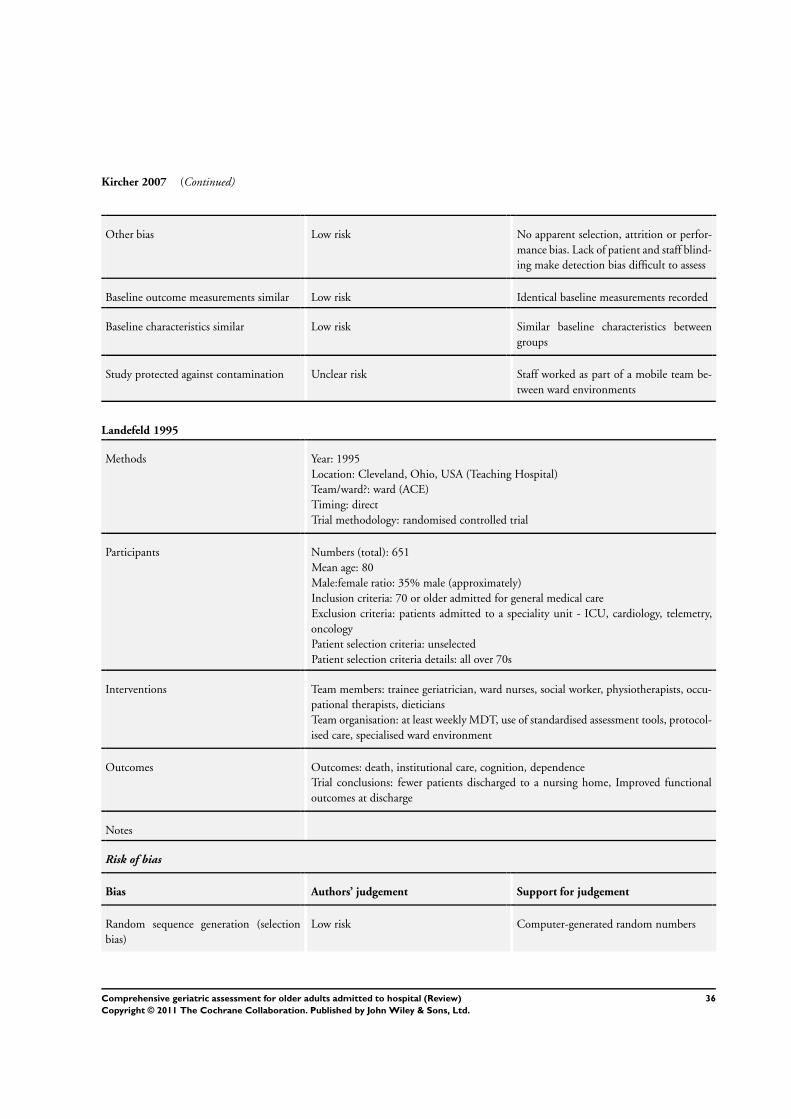
Kircher 2007 (Continued)
Other bias Low risk No apparent selection, attrition or perfor-
mance bias. Lack of patient and staff blind-
ing make detection bias difficult to assess
Baseline outcome measurements similar Low risk Identical baseline measurements recorded
Baseline characteristics similar Low risk Similar baseline characteristics between
groups
Study protected against contamination Unclear risk Staff worked as part of a mobile team be-
tween ward environments
Landefeld 1995
Methods Year: 1995
Location: Cleveland, Ohio, USA (Teaching Hospital)
Team/ward?: ward (ACE)
Timing: direct
Trial methodology: randomised controlled trial
Participants Numbers (total): 651
Mean age: 80
Male:female ratio: 35% male (approximately)
Inclusion criteria: 70 or older admitted for general medical care
Exclusion criteria: patients admitted to a speciality unit - ICU, cardiology, telemetry,
oncology
Patient selection criteria: unselected
Patient selection criteria details: all over 70s
Interventions Team members: trainee geriatrician, ward nurses, social worker, physiotherapists, occu-
pational therapists, dieticians
Team organisation: at least weekly MDT, use of standardised assessment tools, protocol-
ised care, specialised ward environment
Outcomes Outcomes: death, institutional care, cognition, dependence
Trial conclusions: fewer patients discharged to a nursing home, Improved functional
outcomes at discharge
Notes
Risk of bias
Bias Authors’ judgement Support for judgement
Random sequence generation (selection
bias)
Low risk Computer-generated random numbers
36Comprehensive geriatric assessment for older adults admitted to hospital (Review)
Copyright © 2011 The Cochrane Collaboration. Published by John Wiley & Sons, Ltd.
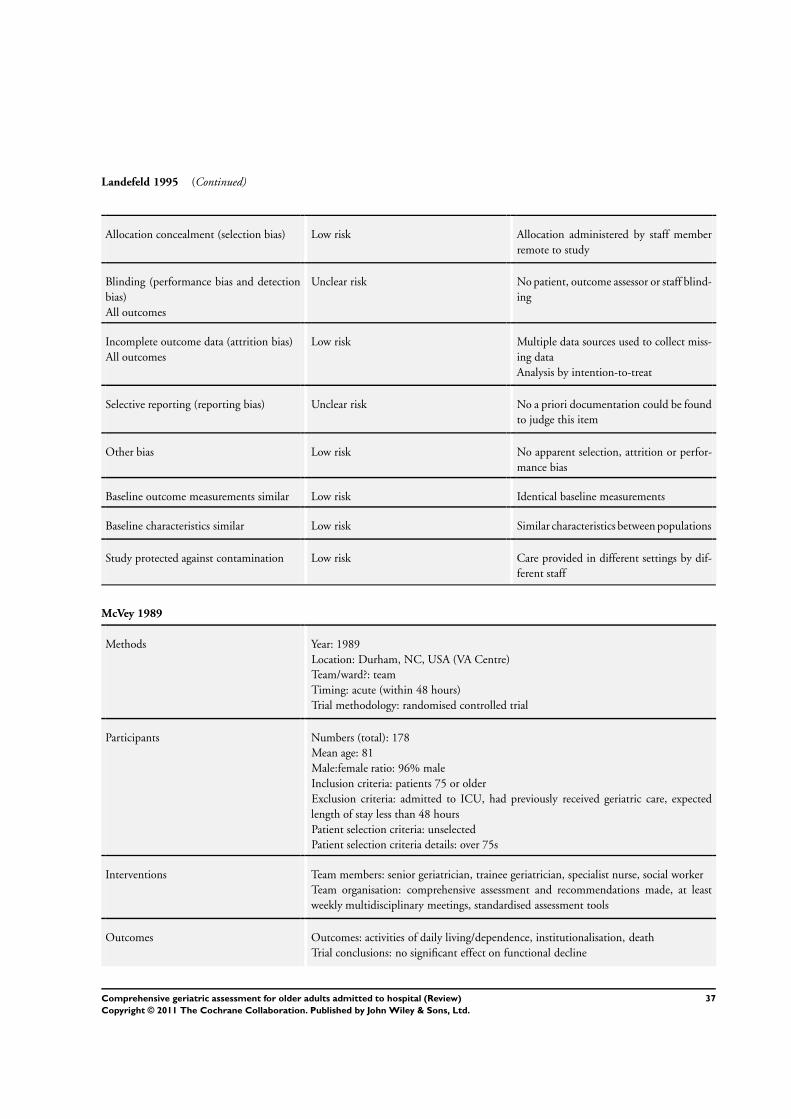
Landefeld 1995 (Continued)
Allocation concealment (selection bias) Low risk Allocation administered by staff member
remote to study
Blinding (performance bias and detection
bias)
All outcomes
Unclear risk No patient, outcome assessor or staff blind-
ing
Incomplete outcome data (attrition bias)
All outcomes
Low risk Multiple data sources used to collect miss-
ing data
Analysis by intention-to-treat
Selective reporting (reporting bias) Unclear risk No a priori documentation could be found
to judge this item
Other bias Low risk No apparent selection, attrition or perfor-
mance bias
Baseline outcome measurements similar Low risk Identical baseline measurements
Baseline characteristics similar Low risk Similar characteristics between populations
Study protected against contamination Low risk Care provided in different settings by dif-
ferent staff
McVey 1989
Methods Year: 1989
Location: Durham, NC, USA (VA Centre)
Team/ward?: team
Timing: acute (within 48 hours)
Trial methodology: randomised controlled trial
Participants Numbers (total): 178
Mean age: 81
Male:female ratio: 96% male
Inclusion criteria: patients 75 or older
Exclusion criteria: admitted to ICU, had previously received geriatric care, expected
length of stay less than 48 hours
Patient selection criteria: unselected
Patient selection criteria details: over 75s
Interventions Team members: senior geriatrician, trainee geriatrician, specialist nurse, social worker
Team organisation: comprehensive assessment and recommendations made, at least
weekly multidisciplinary meetings, standardised assessment tools
Outcomes Outcomes: activities of daily living/dependence, institutionalisation, death
Trial conclusions: no significant effect on functional decline
37Comprehensive geriatric assessment for older adults admitted to hospital (Review)
Copyright © 2011 The Cochrane Collaboration. Published by John Wiley & Sons, Ltd.
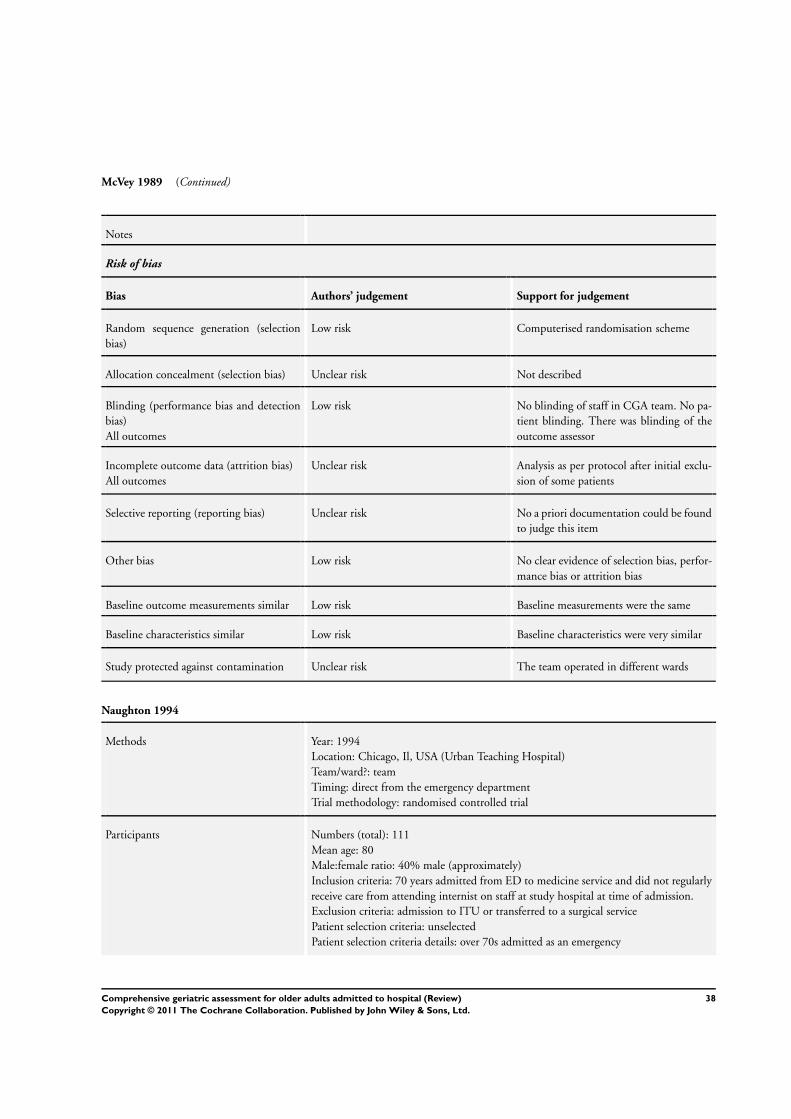
McVey 1989 (Continued)
Notes
Risk of bias
Bias Authors’ judgement Support for judgement
Random sequence generation (selection
bias)
Low risk Computerised randomisation scheme
Allocation concealment (selection bias) Unclear risk Not described
Blinding (performance bias and detection
bias)
All outcomes
Low risk No blinding of staff in CGA team. No pa-
tient blinding. There was blinding of the
outcome assessor
Incomplete outcome data (attrition bias)
All outcomes
Unclear risk Analysis as per protocol after initial exclu-
sion of some patients
Selective reporting (reporting bias) Unclear risk No a priori documentation could be found
to judge this item
Other bias Low risk No clear evidence of selection bias, perfor-
mance bias or attrition bias
Baseline outcome measurements similar Low risk Baseline measurements were the same
Baseline characteristics similar Low risk Baseline characteristics were very similar
Study protected against contamination Unclear risk The team operated in different wards
Naughton 1994
Methods Year: 1994
Location: Chicago, Il, USA (Urban Teaching Hospital)
Team/ward?: team
Timing: direct from the emergency department
Trial methodology: randomised controlled trial
Participants Numbers (total): 111
Mean age: 80
Male:female ratio: 40% male (approximately)
Inclusion criteria: 70 years admitted from ED to medicine service and did not regularly
receive care from attending internist on staff at study hospital at time of admission.
Exclusion criteria: admission to ITU or transferred to a surgical service
Patient selection criteria: unselected
Patient selection criteria details: over 70s admitted as an emergency
38Comprehensive geriatric assessment for older adults admitted to hospital (Review)
Copyright © 2011 The Cochrane Collaboration. Published by John Wiley & Sons, Ltd.
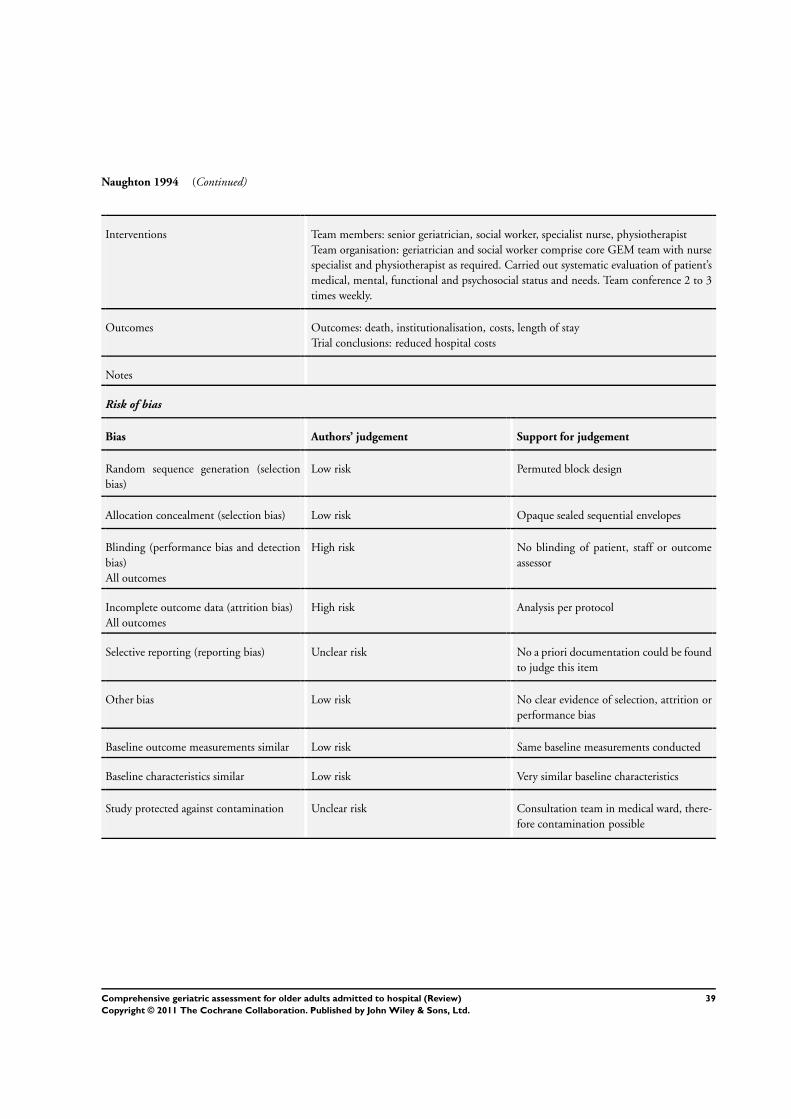
Naughton 1994 (Continued)
Interventions Team members: senior geriatrician, social worker, specialist nurse, physiotherapist
Team organisation: geriatrician and social worker comprise core GEM team with nurse
specialist and physiotherapist as required. Carried out systematic evaluation of patient’s
medical, mental, functional and psychosocial status and needs. Team conference 2 to 3
times weekly.
Outcomes Outcomes: death, institutionalisation, costs, length of stay
Trial conclusions: reduced hospital costs
Notes
Risk of bias
Bias Authors’ judgement Support for judgement
Random sequence generation (selection
bias)
Low risk Permuted block design
Allocation concealment (selection bias) Low risk Opaque sealed sequential envelopes
Blinding (performance bias and detection
bias)
All outcomes
High risk No blinding of patient, staff or outcome
assessor
Incomplete outcome data (attrition bias)
All outcomes
High risk Analysis per protocol
Selective reporting (reporting bias) Unclear risk No a priori documentation could be found
to judge this item
Other bias Low risk No clear evidence of selection, attrition or
performance bias
Baseline outcome measurements similar Low risk Same baseline measurements conducted
Baseline characteristics similar Low risk Very similar baseline characteristics
Study protected against contamination Unclear risk Consultation team in medical ward, there-
fore contamination possible
39Comprehensive geriatric assessment for older adults admitted to hospital (Review)
Copyright © 2011 The Cochrane Collaboration. Published by John Wiley & Sons, Ltd.
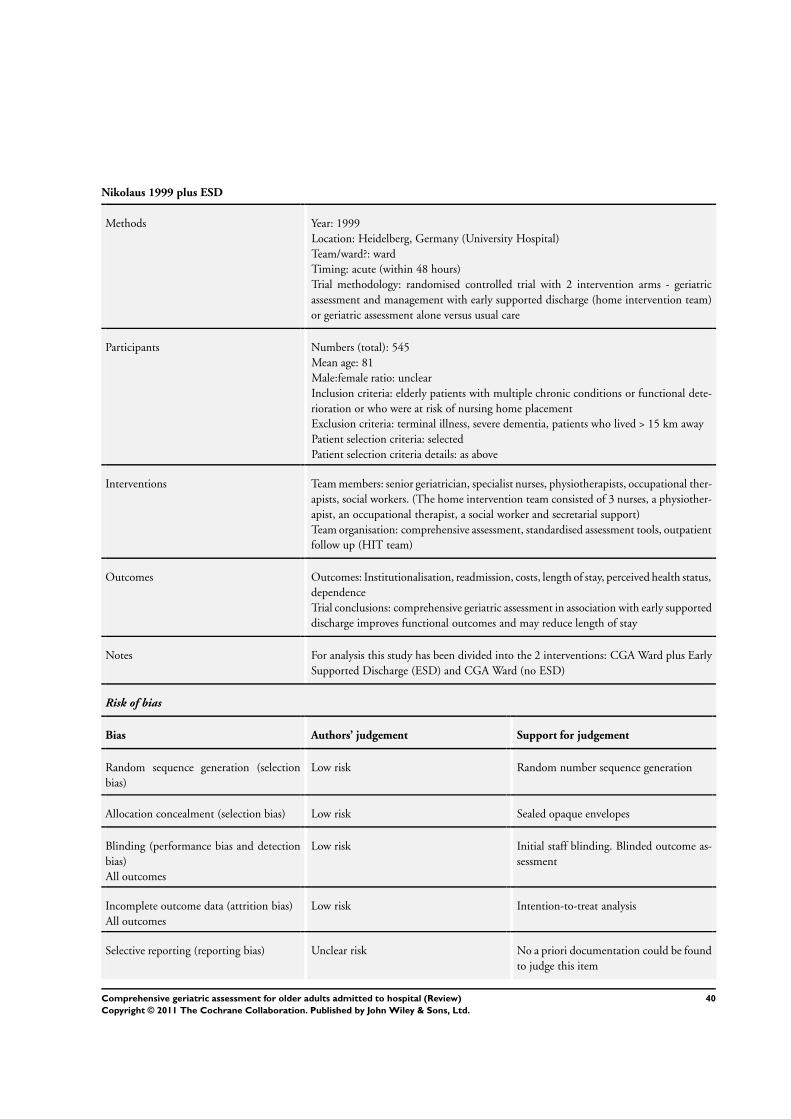
Nikolaus 1999 plus ESD
Methods Year: 1999
Location: Heidelberg, Germany (University Hospital)
Team/ward?: ward
Timing: acute (within 48 hours)
Trial methodology: randomised controlled trial with 2 intervention arms - geriatric
assessment and management with early supported discharge (home intervention team)
or geriatric assessment alone versus usual care
Participants Numbers (total): 545
Mean age: 81
Male:female ratio: unclear
Inclusion criteria: elderly patients with multiple chronic conditions or functional dete-
rioration or who were at risk of nursing home placement
Exclusion criteria: terminal illness, severe dementia, patients who lived > 15 km away
Patient selection criteria: selected
Patient selection criteria details: as above
Interventions Team members: senior geriatrician, specialist nurses, physiotherapists, occupational ther-
apists, social workers. (The home intervention team consisted of 3 nurses, a physiother-
apist, an occupational therapist, a social worker and secretarial support)
Team organisation: comprehensive assessment, standardised assessment tools, outpatient
follow up (HIT team)
Outcomes Outcomes: Institutionalisation, readmission, costs, length of stay, perceived health status,
dependence
Trial conclusions: comprehensive geriatric assessment in association with early supported
discharge improves functional outcomes and may reduce length of stay
Notes For analysis this study has been divided into the 2 interventions: CGA Ward plus Early
Supported Discharge (ESD) and CGA Ward (no ESD)
Risk of bias
Bias Authors’ judgement Support for judgement
Random sequence generation (selection
bias)
Low risk Random number sequence generation
Allocation concealment (selection bias) Low risk Sealed opaque envelopes
Blinding (performance bias and detection
bias)
All outcomes
Low risk Initial staff blinding. Blinded outcome as-
sessment
Incomplete outcome data (attrition bias)
All outcomes
Low risk Intention-to-treat analysis
Selective reporting (reporting bias) Unclear risk No a priori documentation could be found
to judge this item
40Comprehensive geriatric assessment for older adults admitted to hospital (Review)
Copyright © 2011 The Cochrane Collaboration. Published by John Wiley & Sons, Ltd.
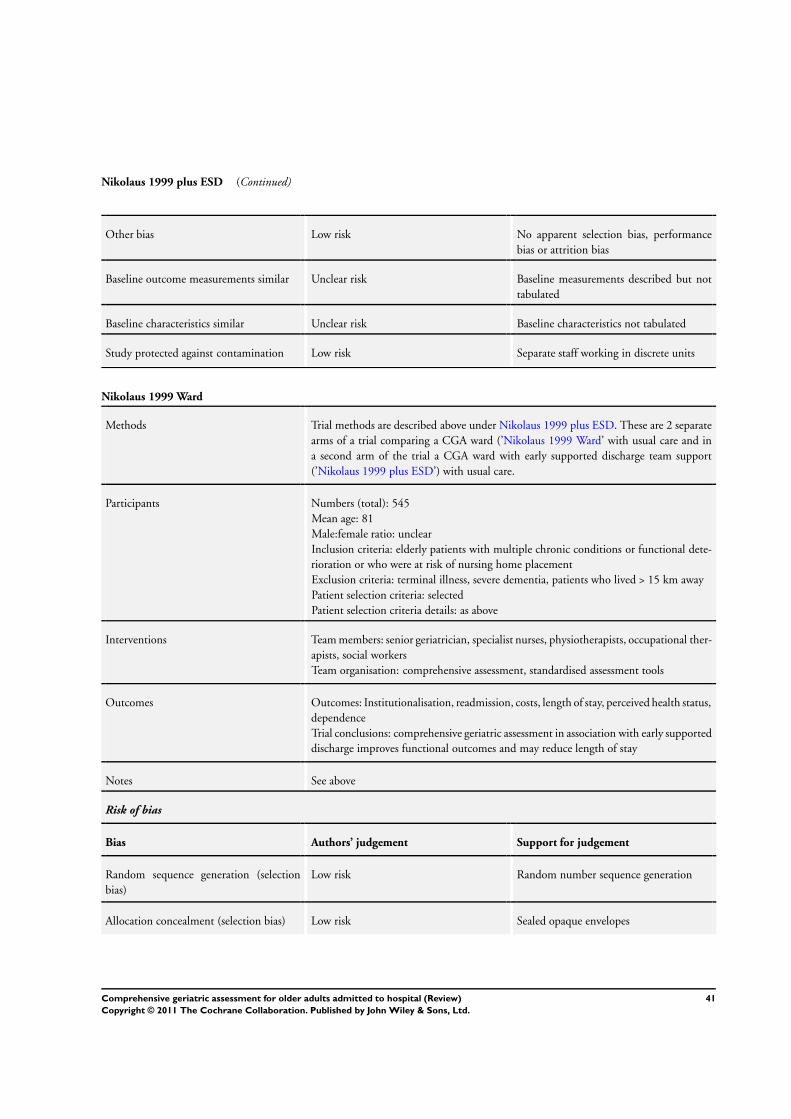
Nikolaus 1999 plus ESD (Continued)
Other bias Low risk No apparent selection bias, performance
bias or attrition bias
Baseline outcome measurements similar Unclear risk Baseline measurements described but not
tabulated
Baseline characteristics similar Unclear risk Baseline characteristics not tabulated
Study protected against contamination Low risk Separate staff working in discrete units
Nikolaus 1999 Ward
Methods Trial methods are described above under Nikolaus 1999 plus ESD. These are 2 separate
arms of a trial comparing a CGA ward (’Nikolaus 1999 Ward’ with usual care and in
a second arm of the trial a CGA ward with early supported discharge team support
(’Nikolaus 1999 plus ESD’) with usual care.
Participants Numbers (total): 545
Mean age: 81
Male:female ratio: unclear
Inclusion criteria: elderly patients with multiple chronic conditions or functional dete-
rioration or who were at risk of nursing home placement
Exclusion criteria: terminal illness, severe dementia, patients who lived > 15 km away
Patient selection criteria: selected
Patient selection criteria details: as above
Interventions Team members: senior geriatrician, specialist nurses, physiotherapists, occupational ther-
apists, social workers
Team organisation: comprehensive assessment, standardised assessment tools
Outcomes Outcomes: Institutionalisation, readmission, costs, length of stay, perceived health status,
dependence
Trial conclusions: comprehensive geriatric assessment in association with early supported
discharge improves functional outcomes and may reduce length of stay
Notes See above
Risk of bias
Bias Authors’ judgement Support for judgement
Random sequence generation (selection
bias)
Low risk Random number sequence generation
Allocation concealment (selection bias) Low risk Sealed opaque envelopes
41Comprehensive geriatric assessment for older adults admitted to hospital (Review)
Copyright © 2011 The Cochrane Collaboration. Published by John Wiley & Sons, Ltd.

Nikolaus 1999 Ward (Continued)
Blinding (performance bias and detection
bias)
All outcomes
Low risk Initial staff blinding. Blinded outcome as-
sessment
Incomplete outcome data (attrition bias)
All outcomes
Low risk Intention-to-treat analysis
Selective reporting (reporting bias) Unclear risk No a priori documentation could be found
to judge this item
Other bias Low risk No apparent selection bias, performance
bias or attrition bias
Baseline outcome measurements similar Unclear risk Baseline measurements described but not
tabulated
Baseline characteristics similar Unclear risk Baseline characteristics not tabulated
Study protected against contamination Low risk Separate staff working in discrete units
Powell 1990
Methods Year: 1990
Location: Manitoba, Canada
Team/ward?: ward
Timing: direct
Trial methodology: randomised controlled trial
Participants Numbers (total): 203
Mean age: uncertain
Male:female ratio: uncertain
Inclusion criteria: acute medical admissions over 74 years
Exclusion criteria: requiring psychiatric or surgical care
Patient selection criteria: unselected
Patient selection criteria details: uncertain. Unselected 75 and over patients
Interventions Team members: unknown
Team organisation: unknown
Outcomes Outcomes: death, institutionalisation, cognitive function, depression, dependence
Trial conclusions: non-significant differences in favour of the treatment group
Notes Abstract only available
Risk of bias
Bias Authors’ judgement Support for judgement
42Comprehensive geriatric assessment for older adults admitted to hospital (Review)
Copyright © 2011 The Cochrane Collaboration. Published by John Wiley & Sons, Ltd.
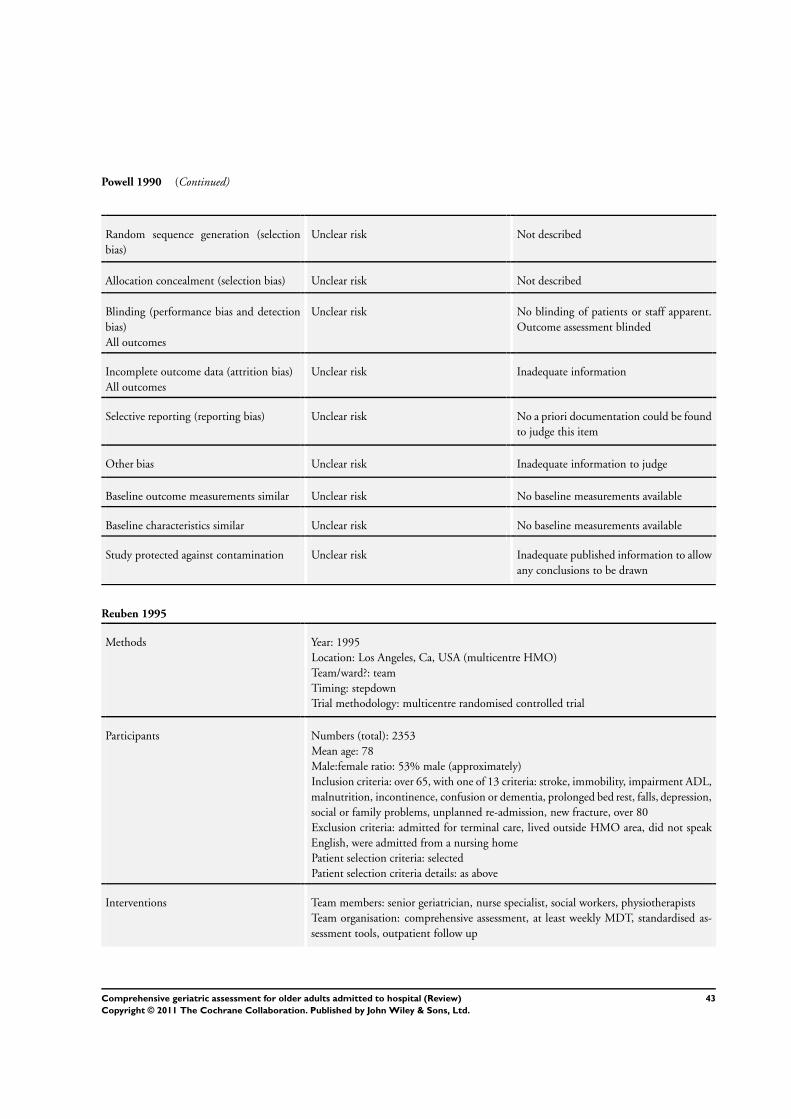
Powell 1990 (Continued)
Random sequence generation (selection
bias)
Unclear risk Not described
Allocation concealment (selection bias) Unclear risk Not described
Blinding (performance bias and detection
bias)
All outcomes
Unclear risk No blinding of patients or staff apparent.
Outcome assessment blinded
Incomplete outcome data (attrition bias)
All outcomes
Unclear risk Inadequate information
Selective reporting (reporting bias) Unclear risk No a priori documentation could be found
to judge this item
Other bias Unclear risk Inadequate information to judge
Baseline outcome measurements similar Unclear risk No baseline measurements available
Baseline characteristics similar Unclear risk No baseline measurements available
Study protected against contamination Unclear risk Inadequate published information to allow
any conclusions to be drawn
Reuben 1995
Methods Year: 1995
Location: Los Angeles, Ca, USA (multicentre HMO)
Team/ward?: team
Timing: stepdown
Trial methodology: multicentre randomised controlled trial
Participants Numbers (total): 2353
Mean age: 78
Male:female ratio: 53% male (approximately)
Inclusion criteria: over 65, with one of 13 criteria: stroke, immobility, impairment ADL,
malnutrition, incontinence, confusion or dementia, prolonged bed rest, falls, depression,
social or family problems, unplanned re-admission, new fracture, over 80
Exclusion criteria: admitted for terminal care, lived outside HMO area, did not speak
English, were admitted from a nursing home
Patient selection criteria: selected
Patient selection criteria details: as above
Interventions Team members: senior geriatrician, nurse specialist, social workers, physiotherapists
Team organisation: comprehensive assessment, at least weekly MDT, standardised as-
sessment tools, outpatient follow up
43Comprehensive geriatric assessment for older adults admitted to hospital (Review)
Copyright © 2011 The Cochrane Collaboration. Published by John Wiley & Sons, Ltd.

Reuben 1995 (Continued)
Outcomes Outcomes: death, institutionalisation, dependency, cognitive status, perceived health
status
Trial conclusions: no significant differences identified in mortality, functional status or
perceived health
Notes
Risk of bias
Bias Authors’ judgement Support for judgement
Random sequence generation (selection
bias)
Low risk Random number tables in blocks of 4
Allocation concealment (selection bias) Unclear risk Not described
Blinding (performance bias and detection
bias)
All outcomes
High risk No blinding of patient, staff or outcome
assessor. Baseline blinded assessments only
Incomplete outcome data (attrition bias)
All outcomes
Low risk Intention-to-treat analysis. Some selective
subgroup reporting however
Selective reporting (reporting bias) Low risk Prior documented description of trial de-
sign and rationale
Other bias Low risk No apparent selection bias or attrition bias
Baseline outcome measurements similar Low risk Measurements at baseline consistent be-
tween groups
Baseline characteristics similar Low risk Both groups appear similar in baseline
characteristics
Study protected against contamination Unclear risk Not described. Mobile team assessing pa-
tients in different wards. Contamination
(e.g. of routine ward staff practices) possi-
ble.
44Comprehensive geriatric assessment for older adults admitted to hospital (Review)
Copyright © 2011 The Cochrane Collaboration. Published by John Wiley & Sons, Ltd.

Rubenstein 1984
Methods Year: 1984
Location: Los Angeles, Ca, USA (VA hospital)
Team/ward?: ward
Timing: stepdown
Trial methodology: randomised controlled trial
Participants Numbers (total): 123
Mean age: 78
Male:female ratio: 96% male
Inclusion criteria: patients over 65 still in hospital one week after admission with persis-
tent medical, functional or psychosocial problem
Exclusion criteria: severe dementia or disabling disease resistant to further medical man-
agement; those with no social supports; those functioning well who would definitely
return to community
Patient selection criteria: selected
Patient selection criteria details: as above - functional impairment, but independent or
severely ill and dependent patients excluded
Interventions Team members: senior geriatrician, trainee geriatrician, specialist nurses, ward nurses,
social workers, physiotherapists, occupational therapists, dietician, audiologists, dentists
and psychologists
Team organisation: at least weekly MDT meetings, standardised assessment tools, out-
patient follow up
Outcomes Outcomes: death, institutionalisation, costs, cognitive status, morale
Trial conclusions: reduced mortality, reduced institutionalisation, improved functional
status and morale
Notes
Risk of bias
Bias Authors’ judgement Support for judgement
Random sequence generation (selection
bias)
Unclear risk Not described
Allocation concealment (selection bias) Unclear risk Not described
Blinding (performance bias and detection
bias)
All outcomes
High risk No blinding of patient, staff or outcome
assessor
Incomplete outcome data (attrition bias)
All outcomes
Low risk Analysis of outcomes by intention-to-treat
Selective reporting (reporting bias) Unclear risk No a priori documentation could be found
to judge this item
45Comprehensive geriatric assessment for older adults admitted to hospital (Review)
Copyright © 2011 The Cochrane Collaboration. Published by John Wiley & Sons, Ltd.
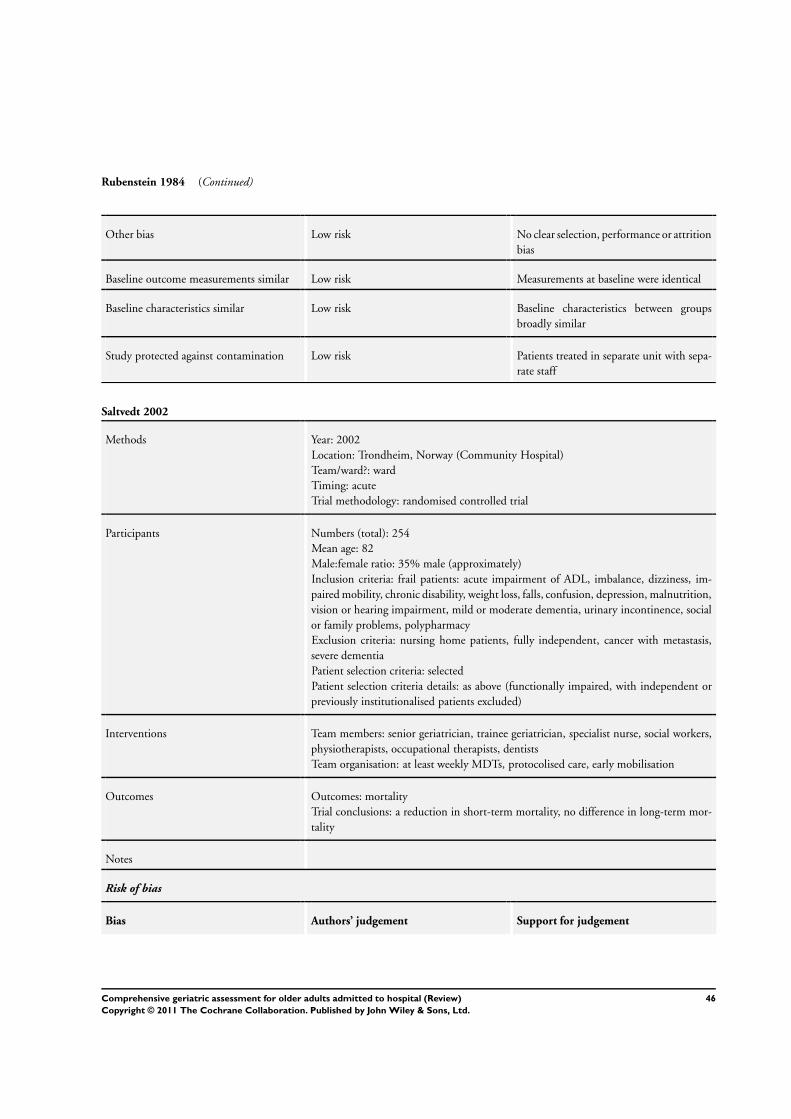
Rubenstein 1984 (Continued)
Other bias Low risk No clear selection, performance or attrition
bias
Baseline outcome measurements similar Low risk Measurements at baseline were identical
Baseline characteristics similar Low risk Baseline characteristics between groups
broadly similar
Study protected against contamination Low risk Patients treated in separate unit with sepa-
rate staff
Saltvedt 2002
Methods Year: 2002
Location: Trondheim, Norway (Community Hospital)
Team/ward?: ward
Timing: acute
Trial methodology: randomised controlled trial
Participants Numbers (total): 254
Mean age: 82
Male:female ratio: 35% male (approximately)
Inclusion criteria: frail patients: acute impairment of ADL, imbalance, dizziness, im-
paired mobility, chronic disability, weight loss, falls, confusion, depression, malnutrition,
vision or hearing impairment, mild or moderate dementia, urinary incontinence, social
or family problems, polypharmacy
Exclusion criteria: nursing home patients, fully independent, cancer with metastasis,
severe dementia
Patient selection criteria: selected
Patient selection criteria details: as above (functionally impaired, with independent or
previously institutionalised patients excluded)
Interventions Team members: senior geriatrician, trainee geriatrician, specialist nurse, social workers,
physiotherapists, occupational therapists, dentists
Team organisation: at least weekly MDTs, protocolised care, early mobilisation
Outcomes Outcomes: mortality
Trial conclusions: a reduction in short-term mortality, no difference in long-term mor-
tality
Notes
Risk of bias
Bias Authors’ judgement Support for judgement
46Comprehensive geriatric assessment for older adults admitted to hospital (Review)
Copyright © 2011 The Cochrane Collaboration. Published by John Wiley & Sons, Ltd.
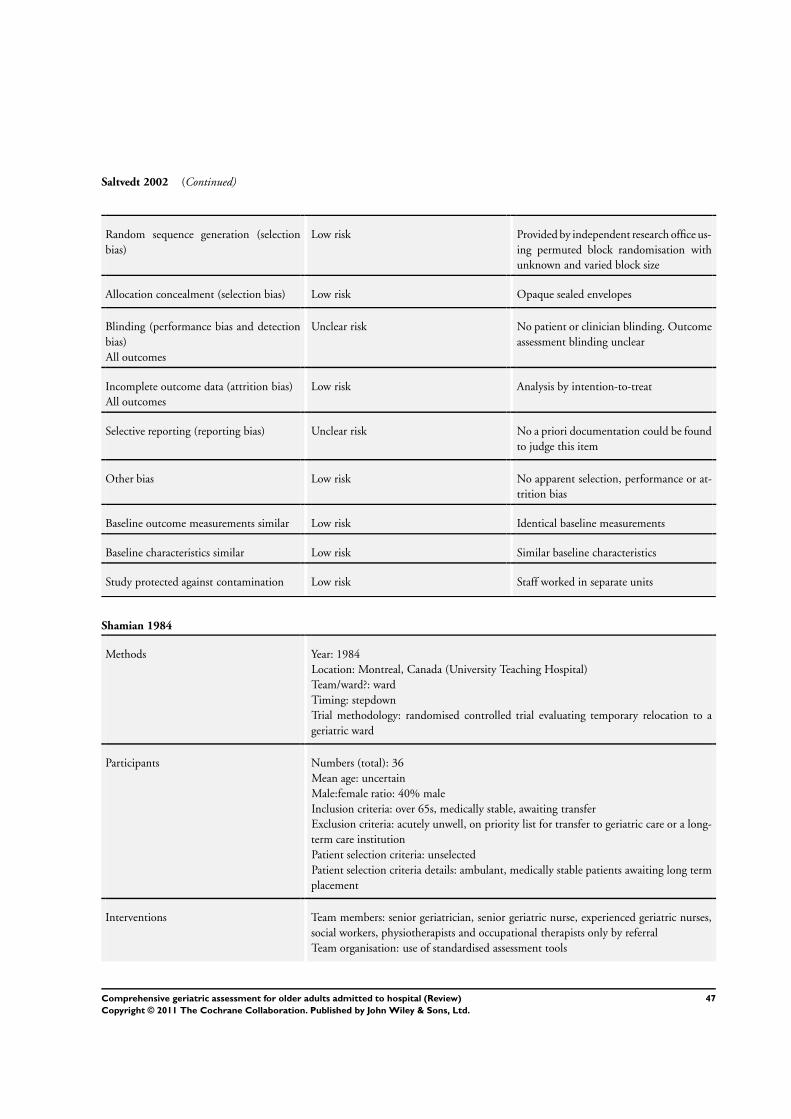
Saltvedt 2002 (Continued)
Random sequence generation (selection
bias)
Low risk Provided by independent research office us-
ing permuted block randomisation with
unknown and varied block size
Allocation concealment (selection bias) Low risk Opaque sealed envelopes
Blinding (performance bias and detection
bias)
All outcomes
Unclear risk No patient or clinician blinding. Outcome
assessment blinding unclear
Incomplete outcome data (attrition bias)
All outcomes
Low risk Analysis by intention-to-treat
Selective reporting (reporting bias) Unclear risk No a priori documentation could be found
to judge this item
Other bias Low risk No apparent selection, performance or at-
trition bias
Baseline outcome measurements similar Low risk Identical baseline measurements
Baseline characteristics similar Low risk Similar baseline characteristics
Study protected against contamination Low risk Staff worked in separate units
Shamian 1984
Methods Year: 1984
Location: Montreal, Canada (University Teaching Hospital)
Team/ward?: ward
Timing: stepdown
Trial methodology: randomised controlled trial evaluating temporary relocation to a
geriatric ward
Participants Numbers (total): 36
Mean age: uncertain
Male:female ratio: 40% male
Inclusion criteria: over 65s, medically stable, awaiting transfer
Exclusion criteria: acutely unwell, on priority list for transfer to geriatric care or a long-
term care institution
Patient selection criteria: unselected
Patient selection criteria details: ambulant, medically stable patients awaiting long term
placement
Interventions Team members: senior geriatrician, senior geriatric nurse, experienced geriatric nurses,
social workers, physiotherapists and occupational therapists only by referral
Team organisation: use of standardised assessment tools
47Comprehensive geriatric assessment for older adults admitted to hospital (Review)
Copyright © 2011 The Cochrane Collaboration. Published by John Wiley & Sons, Ltd.
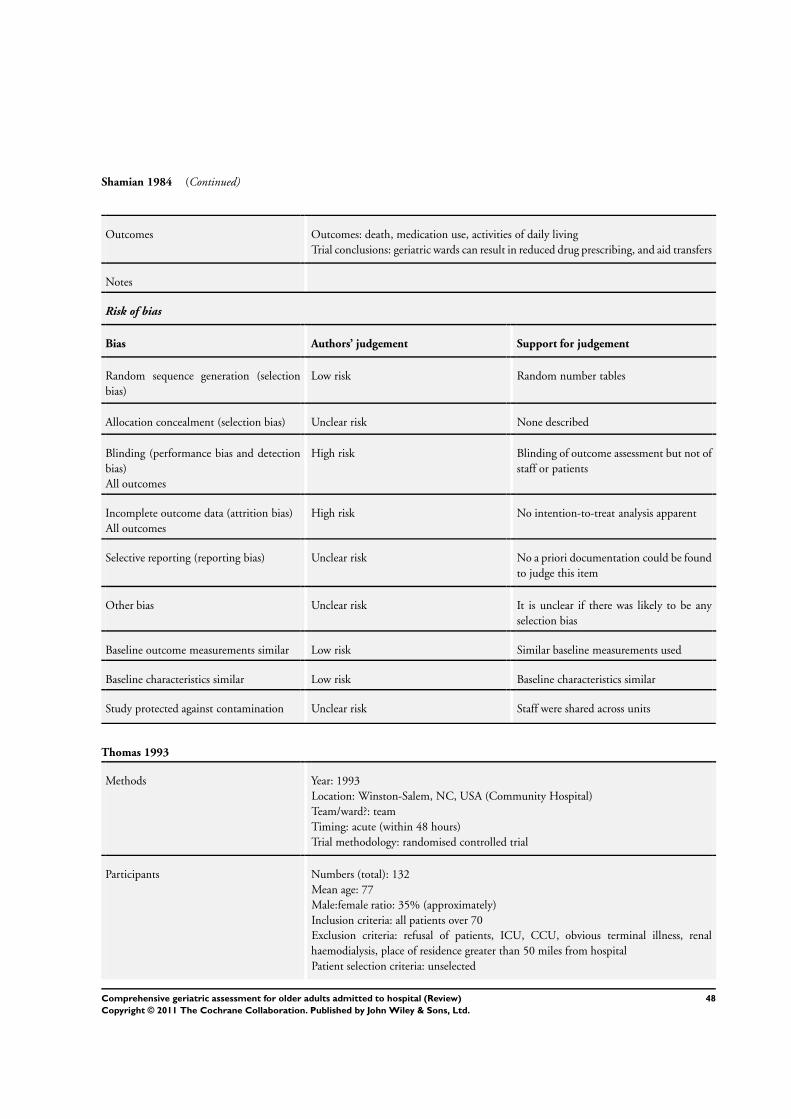
Shamian 1984 (Continued)
Outcomes Outcomes: death, medication use, activities of daily living
Trial conclusions: geriatric wards can result in reduced drug prescribing, and aid transfers
Notes
Risk of bias
Bias Authors’ judgement Support for judgement
Random sequence generation (selection
bias)
Low risk Random number tables
Allocation concealment (selection bias) Unclear risk None described
Blinding (performance bias and detection
bias)
All outcomes
High risk Blinding of outcome assessment but not of
staff or patients
Incomplete outcome data (attrition bias)
All outcomes
High risk No intention-to-treat analysis apparent
Selective reporting (reporting bias) Unclear risk No a priori documentation could be found
to judge this item
Other bias Unclear risk It is unclear if there was likely to be any
selection bias
Baseline outcome measurements similar Low risk Similar baseline measurements used
Baseline characteristics similar Low risk Baseline characteristics similar
Study protected against contamination Unclear risk Staff were shared across units
Thomas 1993
Methods Year: 1993
Location: Winston-Salem, NC, USA (Community Hospital)
Team/ward?: team
Timing: acute (within 48 hours)
Trial methodology: randomised controlled trial
Participants Numbers (total): 132
Mean age: 77
Male:female ratio: 35% (approximately)
Inclusion criteria: all patients over 70
Exclusion criteria: refusal of patients, ICU, CCU, obvious terminal illness, renal
haemodialysis, place of residence greater than 50 miles from hospital
Patient selection criteria: unselected
48Comprehensive geriatric assessment for older adults admitted to hospital (Review)
Copyright © 2011 The Cochrane Collaboration. Published by John Wiley & Sons, Ltd.

Thomas 1993 (Continued)
Patient selection criteria details: all over 70s
Interventions Team members: senior geriatrician, geriatric nurse specialist, social worker, dietician,
pharmacist, physiotherapist
Team organisation: comprehensive assessment, and recommendations made in patients’
charts as well as follow up visits versus assessment with no recommendations in the
control group
Outcomes Outcomes: death, dependence
Trial conclusions: short-term reductions in mortality which still remain at one year.
Additional trends to better functional status and reduced readmission
Notes
Risk of bias
Bias Authors’ judgement Support for judgement
Random sequence generation (selection
bias)
Low risk Computer-generated random numbers
Allocation concealment (selection bias) Unclear risk Not described
Blinding (performance bias and detection
bias)
All outcomes
High risk No blinding of staff or outcome assessment
Incomplete outcome data (attrition bias)
All outcomes
Unclear risk Analysis as per protocol
Selective reporting (reporting bias) Unclear risk No a priori documentation could be found
to judge this item
Other bias Low risk No apparent attrition bias. No obvious per-
formance bias.
Baseline outcome measurements similar Low risk Baseline measurements are the same
Baseline characteristics similar Low risk Baseline characteristics are similar
Study protected against contamination High risk Mobile team in different wards. Contami-
nation (e.g. of routine ward staff practices)
possible.
49Comprehensive geriatric assessment for older adults admitted to hospital (Review)
Copyright © 2011 The Cochrane Collaboration. Published by John Wiley & Sons, Ltd.
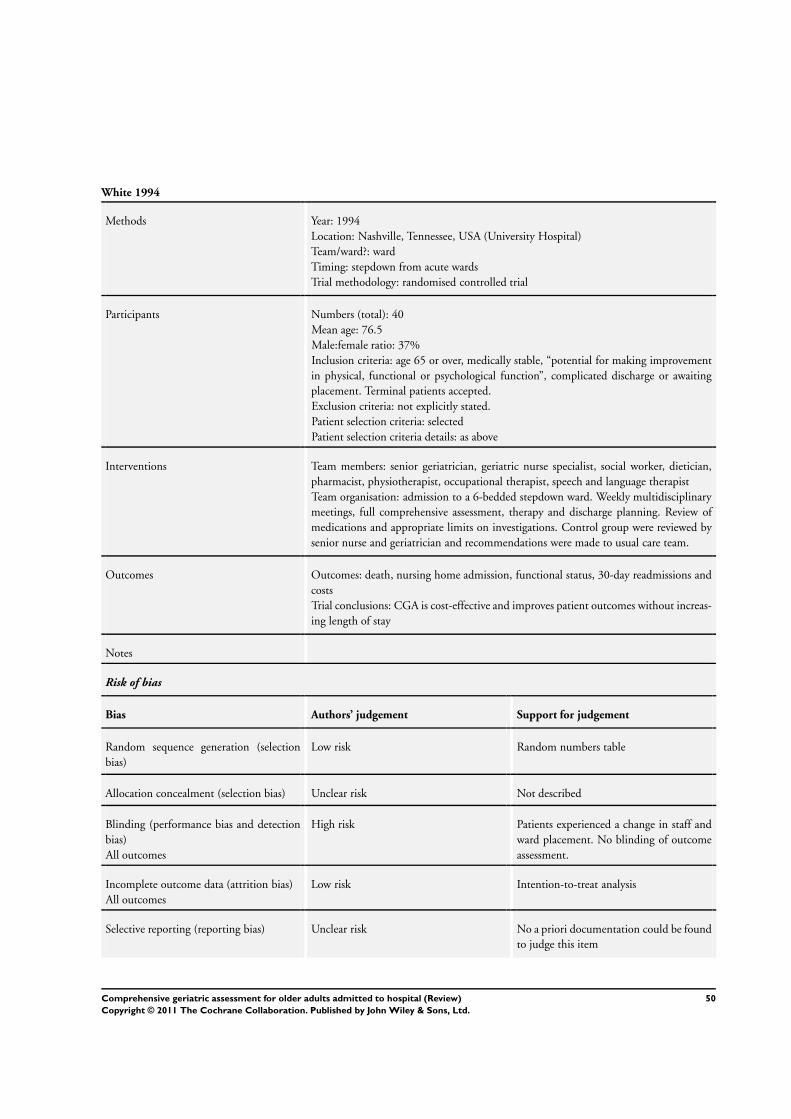
White 1994
Methods Year: 1994
Location: Nashville, Tennessee, USA (University Hospital)
Team/ward?: ward
Timing: stepdown from acute wards
Trial methodology: randomised controlled trial
Participants Numbers (total): 40
Mean age: 76.5
Male:female ratio: 37%
Inclusion criteria: age 65 or over, medically stable, “potential for making improvement
in physical, functional or psychological function”, complicated discharge or awaiting
placement. Terminal patients accepted.
Exclusion criteria: not explicitly stated.
Patient selection criteria: selected
Patient selection criteria details: as above
Interventions Team members: senior geriatrician, geriatric nurse specialist, social worker, dietician,
pharmacist, physiotherapist, occupational therapist, speech and language therapist
Team organisation: admission to a 6-bedded stepdown ward. Weekly multidisciplinary
meetings, full comprehensive assessment, therapy and discharge planning. Review of
medications and appropriate limits on investigations. Control group were reviewed by
senior nurse and geriatrician and recommendations were made to usual care team.
Outcomes Outcomes: death, nursing home admission, functional status, 30-day readmissions and
costs
Trial conclusions: CGA is cost-effective and improves patient outcomes without increas-
ing length of stay
Notes
Risk of bias
Bias Authors’ judgement Support for judgement
Random sequence generation (selection
bias)
Low risk Random numbers table
Allocation concealment (selection bias) Unclear risk Not described
Blinding (performance bias and detection
bias)
All outcomes
High risk Patients experienced a change in staff and
ward placement. No blinding of outcome
assessment.
Incomplete outcome data (attrition bias)
All outcomes
Low risk Intention-to-treat analysis
Selective reporting (reporting bias) Unclear risk No a priori documentation could be found
to judge this item
50Comprehensive geriatric assessment for older adults admitted to hospital (Review)
Copyright © 2011 The Cochrane Collaboration. Published by John Wiley & Sons, Ltd.
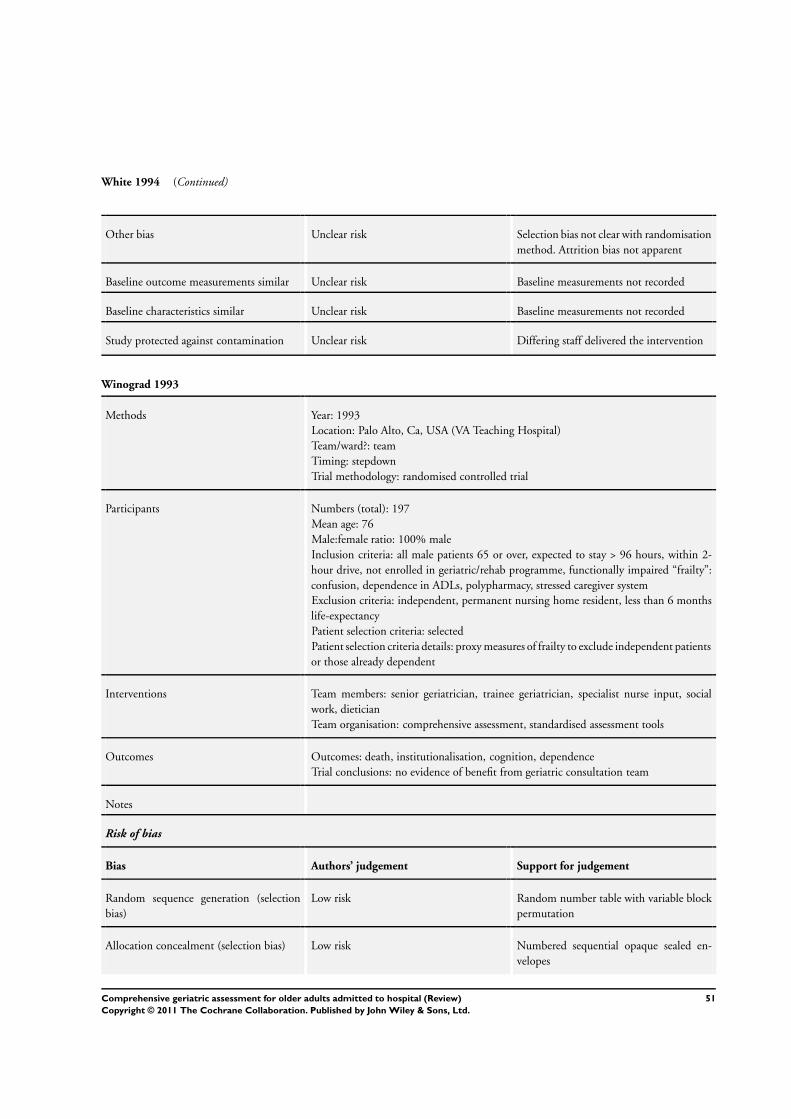
White 1994 (Continued)
Other bias Unclear risk Selection bias not clear with randomisation
method. Attrition bias not apparent
Baseline outcome measurements similar Unclear risk Baseline measurements not recorded
Baseline characteristics similar Unclear risk Baseline measurements not recorded
Study protected against contamination Unclear risk Differing staff delivered the intervention
Winograd 1993
Methods Year: 1993
Location: Palo Alto, Ca, USA (VA Teaching Hospital)
Team/ward?: team
Timing: stepdown
Trial methodology: randomised controlled trial
Participants Numbers (total): 197
Mean age: 76
Male:female ratio: 100% male
Inclusion criteria: all male patients 65 or over, expected to stay > 96 hours, within 2-
hour drive, not enrolled in geriatric/rehab programme, functionally impaired “frailty”:
confusion, dependence in ADLs, polypharmacy, stressed caregiver system
Exclusion criteria: independent, permanent nursing home resident, less than 6 months
life-expectancy
Patient selection criteria: selected
Patient selection criteria details: proxy measures of frailty to exclude independent patients
or those already dependent
Interventions Team members: senior geriatrician, trainee geriatrician, specialist nurse input, social
work, dietician
Team organisation: comprehensive assessment, standardised assessment tools
Outcomes Outcomes: death, institutionalisation, cognition, dependence
Trial conclusions: no evidence of benefit from geriatric consultation team
Notes
Risk of bias
Bias Authors’ judgement Support for judgement
Random sequence generation (selection
bias)
Low risk Random number table with variable block
permutation
Allocation concealment (selection bias) Low risk Numbered sequential opaque sealed en-
velopes
51Comprehensive geriatric assessment for older adults admitted to hospital (Review)
Copyright © 2011 The Cochrane Collaboration. Published by John Wiley & Sons, Ltd.
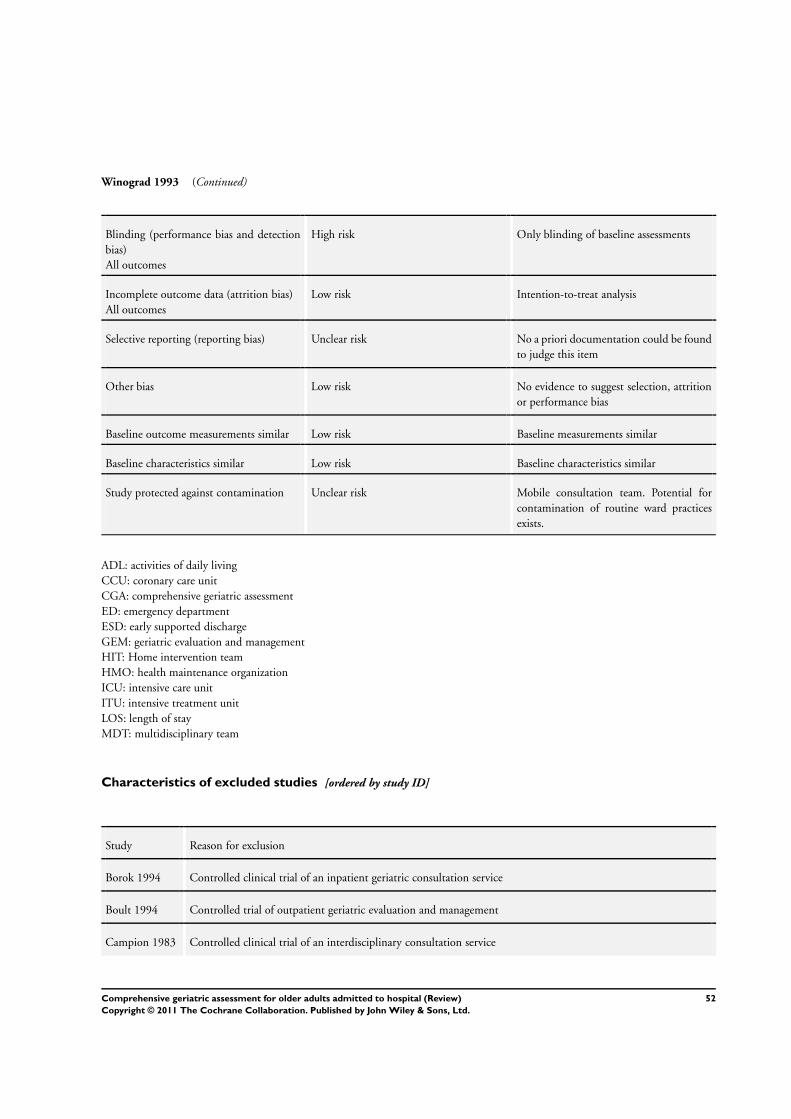
Winograd 1993 (Continued)
Blinding (performance bias and detection
bias)
All outcomes
High risk Only blinding of baseline assessments
Incomplete outcome data (attrition bias)
All outcomes
Low risk Intention-to-treat analysis
Selective reporting (reporting bias) Unclear risk No a priori documentation could be found
to judge this item
Other bias Low risk No evidence to suggest selection, attrition
or performance bias
Baseline outcome measurements similar Low risk Baseline measurements similar
Baseline characteristics similar Low risk Baseline characteristics similar
Study protected against contamination Unclear risk Mobile consultation team. Potential for
contamination of routine ward practices
exists.
ADL: activities of daily living
CCU: coronary care unit
CGA: comprehensive geriatric assessment
ED: emergency department
ESD: early supported discharge
GEM: geriatric evaluation and management
HIT: Home intervention team
HMO: health maintenance organization
ICU: intensive care unit
ITU: intensive treatment unit
LOS: length of stay
MDT: multidisciplinary team
Characteristics of excluded studies [ordered by study ID]
Study Reason for exclusion
Borok 1994 Controlled clinical trial of an inpatient geriatric consultation service
Boult 1994 Controlled trial of outpatient geriatric evaluation and management
Campion 1983 Controlled clinical trial of an interdisciplinary consultation service
52Comprehensive geriatric assessment for older adults admitted to hospital (Review)
Copyright © 2011 The Cochrane Collaboration. Published by John Wiley & Sons, Ltd.
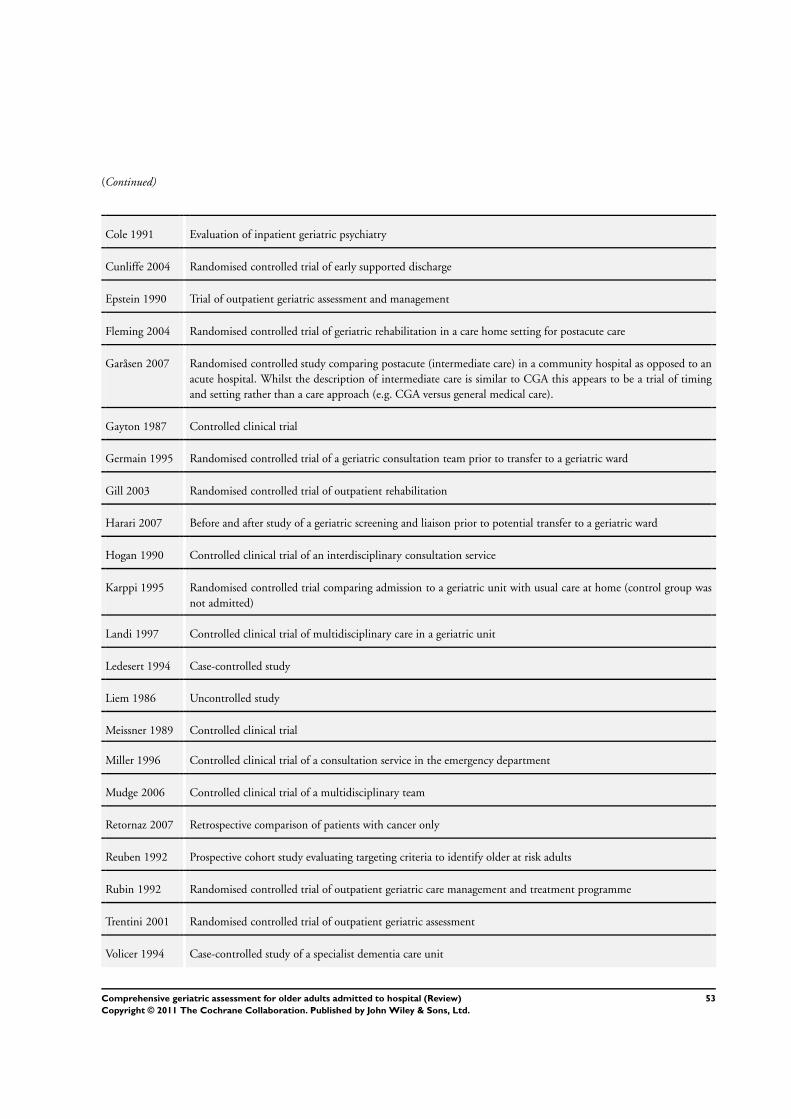
(Continued)
Cole 1991 Evaluation of inpatient geriatric psychiatry
Cunliffe 2004 Randomised controlled trial of early supported discharge
Epstein 1990 Trial of outpatient geriatric assessment and management
Fleming 2004 Randomised controlled trial of geriatric rehabilitation in a care home setting for postacute care
Garåsen 2007 Randomised controlled study comparing postacute (intermediate care) in a community hospital as opposed to an
acute hospital. Whilst the description of intermediate care is similar to CGA this appears to be a trial of timing
and setting rather than a care approach (e.g. CGA versus general medical care).
Gayton 1987 Controlled clinical trial
Germain 1995 Randomised controlled trial of a geriatric consultation team prior to transfer to a geriatric ward
Gill 2003 Randomised controlled trial of outpatient rehabilitation
Harari 2007 Before and after study of a geriatric screening and liaison prior to potential transfer to a geriatric ward
Hogan 1990 Controlled clinical trial of an interdisciplinary consultation service
Karppi 1995 Randomised controlled trial comparing admission to a geriatric unit with usual care at home (control group was
not admitted)
Landi 1997 Controlled clinical trial of multidisciplinary care in a geriatric unit
Ledesert 1994 Case-controlled study
Liem 1986 Uncontrolled study
Meissner 1989 Controlled clinical trial
Miller 1996 Controlled clinical trial of a consultation service in the emergency department
Mudge 2006 Controlled clinical trial of a multidisciplinary team
Retornaz 2007 Retrospective comparison of patients with cancer only
Reuben 1992 Prospective cohort study evaluating targeting criteria to identify older at risk adults
Rubin 1992 Randomised controlled trial of outpatient geriatric care management and treatment programme
Trentini 2001 Randomised controlled trial of outpatient geriatric assessment
Volicer 1994 Case-controlled study of a specialist dementia care unit
53Comprehensive geriatric assessment for older adults admitted to hospital (Review)
Copyright © 2011 The Cochrane Collaboration. Published by John Wiley & Sons, Ltd.

(Continued)
Young 2005 Randomised controlled study of comparison between Community Hospital care (CGA) and District General
Hospital care (CGA)
CGA: comprehensive geriatric assessment
54Comprehensive geriatric assessment for older adults admitted to hospital (Review)
Copyright © 2011 The Cochrane Collaboration. Published by John Wiley & Sons, Ltd.
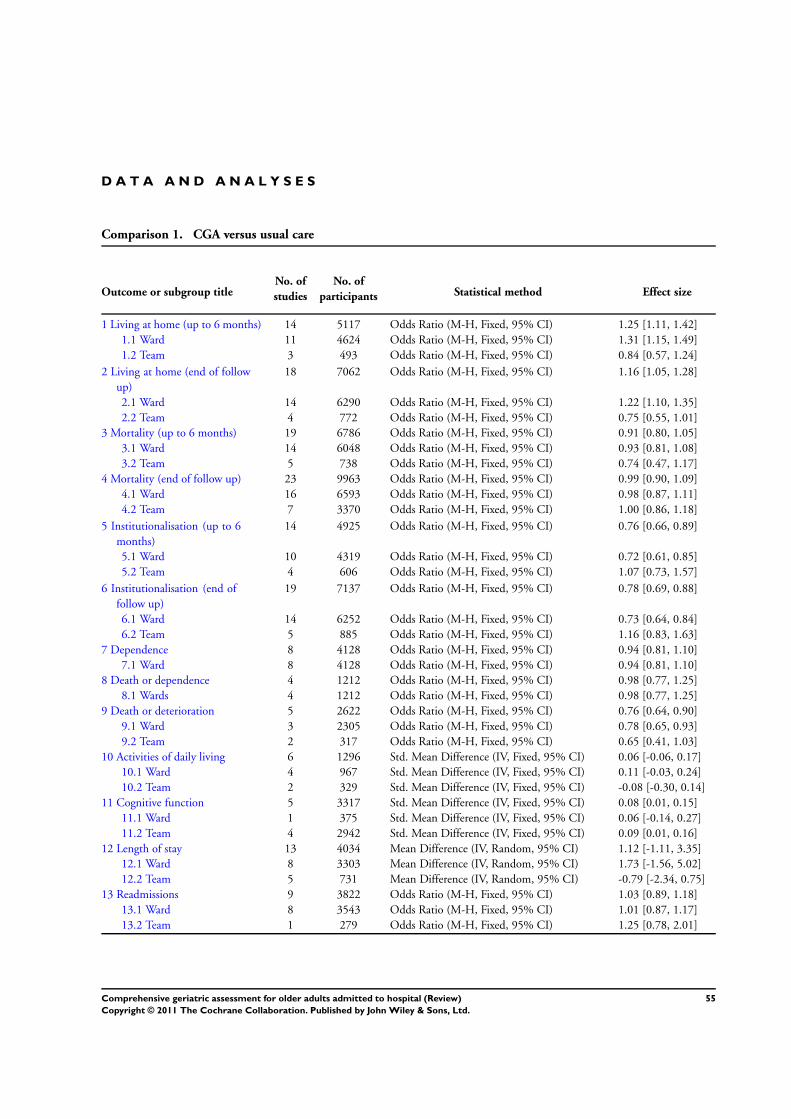
D A T A A N D A N A L Y S E S
Comparison 1. CGA versus usual care
Outcome or subgroup titleNo. of
studies
No. of
participants Statistical method Effect size
1 Living at home (up to 6 months) 14 5117 Odds Ratio (M-H, Fixed, 95% CI) 1.25 [1.11, 1.42]
1.1 Ward 11 4624 Odds Ratio (M-H, Fixed, 95% CI) 1.31 [1.15, 1.49]
1.2 Team 3 493 Odds Ratio (M-H, Fixed, 95% CI) 0.84 [0.57, 1.24]
2 Living at home (end of follow
up)
18 7062 Odds Ratio (M-H, Fixed, 95% CI) 1.16 [1.05, 1.28]
2.1 Ward 14 6290 Odds Ratio (M-H, Fixed, 95% CI) 1.22 [1.10, 1.35]
2.2 Team 4 772 Odds Ratio (M-H, Fixed, 95% CI) 0.75 [0.55, 1.01]
3 Mortality (up to 6 months) 19 6786 Odds Ratio (M-H, Fixed, 95% CI) 0.91 [0.80, 1.05]
3.1 Ward 14 6048 Odds Ratio (M-H, Fixed, 95% CI) 0.93 [0.81, 1.08]
3.2 Team 5 738 Odds Ratio (M-H, Fixed, 95% CI) 0.74 [0.47, 1.17]
4 Mortality (end of follow up) 23 9963 Odds Ratio (M-H, Fixed, 95% CI) 0.99 [0.90, 1.09]
4.1 Ward 16 6593 Odds Ratio (M-H, Fixed, 95% CI) 0.98 [0.87, 1.11]
4.2 Team 7 3370 Odds Ratio (M-H, Fixed, 95% CI) 1.00 [0.86, 1.18]
5 Institutionalisation (up to 6
months)
14 4925 Odds Ratio (M-H, Fixed, 95% CI) 0.76 [0.66, 0.89]
5.1 Ward 10 4319 Odds Ratio (M-H, Fixed, 95% CI) 0.72 [0.61, 0.85]
5.2 Team 4 606 Odds Ratio (M-H, Fixed, 95% CI) 1.07 [0.73, 1.57]
6 Institutionalisation (end of
follow up)
19 7137 Odds Ratio (M-H, Fixed, 95% CI) 0.78 [0.69, 0.88]
6.1 Ward 14 6252 Odds Ratio (M-H, Fixed, 95% CI) 0.73 [0.64, 0.84]
6.2 Team 5 885 Odds Ratio (M-H, Fixed, 95% CI) 1.16 [0.83, 1.63]
7 Dependence 8 4128 Odds Ratio (M-H, Fixed, 95% CI) 0.94 [0.81, 1.10]
7.1 Ward 8 4128 Odds Ratio (M-H, Fixed, 95% CI) 0.94 [0.81, 1.10]
8 Death or dependence 4 1212 Odds Ratio (M-H, Fixed, 95% CI) 0.98 [0.77, 1.25]
8.1 Wards 4 1212 Odds Ratio (M-H, Fixed, 95% CI) 0.98 [0.77, 1.25]
9 Death or deterioration 5 2622 Odds Ratio (M-H, Fixed, 95% CI) 0.76 [0.64, 0.90]
9.1 Ward 3 2305 Odds Ratio (M-H, Fixed, 95% CI) 0.78 [0.65, 0.93]
9.2 Team 2 317 Odds Ratio (M-H, Fixed, 95% CI) 0.65 [0.41, 1.03]
10 Activities of daily living 6 1296 Std. Mean Difference (IV, Fixed, 95% CI) 0.06 [-0.06, 0.17]
10.1 Ward 4 967 Std. Mean Difference (IV, Fixed, 95% CI) 0.11 [-0.03, 0.24]
10.2 Team 2 329 Std. Mean Difference (IV, Fixed, 95% CI) -0.08 [-0.30, 0.14]
11 Cognitive function 5 3317 Std. Mean Difference (IV, Fixed, 95% CI) 0.08 [0.01, 0.15]
11.1 Ward 1 375 Std. Mean Difference (IV, Fixed, 95% CI) 0.06 [-0.14, 0.27]
11.2 Team 4 2942 Std. Mean Difference (IV, Fixed, 95% CI) 0.09 [0.01, 0.16]
12 Length of stay 13 4034 Mean Difference (IV, Random, 95% CI) 1.12 [-1.11, 3.35]
12.1 Ward 8 3303 Mean Difference (IV, Random, 95% CI) 1.73 [-1.56, 5.02]
12.2 Team 5 731 Mean Difference (IV, Random, 95% CI) -0.79 [-2.34, 0.75]
13 Readmissions 9 3822 Odds Ratio (M-H, Fixed, 95% CI) 1.03 [0.89, 1.18]
13.1 Ward 8 3543 Odds Ratio (M-H, Fixed, 95% CI) 1.01 [0.87, 1.17]
13.2 Team 1 279 Odds Ratio (M-H, Fixed, 95% CI) 1.25 [0.78, 2.01]
55Comprehensive geriatric assessment for older adults admitted to hospital (Review)
Copyright © 2011 The Cochrane Collaboration. Published by John Wiley & Sons, Ltd.
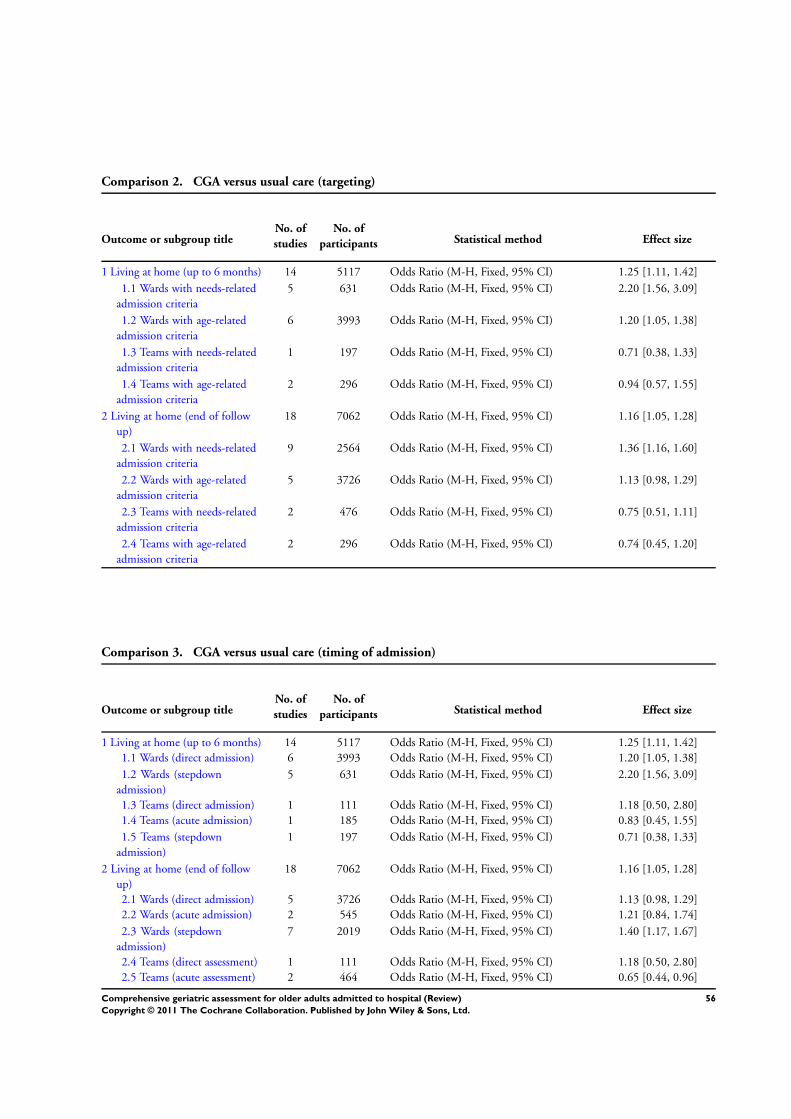
Comparison 2. CGA versus usual care (targeting)
Outcome or subgroup titleNo. of
studies
No. of
participants Statistical method Effect size
1 Living at home (up to 6 months) 14 5117 Odds Ratio (M-H, Fixed, 95% CI) 1.25 [1.11, 1.42]
1.1 Wards with needs-related
admission criteria
5 631 Odds Ratio (M-H, Fixed, 95% CI) 2.20 [1.56, 3.09]
1.2 Wards with age-related
admission criteria
6 3993 Odds Ratio (M-H, Fixed, 95% CI) 1.20 [1.05, 1.38]
1.3 Teams with needs-related
admission criteria
1 197 Odds Ratio (M-H, Fixed, 95% CI) 0.71 [0.38, 1.33]
1.4 Teams with age-related
admission criteria
2 296 Odds Ratio (M-H, Fixed, 95% CI) 0.94 [0.57, 1.55]
2 Living at home (end of follow
up)
18 7062 Odds Ratio (M-H, Fixed, 95% CI) 1.16 [1.05, 1.28]
2.1 Wards with needs-related
admission criteria
9 2564 Odds Ratio (M-H, Fixed, 95% CI) 1.36 [1.16, 1.60]
2.2 Wards with age-related
admission criteria
5 3726 Odds Ratio (M-H, Fixed, 95% CI) 1.13 [0.98, 1.29]
2.3 Teams with needs-related
admission criteria
2 476 Odds Ratio (M-H, Fixed, 95% CI) 0.75 [0.51, 1.11]
2.4 Teams with age-related
admission criteria
2 296 Odds Ratio (M-H, Fixed, 95% CI) 0.74 [0.45, 1.20]
Comparison 3. CGA versus usual care (timing of admission)
Outcome or subgroup titleNo. of
studies
No. of
participants Statistical method Effect size
1 Living at home (up to 6 months) 14 5117 Odds Ratio (M-H, Fixed, 95% CI) 1.25 [1.11, 1.42]
1.1 Wards (direct admission) 6 3993 Odds Ratio (M-H, Fixed, 95% CI) 1.20 [1.05, 1.38]
1.2 Wards (stepdown
admission)
5 631 Odds Ratio (M-H, Fixed, 95% CI) 2.20 [1.56, 3.09]
1.3 Teams (direct admission) 1 111 Odds Ratio (M-H, Fixed, 95% CI) 1.18 [0.50, 2.80]
1.4 Teams (acute admission) 1 185 Odds Ratio (M-H, Fixed, 95% CI) 0.83 [0.45, 1.55]
1.5 Teams (stepdown
admission)
1 197 Odds Ratio (M-H, Fixed, 95% CI) 0.71 [0.38, 1.33]
2 Living at home (end of follow
up)
18 7062 Odds Ratio (M-H, Fixed, 95% CI) 1.16 [1.05, 1.28]
2.1 Wards (direct admission) 5 3726 Odds Ratio (M-H, Fixed, 95% CI) 1.13 [0.98, 1.29]
2.2 Wards (acute admission) 2 545 Odds Ratio (M-H, Fixed, 95% CI) 1.21 [0.84, 1.74]
2.3 Wards (stepdown
admission)
7 2019 Odds Ratio (M-H, Fixed, 95% CI) 1.40 [1.17, 1.67]
2.4 Teams (direct assessment) 1 111 Odds Ratio (M-H, Fixed, 95% CI) 1.18 [0.50, 2.80]
2.5 Teams (acute assessment) 2 464 Odds Ratio (M-H, Fixed, 95% CI) 0.65 [0.44, 0.96]
56Comprehensive geriatric assessment for older adults admitted to hospital (Review)
Copyright © 2011 The Cochrane Collaboration. Published by John Wiley & Sons, Ltd.

2.6 Teams (stepdown
assessment)
1 197 Odds Ratio (M-H, Fixed, 95% CI) 0.82 [0.46, 1.48]
Comparison 4. CGA versus usual care (outpatient follow up)
Outcome or subgroup titleNo. of
studies
No. of
participants Statistical method Effect size
1 Living at home (up to 6 months) 9 3542 Odds Ratio (M-H, Fixed, 95% CI) 1.26 [1.09, 1.46]
1.1 Outpatient follow up 5 2896 Odds Ratio (M-H, Fixed, 95% CI) 1.18 [1.00, 1.38]
1.2 No outpatient follow up 4 646 Odds Ratio (M-H, Fixed, 95% CI) 1.71 [1.22, 2.41]
2 Living at home (end of follow
up)
14 5754 Odds Ratio (M-H, Fixed, 95% CI) 1.17 [1.05, 1.30]
2.1 Outpatient follow up 7 3861 Odds Ratio (M-H, Fixed, 95% CI) 1.13 [0.99, 1.30]
2.2 No outpatient follow up 7 1893 Odds Ratio (M-H, Fixed, 95% CI) 1.24 [1.03, 1.50]
Analysis 1.1. Comparison 1 CGA versus usual care, Outcome 1 Living at home (up to 6 months).
Review: Comprehensive geriatric assessment for older adults admitted to hospital
Comparison: 1 CGA versus usual care
Outcome: 1 Living at home (up to 6 months)
Study or subgroup Favours control Control Odds Ratio Weight Odds Ratio
n/N n/N M-H,Fixed,95% CI M-H,Fixed,95% CI
1 Ward
Applegate 1990 62/78 47/77 2.0 % 2.47 [ 1.21, 5.06 ]
Asplund 2000 121/190 134/223 9.4 % 1.16 [ 0.78, 1.74 ]
Collard 1985 163/218 319/477 10.6 % 1.47 [ 1.02, 2.10 ]
Counsell 2000 536/767 531/764 33.6 % 1.02 [ 0.82, 1.27 ]
Fretwell 1990 104/221 92/215 10.4 % 1.19 [ 0.81, 1.73 ]
Harris 1991 67/97 106/170 5.0 % 1.35 [ 0.79, 2.29 ]
Kay 1992 16/30 17/29 1.7 % 0.81 [ 0.29, 2.26 ]
Landefeld 1995 260/327 233/324 10.1 % 1.52 [ 1.06, 2.18 ]
Rubenstein 1984 46/63 32/60 1.9 % 2.37 [ 1.12, 5.03 ]
Saltvedt 2002 101/127 79/127 3.4 % 2.36 [ 1.35, 4.14 ]
White 1994 14/20 7/20 0.4 % 4.33 [ 1.15, 16.32 ]
0.2 0.5 1 2 5
Favours control Favours experimental
(Continued . . . )
57Comprehensive geriatric assessment for older adults admitted to hospital (Review)
Copyright © 2011 The Cochrane Collaboration. Published by John Wiley & Sons, Ltd.
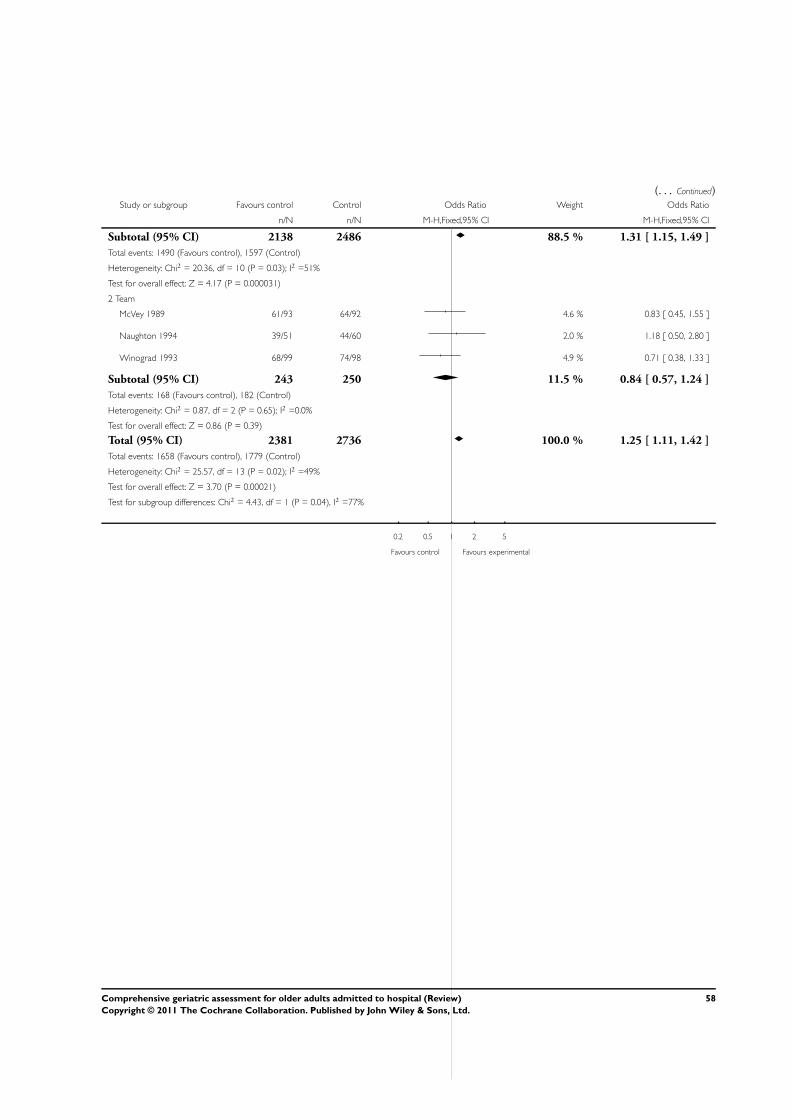
(. . . Continued)Study or subgroup Favours control Control Odds Ratio Weight Odds Ratio
n/N n/N M-H,Fixed,95% CI M-H,Fixed,95% CI
Subtotal (95% CI) 2138 2486 88.5 % 1.31 [ 1.15, 1.49 ]
Total events: 1490 (Favours control), 1597 (Control)
Heterogeneity: Chi2 = 20.36, df = 10 (P = 0.03); I2 =51%
Test for overall effect: Z = 4.17 (P = 0.000031)
2 Team
McVey 1989 61/93 64/92 4.6 % 0.83 [ 0.45, 1.55 ]
Naughton 1994 39/51 44/60 2.0 % 1.18 [ 0.50, 2.80 ]
Winograd 1993 68/99 74/98 4.9 % 0.71 [ 0.38, 1.33 ]
Subtotal (95% CI) 243 250 11.5 % 0.84 [ 0.57, 1.24 ]
Total events: 168 (Favours control), 182 (Control)
Heterogeneity: Chi2 = 0.87, df = 2 (P = 0.65); I2 =0.0%
Test for overall effect: Z = 0.86 (P = 0.39)
Total (95% CI) 2381 2736 100.0 % 1.25 [ 1.11, 1.42 ]
Total events: 1658 (Favours control), 1779 (Control)
Heterogeneity: Chi2 = 25.57, df = 13 (P = 0.02); I2 =49%
Test for overall effect: Z = 3.70 (P = 0.00021)
Test for subgroup differences: Chi2 = 4.43, df = 1 (P = 0.04), I2 =77%
0.2 0.5 1 2 5
Favours control Favours experimental
58Comprehensive geriatric assessment for older adults admitted to hospital (Review)
Copyright © 2011 The Cochrane Collaboration. Published by John Wiley & Sons, Ltd.

Analysis 1.2. Comparison 1 CGA versus usual care, Outcome 2 Living at home (end of follow up).
Review: Comprehensive geriatric assessment for older adults admitted to hospital
Comparison: 1 CGA versus usual care
Outcome: 2 Living at home (end of follow up)
Study or subgroup Treatment Control Odds Ratio Weight Odds Ratio
n/N n/N M-H,Fixed,95% CI M-H,Fixed,95% CI
1 Ward
Applegate 1990 55/78 43/77 1.7 % 1.89 [ 0.97, 3.67 ]
Asplund 2000 121/190 134/223 5.9 % 1.16 [ 0.78, 1.74 ]
Cohen 2002 GEMC 200/346 185/346 10.4 % 1.19 [ 0.88, 1.61 ]
Cohen 2002 UCOP 217/348 185/348 9.3 % 1.46 [ 1.08, 1.97 ]
Collard 1985 163/218 319/477 6.7 % 1.47 [ 1.02, 2.10 ]
Counsell 2000 474/767 485/764 24.7 % 0.93 [ 0.76, 1.14 ]
Fretwell 1990 104/221 92/215 6.6 % 1.19 [ 0.81, 1.73 ]
Kay 1992 16/30 17/29 1.1 % 0.81 [ 0.29, 2.26 ]
Landefeld 1995 218/327 194/324 8.6 % 1.34 [ 0.97, 1.85 ]
Nikolaus 1999 plus ESD 118/181 55/92 3.4 % 1.26 [ 0.75, 2.11 ]
Nikolaus 1999 Ward 114/179 56/93 3.6 % 1.16 [ 0.69, 1.94 ]
Rubenstein 1984 35/63 22/60 1.3 % 2.16 [ 1.05, 4.45 ]
Saltvedt 2002 76/127 68/127 3.6 % 1.29 [ 0.79, 2.13 ]
White 1994 14/20 7/20 0.3 % 4.33 [ 1.15, 16.32 ]
Subtotal (95% CI) 3095 3195 87.1 % 1.22 [ 1.10, 1.35 ]
Total events: 1925 (Treatment), 1862 (Control)
Heterogeneity: Chi2 = 17.66, df = 13 (P = 0.17); I2 =26%
Test for overall effect: Z = 3.77 (P = 0.00016)
2 Team
Kircher 2007 98/150 94/129 4.7 % 0.70 [ 0.42, 1.17 ]
McVey 1989 51/93 62/92 3.7 % 0.59 [ 0.32, 1.07 ]
Naughton 1994 39/51 44/60 1.3 % 1.18 [ 0.50, 2.80 ]
Winograd 1993 32/99 36/98 3.3 % 0.82 [ 0.46, 1.48 ]
Subtotal (95% CI) 393 379 12.9 % 0.75 [ 0.55, 1.01 ]
Total events: 220 (Treatment), 236 (Control)
Heterogeneity: Chi2 = 1.86, df = 3 (P = 0.60); I2 =0.0%
Test for overall effect: Z = 1.90 (P = 0.058)
0.2 0.5 1 2 5
Favours control Favours experimental
(Continued . . . )
59Comprehensive geriatric assessment for older adults admitted to hospital (Review)
Copyright © 2011 The Cochrane Collaboration. Published by John Wiley & Sons, Ltd.

(. . . Continued)Study or subgroup Treatment Control Odds Ratio Weight Odds Ratio
n/N n/N M-H,Fixed,95% CI M-H,Fixed,95% CI
Total (95% CI) 3488 3574 100.0 % 1.16 [ 1.05, 1.28 ]
Total events: 2145 (Treatment), 2098 (Control)
Heterogeneity: Chi2 = 28.49, df = 17 (P = 0.04); I2 =40%
Test for overall effect: Z = 2.96 (P = 0.0031)
Test for subgroup differences: Chi2 = 9.06, df = 1 (P = 0.00), I2 =89%
0.2 0.5 1 2 5
Favours control Favours experimental
Analysis 1.3. Comparison 1 CGA versus usual care, Outcome 3 Mortality (up to 6 months).
Review: Comprehensive geriatric assessment for older adults admitted to hospital
Comparison: 1 CGA versus usual care
Outcome: 3 Mortality (up to 6 months)
Study or subgroup Treatment Control Odds Ratio Odds Ratio
n/N n/N M-H,Fixed,95% CI M-H,Fixed,95% CI
1 Ward
Applegate 1990 8/78 16/77 0.44 [ 0.17, 1.09 ]
Asplund 2000 21/190 17/223 1.51 [ 0.77, 2.95 ]
Cohen 2002 GEMC 58/346 52/346 1.14 [ 0.76, 1.71 ]
Cohen 2002 UCOP 46/348 46/348 1.00 [ 0.64, 1.55 ]
Collard 1985 8/218 39/477 0.43 [ 0.20, 0.93 ]
Counsell 2000 173/767 172/764 1.00 [ 0.79, 1.27 ]
Fretwell 1990 47/221 38/215 1.26 [ 0.78, 2.03 ]
Harris 1991 15/97 36/170 0.68 [ 0.35, 1.32 ]
Kay 1992 2/30 0/29 5.18 [ 0.24, 112.57 ]
Landefeld 1995 24/327 24/324 0.99 [ 0.55, 1.78 ]
Rubenstein 1984 9/63 9/60 0.94 [ 0.35, 2.57 ]
Saltvedt 2002 15/127 34/127 0.37 [ 0.19, 0.71 ]
Shamian 1984 1/20 1/16 0.79 [ 0.05, 13.69 ]
0.01 0.1 1 10 100
Favours experimental Favours control
(Continued . . . )
60Comprehensive geriatric assessment for older adults admitted to hospital (Review)
Copyright © 2011 The Cochrane Collaboration. Published by John Wiley & Sons, Ltd.
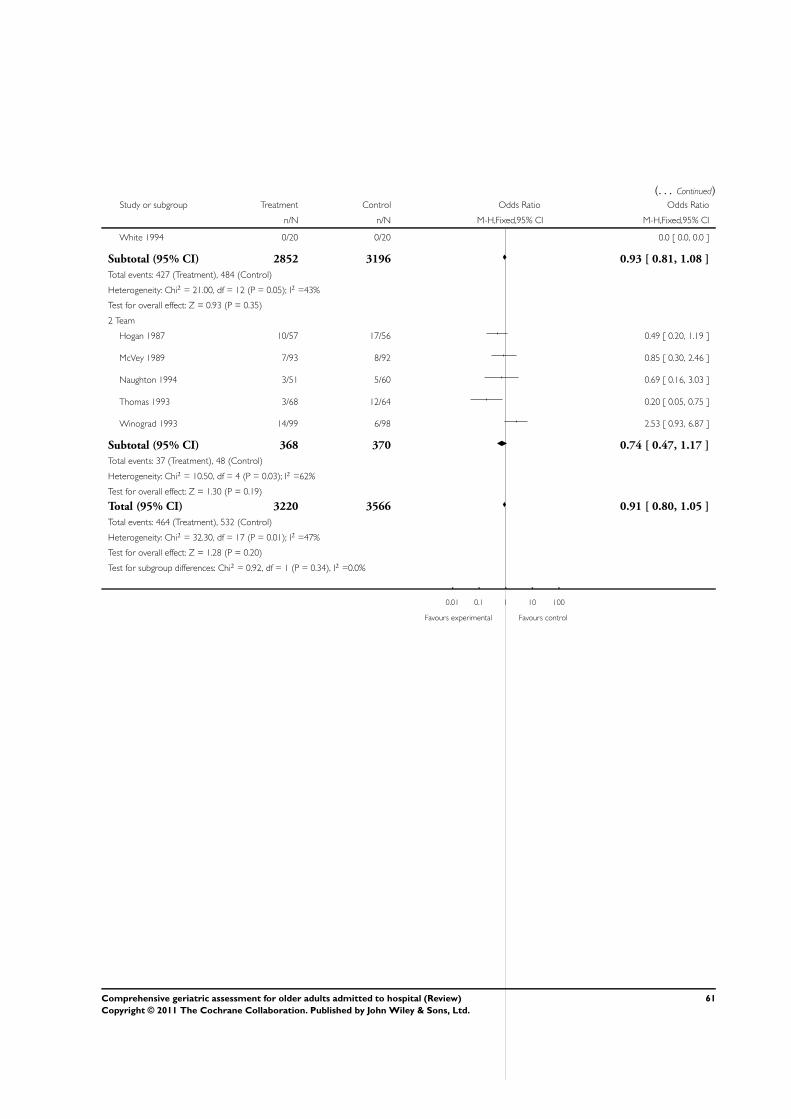
(. . . Continued)Study or subgroup Treatment Control Odds Ratio Odds Ratio
n/N n/N M-H,Fixed,95% CI M-H,Fixed,95% CI
White 1994 0/20 0/20 0.0 [ 0.0, 0.0 ]
Subtotal (95% CI) 2852 3196 0.93 [ 0.81, 1.08 ]
Total events: 427 (Treatment), 484 (Control)
Heterogeneity: Chi2 = 21.00, df = 12 (P = 0.05); I2 =43%
Test for overall effect: Z = 0.93 (P = 0.35)
2 Team
Hogan 1987 10/57 17/56 0.49 [ 0.20, 1.19 ]
McVey 1989 7/93 8/92 0.85 [ 0.30, 2.46 ]
Naughton 1994 3/51 5/60 0.69 [ 0.16, 3.03 ]
Thomas 1993 3/68 12/64 0.20 [ 0.05, 0.75 ]
Winograd 1993 14/99 6/98 2.53 [ 0.93, 6.87 ]
Subtotal (95% CI) 368 370 0.74 [ 0.47, 1.17 ]
Total events: 37 (Treatment), 48 (Control)
Heterogeneity: Chi2 = 10.50, df = 4 (P = 0.03); I2 =62%
Test for overall effect: Z = 1.30 (P = 0.19)
Total (95% CI) 3220 3566 0.91 [ 0.80, 1.05 ]
Total events: 464 (Treatment), 532 (Control)
Heterogeneity: Chi2 = 32.30, df = 17 (P = 0.01); I2 =47%
Test for overall effect: Z = 1.28 (P = 0.20)
Test for subgroup differences: Chi2 = 0.92, df = 1 (P = 0.34), I2 =0.0%
0.01 0.1 1 10 100
Favours experimental Favours control
61Comprehensive geriatric assessment for older adults admitted to hospital (Review)
Copyright © 2011 The Cochrane Collaboration. Published by John Wiley & Sons, Ltd.
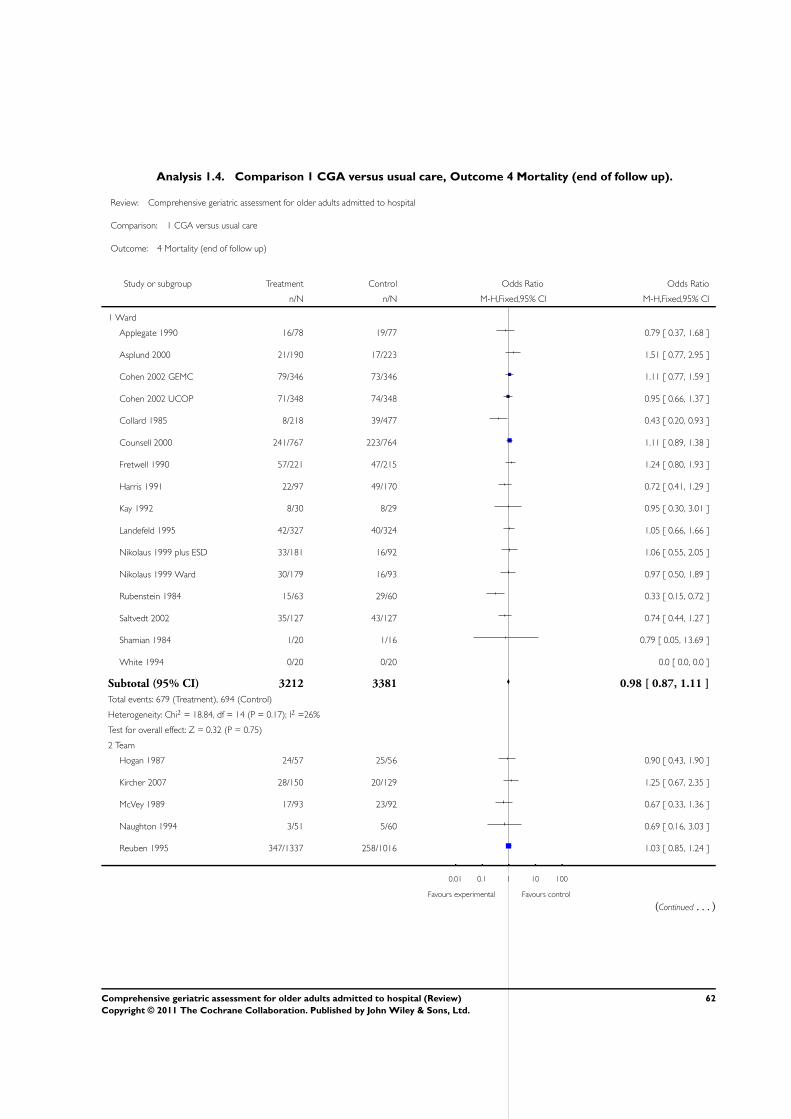
Analysis 1.4. Comparison 1 CGA versus usual care, Outcome 4 Mortality (end of follow up).
Review: Comprehensive geriatric assessment for older adults admitted to hospital
Comparison: 1 CGA versus usual care
Outcome: 4 Mortality (end of follow up)
Study or subgroup Treatment Control Odds Ratio Odds Ratio
n/N n/N M-H,Fixed,95% CI M-H,Fixed,95% CI
1 Ward
Applegate 1990 16/78 19/77 0.79 [ 0.37, 1.68 ]
Asplund 2000 21/190 17/223 1.51 [ 0.77, 2.95 ]
Cohen 2002 GEMC 79/346 73/346 1.11 [ 0.77, 1.59 ]
Cohen 2002 UCOP 71/348 74/348 0.95 [ 0.66, 1.37 ]
Collard 1985 8/218 39/477 0.43 [ 0.20, 0.93 ]
Counsell 2000 241/767 223/764 1.11 [ 0.89, 1.38 ]
Fretwell 1990 57/221 47/215 1.24 [ 0.80, 1.93 ]
Harris 1991 22/97 49/170 0.72 [ 0.41, 1.29 ]
Kay 1992 8/30 8/29 0.95 [ 0.30, 3.01 ]
Landefeld 1995 42/327 40/324 1.05 [ 0.66, 1.66 ]
Nikolaus 1999 plus ESD 33/181 16/92 1.06 [ 0.55, 2.05 ]
Nikolaus 1999 Ward 30/179 16/93 0.97 [ 0.50, 1.89 ]
Rubenstein 1984 15/63 29/60 0.33 [ 0.15, 0.72 ]
Saltvedt 2002 35/127 43/127 0.74 [ 0.44, 1.27 ]
Shamian 1984 1/20 1/16 0.79 [ 0.05, 13.69 ]
White 1994 0/20 0/20 0.0 [ 0.0, 0.0 ]
Subtotal (95% CI) 3212 3381 0.98 [ 0.87, 1.11 ]
Total events: 679 (Treatment), 694 (Control)
Heterogeneity: Chi2 = 18.84, df = 14 (P = 0.17); I2 =26%
Test for overall effect: Z = 0.32 (P = 0.75)
2 Team
Hogan 1987 24/57 25/56 0.90 [ 0.43, 1.90 ]
Kircher 2007 28/150 20/129 1.25 [ 0.67, 2.35 ]
McVey 1989 17/93 23/92 0.67 [ 0.33, 1.36 ]
Naughton 1994 3/51 5/60 0.69 [ 0.16, 3.03 ]
Reuben 1995 347/1337 258/1016 1.03 [ 0.85, 1.24 ]
0.01 0.1 1 10 100
Favours experimental Favours control
(Continued . . . )
62Comprehensive geriatric assessment for older adults admitted to hospital (Review)
Copyright © 2011 The Cochrane Collaboration. Published by John Wiley & Sons, Ltd.

(. . . Continued)Study or subgroup Treatment Control Odds Ratio Odds Ratio
n/N n/N M-H,Fixed,95% CI M-H,Fixed,95% CI
Thomas 1993 7/68 13/64 0.45 [ 0.17, 1.21 ]
Winograd 1993 41/99 35/98 1.27 [ 0.72, 2.26 ]
Subtotal (95% CI) 1855 1515 1.00 [ 0.86, 1.18 ]
Total events: 467 (Treatment), 379 (Control)
Heterogeneity: Chi2 = 5.29, df = 6 (P = 0.51); I2 =0.0%
Test for overall effect: Z = 0.03 (P = 0.97)
Total (95% CI) 5067 4896 0.99 [ 0.90, 1.09 ]
Total events: 1146 (Treatment), 1073 (Control)
Heterogeneity: Chi2 = 24.15, df = 21 (P = 0.29); I2 =13%
Test for overall effect: Z = 0.23 (P = 0.82)
Test for subgroup differences: Chi2 = 0.05, df = 1 (P = 0.83), I2 =0.0%
0.01 0.1 1 10 100
Favours experimental Favours control
Analysis 1.5. Comparison 1 CGA versus usual care, Outcome 5 Institutionalisation (up to 6 months).
Review: Comprehensive geriatric assessment for older adults admitted to hospital
Comparison: 1 CGA versus usual care
Outcome: 5 Institutionalisation (up to 6 months)
Study or subgroup Treatment Control Odds Ratio Weight Odds Ratio
n/N n/N M-H,Fixed,95% CI M-H,Fixed,95% CI
1 Ward
Applegate 1990 8/78 14/77 3.3 % 0.51 [ 0.20, 1.31 ]
Asplund 2000 48/169 72/206 11.9 % 0.74 [ 0.48, 1.15 ]
Collard 1985 47/218 119/477 15.1 % 0.83 [ 0.56, 1.21 ]
Counsell 2000 58/767 61/764 14.5 % 0.94 [ 0.65, 1.37 ]
Fretwell 1990 70/221 85/215 15.1 % 0.71 [ 0.48, 1.05 ]
Kay 1992 12/30 12/29 1.9 % 0.94 [ 0.33, 2.67 ]
Landefeld 1995 43/327 67/324 15.0 % 0.58 [ 0.38, 0.88 ]
Rubenstein 1984 8/63 19/60 4.4 % 0.31 [ 0.13, 0.79 ]
Saltvedt 2002 11/127 14/127 3.3 % 0.77 [ 0.33, 1.76 ]
0.01 0.1 1 10 100
Favours experimental Favours control
(Continued . . . )
63Comprehensive geriatric assessment for older adults admitted to hospital (Review)
Copyright © 2011 The Cochrane Collaboration. Published by John Wiley & Sons, Ltd.

(. . . Continued)Study or subgroup Treatment Control Odds Ratio Weight Odds Ratio
n/N n/N M-H,Fixed,95% CI M-H,Fixed,95% CI
White 1994 6/20 13/20 2.3 % 0.23 [ 0.06, 0.87 ]
Subtotal (95% CI) 2020 2299 86.8 % 0.72 [ 0.61, 0.85 ]
Total events: 311 (Treatment), 476 (Control)
Heterogeneity: Chi2 = 10.27, df = 9 (P = 0.33); I2 =12%
Test for overall effect: Z = 3.95 (P = 0.000079)
2 Team
Hogan 1987 23/57 22/56 3.4 % 1.05 [ 0.49, 2.22 ]
McVey 1989 25/93 20/92 3.8 % 1.32 [ 0.67, 2.60 ]
Naughton 1994 9/51 11/60 2.1 % 0.95 [ 0.36, 2.52 ]
Winograd 1993 17/99 18/98 3.9 % 0.92 [ 0.44, 1.91 ]
Subtotal (95% CI) 300 306 13.2 % 1.07 [ 0.73, 1.57 ]
Total events: 74 (Treatment), 71 (Control)
Heterogeneity: Chi2 = 0.60, df = 3 (P = 0.90); I2 =0.0%
Test for overall effect: Z = 0.37 (P = 0.71)
Total (95% CI) 2320 2605 100.0 % 0.76 [ 0.66, 0.89 ]
Total events: 385 (Treatment), 547 (Control)
Heterogeneity: Chi2 = 14.43, df = 13 (P = 0.34); I2 =10%
Test for overall effect: Z = 3.49 (P = 0.00049)
Test for subgroup differences: Chi2 = 3.64, df = 1 (P = 0.06), I2 =73%
0.01 0.1 1 10 100
Favours experimental Favours control
64Comprehensive geriatric assessment for older adults admitted to hospital (Review)
Copyright © 2011 The Cochrane Collaboration. Published by John Wiley & Sons, Ltd.
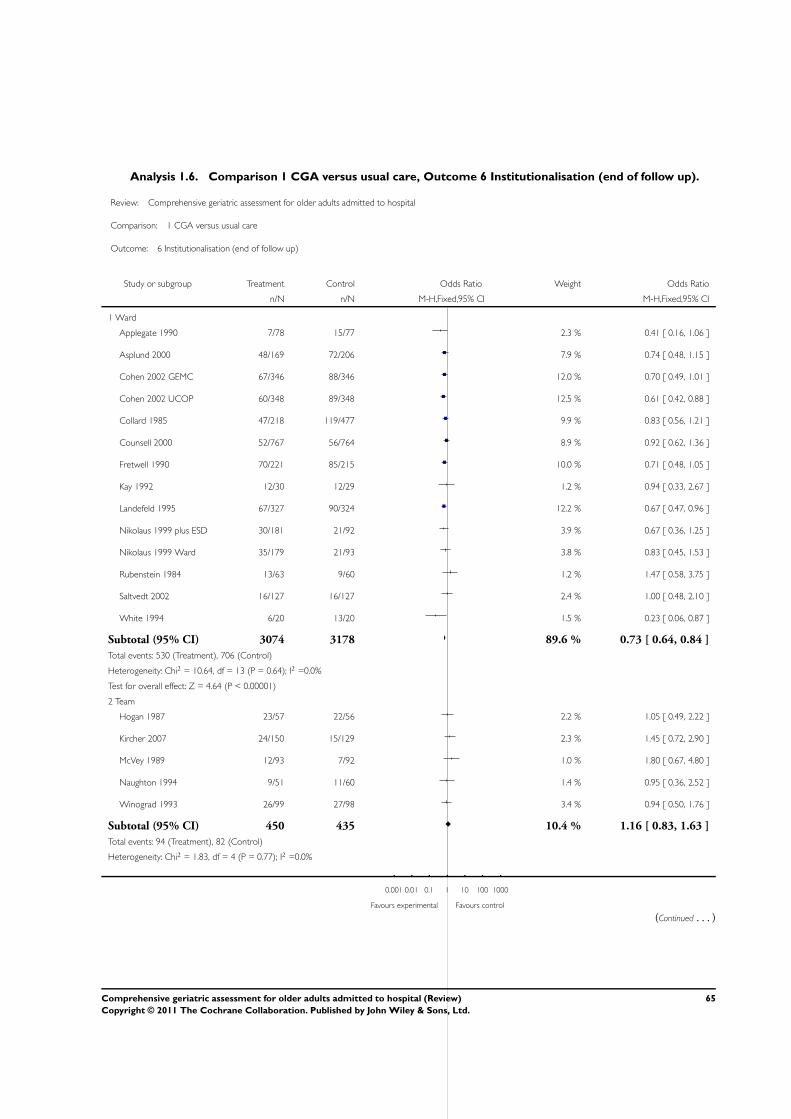
Analysis 1.6. Comparison 1 CGA versus usual care, Outcome 6 Institutionalisation (end of follow up).
Review: Comprehensive geriatric assessment for older adults admitted to hospital
Comparison: 1 CGA versus usual care
Outcome: 6 Institutionalisation (end of follow up)
Study or subgroup Treatment Control Odds Ratio Weight Odds Ratio
n/N n/N M-H,Fixed,95% CI M-H,Fixed,95% CI
1 Ward
Applegate 1990 7/78 15/77 2.3 % 0.41 [ 0.16, 1.06 ]
Asplund 2000 48/169 72/206 7.9 % 0.74 [ 0.48, 1.15 ]
Cohen 2002 GEMC 67/346 88/346 12.0 % 0.70 [ 0.49, 1.01 ]
Cohen 2002 UCOP 60/348 89/348 12.5 % 0.61 [ 0.42, 0.88 ]
Collard 1985 47/218 119/477 9.9 % 0.83 [ 0.56, 1.21 ]
Counsell 2000 52/767 56/764 8.9 % 0.92 [ 0.62, 1.36 ]
Fretwell 1990 70/221 85/215 10.0 % 0.71 [ 0.48, 1.05 ]
Kay 1992 12/30 12/29 1.2 % 0.94 [ 0.33, 2.67 ]
Landefeld 1995 67/327 90/324 12.2 % 0.67 [ 0.47, 0.96 ]
Nikolaus 1999 plus ESD 30/181 21/92 3.9 % 0.67 [ 0.36, 1.25 ]
Nikolaus 1999 Ward 35/179 21/93 3.8 % 0.83 [ 0.45, 1.53 ]
Rubenstein 1984 13/63 9/60 1.2 % 1.47 [ 0.58, 3.75 ]
Saltvedt 2002 16/127 16/127 2.4 % 1.00 [ 0.48, 2.10 ]
White 1994 6/20 13/20 1.5 % 0.23 [ 0.06, 0.87 ]
Subtotal (95% CI) 3074 3178 89.6 % 0.73 [ 0.64, 0.84 ]
Total events: 530 (Treatment), 706 (Control)
Heterogeneity: Chi2 = 10.64, df = 13 (P = 0.64); I2 =0.0%
Test for overall effect: Z = 4.64 (P < 0.00001)
2 Team
Hogan 1987 23/57 22/56 2.2 % 1.05 [ 0.49, 2.22 ]
Kircher 2007 24/150 15/129 2.3 % 1.45 [ 0.72, 2.90 ]
McVey 1989 12/93 7/92 1.0 % 1.80 [ 0.67, 4.80 ]
Naughton 1994 9/51 11/60 1.4 % 0.95 [ 0.36, 2.52 ]
Winograd 1993 26/99 27/98 3.4 % 0.94 [ 0.50, 1.76 ]
Subtotal (95% CI) 450 435 10.4 % 1.16 [ 0.83, 1.63 ]
Total events: 94 (Treatment), 82 (Control)
Heterogeneity: Chi2 = 1.83, df = 4 (P = 0.77); I2 =0.0%
0.001 0.01 0.1 1 10 100 1000
Favours experimental Favours control
(Continued . . . )
65Comprehensive geriatric assessment for older adults admitted to hospital (Review)
Copyright © 2011 The Cochrane Collaboration. Published by John Wiley & Sons, Ltd.
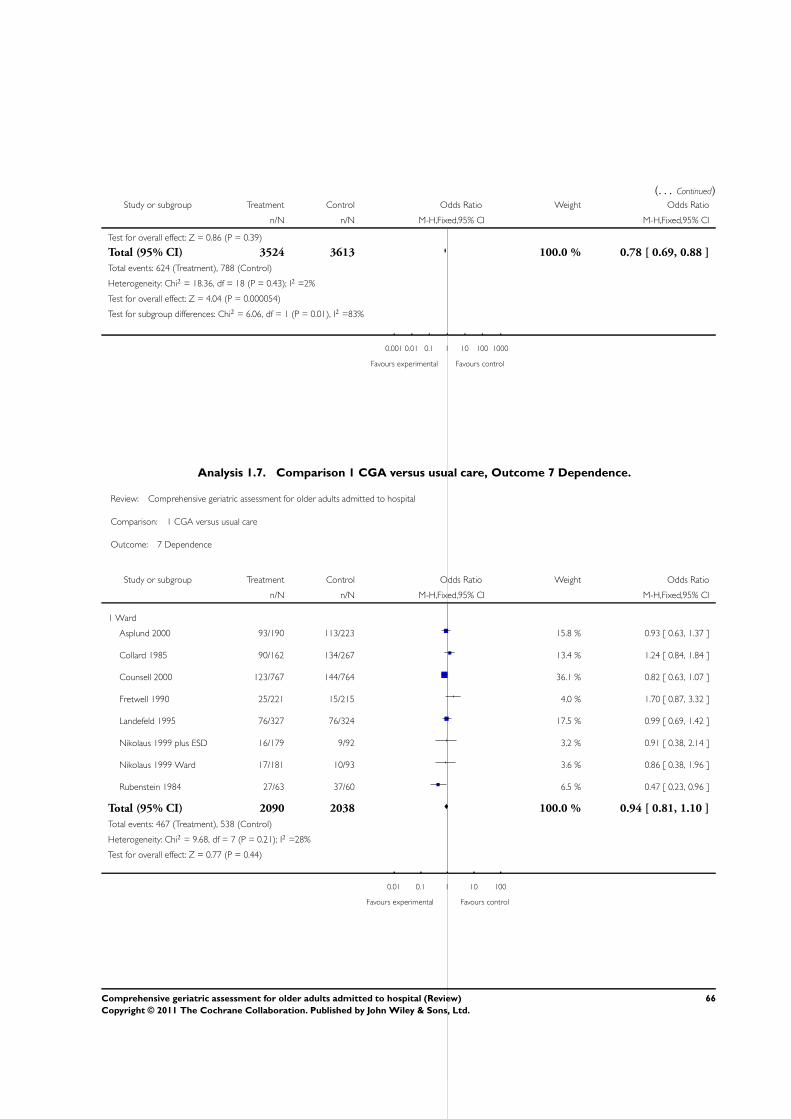
(. . . Continued)Study or subgroup Treatment Control Odds Ratio Weight Odds Ratio
n/N n/N M-H,Fixed,95% CI M-H,Fixed,95% CI
Test for overall effect: Z = 0.86 (P = 0.39)
Total (95% CI) 3524 3613 100.0 % 0.78 [ 0.69, 0.88 ]
Total events: 624 (Treatment), 788 (Control)
Heterogeneity: Chi2 = 18.36, df = 18 (P = 0.43); I2 =2%
Test for overall effect: Z = 4.04 (P = 0.000054)
Test for subgroup differences: Chi2 = 6.06, df = 1 (P = 0.01), I2 =83%
0.001 0.01 0.1 1 10 100 1000
Favours experimental Favours control
Analysis 1.7. Comparison 1 CGA versus usual care, Outcome 7 Dependence.
Review: Comprehensive geriatric assessment for older adults admitted to hospital
Comparison: 1 CGA versus usual care
Outcome: 7 Dependence
Study or subgroup Treatment Control Odds Ratio Weight Odds Ratio
n/N n/N M-H,Fixed,95% CI M-H,Fixed,95% CI
1 Ward
Asplund 2000 93/190 113/223 15.8 % 0.93 [ 0.63, 1.37 ]
Collard 1985 90/162 134/267 13.4 % 1.24 [ 0.84, 1.84 ]
Counsell 2000 123/767 144/764 36.1 % 0.82 [ 0.63, 1.07 ]
Fretwell 1990 25/221 15/215 4.0 % 1.70 [ 0.87, 3.32 ]
Landefeld 1995 76/327 76/324 17.5 % 0.99 [ 0.69, 1.42 ]
Nikolaus 1999 plus ESD 16/179 9/92 3.2 % 0.91 [ 0.38, 2.14 ]
Nikolaus 1999 Ward 17/181 10/93 3.6 % 0.86 [ 0.38, 1.96 ]
Rubenstein 1984 27/63 37/60 6.5 % 0.47 [ 0.23, 0.96 ]
Total (95% CI) 2090 2038 100.0 % 0.94 [ 0.81, 1.10 ]
Total events: 467 (Treatment), 538 (Control)
Heterogeneity: Chi2 = 9.68, df = 7 (P = 0.21); I2 =28%
Test for overall effect: Z = 0.77 (P = 0.44)
0.01 0.1 1 10 100
Favours experimental Favours control
66Comprehensive geriatric assessment for older adults admitted to hospital (Review)
Copyright © 2011 The Cochrane Collaboration. Published by John Wiley & Sons, Ltd.
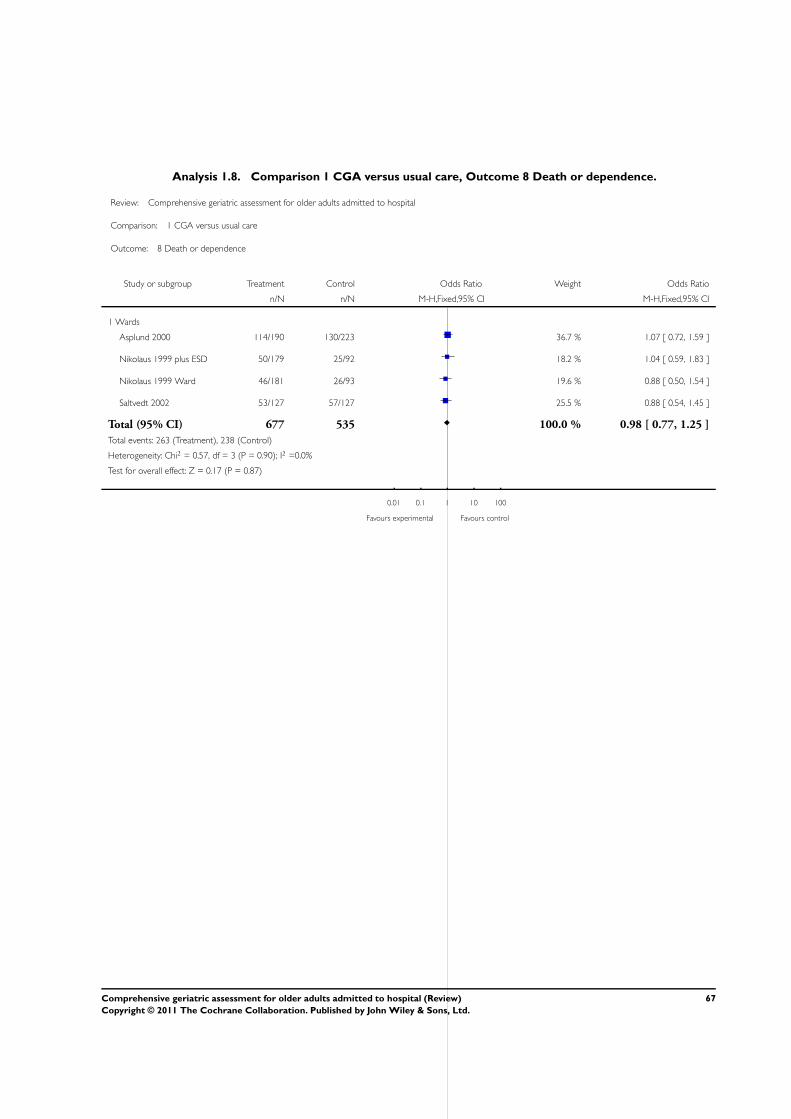
Analysis 1.8. Comparison 1 CGA versus usual care, Outcome 8 Death or dependence.
Review: Comprehensive geriatric assessment for older adults admitted to hospital
Comparison: 1 CGA versus usual care
Outcome: 8 Death or dependence
Study or subgroup Treatment Control Odds Ratio Weight Odds Ratio
n/N n/N M-H,Fixed,95% CI M-H,Fixed,95% CI
1 Wards
Asplund 2000 114/190 130/223 36.7 % 1.07 [ 0.72, 1.59 ]
Nikolaus 1999 plus ESD 50/179 25/92 18.2 % 1.04 [ 0.59, 1.83 ]
Nikolaus 1999 Ward 46/181 26/93 19.6 % 0.88 [ 0.50, 1.54 ]
Saltvedt 2002 53/127 57/127 25.5 % 0.88 [ 0.54, 1.45 ]
Total (95% CI) 677 535 100.0 % 0.98 [ 0.77, 1.25 ]
Total events: 263 (Treatment), 238 (Control)
Heterogeneity: Chi2 = 0.57, df = 3 (P = 0.90); I2 =0.0%
Test for overall effect: Z = 0.17 (P = 0.87)
0.01 0.1 1 10 100
Favours experimental Favours control
67Comprehensive geriatric assessment for older adults admitted to hospital (Review)
Copyright © 2011 The Cochrane Collaboration. Published by John Wiley & Sons, Ltd.
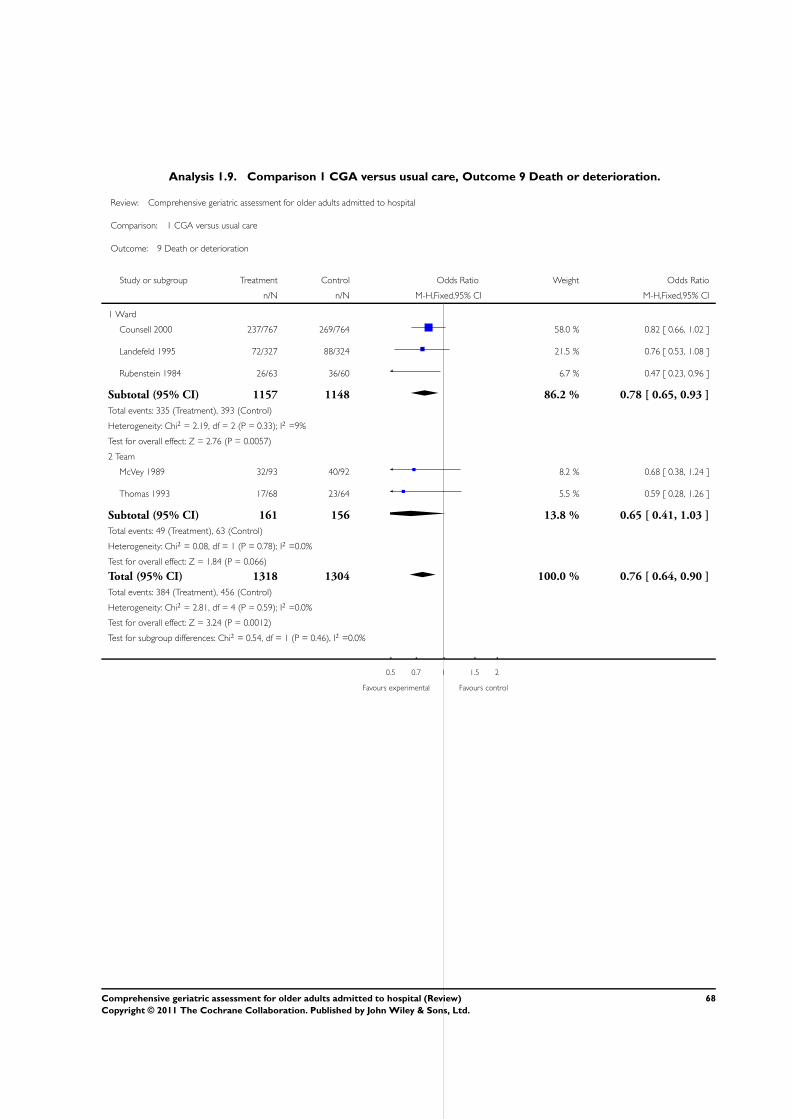
Analysis 1.9. Comparison 1 CGA versus usual care, Outcome 9 Death or deterioration.
Review: Comprehensive geriatric assessment for older adults admitted to hospital
Comparison: 1 CGA versus usual care
Outcome: 9 Death or deterioration
Study or subgroup Treatment Control Odds Ratio Weight Odds Ratio
n/N n/N M-H,Fixed,95% CI M-H,Fixed,95% CI
1 Ward
Counsell 2000 237/767 269/764 58.0 % 0.82 [ 0.66, 1.02 ]
Landefeld 1995 72/327 88/324 21.5 % 0.76 [ 0.53, 1.08 ]
Rubenstein 1984 26/63 36/60 6.7 % 0.47 [ 0.23, 0.96 ]
Subtotal (95% CI) 1157 1148 86.2 % 0.78 [ 0.65, 0.93 ]
Total events: 335 (Treatment), 393 (Control)
Heterogeneity: Chi2 = 2.19, df = 2 (P = 0.33); I2 =9%
Test for overall effect: Z = 2.76 (P = 0.0057)
2 Team
McVey 1989 32/93 40/92 8.2 % 0.68 [ 0.38, 1.24 ]
Thomas 1993 17/68 23/64 5.5 % 0.59 [ 0.28, 1.26 ]
Subtotal (95% CI) 161 156 13.8 % 0.65 [ 0.41, 1.03 ]
Total events: 49 (Treatment), 63 (Control)
Heterogeneity: Chi2 = 0.08, df = 1 (P = 0.78); I2 =0.0%
Test for overall effect: Z = 1.84 (P = 0.066)
Total (95% CI) 1318 1304 100.0 % 0.76 [ 0.64, 0.90 ]
Total events: 384 (Treatment), 456 (Control)
Heterogeneity: Chi2 = 2.81, df = 4 (P = 0.59); I2 =0.0%
Test for overall effect: Z = 3.24 (P = 0.0012)
Test for subgroup differences: Chi2 = 0.54, df = 1 (P = 0.46), I2 =0.0%
0.5 0.7 1 1.5 2
Favours experimental Favours control
68Comprehensive geriatric assessment for older adults admitted to hospital (Review)
Copyright © 2011 The Cochrane Collaboration. Published by John Wiley & Sons, Ltd.
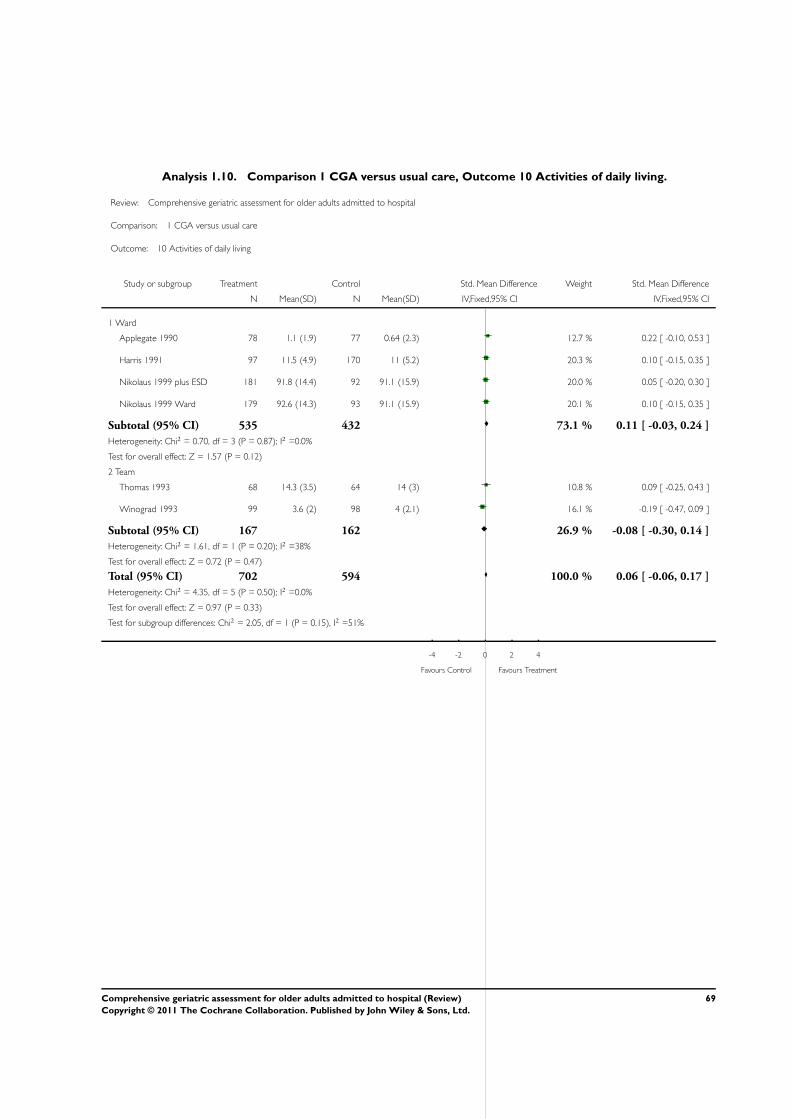
Analysis 1.10. Comparison 1 CGA versus usual care, Outcome 10 Activities of daily living.
Review: Comprehensive geriatric assessment for older adults admitted to hospital
Comparison: 1 CGA versus usual care
Outcome: 10 Activities of daily living
Study or subgroup Treatment Control Std. Mean Difference Weight Std. Mean Difference
N Mean(SD) N Mean(SD) IV,Fixed,95% CI IV,Fixed,95% CI
1 Ward
Applegate 1990 78 1.1 (1.9) 77 0.64 (2.3) 12.7 % 0.22 [ -0.10, 0.53 ]
Harris 1991 97 11.5 (4.9) 170 11 (5.2) 20.3 % 0.10 [ -0.15, 0.35 ]
Nikolaus 1999 plus ESD 181 91.8 (14.4) 92 91.1 (15.9) 20.0 % 0.05 [ -0.20, 0.30 ]
Nikolaus 1999 Ward 179 92.6 (14.3) 93 91.1 (15.9) 20.1 % 0.10 [ -0.15, 0.35 ]
Subtotal (95% CI) 535 432 73.1 % 0.11 [ -0.03, 0.24 ]
Heterogeneity: Chi2 = 0.70, df = 3 (P = 0.87); I2 =0.0%
Test for overall effect: Z = 1.57 (P = 0.12)
2 Team
Thomas 1993 68 14.3 (3.5) 64 14 (3) 10.8 % 0.09 [ -0.25, 0.43 ]
Winograd 1993 99 3.6 (2) 98 4 (2.1) 16.1 % -0.19 [ -0.47, 0.09 ]
Subtotal (95% CI) 167 162 26.9 % -0.08 [ -0.30, 0.14 ]
Heterogeneity: Chi2 = 1.61, df = 1 (P = 0.20); I2 =38%
Test for overall effect: Z = 0.72 (P = 0.47)
Total (95% CI) 702 594 100.0 % 0.06 [ -0.06, 0.17 ]
Heterogeneity: Chi2 = 4.35, df = 5 (P = 0.50); I2 =0.0%
Test for overall effect: Z = 0.97 (P = 0.33)
Test for subgroup differences: Chi2 = 2.05, df = 1 (P = 0.15), I2 =51%
-4 -2 0 2 4
Favours Control Favours Treatment
69Comprehensive geriatric assessment for older adults admitted to hospital (Review)
Copyright © 2011 The Cochrane Collaboration. Published by John Wiley & Sons, Ltd.

Analysis 1.11. Comparison 1 CGA versus usual care, Outcome 11 Cognitive function.
Review: Comprehensive geriatric assessment for older adults admitted to hospital
Comparison: 1 CGA versus usual care
Outcome: 11 Cognitive function
Study or subgroup Treatment Control Std. Mean Difference Weight Std. Mean Difference
N Mean(SD) N Mean(SD) IV,Fixed,95% CI IV,Fixed,95% CI
1 Ward
Asplund 2000 169 26 (23.4) 206 24 (37.3) 11.4 % 0.06 [ -0.14, 0.27 ]
Subtotal (95% CI) 169 206 11.4 % 0.06 [ -0.14, 0.27 ]
Heterogeneity: not applicable
Test for overall effect: Z = 0.60 (P = 0.55)
2 Team
Hogan 1987 57 1.5 (1.4) 56 0.8 (2.1) 3.4 % 0.39 [ 0.02, 0.76 ]
Kircher 2007 150 25 (18.4) 129 26 (17) 8.5 % -0.06 [ -0.29, 0.18 ]
Reuben 1995 1337 72.3 (25.6) 1016 70.6 (25.5) 70.8 % 0.07 [ -0.02, 0.15 ]
Winograd 1993 99 24.3 (7.1) 98 21.4 (9.2) 5.9 % 0.35 [ 0.07, 0.63 ]
Subtotal (95% CI) 1643 1299 88.6 % 0.09 [ 0.01, 0.16 ]
Heterogeneity: Chi2 = 7.61, df = 3 (P = 0.05); I2 =61%
Test for overall effect: Z = 2.32 (P = 0.020)
Total (95% CI) 1812 1505 100.0 % 0.08 [ 0.01, 0.15 ]
Heterogeneity: Chi2 = 7.65, df = 4 (P = 0.11); I2 =48%
Test for overall effect: Z = 2.39 (P = 0.017)
Test for subgroup differences: Chi2 = 0.05, df = 1 (P = 0.83), I2 =0.0%
-0.2 -0.1 0 0.1 0.2
Favours Control Favours Treatment
70Comprehensive geriatric assessment for older adults admitted to hospital (Review)
Copyright © 2011 The Cochrane Collaboration. Published by John Wiley & Sons, Ltd.

Analysis 1.12. Comparison 1 CGA versus usual care, Outcome 12 Length of stay.
Review: Comprehensive geriatric assessment for older adults admitted to hospital
Comparison: 1 CGA versus usual care
Outcome: 12 Length of stay
Study or subgroup Treatment Control Mean Difference Weight Mean Difference
N Mean(SD) N Mean(SD) IV,Random,95% CI IV,Random,95% CI
1 Ward
Asplund 2000 190 5.9 (5.7) 223 7.3 (5.7) 9.9 % -1.40 [ -2.50, -0.30 ]
Cohen 2002 GEMC 346 23.8 (25.3) 346 14.8 (23.3) 8.0 % 9.00 [ 5.38, 12.62 ]
Cohen 2002 UCOP 348 22.7 (27.9) 348 15.2 (23.8) 7.8 % 7.50 [ 3.65, 11.35 ]
Fretwell 1990 221 11.6 (12.2) 215 12.8 (15.8) 8.9 % -1.20 [ -3.85, 1.45 ]
Harris 1991 97 10.9 (7.9) 170 9.8 (7.8) 9.4 % 1.10 [ -0.86, 3.06 ]
Nikolaus 1999 plus ESD 181 33.5 (21.5) 93 42.7 (20.4) 6.6 % -9.20 [ -14.40, -4.00 ]
Nikolaus 1999 Ward 179 40.7 (24.1) 92 42.7 (20.4) 6.3 % -2.00 [ -7.46, 3.46 ]
Saltvedt 2002 127 21.2 (16.2) 127 12.2 (15) 7.8 % 9.00 [ 5.16, 12.84 ]
Subtotal (95% CI) 1689 1614 64.8 % 1.73 [ -1.56, 5.02 ]
Heterogeneity: Tau2 = 19.19; Chi2 = 79.76, df = 7 (P<0.00001); I2 =91%
Test for overall effect: Z = 1.03 (P = 0.30)
2 Team
Hogan 1987 57 15.8 (12.7) 56 14.2 (13.3) 6.9 % 1.60 [ -3.20, 6.40 ]
McVey 1989 88 20.2 (26.5) 90 16.6 (14.9) 5.6 % 3.60 [ -2.73, 9.93 ]
Naughton 1994 51 5.4 (5.5) 60 7 (7) 9.2 % -1.60 [ -3.93, 0.73 ]
Thomas 1993 68 9 (7.5) 64 10.1 (7.6) 9.0 % -1.10 [ -3.68, 1.48 ]
Winograd 1993 99 24.8 (22) 98 26.7 (33) 4.5 % -1.90 [ -9.74, 5.94 ]
Subtotal (95% CI) 363 368 35.2 % -0.79 [ -2.34, 0.75 ]
Heterogeneity: Tau2 = 0.0; Chi2 = 3.40, df = 4 (P = 0.49); I2 =0.0%
Test for overall effect: Z = 1.01 (P = 0.31)
Total (95% CI) 2052 1982 100.0 % 1.12 [ -1.11, 3.35 ]
Heterogeneity: Tau2 = 12.67; Chi2 = 84.50, df = 12 (P<0.00001); I2 =86%
Test for overall effect: Z = 0.99 (P = 0.32)
Test for subgroup differences: Chi2 = 1.85, df = 1 (P = 0.17), I2 =46%
-20 -10 0 10 20
Favours experimental Favours control
71Comprehensive geriatric assessment for older adults admitted to hospital (Review)
Copyright © 2011 The Cochrane Collaboration. Published by John Wiley & Sons, Ltd.
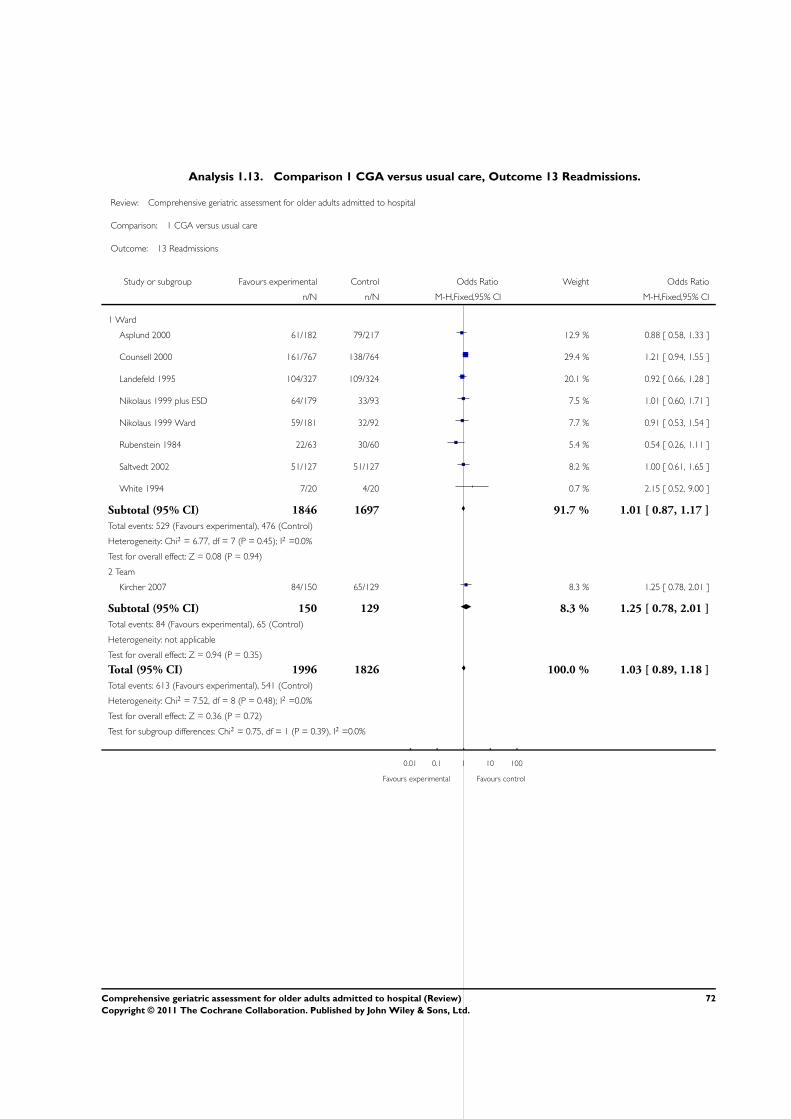
Analysis 1.13. Comparison 1 CGA versus usual care, Outcome 13 Readmissions.
Review: Comprehensive geriatric assessment for older adults admitted to hospital
Comparison: 1 CGA versus usual care
Outcome: 13 Readmissions
Study or subgroup Favours experimental Control Odds Ratio Weight Odds Ratio
n/N n/N M-H,Fixed,95% CI M-H,Fixed,95% CI
1 Ward
Asplund 2000 61/182 79/217 12.9 % 0.88 [ 0.58, 1.33 ]
Counsell 2000 161/767 138/764 29.4 % 1.21 [ 0.94, 1.55 ]
Landefeld 1995 104/327 109/324 20.1 % 0.92 [ 0.66, 1.28 ]
Nikolaus 1999 plus ESD 64/179 33/93 7.5 % 1.01 [ 0.60, 1.71 ]
Nikolaus 1999 Ward 59/181 32/92 7.7 % 0.91 [ 0.53, 1.54 ]
Rubenstein 1984 22/63 30/60 5.4 % 0.54 [ 0.26, 1.11 ]
Saltvedt 2002 51/127 51/127 8.2 % 1.00 [ 0.61, 1.65 ]
White 1994 7/20 4/20 0.7 % 2.15 [ 0.52, 9.00 ]
Subtotal (95% CI) 1846 1697 91.7 % 1.01 [ 0.87, 1.17 ]
Total events: 529 (Favours experimental), 476 (Control)
Heterogeneity: Chi2 = 6.77, df = 7 (P = 0.45); I2 =0.0%
Test for overall effect: Z = 0.08 (P = 0.94)
2 Team
Kircher 2007 84/150 65/129 8.3 % 1.25 [ 0.78, 2.01 ]
Subtotal (95% CI) 150 129 8.3 % 1.25 [ 0.78, 2.01 ]
Total events: 84 (Favours experimental), 65 (Control)
Heterogeneity: not applicable
Test for overall effect: Z = 0.94 (P = 0.35)
Total (95% CI) 1996 1826 100.0 % 1.03 [ 0.89, 1.18 ]
Total events: 613 (Favours experimental), 541 (Control)
Heterogeneity: Chi2 = 7.52, df = 8 (P = 0.48); I2 =0.0%
Test for overall effect: Z = 0.36 (P = 0.72)
Test for subgroup differences: Chi2 = 0.75, df = 1 (P = 0.39), I2 =0.0%
0.01 0.1 1 10 100
Favours experimental Favours control
72Comprehensive geriatric assessment for older adults admitted to hospital (Review)
Copyright © 2011 The Cochrane Collaboration. Published by John Wiley & Sons, Ltd.
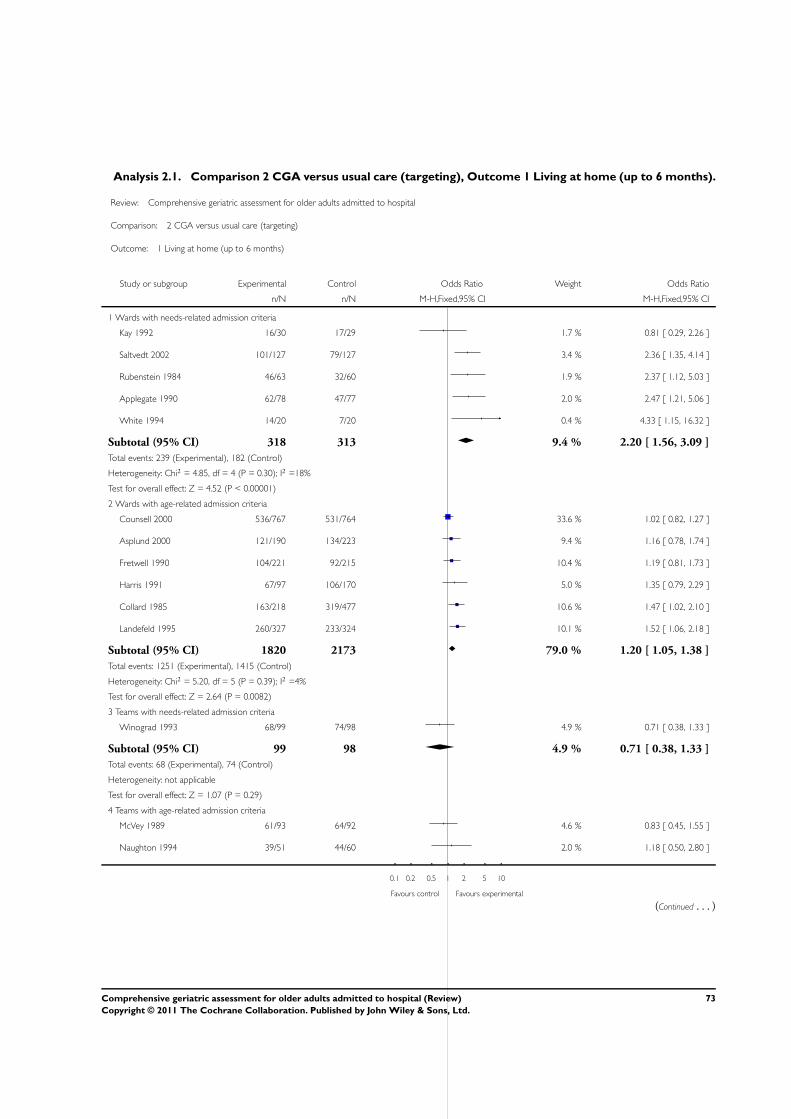
Analysis 2.1. Comparison 2 CGA versus usual care (targeting), Outcome 1 Living at home (up to 6 months).
Review: Comprehensive geriatric assessment for older adults admitted to hospital
Comparison: 2 CGA versus usual care (targeting)
Outcome: 1 Living at home (up to 6 months)
Study or subgroup Experimental Control Odds Ratio Weight Odds Ratio
n/N n/N M-H,Fixed,95% CI M-H,Fixed,95% CI
1 Wards with needs-related admission criteria
Kay 1992 16/30 17/29 1.7 % 0.81 [ 0.29, 2.26 ]
Saltvedt 2002 101/127 79/127 3.4 % 2.36 [ 1.35, 4.14 ]
Rubenstein 1984 46/63 32/60 1.9 % 2.37 [ 1.12, 5.03 ]
Applegate 1990 62/78 47/77 2.0 % 2.47 [ 1.21, 5.06 ]
White 1994 14/20 7/20 0.4 % 4.33 [ 1.15, 16.32 ]
Subtotal (95% CI) 318 313 9.4 % 2.20 [ 1.56, 3.09 ]
Total events: 239 (Experimental), 182 (Control)
Heterogeneity: Chi2 = 4.85, df = 4 (P = 0.30); I2 =18%
Test for overall effect: Z = 4.52 (P < 0.00001)
2 Wards with age-related admission criteria
Counsell 2000 536/767 531/764 33.6 % 1.02 [ 0.82, 1.27 ]
Asplund 2000 121/190 134/223 9.4 % 1.16 [ 0.78, 1.74 ]
Fretwell 1990 104/221 92/215 10.4 % 1.19 [ 0.81, 1.73 ]
Harris 1991 67/97 106/170 5.0 % 1.35 [ 0.79, 2.29 ]
Collard 1985 163/218 319/477 10.6 % 1.47 [ 1.02, 2.10 ]
Landefeld 1995 260/327 233/324 10.1 % 1.52 [ 1.06, 2.18 ]
Subtotal (95% CI) 1820 2173 79.0 % 1.20 [ 1.05, 1.38 ]
Total events: 1251 (Experimental), 1415 (Control)
Heterogeneity: Chi2 = 5.20, df = 5 (P = 0.39); I2 =4%
Test for overall effect: Z = 2.64 (P = 0.0082)
3 Teams with needs-related admission criteria
Winograd 1993 68/99 74/98 4.9 % 0.71 [ 0.38, 1.33 ]
Subtotal (95% CI) 99 98 4.9 % 0.71 [ 0.38, 1.33 ]
Total events: 68 (Experimental), 74 (Control)
Heterogeneity: not applicable
Test for overall effect: Z = 1.07 (P = 0.29)
4 Teams with age-related admission criteria
McVey 1989 61/93 64/92 4.6 % 0.83 [ 0.45, 1.55 ]
Naughton 1994 39/51 44/60 2.0 % 1.18 [ 0.50, 2.80 ]
0.1 0.2 0.5 1 2 5 10
Favours control Favours experimental
(Continued . . . )
73Comprehensive geriatric assessment for older adults admitted to hospital (Review)
Copyright © 2011 The Cochrane Collaboration. Published by John Wiley & Sons, Ltd.
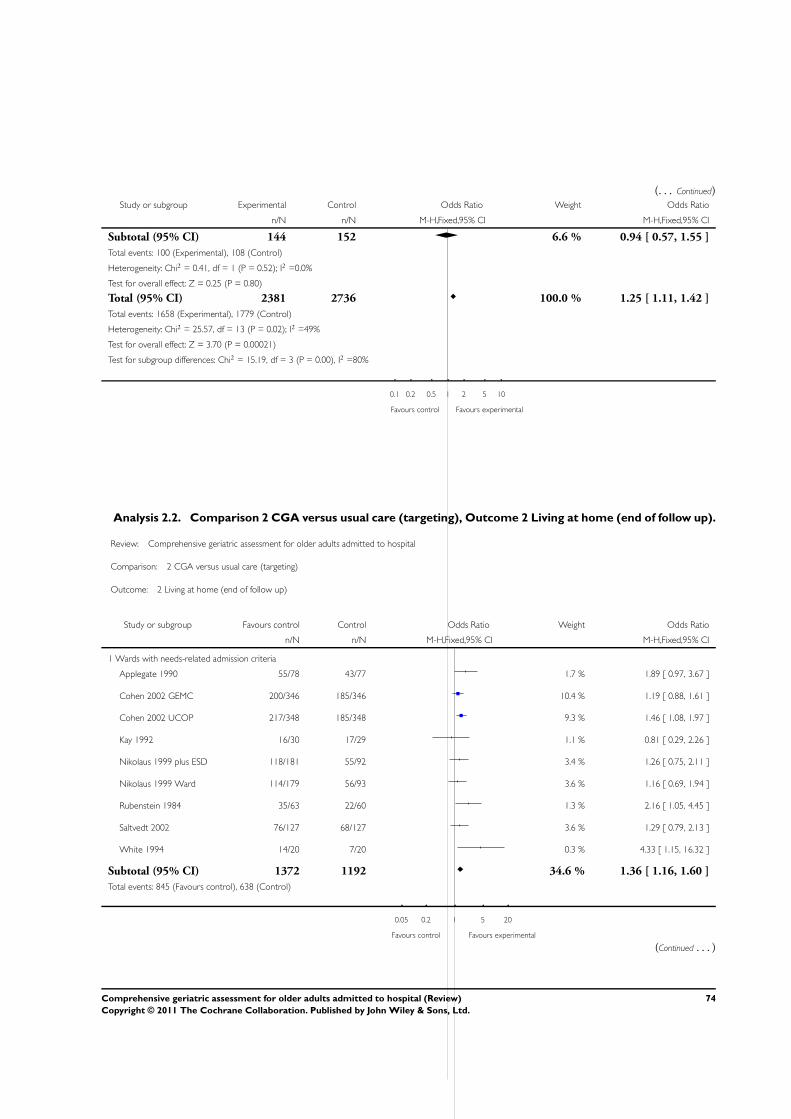
(. . . Continued)Study or subgroup Experimental Control Odds Ratio Weight Odds Ratio
n/N n/N M-H,Fixed,95% CI M-H,Fixed,95% CI
Subtotal (95% CI) 144 152 6.6 % 0.94 [ 0.57, 1.55 ]
Total events: 100 (Experimental), 108 (Control)
Heterogeneity: Chi2 = 0.41, df = 1 (P = 0.52); I2 =0.0%
Test for overall effect: Z = 0.25 (P = 0.80)
Total (95% CI) 2381 2736 100.0 % 1.25 [ 1.11, 1.42 ]
Total events: 1658 (Experimental), 1779 (Control)
Heterogeneity: Chi2 = 25.57, df = 13 (P = 0.02); I2 =49%
Test for overall effect: Z = 3.70 (P = 0.00021)
Test for subgroup differences: Chi2 = 15.19, df = 3 (P = 0.00), I2 =80%
0.1 0.2 0.5 1 2 5 10
Favours control Favours experimental
Analysis 2.2. Comparison 2 CGA versus usual care (targeting), Outcome 2 Living at home (end of follow up).
Review: Comprehensive geriatric assessment for older adults admitted to hospital
Comparison: 2 CGA versus usual care (targeting)
Outcome: 2 Living at home (end of follow up)
Study or subgroup Favours control Control Odds Ratio Weight Odds Ratio
n/N n/N M-H,Fixed,95% CI M-H,Fixed,95% CI
1 Wards with needs-related admission criteria
Applegate 1990 55/78 43/77 1.7 % 1.89 [ 0.97, 3.67 ]
Cohen 2002 GEMC 200/346 185/346 10.4 % 1.19 [ 0.88, 1.61 ]
Cohen 2002 UCOP 217/348 185/348 9.3 % 1.46 [ 1.08, 1.97 ]
Kay 1992 16/30 17/29 1.1 % 0.81 [ 0.29, 2.26 ]
Nikolaus 1999 plus ESD 118/181 55/92 3.4 % 1.26 [ 0.75, 2.11 ]
Nikolaus 1999 Ward 114/179 56/93 3.6 % 1.16 [ 0.69, 1.94 ]
Rubenstein 1984 35/63 22/60 1.3 % 2.16 [ 1.05, 4.45 ]
Saltvedt 2002 76/127 68/127 3.6 % 1.29 [ 0.79, 2.13 ]
White 1994 14/20 7/20 0.3 % 4.33 [ 1.15, 16.32 ]
Subtotal (95% CI) 1372 1192 34.6 % 1.36 [ 1.16, 1.60 ]
Total events: 845 (Favours control), 638 (Control)
0.05 0.2 1 5 20
Favours control Favours experimental
(Continued . . . )
74Comprehensive geriatric assessment for older adults admitted to hospital (Review)
Copyright © 2011 The Cochrane Collaboration. Published by John Wiley & Sons, Ltd.
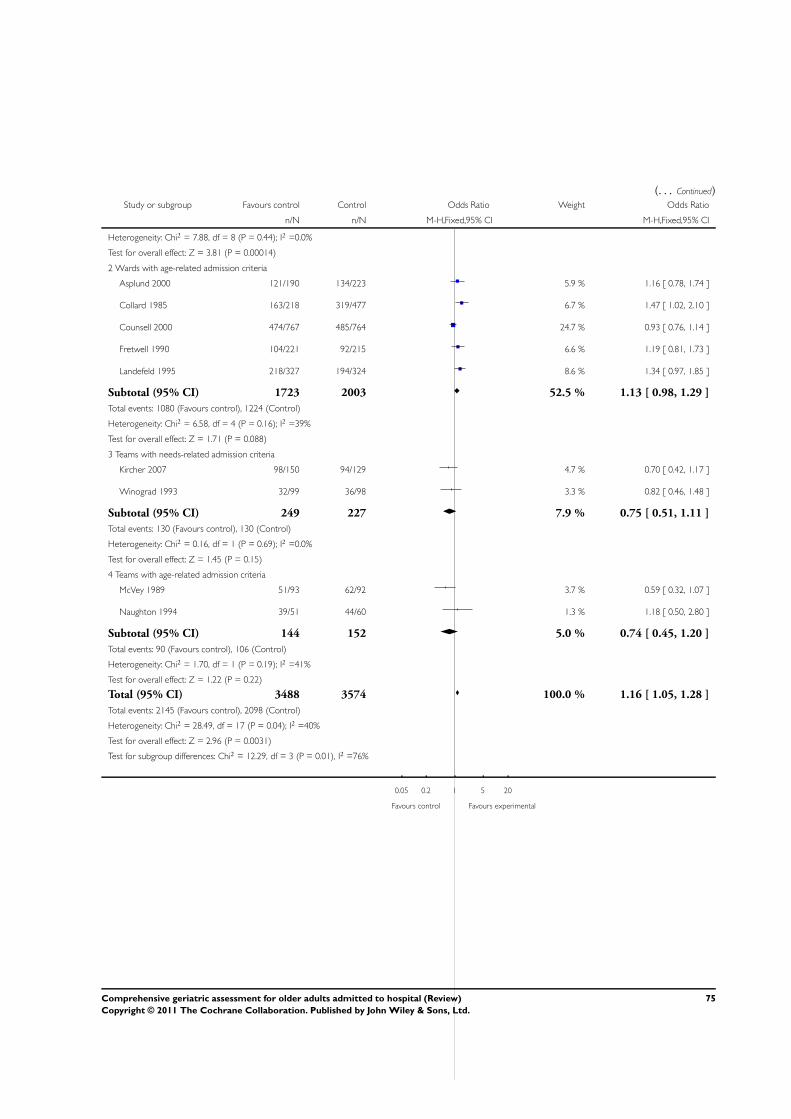
(. . . Continued)Study or subgroup Favours control Control Odds Ratio Weight Odds Ratio
n/N n/N M-H,Fixed,95% CI M-H,Fixed,95% CI
Heterogeneity: Chi2 = 7.88, df = 8 (P = 0.44); I2 =0.0%
Test for overall effect: Z = 3.81 (P = 0.00014)
2 Wards with age-related admission criteria
Asplund 2000 121/190 134/223 5.9 % 1.16 [ 0.78, 1.74 ]
Collard 1985 163/218 319/477 6.7 % 1.47 [ 1.02, 2.10 ]
Counsell 2000 474/767 485/764 24.7 % 0.93 [ 0.76, 1.14 ]
Fretwell 1990 104/221 92/215 6.6 % 1.19 [ 0.81, 1.73 ]
Landefeld 1995 218/327 194/324 8.6 % 1.34 [ 0.97, 1.85 ]
Subtotal (95% CI) 1723 2003 52.5 % 1.13 [ 0.98, 1.29 ]
Total events: 1080 (Favours control), 1224 (Control)
Heterogeneity: Chi2 = 6.58, df = 4 (P = 0.16); I2 =39%
Test for overall effect: Z = 1.71 (P = 0.088)
3 Teams with needs-related admission criteria
Kircher 2007 98/150 94/129 4.7 % 0.70 [ 0.42, 1.17 ]
Winograd 1993 32/99 36/98 3.3 % 0.82 [ 0.46, 1.48 ]
Subtotal (95% CI) 249 227 7.9 % 0.75 [ 0.51, 1.11 ]
Total events: 130 (Favours control), 130 (Control)
Heterogeneity: Chi2 = 0.16, df = 1 (P = 0.69); I2 =0.0%
Test for overall effect: Z = 1.45 (P = 0.15)
4 Teams with age-related admission criteria
McVey 1989 51/93 62/92 3.7 % 0.59 [ 0.32, 1.07 ]
Naughton 1994 39/51 44/60 1.3 % 1.18 [ 0.50, 2.80 ]
Subtotal (95% CI) 144 152 5.0 % 0.74 [ 0.45, 1.20 ]
Total events: 90 (Favours control), 106 (Control)
Heterogeneity: Chi2 = 1.70, df = 1 (P = 0.19); I2 =41%
Test for overall effect: Z = 1.22 (P = 0.22)
Total (95% CI) 3488 3574 100.0 % 1.16 [ 1.05, 1.28 ]
Total events: 2145 (Favours control), 2098 (Control)
Heterogeneity: Chi2 = 28.49, df = 17 (P = 0.04); I2 =40%
Test for overall effect: Z = 2.96 (P = 0.0031)
Test for subgroup differences: Chi2 = 12.29, df = 3 (P = 0.01), I2 =76%
0.05 0.2 1 5 20
Favours control Favours experimental
75Comprehensive geriatric assessment for older adults admitted to hospital (Review)
Copyright © 2011 The Cochrane Collaboration. Published by John Wiley & Sons, Ltd.
Analysis 3.1. Comparison 3 CGA versus usual care (timing of admission), Outcome 1 Living at home (up to
6 months).
Review: Comprehensive geriatric assessment for older adults admitted to hospital
Comparison: 3 CGA versus usual care (timing of admission)
Outcome: 1 Living at home (up to 6 months)
Study or subgroup Experimental Control Odds Ratio Weight Odds Ratio
n/N n/N M-H,Fixed,95% CI M-H,Fixed,95% CI
1 Wards (direct admission)
Asplund 2000 121/190 134/223 9.4 % 1.16 [ 0.78, 1.74 ]
Collard 1985 163/218 319/477 10.6 % 1.47 [ 1.02, 2.10 ]
Counsell 2000 536/767 531/764 33.6 % 1.02 [ 0.82, 1.27 ]
Fretwell 1990 104/221 92/215 10.4 % 1.19 [ 0.81, 1.73 ]
Harris 1991 67/97 106/170 5.0 % 1.35 [ 0.79, 2.29 ]
Landefeld 1995 260/327 233/324 10.1 % 1.52 [ 1.06, 2.18 ]
Subtotal (95% CI) 1820 2173 79.0 % 1.20 [ 1.05, 1.38 ]
Total events: 1251 (Experimental), 1415 (Control)
Heterogeneity: Chi2 = 5.20, df = 5 (P = 0.39); I2 =4%
Test for overall effect: Z = 2.64 (P = 0.0082)
2 Wards (stepdown admission)
Applegate 1990 62/78 47/77 2.0 % 2.47 [ 1.21, 5.06 ]
Kay 1992 16/30 17/29 1.7 % 0.81 [ 0.29, 2.26 ]
Rubenstein 1984 46/63 32/60 1.9 % 2.37 [ 1.12, 5.03 ]
Saltvedt 2002 101/127 79/127 3.4 % 2.36 [ 1.35, 4.14 ]
White 1994 14/20 7/20 0.4 % 4.33 [ 1.15, 16.32 ]
Subtotal (95% CI) 318 313 9.4 % 2.20 [ 1.56, 3.09 ]
Total events: 239 (Experimental), 182 (Control)
Heterogeneity: Chi2 = 4.85, df = 4 (P = 0.30); I2 =18%
Test for overall effect: Z = 4.52 (P < 0.00001)
3 Teams (direct admission)
Naughton 1994 39/51 44/60 2.0 % 1.18 [ 0.50, 2.80 ]
Subtotal (95% CI) 51 60 2.0 % 1.18 [ 0.50, 2.80 ]
Total events: 39 (Experimental), 44 (Control)
Heterogeneity: not applicable
Test for overall effect: Z = 0.38 (P = 0.70)
4 Teams (acute admission)
McVey 1989 61/93 64/92 4.6 % 0.83 [ 0.45, 1.55 ]
Subtotal (95% CI) 93 92 4.6 % 0.83 [ 0.45, 1.55 ]
0.01 0.1 1 10 100
Favours control Favours experimental
(Continued . . . )
76Comprehensive geriatric assessment for older adults admitted to hospital (Review)
Copyright © 2011 The Cochrane Collaboration. Published by John Wiley & Sons, Ltd.
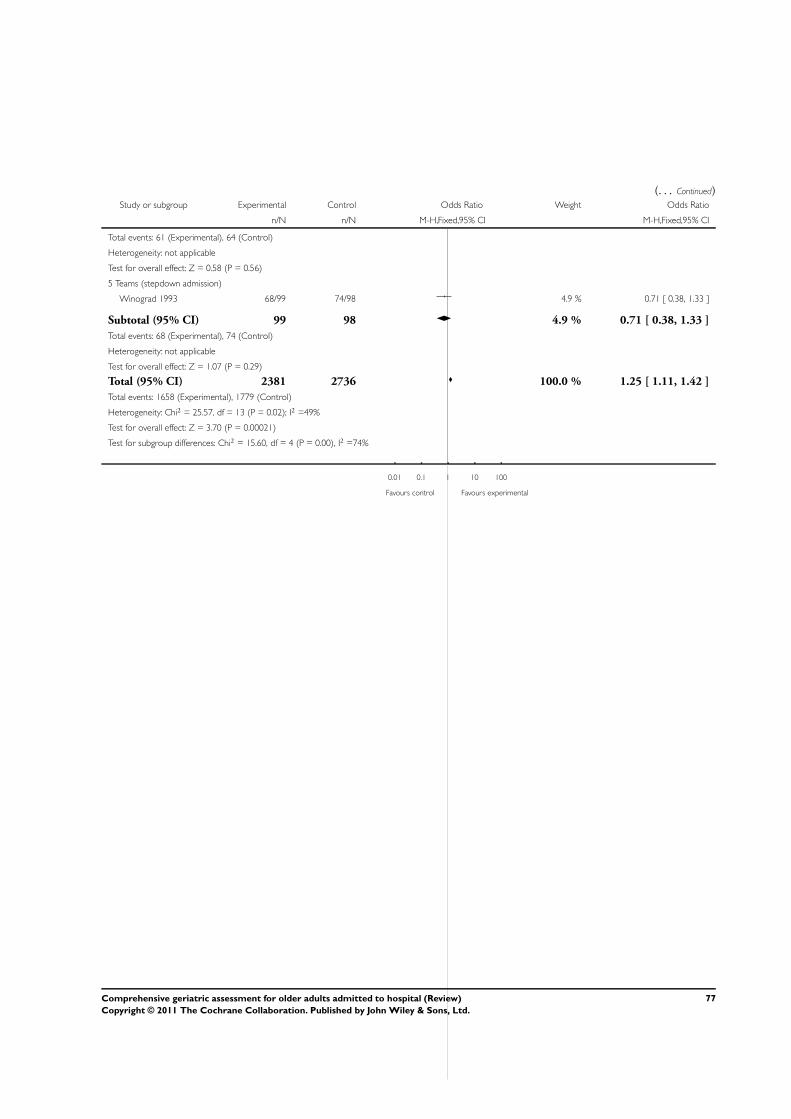
(. . . Continued)Study or subgroup Experimental Control Odds Ratio Weight Odds Ratio
n/N n/N M-H,Fixed,95% CI M-H,Fixed,95% CI
Total events: 61 (Experimental), 64 (Control)
Heterogeneity: not applicable
Test for overall effect: Z = 0.58 (P = 0.56)
5 Teams (stepdown admission)
Winograd 1993 68/99 74/98 4.9 % 0.71 [ 0.38, 1.33 ]
Subtotal (95% CI) 99 98 4.9 % 0.71 [ 0.38, 1.33 ]
Total events: 68 (Experimental), 74 (Control)
Heterogeneity: not applicable
Test for overall effect: Z = 1.07 (P = 0.29)
Total (95% CI) 2381 2736 100.0 % 1.25 [ 1.11, 1.42 ]
Total events: 1658 (Experimental), 1779 (Control)
Heterogeneity: Chi2 = 25.57, df = 13 (P = 0.02); I2 =49%
Test for overall effect: Z = 3.70 (P = 0.00021)
Test for subgroup differences: Chi2 = 15.60, df = 4 (P = 0.00), I2 =74%
0.01 0.1 1 10 100
Favours control Favours experimental
77Comprehensive geriatric assessment for older adults admitted to hospital (Review)
Copyright © 2011 The Cochrane Collaboration. Published by John Wiley & Sons, Ltd.

Analysis 3.2. Comparison 3 CGA versus usual care (timing of admission), Outcome 2 Living at home (end
of follow up).
Review: Comprehensive geriatric assessment for older adults admitted to hospital
Comparison: 3 CGA versus usual care (timing of admission)
Outcome: 2 Living at home (end of follow up)
Study or subgroup Experimental Control Odds Ratio Weight Odds Ratio
n/N n/N M-H,Fixed,95% CI M-H,Fixed,95% CI
1 Wards (direct admission)
Asplund 2000 121/190 134/223 5.9 % 1.16 [ 0.78, 1.74 ]
Collard 1985 163/218 319/477 6.7 % 1.47 [ 1.02, 2.10 ]
Counsell 2000 474/767 485/764 24.7 % 0.93 [ 0.76, 1.14 ]
Fretwell 1990 104/221 92/215 6.6 % 1.19 [ 0.81, 1.73 ]
Landefeld 1995 218/327 194/324 8.6 % 1.34 [ 0.97, 1.85 ]
Subtotal (95% CI) 1723 2003 52.5 % 1.13 [ 0.98, 1.29 ]
Total events: 1080 (Experimental), 1224 (Control)
Heterogeneity: Chi2 = 6.58, df = 4 (P = 0.16); I2 =39%
Test for overall effect: Z = 1.71 (P = 0.088)
2 Wards (acute admission)
Nikolaus 1999 plus ESD 118/181 55/92 3.4 % 1.26 [ 0.75, 2.11 ]
Nikolaus 1999 Ward 114/179 56/93 3.6 % 1.16 [ 0.69, 1.94 ]
Subtotal (95% CI) 360 185 6.9 % 1.21 [ 0.84, 1.74 ]
Total events: 232 (Experimental), 111 (Control)
Heterogeneity: Chi2 = 0.05, df = 1 (P = 0.82); I2 =0.0%
Test for overall effect: Z = 1.02 (P = 0.31)
3 Wards (stepdown admission)
Applegate 1990 55/78 43/77 1.7 % 1.89 [ 0.97, 3.67 ]
Cohen 2002 GEMC 200/346 185/346 10.4 % 1.19 [ 0.88, 1.61 ]
Cohen 2002 UCOP 217/348 185/348 9.3 % 1.46 [ 1.08, 1.97 ]
Kay 1992 16/30 17/29 1.1 % 0.81 [ 0.29, 2.26 ]
Rubenstein 1984 35/63 22/60 1.3 % 2.16 [ 1.05, 4.45 ]
Saltvedt 2002 76/127 68/127 3.6 % 1.29 [ 0.79, 2.13 ]
White 1994 14/20 7/20 0.3 % 4.33 [ 1.15, 16.32 ]
Subtotal (95% CI) 1012 1007 27.6 % 1.40 [ 1.17, 1.67 ]
Total events: 613 (Experimental), 527 (Control)
Heterogeneity: Chi2 = 7.33, df = 6 (P = 0.29); I2 =18%
Test for overall effect: Z = 3.74 (P = 0.00018)
0.01 0.1 1 10 100
Favours control Favours experimental
(Continued . . . )
78Comprehensive geriatric assessment for older adults admitted to hospital (Review)
Copyright © 2011 The Cochrane Collaboration. Published by John Wiley & Sons, Ltd.

(. . . Continued)Study or subgroup Experimental Control Odds Ratio Weight Odds Ratio
n/N n/N M-H,Fixed,95% CI M-H,Fixed,95% CI
4 Teams (direct assessment)
Naughton 1994 39/51 44/60 1.3 % 1.18 [ 0.50, 2.80 ]
Subtotal (95% CI) 51 60 1.3 % 1.18 [ 0.50, 2.80 ]
Total events: 39 (Experimental), 44 (Control)
Heterogeneity: not applicable
Test for overall effect: Z = 0.38 (P = 0.70)
5 Teams (acute assessment)
Kircher 2007 98/150 94/129 4.7 % 0.70 [ 0.42, 1.17 ]
McVey 1989 51/93 62/92 3.7 % 0.59 [ 0.32, 1.07 ]
Subtotal (95% CI) 243 221 8.4 % 0.65 [ 0.44, 0.96 ]
Total events: 149 (Experimental), 156 (Control)
Heterogeneity: Chi2 = 0.20, df = 1 (P = 0.66); I2 =0.0%
Test for overall effect: Z = 2.16 (P = 0.031)
6 Teams (stepdown assessment)
Winograd 1993 32/99 36/98 3.3 % 0.82 [ 0.46, 1.48 ]
Subtotal (95% CI) 99 98 3.3 % 0.82 [ 0.46, 1.48 ]
Total events: 32 (Experimental), 36 (Control)
Heterogeneity: not applicable
Test for overall effect: Z = 0.65 (P = 0.52)
Total (95% CI) 3488 3574 100.0 % 1.16 [ 1.05, 1.28 ]
Total events: 2145 (Experimental), 2098 (Control)
Heterogeneity: Chi2 = 28.49, df = 17 (P = 0.04); I2 =40%
Test for overall effect: Z = 2.96 (P = 0.0031)
Test for subgroup differences: Chi2 = 14.40, df = 5 (P = 0.01), I2 =65%
0.01 0.1 1 10 100
Favours control Favours experimental
79Comprehensive geriatric assessment for older adults admitted to hospital (Review)
Copyright © 2011 The Cochrane Collaboration. Published by John Wiley & Sons, Ltd.
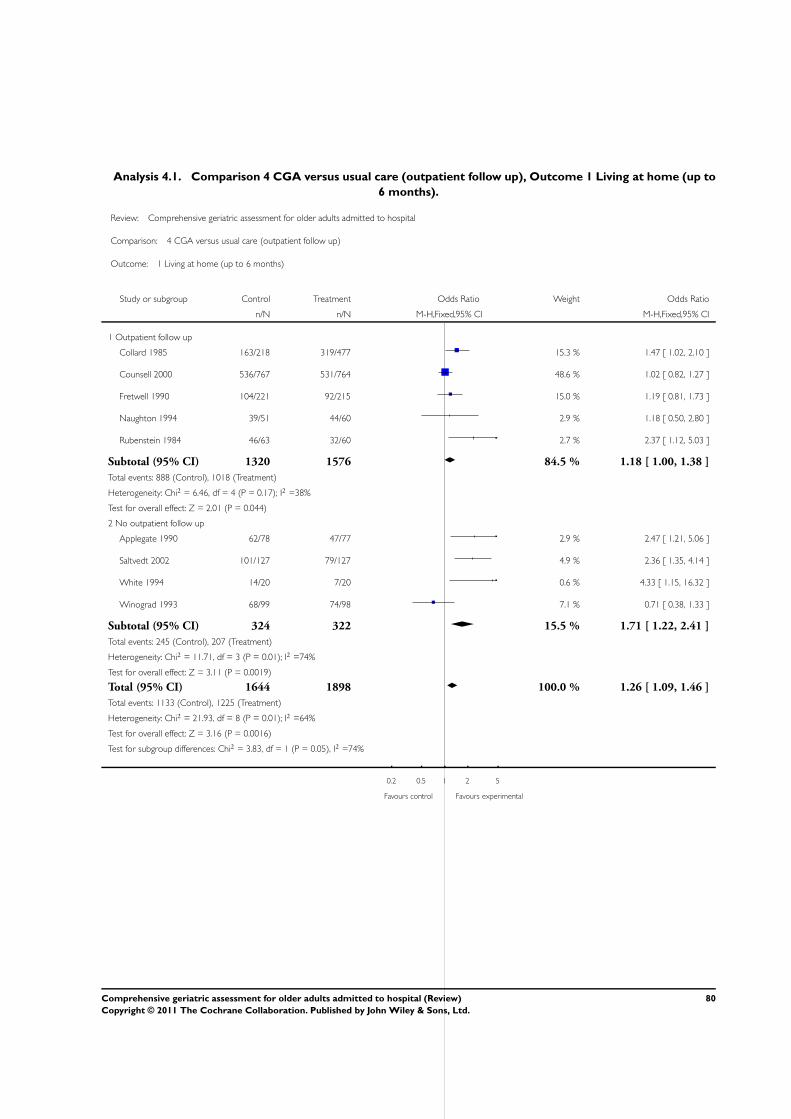
Analysis 4.1. Comparison 4 CGA versus usual care (outpatient follow up), Outcome 1 Living at home (up to
6 months).
Review: Comprehensive geriatric assessment for older adults admitted to hospital
Comparison: 4 CGA versus usual care (outpatient follow up)
Outcome: 1 Living at home (up to 6 months)
Study or subgroup Control Treatment Odds Ratio Weight Odds Ratio
n/N n/N M-H,Fixed,95% CI M-H,Fixed,95% CI
1 Outpatient follow up
Collard 1985 163/218 319/477 15.3 % 1.47 [ 1.02, 2.10 ]
Counsell 2000 536/767 531/764 48.6 % 1.02 [ 0.82, 1.27 ]
Fretwell 1990 104/221 92/215 15.0 % 1.19 [ 0.81, 1.73 ]
Naughton 1994 39/51 44/60 2.9 % 1.18 [ 0.50, 2.80 ]
Rubenstein 1984 46/63 32/60 2.7 % 2.37 [ 1.12, 5.03 ]
Subtotal (95% CI) 1320 1576 84.5 % 1.18 [ 1.00, 1.38 ]
Total events: 888 (Control), 1018 (Treatment)
Heterogeneity: Chi2 = 6.46, df = 4 (P = 0.17); I2 =38%
Test for overall effect: Z = 2.01 (P = 0.044)
2 No outpatient follow up
Applegate 1990 62/78 47/77 2.9 % 2.47 [ 1.21, 5.06 ]
Saltvedt 2002 101/127 79/127 4.9 % 2.36 [ 1.35, 4.14 ]
White 1994 14/20 7/20 0.6 % 4.33 [ 1.15, 16.32 ]
Winograd 1993 68/99 74/98 7.1 % 0.71 [ 0.38, 1.33 ]
Subtotal (95% CI) 324 322 15.5 % 1.71 [ 1.22, 2.41 ]
Total events: 245 (Control), 207 (Treatment)
Heterogeneity: Chi2 = 11.71, df = 3 (P = 0.01); I2 =74%
Test for overall effect: Z = 3.11 (P = 0.0019)
Total (95% CI) 1644 1898 100.0 % 1.26 [ 1.09, 1.46 ]
Total events: 1133 (Control), 1225 (Treatment)
Heterogeneity: Chi2 = 21.93, df = 8 (P = 0.01); I2 =64%
Test for overall effect: Z = 3.16 (P = 0.0016)
Test for subgroup differences: Chi2 = 3.83, df = 1 (P = 0.05), I2 =74%
0.2 0.5 1 2 5
Favours control Favours experimental
80Comprehensive geriatric assessment for older adults admitted to hospital (Review)
Copyright © 2011 The Cochrane Collaboration. Published by John Wiley & Sons, Ltd.

Analysis 4.2. Comparison 4 CGA versus usual care (outpatient follow up), Outcome 2 Living at home (end
of follow up).
Review: Comprehensive geriatric assessment for older adults admitted to hospital
Comparison: 4 CGA versus usual care (outpatient follow up)
Outcome: 2 Living at home (end of follow up)
Study or subgroup Treatment Control Odds Ratio Weight Odds Ratio
n/N n/N M-H,Fixed,95% CI M-H,Fixed,95% CI
1 Outpatient follow up
Cohen 2002 GEMC 200/346 185/346 12.9 % 1.19 [ 0.88, 1.61 ]
Collard 1985 163/218 319/477 8.3 % 1.47 [ 1.02, 2.10 ]
Counsell 2000 474/767 485/764 30.6 % 0.93 [ 0.76, 1.14 ]
Fretwell 1990 104/221 92/215 8.1 % 1.19 [ 0.81, 1.73 ]
Naughton 1994 39/51 44/60 1.6 % 1.18 [ 0.50, 2.80 ]
Nikolaus 1999 plus ESD 118/181 55/92 4.2 % 1.26 [ 0.75, 2.11 ]
Rubenstein 1984 35/63 22/60 1.7 % 2.16 [ 1.05, 4.45 ]
Subtotal (95% CI) 1847 2014 67.3 % 1.13 [ 0.99, 1.30 ]
Total events: 1133 (Treatment), 1202 (Control)
Heterogeneity: Chi2 = 8.85, df = 6 (P = 0.18); I2 =32%
Test for overall effect: Z = 1.86 (P = 0.063)
2 No outpatient follow up
Applegate 1990 55/78 43/77 2.1 % 1.89 [ 0.97, 3.67 ]
Cohen 2002 UCOP 217/348 185/348 11.5 % 1.46 [ 1.08, 1.97 ]
Kircher 2007 98/150 94/129 5.8 % 0.70 [ 0.42, 1.17 ]
Nikolaus 1999 Ward 114/179 56/93 4.4 % 1.16 [ 0.69, 1.94 ]
Saltvedt 2002 76/127 68/127 4.5 % 1.29 [ 0.79, 2.13 ]
White 1994 14/20 7/20 0.3 % 4.33 [ 1.15, 16.32 ]
Winograd 1993 32/99 36/98 4.0 % 0.82 [ 0.46, 1.48 ]
Subtotal (95% CI) 1001 892 32.7 % 1.24 [ 1.03, 1.50 ]
Total events: 606 (Treatment), 489 (Control)
Heterogeneity: Chi2 = 12.78, df = 6 (P = 0.05); I2 =53%
Test for overall effect: Z = 2.27 (P = 0.023)
Total (95% CI) 2848 2906 100.0 % 1.17 [ 1.05, 1.30 ]
Total events: 1739 (Treatment), 1691 (Control)
Heterogeneity: Chi2 = 22.23, df = 13 (P = 0.05); I2 =42%
Test for overall effect: Z = 2.83 (P = 0.0046)
Test for subgroup differences: Chi2 = 0.59, df = 1 (P = 0.44), I2 =0.0%
0.2 0.5 1 2 5
Favours control Favours experimental
81Comprehensive geriatric assessment for older adults admitted to hospital (Review)
Copyright © 2011 The Cochrane Collaboration. Published by John Wiley & Sons, Ltd.
A P P E N D I C E S
Appendix 1. MEDLINE search strategy
1 Geriatric Assessment/
2 Health Services for the Aged/
3 needs assessment/
4 risk assessment/
5 exp Diagnostic Services/
6 “Health Services Needs and Demand”/
7 exp Health Services/
8 exp “Delivery of Health Care”/
9 exp “Outcome and Process Assessment (Health Care)”/
10 or/3-9
11 geriatrics/
12 10 and 11
13 1 or 2 or 12
14 geriatric assessment.tw.
15 (geriatric adj2 consultation).tw.
16 (geriatric adj2 evaluation).tw.
17 or/13-16
18 randomized controlled trial.pt.
19 controlled clinical trial.pt.
20 intervention studies/
21 experiment$.tw.
22 (time adj series).tw.
23 (pre test or pretest or (posttest or post test)).tw.
24 random allocation/
25 impact.tw.
26 intervention?.tw.
27 chang$.tw.
28 evaluation studies/
29 evaluat$.tw.
30 effect?.tw.
31 comparative studies/
32 animal/
33 human/
34 32 not 33
35 or/18-31
36 35 not 34
37 17 and 36
Appendix 2. EMBASE search strategy
1. geriatric assessment/
2. health services for the aged/
3. aged/ or “aged, 80 and over”/ or frail elderly/ or geriatrics/
4. needs assessment/
5. *risk assessment/
6. diagnostic services/
7. “health services needs and demand”/
8. *health services/
9. *health status/
82Comprehensive geriatric assessment for older adults admitted to hospital (Review)
Copyright © 2011 The Cochrane Collaboration. Published by John Wiley & Sons, Ltd.
10. *“outcome and process assessment (health care)”/ or *“outcome assessment (health care)”/
11. “delivery of health care”/ or “delivery of health care, integrated”/
12. patient care team/
13. or/4-12
14. 3 and 13
15. ((geriatric or aged or elderly or old age) adj5 (assess$ or evaluation or consultation)).tw.
16. (gemu or gemus).tw.
17. 3 and (multidisciplinary adj5 assess$).tw.
18. 1 or 2 or 14 or 15 or 16 or 17
19. randomized controlled trials/
20. controlled clinical trials/
21. random allocation/
22. double-blind method/
23. single-blind method/
24. clinical trials/
25. (clin$ adj5 trial$).tw.
26. ((singl$ or doubl$ or tripl$ or trebl$) adj5 (blind$ or mask$)).tw.
27. (random$ or quasi-random$ or quasi random$).tw.
28. research design/
29. meta-analysis/
30. control groups/
31. ((control or intervention) adj5 group$).tw.
32. (metaanalysis or meta-analysis or meta-analysis or systematic review).tw.
33. program evaluation/
34. or/19-33
35. 18 and 34
H I S T O R Y
Protocol first published: Issue 4, 2006
Review first published: Issue 7, 2011
Date Event Description
12 November 2008 Amended Minor changes
12 November 2008 Amended Converted to new review format.
83Comprehensive geriatric assessment for older adults admitted to hospital (Review)
Copyright © 2011 The Cochrane Collaboration. Published by John Wiley & Sons, Ltd.
C O N T R I B U T I O N S O F A U T H O R S
G Ellis was lead review author. M Whitehead and D Robinson were responsible for the selection of trials and extraction of data. D
O’Neill and P Langhorne moderated.
D E C L A R A T I O N S O F I N T E R E S T
All review authors are geriatricians. None have received financial support related to the subject of the review.
S O U R C E S O F S U P P O R T
Internal sources
• No internal sources of support were sought, UK.
External sources
• No sources of support supplied
D I F F E R E N C E S B E T W E E N P R O T O C O L A N D R E V I E W
Analysis of the joint primary outcome ’independent survival’ was not possible for reasons highlighted above. Similarly, comparisons of
cost in a meta-analysis have not been attempted because of the differences in reporting style described above.
84Comprehensive geriatric assessment for older adults admitted to hospital (Review)
Copyright © 2011 The Cochrane Collaboration. Published by John Wiley & Sons, Ltd.


![geriatric assessment [EDocFind.com].ppt](https://img.dokumen.tips/doc/110x75/56d6c0791a28ab30169a87ff/geriatric-assessment-edocfindcomppt.jpg)