Embed Size (px)
DESCRIPTION
finite element method using ansys program to analysis composite streel-concrete beam
Citation preview
107
ISSN 1999-8716
Printed in Iraq
Vol. 06, No. 03, pp. 107-126, September 2013
NONLINEAR ANALYSIS OF SIMPLY SUPPORTED
COMPOSITE STEEL - CONCRETE BEAM
Amer M. Ibrahim1, Qussay W. Ahmed2
University Diyala ,College of engineering, 21
Email: [email protected], [email protected]
(Received: 18/9/2011; Accepted: 31/1/2013)
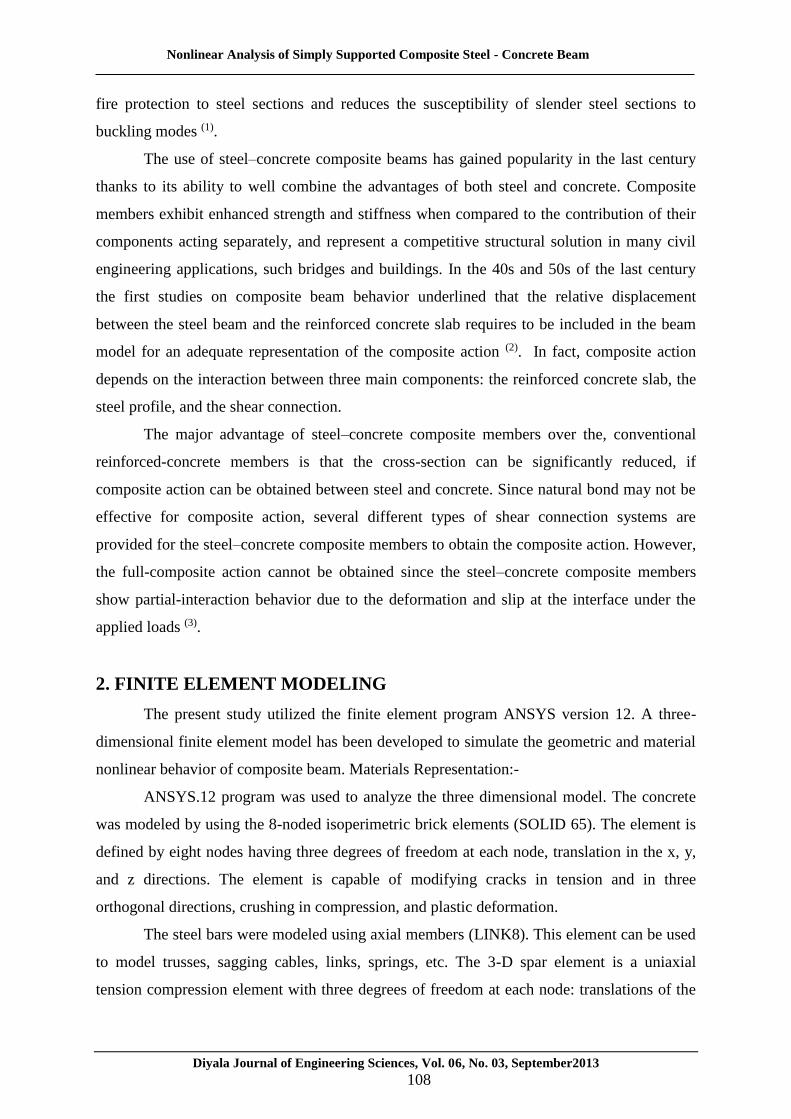
ABSTRACT:- This paper presents a nonlinear finite element computer program. ANSYS
version 12.0 developed for the analysis of composite steel-concrete beam. A three-
dimensional finite element (FE) model has been developed in this work. The analytical
results of load-deflection response have been compared with available experimental tests. In
general good agreement between the finite element solutions and experimental results have
been obtained. Parametric studies have been carried out to investigate the effect of some
important material and geometrical parameters. These parameters included the effect of shear
connectors number, concrete grade, thickness to width ratio of concrete slab, the ultimate
load for shear connector and effect of yield strength of Steel beam. It was found that, as the
compressive strength of concrete increases from 20 MPa to 70 MPa the ultimate load
increases by about 20% and also an increase in the thickness to width ratio (t/B) of concrete
slab from 0.1 to 0.3 lead to increase in the ultimate load by about 43%.
Keywords: - Composite beams; Steel-concrete; Finite Element modeling; Nonlinear analysis.
1. INTRODUCTION
Concrete and structural steel are the two most widely used materials in the
construction industry. Whenever such materials are used individually, there are inherent
weaknesses where concrete is inefficient in resisting tensile load and slender structural steel
sections are susceptible to load buckling. However, when they are combined together to form
so called composite construction, the merits of these two materials are optimally used. The
efficiency of composite construction is increased significantly where concrete is utilized for
compression and steel in tension. Furthermore, concrete provides corrosion resistance and
Diyala Journal of Engineering
Sciences
Nonlinear Analysis of Simply Supported Composite Steel - Concrete Beam
Diyala Journal of Engineering Sciences, Vol. 06, No. 03, September2013
108
fire protection to steel sections and reduces the susceptibility of slender steel sections to
buckling modes (1).
The use of steel–concrete composite beams has gained popularity in the last century
thanks to its ability to well combine the advantages of both steel and concrete. Composite
members exhibit enhanced strength and stiffness when compared to the contribution of their
components acting separately, and represent a competitive structural solution in many civil
engineering applications, such bridges and buildings. In the 40s and 50s of the last century
the first studies on composite beam behavior underlined that the relative displacement
between the steel beam and the reinforced concrete slab requires to be included in the beam
model for an adequate representation of the composite action (2). In fact, composite action
depends on the interaction between three main components: the reinforced concrete slab, the
steel profile, and the shear connection.
The major advantage of steel–concrete composite members over the, conventional
reinforced-concrete members is that the cross-section can be significantly reduced, if
composite action can be obtained between steel and concrete. Since natural bond may not be
effective for composite action, several different types of shear connection systems are
provided for the steel–concrete composite members to obtain the composite action. However,
the full-composite action cannot be obtained since the steel–concrete composite members
show partial-interaction behavior due to the deformation and slip at the interface under the
applied loads (3).
2. FINITE ELEMENT MODELING
The present study utilized the finite element program ANSYS version 12. A three-
dimensional finite element model has been developed to simulate the geometric and material
nonlinear behavior of composite beam. Materials Representation:-
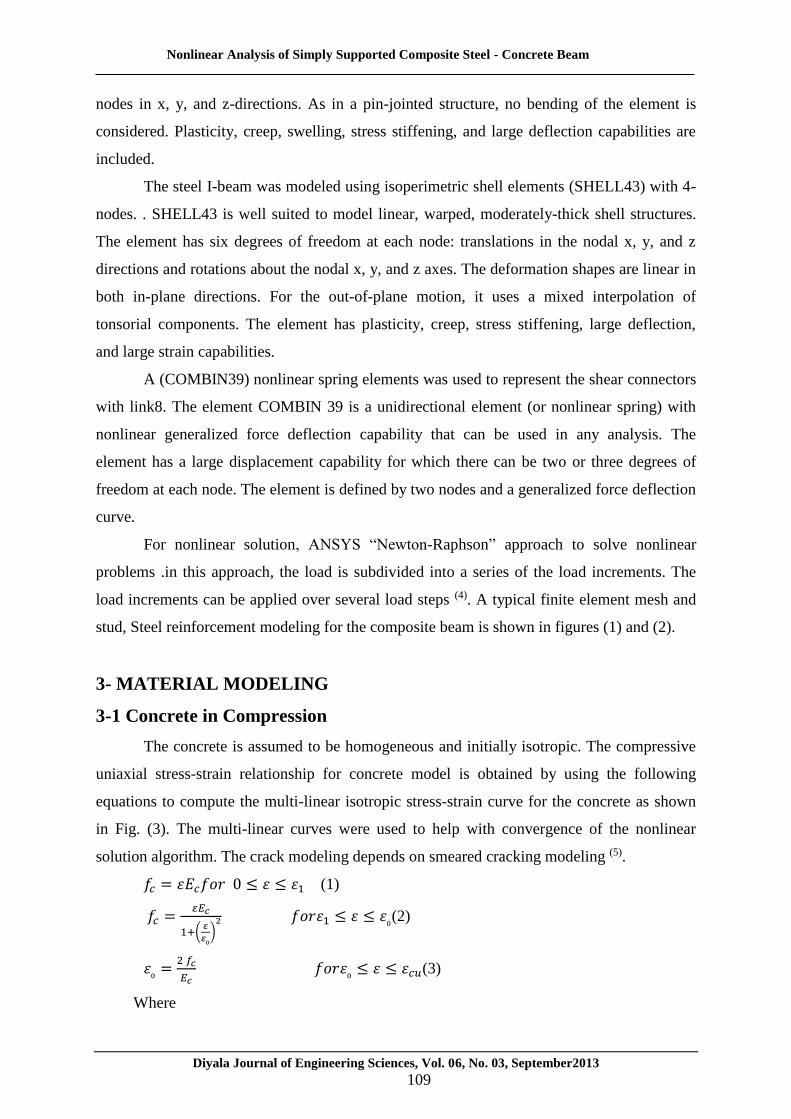
ANSYS.12 program was used to analyze the three dimensional model. The concrete
was modeled by using the 8-noded isoperimetric brick elements (SOLID 65). The element is
defined by eight nodes having three degrees of freedom at each node, translation in the x, y,
and z directions. The element is capable of modifying cracks in tension and in three
orthogonal directions, crushing in compression, and plastic deformation.
The steel bars were modeled using axial members (LINK8). This element can be used
to model trusses, sagging cables, links, springs, etc. The 3-D spar element is a uniaxial
tension compression element with three degrees of freedom at each node: translations of the
Nonlinear Analysis of Simply Supported Composite Steel - Concrete Beam
Diyala Journal of Engineering Sciences, Vol. 06, No. 03, September2013
109
nodes in x, y, and z-directions. As in a pin-jointed structure, no bending of the element is
considered. Plasticity, creep, swelling, stress stiffening, and large deflection capabilities are
included.
The steel I-beam was modeled using isoperimetric shell elements (SHELL43) with 4-
nodes. . SHELL43 is well suited to model linear, warped, moderately-thick shell structures.
The element has six degrees of freedom at each node: translations in the nodal x, y, and z
directions and rotations about the nodal x, y, and z axes. The deformation shapes are linear in
both in-plane directions. For the out-of-plane motion, it uses a mixed interpolation of
tonsorial components. The element has plasticity, creep, stress stiffening, large deflection,
and large strain capabilities.
A (COMBIN39) nonlinear spring elements was used to represent the shear connectors
with link8. The element COMBIN 39 is a unidirectional element (or nonlinear spring) with
nonlinear generalized force deflection capability that can be used in any analysis. The
element has a large displacement capability for which there can be two or three degrees of
freedom at each node. The element is defined by two nodes and a generalized force deflection
curve.
For nonlinear solution, ANSYS “Newton-Raphson” approach to solve nonlinear
problems .in this approach, the load is subdivided into a series of the load increments. The
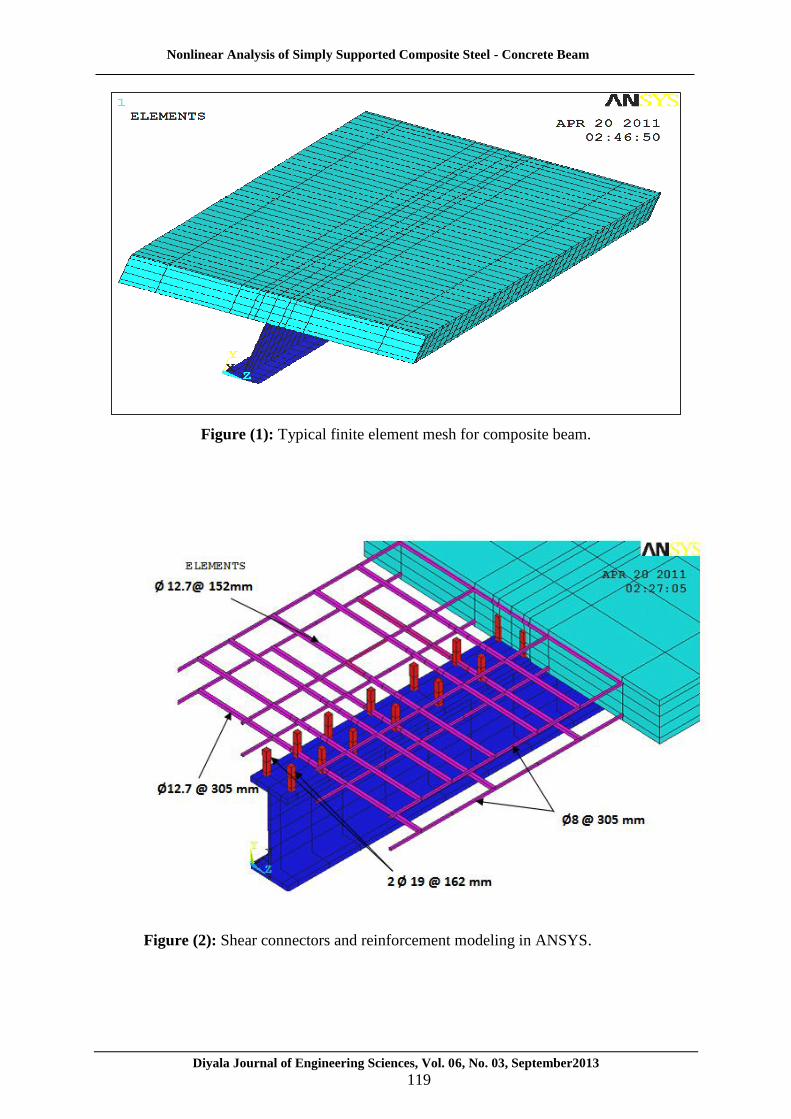
load increments can be applied over several load steps (4). A typical finite element mesh and
stud, Steel reinforcement modeling for the composite beam is shown in figures (1) and (2).
3- MATERIAL MODELING
3-1 Concrete in Compression
The concrete is assumed to be homogeneous and initially isotropic. The compressive
uniaxial stress-strain relationship for concrete model is obtained by using the following
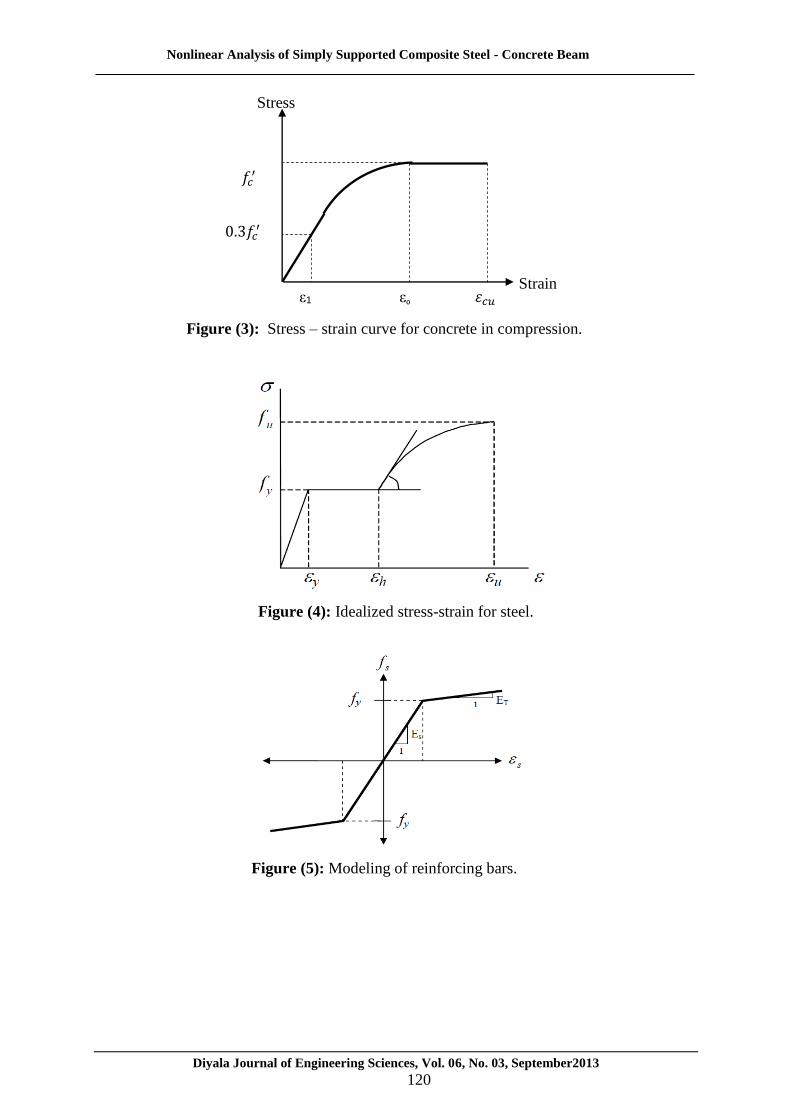
equations to compute the multi-linear isotropic stress-strain curve for the concrete as shown
in Fig. (3). The multi-linear curves were used to help with convergence of the nonlinear
solution algorithm. The crack modeling depends on smeared cracking modeling (5).
𝑓𝑐 = 𝜀𝐸𝑐𝑓𝑜𝑟 0 ≤ 𝜀 ≤ 𝜀1 (1)
𝑓𝑐 =𝜀𝐸𝑐
1+(𝜀
𝜀₀)
2 𝑓𝑜𝑟𝜀1 ≤ 𝜀 ≤ 𝜀₀(2)
𝜀₀ =2 𝑓𝑐
𝐸𝑐 𝑓𝑜𝑟𝜀₀ ≤ 𝜀 ≤ 𝜀𝑐𝑢(3)
Where
Nonlinear Analysis of Simply Supported Composite Steel - Concrete Beam
Diyala Journal of Engineering Sciences, Vol. 06, No. 03, September2013
110
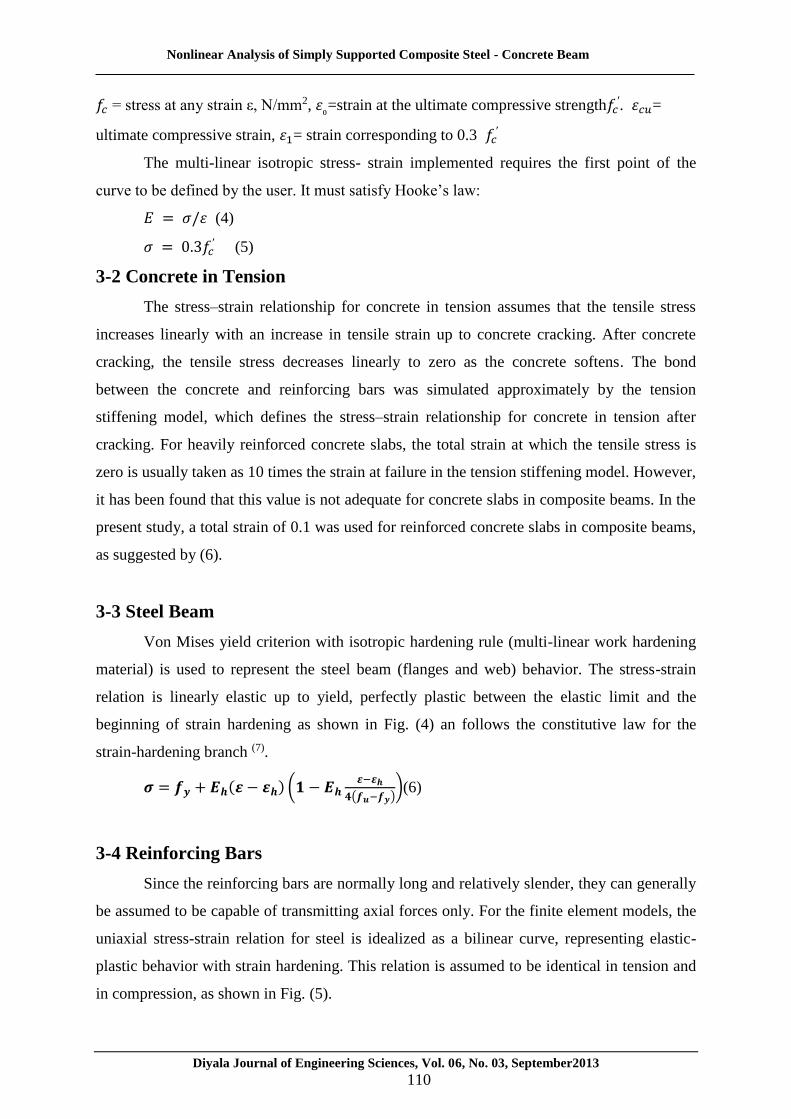
𝑓𝑐 = stress at any strain ε, N/mm2, 𝜀₀=strain at the ultimate compressive strength𝑓𝑐′. 𝜀𝑐𝑢=
ultimate compressive strain, 𝜀1= strain corresponding to 0.3 𝑓𝑐′
The multi-linear isotropic stress- strain implemented requires the first point of the
curve to be defined by the user. It must satisfy Hooke’s law:
𝐸 = 𝜎/𝜀 (4)
𝜎 = 0.3𝑓𝑐′ (5)
3-2 Concrete in Tension
The stress–strain relationship for concrete in tension assumes that the tensile stress
increases linearly with an increase in tensile strain up to concrete cracking. After concrete
cracking, the tensile stress decreases linearly to zero as the concrete softens. The bond
between the concrete and reinforcing bars was simulated approximately by the tension
stiffening model, which defines the stress–strain relationship for concrete in tension after
cracking. For heavily reinforced concrete slabs, the total strain at which the tensile stress is
zero is usually taken as 10 times the strain at failure in the tension stiffening model. However,
it has been found that this value is not adequate for concrete slabs in composite beams. In the
present study, a total strain of 0.1 was used for reinforced concrete slabs in composite beams,
as suggested by (6).
3-3 Steel Beam
Von Mises yield criterion with isotropic hardening rule (multi-linear work hardening
material) is used to represent the steel beam (flanges and web) behavior. The stress-strain
relation is linearly elastic up to yield, perfectly plastic between the elastic limit and the
beginning of strain hardening as shown in Fig. (4) an follows the constitutive law for the
strain-hardening branch (7).
𝝈 = 𝒇𝒚 + 𝑬𝒉(𝜺 − 𝜺𝒉) (𝟏 − 𝑬𝒉𝜺−𝜺𝒉
𝟒(𝒇𝒖−𝒇𝒚))(6)
3-4 Reinforcing Bars
Since the reinforcing bars are normally long and relatively slender, they can generally
be assumed to be capable of transmitting axial forces only. For the finite element models, the
uniaxial stress-strain relation for steel is idealized as a bilinear curve, representing elastic-
plastic behavior with strain hardening. This relation is assumed to be identical in tension and
in compression, as shown in Fig. (5).
Nonlinear Analysis of Simply Supported Composite Steel - Concrete Beam
Diyala Journal of Engineering Sciences, Vol. 06, No. 03, September2013
111
In the present work, the strain hardening modulus (ET) is assumed to be (0.02 Es).
This value was selected to avoid convergence problems during iteration.
3-5 Shear Connectors The main function of shear connectors are to transmit longitudinal shear force
between concrete beam and steel this is represented by the following function Where
𝐹𝑑 = 𝑎(1 − 𝑒−𝑏𝑢𝑐)(7)
𝐹𝑑 = shear force on a stud shear connector,𝑢𝑐 = the slip, b = constant, a = ultimate
shear resistance of stud shear connector.
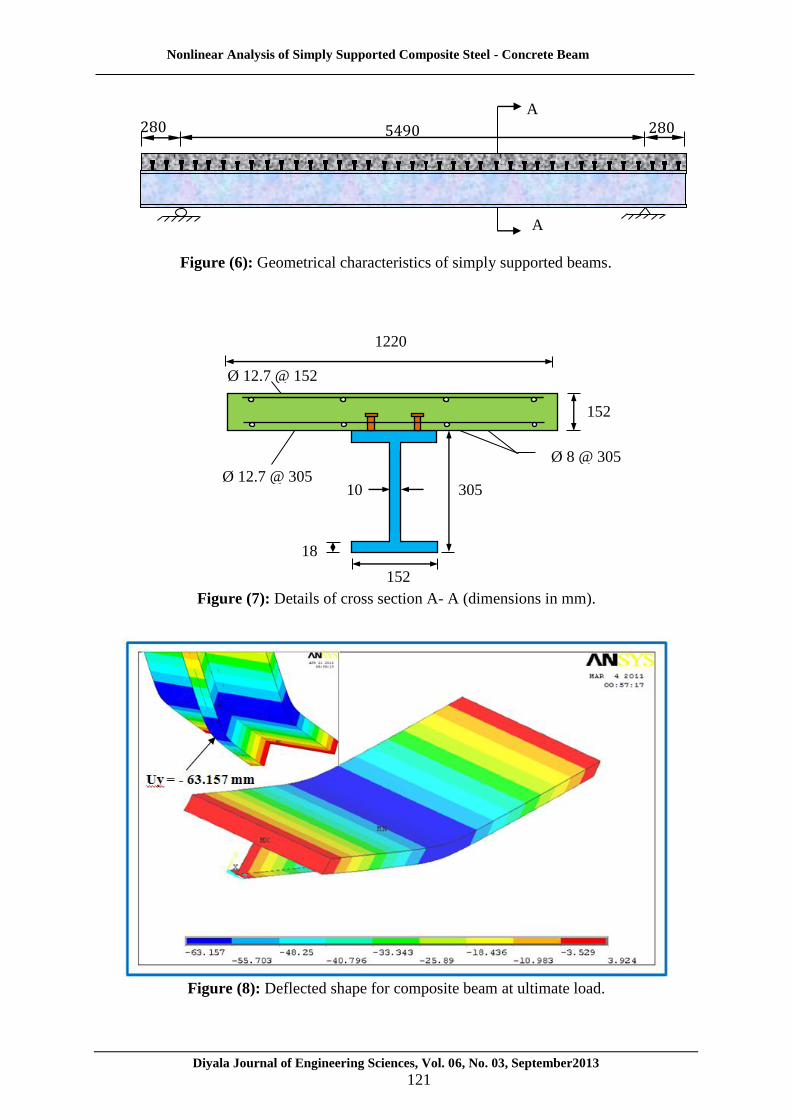
4- BEAM AND MATERIALS
The geometry and the Details of cross section for composite beam (8) are shown in (Figs. 6,
7). The length of this simple composite steel-concrete beam was (5490 mm). This beam
consisted of a concrete slab at the top, steel I-section beam at the bottom and stud top, steel I
section beam at the bottom and stud connectors to connect the concrete slab with the steel
beam. The concrete slab had a depth of connectors to connect the concrete slab with the (152
mm) and a width of (1220 mm) whereas the steel I-section beam had a depth of (305 mm), a
flange depth of (18 mm), flange width of (152 mm) and web thickness of (10 mm). The
external concentrated load was applied to the specimen at its midspan. Asummary of the
materials properties of the selected specimens are listed in Table (1).
5- RESULTS AND DISCUSSION
5-1 Load Deflection Curve
To compare the load-deflection curve of F.E.Model together with experimental test
curve for Yam-Chapman’s composite test beam, it is necessary to measure the vertical
displacement (deflection) at centerline of bottom face of the F.E.Model, and vertical
displacement due to applied load at end sub step, as shown in Fig. (8) and Fig.(9) the
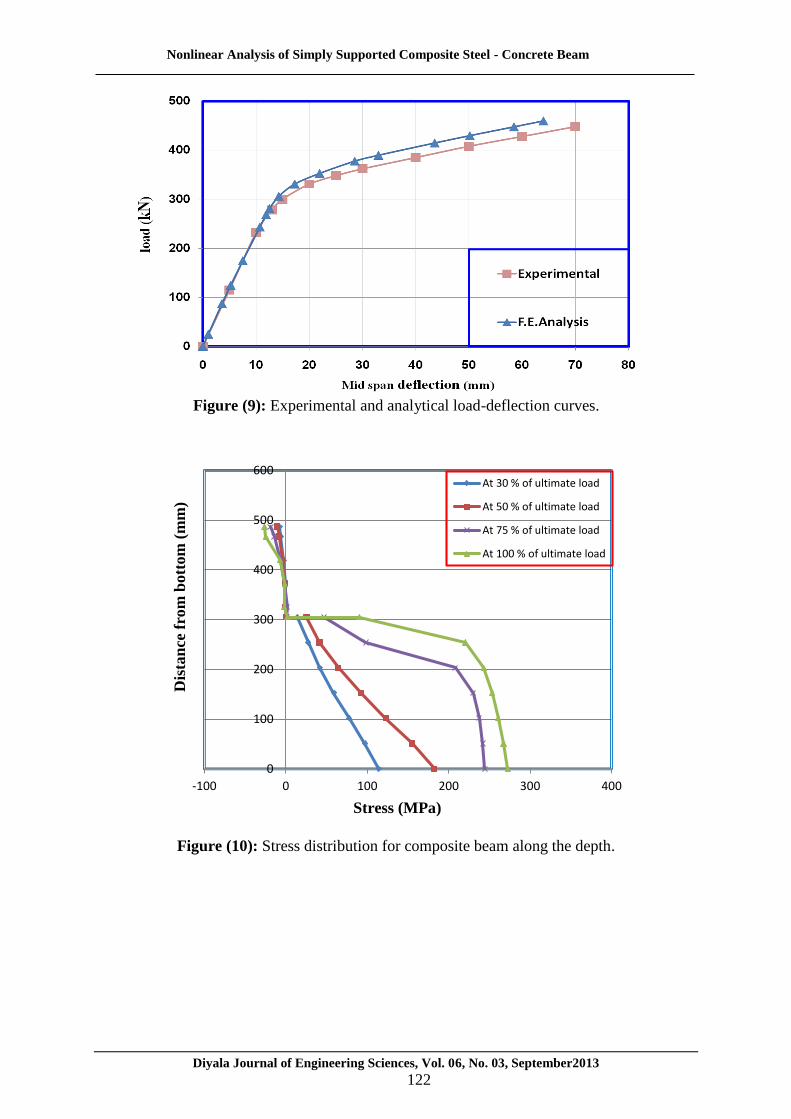
experimental and numerical curves obtained for the composite beam.The midspan externally
applied load is plotted against the mid span deflection. For this beam, the failure load
obtained by experimental work and that predicted by the finite element solutions are listed in
Table (2). It can be noted from Fig.(9) and Table(2) that the finite element solutions are in
good agreement with the experimental results throughout the entire range of behavior and it
shows that, the percent discrepancy of F.E.Model corresponding to test beam is only (2.67%).
Nonlinear Analysis of Simply Supported Composite Steel - Concrete Beam
Diyala Journal of Engineering Sciences, Vol. 06, No. 03, September2013
112
5-2 Stress Distribution Along Cross -Section
The normal stress distribution along the depth of the section is shown in Fig.(10). The
selected section is close to the mid-span of the beam and loaded with maximum shear and
maximum moment. For composite beam, the pattern of normal stress distribution at (30%)
and (50%) of the ultimate load is almost linear along the concrete slab and the steel I-beam as
shown Fig. (10).At (75%) of the ultimate load the tensile stress at the bottom face of the
concrete slab is reduced, because of cracking. Also, the normal stress at steel I-beam bottom
face approaches yielding. With higher load levels and up to ultimate load, the compressive
stress at top of concrete slab is continuously increased while the tensile stress at bottom of
concrete slab is reduced to zero. While, a plastic stress distribution is noticed at the bottom
parts of the steel I-beam at stages close to ultimate load.
5-3 End Slip Beam
Numerically, the relative movement (shear slip) between concrete and I-Steel beam
was measured from the difference between the nodal displacements, in x-direction (Ux), at
concrete and I-steel beam, as shown in Fig. (11).
5-4 PARAMETRIC STUDY
5-4-1: Effect of Compressive Strength for Concrete
To study the effect of concrete compressive strength fc′ of the slab on the behavior of
composite steel-concrete beam, composite beam has been analyzed for different values of
concrete compressive strength. These value were (20, 27.1, 30, 40, 50, 60, and 70)MPa. Fig.
(12) shows the effect of compressive strength concrete slab on the load-deflection behavior of
the selected beam. The figure indicates that the stiffness of beam increases with the increase
of fc′up to 50 MPa. The responses obtained for values of fc
′ equal to 50, 60 and 70 MPa are
almost similar. Therefore, the increase in concrete compressive strength beyond 50 Mpa is
insignificant this is due to the fact that the failure is crushing type of failure for fc′ is less than
50 MPa and yielding of steel beam forfc′greater than 50 MPa.In addition, The Fig.(12) and
table (3) shows that the ultimate load capacity increases asfc′ is increased. For values of fc
′
ranging between 20 and 40 MPa the numerical analyses show that the type of failure
wascrushing of concrete slab prio to yielding of the steel beam. Therefore, the increase in the
value of the compressive strength results in a substantial increase in the ultimate moment.
Nonlinear Analysis of Simply Supported Composite Steel - Concrete Beam
Diyala Journal of Engineering Sciences, Vol. 06, No. 03, September2013
113
While forvalues of fc′ ranging between 50 and 70 MPa, the numerical analyses reveal that the
steel beam yields at failure before crushing of concrete slab takesplace.
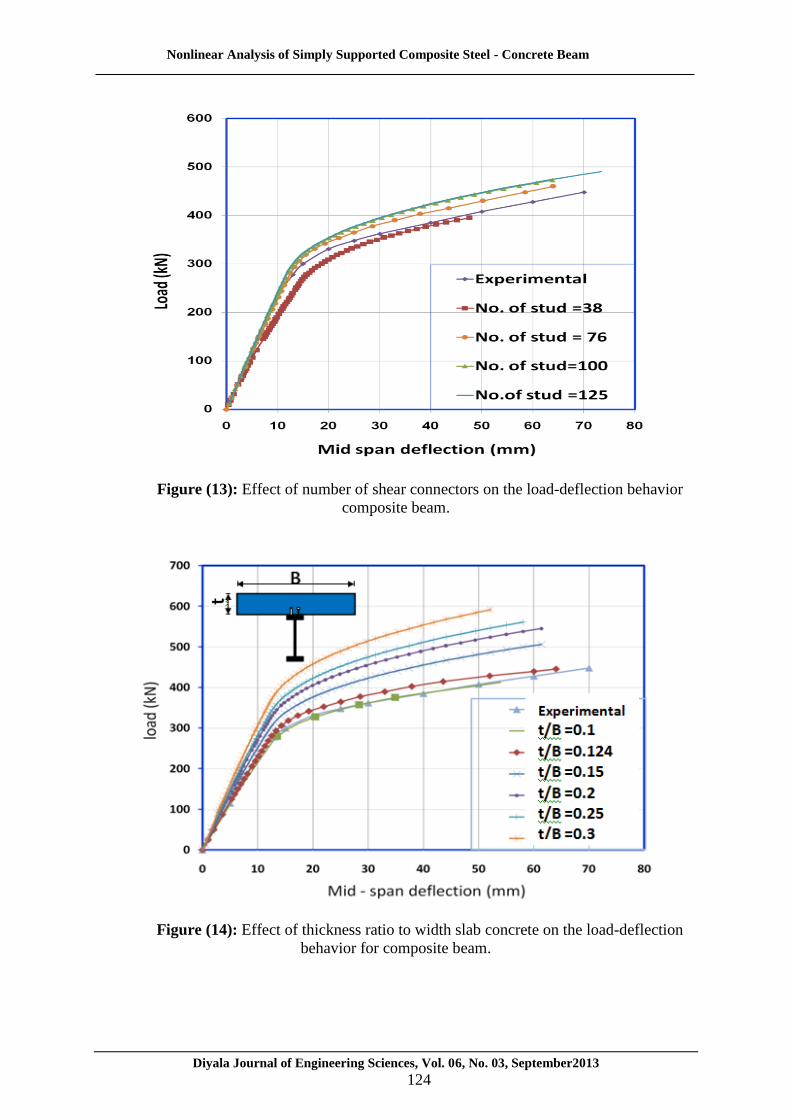
5-4-2 Effect of Shear Connector Number
In order to investigate the effect shear connectors on the load –deflection behavior, six
different numbers of shear connectors were taken for the finite element analysis of composite
steel-concrete beam. The selected number of shear connectors were 38, 76, 100, and
125studs. Fig. (13) and table (4) show the effect of the number of shear connectors on the
load-deflection behavior of the selected composite steel-concrete beam. The figure indicates
that the stiffness of the beam increases with increasing number of shear connectors up to 100
studs. The response obtained using a number of shear connectors more than 100 studs was
almost similar to that with 125 studs. Therefore, for this beam the use of a number more than
125 studs has an insignificant effect of the predicted behavior since the mode of failure was
achieving the ultimate shear capacity of stud when the number of studs are less than 38, 76
and 100 while the failure mode was yielding of steel beam when the number of studs exceeds
100.
5.4.3: Effect of Ratio of Depth to Width of Concrete Slab
Effect of the ratio of concrete slab depth to its width on the load-deflection behavior
of composite beams and their ultimate moment are illustrated in Fig. (14). Different ratios
depth to width for concrete slab of composite beam were taken in the finite element analysis.
The selected ratios were (0.1, 0.12, 0.15, 0.2, 0.25 and 0.3). In choosing these ratios, the total
area of concrete slab was kept constant at (185440 mm2). Fig. (14) and table (5) shows the
effect of depth to width ratio on the load-deflection behavior of selected beam. In this figure,
the stiffness of beam is increased by increasing the depth to width ratio of concrete slab. In
this study, the type of failure for all ratios was yielding of steel beam because of the presence
of large concrete area. Values of compressivestrength of concrete and yield stress of steel
beam were keptconstants at (27.1 MPa) and (239 MPa) respectively.
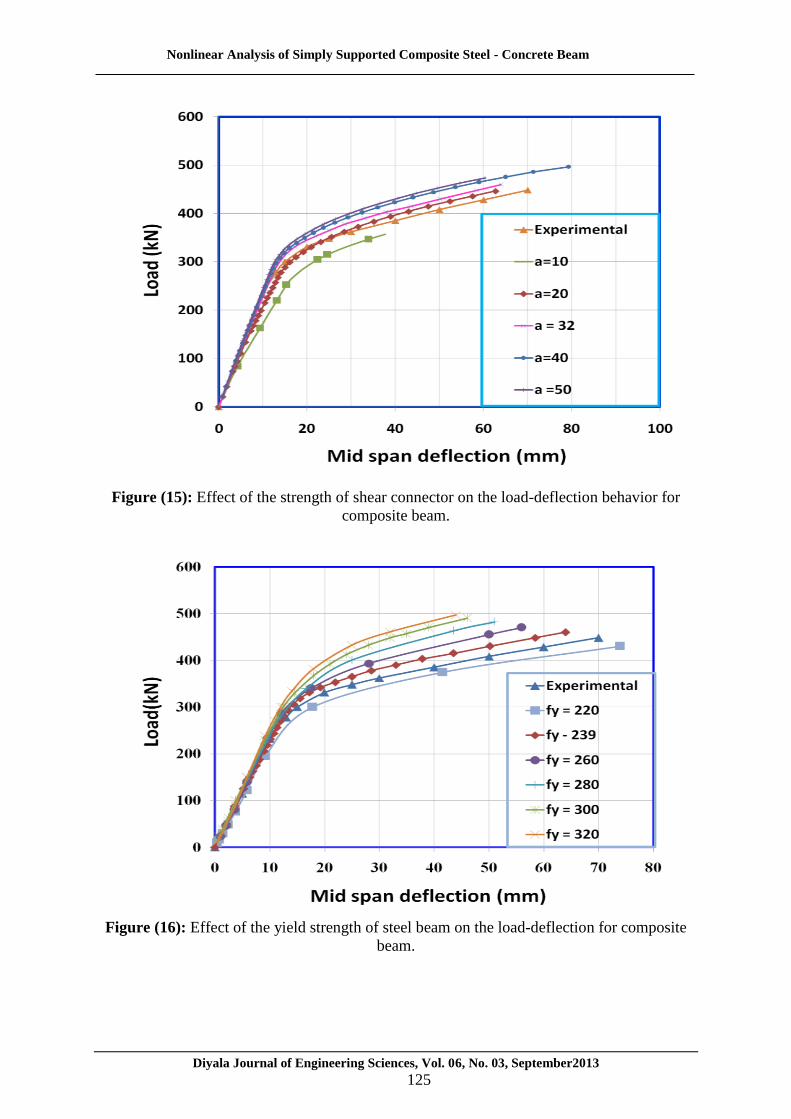
5-4-4 Effect of Ultimate Strength of Shear Connector (a):
For composite beam, all the numerical tests described up to this point have been
conducted by setting the values of the constants (a) and (b) to (32 kN) and (5mm-1)
respectively, According to push-out test results, these values have been selected using (Eq.7)
Nonlinear Analysis of Simply Supported Composite Steel - Concrete Beam
Diyala Journal of Engineering Sciences, Vol. 06, No. 03, September2013
114
to obtain the best fit shear connectors response. Numerical analyses with different values for
the constants (a) conducted, while the other constant (b) held fixed in order to isolate the
effects of constant considered. Four different values for the constant (a) were used. While, the
constant (b) was kept equal to (5 mm-1). Results of the analysis are shown in Fig. (15) and
table (6),The selected values for the constant (a) ranged between 10 kN and 50 kN. The
numerical results indicate that the higher value of constant (a) results in a higher limited
slipping stress. Therefore, higher values of the constant (a) mean that the reduction in
composite action will be delayed. Through this study, it can be noted stiffer of load-deflection
responses are obtained with higher values of the constant (a). Also, the ultimate load
increases by about 39% as the constant (a) is increased from 10 kN to 40 kN, as shown in
Table (6).
5-4-5 Effect of Yield Strength of Steel Beam:
To study the effect of yield strength for steel beam, different yield strengths are
considered. These values are (220MPa, 239MPa, 260MPa, 280 MPa, 300 MPa and 320
MPa). Fig. (16) showthe response of the deflection for various yield strength for steel beam.
From this Figure and table (7), it can be observed that an increase in yield strength of steel
beam from 239 MPa to 320 MPa causes an increase in ultimate load capacity (8%) and a
decrease in ductility index in (40%) while decreasing yield strength of steel beam from 239
MPa to 220 Mpa cause a decrease in ultimate load capacity (6.5%) and increase in ductility
index (22.7%).
CONCLUSIONS:-
The main concluding remarks that have been achieved from theresults of the finite element
analysis may be summarized as:
1- The finite element model used in the present work is able to simulate the behavior of
composite steel-concrete beams in flexure. The analytical studied indicated that the
load-deflection behavior and the ultimate loads are in good agreement with the
published experimental results. The ratio of the predicted experimental ultimate load
to the numerical ultimate load has an average value of (0.97) for composite steel-
concrete beams in flexure. These results reveal the accuracy and efficiency of the
Nonlinear Analysis of Simply Supported Composite Steel - Concrete Beam
Diyala Journal of Engineering Sciences, Vol. 06, No. 03, September2013
115
developed computer program (ANSYS version 12.0) in predicting the behavior and
ultimate load of composite steel-concrete beams.
2- According to the results obtained from the numerical analyses of composite steel-
concrete beams, it was found that the Increasing concrete compressive strength for the
concrete slab beyond 50 MPa has insignificant effect on the ultimate capacity of
selected beam, while, a decrease of concrete compressive strength from 50 MPa to 20
MPa decreases the ultimate load a bout (18 %).
3- This study shows that by increase number of shear connector from (38 to 125) studs
the ultimate load capacity increased about (24.6%).
4- The stiffness of composite beams was increased by increasing the ratio of the depth to
width of concrete slab (t/B), with keeping the total area of concrete slab constant and
it was found that as the (t/B) ratio is increased from 0.1 to 0.3 the ultimate load
increases by about 43%.
5- It was found that the load-deflection response of composite beams is stiffer for higher
value of constant (a), which represents the ultimate shear capacity of studs. It was also
noticed that when the constant (a) is increased from 10 kN to 50 kN, the ultimate load
increases by about (32%).
6- An increase in yield strength of steel beam from 239 MPa to 320 MPa causes an
increase in ultimate load capacity (8%) and a decrease in ductility index in (40%)
while decreasing yield strength of steel beam from 239 MPa to 220 Mpa cause a
decrease in ultimate load capacity (6.5%) and increase in ductility index (22.7%).
REFERENCES:
1- Heong. T. T., 2003, "Design Appraisal of Steel-Concrete Composite Joints" A Thesis
National University of Singapore.
2- Ranzi G., and Zona A., 2007, "A steel–concrete composite beam model with partial
interaction including the shear deformability of the steel component" Engineering
Structures, Vol.29, pp. 3026–3041.
3- Jeong,Y., KimaH., and Kimb S., 2005,"Partial-interaction analysis with push-out
tests" Journal of Constructional Steel Research Vol. 61, 1318–1331.
Nonlinear Analysis of Simply Supported Composite Steel - Concrete Beam
Diyala Journal of Engineering Sciences, Vol. 06, No. 03, September2013
116
4- Nethercot D. A., 2002, "The Importance of Combining Experimental and Numerical
Study in Advancing Structural Engineering Under-standing", Journal of
Constructional Steel Research, No. 58, pp. 1283-96.
5- Desayi, P., and Krishnan, S., 1964,"Equation for the Stress-Strain Curve of Concrete",
Journal of the American Concrete Institute, Vol. (61), pp. 345- 350.
6- Liang Q.Q., Uy B., Bradford M.A., and Ronagh H.R., 2004, "Strength analysis of
steel–concrete composite beams in combined bending and shear" Journal of structural
Engineering- ASCE, Vol. 60, pp. 1109 - 1128.
7- Kemp A.R., Dekker N.W., and TrincheroP., 1995 "Differences in Inelastic Properties
of Steel and Composite Beams", Journal of Constructional Steel Research, No. 34, pp.
187-206.
8- Yam, L. C. P. and Chapman,J. C., 1968, "The inelastic behaviour of simply supported
composite beams of steel and concrete", Proc. Instn. Civ. Engrs, Vol. 41, pp. 651-683.
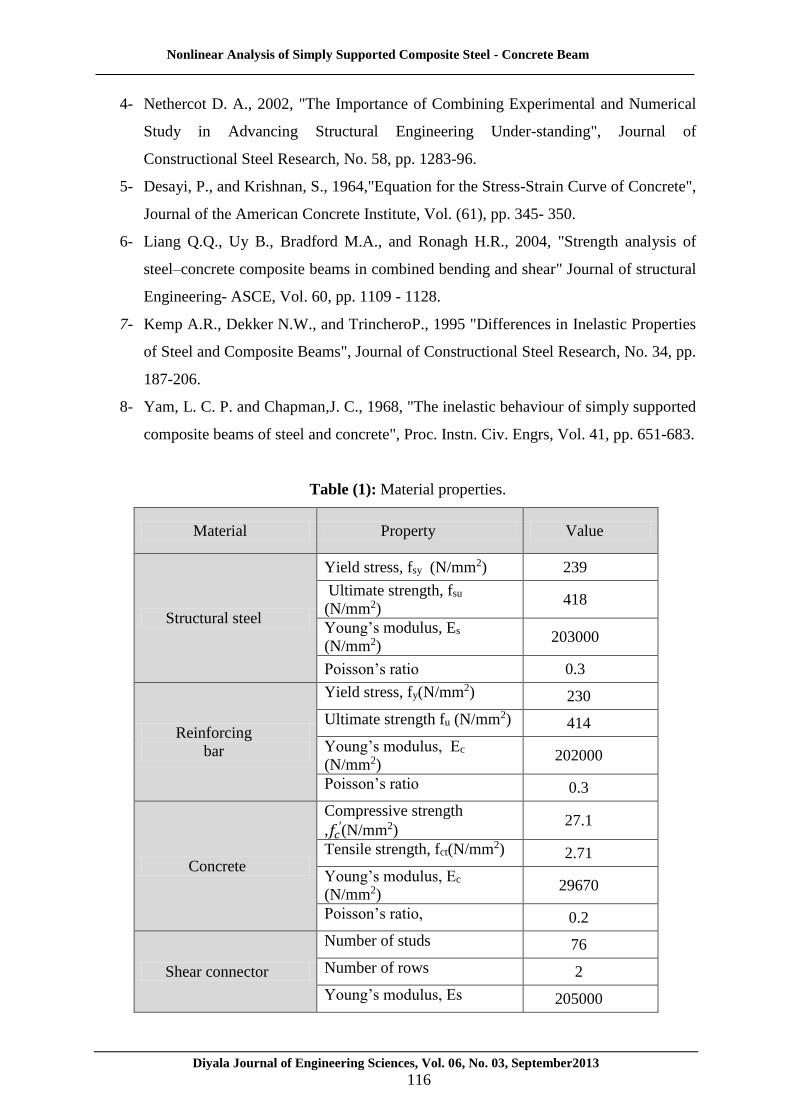
Table (1): Material properties.
Material Property Value
Structural steel
)2(N/mm syYield stress, f 239
suUltimate strength, f
)2(N/mm 418
smodulus, EYoung’s
)2(N/mm 203000
Poisson’s ratio 0.3
Reinforcing
bar
) 2(N/mmyYield stress, f 230
)2(N/mm uUltimate strength f 414
cYoung’s modulus, E
)2(N/mm 202000
Poisson’s ratio 0.3
Concrete
Compressive strength
)2(N/mm𝑓𝑐′,
27.1
)2(N/mmctTensile strength, f 2.71
cYoung’s modulus, E
)2(N/mm 29670
Poisson’s ratio, 0.2
Shear connector
Number of studs 76
Number of rows 2
Young’s modulus, Es 205000
Nonlinear Analysis of Simply Supported Composite Steel - Concrete Beam
Diyala Journal of Engineering Sciences, Vol. 06, No. 03, September2013
117
)2(N/mm
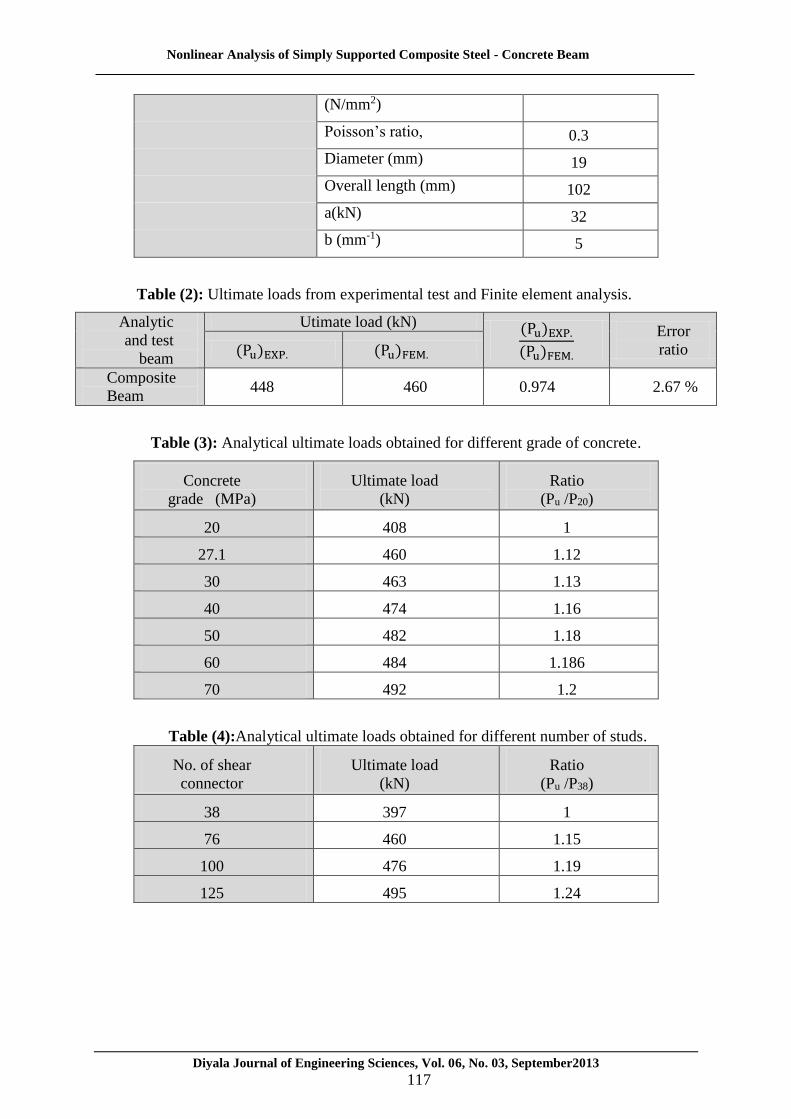
Poisson’s ratio, 0.3
Diameter (mm) 19
Overall length (mm) 102
a(kN) 32
)1-b (mm 5
Table (2): Ultimate loads from experimental test and Finite element analysis.
Table (3): Analytical ultimate loads obtained for different grade of concrete.
Concrete
grade (MPa)
Ultimate load
(kN)
Ratio
(Pu /P20)
20 408 1
27.1 460 1.12
30 463 1.13
40 474 1.16
50 482 1.18
60 484 1.186
70 492 1.2
Table (4):Analytical ultimate loads obtained for different number of studs.
No. of shear
connector
Ultimate load
(kN)
Ratio
(Pu /P38)
38 397 1
76 460 1.15
100 476 1.19
125 495 1.24
Analytic
and test
beam
Utimate load (kN) (Pu)EXP.
(Pu)FEM.
Error
ratio (Pu)EXP. (Pu)FEM.
Composite
Beam 448 460 0.974 2.67 %
Nonlinear Analysis of Simply Supported Composite Steel - Concrete Beam
Diyala Journal of Engineering Sciences, Vol. 06, No. 03, September2013
118
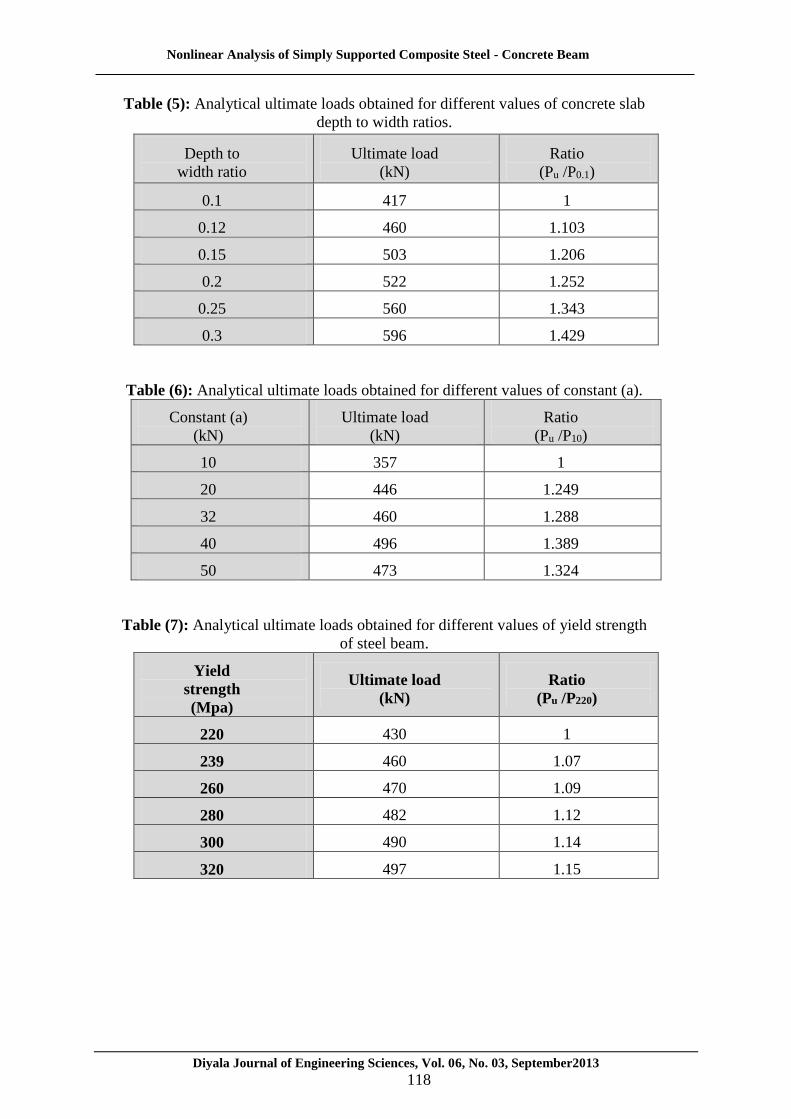
Table (5): Analytical ultimate loads obtained for different values of concrete slab
depth to width ratios.
Depth to
width ratio
Ultimate load
(kN)
Ratio
(Pu /P0.1)
0.1 417 1
0.12 460 1.103
0.15 503 1.206
0.2 522 1.252
0.25 560 1.343
0.3 596 1.429
Table (6): Analytical ultimate loads obtained for different values of constant (a).
Constant (a)
(kN)
Ultimate load
(kN)
Ratio
(Pu /P10)
10 357 1
20 446 1.249
32 460 1.288
40 496 1.389
50 473 1.324
Table (7): Analytical ultimate loads obtained for different values of yield strength
of steel beam.
Yield
strength
(Mpa)
Ultimate load
(kN)
Ratio
(Pu /P220)
220 430 1
239 460 1.07
260 470 1.09
280 482 1.12
300 490 1.14
320 497 1.15
Nonlinear Analysis of Simply Supported Composite Steel - Concrete Beam
Diyala Journal of Engineering Sciences, Vol. 06, No. 03, September2013
119
Figure (1): Typical finite element mesh for composite beam.
Figure (2): Shear connectors and reinforcement modeling in ANSYS.
Nonlinear Analysis of Simply Supported Composite Steel - Concrete Beam
Diyala Journal of Engineering Sciences, Vol. 06, No. 03, September2013
120
Figure (3): Stress – strain curve for concrete in compression.
Figure (4): Idealized stress-strain for steel.
Figure (5): Modeling of reinforcing bars.
1ε 𝜀𝑐𝑢 ₀ε
0.3𝑓𝑐′
𝑓𝑐′
Strain
Stress
Nonlinear Analysis of Simply Supported Composite Steel - Concrete Beam
Diyala Journal of Engineering Sciences, Vol. 06, No. 03, September2013
121
Figure (6): Geometrical characteristics of simply supported beams.
Figure (7): Details of cross section A- A (dimensions in mm).
Figure (8): Deflected shape for composite beam at ultimate load.
280 280
A
5490
A
152
152
Ø 8 @ 305
1220
Ø 12.7 @ 305
Ø 12.7 @ 152
10 305
18
Nonlinear Analysis of Simply Supported Composite Steel - Concrete Beam
Diyala Journal of Engineering Sciences, Vol. 06, No. 03, September2013
122
0
100
200
300
400
500
600
-100 0 100 200 300 400
At 30 % of ultimate load
At 50 % of ultimate load
At 75 % of ultimate load
At 100 % of ultimate load
Figure (9): Experimental and analytical load-deflection curves.
Figure (10): Stress distribution for composite beam along the depth.
Dis
tan
ce f
rom
bott
om
(m
m)
Stress (MPa)

Nonlinear Analysis of Simply Supported Composite Steel - Concrete Beam
Diyala Journal of Engineering Sciences, Vol. 06, No. 03, September2013
123
Figure (11): Numerical relative slip between concrete and steel for composite beam.
Figure (12): Effect of compressive strength of concrete on the load-deflection
behavior for composite beam.
Nonlinear Analysis of Simply Supported Composite Steel - Concrete Beam
Diyala Journal of Engineering Sciences, Vol. 06, No. 03, September2013
124
Figure (13): Effect of number of shear connectors on the load-deflection behavior
composite beam.
Figure (14): Effect of thickness ratio to width slab concrete on the load-deflection
behavior for composite beam.
Nonlinear Analysis of Simply Supported Composite Steel - Concrete Beam
Diyala Journal of Engineering Sciences, Vol. 06, No. 03, September2013
125
Figure (15): Effect of the strength of shear connector on the load-deflection behavior for
composite beam.
Figure (16): Effect of the yield strength of steel beam on the load-deflection for composite
beam.
Nonlinear Analysis of Simply Supported Composite Steel - Concrete Beam
Diyala Journal of Engineering Sciences, Vol. 06, No. 03, September2013
126
الخرسانة –التحليل الالخطي لعتبة مركبة بسيطة اإلسناد من الفوالذ
:الخالصة
والمطور لتحليل عتبة 12اإلصدار ANSYSالمحددةهذا البحث يقدم برنامج التحلياللالخطيباستخدامالعناصر نت االود قور -. النتائج النظرية لتصرف الحملاألبعاد. تناول هذا العمل نموذج لعنصر محدد ثالثي خرسانة-مركبة فوالذ
والنتائج . بصورة عامة تم الحصول على توافق جيد بين نتائج طريقة العناصر المحددةالمختبرية المتوفرةمع الفحوص هذه المتغيرات تضمنت .غيرات المادية والهندسية المهمةبعض المت تأثيردراسة المتغيرات قد نفذت لبحث إن. المختبرية
األقصى, الحمل ة سمك الى عرض البالطة الخرسانية, نسبريتية , ومقاومة االنضغاط للكونكتأثير عدد الروابط القص 20مقاومة الخضوع للعتب الحديدي. لقد وجد بان كلما زادت مقاومة االنضغاط للكونكريت من وتأثيرللروابط القصية
MPa70إلى MPa وكذلك بزيادة نسبة سمك الى عرض البالطة الخرسانية % 20يزداد حوالي األقصىفان الحمل(B/t من )43بحوالي األقصىزيادة الحمل إلىيودي 0.3إلى0.1%.
عامر محمد إبراهيم
أستاذ
جامعة ديالى -كلية الهندسة
قصي وهاب احمد
مدرس مساعد
جامعة ديالى -كلية الهندسة