Embed Size (px)
Citation preview
Defence R&D Canada – Atlantic
DEFENCE DÉFENSE&
Compilation of Marine Mammal Passive
Transients for Aural Classification
Joe HoodDerek BurnettAkoostix Inc.
Akoostix Inc.10 Akerley Blvd, Suite 12Dartmouth, NS B3B 1J4
Project Manager: Dr. Paul C. Hines, 902-426-3100 ext 321
Contract Number: W7707-078039/001/HAL
The scientific or technical validity of this Contract Report is entirely the responsibility of the Contractor and thecontents do not necessarily have the approval or endorsement of Defence R&D Canada.
Contract Report
DRDC Atlantic CR 2008-287
April 2009
Copy No. _____
Defence Research andDevelopment Canada
Recherche et développementpour la défense Canada

This page intentionally left blank.
Compilation of Marine Mammal Passive Transients for Aural Classification
Joe Hood Derek Burnett Akoostix Inc. Akoostix Inc. 10 Akerley Blvd, Suite 12 Dartmouth, NS B3B 1J4 Submitted to: Defence Research & Development Canada – Atlantic P.O. Box 1012 9 Grove Street Dartmouth, Nova Scotia B2Y 3Z7
Project Manager: Dr. Paul C. Hines, (902) 426-3100
Contract number: W7707-078039/001/HAL
The scientific or technical validity of this Contract Report is entirely the responsibility of the Contractor and the contents do not necessarily have the approval or endorsement of Defence R&D Canada.
Defence R&D Canada – Atlantic Contractor Report DRDC Atlantic CR 2008-287 April 2009
Principal Author
Joe Hood
President & Chief Technical Officer, Akoostix Inc.
Approved by
Dr. Paul Hines
Project Authority
Approved for release by
Dr. Calvin Hyatt
Chair/Document Review
© Her Majesty the Queen in Right of Canada, as represented by the Minister of National Defence, 2009
© Sa Majesté la Reine (en droit du Canada), telle que représentée par le ministre de la Défense nationale, 2009
Original signed by Joe Hood
Original signed by Dr. Paul Hines
Original signed by Ron Kuwahara for
Abstract ……..
This report documents the work performed to generate a database of marine mammal vocalizations for use with DRDC Atlantic’s prototype automatic aural classifier. The project involved the selection of appropriate marine mammal and ambient noise data sets, formatting the data, detection processing, extraction of the potential samples, establishment of ground-truth data, post-processing of the data, and classification of each selected sample. Several DRDC Atlantic tools were utilized to perform the variety of tasks, including the Sentinel Acoustic Subsystem (AS) detector, the Acoustic Cetacean Detection Capability (ACDC) application, the Software Tools for Analysis and Research (STAR) suite, and the Omni-Passive Display (OPD) signal processing application. The resulting database contains individually classified samples (hundreds each) of Bowhead, Sperm, Right, and Humpback whales. Each sample exists as an isolated and uniquely identified WAV file. Minimal software development was conducted as part of this contract, although several benefits were realized as the result of synergetic development from separate contracts. The database produced by this contract will directly support the ongoing automated aural classification development.
Résumé ….....
Le présent rapport documente le travail accompli aux fins de création d’une base de données de vocalisations de mammifères marins devant être utilisée avec le prototype classificateur de signaux sonores de RDDC. Ce projet nécessitait la sélection de mammifères marins appropriés et d’un ensemble de données de bruits ambiants, la mise en forme des données, la détection, l’extraction d’échantillons potentiels, la prise de données sur le terrain, le post-traitement des données, ainsi que la classification de tous les échantillons retenus. Plusieurs outils de RDDC Atlantique ont été utilisés pour exécuter les diverses tâches, y compris le système de détection Sentinel, l’application « Acoustic Cetacean Detection Capability » (ACDC), la suite logicielle d’analyse et de recherche (STAR), l’application de traitement de signal à affichage Omni passif (OPD). La base de données ainsi créée renferme des échantillons classés individuellement (100 par espèce de baleine) pour la baleine boréale, le cachalot, la baleine noire et le rorqual à bosse. Chaque échantillon existe sous la forme d’un fichier « .wav » distinct et unique. Un travail de développement logiciel minime a été réalisé dans le cadre de ce contrat, mais le travail de développement accompli aux termes de plusieurs contrats distincts a globalement été fructueux. La base de données créée dans le cadre de ce contrat viendra directement appuyer le travail de développement mené en classification automatisée de signaux sonores.
DRDC Atlantic CR 2008-287 i

This page intentionally left blank.
ii DRDC Atlantic CR 2008-287
Executive summary
Compilation of Marine Mammal Passive Transients for Aural Classification
Joe Hood; Derek Burnett; DRDC Atlantic CR 2008-287; Defence R&D Canada – Atlantic; April 2009.
Introduction or background: This contractor report highlights data analysis in support of the Applied Research Project entitled Automatic Clutter Discrimination Using Aural Cues. The purpose of the analysis was to detect and ground truth vocalizations from several whale (order cetacea) families, and store these detections as .wav files for analysis using DRDC’s prototype automatic aural classifier. Vocalizations from four whale types (sperm, bowhead, humpback, and right whale) and anthropogenic false alarms (eg. mechanical noise and RF “dropouts”) were extracted from both DRDC trial data and public domain data. The bowhead and humpback whales were selected because although they are aurally distinct, automatic classifiers frequently confuse the two. Sperm whale calls are impulsive and represent an easier (baseline) case for the aural classifier. In addition the sperm whale calls provide a measure of performance against anthropogenic false alarms which are impulsive in nature. The right whale was included in the set because it is an endangered species that is resident in local operational waters for which automatic classification would be especially useful to the operational community. The report describes the algorithms used to extract the vocalizations and estimate signal to noise, the annotations that were attached to the data, and the visualization software used in the analysis.
Results: Approximately 4000 vocalizations and false alarms were extracted and saved as short duration (1-5 s) .wav files. Ground truth was done by subject experts. The original data was carefully annotated and time stamped to allow extended analysis as well as additional ground-truth tests to be performed if required.
Significance: Present and future military sonar operation must adhere to strict environmental guidelines which include limiting the impact of active sonar on marine mammals. Monitoring marine mammals is labour intensive and requires near-fulltime effort from the operator. Since future military platforms will have to support smaller complements, and near-future operations will have to accommodate additional mission-specific forces, automation of on-board systems is essential. Preliminary testing of DRDC’s automatic aural classifier on the vocalizations described in this report is favourable. This classification technique is also well suited to autonomous systems since a much smaller bandwidth is needed to transmit a classification result than to transmit raw acoustic data.
Future plans: DRDC’s prototype automatic aural classifier was originally designed as an active sonar classification tool. This data set of vocalizations will be used to quantify the classifier’s performance for passive sonar. In addition to the direct application to marine mammal mitigation, the lessons learned on feature extraction from passive vocalizations can be used to enhance the aural classifier to handle passive transients collected from torpedoes and submarines. This would accelerate its insertion into a detection-classification system within DRDC’s sonar test bed (Pleiades).
DRDC Atlantic CR 2008-287 iii
Sommaire .....
Compilation of Marine Mammal Passive Transients for Aural Classification
Joe Hood; Derek Burnett; DRDC Atlantic CR 2008-287; R & D pour la défense Canada – Atlantique; April 2009.
Introduction ou contexte : L’entrepreneur présente les résultats d’analyse de données importantes à l’appui du projet de recherche appliquée intitulé Automatic Clutter Discrimination Using Aural Cues, un projet d’étude portant sur la discrimination automatique d’un fouillis d’échos parasites au moyen de signaux sonores. L’étude menée avait pour but la détection et la collecte sur le terrain de données de vocalisation produites par plusieurs baleines appartenant à l’ordre des cétacés, ainsi que l’enregistrement de ces données dans des fichiers portant le suffixe « .wav » en vue de leur analyse au moyen du prototype de classification automatique de signaux sonores de RDDC. Des données de vocalisation provenant de quatre types de baleines – cachalot, baleine boréale, rorqual à bosse et baleine noire – et des faux positifs de source anthropique (p. ex. bruits mécaniques et pertes de signal RF) ont été obtenus d’essais menés par RDDC et du domaine public. La baleine boréale et le rorqual à bosse ont été choisis parce que même si les deux cétacés produisent des signaux sonores distincts, les classificateurs automatiques les confondent souvent. Les appels du cachalot, qui prennent la forme d’impulsions faciles à distinguer, constituent une référence pour le classificateur; ils permettent de mesurer le rendement par rapport aux faux positifs, qui ont également la forme d’impulsions. La baleine noire a été incluse dans l’étude parce qu’elle est une espèce menacée résidente des eaux locales où se déroulent des opérations pour laquelle une classification automatique serait tout particulièrement utile pour la communauté opérationnelle. Le rapport décrit les algorithmes ayant servi à l’extraction des données de vocalisation, fournit une estimation du rapport signal-bruit, présente les annotations qui accompagnent les données et renseigne sur le logiciel de visualisation employé dans l’étude.
Résultats : Environ 4000 données de vocalisations et faux positifs ont été recueillis, puis enregistrés dans des fichiers de données de courte durée ( de 1 à 5 s) portant le suffixe « .wav ». La collecte de données sur le terrain a été réalisée par des experts en la matière. Les données originales ont été soigneusement annotées, et le temps de leur collecte, consigné rigoureusement afin que soient menés une analyse approfondie de même que d’autres essais sur le terrain, au besoin.
Importance : Les opérations militaires actuelles et futures utilisant un sonar doivent respecter des directives environnementales strictes, qui entre autres limitent l’impact des sonars en mode actif sur les mammifères marins. La surveillance des mammifères marins est une activité qui nécessite beaucoup de ressources humaines qui doivent fournir un effort presque à temps plein. Comme les futures plateformes militaires devront accueillir des équipages réduits, et que les opérations devront, dans un proche avenir, répondre aux besoins de forces supplémentaires pour des missions particulières, l’automatisation des systèmes de bord est essentielle. Un essai préliminaire du prototype de classificateur automatique des signaux sonores de RDDC mené en utilisant les vocalisations décrites dans le présent rapport a été concluant. La technique peut également être
iv DRDC Atlantic CR 2008-287
appliquée aux systèmes autonomes, puisque la transmission de résultats de classification nécessite une largeur de bande bien moindre que la transmission de données acoustiques brutes.
Perspectives : Le prototype de RDDC a été conçu à l’origine comme un outil de classification pour sonar en mode actif. L’ensemble des données de vocalisation recueillies servira à quantifier le rendement du classificateur pour les sonars en mode passif. Outre l’application directe à la réduction de l'impact des opérations sonar sur les mammifères marins, l’expérience acquise de l’extraction de caractéristiques de données de vocalisations obtenues en mode passif peut servir à améliorer le classificateur pour le traitement des signaux transitoires en mode passif provenant de torpilles et de sous-marins. Ceci permettra d’accélérer l’intégration du classificateur à un système de détection et de classification du banc d’essai de RDDC (PLEIADE).
DRDC Atlantic CR 2008-287 v

This page intentionally left blank.
vi DRDC Atlantic CR 2008-287
Table of contents
Abstract …….. ................................................................................................................................. i Résumé …..... ................................................................................................................................... i Executive summary ........................................................................................................................ iii Sommaire ....................................................................................................................................... iv Table of contents ........................................................................................................................... vii List of figures ................................................................................................................................. ix List of tables .................................................................................................................................. xii Acknowledgements ...................................................................................................................... xiii 1 Introduction............................................................................................................................... 1
1.1 Background ..................................................................................................................... 1 1.1.1 Data Set Overview ............................................................................................ 1 1.1.2 Sentinel Acoustic Sub-system (AS) .................................................................. 3 1.1.3 Acoustic Cetacean Detection Capability (ACDC) ............................................ 3 1.1.4 Software Tools for Analysis & Research (STAR) ............................................ 3 1.1.5 Omni-Passive Display (OPD) ........................................................................... 4
2 Data Preparation........................................................................................................................ 5 2.1 Data Re-sampling ............................................................................................................ 6 2.2 Data Flow ........................................................................................................................ 9
3 Detection and Post-Processing................................................................................................ 19 3.1 Detection ....................................................................................................................... 19 3.2 SNR Computation ......................................................................................................... 23
4 Classification........................................................................................................................... 25 4.1 Classification Options ................................................................................................... 25
4.1.1 Bowhead.......................................................................................................... 26 4.1.2 Humpback 1 .................................................................................................... 28 4.1.3 Humpback 2 .................................................................................................... 30 4.1.4 Humpback 3 .................................................................................................... 32 4.1.5 Humpback 4 .................................................................................................... 34 4.1.6 Sperm Whale................................................................................................... 36 4.1.7 Right Whale 1 ................................................................................................. 38 4.1.8 Right Whale 2 ................................................................................................. 41 4.1.9 Right Whale 4 ................................................................................................. 43
4.2 Classification Methodology........................................................................................... 45 4.2.1 Bowhead.......................................................................................................... 45 4.2.2 Humpback General.......................................................................................... 45 4.2.3 Humpback 1 .................................................................................................... 46
DRDC Atlantic CR 2008-287 vii
4.2.4 Humpback 2 .................................................................................................... 46 4.2.5 Humpback 3 .................................................................................................... 46 4.2.6 Humpback 4 .................................................................................................... 46 4.2.7 Sperm Whale................................................................................................... 46 4.2.8 Right Whale 1 ................................................................................................. 47 4.2.9 Right Whale 2 ................................................................................................. 47 4.2.10 Right Whale 3 ............................................................................................... 47 4.2.11 Right Whale 4 ............................................................................................... 47 4.2.12 Marine Mammal Other.................................................................................. 47
5 Classification Database Description ....................................................................................... 48 5.1 Input Data Descriptions................................................................................................. 48
5.1.1 Bowhead – Mobysound................................................................................... 48 5.1.2 Humpback – Mobysound ................................................................................ 49 5.1.3 Sperm Whale – Q302 ...................................................................................... 50 5.1.4 Ambient Noise – Q312.................................................................................... 50 5.1.5 Ambient Noise – Mobysound ......................................................................... 51
5.2 Database Description..................................................................................................... 51 6 Software Development............................................................................................................ 57
6.1 Project Synergies ........................................................................................................... 57 6.2 Software Compilation for MAC OS.............................................................................. 58
7 Engineering ............................................................................................................................. 59 7.1.1 Configuration Management (CM)................................................................... 59 7.1.2 Quality Assurance (QA).................................................................................. 59 7.1.3 Issue Tracking ................................................................................................. 60
7.2 Recommendations for Future Work .............................................................................. 60 7.2.1 Better Call Isolation ........................................................................................ 60 7.2.2 SNR Estimation and PDF Normalization........................................................ 61
References ..... ............................................................................................................................... 62 Annex A .. Minor Documents and Discussions ............................................................................. 65
A.1 Sperm Whale Clicks ..................................................................................................... 65 A.1.1 Literature cited ............................................................................................... 67
A.2 Humpback Vocalizations.............................................................................................. 67 A.2.1 Literature Cited .............................................................................................. 69
List of symbols/abbreviations/acronyms/initialisms ..................................................................... 71 Distribution list.............................................................................................................................. 73
viii DRDC Atlantic CR 2008-287
List of figures
Figure 1: Averaged spectrum for SoX output. Produced using a 2K, 50% overlap, Hann window FFT over 75 averages. Note the time and frequency resolution at the top of the figure. .................................................................................................................. 7
Figure 2: Averaged spectrum for sp_filter output. Produced using a 16K, 50% overlap, Hann window FFT over 94 averages. Note the time and frequency resolution at the top of the figure. .................................................................................................................. 8
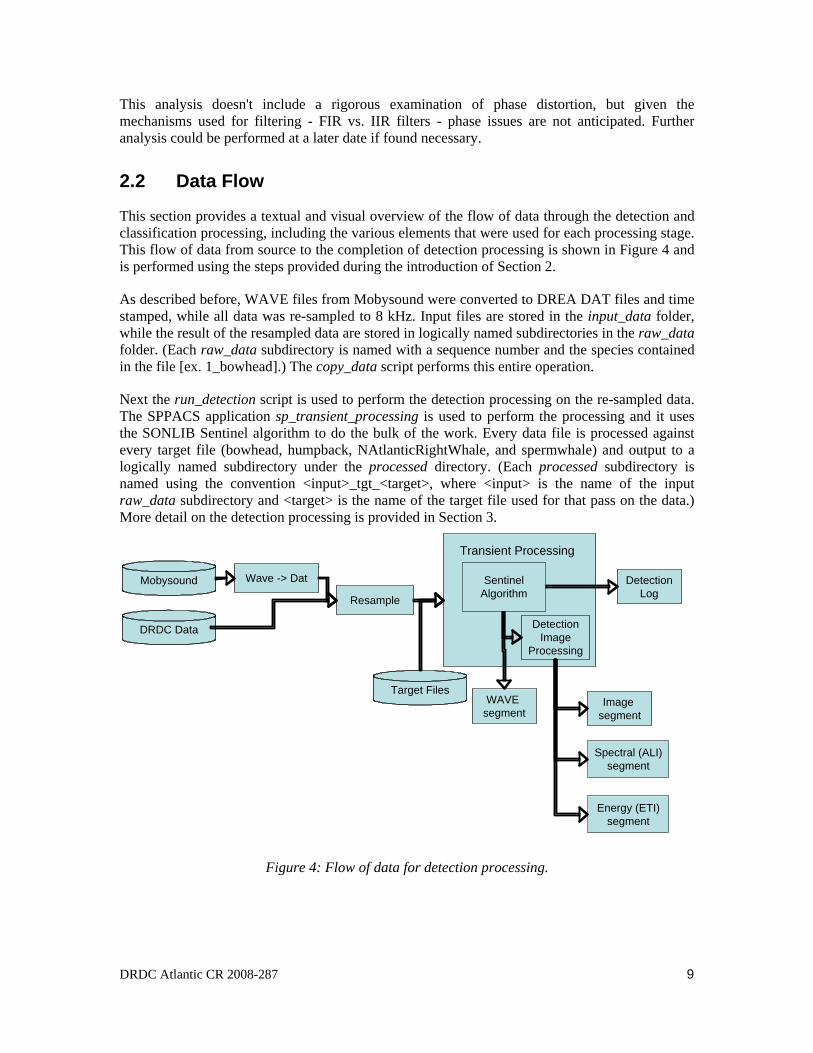
Figure 3: Averaged spectrum for the original data. Produced using a 16K, 50% overlap, Hann window FFT over 94 averages. Note the time and frequency resolution at the top of the figure. .................................................................................................................. 8
Figure 4: Flow of data for detection processing. ............................................................................. 9
Figure 5: ACDC User Interface..................................................................................................... 16
Figure 6: ACDC Time Series Display........................................................................................... 17
Figure 7: Sentinel Processing Flow............................................................................................... 19
Figure 8: Sample plot of data used for SNR computation. The red line is a plot of estimated signal energy and the green box indicates automatically defined region of the signal used to compute the RMS signal level.............................................................. 24
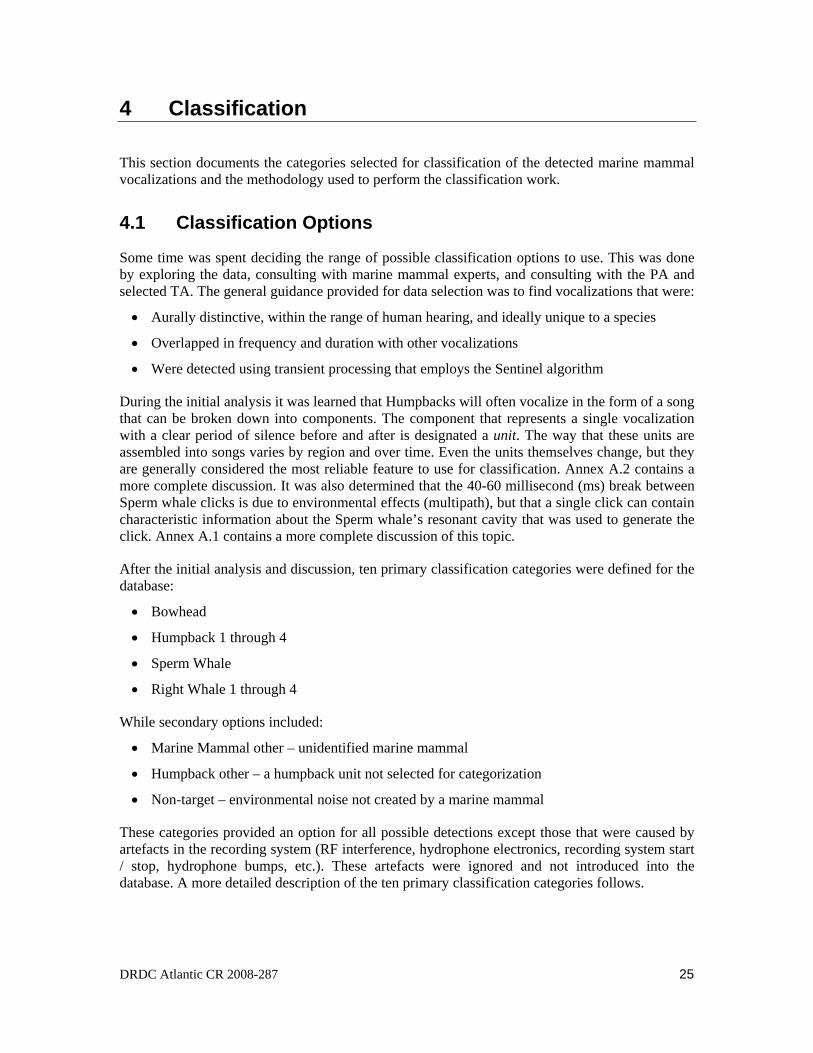
Figure 9: Sample Bowhead vocalization. The subject vocalization is marked with a red box, though seven of these calls are shown. ....................................................................... 26
Figure 10: Time series of sample Bowhead vocalization from ACDC. The detector triggered detection at 3.0 seconds (the middle of the sample).................................................... 27
Figure 11: Binary quantized gram image of the sample Bowhead vocalization from ACDC. In this case the frequency resolution is double that of the original gram and matches the processing described in Table 5. ........................................................................... 27
Figure 12: Sample Humpback 1 vocalization. The subject vocalization is marked with a red box, though five of these calls are shown. The first harmonic (detected feature) is boxed in blue. .............................................................................................................. 28
Figure 13: Time series of sample Humpback 1 vocalization from ACDC. The detector triggered detection at 3.0 seconds (the middle of the sample). This capture also contains a recording artefact (spike at ~2 sec). ........................................................... 29
Figure 14: Binary quantized gram image of the sample Humpback 1 vocalization from ACDC. In this case the frequency resolution is double that of the original gram and matches the processing described in Table 5. Also present is the artefact, clearly visible from 0-1000 Hz, just prior to the Humpback 1 vocalization. .............. 29
Figure 15: Sample Humpback 2 vocalization. The subject vocalization is marked with a red box, though five of these calls are shown. The first harmonic (detected feature) is boxed in blue. .............................................................................................................. 30
DRDC Atlantic CR 2008-287 ix
Figure 16: Time series of sample Humpback 2 vocalization from ACDC. The detector triggered detection at 3.0 seconds (the middle of the sample). ................................... 31
Figure 17: Binary quantized gram image of the sample Humpback 2 vocalization from ACDC. In this case the frequency resolution is double that of the original gram and matches the processing described in Table 5........................................................ 31
Figure 18: Sample Humpback 3 vocalization. The subject vocalization is marked with a red box, though six of these calls are shown. This should not be confused with the higher start frequency whoop that it alternates with. .................................................. 32
Figure 19: Time series of sample Humpback 3 vocalization from ACDC. The detector triggered detection at 3.0 seconds (the middle of the sample). There is a recorder artefact at ~2 seconds. ................................................................................................. 33
Figure 20: Binary quantized gram image of the sample Humpback 3 vocalization from ACDC. In this case the frequency resolution is double that of the original gram and matches the processing described in Table 5........................................................ 33
Figure 21: Sample Humpback 4 vocalization. The subject vocalization is marked with a red box, though five of these calls are shown. The blue box marks the first harmonic (detected feature)......................................................................................................... 34
Figure 22: Time series of sample Humpback 4 vocalization from ACDC. The detector triggered detection at 3.0 seconds (the middle of the sample). ................................... 35
Figure 23: Binary quantized gram image of the sample Humpback 4 vocalization from ACDC. In this case the frequency resolution is double that of the original gram and matches the processing described in Table 5........................................................ 35
Figure 24: Sample Sperm whale click. The subject vocalization is marked with a red box, though eleven of these call sets are shown. In this case the second arrival was detected. ...................................................................................................................... 36
Figure 25: Time series of sample Sperm whale click from ACDC. The detector triggered detection at ~0.75 seconds (the middle of the sample). .............................................. 37
Figure 26: Binary quantized gram image of the sample Sperm whale click from ACDC. Note the significant reduction in spectrum from the original gram. .................................... 38
Figure 27: Sample Right Whale 1 vocalization. The subject vocalization is marked with a red box, with the blue box indicating the focus of the detector. ....................................... 39
Figure 28: Time series of sample Right Whale 1 vocalization from ACDC. The detector triggered detection at ~2.5 seconds. ............................................................................ 40
Figure 29: Binary quantized gram image of the sample Right Whale 1 vocalization from ACDC.......................................................................................................................... 40
Figure 30: Sample Right Whale 2 vocalization. The subject vocalization is marked with a red box............................................................................................................................... 41
Figure 31: Time series of sample Right Whale 2 vocalization from ACDC. The detector triggered detection at ~2.8 seconds. ............................................................................ 42
x DRDC Atlantic CR 2008-287
Figure 32: Binary quantized gram image of the sample Right Whale 2 vocalization from ACDC.......................................................................................................................... 42
Figure 33: Sample Right Whale 4 vocalization. The subject vocalization is marked with a red box............................................................................................................................... 43
Figure 34: Time series of sample Right Whale 4 vocalization from ACDC. The detector triggered detection at ~3 seconds (the centre of the sample). ..................................... 44
Figure 35: Binary quantized gram image of the sample Right Whale 4 vocalization from ACDC. Note that the higher-frequency vocalizations are more easily seen in this image. .......................................................................................................................... 44
DRDC Atlantic CR 2008-287 xi
List of tables
Table 1: Samples of the original, filtered and SoX wave files. ....................................................... 7
Table 2: Transient Detection Message Format.............................................................................. 10
Table 3: Detection Summary Message Format ............................................................................. 12
Table 4: Annotation Message Format ........................................................................................... 17
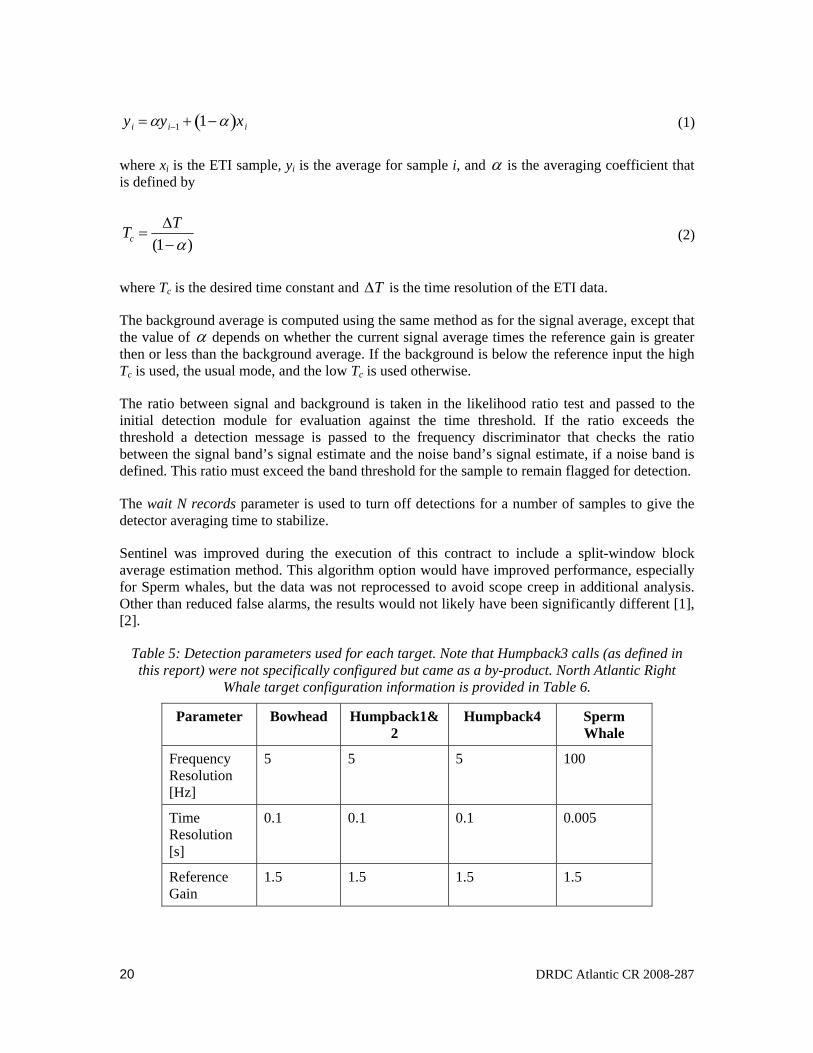
Table 5: Detection parameters used for each target. Note that Humpback3 calls (as defined in this report) were not specifically configured but came as a by-product. North Atlantic Right Whale target configuration information is provided in Table 6. ......... 20
Table 6: Detection parameters used for North Atlantic Right Whales. Note that NAtlRight3 calls are detecting on the second harmonic of NAtlRight2......................................... 21
Table 7: Confusion matrix for all detections. Each row denotes the species that was contained in the data used to produce the results in that row. Each column denotes the target configuration that was used for Sentinel. No breakdown is provided by detecting band. See document text for more explanation. .......................................................... 53
Table 8: File Info Message Format. .............................................................................................. 54
Table 9: Defects for OPD, ACDC and SPPACS........................................................................... 60
xii DRDC Atlantic CR 2008-287
Acknowledgements
Akoostix takes this opportunity to thank Mobysound for the use of their marine mammal acoustic vocalization database http://hmsc.oregonstate.edu/projects/MobySound/MsSoundSets.html.
Akoostix also wishes to thank Dr. Christine Erbe and Julie Oswald for their contributions to understanding the field of marine mammal vocalizations and their assistance with classification of the vocalizations.
DRDC Atlantic CR 2008-287 xiii

This page intentionally left blank.
xiv DRDC Atlantic CR 2008-287
1 Introduction
This contractor report documents work performed under contract W7707-078039/001/HAL for Dr. Paul Hines, DRDC Atlantic between January and October of 2008. This work was conducted in support of DRDC’s research into classification methods for marine mammal vocalizations. The contracted portion of the work involved:
• Selecting appropriate data sets in consultation with the Project Authority (PA)
• Formatting that data for detection processing and gathering information on the data sets
• Performing detection processing to extract candidate data samples for classification
• Establishing ground truth data for each detected segment and post-processing the detections to support classification processing
• Documenting the process and results in a final report and analysis archive
• Performing software maintenance and enhancement as required to support the contract objectives
This report provides the necessary background information and documentation of the work, as required to understand the work products. The focus is on documenting final decisions and methodology. If required more detail on each iteration, and the analysis process as it evolved, can be found in meeting minutes and the analysis archive, which is version controlled.
The remainder of this section provides background information on the source datasets and tools used to perform the work. Subsequent chapters provide:
• Detail on how the data was formatted and pre-processed prior to detection processing
• An explanation of the detection processing and how the signal-to-noise ration (SNR) was computed
• Information on the ground-truth classification process
• A description of the ground-truth annotation
• A description of any software development conducted under this contract
• Engineering data related to this contract including software versions used and related issues
1.1 Background
1.1.1 Data Set Overview
Five data sets were selected for analysis. Three of the data sets were used to provide samples of marine mammal vocalizations, while the other two were used for ambient noise, as a potential source of false alarms. This section provides a summary of each data set, its origin, and what it provided to the project. Full descriptions of the data can be found in Section 5.1. The data sets are:
DRDC Atlantic CR 2008-287 1
• Mobysound (Bowhead, Humpback, Southern Right Whale, North Pacific Right Whale, Ambient Noise with focus on the first two species)
• Bay of Fundy ‘99 (North Atlantic Right Whale)
• Q302 (Sperm Whale)
• Q312 (Ambient Noise)
Mobysound WAVE file data was obtained from the internet (http://hmsc.oregonstate.edu/projects/MobySound/MsSoundSets.html) and was used within the Copyright restriction specified on the site and as agreed by direct communication with David Mellinger. Each data set was previously classified with text annotation indicating detections provided with the data. All Mysticetes data was examined for quality and content and it was decided to focus on the Bowhead and Humpback data. The vocalizations from these two species are similar in frequency content and duration, hampering classification at the detector level. If the classifier could successfully classify between these two species, it would add value to an operational system.
The Bay of Fundy data was obtained from Francine Desharnais, DRDC Atlantic. This data was collected using a variety of sonobuoy types and a CP140 Maritime Patrol Aircraft (MPA). It was later converted to Defence Research Establishment Atlantic (DREA) Digital Audio Tape (DAT) format using the Air Deployable Active Receiver (ADRF) system. Data channels (indexed from 1) 1, 3, 5 thru 12, 14, and 16 were selected for processing. The Right whale contains a variety of vocalizations ranging from low frequency moans, to broadband ‘shotgun’ impulsive signals. This provided some overlap with both the Sperm whale data and Bowhead and Humpback songs, though the vocalizations were sparser. This dataset also contains a large amount of radio frequency (RF) interference in the form of voice radio transmissions. It was decided to ignore detections due to RF interference for the study.
A single Canadian Forces Auxiliary Vessel (CFAV) Quest Cruise Q302 data file was copied from the trial repository (22FEB08_054024.DAT) where channels 1 and 2 (zero indexed) were copied from the file. These data channels contained many Sperm Whale clicks from an SSQ57B broadband sonobuoy.
Two CFAV Quest Cruise Q312 data files were copied from the trial repository (22FEB08_054024.dat, 28FEB08_214013.dat) where channels 1 and 2 (zero indexed) were copied from the file to reduce the data size (similar data was recorded on other channels). These files contain Expendable Mobile Anti-Submarine warfare Training Target (EMATT) / surface ship data, and low frequency active (LFA) ping data respectively, which were expected to produce false alarms.
Initially data from the Workshop Dataset, in Proc. Of 3rd International Workshop in the Detection and Classification of Marine Mammals Using Passive Acoustics, Boston, MA, USA (The Boston Data Set) [3] was intended for this contract, but it was found that both the quality (use of dynamic range) and species contained within the file made it unsuitable for this work.
2 DRDC Atlantic CR 2008-287
1.1.2 Sentinel Acoustic Sub-system (AS)
The Sentinel Acoustic Sub-system is a modular component used in a number of systems, including the Slocum Glider and the Stealth Buoy. This component can sample data, perform passive target detection, or perform transient signal detection using the Sentinel algorithm and user-specified parameters. This component collects data using the analogue interface and can operate at acoustic bandwidths up to 40 kilo-Hertz (kHz), depending on the connected analogue-to-digital (A/D) device. The Sentinel detector module used in the Acoustic System (AS) is identical to the one used for detection processing under this contract, which is described in Section 3.1. The other modules are not relevant to this contract and are not described further.
1.1.3 Acoustic Cetacean Detection Capability (ACDC)
The Acoustic Cetacean Detection Capability (ACDC) application was developed to provide an initial marine mammal monitoring capability for DRDC with the hopes of growing the application to provide broader, generic support. The vision is to create a component that can be connected to a variety of sonar systems and configured to automatically monitor data streams for marine mammal vocalizations. Eventually detections would be vetted by more complex classification software before being presented to an operator for validation and mitigation. An intuitive user-friendly display would allow an operator to operate the system part-time and automatically log detections with annotation showing mitigation action. This log information could also be merged with other streams, such as ping logs, to provide comprehensive evidence gathering to support the crew in the case of an incident.
The software is contained in two separable components; display processing and control (ACDC); and signal processing (sp_transient_processing). This was intentional and allows signal processing to take place off-line or in a remote system such as the Slocum Glider, though it can also be run as part of ACDC. The heart of the detection processing is the Sentinel sonar library (SONLIB) module that can be tuned for transient detection. Processing results are stored in up to five formats; American Standard Code for Information Interchange (ASCII) log files, WAV files, and DREA DAT formatted power files containing black and white GRAM images, power files containing raw spectral data, and energy time indictor (ETI) files containing band vs. time data. The detection results are dynamically read into the ACDC application for operator analysis and verification. Dynamic reading allows the processing and analysis to run simultaneously, providing automatic updates as detections are made. ACDC will function on any data set once provided with a directory in which to find the required detection results.
A more complete description of the processing modules is provided in Section 2.2 including screenshots.
1.1.4 Software Tools for Analysis & Research (STAR)
The STAR suite was developed to support general research and analysis objectives at DRDC Atlantic. The primary objectives of the STAR suite are:
• Provide scientific grade analysis tools that allow for efficient, detailed quantitative and qualitative analysis of a data set.
DRDC Atlantic CR 2008-287 3
• Support synergy between DRDC groups and the Department of National Defence (DND) by providing a common software base for analysis. This synergy encourages inter-group communication and simplifies user training, analysis process development, documentation and data portability.
• Support cost and analysis efficiency by providing software reuse and common tools and data formats. Examples of efficiency would be using the output of analysis from one group to feed the inputs of another, or using common software components to lower development cost of several custom analysis tools.
All STAR components are currently implemented using Interactive Data Language (IDL), though the design is not restricted to IDL. The name STAR reflects the generic nature of the software. Applications in the STAR suite are built using a combination of reusable and custom components that meet the requirements of each application. The layered design and common components allow for rapid and logical development of new capabilities. Though currently focused on two main areas - sonar data processing and analysis, and target localization, tracking and multi-sensor data fusion - the tools are capable of expanding to meet other analysis and research requirements.
This contract used STAR to perform custom processing on datasets to adjust extracted WAVE files and to perform analysis, such as computation of SNR for detection.
1.1.5 Omni-Passive Display (OPD)
OPD is a standalone signal processing application designed to run on Unix, OSX, and Microsoft Windows platforms. It can be used to quickly produce Sonogram and energy-time integration (ETI) output from DREA digital acoustic tape (.DAT/.DAT32) files and wave files. The following functions summarize its capability (detailed information can be found in the OPD User Manual [17]):
• Soundcard input is also available on Unix and OSX platforms.
• Time series viewing and aural listening are possible from wave files (WAV).
• A user can quickly set up the desired signal processing by loading in a preset configuration from storage, or by simply defining the desired frequency and time resolution. A more sophisticated user can define a wide range of parameters, including Fast Fourier Transform (FFT) size, zero padding, overlap, quantization range and much more.
• Each processing result is stored in memory and can be selected for viewing and analysis. Analysis tools include a crosshair cursor for time-frequency measurements.
• The entire sonogram can be saved to an image file to capture the output for reports, etc.
4 DRDC Atlantic CR 2008-287
2 Data Preparation
This section documents the methodology used to select and prepare the data for detection processing. It also provides documentation of the automated processing used to format the data and perform automated detection processing.
The majority of the data preparation task involved:
• Adhoc freeplay with the data
• Informal meetings with the PA to select data and vocalization types
• Experiments with the various options for detection processing, logging, annotation, and SNR computation.
The detailed discussions are documented as meeting minutes and in the analysis repository. The selected preparation processing is documented herein. Generally, the data was modified as little as possible prior to detection processing. All data was re-sampled to 8,000 Hertz (Hz) as described in Section 2.1. All WAVE files were converted to DREA DAT files using sp_wav2dat, and given a unique time stamp as recorded in analysis_results/file_times.csv. The WAVE to DAT conversion did not alter the data in any other way.
The data was stored and prepared for analysis in a way that permits tracking of the data from source data to any detection sample. The process also permits rapid reproduction of the processed output, for those portions that could be automated. This can be useful for reprocessing with different parameters or in the case that bugs are discovered.
This section provides step-by-step instructions on how to regenerate the processed data and a more detailed description of how the data was re-sampled. These instructions assume that all input data are stored in the original directories in the form provided. The input data are otherwise not required to work with the data, as a full copy of the data was provided as part of the contract deliverables. Individual scripts can be examined, if required, to determine more detail on how each step was performed.
Step-by-step data production (all scripts are contained in the scripts directory) is performed using the following steps and with the flow depicted in Figure 4. A more detailed description of the data flow and purpose for each step is provided in Section 2.2:
1. If the base aural_mammal directory structure is not already available:
a. Perform a Subversion check-out of the trials/aural_mammal repository.
b. Move or copy the input_data directory into the repository.
2. Run the copy_data script to copy and resample the input_data and place it in the raw_data directory.
DRDC Atlantic CR 2008-287 5
3. Run the transient_detect script to perform the detection processing and place the results in the processed directory.
4. Run the count_detects script and confirm that the number of detections match those recorded in the analysis_results/detections_stats.txt file.
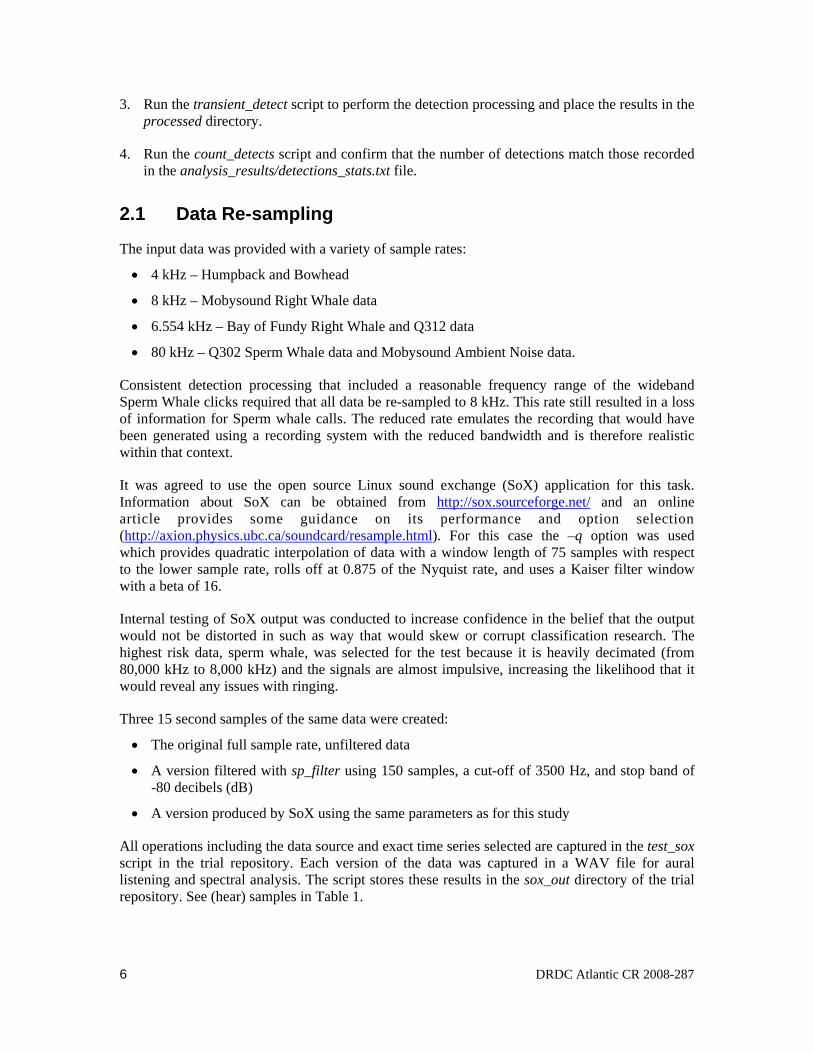
2.1 Data Re-sampling
The input data was provided with a variety of sample rates:
• 4 kHz – Humpback and Bowhead
• 8 kHz – Mobysound Right Whale data
• 6.554 kHz – Bay of Fundy Right Whale and Q312 data
• 80 kHz – Q302 Sperm Whale data and Mobysound Ambient Noise data.
Consistent detection processing that included a reasonable frequency range of the wideband Sperm Whale clicks required that all data be re-sampled to 8 kHz. This rate still resulted in a loss of information for Sperm whale calls. The reduced rate emulates the recording that would have been generated using a recording system with the reduced bandwidth and is therefore realistic within that context.
It was agreed to use the open source Linux sound exchange (SoX) application for this task. Information about SoX can be obtained from http://sox.sourceforge.net/ and an online article provides some guidance on its performance and option selection (http://axion.physics.ubc.ca/soundcard/resample.html). For this case the –q option was used which provides quadratic interpolation of data with a window length of 75 samples with respect to the lower sample rate, rolls off at 0.875 of the Nyquist rate, and uses a Kaiser filter window with a beta of 16.
Internal testing of SoX output was conducted to increase confidence in the belief that the output would not be distorted in such as way that would skew or corrupt classification research. The highest risk data, sperm whale, was selected for the test because it is heavily decimated (from 80,000 kHz to 8,000 kHz) and the signals are almost impulsive, increasing the likelihood that it would reveal any issues with ringing.
Three 15 second samples of the same data were created:
• The original full sample rate, unfiltered data
• A version filtered with sp_filter using 150 samples, a cut-off of 3500 Hz, and stop band of -80 decibels (dB)
• A version produced by SoX using the same parameters as for this study
All operations including the data source and exact time series selected are captured in the test_sox script in the trial repository. Each version of the data was captured in a WAV file for aural listening and spectral analysis. The script stores these results in the sox_out directory of the trial repository. See (hear) samples in Table 1.
6 DRDC Atlantic CR 2008-287

Table 1: Samples of the original, filtered and SoX wave files.
orig.wav filter.wav sox.wav
Aural analysis of the three data versions revealed some differences. Of course the full band version sounded more like a sperm whale and was much sharper, but there wasn’t any critical distortion in either of the other two files. Any differences in the aural characteristics of the two filtered versions can be explained by the difference in roll-off between the two filters used. The signal processing packages (SPPACS) filter program produces simple filters and did not achieve the same tight roll-off as the SoX filter. In reality the sp_filter version wouldn’t roll off fast enough to prevent aliasing.
A plot of an averaged spectra for the SoX data are shown in Figure 1 while the averaged spectrum for the sp_filter data are shown in Figure 2. Both of these spectra show an energy hump around 3 kHz. This hump also exists in the original data shown in Figure 3. The difference in sample rates (8 kHz vs. 80 kHz) prevented exact time and frequency resolution matching, but OPD’s resolution matching algorithm produced a match that is optimal for a power of 2 FFT. The processing parameters used are provided in each figure caption.
Figure 1: Averaged spectrum for SoX output. Produced using a 2K, 50% overlap, Hann window FFT over 75 averages. Note the time and frequency resolution at the top of the figure.
DRDC Atlantic CR 2008-287 7
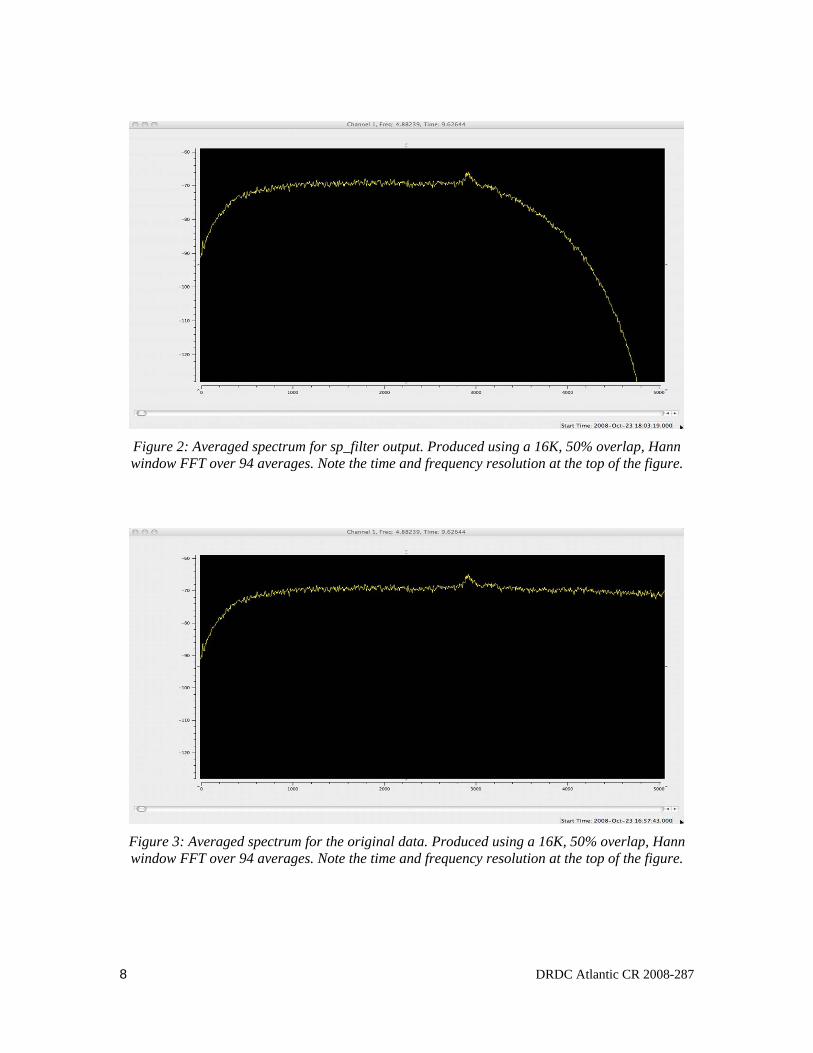
Figure 2: Averaged spectrum for sp_filter output. Produced using a 16K, 50% overlap, Hann window FFT over 94 averages. Note the time and frequency resolution at the top of the figure.
Figure 3: Averaged spectrum for the original data. Produced using a 16K, 50% overlap, Hann window FFT over 94 averages. Note the time and frequency resolution at the top of the figure.
8 DRDC Atlantic CR 2008-287
This analysis doesn't include a rigorous examination of phase distortion, but given the mechanisms used for filtering - FIR vs. IIR filters - phase issues are not anticipated. Further analysis could be performed at a later date if found necessary.
2.2 Data Flow
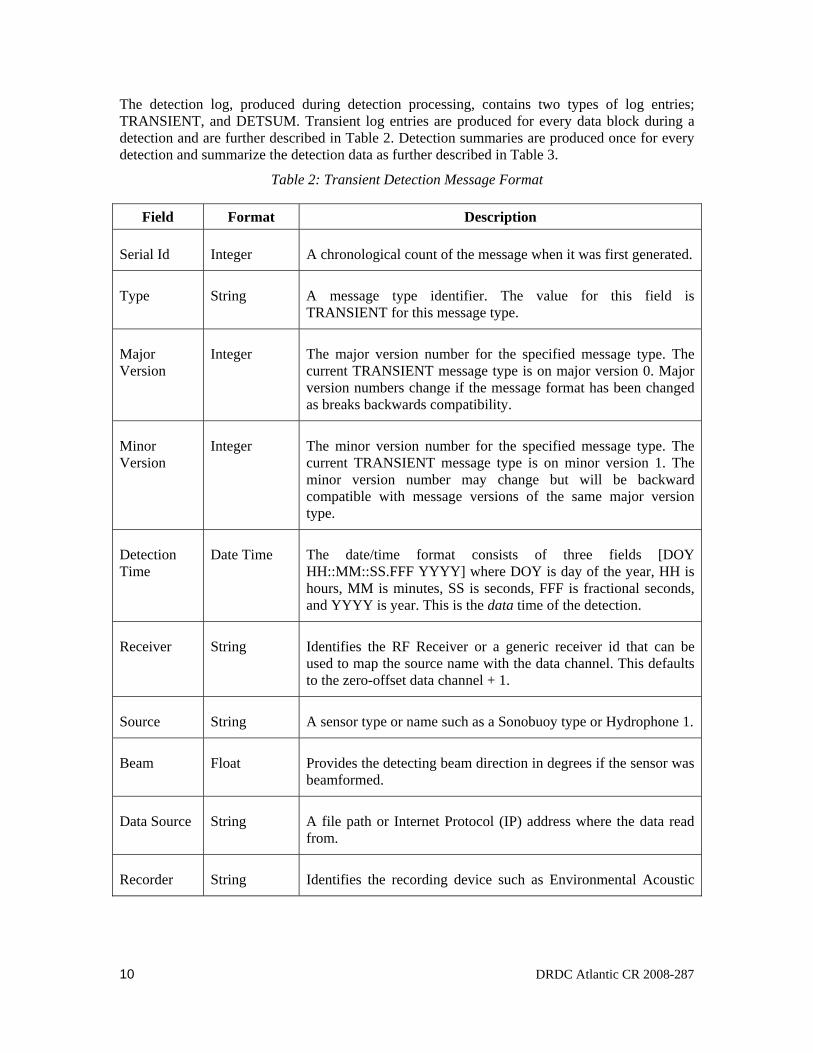
This section provides a textual and visual overview of the flow of data through the detection and classification processing, including the various elements that were used for each processing stage. This flow of data from source to the completion of detection processing is shown in Figure 4 and is performed using the steps provided during the introduction of Section 2.
As described before, WAVE files from Mobysound were converted to DREA DAT files and time stamped, while all data was re-sampled to 8 kHz. Input files are stored in the input_data folder, while the result of the resampled data are stored in logically named subdirectories in the raw_data folder. (Each raw_data subdirectory is named with a sequence number and the species contained in the file [ex. 1_bowhead].) The copy_data script performs this entire operation.
Next the run_detection script is used to perform the detection processing on the re-sampled data. The SPPACS application sp_transient_processing is used to perform the processing and it uses the SONLIB Sentinel algorithm to do the bulk of the work. Every data file is processed against every target file (bowhead, humpback, NAtlanticRightWhale, and spermwhale) and output to a logically named subdirectory under the processed directory. (Each processed subdirectory is named using the convention <input>_tgt_<target>, where <input> is the name of the input raw_data subdirectory and <target> is the name of the target file used for that pass on the data.) More detail on the detection processing is provided in Section 3.
Mobysound
DRDC Data
Wave -> Dat
Resample
WAVE segment
DetectionLog
DetectionImage
Processing
Image segment
Target Files
Spectral (ALI)segment
Energy (ETI)segment
Transient Processing
SentinelAlgorithm
Figure 4: Flow of data for detection processing.
DRDC Atlantic CR 2008-287 9
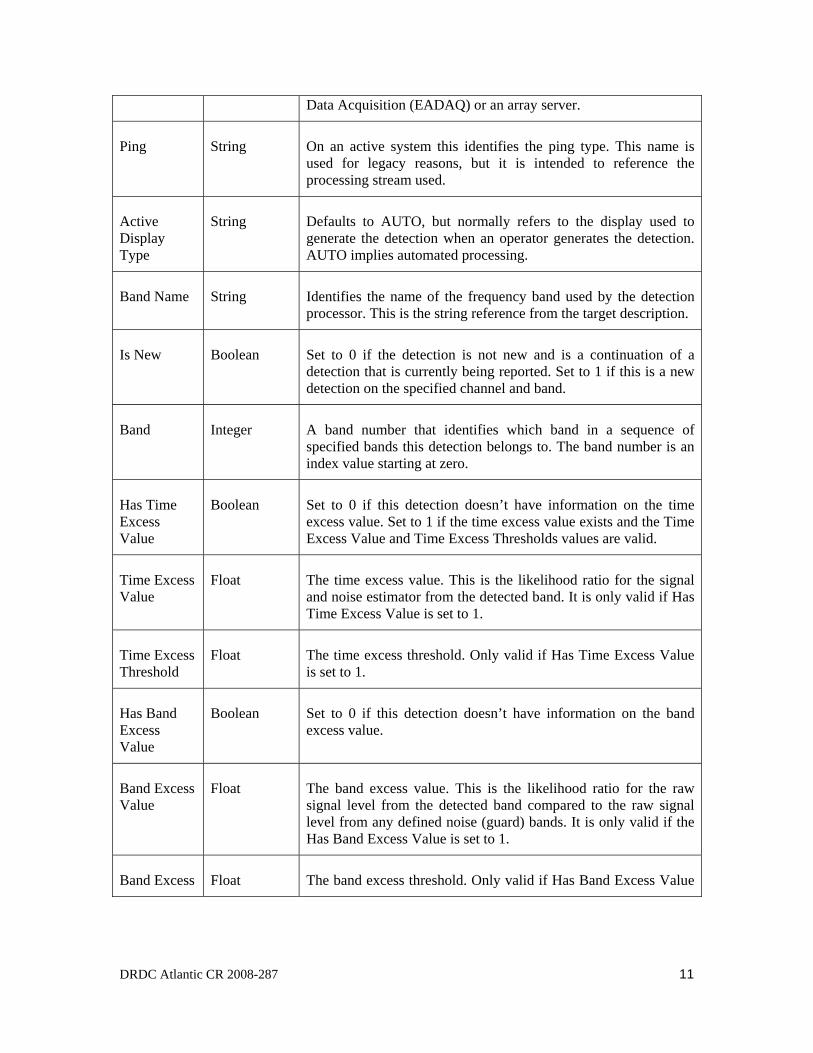
The detection log, produced during detection processing, contains two types of log entries; TRANSIENT, and DETSUM. Transient log entries are produced for every data block during a detection and are further described in Table 2. Detection summaries are produced once for every detection and summarize the detection data as further described in Table 3.
Table 2: Transient Detection Message Format
Field Format Description
Serial Id Integer A chronological count of the message when it was first generated.
Type String A message type identifier. The value for this field is TRANSIENT for this message type.
Major Version
Integer The major version number for the specified message type. The current TRANSIENT message type is on major version 0. Major version numbers change if the message format has been changed as breaks backwards compatibility.
Minor Version
Integer The minor version number for the specified message type. The current TRANSIENT message type is on minor version 1. The minor version number may change but will be backward compatible with message versions of the same major version type.
Detection Time
Date Time The date/time format consists of three fields [DOY HH::MM::SS.FFF YYYY] where DOY is day of the year, HH is hours, MM is minutes, SS is seconds, FFF is fractional seconds, and YYYY is year. This is the data time of the detection.
Receiver String Identifies the RF Receiver or a generic receiver id that can be used to map the source name with the data channel. This defaults to the zero-offset data channel + 1.
Source String A sensor type or name such as a Sonobuoy type or Hydrophone 1.
Beam Float Provides the detecting beam direction in degrees if the sensor was beamformed.
Data Source String A file path or Internet Protocol (IP) address where the data read from.
Recorder String Identifies the recording device such as Environmental Acoustic
10 DRDC Atlantic CR 2008-287
Data Acquisition (EADAQ) or an array server.
Ping String On an active system this identifies the ping type. This name is used for legacy reasons, but it is intended to reference the processing stream used.
Active Display Type
String Defaults to AUTO, but normally refers to the display used to generate the detection when an operator generates the detection. AUTO implies automated processing.
Band Name String Identifies the name of the frequency band used by the detection processor. This is the string reference from the target description.
Is New Boolean Set to 0 if the detection is not new and is a continuation of a detection that is currently being reported. Set to 1 if this is a new detection on the specified channel and band.
Band Integer A band number that identifies which band in a sequence of specified bands this detection belongs to. The band number is an index value starting at zero.
Has Time Excess Value
Boolean Set to 0 if this detection doesn’t have information on the time excess value. Set to 1 if the time excess value exists and the Time Excess Value and Time Excess Thresholds values are valid.
Time Excess Value
Float The time excess value. This is the likelihood ratio for the signal and noise estimator from the detected band. It is only valid if Has Time Excess Value is set to 1.
Time Excess Threshold
Float The time excess threshold. Only valid if Has Time Excess Value is set to 1.
Has Band Excess Value
Boolean Set to 0 if this detection doesn’t have information on the band excess value.
Band Excess Value
Float The band excess value. This is the likelihood ratio for the raw signal level from the detected band compared to the raw signal level from any defined noise (guard) bands. It is only valid if the Has Band Excess Value is set to 1.
Band Excess Float The band excess threshold. Only valid if Has Band Excess Value
DRDC Atlantic CR 2008-287 11
Threshold is set to 1.
Has Raw Value
Boolean Set to 0 if this detection doesn’t have information on the raw value. Set to 1 if the raw value exists and the Raw Value values are valid.
Raw Value Float Raw value of the detection. This is the raw signal level estimate from the detecting band. It is only valid if the Has Raw Value field is set to 1.
Detection Id Integer Chronologically sequenced id of the detection for a particular processing run.
Base Filename
String A base file name (without any file extensions) that associates processed files with this base name to the detection (such as the .ali, .wav, .eti. .pwr files).
Base Start Time
Date/Time A date/time that denotes the beginning of the files associated with the base filename.
Base End Time
Date/Time A date/time that denotes the end of the files associated with the base filename.
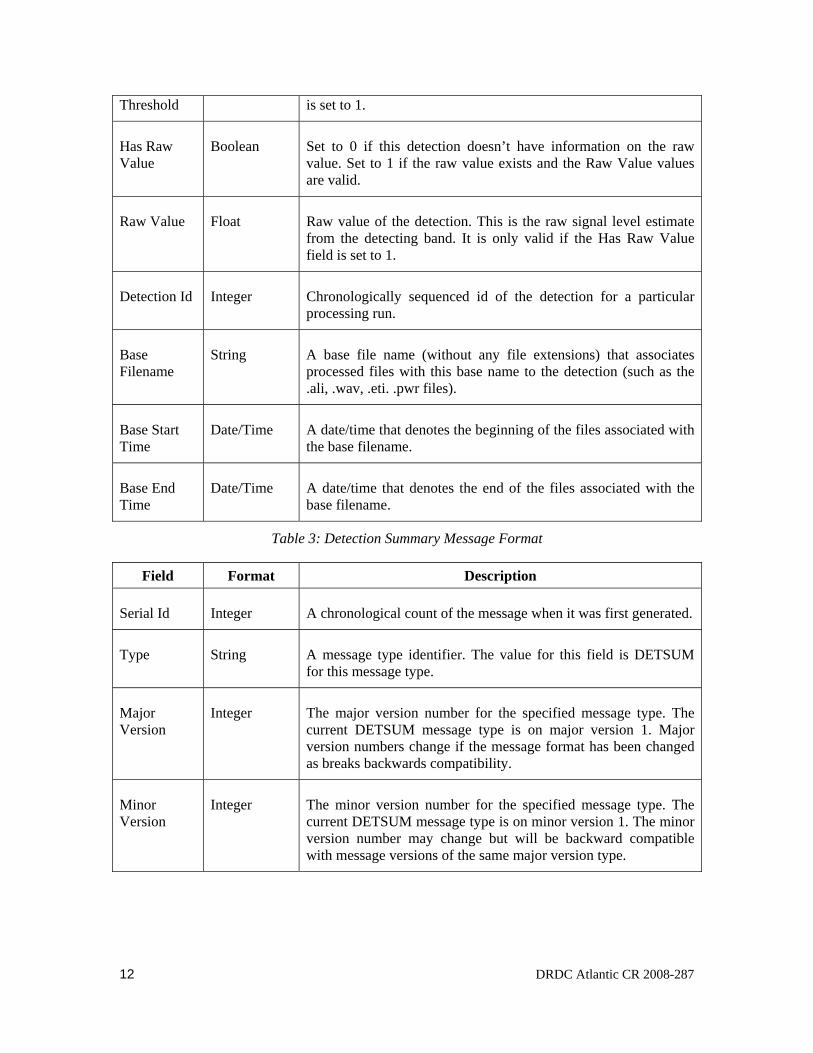
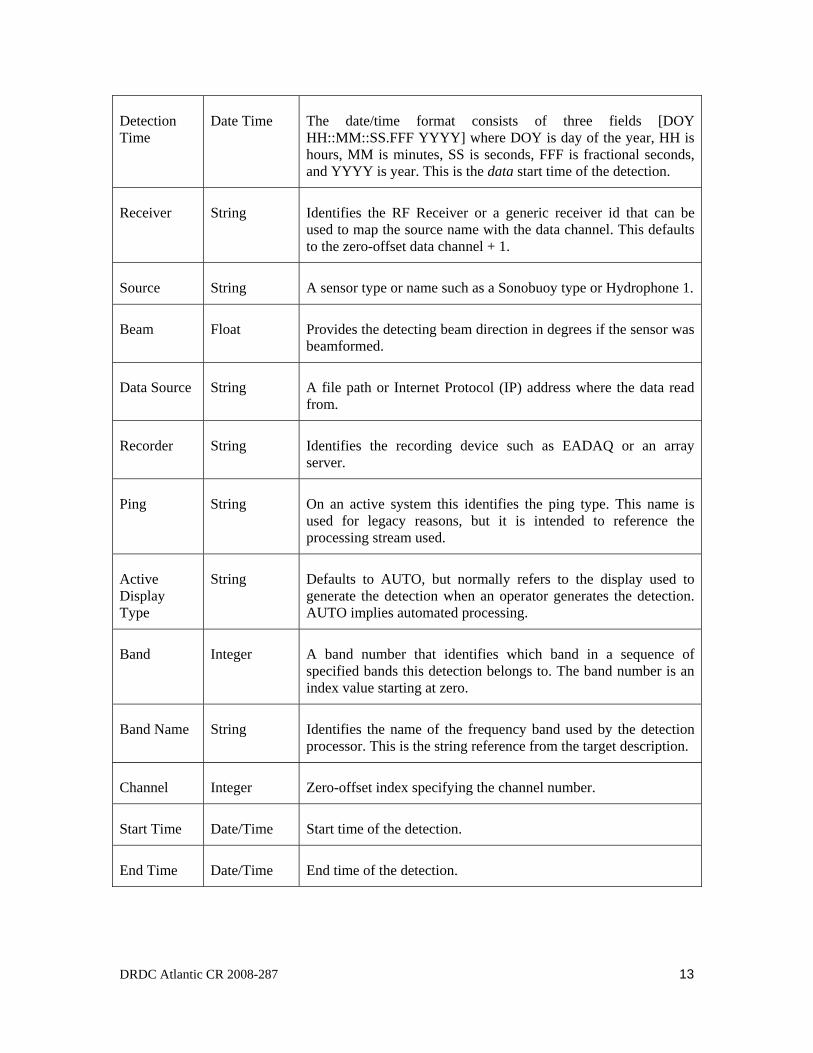
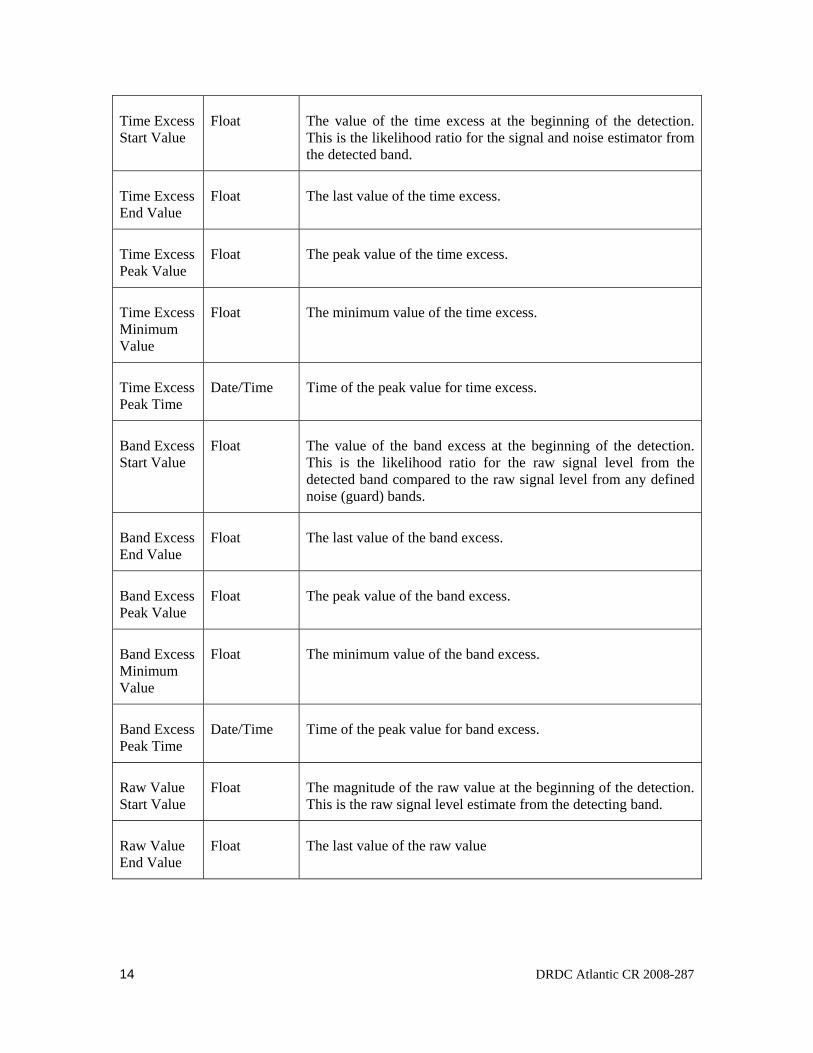
Table 3: Detection Summary Message Format
Field Format Description
Serial Id Integer A chronological count of the message when it was first generated.
Type String A message type identifier. The value for this field is DETSUM for this message type.
Major Version
Integer The major version number for the specified message type. The current DETSUM message type is on major version 1. Major version numbers change if the message format has been changed as breaks backwards compatibility.
Minor Version
Integer The minor version number for the specified message type. The current DETSUM message type is on minor version 1. The minor version number may change but will be backward compatible with message versions of the same major version type.
12 DRDC Atlantic CR 2008-287
Detection Time
Date Time The date/time format consists of three fields [DOY HH::MM::SS.FFF YYYY] where DOY is day of the year, HH is hours, MM is minutes, SS is seconds, FFF is fractional seconds, and YYYY is year. This is the data start time of the detection.
Receiver String Identifies the RF Receiver or a generic receiver id that can be used to map the source name with the data channel. This defaults to the zero-offset data channel + 1.
Source String A sensor type or name such as a Sonobuoy type or Hydrophone 1.
Beam Float Provides the detecting beam direction in degrees if the sensor was beamformed.
Data Source String A file path or Internet Protocol (IP) address where the data read from.
Recorder String Identifies the recording device such as EADAQ or an array server.
Ping String On an active system this identifies the ping type. This name is used for legacy reasons, but it is intended to reference the processing stream used.
Active Display Type
String Defaults to AUTO, but normally refers to the display used to generate the detection when an operator generates the detection. AUTO implies automated processing.
Band Integer A band number that identifies which band in a sequence of specified bands this detection belongs to. The band number is an index value starting at zero.
Band Name String Identifies the name of the frequency band used by the detection processor. This is the string reference from the target description.
Channel Integer Zero-offset index specifying the channel number.
Start Time Date/Time Start time of the detection.
End Time Date/Time End time of the detection.
DRDC Atlantic CR 2008-287 13
Time Excess Start Value
Float The value of the time excess at the beginning of the detection. This is the likelihood ratio for the signal and noise estimator from the detected band.
Time Excess End Value
Float The last value of the time excess.
Time Excess Peak Value
Float The peak value of the time excess.
Time Excess Minimum Value
Float The minimum value of the time excess.
Time Excess Peak Time
Date/Time Time of the peak value for time excess.
Band Excess Start Value
Float The value of the band excess at the beginning of the detection. This is the likelihood ratio for the raw signal level from the detected band compared to the raw signal level from any defined noise (guard) bands.
Band Excess End Value
Float The last value of the band excess.
Band Excess Peak Value
Float The peak value of the band excess.
Band Excess Minimum Value
Float The minimum value of the band excess.
Band Excess Peak Time
Date/Time Time of the peak value for band excess.
Raw Value Start Value
Float The magnitude of the raw value at the beginning of the detection. This is the raw signal level estimate from the detecting band.
Raw Value End Value
Float The last value of the raw value
14 DRDC Atlantic CR 2008-287
Raw Value Peak Value
Float The peak value of the raw value.
Raw Value Minimum Value
Float The minimum value of the raw value.
Raw Value Peak Time
Date/Time Time of the peak value for raw value.
Base Filename
String A base file name (without any file extensions) that associates processed files with this base name to the detection (such as the .ali, .wav, .eti. .pwr files).
Base Start Time
Date/Time A date/time that denotes the beginning of the files associated with the base filename.
Base End Time
Date/Time A date/time that denotes the end of the files associated with the base filename.
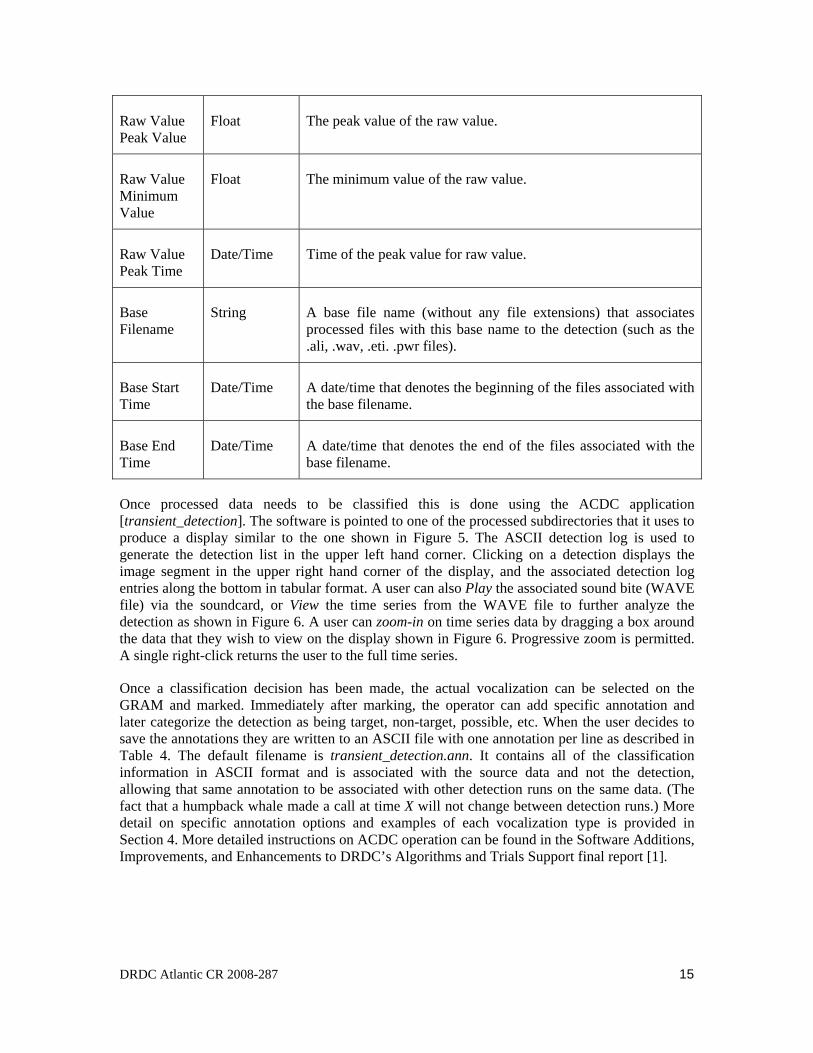
Once processed data needs to be classified this is done using the ACDC application [transient_detection]. The software is pointed to one of the processed subdirectories that it uses to produce a display similar to the one shown in Figure 5. The ASCII detection log is used to generate the detection list in the upper left hand corner. Clicking on a detection displays the image segment in the upper right hand corner of the display, and the associated detection log entries along the bottom in tabular format. A user can also Play the associated sound bite (WAVE file) via the soundcard, or View the time series from the WAVE file to further analyze the detection as shown in Figure 6. A user can zoom-in on time series data by dragging a box around the data that they wish to view on the display shown in Figure 6. Progressive zoom is permitted. A single right-click returns the user to the full time series.
Once a classification decision has been made, the actual vocalization can be selected on the GRAM and marked. Immediately after marking, the operator can add specific annotation and later categorize the detection as being target, non-target, possible, etc. When the user decides to save the annotations they are written to an ASCII file with one annotation per line as described in Table 4. The default filename is transient_detection.ann. It contains all of the classification information in ASCII format and is associated with the source data and not the detection, allowing that same annotation to be associated with other detection runs on the same data. (The fact that a humpback whale made a call at time X will not change between detection runs.) More detail on specific annotation options and examples of each vocalization type is provided in Section 4. More detailed instructions on ACDC operation can be found in the Software Additions, Improvements, and Enhancements to DRDC’s Algorithms and Trials Support final report [1].
DRDC Atlantic CR 2008-287 15

Figure 5: ACDC User Interface.
16 DRDC Atlantic CR 2008-287
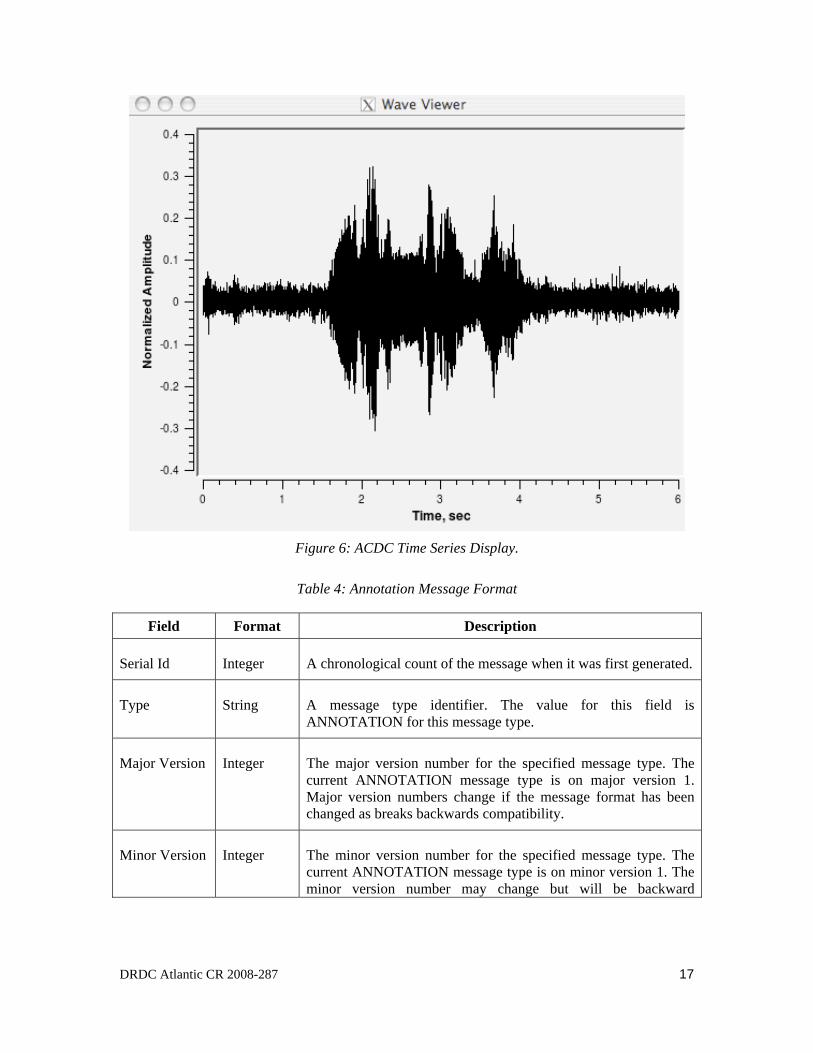
Figure 6: ACDC Time Series Display.
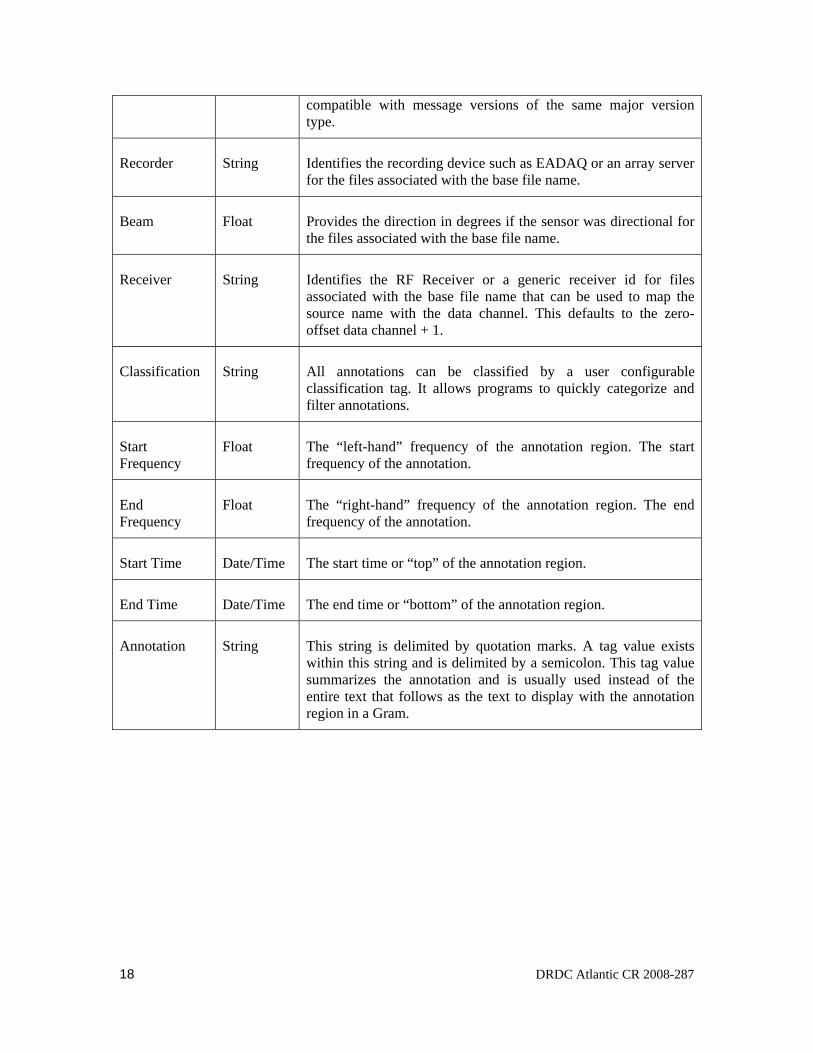
Table 4: Annotation Message Format
Field Format Description
Serial Id Integer A chronological count of the message when it was first generated.
Type String A message type identifier. The value for this field is ANNOTATION for this message type.
Major Version Integer The major version number for the specified message type. The current ANNOTATION message type is on major version 1. Major version numbers change if the message format has been changed as breaks backwards compatibility.
Minor Version Integer The minor version number for the specified message type. The current ANNOTATION message type is on minor version 1. The minor version number may change but will be backward
DRDC Atlantic CR 2008-287 17
compatible with message versions of the same major version type.
Recorder String Identifies the recording device such as EADAQ or an array server for the files associated with the base file name.
Beam Float Provides the direction in degrees if the sensor was directional for the files associated with the base file name.
Receiver String Identifies the RF Receiver or a generic receiver id for files associated with the base file name that can be used to map the source name with the data channel. This defaults to the zero-offset data channel + 1.
Classification String All annotations can be classified by a user configurable classification tag. It allows programs to quickly categorize and filter annotations.
Start Frequency
Float The “left-hand” frequency of the annotation region. The start frequency of the annotation.
End Frequency
Float The “right-hand” frequency of the annotation region. The end frequency of the annotation.
Start Time Date/Time The start time or “top” of the annotation region.
End Time Date/Time The end time or “bottom” of the annotation region.
Annotation String This string is delimited by quotation marks. A tag value exists within this string and is delimited by a semicolon. This tag value summarizes the annotation and is usually used instead of the entire text that follows as the text to display with the annotation region in a Gram.
18 DRDC Atlantic CR 2008-287
3 Detection and Post-Processing
This section provides detailed information on how the detection processing was performed including details of the Sentinel algorithm. Detection processing was performed with a less stringent set of parameters than would normally be used in order to generate as many detections as possible, while allowing for some false alarms. The vision is that capable classification processing will reduce the false alarm rate, while maintaining many of the detections, whereas any detection missed at this stage could not be recovered.
3.1 Detection
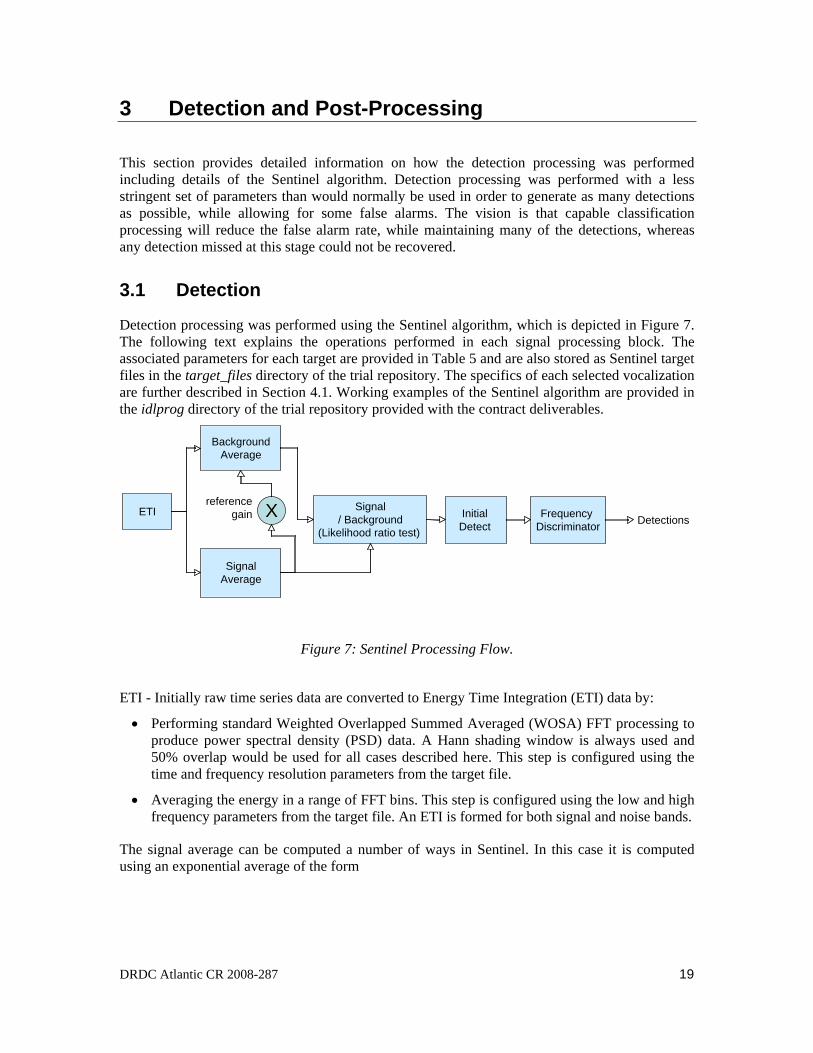
Detection processing was performed using the Sentinel algorithm, which is depicted in Figure 7. The following text explains the operations performed in each signal processing block. The associated parameters for each target are provided in Table 5 and are also stored as Sentinel target files in the target_files directory of the trial repository. The specifics of each selected vocalization are further described in Section 4.1. Working examples of the Sentinel algorithm are provided in the idlprog directory of the trial repository provided with the contract deliverables.
ETI
BackgroundAverage
SignalAverage
Signal/ Background
(Likelihood ratio test)
Initial Detect
Frequency Discriminator
Xreferencegain Detections
Figure 7: Sentinel Processing Flow.
ETI - Initially raw time series data are converted to Energy Time Integration (ETI) data by:
• Performing standard Weighted Overlapped Summed Averaged (WOSA) FFT processing to produce power spectral density (PSD) data. A Hann shading window is always used and 50% overlap would be used for all cases described here. This step is configured using the time and frequency resolution parameters from the target file.
• Averaging the energy in a range of FFT bins. This step is configured using the low and high frequency parameters from the target file. An ETI is formed for both signal and noise bands.
The signal average can be computed a number of ways in Sentinel. In this case it is computed using an exponential average of the form
DRDC Atlantic CR 2008-287 19
yi =αyi−1 + 1−α( )xi (1)
α is the ETI sample, y is the average for sample i, and where xi i is the averaging coefficient that is defined by
Tc =ΔT
(1−α) (2)
ΔTwhere T is the desired time constant and is the time resolution of the ETI data. c
The background average is computed using the same method as for the signal average, except that the value of α depends on whether the current signal average times the reference gain is greater then or less than the background average. If the background is below the reference input the high T is used, the usual mode, and the low T is used otherwise. c c
The ratio between signal and background is taken in the likelihood ratio test and passed to the initial detection module for evaluation against the time threshold. If the ratio exceeds the threshold a detection message is passed to the frequency discriminator that checks the ratio between the signal band’s signal estimate and the noise band’s signal estimate, if a noise band is defined. This ratio must exceed the band threshold for the sample to remain flagged for detection.
The wait N records parameter is used to turn off detections for a number of samples to give the detector averaging time to stabilize.
Sentinel was improved during the execution of this contract to include a split-window block average estimation method. This algorithm option would have improved performance, especially for Sperm whales, but the data was not reprocessed to avoid scope creep in additional analysis. Other than reduced false alarms, the results would not likely have been significantly different [1], [2].
Table 5: Detection parameters used for each target. Note that Humpback3 calls (as defined in this report) were not specifically configured but came as a by-product. North Atlantic Right
Whale target configuration information is provided in Table 6.
Parameter Bowhead Humpback1&2
Humpback4 Sperm Whale
Frequency Resolution [Hz]
5 5 5 100
Time Resolution [s]
0.1 0.1 0.1 0.005
Reference Gain
1.5 1.5 1.5 1.5
20 DRDC Atlantic CR 2008-287
Wait N Records
5 5 5 50
Signal Band Bowhead Humpback1&2 Humpback3 Spermwhale
(Humpback4 classification)
High / Low Frequency [Hz]
130 / 700 200 / 500 625 / 1550 1000 / 3900
Background Tc (L/H) [s]
1.0 / 50.0 1.0 / 50.0 1.0 / 50.0 0.1 / 0.2
Signal Tc [s] 1.0 1.0 1.0 0.005
Time Threshold
2.0 2.5 2.5 4.0
Band Threshold
50.0 10.0 10.0 N/A
Noise Band Noise1 Noise1 Noise2 N/A
High / Low Frequency [Hz]
1000 / 1250
600 / 1000 200 / 500
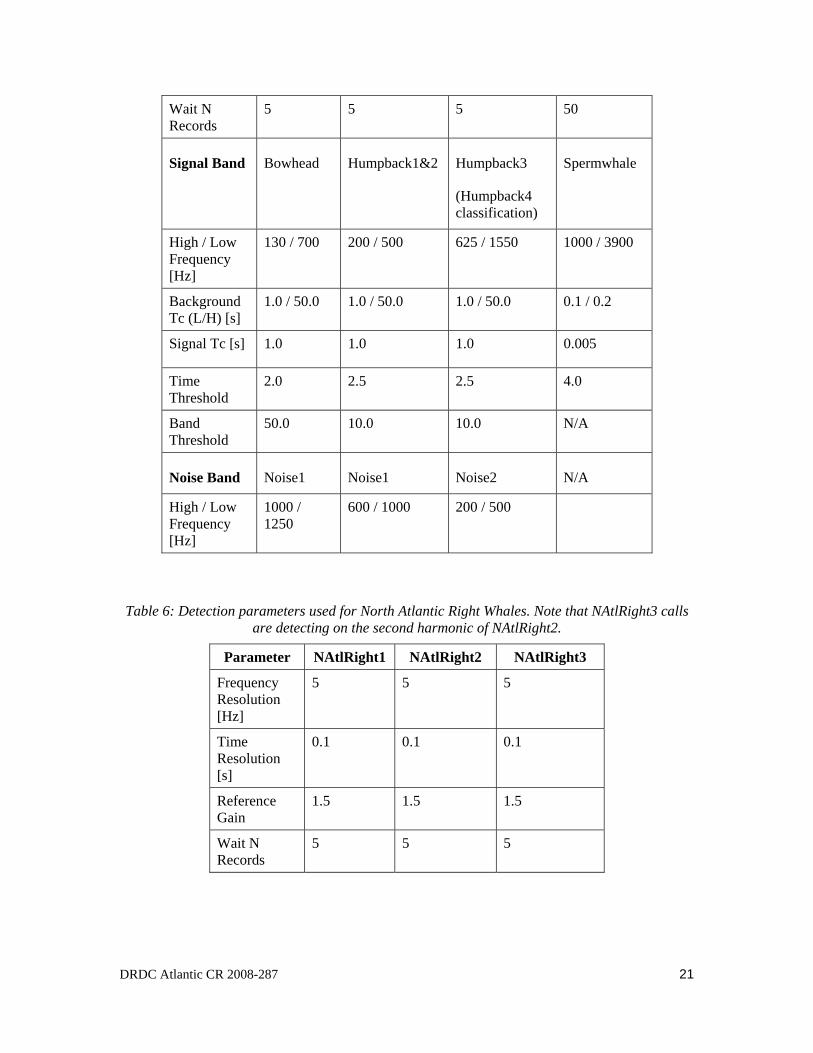
Table 6: Detection parameters used for North Atlantic Right Whales. Note that NAtlRight3 calls are detecting on the second harmonic of NAtlRight2.
Parameter NAtlRight1 NAtlRight2 NAtlRight3
Frequency Resolution [Hz]
5 5 5
Time Resolution [s]
0.1 0.1 0.1
Reference Gain
1.5 1.5 1.5
Wait N Records
5 5 5
DRDC Atlantic CR 2008-287 21
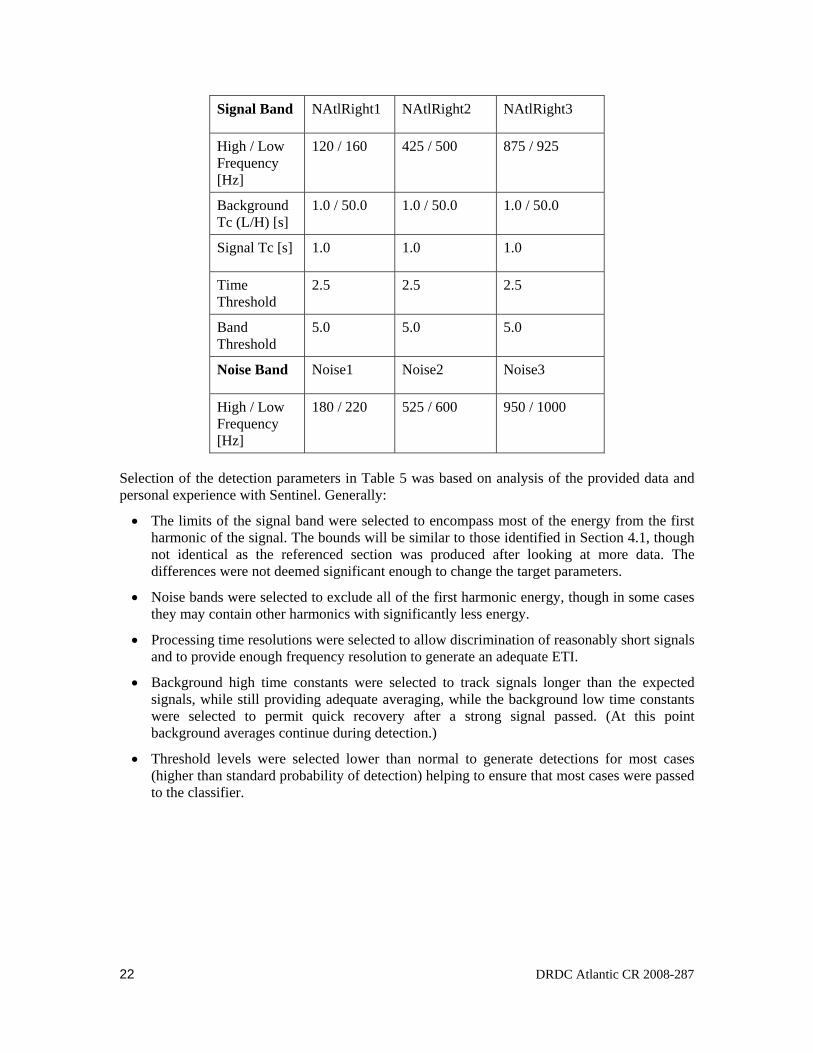
Signal Band NAtlRight1 NAtlRight2 NAtlRight3
High / Low Frequency [Hz]
120 / 160 425 / 500 875 / 925
Background Tc (L/H) [s]
1.0 / 50.0 1.0 / 50.0 1.0 / 50.0
Signal Tc [s] 1.0 1.0 1.0
Time Threshold
2.5 2.5 2.5
Band Threshold
5.0 5.0 5.0
Noise Band Noise1 Noise2 Noise3
High / Low Frequency [Hz]
180 / 220 525 / 600 950 / 1000
Selection of the detection parameters in Table 5 was based on analysis of the provided data and personal experience with Sentinel. Generally:
• The limits of the signal band were selected to encompass most of the energy from the first harmonic of the signal. The bounds will be similar to those identified in Section 4.1, though not identical as the referenced section was produced after looking at more data. The differences were not deemed significant enough to change the target parameters.
• Noise bands were selected to exclude all of the first harmonic energy, though in some cases they may contain other harmonics with significantly less energy.
• Processing time resolutions were selected to allow discrimination of reasonably short signals and to provide enough frequency resolution to generate an adequate ETI.
• Background high time constants were selected to track signals longer than the expected signals, while still providing adequate averaging, while the background low time constants were selected to permit quick recovery after a strong signal passed. (At this point background averages continue during detection.)
• Threshold levels were selected lower than normal to generate detections for most cases (higher than standard probability of detection) helping to ensure that most cases were passed to the classifier.
22 DRDC Atlantic CR 2008-287
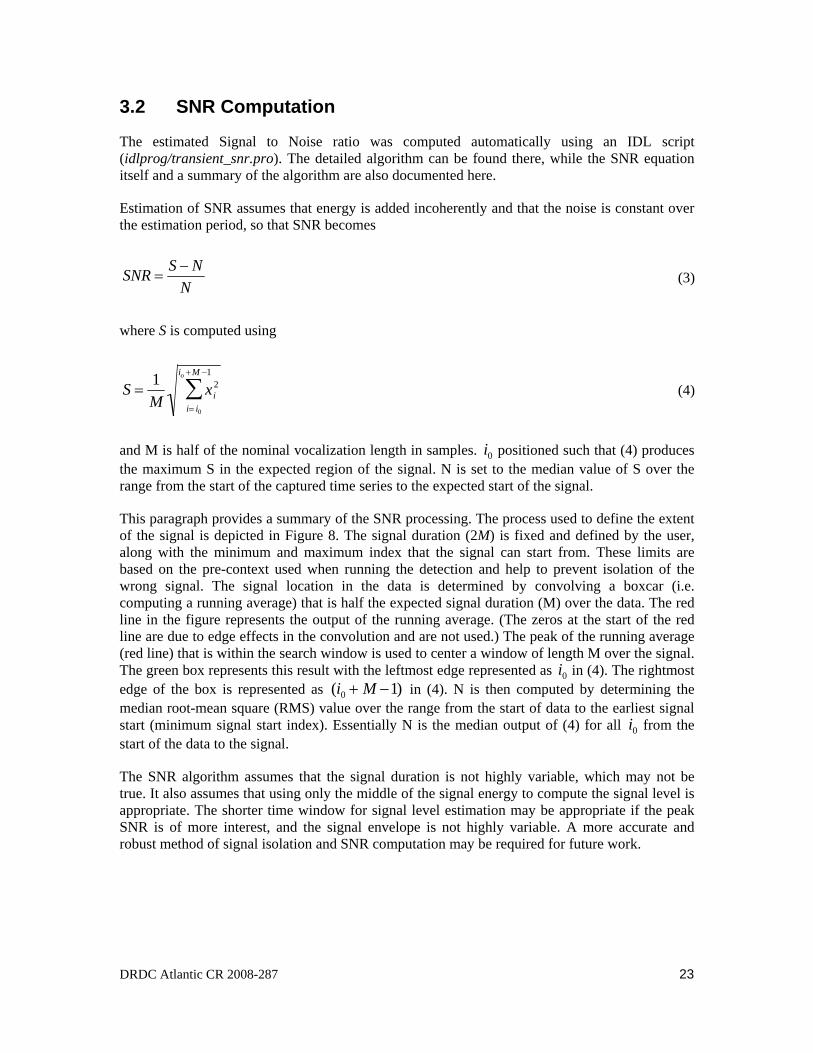
3.2 SNR Computation
The estimated Signal to Noise ratio was computed automatically using an IDL script (idlprog/transient_snr.pro). The detailed algorithm can be found there, while the SNR equation itself and a summary of the algorithm are also documented here.
Estimation of SNR assumes that energy is added incoherently and that the noise is constant over the estimation period, so that SNR becomes
SNR =S − N
N (3)
where S is computed using
S =1
Mxi
2
i= i0
io +M −1
∑ (4)
and M is half of the nominal vocalization length in samples. i positioned such that (4)0 produces the maximum S in the expected region of the signal. N is set to the median value of S over the range from the start of the captured time series to the expected start of the signal.
This paragraph provides a summary of the SNR processing. The process used to define the extent of the signal is depicted in Figure 8. The signal duration (2M) is fixed and defined by the user, along with the minimum and maximum index that the signal can start from. These limits are based on the pre-context used when running the detection and help to prevent isolation of the wrong signal. The signal location in the data is determined by convolving a boxcar (i.e. computing a running average) that is half the expected signal duration (M) over the data. The red line in the figure represents the output of the running average. (The zeros at the start of the red line are due to edge effects in the convolution and are not used.) The peak of the running average (red line) that is within the search window is used to center a window of length M over the signal. The green box represents this result with the leftmost edge represented as i0 in (4). The rightmost edge of the box is represented as ( + −1)
i
in (4)i M0 . N is then computed by determining the median root-mean square (RMS) value over the range from the start of data to the earliest signal start (minimum signal start index). Essentially N is the median output of (4) for all from the start of the data to the signal.
0
The SNR algorithm assumes that the signal duration is not highly variable, which may not be true. It also assumes that using only the middle of the signal energy to compute the signal level is appropriate. The shorter time window for signal level estimation may be appropriate if the peak SNR is of more interest, and the signal envelope is not highly variable. A more accurate and robust method of signal isolation and SNR computation may be required for future work.
DRDC Atlantic CR 2008-287 23
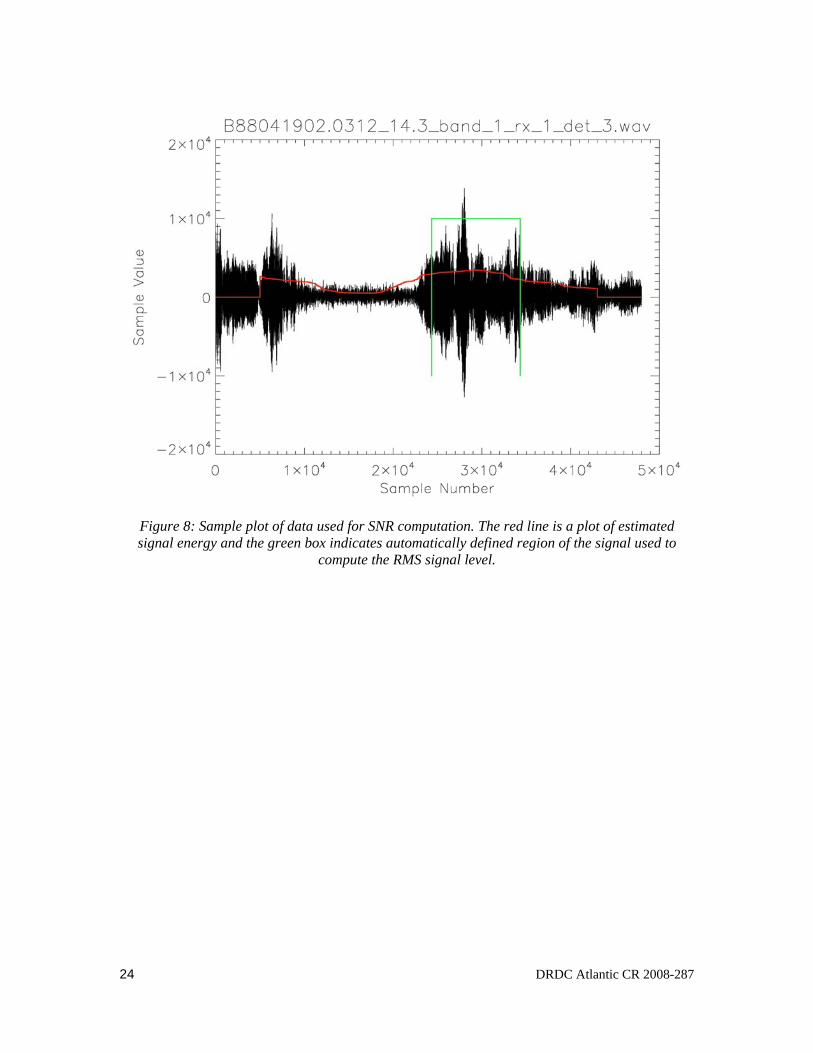
Figure 8: Sample plot of data used for SNR computation. The red line is a plot of estimated signal energy and the green box indicates automatically defined region of the signal used to
compute the RMS signal level.
24 DRDC Atlantic CR 2008-287
4 Classification
This section documents the categories selected for classification of the detected marine mammal vocalizations and the methodology used to perform the classification work.
4.1 Classification Options
Some time was spent deciding the range of possible classification options to use. This was done by exploring the data, consulting with marine mammal experts, and consulting with the PA and selected TA. The general guidance provided for data selection was to find vocalizations that were:
• Aurally distinctive, within the range of human hearing, and ideally unique to a species
• Overlapped in frequency and duration with other vocalizations
• Were detected using transient processing that employs the Sentinel algorithm
During the initial analysis it was learned that Humpbacks will often vocalize in the form of a song that can be broken down into components. The component that represents a single vocalization with a clear period of silence before and after is designated a unit. The way that these units are assembled into songs varies by region and over time. Even the units themselves change, but they are generally considered the most reliable feature to use for classification. Annex A.2 contains a more complete discussion. It was also determined that the 40-60 millisecond (ms) break between Sperm whale clicks is due to environmental effects (multipath), but that a single click can contain characteristic information about the Sperm whale’s resonant cavity that was used to generate the click. Annex A.1 contains a more complete discussion of this topic.
After the initial analysis and discussion, ten primary classification categories were defined for the database:
• Bowhead
• Humpback 1 through 4
• Sperm Whale
• Right Whale 1 through 4
While secondary options included:
• Marine Mammal other – unidentified marine mammal
• Humpback other – a humpback unit not selected for categorization
• Non-target – environmental noise not created by a marine mammal
These categories provided an option for all possible detections except those that were caused by artefacts in the recording system (RF interference, hydrophone electronics, recording system start / stop, hydrophone bumps, etc.). These artefacts were ignored and not introduced into the database. A more detailed description of the ten primary classification categories follows.
DRDC Atlantic CR 2008-287 25
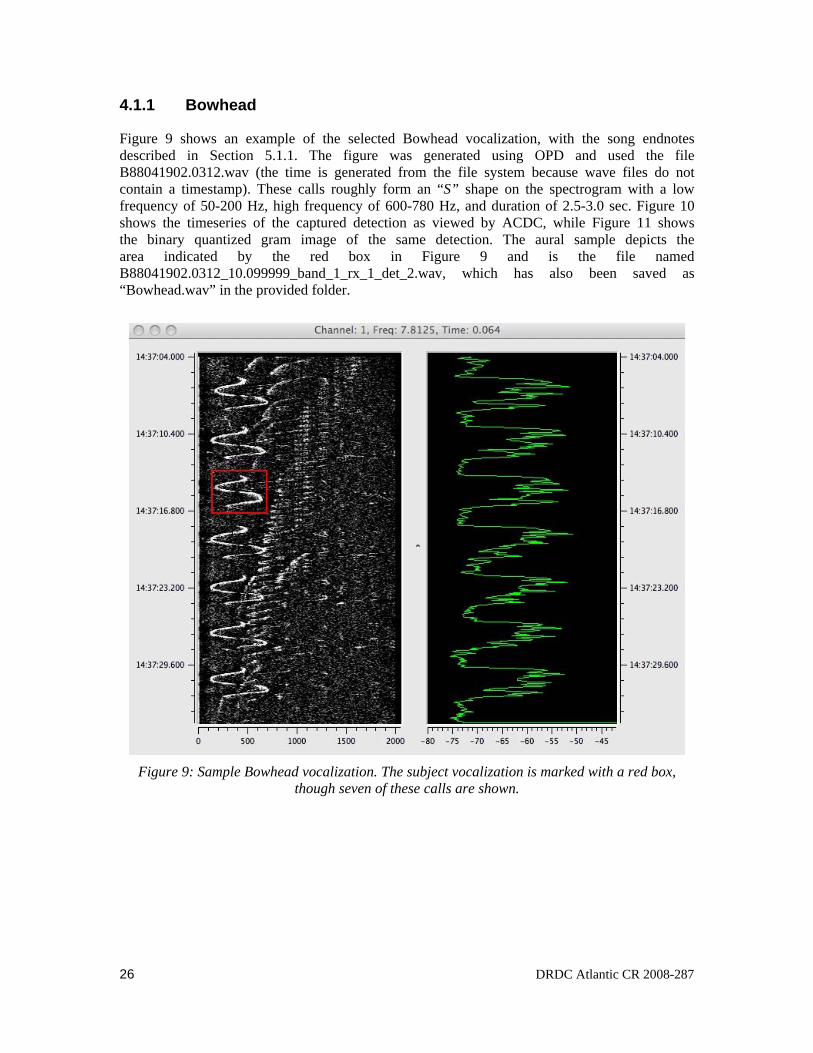
4.1.1 Bowhead
Figure 9 shows an example of the selected Bowhead vocalization, with the song endnotes described in Section 5.1.1. The figure was generated using OPD and used the file B88041902.0312.wav (the time is generated from the file system because wave files do not contain a timestamp). These calls roughly form an “S” shape on the spectrogram with a low frequency of 50-200 Hz, high frequency of 600-780 Hz, and duration of 2.5-3.0 sec. Figure 10 shows the timeseries of the captured detection as viewed by ACDC, while Figure 11 shows the binary quantized gram image of the same detection. The aural sample depicts the area indicated by the red box in Figure 9 and is the file named B88041902.0312_10.099999_band_1_rx_1_det_2.wav, which has also been saved as “Bowhead.wav” in the provided folder.
Figure 9: Sample Bowhead vocalization. The subject vocalization is marked with a red box, though seven of these calls are shown.
26 DRDC Atlantic CR 2008-287
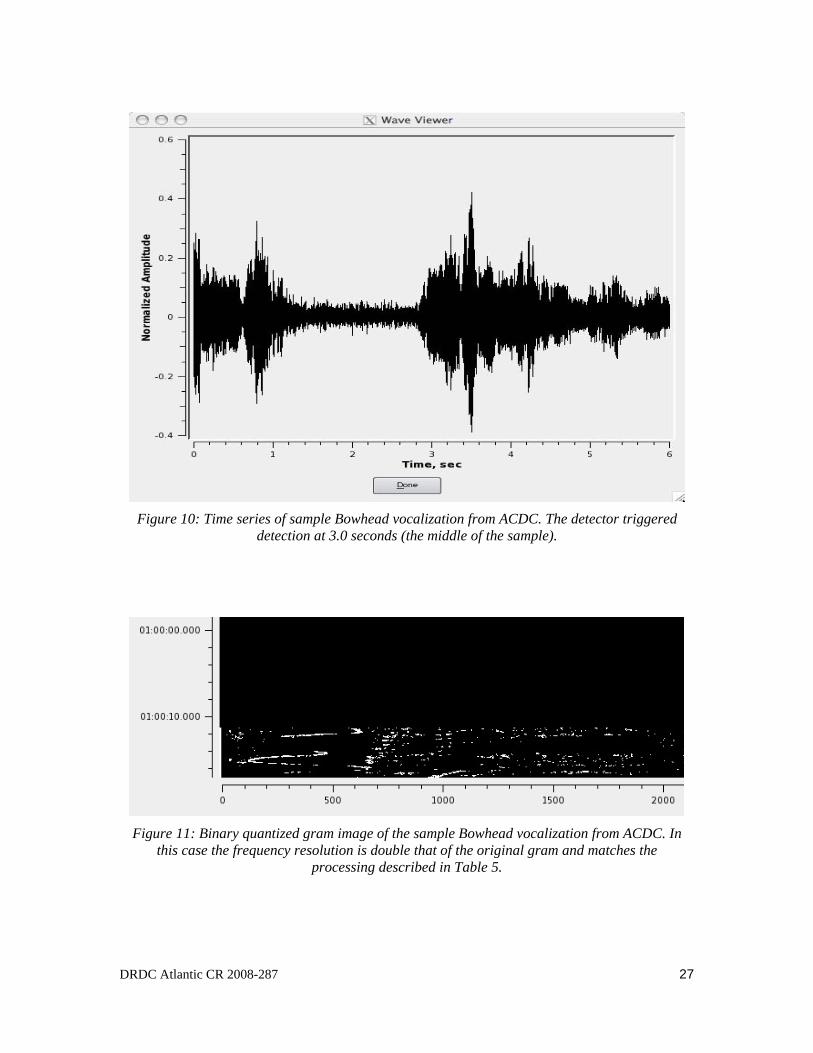
Figure 10: Time series of sample Bowhead vocalization from ACDC. The detector triggered detection at 3.0 seconds (the middle of the sample).
Figure 11: Binary quantized gram image of the sample Bowhead vocalization from ACDC. In this case the frequency resolution is double that of the original gram and matches the
processing described in Table 5.
DRDC Atlantic CR 2008-287 27
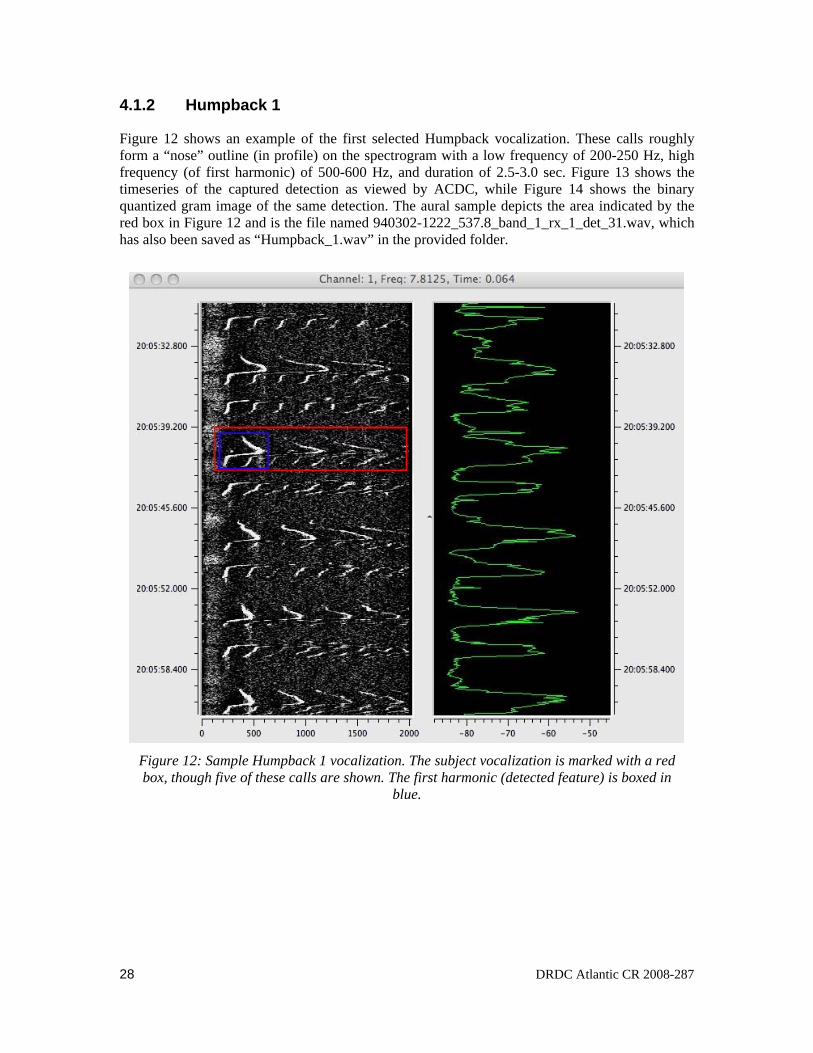
4.1.2 Humpback 1
Figure 12 shows an example of the first selected Humpback vocalization. These calls roughly form a “nose” outline (in profile) on the spectrogram with a low frequency of 200-250 Hz, high frequency (of first harmonic) of 500-600 Hz, and duration of 2.5-3.0 sec. Figure 13 shows the timeseries of the captured detection as viewed by ACDC, while Figure 14 shows the binary quantized gram image of the same detection. The aural sample depicts the area indicated by the red box in Figure 12 and is the file named 940302-1222_537.8_band_1_rx_1_det_31.wav, which has also been saved as “Humpback_1.wav” in the provided folder.
Figure 12: Sample Humpback 1 vocalization. The subject vocalization is marked with a red box, though five of these calls are shown. The first harmonic (detected feature) is boxed in
blue.
28 DRDC Atlantic CR 2008-287
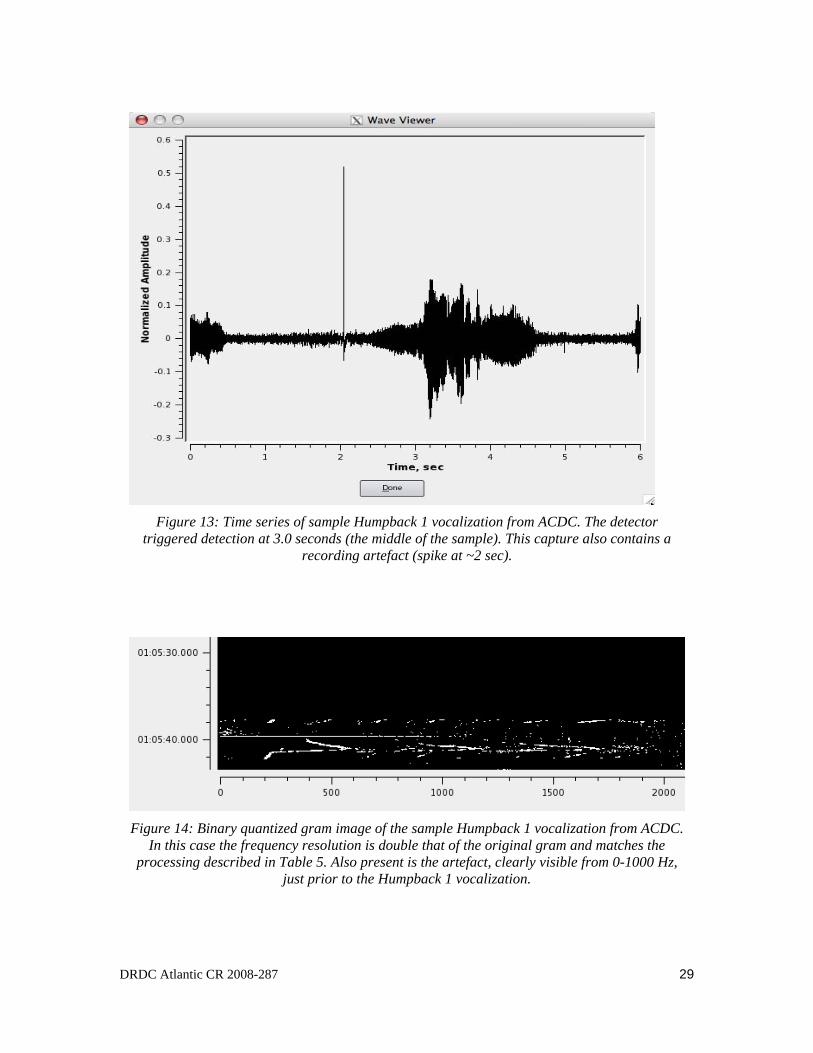
Figure 13: Time series of sample Humpback 1 vocalization from ACDC. The detector triggered detection at 3.0 seconds (the middle of the sample). This capture also contains a
recording artefact (spike at ~2 sec).
Figure 14: Binary quantized gram image of the sample Humpback 1 vocalization from ACDC. In this case the frequency resolution is double that of the original gram and matches the
processing described in Table 5. Also present is the artefact, clearly visible from 0-1000 Hz, just prior to the Humpback 1 vocalization.
DRDC Atlantic CR 2008-287 29
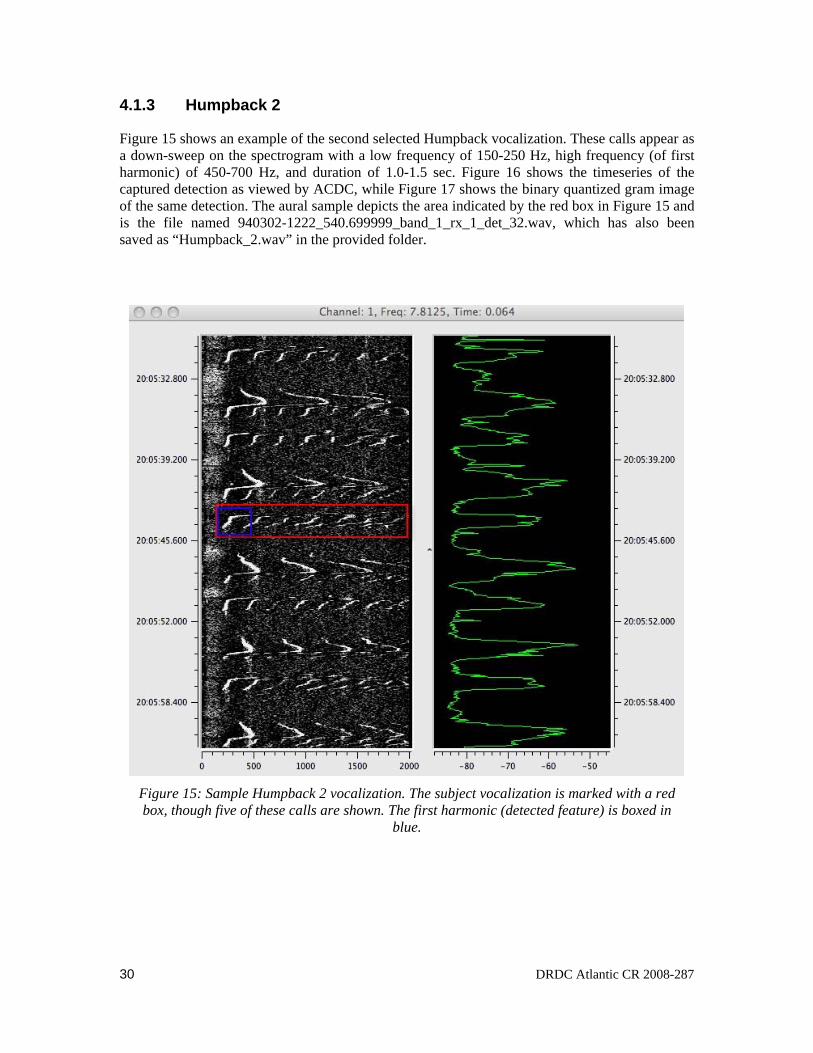
4.1.3 Humpback 2
Figure 15 shows an example of the second selected Humpback vocalization. These calls appear as a down-sweep on the spectrogram with a low frequency of 150-250 Hz, high frequency (of first harmonic) of 450-700 Hz, and duration of 1.0-1.5 sec. Figure 16 shows the timeseries of the captured detection as viewed by ACDC, while Figure 17 shows the binary quantized gram image of the same detection. The aural sample depicts the area indicated by the red box in Figure 15 and is the file named 940302-1222_540.699999_band_1_rx_1_det_32.wav, which has also been saved as “Humpback_2.wav” in the provided folder.
Figure 15: Sample Humpback 2 vocalization. The subject vocalization is marked with a red box, though five of these calls are shown. The first harmonic (detected feature) is boxed in
blue.
30 DRDC Atlantic CR 2008-287
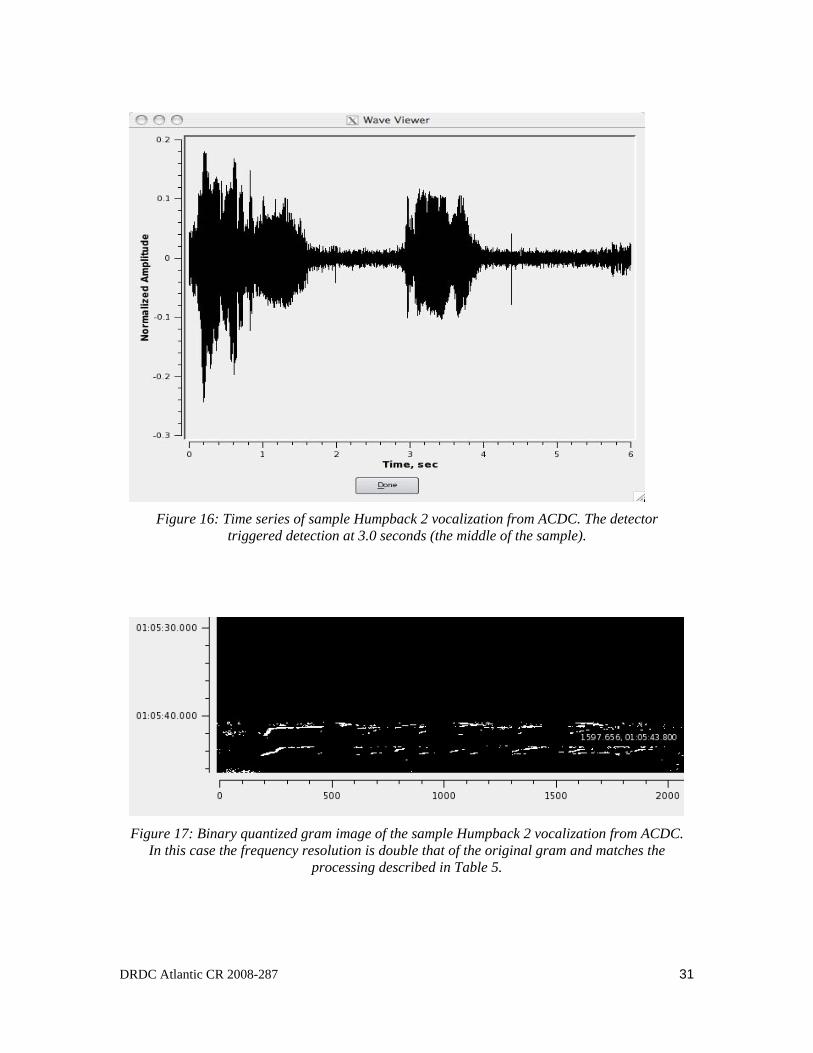
Figure 16: Time series of sample Humpback 2 vocalization from ACDC. The detector triggered detection at 3.0 seconds (the middle of the sample).
Figure 17: Binary quantized gram image of the sample Humpback 2 vocalization from ACDC. In this case the frequency resolution is double that of the original gram and matches the
processing described in Table 5.
DRDC Atlantic CR 2008-287 31
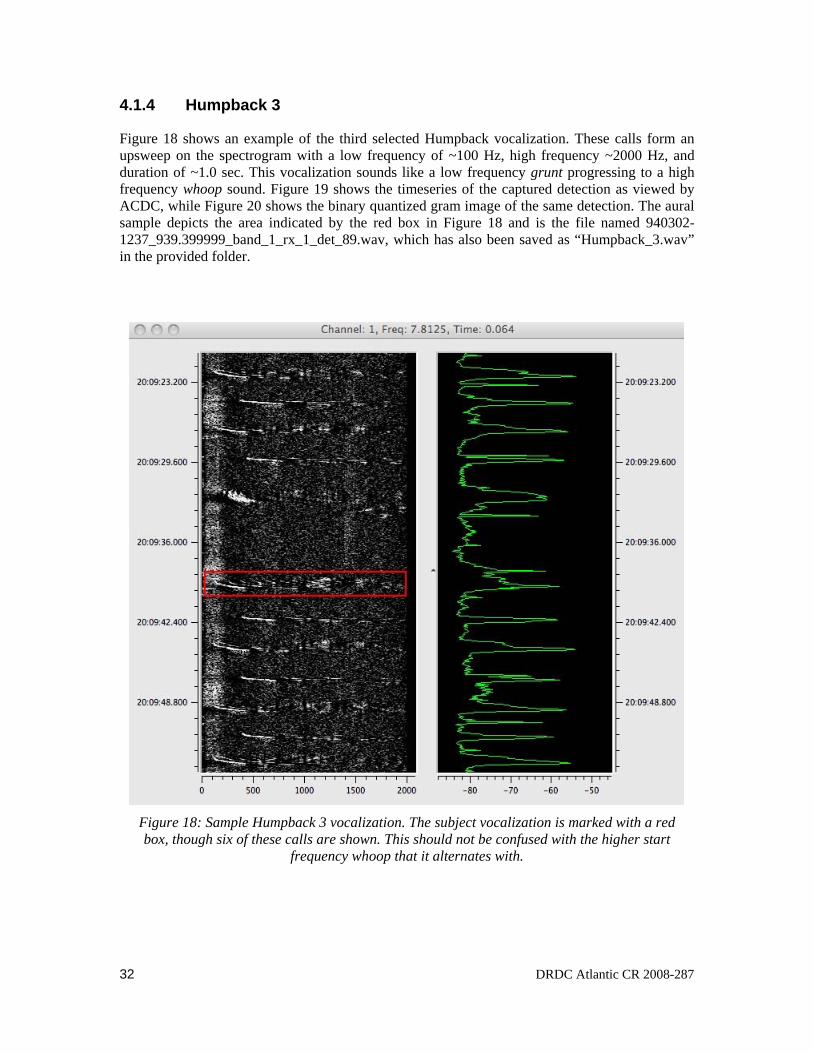
4.1.4 Humpback 3
Figure 18 shows an example of the third selected Humpback vocalization. These calls form an upsweep on the spectrogram with a low frequency of ~100 Hz, high frequency ~2000 Hz, and duration of ~1.0 sec. This vocalization sounds like a low frequency grunt progressing to a high frequency whoop sound. Figure 19 shows the timeseries of the captured detection as viewed by ACDC, while Figure 20 shows the binary quantized gram image of the same detection. The aural sample depicts the area indicated by the red box in Figure 18 and is the file named 940302-1237_939.399999_band_1_rx_1_det_89.wav, which has also been saved as “Humpback_3.wav” in the provided folder.
Figure 18: Sample Humpback 3 vocalization. The subject vocalization is marked with a red box, though six of these calls are shown. This should not be confused with the higher start
frequency whoop that it alternates with.
32 DRDC Atlantic CR 2008-287
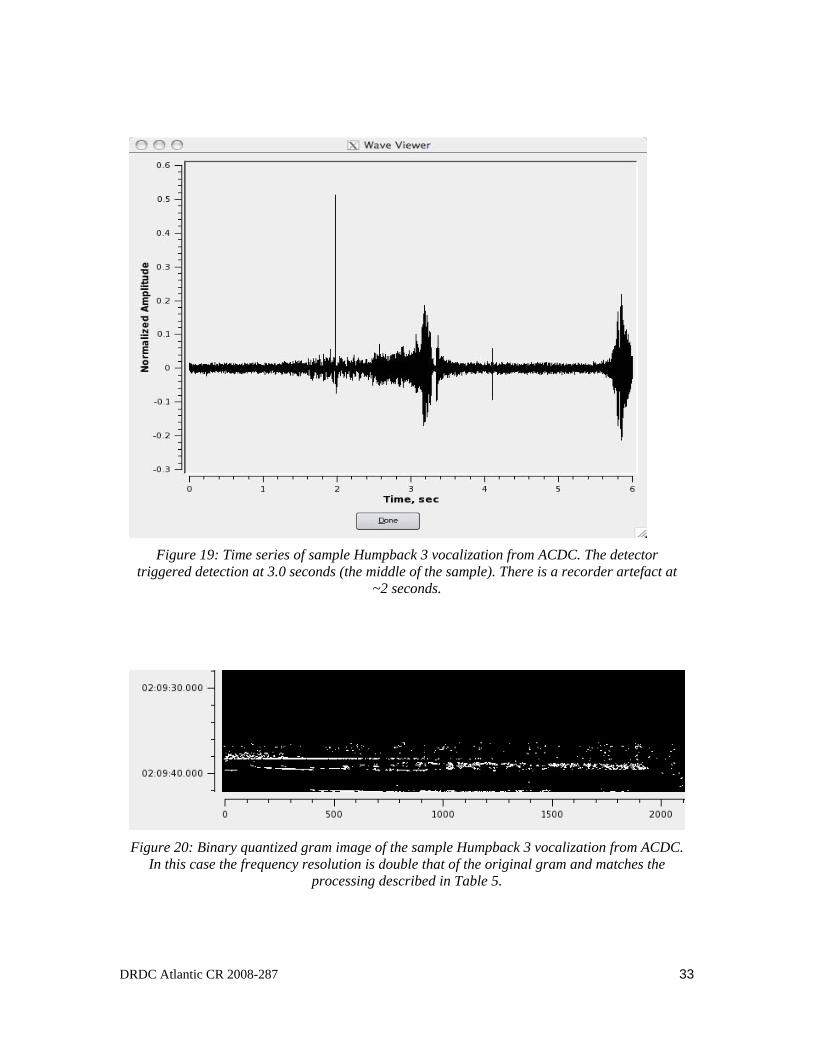
Figure 19: Time series of sample Humpback 3 vocalization from ACDC. The detector triggered detection at 3.0 seconds (the middle of the sample). There is a recorder artefact at
~2 seconds.
Figure 20: Binary quantized gram image of the sample Humpback 3 vocalization from ACDC. In this case the frequency resolution is double that of the original gram and matches the
processing described in Table 5.
DRDC Atlantic CR 2008-287 33
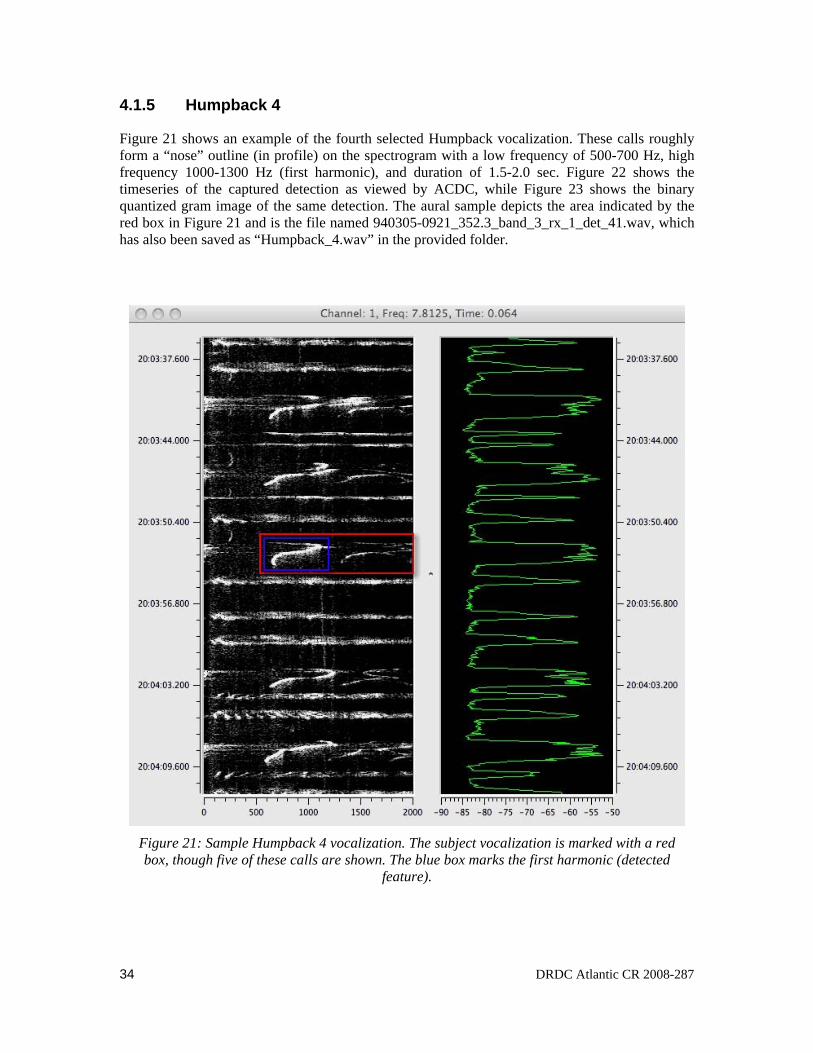
4.1.5 Humpback 4
Figure 21 shows an example of the fourth selected Humpback vocalization. These calls roughly form a “nose” outline (in profile) on the spectrogram with a low frequency of 500-700 Hz, high frequency 1000-1300 Hz (first harmonic), and duration of 1.5-2.0 sec. Figure 22 shows the timeseries of the captured detection as viewed by ACDC, while Figure 23 shows the binary quantized gram image of the same detection. The aural sample depicts the area indicated by the red box in Figure 21 and is the file named 940305-0921_352.3_band_3_rx_1_det_41.wav, which has also been saved as “Humpback_4.wav” in the provided folder.
Figure 21: Sample Humpback 4 vocalization. The subject vocalization is marked with a red box, though five of these calls are shown. The blue box marks the first harmonic (detected
feature).
34 DRDC Atlantic CR 2008-287
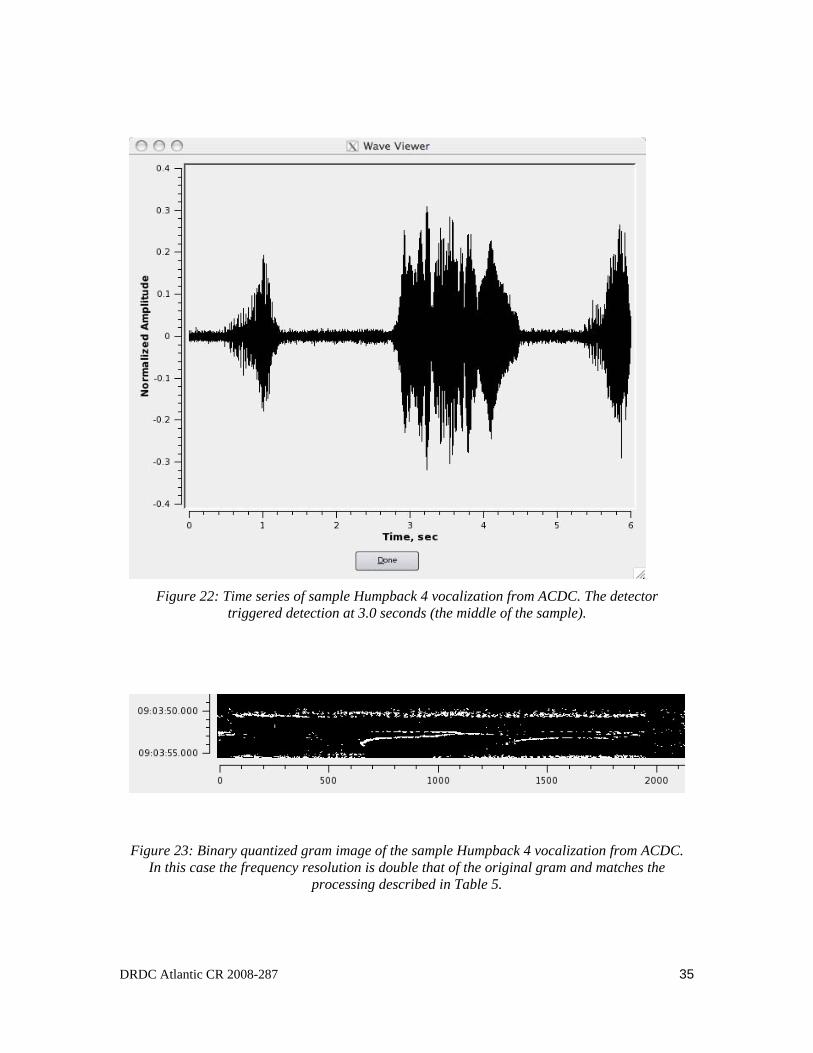
Figure 22: Time series of sample Humpback 4 vocalization from ACDC. The detector triggered detection at 3.0 seconds (the middle of the sample).
Figure 23: Binary quantized gram image of the sample Humpback 4 vocalization from ACDC. In this case the frequency resolution is double that of the original gram and matches the
processing described in Table 5.
DRDC Atlantic CR 2008-287 35
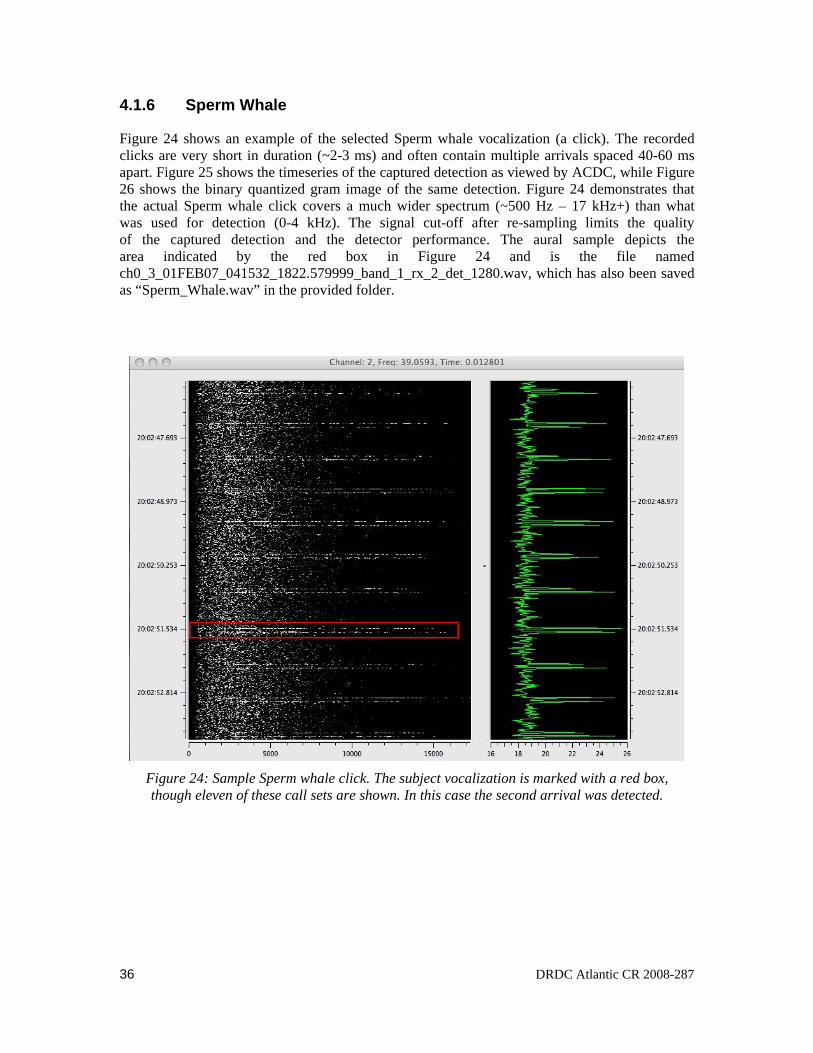
4.1.6 Sperm Whale
Figure 24 shows an example of the selected Sperm whale vocalization (a click). The recorded clicks are very short in duration (~2-3 ms) and often contain multiple arrivals spaced 40-60 ms apart. Figure 25 shows the timeseries of the captured detection as viewed by ACDC, while Figure 26 shows the binary quantized gram image of the same detection. Figure 24 demonstrates that the actual Sperm whale click covers a much wider spectrum (~500 Hz – 17 kHz+) than what was used for detection (0-4 kHz). The signal cut-off after re-sampling limits the quality of the captured detection and the detector performance. The aural sample depicts the area indicated by the red box in Figure 24 and is the file named ch0_3_01FEB07_041532_1822.579999_band_1_rx_2_det_1280.wav, which has also been saved as “Sperm_Whale.wav” in the provided folder.
Figure 24: Sample Sperm whale click. The subject vocalization is marked with a red box, though eleven of these call sets are shown. In this case the second arrival was detected.
36 DRDC Atlantic CR 2008-287
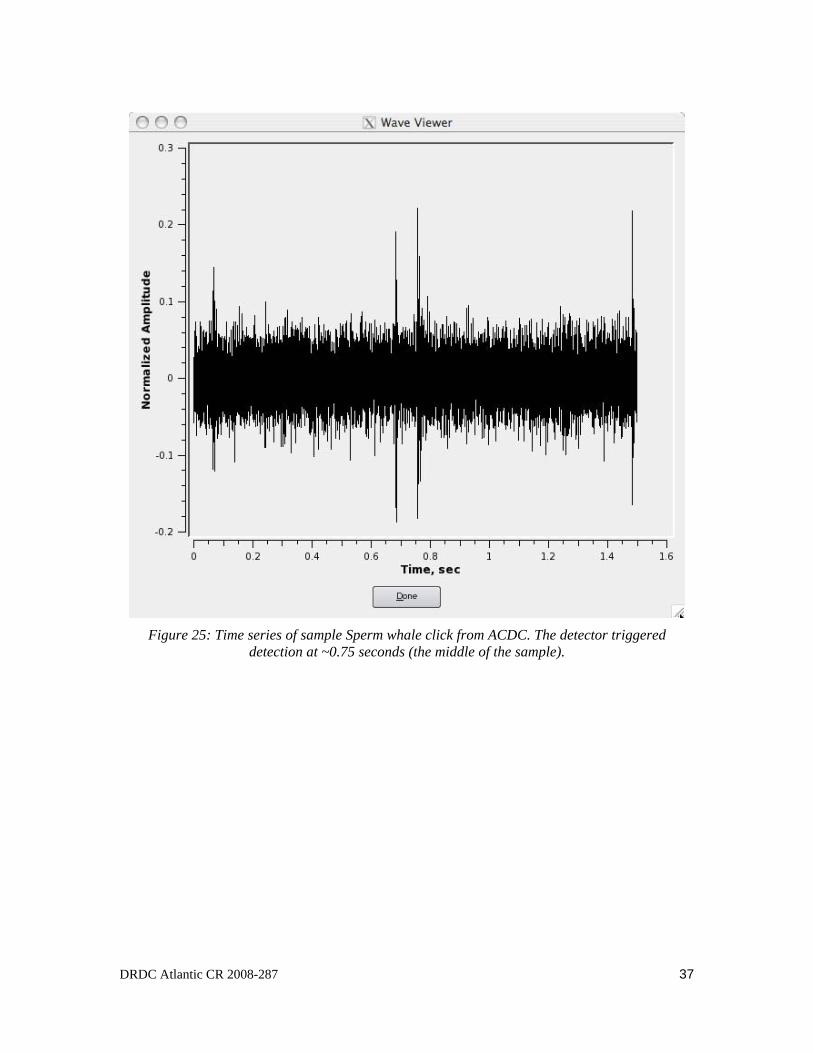
Figure 25: Time series of sample Sperm whale click from ACDC. The detector triggered detection at ~0.75 seconds (the middle of the sample).
DRDC Atlantic CR 2008-287 37
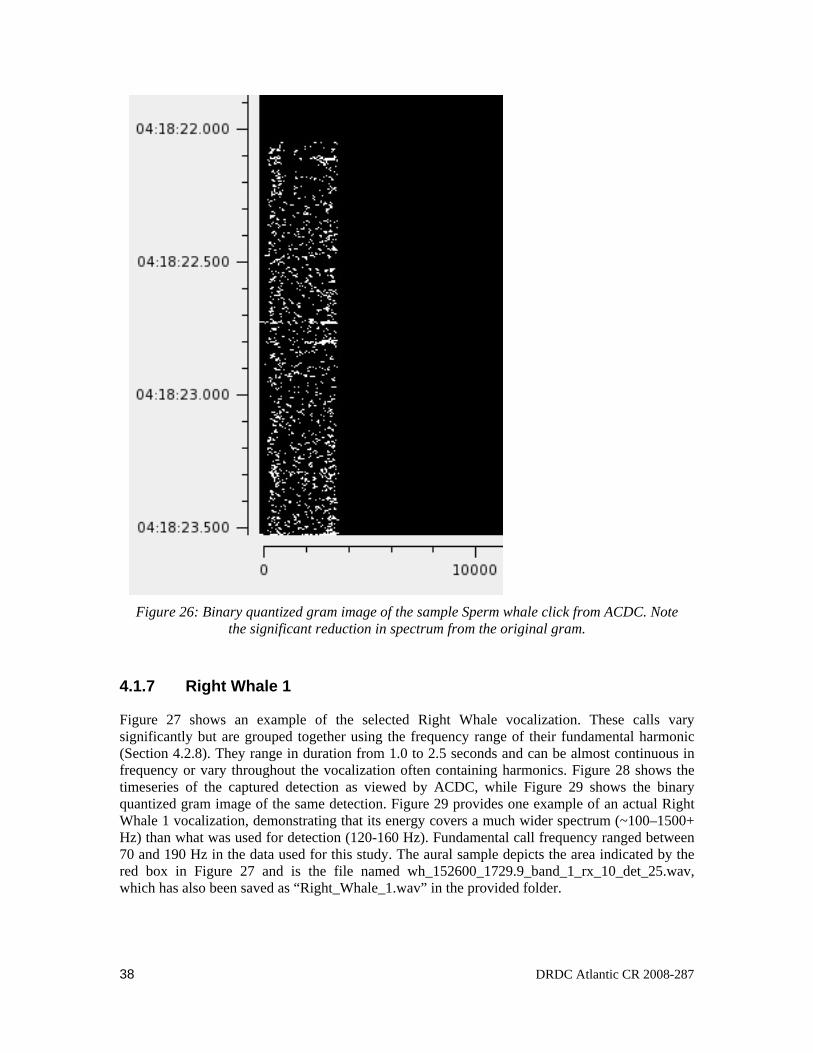
Figure 26: Binary quantized gram image of the sample Sperm whale click from ACDC. Note the significant reduction in spectrum from the original gram.
4.1.7 Right Whale 1
Figure 27 shows an example of the selected Right Whale vocalization. These calls vary significantly but are grouped together using the frequency range of their fundamental harmonic (Section 4.2.8). They range in duration from 1.0 to 2.5 seconds and can be almost continuous in frequency or vary throughout the vocalization often containing harmonics. Figure 28 shows the timeseries of the captured detection as viewed by ACDC, while Figure 29 shows the binary quantized gram image of the same detection. Figure 29 provides one example of an actual Right Whale 1 vocalization, demonstrating that its energy covers a much wider spectrum (~100–1500+ Hz) than what was used for detection (120-160 Hz). Fundamental call frequency ranged between 70 and 190 Hz in the data used for this study. The aural sample depicts the area indicated by the red box in Figure 27 and is the file named wh_152600_1729.9_band_1_rx_10_det_25.wav, which has also been saved as “Right_Whale_1.wav” in the provided folder.
38 DRDC Atlantic CR 2008-287
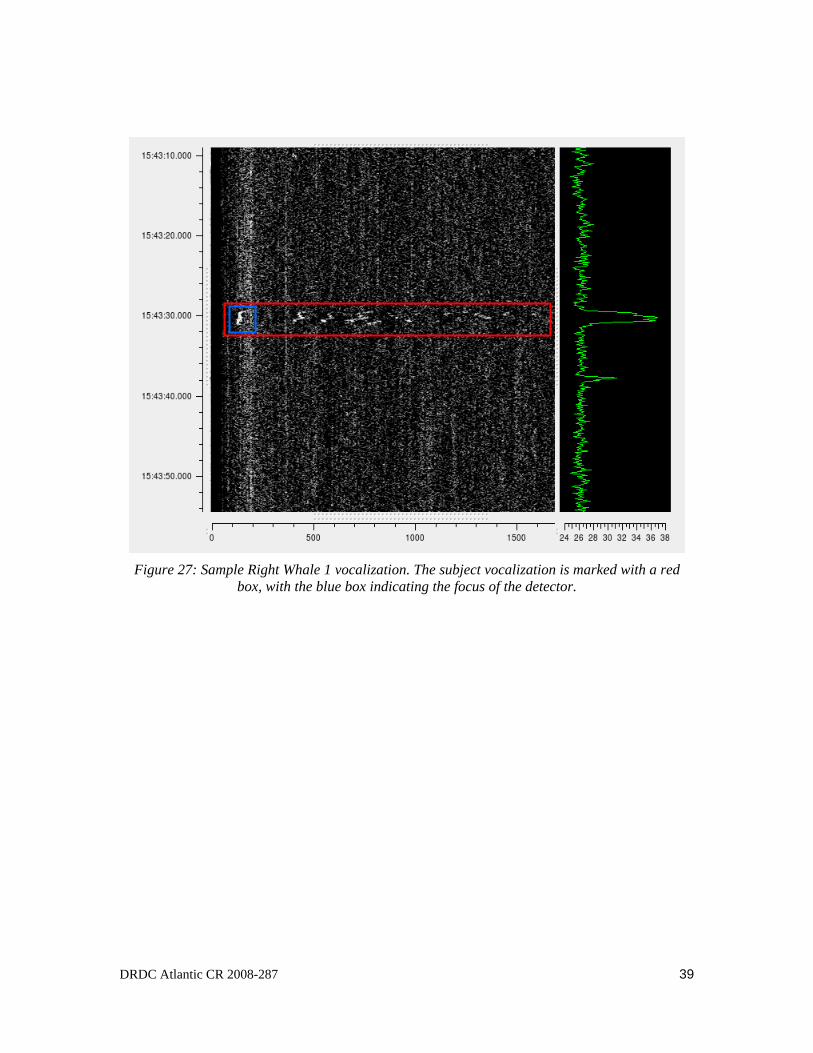
Figure 27: Sample Right Whale 1 vocalization. The subject vocalization is marked with a red box, with the blue box indicating the focus of the detector.
DRDC Atlantic CR 2008-287 39
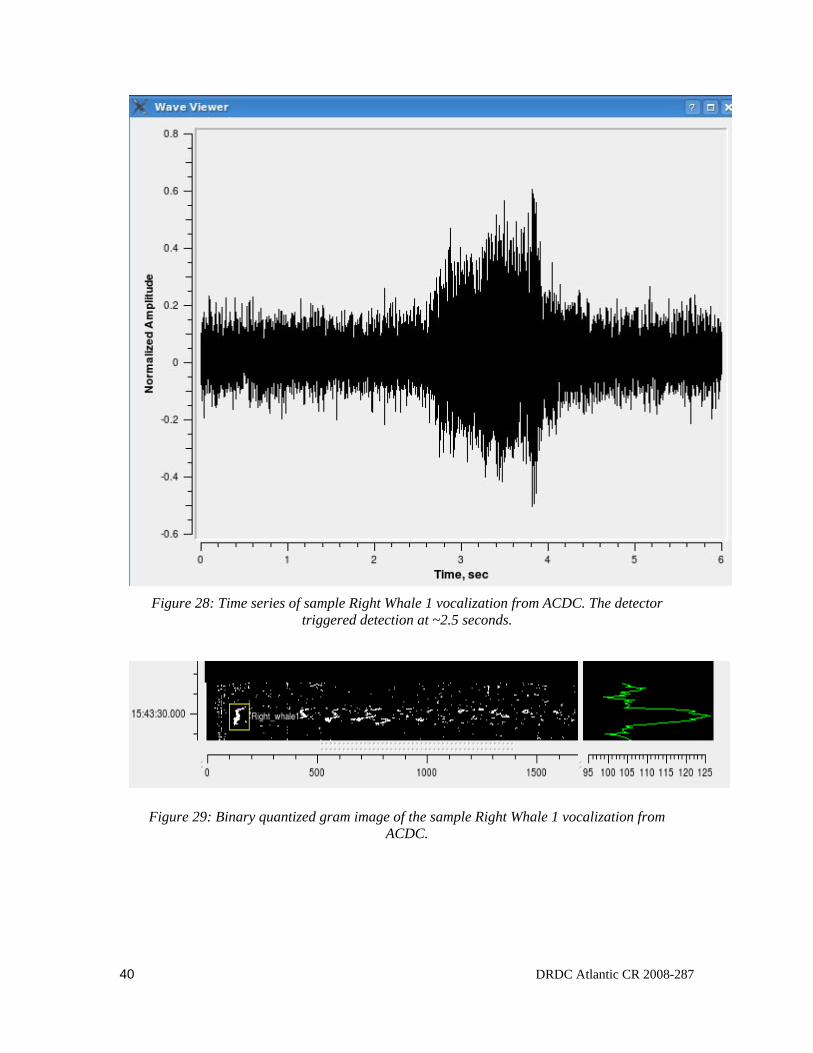
Figure 28: Time series of sample Right Whale 1 vocalization from ACDC. The detector triggered detection at ~2.5 seconds.
Figure 29: Binary quantized gram image of the sample Right Whale 1 vocalization from ACDC.
40 DRDC Atlantic CR 2008-287
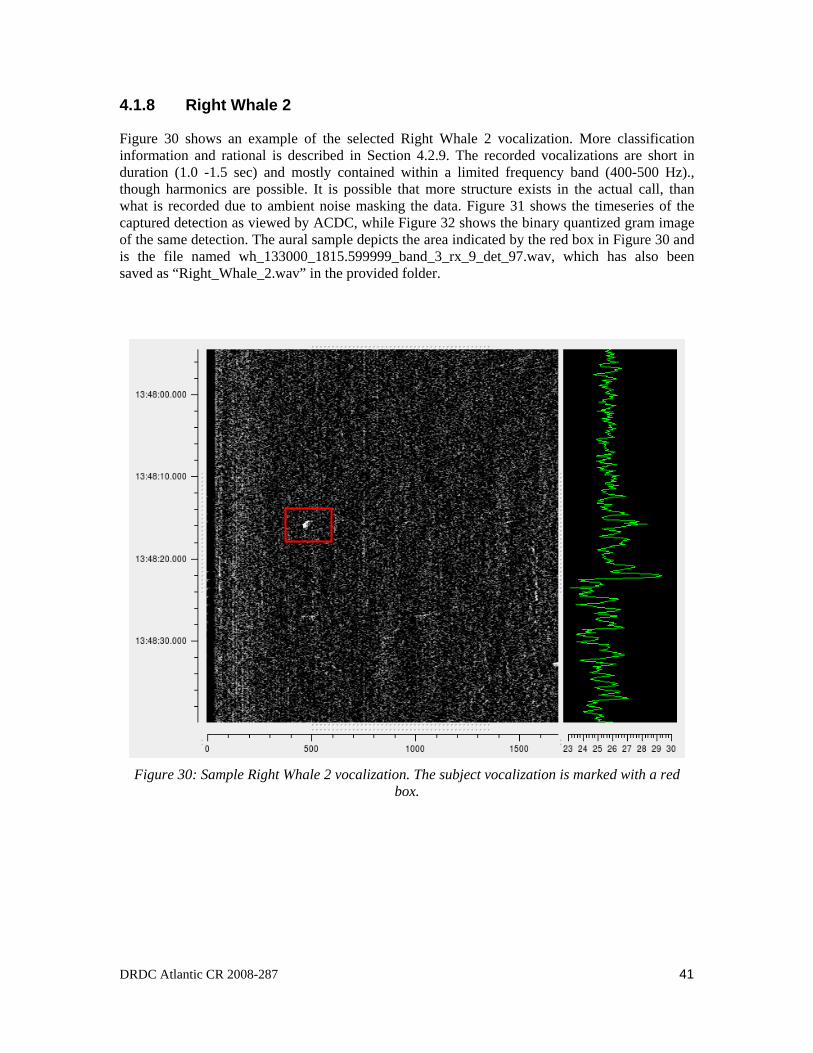
4.1.8 Right Whale 2
Figure 30 shows an example of the selected Right Whale 2 vocalization. More classification information and rational is described in Section 4.2.9. The recorded vocalizations are short in duration (1.0 -1.5 sec) and mostly contained within a limited frequency band (400-500 Hz)., though harmonics are possible. It is possible that more structure exists in the actual call, than what is recorded due to ambient noise masking the data. Figure 31 shows the timeseries of the captured detection as viewed by ACDC, while Figure 32 shows the binary quantized gram image of the same detection. The aural sample depicts the area indicated by the red box in Figure 30 and is the file named wh_133000_1815.599999_band_3_rx_9_det_97.wav, which has also been saved as “Right_Whale_2.wav” in the provided folder.
Figure 30: Sample Right Whale 2 vocalization. The subject vocalization is marked with a red box.
DRDC Atlantic CR 2008-287 41
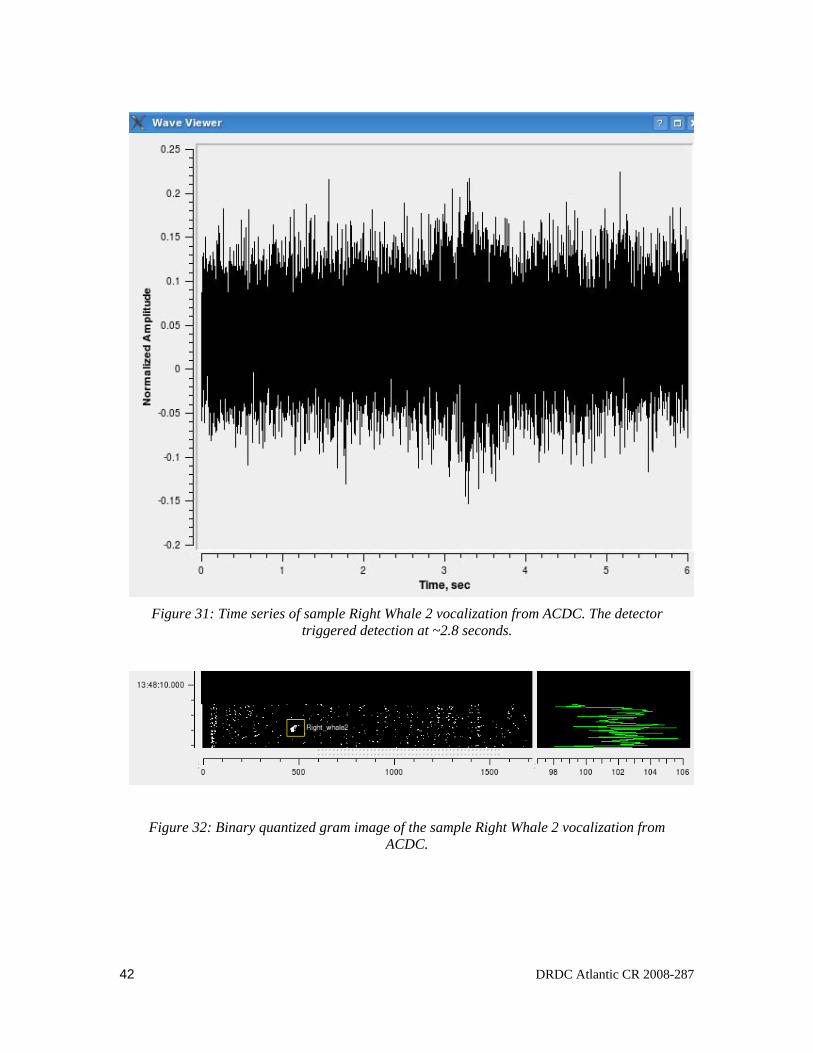
Figure 31: Time series of sample Right Whale 2 vocalization from ACDC. The detector triggered detection at ~2.8 seconds.
Figure 32: Binary quantized gram image of the sample Right Whale 2 vocalization from ACDC.
42 DRDC Atlantic CR 2008-287
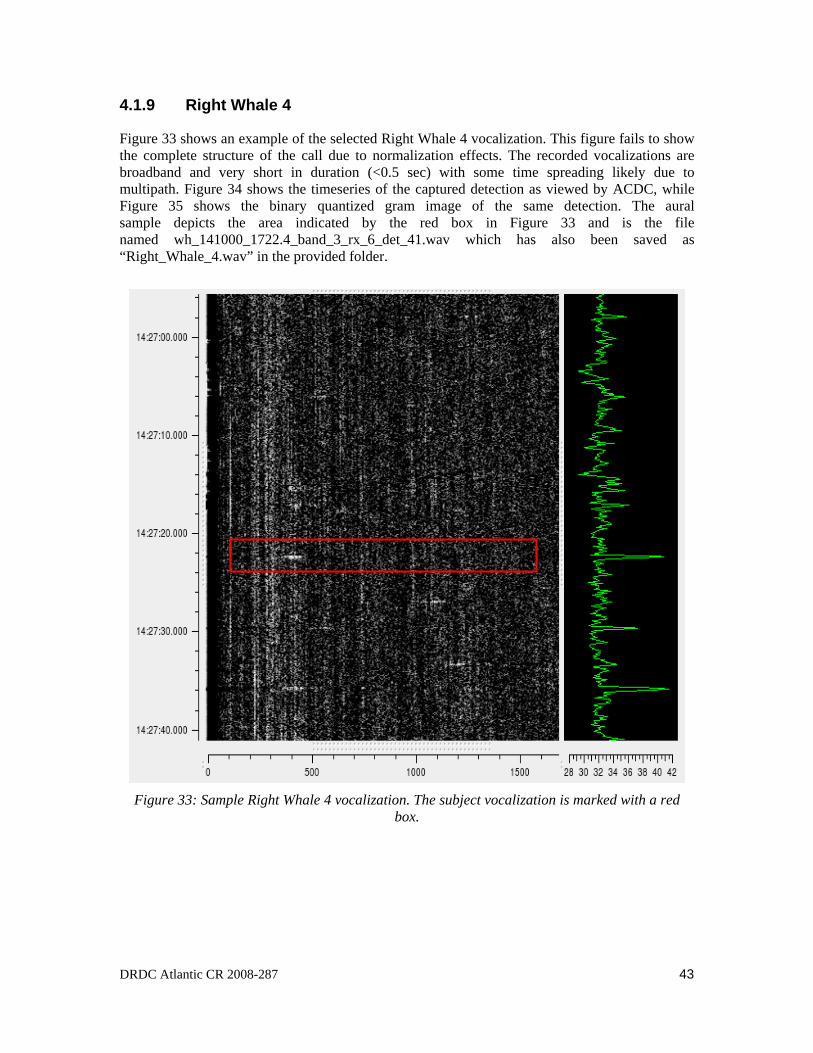
4.1.9 Right Whale 4
Figure 33 shows an example of the selected Right Whale 4 vocalization. This figure fails to show the complete structure of the call due to normalization effects. The recorded vocalizations are broadband and very short in duration (<0.5 sec) with some time spreading likely due to multipath. Figure 34 shows the timeseries of the captured detection as viewed by ACDC, while Figure 35 shows the binary quantized gram image of the same detection. The aural sample depicts the area indicated by the red box in Figure 33 and is the file named wh_141000_1722.4_band_3_rx_6_det_41.wav which has also been saved as “Right_Whale_4.wav” in the provided folder.
Figure 33: Sample Right Whale 4 vocalization. The subject vocalization is marked with a red box.
DRDC Atlantic CR 2008-287 43
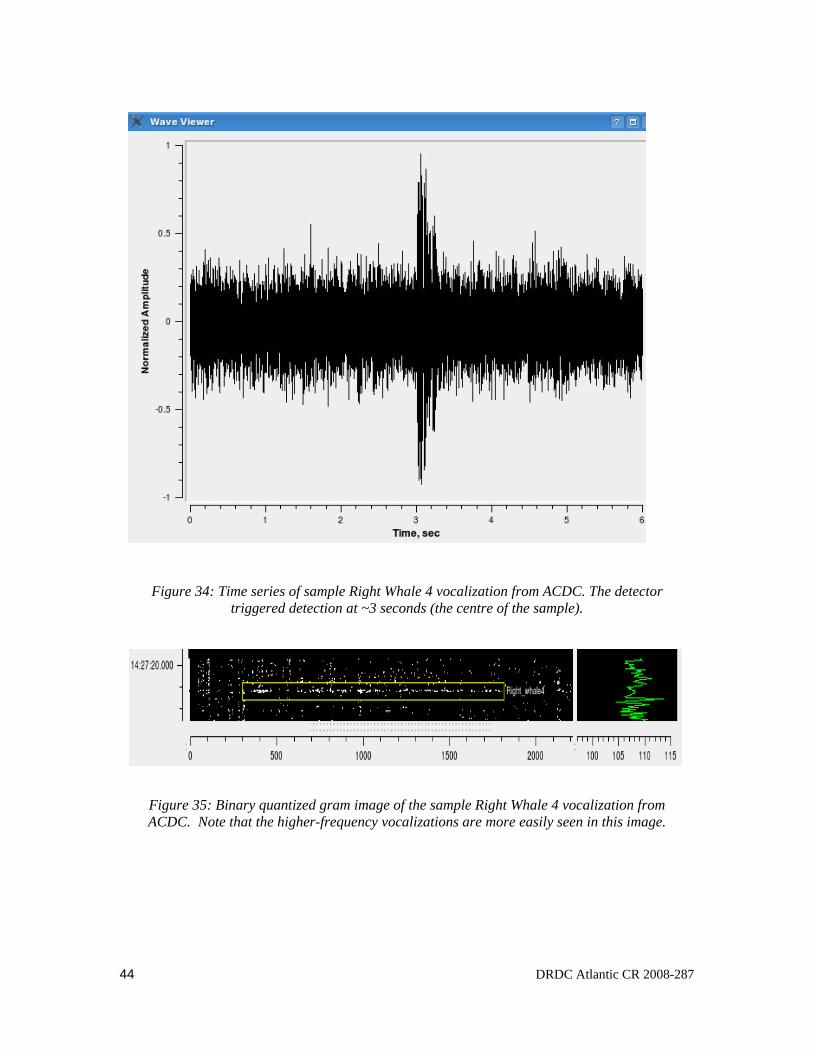
Figure 34: Time series of sample Right Whale 4 vocalization from ACDC. The detector triggered detection at ~3 seconds (the centre of the sample).
Figure 35: Binary quantized gram image of the sample Right Whale 4 vocalization from ACDC. Note that the higher-frequency vocalizations are more easily seen in this image.
44 DRDC Atlantic CR 2008-287
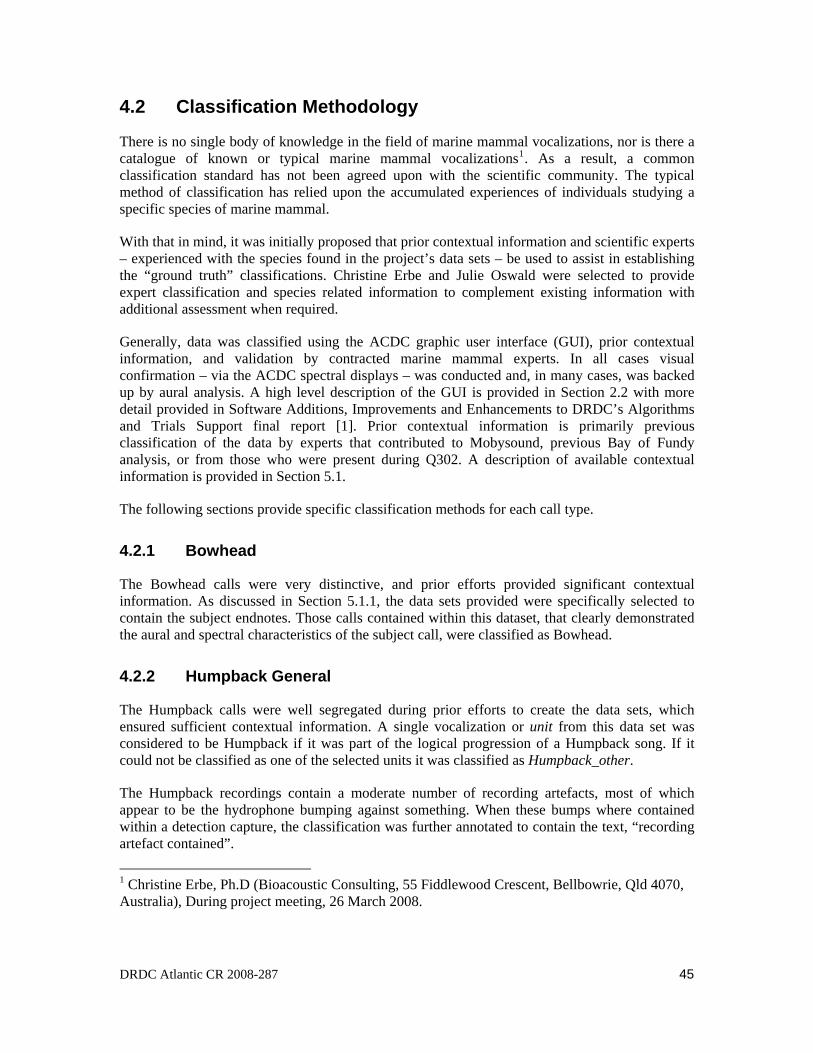
4.2 Classification Methodology
There is no single body of knowledge in the field of marine mammal vocalizations, nor is there a catalogue of known or typical marine mammal vocalizations1. As a result, a common classification standard has not been agreed upon with the scientific community. The typical method of classification has relied upon the accumulated experiences of individuals studying a specific species of marine mammal.
With that in mind, it was initially proposed that prior contextual information and scientific experts – experienced with the species found in the project’s data sets – be used to assist in establishing the “ground truth” classifications. Christine Erbe and Julie Oswald were selected to provide expert classification and species related information to complement existing information with additional assessment when required.
Generally, data was classified using the ACDC graphic user interface (GUI), prior contextual information, and validation by contracted marine mammal experts. In all cases visual confirmation – via the ACDC spectral displays – was conducted and, in many cases, was backed up by aural analysis. A high level description of the GUI is provided in Section 2.2 with more detail provided in Software Additions, Improvements and Enhancements to DRDC’s Algorithms and Trials Support final report [1]. Prior contextual information is primarily previous classification of the data by experts that contributed to Mobysound, previous Bay of Fundy analysis, or from those who were present during Q302. A description of available contextual information is provided in Section 5.1.
The following sections provide specific classification methods for each call type.
4.2.1 Bowhead
The Bowhead calls were very distinctive, and prior efforts provided significant contextual information. As discussed in Section 5.1.1, the data sets provided were specifically selected to contain the subject endnotes. Those calls contained within this dataset, that clearly demonstrated the aural and spectral characteristics of the subject call, were classified as Bowhead.
4.2.2 Humpback General
The Humpback calls were well segregated during prior efforts to create the data sets, which ensured sufficient contextual information. A single vocalization or unit from this data set was considered to be Humpback if it was part of the logical progression of a Humpback song. If it could not be classified as one of the selected units it was classified as Humpback_other.
The Humpback recordings contain a moderate number of recording artefacts, most of which appear to be the hydrophone bumping against something. When these bumps where contained within a detection capture, the classification was further annotated to contain the text, “recording artefact contained”.
1 Christine Erbe, Ph.D (Bioacoustic Consulting, 55 Fiddlewood Crescent, Bellbowrie, Qld 4070, Australia), During project meeting, 26 March 2008.
DRDC Atlantic CR 2008-287 45
4.2.3 Humpback 1
The Humpback 1 call is quite distinctive, though the frequency extent and the spectral shape of the call varied substantially. If a detected unit exhibited the general spectral and aural characteristics of a Humpback 1 call, within the bounds described in Section 4.1.2, it was classified as such. Some calls classified as Humpback_other were further annotated as being between a Humpback 1 and Humpback 4 call due to their frequency extent. Researchers may wish to examine these calls and determine if a broader, or narrower, classification range is appropriate.
4.2.4 Humpback 2
The Humpback 2 call was quite distinctive as a down sweep within the bounds described in Section 4.1.3. A small inflection was sometimes observed on the spectrogram, but not detected aurally. In this case it was still classified as a Humpback 2. If the inflection could be heard, it was classified as a Humpback_other.
4.2.5 Humpback 3
The Humpback 3 call was aurally distinctive because of the aural “grunt” which rapidly progressed into a whoop sound. Spectrally the energy started at a low frequency as described in Section 4.1.4. If the “grunt” did not precede the whoop sound it was classified as Humpback_other and further annotated to contain a whoop.
4.2.6 Humpback 4
The Humpback 4 call is quite distinctive though the frequency extent and the spectral shape of the call varied substantially. If a detected unit exhibited the general spectral and aural characteristics of a Humpback 4 call, within the bounds described in Section 4.1.5, it was classified as such. Although similar in visual appearance to a Humpback 1, on spectral displays, the entire vocalization lies in a higher frequency band. This makes it aurally distinctive from a Humpback 1 vocalization as well. Some calls classified as Humpback_other were further annotated as being between a Humpback 1 and Humpback 4 call due to their frequency extent; the calls fell between the parameters described for both Humpback 1 and Humpback 4 calls. Researchers may wish to examine these calls and determine if a broader, or narrower, classification range is appropriate.
4.2.7 Sperm Whale
The Sperm whale clicks are both aurally and visually distinctive. The data sets they originated from contain many, nearly identical, clicks, which were recorded in a region where Sperm whales were expected (Atlantic Undersea Test and Evaluation Center (AUTEC) Range). AUTEC range staff also classified the sounds as being from a Sperm whale during the detection period. Only distinctive clicks from this data set were classified as Sperm whale clicks.
46 DRDC Atlantic CR 2008-287
4.2.8 Right Whale 1
The Right Whale 1 calls are low frequency moans and are readily recognized using aural and visual cues, though they range in duration and type (i.e. constant frequency or upsweep). Some of these differences appear to be due to SNR and may be due to a masking of part of the call. The main criteria for classification were that the call fit within the narrow frequency range and that it sounded like a moan.
4.2.9 Right Whale 2
The Right Whale 2 calls are mid-frequency and are readily recognized using aural and visual cues, though they range in duration and type (i.e. constant frequency or modulating). Some of these differences appear to be due to SNR and may be due to a masking of part of the call. The main criteria for classification were that the call fit within the narrow frequency range and that it sounded like a cry.
4.2.10 Right Whale 3
The Right Whale 3 calls were grouped with Right Whale 2 calls. This call type was selected during initial analysis, but further analysis during classification revealed that this call was the second harmonic of a Right Whale 2 call where the first harmonic was masked by ambient noise. Aural listening and the presence of a 3rd harmonic that proves the fundamental is in the range of a Right Whale 2 call reinforced this assertion.
4.2.11 Right Whale 4
The Right Whale 4 calls are short-duration broadband calls that are readily recognized using aural and visual cues. These calls sound like a knock or bang often heard in a series due to multipath effects from different path lengths. These sounds are longer in duration than sperm whale clicks with a more ‘hollow’ sound possibly due to reverberation. Many of the detected calls are low in SNR. Higher SNR versions of the call have been described as having a shotgun like sound.
4.2.12 Marine Mammal Other
In some recordings, especially during Bowhead classification, a sound that is representative of a marine mammal sound in duration and aural characteristics was heard, but did not fall within the selected ranges, nor did it fall within a running Bowhead or Humpback song. In these cases a classification of marine mammal other was selected.
DRDC Atlantic CR 2008-287 47
5 Classification Database Description
This section provides a detailed explanation of the data origins and the resulting database of marine mammal vocalizations that can be used to support classification research.
5.1 Input Data Descriptions
This section provides a copy of any information that was provided with the datasets for ease of reference. Copies of the actual data must be obtained from Mobysound due to copyright limitations.
5.1.1 Bowhead – Mobysound
The information contained in this section was obtained from the Mobysound website: http://cetus.pmel.noaa.gov/MobySound/cetacea/bowhead-1/README-bowhead-1.txt.
These were made in April 1988 off the coast of Point Barrow, Alaska. Sounds were recorded by homemade hydrophones using Sippican transducer elements, and transmitted to a TEAC R-61D cassette data recorder. The recordings were played back from this recorder and digitized by a TEAC RD-135T DAT recorder.
These sounds are the end-notes of bowhead whale song; the whole song is much longer than the snippets recorded here. Compared to other parts of the bowhead song, this part of the song is relatively constant from year to year, but does change somewhat. It is also relatively loud compared to some other parts of the song.
Some of these sounds have quite a lot of interfering noise from bearded seals, ice, banging hydrophone cables, and other sources.
File names indicate dates of recording. A file name like B88042003.0307 indicates the year (1988), month (04), day of the month (20), a tape sequence number that is essentially irrelevant here (03), and the hour and minute of the day (0307). The time is the local time in Barrow. Sometimes there are two identical timestamps with 'a' and 'b' suffixes, like B88042615.1229a.aif and B88042615.1229b.aif. These are not distinct whales (see below) but rather are two end-note sequences from the same whale that occurred less than a minute apart.
The sounds are stored as .wav files, which are in WAVE format. The sampling rate, which is encoded in the WAVE header, is 4000 Hz.
On these recordings there is generally one prominent whale producing sound. Successive recordings that are near in time are likely to be from the same whale - end-notes from successive songs - but no guarantee of this is made.
Call boundaries were determined using the bioacoustic sound analysis program Canary. Spectrograms were made and call start-time and end-time and low-frequency and high-frequency boundaries of each call were picked by hand. Time boundaries were adjusted for Canary's offset
48 DRDC Atlantic CR 2008-287
of spectrogram frames from the actual times that calls occur in the time-series waveform. The spectrogram parameters used for picking out calls were:
• Sampling rate: 4,000 Hz
• Frame size: 256 points (96.72 Hz filter bandwidth)
• Overlap: 50% (32 ms spectrogram frame spacing)
• FFT size: 256 points (15.62 Hz spacing)
• Window type: Blackman
Whale call descriptions (annotations) are in the .box files, which are ASCII tables. Each sound file has one or more whales, i.e., one or more .box files associated with it. Each whale is designated by the '.a', '.b', etc. part of the .box file name. Each row of the table describes one call. The columns of the table are:
start-time end-time low-freq high-freq SNR mark-time
where the start- and end-time and low- and high-frequencies define where and at what frequency the call happens. SNR is the signal-to-noise ratio.
The mark time is useful for aligning at a specific point in the call. It is Canary's "center time" for the call.
MobySound is copyrighted in certain ways; for more information on these copyrights please see: http://cetus.pmel.noaa.gov/MsCopyright.html.
5.1.2 Humpback – Mobysound
The information contained in this section was obtained from the Mobysound website: http://cetus.pmel.noaa.gov/MobySound/cetacea/bowhead-1/README-bowhead-1.txt.
These were made in March 1994 off the north coast of the island of Kauai, Hawaii. Sounds were received on custom-built hydrophones using a Sippican transducer element, transmitted by Joslyn or L-tronics radio tranceivers (20 kHz bandwidth, with equalization filtering to even out frequency response), and digitized and recorded by a TEAC RD-135 digital recorder.
These sounds are from humpback whale song. Each file is about 15 minutes long, and often songs go on past the end of one file and finish in the next one. Also, there may be a few seconds of overlap between one file and the next, since they were captured sequentially off tape by stopping the tape, rewinding a bit, and restarting. (This was necessary because of the size of the files.)
File names indicate dates of recording. A file name like 940305-1037.aif indicates the year (94), month (03), day of the month (05), and hour and minute (1037). These times are local Hawaii time.
The sounds are stored as .wav files, which are in WAVE format. The sampling rate, which is encoded in the WAVE header, is 4000 Hz.
DRDC Atlantic CR 2008-287 49
On these recordings there is one prominent whale singing.
Call boundaries were determined using the bioacoustic sound analysis program Canary. Spectrograms were made and call start-time and end-time and low-frequency and high-frequency boundaries of each call were picked by hand. Time boundaries were adjusted for Canary's offset of spectrogram frames from the actual times that calls occur in the time-series waveform. The spectrogram parameters used for picking out calls were:
• Sampling rate: 4,000 Hz
• Frame size: 2,048 points (12.09 Hz filter bandwidth)
• Overlap: 50% (116 ms spectrogram frame spacing)
• FFT size: 2,048 points (1.953 Hz spacing)
• Window type: Blackman
Whale call descriptions (annotations) are in the .box files, which are ASCII tables. Each sound file has one or more whales, i.e., one or more .box files associated with it. Each whale is designated by the '.a', '.b', etc. part of the .box file name. Each row of the table describes one call. The columns of the table are:
start-time end-time low-freq high-freq SNR mark-time
where the start- and end-time and low- and high-frequencies define where and at what frequency the call happens. SNR is the signal-to-noise ratio.
The mark time is useful for aligning at a specific point in the call. It is Canary's "center time" for the call.
MobySound is copyrighted in certain ways; for more information on these copyrights please see: http://cetus.pmel.noaa.gov/MsCopyright.html.
5.1.3 Sperm Whale – Q302
Sperm whale recordings were taken on the AUTEC Range during the winter of 2007. They were sampled using modified SSQ-57B (Spartan) buoys with bandwidth extended to 40 kHz and recorded at 80 kHz sample rate using EADAQ.
The clicks in the file are from Sperm whales during a dive cycle.
File names represent the date and time that the data recording started in the form DDMMMYY_HHMMSS.dat. Files are in standard DREA DAT format with a 512-byte header and channel multiplexed 16-bit integer data.
5.1.4 Ambient Noise – Q312
Ambient noise recordings were taken in Exuma Sound during the winter of 2008. They were sampled using SSQ-53F DIFAR buoys and recorded at 48 kHz sample rate using EADAQ.
50 DRDC Atlantic CR 2008-287
The recording on 22 Feb 08, contains an EMATT and two surface ships. The recording on 28 Feb 08 contains Low Frequency Active (LFA) source pings with synthetic echoes generated by the same source.
File names represent the date and time that the data recording started in the form DDMMMYY_HHMMSS.dat. Files are in standard DREA DAT format with a 512-byte header and channel multiplexed 16-bit integer data.
5.1.5 Ambient Noise – Mobysound
The Mobysound portion of the noise data set was taken from the non-target noise data set provided for the 3rd workshop in the series of International Workshops on the Detection and Localization of Marine Mammals Using Passive Acoustics. (http://hmsc.oregonstate.edu/projects/MobySound/MsSoundSets.html). It was reported to contain ocean noise and other marine mammals, but did not produce any detections for this contract.
5.2 Database Description
This section provides a summary of the detection results and the information necessary to navigate and use the results. The results in terms of number of detection are shown in Table 7. The known instances were generated by counting the annotations provided with the Mobysound data. The detection counts were generated by running the count_detects script in the scripts directory of the trial repository. The script output is archived in the analysis_results directory in raw form in the detection_stats.txt file and in Microsoft (MS) Excel format in the confusion_matrix.xls file.
The content of Table 7 requires further explanation to understand the significance of the results. The name confusion matrix comes from the idea that the detectors are blind. They do not know the data being passed through them, and so can be confused into detecting a particular call type even when it is not present. The confusion can be caused by noise (false alarm) or by a different call type (mis-classification). The table attempts to shed some light on the level of confusion encountered by Sentinel and is best understood using an example:
The Humpback row indicates results when all detector configurations were used to produce detections using Humpback data as the source. The first number in the row (2310) is essentially the ground-truth value (i.e. the number of calls in that data set attributed to Humpbacks by Mobysound). The next number in the row (445) indicates the number of detections produced using the Bowhead detector configuration of Sentinel; that is to say, the Sentinel system attributed (i.e. misclassified) 445 signals in the Humpback data, to Bowheads. These 445 signals would prove to be a mix of Humpback calls and a small number of other signals (i.e. noise transients), if detailed classification were performed on those results. The value 1031 is the number of detections using Sentinel's Humpback detector configuration on the Humpback data. This does not mean that there were exactly 1279 (2310-1031) missed detections, as the 1031 represents a mix of Humpback signals and other data. In this case there was only one other signal included which appeared to be a hydrophone transient or bump. This level of classification was only performed for matching data and target configuration (i.e. Humpback data and a Humpback detector configuration).
DRDC Atlantic CR 2008-287 51
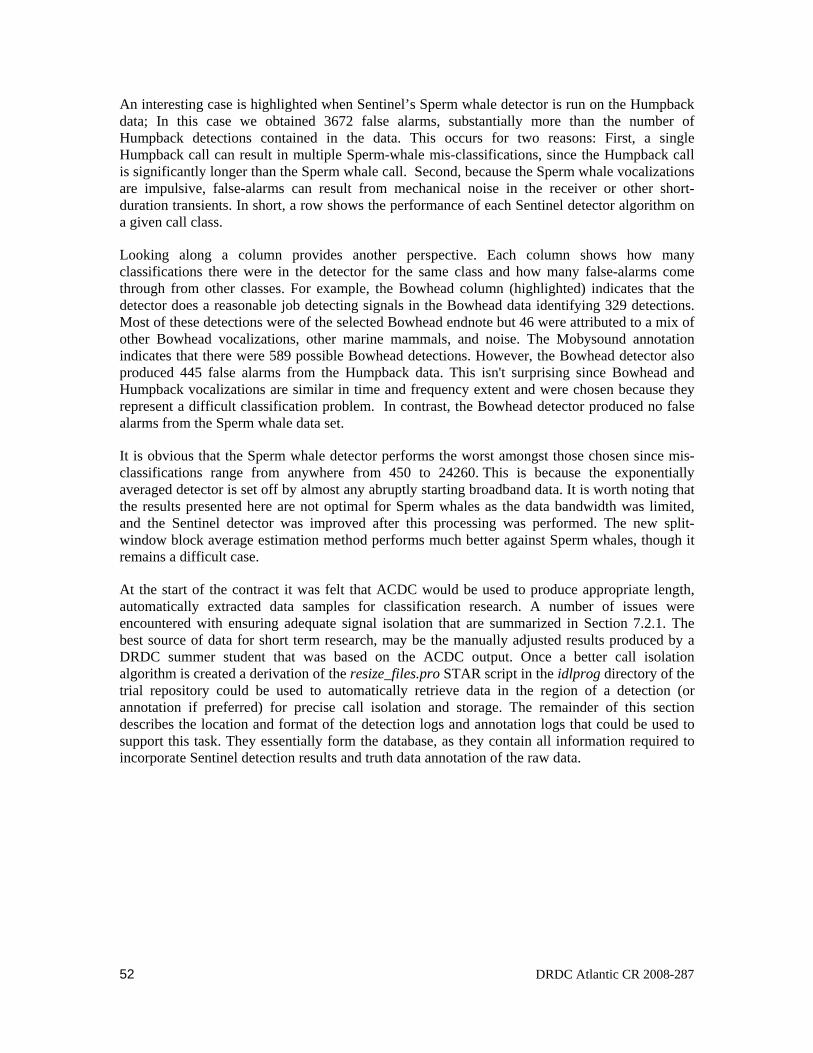
An interesting case is highlighted when Sentinel’s Sperm whale detector is run on the Humpback data; In this case we obtained 3672 false alarms, substantially more than the number of Humpback detections contained in the data. This occurs for two reasons: First, a single Humpback call can result in multiple Sperm-whale mis-classifications, since the Humpback call is significantly longer than the Sperm whale call. Second, because the Sperm whale vocalizations are impulsive, false-alarms can result from mechanical noise in the receiver or other short-duration transients. In short, a row shows the performance of each Sentinel detector algorithm on a given call class.
Looking along a column provides another perspective. Each column shows how many classifications there were in the detector for the same class and how many false-alarms come through from other classes. For example, the Bowhead column (highlighted) indicates that the detector does a reasonable job detecting signals in the Bowhead data identifying 329 detections. Most of these detections were of the selected Bowhead endnote but 46 were attributed to a mix of other Bowhead vocalizations, other marine mammals, and noise. The Mobysound annotation indicates that there were 589 possible Bowhead detections. However, the Bowhead detector also produced 445 false alarms from the Humpback data. This isn't surprising since Bowhead and Humpback vocalizations are similar in time and frequency extent and were chosen because they represent a difficult classification problem. In contrast, the Bowhead detector produced no false alarms from the Sperm whale data set.
It is obvious that the Sperm whale detector performs the worst amongst those chosen since mis-classifications range from anywhere from 450 to 24260. This is because the exponentially averaged detector is set off by almost any abruptly starting broadband data. It is worth noting that the results presented here are not optimal for Sperm whales as the data bandwidth was limited, and the Sentinel detector was improved after this processing was performed. The new split-window block average estimation method performs much better against Sperm whales, though it remains a difficult case.
At the start of the contract it was felt that ACDC would be used to produce appropriate length, automatically extracted data samples for classification research. A number of issues were encountered with ensuring adequate signal isolation that are summarized in Section 7.2.1. The best source of data for short term research, may be the manually adjusted results produced by a DRDC summer student that was based on the ACDC output. Once a better call isolation algorithm is created a derivation of the resize_files.pro STAR script in the idlprog directory of the trial repository could be used to automatically retrieve data in the region of a detection (or annotation if preferred) for precise call isolation and storage. The remainder of this section describes the location and format of the detection logs and annotation logs that could be used to support this task. They essentially form the database, as they contain all information required to incorporate Sentinel detection results and truth data annotation of the raw data.
52 DRDC Atlantic CR 2008-287
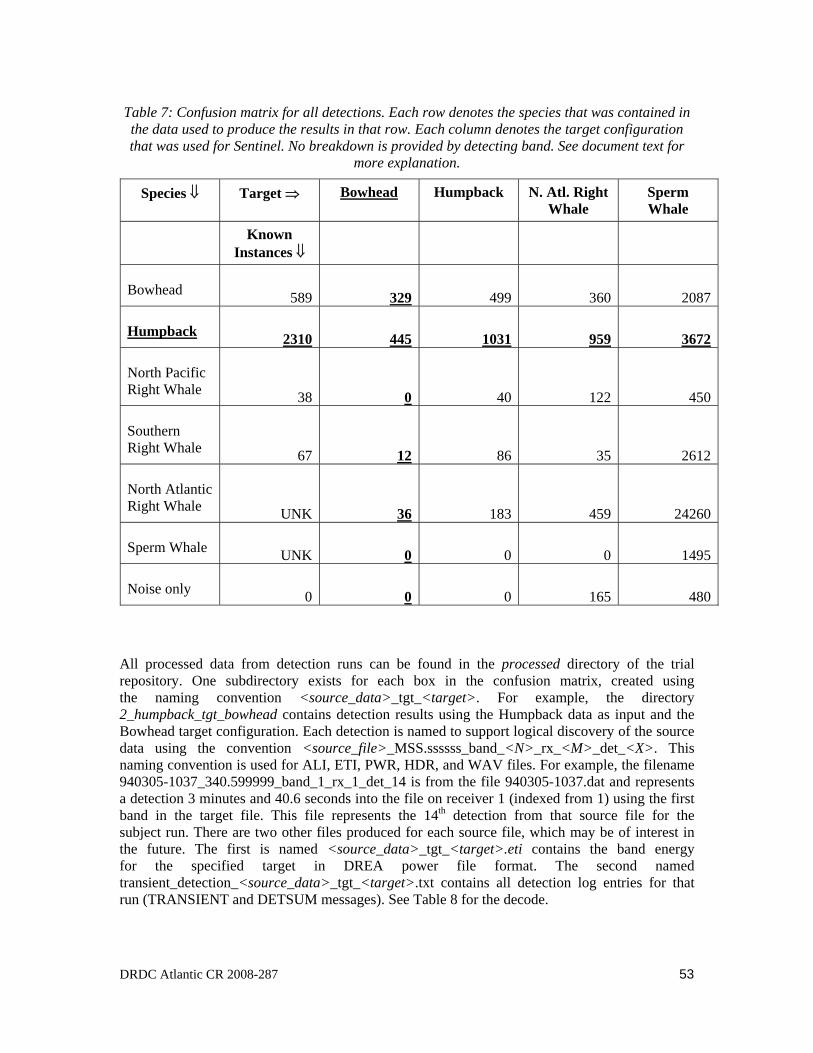
Table 7: Confusion matrix for all detections. Each row denotes the species that was contained in the data used to produce the results in that row. Each column denotes the target configuration that was used for Sentinel. No breakdown is provided by detecting band. See document text for
more explanation.
Bowhead Humpback N. Atl. Right Whale
Sperm Whale
Species ⇓ Target ⇒
Known Instances ⇓
Bowhead 329589 499 360 2087
Humpback 2310 445 1031 959 3672
North Pacific Right Whale 038 40 122 450
Southern Right Whale 1267 86 35 2612
North Atlantic Right Whale 36UNK 183 459 24260
Sperm Whale 0UNK 0 0 1495
Noise only 00 0 165 480
All processed data from detection runs can be found in the processed directory of the trial repository. One subdirectory exists for each box in the confusion matrix, created using the naming convention <source_data>_tgt_<target>. For example, the directory 2_humpback_tgt_bowhead contains detection results using the Humpback data as input and the Bowhead target configuration. Each detection is named to support logical discovery of the source data using the convention <source_file>_MSS.ssssss_band_<N>_rx_<M>_det_<X>. This naming convention is used for ALI, ETI, PWR, HDR, and WAV files. For example, the filename 940305-1037_340.599999_band_1_rx_1_det_14 is from the file 940305-1037.dat and represents a detection 3 minutes and 40.6 seconds into the file on receiver 1 (indexed from 1) using the first band in the target file. This file represents the 14th detection from that source file for the subject run. There are two other files produced for each source file, which may be of interest in the future. The first is named <source_data>_tgt_<target>.eti contains the band energy for the specified target in DREA power file format. The second named transient_detection_<source_data>_tgt_<target>.txt contains all detection log entries for that run (TRANSIENT and DETSUM messages). See Table 8 for the decode.
DRDC Atlantic CR 2008-287 53
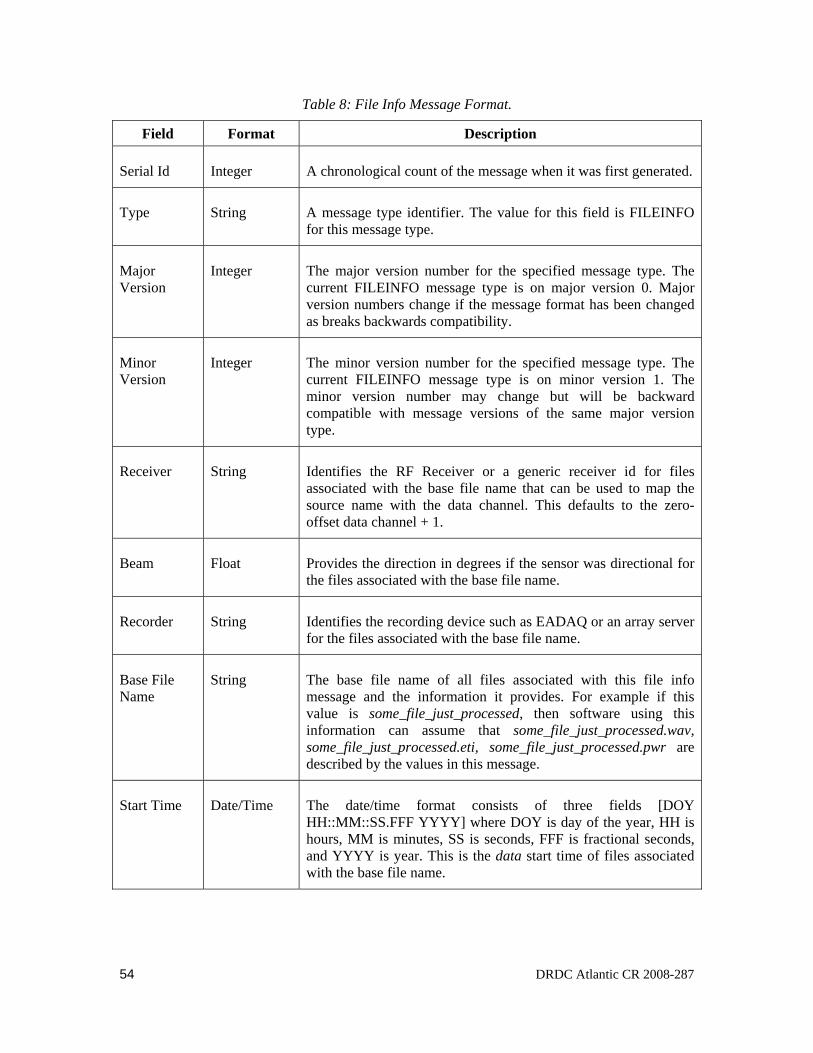
Table 8: File Info Message Format.
Field Format Description
Serial Id Integer A chronological count of the message when it was first generated.
Type String A message type identifier. The value for this field is FILEINFO for this message type.
Major Version
Integer The major version number for the specified message type. The current FILEINFO message type is on major version 0. Major version numbers change if the message format has been changed as breaks backwards compatibility.
Minor Version
Integer The minor version number for the specified message type. The current FILEINFO message type is on minor version 1. The minor version number may change but will be backward compatible with message versions of the same major version type.
Receiver String Identifies the RF Receiver or a generic receiver id for files associated with the base file name that can be used to map the source name with the data channel. This defaults to the zero-offset data channel + 1.
Beam Float Provides the direction in degrees if the sensor was directional for the files associated with the base file name.
Recorder String Identifies the recording device such as EADAQ or an array server for the files associated with the base file name.
Base File Name
String The base file name of all files associated with this file info message and the information it provides. For example if this value is some_file_just_processed, then software using this information can assume that some_file_just_processed.wav, some_file_just_processed.eti, some_file_just_processed.pwr are described by the values in this message.
Start Time Date/Time The date/time format consists of three fields [DOY HH::MM::SS.FFF YYYY] where DOY is day of the year, HH is hours, MM is minutes, SS is seconds, FFF is fractional seconds, and YYYY is year. This is the data start time of files associated with the base file name.
54 DRDC Atlantic CR 2008-287
Sampling Rate
Float The original sample rate of the data used to generate file associated with the base file name.
Number of ETI Bands
Integer Denotes the number of ETI values to expect when de-multiplexing the initial background levels, initial signal levels, final background levels and file signal levels fields of the message. This field is usually only used by detection modules and is 0 by default for programs that simply record. If the number of ETI bands is 0 then the Initial Background Levels, Initial Signal Levels, Final Background Levels and Final Signal Levels fields are not present in the message. This makes it a variable length message format which needs to determine the number of bands before continuing parsing of the message.
Initial Background Levels
List of Floats Provides the initial background levels of each band up to the number of specified ETI bands.
Initial Signal Levels
List of Floats Provides the initial signal levels of each band up to the number of specified ETI bands.
Final Background Levels
List of Floats Provides the final background levels of each band up to the number of specified ETI bands.
Final Signal Levels
List of Floats Provides the final signal levels of each band up to the number of specified ETI bands.
The manual classification results are stored in the analysis_results directory with each annotation file placed in a directory that corresponds to the location of the detection run (i.e. 1_bowhead_tgt_bowhead). Only the detection results that match source and target type were classified. The decode for the ASCII annotation files can be found in Table 4. These files were separated from the detection runs because the annotations reference the data itself and can be used for any run on that data.
The best way to view results is using ACDC. After running the application the detection run directory and annotation directory is selected and all data are read into the application. Users can then see annotations overlaid on detection results with summary statistics providing an indication of how much known data are contained in the current detection results. Further information on how to use ACDC can be found in the Software Additions, Improvements and Enhancements to DRDC’s Algorithms and Trials Support final report [1].
DRDC Atlantic CR 2008-287 55
The extracted detection segments – WAV files – were also renamed and segregated from the main detection data to simplify classify training and testing. During classification each detection was tagged with a name, denoting what call type was contained. These call types are described in Section 4.1. The renamed data in contained in the renamed_full and renamed_1sec directories of the trial repository. It may not be directly useful due to the issue described in Section 7.2.1, but provides the required association information and STAR scripts can be used to adjust the content as necessary.
At the beginning of the contract it was felt that PDF (probability density functions) of the various SNR for each vocalization type would be required. Some work was done to make these measurements that is stored in the transient_snr.pro STAR script in the idlprog directory of the trial repository. Initial PDF were produced for Bowhead, Humpback, and Sperm Whale data, but not further broken down by call type. These PDF include all detections from a data set including non-target. More precise PDF were not produced as the PA wished to validate the general classification process prior to expending effort on detailed data pruning and adjustment. See Section 7.2.2 for future recommendations.
56 DRDC Atlantic CR 2008-287
6 Software Development
Effort towards software development was avoided for this contract, as data analysis was the primary objective. Most software development took place in the generation of processing scripts and simple STAR IDL scripts to perform data and statistical analysis and re-formatting. This effort is described throughout the report in sections relating to the analysis work that required the script.
Some effort was expended under this contract to enhance ACDC so that it could quickly rename WAV files, appending the classification tag from any associated annotations. This capability was added to ACDC and can be accessed from the menu (File ⇒ Rename Audio Files…). Once selected the user specifies an output directory and all detections that have associated annotations are written out. The association rules used for the renaming were changed to support the case where the subject WAV file was shorter than the annotation. Normally an association is only made when the annotation is 100% contained by the data. In this case, an annotation that is at least partially contained can be used. If more than one annotation passes this test the earliest annotation is used.
The primary applications – ACDC, OPD, and SPPACS – were formally ported to run on OSX as described in Section 6.2.
Other than minor bug fixes and support all other software development was conducted under related project work and is summarized in the following section.
6.1 Project Synergies
This project received the benefit of work conducted during the execution of other Akoostix projects. The overall impact has been an effective increase in total project effort beyond the amounts originally estimated or charged to this project. Akoostix’s intrinsic desire to develop products that are truly reusable has provided these added efforts at no cost to this project.
The project “Software Additions, Improvements and Enhancements to DRDC’s Algorithms and Trials Support” [1] provided significant synergistic support to this project including:
• A complete change to how classification annotations were stored, referencing the data instead of the detection to support rapid classification between runs
• A complete change to how detections were named, supporting rapid sequential detections and filenames that provided a logical association with the source data
• The addition of detection summary messages used in this contract to support rapid adjustment of WAV file extent around a detection. This information is plotted in a summary window in ACDC.
• Multi-rate playback for improved aural listening
• A broad range of code stability and design improvements along with defect repair
• General improvements to OPD that supported efficient analysis
DRDC Atlantic CR 2008-287 57

• The TRANSIENT detection message was modified with additional information that will allow association of detection message with the original data file that was used to process the detection. This was very important since it allows the data to be reprocessed and re-associated as enhancements and fixes to the software are made.
• Improved sp_transient_processing design for better integration into ACDC.
• ALI and ETI files are now produced by the sp_transient_processing application and viewable in ACDC giving more information to the operator identifying and classifying the marine mammal detections.
• Added the ability to de-speckle GRAM images in ACDC for better visual feedback on signal characteristics.
• Added new verification states and improved display filters in ACDC for more comprehensive classification and visual data management.
• Added Undo functionality in ACDC to back out of erroneous or unwanted changes to the data.
The ongoing project “Mitigation and Monitoring: Passive Acoustic Monitoring (PAM) Software Development – Detection Classification and Localization Capabilities” [2] contributed to this project through general support to ACDC. This contract involved effort performing acoustic data analysis of the same datasets as those used for this project, but with the objective of improving the Sentinel detector. ACDC, OPD, and SPPACS are being used under license to Akoostix to support this work. Some project funds were used to perform general defect repair and focused enhancements including improvements to the ACDC statistical summary view. This contract also provided improvements to the SPPACS version of Sentinel, provided a split window estimator option, though that option wasn’t used for this project it does improve false alarm rejection in many cases.
6.2 Software Compilation for MAC OS
Akoostix strives to write portable, cross-platform code. Regular builds are performed for all major platforms: Windows, Linux, and Mac OSX. As part of the contract deliverables, an OSX binary release was made for OSX Leopard (10.5, Intel). This software is provided on the software release CD under the osx/ directory. Run install.sh to unpack the distribution on your OSX system.
The work to create a formal OSX release was performed as part of this contract. Akoostix had already invested effort in ensuring that the software would compile on OSX, but additional effort was required to convert that software into a release that could be quickly and consistently created and distributed. New releases can be created, after building, using the release.sh script in the support/osx directory of the distribution. This creates a compressed file that can be taken to any OSX Leopard Intel machine and installed using a simple install script. Installations are versioned allowing users to quickly change the active version by switching a simlink.
58 DRDC Atlantic CR 2008-287
7 Engineering
7.1.1 Configuration Management (CM)
Software development work for this contract started on the noise_monitoring_dev branch of the acoustics2 SVN repository. This branch was moved back as the main development trunk as of revision 11707 on March 12th, 2008.
Several release branches were generated at different points during the project’s life span:
• 6.0-maint was created April 30th, 2008. It was used to plan the initial analysis.
• 6.1-maint was created May 21st, 2008. It was created to showcase some of the major changes performed to ACDC and OPD as part of another DRDC Project [1]. This branch was used to perform a majority of the analysis for this contract.
• 6.2-maint was created June 30th, 2008. This was an interim release which provided several bug fixes which also affected this contract.
• 6.3-maint was created August 29th, 2008 in conjunction with the final deliverables for this contract and another DRDC project [1]. The latest release tag for this branch is 6.3.1 and is provided with the final contractor report.
The 6.3-maint branch was provided to the PA as part of the contract deliverables and any necessary defect repairs will be made on this branch before producing a minor version release.
Analysis work for this contract was versioned in a separate trials repository named aural_mammal. It is currently at revision 360.
As discussed in Section 6.1, software development conducted as part of other Akoostix projects has provided benefits to this project. It was therefore critical to maintain configuration management not only during direct software development, but also during associated development, such as during the Software Additions, Improvements and Enhancements to DRDC’s Algorithms and Trials Support contract [1].
Notable improvements to the software performed under the Software Additions [1] contract that benefited Aural Mammal have been detailed in Section 6.1.
7.1.2 Quality Assurance (QA)
An integral part of the classification work involved the use of subject matter experts, specialists in the field of marine mammal vocalizations. Their expert input provided the necessary QA required by the PA. Additional information can be found in Section 4
DRDC Atlantic CR 2008-287 59
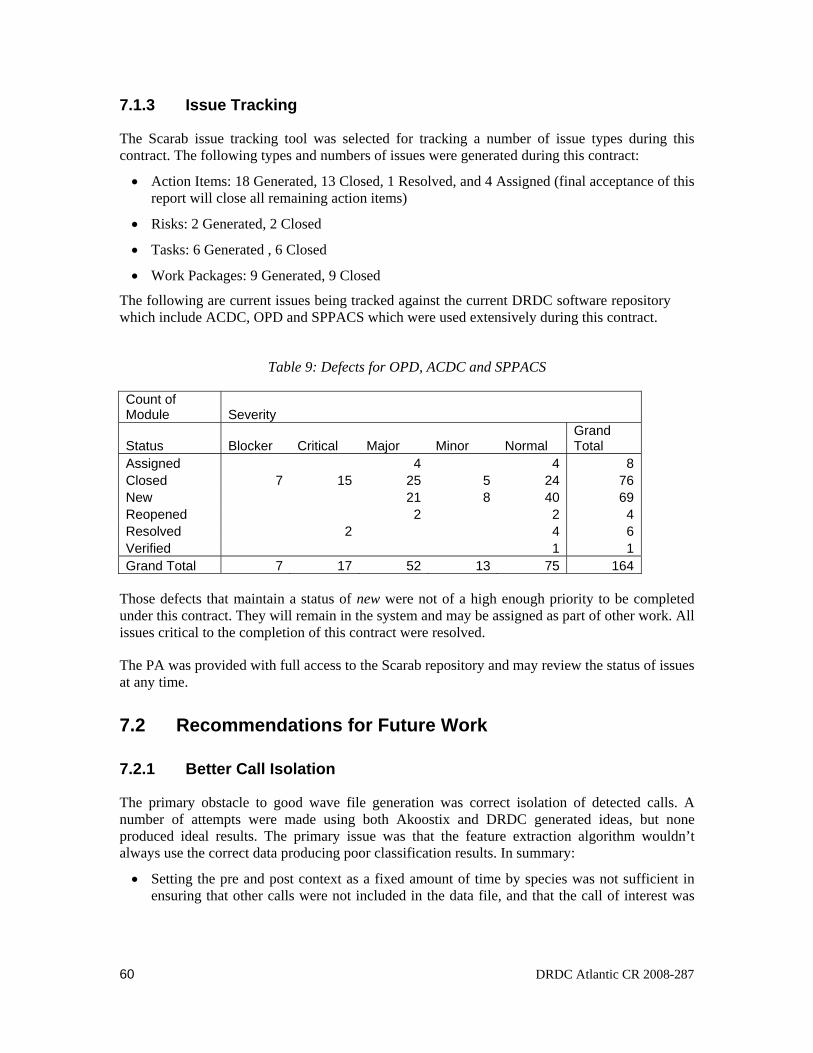
7.1.3 Issue Tracking
The Scarab issue tracking tool was selected for tracking a number of issue types during this contract. The following types and numbers of issues were generated during this contract:
• Action Items: 18 Generated, 13 Closed, 1 Resolved, and 4 Assigned (final acceptance of this report will close all remaining action items)
• Risks: 2 Generated, 2 Closed
• Tasks: 6 Generated , 6 Closed
• Work Packages: 9 Generated, 9 Closed
The following are current issues being tracked against the current DRDC software repository which include ACDC, OPD and SPPACS which were used extensively during this contract.
Table 9: Defects for OPD, ACDC and SPPACS
Count of Module Severity
Status Blocker Critical Major Minor Normal Grand Total
Assigned 4 4 8 Closed 7 15 25 5 24 76 New 21 8 40 69 Reopened 2 2 4 Resolved 2 4 6 Verified 1 1 Grand Total 7 17 52 13 75 164
Those defects that maintain a status of new were not of a high enough priority to be completed under this contract. They will remain in the system and may be assigned as part of other work. All issues critical to the completion of this contract were resolved.
The PA was provided with full access to the Scarab repository and may review the status of issues at any time.
7.2 Recommendations for Future Work
7.2.1 Better Call Isolation
The primary obstacle to good wave file generation was correct isolation of detected calls. A number of attempts were made using both Akoostix and DRDC generated ideas, but none produced ideal results. The primary issue was that the feature extraction algorithm wouldn’t always use the correct data producing poor classification results. In summary:
• Setting the pre and post context as a fixed amount of time by species was not sufficient in ensuring that other calls were not included in the data file, and that the call of interest was
60 DRDC Atlantic CR 2008-287
included. A variety of parameters were used but problems were repeatedly found with the results. Note that this method defines the pre and post context based on the initial detection time.
• Using the Sentinel detection times (start and end) with a small buffer on each end had problems because the detection period seldom reflects correct period of the detected vocalization. Under different scenarios it can either over or underestimate the detection end time, though the detection start time is frequently valid and useful.
• Using the built-in signal isolation technique from DRDC’s Auralization tools also had problems. These tools were designed to deal with very short duration transients that contained one primary event. Some of the vocalizations modulate significantly in amplitude confusing this call isolation algorithm.
A practical detection / classification system would need to work without operator intervention, so robust call isolation is required.
7.2.2 SNR Estimation and PDF Normalization
One objective of this contract that wasn’t completed was the accurate estimate of the SNR for each detected call and the production of uniform SNR distributions in each data set. This work was decreased in priority, but should be completed at a later date. This would include validating and refining SNR estimation then pruning the data, or using acceptable SNR adjustment methods to ensure that the probability density function (PDF) of SNR is similar across vocalizations types in the classification database.
DRDC Atlantic CR 2008-287 61
References .....
[1] Software Additions, Improvements and Enhancements to DRDC’s Algorithms and Trials Support, W7707-078054/001/HAL, Jan 2008, Akoostix Inc.
[2] Mitigation and Monitoring: Passive Acoustic Monitoring (PAM) Software Development – Detection Classification and Localization Capabilities, International Association of Oil and Gas Producers Joint Industrial Programme (JIP) 22-RFP 07-01, Akoostix, Dec 2007.
[3] Theriault, J., and Hood, J., (2007). Acoustic Cetacean Detection Capability Performance with the Workshop Dataset, in Proc. Of 3rd International Workshop in the Detection and Classification of Marine Mammals Using Passive Acoustics, Boston, MA, USA 2007.
[4] Blackwell, S.B., Richardson, W.J., Greene Jr, C.R., and Streever, B. (2007). Bowhead Whale (Balaena Mysticetus) Migration and Calling Behaviour in the Alaskan Beaufort Sea, Autumn 2001–04: An Acoustic Localization Study. Arctic, Vol. 60, No. 3, September 2007, p.255-270.
[5] Darling, J.D., Jones, M.E., and Nicklin, C.P. (2006). Humpback Whale Songs: Do They Organize Males During the Breeding Season? West Coast Whale Research Foundation, July 2006.
[6] Parks, S.E., Tyack, P.L., (2005). Sound Production by North Atlantic Right Whales (Eubalaena Glacialis) in Surface Active Groups. Journal of the Acoustical Society of America, Vol. 117, No. 5, May 2005, p.3297-3306.
[7] Thode, A., (2004). Tracking Sperm Whale (Physeter Macrocephalus) Dive Profiles Using a Towed Passive Acoustic Array. Journal of the Acoustical Society of America, Vol. 116, No. 1, July 2004, p.245-253.
[8] Erbe, C., (2004). The Acoustic Repertoire of Odontecetes as a Basis for Developing Automatic Detectors and Classifiers, DRDC Atlantic CR 2004-071, May 2004, Bioacoustic Consulting.
[9] Mohl, B., Heerfordt, A., Lund, A., (2003). The Monopulsed Nature of Sperm Whale Clicks. Journal of the Acoustical Society of America, Vol. 114, No. 2, August 2003, p.1143-1154.
[10] Thode, A., Mellinger, D.K., Stienessen, S., Martinez, A., and Mullin, K., (2002). Depth-Dependent Acoustic Features of Diving Sperm Whales (Physeter Macrocephalus) in the Gulf of Mexico. Journal of the Acoustical Society of America, Vol. 112, No. 1, July 2002, p. 308-321.
[11] Madsen, P.T., Payne, R., Kristiansen, N.U., Wahlberg, M., Kerr, I., and Mohl, B., (2002). Sperm Whale Sound Production Studied with Ultrasound Time/Depth-Recording Tags. The Journal of Experimental Biology, Vol. 205, 2002, p.1899-1906.
62 DRDC Atlantic CR 2008-287
[12] Cerchio, S., Jacobsen, J.K., and Norris, T.F. (2001). Temporal and Geographical Variation in Songs of Humpback Whales, Megaptera Novaeangliae: Synchronous Change in Hawaiian and Mexican Breeding Assemblages. Animal Behavior, Vol. 62, January 2001, p.313-329.
[13] Mohl, B., (2001). Sound Transmission in the Nose of the Sperm Whale Physeter Catodon. A Post Mortem Study. Journal of Comparative Physiology A, Vol. 187, 2001, p. 335-340.
[14] Goold, J.C., (1996). Signal Processing Techniques for Acoustic Measurement of Sperm Whale Body Lengths. Journal of the Acoustical Society of America, Vol. 100, No. 5, November 1996, p.3431-3441.
[15] Goold, J.C., and Jones, S.E., (1995). Time and Frequency Domain Characteristics of Sperm Whale Clicks. Journal of the Acoustical Society of America, Vol. 98, No. 3, September 1995, p.1279-1291.
[16] Payne, R.S., McVay, S., (1971). Songs of Humpback Whales. Science, New Series, Vol. 173, No. 3997, August 1971, p.585-597 (from the JSTOR Archive).
[17] McInnis, J., (2008), OPD User Manual, Akoostix Inc. 2008-001.
DRDC Atlantic CR 2008-287 63

This page intentionally left blank.
64 DRDC Atlantic CR 2008-287
Annex A Minor Documents and Discussions
The expertise of Julie Oswald (through JASCO Research) was utilized to provide background information and insight into two phenomena observed during the analysis of the Sperm whale and Humpback whale vocalizations. The information she provided was well-known to those familiar with the vocalizations of these species, and so the question and answer sessions (between Akoostix and Julie Oswald) have been captured here to provide the reader with this same knowledge.
A.1 Sperm Whale Clicks
The following represents a question posed by Joe Hood (Akoostix Inc.) to Julie Oswald (JASCO Research). Further discussion revealed that the delay between clicks (~60ms) was due to multipath, but the click structure itself could contain the discussed multi-pulse structure.
Question:
I plan to provide a set of sperm whale clicks (two examples provided) from the Q302 data just to get expert confirmation of the classification. The clicks mainly are detected in pairs with a VERY short gap. I attribute this to multi-path. Has this "double click" ever been shown to come from the animal itself (a second bounce in the cavity)?
Answer:
The structure of sperm whale clicks was first described by Backus and Scheville (1966) as regularly spaced pulses of sound, each a few ms in duration. Each click contains 3 or more pulses with decreasing amplitudes and inter-pulse intervals (IPI) on the order of 5ms. Click durations may reach 20-30 ms. Figure 1; taken from Mohl et al. 2003a illustrates these properties of a sperm whale click. There are several explanations for this click structure. One of the most prevalent was proposed by Norris and Harvey (1972). This hypothesis states that a single pulse is produced at the front of the spermaceti organ by the monkey lips monkey lips (a valve-like structure in the nasal passage). The multiple pulses are a result of reverberation of the initial pulse between two airsacs. This hypothesis has been supported by sound transmission experiments (Mohl 2001, Madsen et al. 2003). The IPI is though to be a function of the length of the spermaceti organ and has been used to calculate the size of the whale (Goold and Jones 1995, Goold 1999). Mohl et al. (2003) expand on this explanation for the multiple pulses. They hypothesize that the initial p0 pulse (fig 1) is the primary event at the monkey lips, transmitted as leakage directly into the water. The main (p1) pulse is shaped by traveling back through the spermaceti, reflecting off the frontal sac, and traveling out to the water through the junk (see figure 2, taken from Mohl et al. 2003). The remaining pulses are hypothesized to be stray energy from the main pulse making the 2-way travel inside the nasal structures and additional number of times. This hypothesis supports the ‘bent horn model’, which describes the spermaceti organ and junk compartments as two connected tubes forming a bent, conical horn (Mohl 2001).
DRDC Atlantic CR 2008-287 65
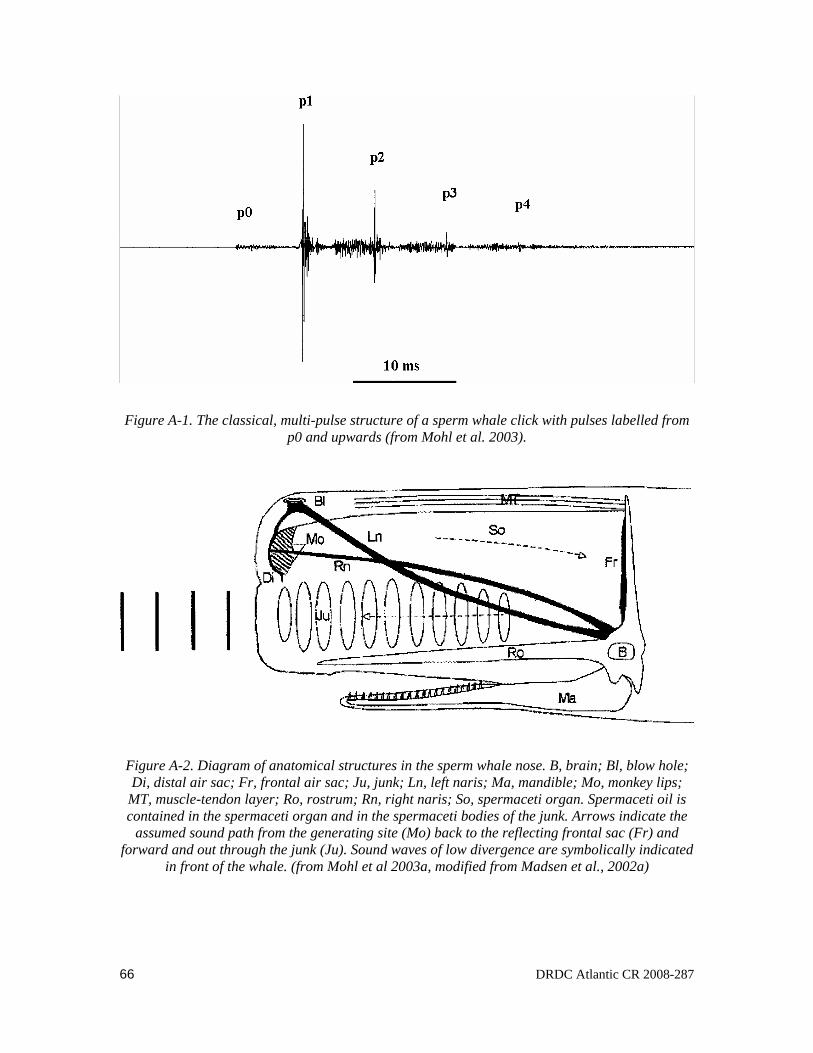
Figure A-1. The classical, multi-pulse structure of a sperm whale click with pulses labelled from p0 and upwards (from Mohl et al. 2003).
Figure A-2. Diagram of anatomical structures in the sperm whale nose. B, brain; Bl, blow hole; Di, distal air sac; Fr, frontal air sac; Ju, junk; Ln, left naris; Ma, mandible; Mo, monkey lips;
MT, muscle-tendon layer; Ro, rostrum; Rn, right naris; So, spermaceti organ. Spermaceti oil is contained in the spermaceti organ and in the spermaceti bodies of the junk. Arrows indicate the
assumed sound path from the generating site (Mo) back to the reflecting frontal sac (Fr) and forward and out through the junk (Ju). Sound waves of low divergence are symbolically indicated
in front of the whale. (from Mohl et al 2003a, modified from Madsen et al., 2002a)
66 DRDC Atlantic CR 2008-287
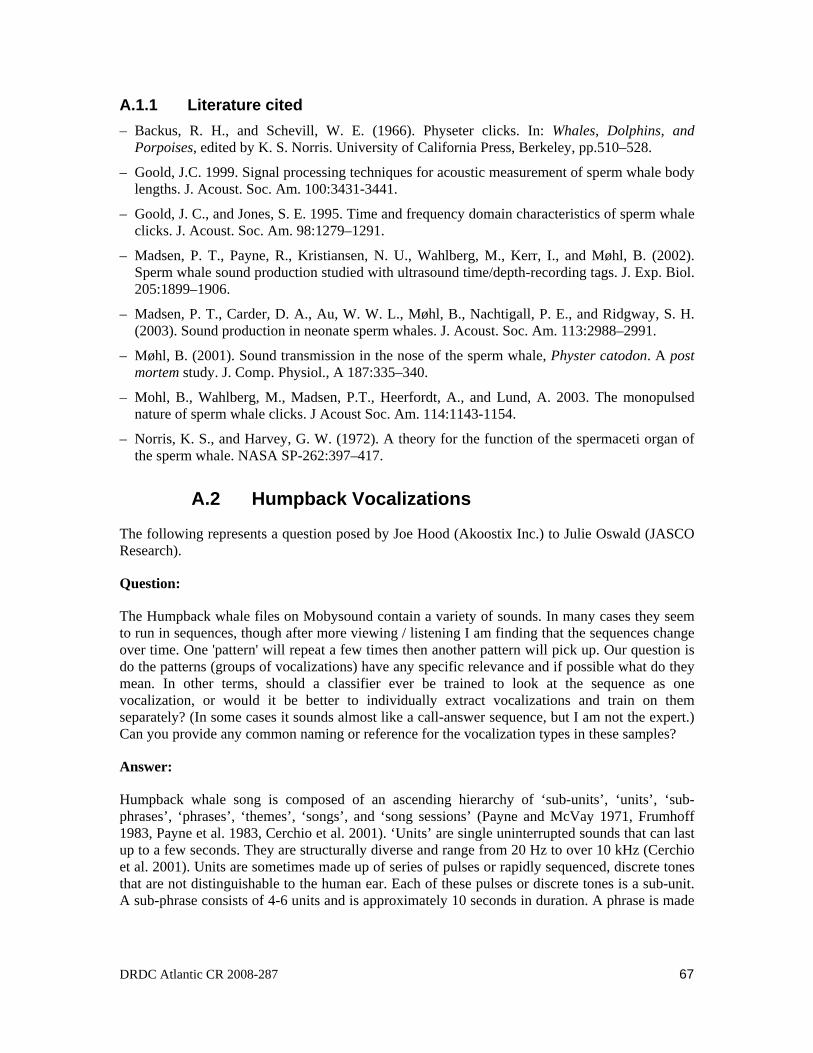
A.1.1 Literature cited – Backus, R. H., and Schevill, W. E. (1966). Physeter clicks. In: Whales, Dolphins, and
Porpoises, edited by K. S. Norris. University of California Press, Berkeley, pp.510–528.
– Goold, J.C. 1999. Signal processing techniques for acoustic measurement of sperm whale body lengths. J. Acoust. Soc. Am. 100:3431-3441.
– Goold, J. C., and Jones, S. E. 1995. Time and frequency domain characteristics of sperm whale clicks. J. Acoust. Soc. Am. 98:1279–1291.
– Madsen, P. T., Payne, R., Kristiansen, N. U., Wahlberg, M., Kerr, I., and Møhl, B. (2002). Sperm whale sound production studied with ultrasound time/depth-recording tags. J. Exp. Biol. 205:1899–1906.
– Madsen, P. T., Carder, D. A., Au, W. W. L., Møhl, B., Nachtigall, P. E., and Ridgway, S. H. (2003). Sound production in neonate sperm whales. J. Acoust. Soc. Am. 113:2988–2991.
– Møhl, B. (2001). Sound transmission in the nose of the sperm whale, Physter catodon. A post mortem study. J. Comp. Physiol., A 187:335–340.
– Mohl, B., Wahlberg, M., Madsen, P.T., Heerfordt, A., and Lund, A. 2003. The monopulsed nature of sperm whale clicks. J Acoust Soc. Am. 114:1143-1154.
– Norris, K. S., and Harvey, G. W. (1972). A theory for the function of the spermaceti organ of the sperm whale. NASA SP-262:397–417.
A.2 Humpback Vocalizations
The following represents a question posed by Joe Hood (Akoostix Inc.) to Julie Oswald (JASCO Research).
Question:
The Humpback whale files on Mobysound contain a variety of sounds. In many cases they seem to run in sequences, though after more viewing / listening I am finding that the sequences change over time. One 'pattern' will repeat a few times then another pattern will pick up. Our question is do the patterns (groups of vocalizations) have any specific relevance and if possible what do they mean. In other terms, should a classifier ever be trained to look at the sequence as one vocalization, or would it be better to individually extract vocalizations and train on them separately? (In some cases it sounds almost like a call-answer sequence, but I am not the expert.) Can you provide any common naming or reference for the vocalization types in these samples?
Answer:
Humpback whale song is composed of an ascending hierarchy of ‘sub-units’, ‘units’, ‘sub-phrases’, ‘phrases’, ‘themes’, ‘songs’, and ‘song sessions’ (Payne and McVay 1971, Frumhoff 1983, Payne et al. 1983, Cerchio et al. 2001). ‘Units’ are single uninterrupted sounds that can last up to a few seconds. They are structurally diverse and range from 20 Hz to over 10 kHz (Cerchio et al. 2001). Units are sometimes made up of series of pulses or rapidly sequenced, discrete tones that are not distinguishable to the human ear. Each of these pulses or discrete tones is a sub-unit. A sub-phrase consists of 4-6 units and is approximately 10 seconds in duration. A phrase is made
DRDC Atlantic CR 2008-287 67
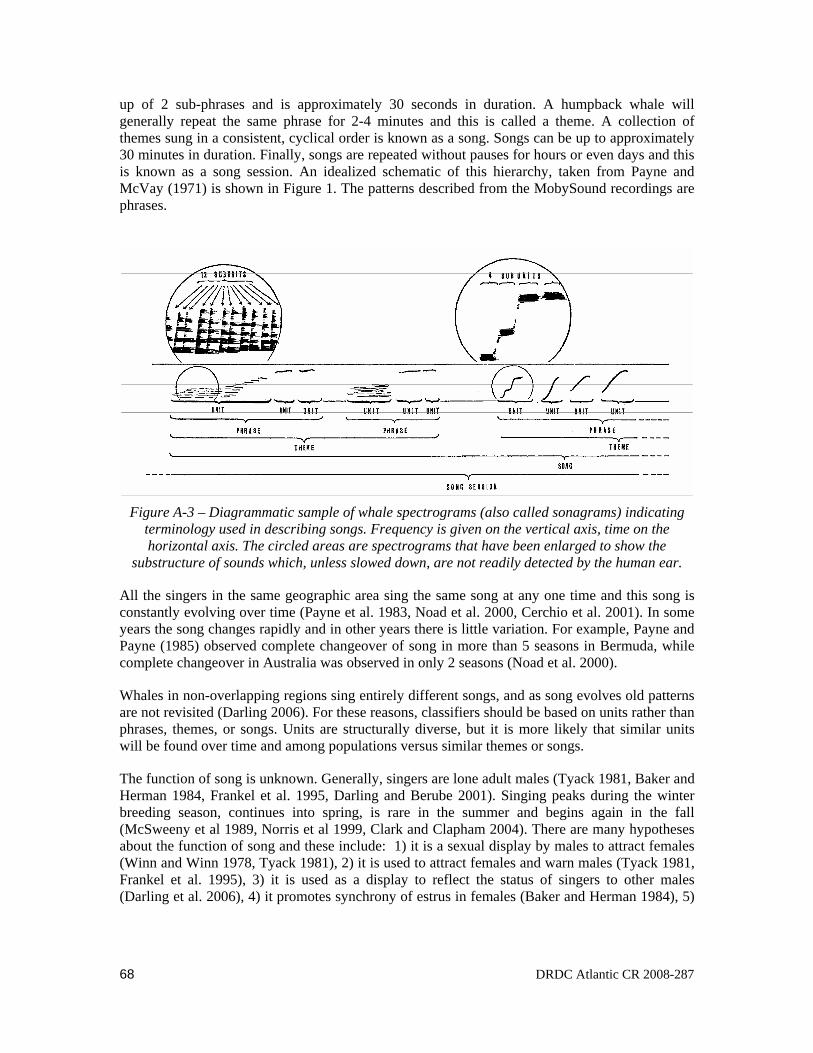
up of 2 sub-phrases and is approximately 30 seconds in duration. A humpback whale will generally repeat the same phrase for 2-4 minutes and this is called a theme. A collection of themes sung in a consistent, cyclical order is known as a song. Songs can be up to approximately 30 minutes in duration. Finally, songs are repeated without pauses for hours or even days and this is known as a song session. An idealized schematic of this hierarchy, taken from Payne and McVay (1971) is shown in Figure 1. The patterns described from the MobySound recordings are phrases.
Figure A-3 – Diagrammatic sample of whale spectrograms (also called sonagrams) indicating
terminology used in describing songs. Frequency is given on the vertical axis, time on the horizontal axis. The circled areas are spectrograms that have been enlarged to show the
substructure of sounds which, unless slowed down, are not readily detected by the human ear.
All the singers in the same geographic area sing the same song at any one time and this song is constantly evolving over time (Payne et al. 1983, Noad et al. 2000, Cerchio et al. 2001). In some years the song changes rapidly and in other years there is little variation. For example, Payne and Payne (1985) observed complete changeover of song in more than 5 seasons in Bermuda, while complete changeover in Australia was observed in only 2 seasons (Noad et al. 2000).
Whales in non-overlapping regions sing entirely different songs, and as song evolves old patterns are not revisited (Darling 2006). For these reasons, classifiers should be based on units rather than phrases, themes, or songs. Units are structurally diverse, but it is more likely that similar units will be found over time and among populations versus similar themes or songs.
The function of song is unknown. Generally, singers are lone adult males (Tyack 1981, Baker and Herman 1984, Frankel et al. 1995, Darling and Berube 2001). Singing peaks during the winter breeding season, continues into spring, is rare in the summer and begins again in the fall (McSweeny et al 1989, Norris et al 1999, Clark and Clapham 2004). There are many hypotheses about the function of song and these include: 1) it is a sexual display by males to attract females (Winn and Winn 1978, Tyack 1981), 2) it is used to attract females and warn males (Tyack 1981, Frankel et al. 1995), 3) it is used as a display to reflect the status of singers to other males (Darling et al. 2006), 4) it promotes synchrony of estrus in females (Baker and Herman 1984), 5)
68 DRDC Atlantic CR 2008-287
it is used in navigation or orientation (Clapham and Mattila 1990), 6) it is a male spacing mechanism on breeding grounds (Frankel et al. 1995), and 7) it is used as sonar to locate females (Frazer and Mercado 2000). The most accepted hypothesis is that song is used to attract females and detract males (Baker and Herman 1984, Helwig et al. 1992, Frankel et al. 1995, Clapham 1996).
A.2.1 Literature Cited – Baker, C.S. and Herman, L.M. 1984. Aggressive behaviour between humpback
whales (Megaptera novaeangliae) wintering in Hawaiian waters. Can. J. Zool. 62: 1922-1937.
– Cerchio, S., J.K. Jacobsen, and T.F. Norris. 2001. Temporal and geographical variation in songs of humpback whales, Megaptera novaeangliae: synchronous change in Hawaiian and Mexican breeding assemblages. Animal Behaviour 62:313-329.
– Clapham, P.J. 1996. The social and reproductive biology of humpback whales: an ecological perspective. Mammal Rev. 26: 27-49. Clapham, P.J., and Mattila, D.K. 1990. Humpback whale songs as indications of migration routes. Mar. Mammal Sci. 6:155-160.
– Clark, C.W., and Clapham, P.J. 2004. Acoustic monitoring on a humpback whale (Megaptera novaeangliae) feeding ground shows continual singing into late spring. Proc. R. Soc. Lond. 271:1051-1057.
– Darling, J.D., and Berube, M. 2001. Interactions of singing humpback whales with other males. Mar. Mammal Sci. 17:570-584.
– Darling, J.D., Jones, M.E., and Nicklin, C.P. 2006. Humpback whale songs: do they organize males during the breeding season? Behaviour 143:1051-1101.
– Frankel, A.S., Clark, C.W., Herman, L.M., and Gabriele, C. 1995. Spatial distribution, habitat utilization, and social interactions of humpback whales, Megaptera novaeangliae, off Hawaii determined using acoustic and visual techniques. Can. J. Zool. 73:1134-1146.
– Frazer, L.N., and Mercado, E. 2000. A sonar model for the humpback whale song. J. Ocean. Eng. 25:160-181.
– Frumhoff, P. 1983. Aberrant songs of humpback whales (Megaptera novaeangliae): clues to the structure of humpback songs. In: Communication and Behavior of Whales (Ed. by R. Payne), pp. 81–127. Boulder, Colorado: Westview Press Helwig, D.A., Frankel, A.S., Mobley, J.R., and Herman, L.M. 1992. Humpback whale song: our current understanding. In: Marine mammal sensory systems (Thomas, J.A., Kastelein, R.A., and Supin, A.Y., eds.). Plenum Press, New York, p. 459-483.
– McSweeney, D.J., Chu, K.C., Dolphin,W.F., and Guinee, L.N. 1989. North Pacific Humpback whale songs: a comparison of southeast Alaskan feeding ground songs and Hawaiian wintering ground songs. Mar. Mammal Sci. 5: 16-138.
DRDC Atlantic CR 2008-287 69
– Noad, M.J., Cato, D.H., Bryden, M.M., Jenner, M.N., and Jenner, C.S. 2000. Cultural Revolution in whale songs. Nature 408:537.
– Norris, T.F., McDonald, M., and Barlow, J. 1999. Acoustic detections of singing humpback whales (Megaptera novaeangliae) in the eastern Pacific during their northbound migration. J. Acoust. Soc. Amer. 106: 506-514.
– Payne, K.P., and Payne, R.S. 1985. Large scale changes over 19 years in songs of Humpback whales of Bermuda. Z. Tierpsychol. 68:89-114.
– Payne, K., Tyack, P., and Payne, R. 1983. Progressive changes in the songs of humpback whales (Megaptera novaeangliae): a detailed analysis of two seasons in Hawaii.In: Communication and Behavior of Whales (Payne, R., ed.), Westview Press: Boulder, Colorado, pp. 9–57.
– Payne, R. S., and McVay, S. 1971. Songs of humpback whales. Science 173:585–597. Tyack, P.L. 1981. Interactions between singing Hawaiian humpback whales and Conspecifics nearby. Behav. Ecol. Sociobiol. 8: 105-116.
– Tyack, P.L. 1981. Interactions between singing Hawaiian humpback whales and conspecifics nearby. Behav. Ecol. Sociobiol. 8: 105-116.
– Winn, H.E., and Winn, L.K. 1978. The song of the humpback whale, Megaptera novaeangliae, in the West Indies. Mar. Biol. 47: 97-114.
70 DRDC Atlantic CR 2008-287
List of symbols/abbreviations/acronyms/initialisms
ACDC Acoustic Cetacean Detection Capability
ADAR Air Deployable Active Receiver
ADRF Acoustic Data Recording Facility
ALI Amplitude Line Integration
AN Ambient Noise
AS Acoustic Subsystem
ASCII American Standard Code for Information Interchange
AUTEC Atlantic Undersea Test and Evaluation Center
CF Canadian Forces
CFAV Canadian Forces Auxiliary Vessel
CM Configuration Management
CTO Chief Technical Officer
DAT Digital Audio Tape
DIFAR Directional Frequency and Ranging
DND Department of National Defence
DOY Day of Year
DRDC Defence Research and Development Canada
DREA Defence Research Establishment Atlantic
EADAQ Environmental Acoustic Data Acquisition
EMATT Expendable Mobile Anti-submarine warfare Training Target
ETI Energy Time Indicator
FFT Fast Fourier Transform
FIR Finite Impulse Response
FM Frequency Modulation
GUI Graphic User Interface
Hz Hertz
IDL Interactive Data Language
IP Internet Protocol
JASA Journal of the Acoustical Society of America
JIP Joint Industry Project
LFA Low Frequency Active
MPA Maritime Patrol Aircraft
DRDC Atlantic CR 2008-287 71
MS Microsoft
O&G Oil and Gas
OGP Oil and Gas Producers
OPD Omni-Passive Display
OS Operating System
PA Project Authority
PDF Probability Density Function
PSD Power Spectral Density
QA Quality Assurance
R&D Research and Development
RF Radio Frequency
RMS Root Mean Square
SNR Signal to Noise Ratio
SoX Linux Sound Exchange
SPPACS Signal Processing Packages
STAR Software Tools for Analysis and Research
SVN Subversion
TA Technical Authority
USA United States of America
WAV Wave file format (i.e. .wav)
WOSA Weighted Overlapped Segmented Averaged
72 DRDC Atlantic CR 2008-287
Distribution list
Document No.: DRDC Atlantic CR 2008-287
LIST PART 1: Internal Distribution by Centre 5 Paul C. Hines
5 DRDC Atlantic Library
1 H/US
1 Dave Hazen (TAG co-chair)
1 GL/MEA
1 H/US
1 Jim Theriault
1 Senior Military Officer
16 TOTAL LIST PART 1
LIST PART 2: External Distribution by DRDKIM
1 DRDKIM
1 Library and Archives Canada, Atten: Military Archivist, Government Records Branch
CFB Halifax, PO BOX 99000, Stn Forces, Halifax, NS B3K5X5
1 ADAC(A) – Commanding Officer
1 MARLANT N48
4 TOTAL LIST PART 2
20 TOTAL COPIES REQUIRED
DRDC Atlantic CR 2008-287 73

74 DRDC Atlantic CR 2008-287
This page intentionally left blank.
DOCUMENT CONTROL DATA (Security classification of title, body of abstract and indexing annotation must be entered when the overall document is classified)
1. ORIGINATOR (The name and address of the organization preparing the document. Organizations for whom the document was prepared, e.g. Centre sponsoring a contractor's report, or tasking agency, are entered in section 8.)
Akoostix Inc. 10 Akerley Blvd, Suite 12, Dartmouth, NS B3B 1J4
2. SECURITY CLASSIFICATION (Overall security classification of the document including special warning terms if applicable.)
UNCLASSIFIED
3. TITLE (The complete document title as indicated on the title page. Its classification should be indicated by the appropriate abbreviation (S, C or U) in parentheses after the title.)
Compilation of Marine Mammal Passive Transients for Aural Classification
4. AUTHORS (last name, followed by initials – ranks, titles, etc. not to be used)
Hood, J.; Burnett, D.
5. DATE OF PUBLICATION (Month and year of publication of document.)
April 2009
6a. NO. OF PAGES (Total containing information, including Annexes, Appendices, etc.)
92
6b. NO. OF REFS (Total cited in document.)
17
7. DESCRIPTIVE NOTES (The category of the document, e.g. technical report, technical note or memorandum. If appropriate, enter the type of report, e.g. interim, progress, summary, annual or final. Give the inclusive dates when a specific reporting period is covered.)
Contract Report
8. SPONSORING ACTIVITY (The name of the department project office or laboratory sponsoring the research and development – include address.)
Defence R&D Canada – Atlantic 9 Grove Street P.O. Box 1012 Dartmouth, Nova Scotia B2Y 3Z7
9a. PROJECT OR GRANT NO. (If appropriate, the applicable research and development project or grant number under which the document was written. Please specify whether project or grant.)
9b. CONTRACT NO. (If appropriate, the applicable number under which the document was written.)
W7707-078039/001/HAL
10a. ORIGINATOR'S DOCUMENT NUMBER (The official document number by which the document is identified by the originating activity. This number must be unique to this document.)
DRDC Atlantic CR 2008-287
10b. OTHER DOCUMENT NO(s). (Any other numbers which may be assigned this document either by the originator or by the sponsor.)
11. DOCUMENT AVAILABILITY (Any limitations on further dissemination of the document, other than those imposed by security classification.)
Unlimited
12. DOCUMENT ANNOUNCEMENT (Any limitation to the bibliographic announcement of this document. This will normally correspond to the Document Availability (11). However, where further distribution (beyond the audience specified in (11) is possible, a wider announcement audience may be selected.))
13. ABSTRACT T (A brief and factual summary of the document. It may also appear elsewhere in the body of the document itself. It is highly desirable that the abstract of classified documents be unclassified. Each paragraph of the abstract shall begin with an indication of the security classification of the information in the paragraph (unless the document itself is unclassified) represented as (S), (C), (R), or (U). It is not necessary to include here abstracts in both official languages unless the text is bilingual.)
This report documents the work performed to generate a database of marine mammalvocalizations for use with DRDC Atlantic’s prototype automatic aural classifier. The projectinvolved the selection of appropriate marine mammal and ambient noise data sets, formattingthe data, detection processing, extraction of the potential samples, establishment of ground-truthdata, post-processing of the data, and classification of each selected sample. Several DRDCAtlantic tools were utilized to perform the variety of tasks, including the Sentinel AcousticSubsystem (AS) detector, the Acoustic Cetacean Detection Capability (ACDC) application, theSoftware Tools for Analysis and Research (STAR) suite, and the Omni-Passive Display (OPD)signal processing application. The resulting database contains individually classified samples(hundreds each) of Bowhead, Sperm, Right, and Humpback whales. Each sample exists as anisolated and uniquely identified WAV file. Minimal software development was conducted aspart of this contract, although several benefits were realized as the result of synergeticdevelopment from separate contracts. The database produced by this contract will directlysupport the ongoing automated aural classification development.
Le présent rapport documente le travail accompli aux fins de création d’une base de données devocalisations de mammifères marins devant être utilisée avec le prototype classificateur designaux sonores de RDDC. Ce projet nécessitait la sélection de mammifères marins appropriéset d’un ensemble de données de bruits ambiants, la mise en forme des données, la détection,l’extraction d’échantillons potentiels, la prise de données sur le terrain, le post-traitement desdonnées, ainsi que la classification de tous les échantillons retenus. Plusieurs outils de RDDCAtlantique ont été utilisés pour exécuter les diverses tâches, y compris le système de détectionSentinel, l’application « Acoustic Cetacean Detection Capability » (ACDC), la suite logicielled’analyse et de recherche (STAR), l’application de traitement de signal à affichage Omni passif(OPD). La base de données ainsi créée renferme des échantillons classés individuellement (100par espèce de baleine) pour la baleine boréale, le cachalot, la baleine noire et le rorqual à bosse.Chaque échantillon existe sous la forme d’un fichier « .wav » distinct et unique. Un travail dedéveloppement logiciel minime a été réalisé dans le cadre de ce contrat, mais le travail dedéveloppement accompli aux termes de plusieurs contrats distincts a globalement été fructueux.La base de données créée dans le cadre de ce contrat viendra directement appuyer le travail dedéveloppement mené en classification automatisée de signaux sonores.
14. KEYWORDS, DESCRIPTORS or IDENTIFIERS (Technically meaningful terms or short phrases that characterize a document and could be helpful in cataloguing the document. They should be selected so that no security classification is required. Identifiers, such as equipment model designation, trade name, military project code name, geographic location may also be included. If possible keywords should be selected from a published thesaurus, e.g. Thesaurus of Engineering and Scientific Terms (TEST) and that thesaurus identified. If it is not possible to select indexing terms which are Unclassified, the classification of each should be indicated as with the title.)
marine mammals, vocalizations, aural classification

This page intentionally left blank.