Embed Size (px)
Citation preview
Competition between anthocyanin and flavonolbiosynthesis produces spatial pattern variation offloral pigments between Mimulus speciesYao-Wu Yuana,b,c,1, Alexandra B. Rebochod, Janelle M. Sagawaa,b, Lauren E. Stanleyb, and Harvey D. Bradshaw Jr.a,1
aDepartment of Biology, University of Washington, Seattle, WA 98195; bDepartment of Ecology and Evolutionary Biology, University of Connecticut, Storrs,CT 06269; cInstitute for Systems Genomics, University of Connecticut, Storrs, CT 06269; and dDepartment of Cell and Developmental Biology, John InnesCentre, Norwich Research Park, Norwich NR4 7UH, United Kingdom
Edited by Sean B. Carroll, Howard Hughes Medical Institute and University of Wisconsin–Madison, Madison, WI, and approved January 21, 2016 (received forreview August 2, 2015)
Flower color patterns have long served as a model for develop-mental genetics because pigment phenotypes are visually striking,yet generally not required for plant viability, facilitating the geneticanalysis of color and pattern mutants. The evolution of novel flowercolors and patterns has played a key role in the adaptive radiationof flowering plants via their specialized interactions with differentpollinator guilds (e.g., bees, butterflies, birds), motivating the searchfor allelic differences affecting flower color pattern in closely relatedplant species with different pollinators. We have identified LIGHTAREAS1 (LAR1), encoding an R2R3-MYB transcription factor, as thecausal gene underlying the spatial pattern variation of floral antho-cyanin pigmentation between two sister species of monkeyflower:the bumblebee-pollinated Mimulus lewisii and the hummingbird-pollinated Mimulus cardinalis. We demonstrated that LAR1 posi-tively regulates FLAVONOL SYNTHASE (FLS), essentially eliminatinganthocyanin biosynthesis in the white region (i.e., light areas)around the corolla throat ofM. lewisii flowers by diverting dihydro-flavonol into flavonol biosynthesis from the anthocyanin pigmentpathway. FLS is preferentially expressed in the light areas of theM. lewisii flower, thus prepatterning the corolla. LAR1 expression inM. cardinalis flowers is much lower than inM. lewisii, explaining theunpatterned phenotype and recessive inheritance of the M. cardi-nalis allele. Furthermore, our gene-expression analysis and geneticmapping results suggest that cis-regulatory change at the LAR1gene played a critical role in the evolution of different pigmentationpatterns between the two species.
flower color pattern | Mimulus | anthocyanins | flavonols | R2R3-MYB
Many flowers display interesting color patterns (e.g., spots,stripes, picotees, bull’s-eyes) that are precisely programmed
during development. Numerous studies have shown that thesecolor patterns are critically important for plant–pollinator inter-actions (1–8). Among the most captivating examples are deceptiveorchids that display floral pigment patterns remarkably similar tofemale bees or wasps to lure male counterparts for pseudocopu-lation, thereby achieving pollination (9–11). Despite the obviousaesthetic and ecological significance of these flower color patterns,the molecular mechanisms of pigment pattern formation is notwell understood, nor is the genetic basis underlying pattern vari-ation between related species in nature.From a genetic and developmental viewpoint, the most exten-
sively studied flower color pattern is venation. Studies in snap-dragon (Antirrhinum majus) and petunia (Petunia hybrida) haverevealed a conserved mechanism for the formation of vein-associ-ated anthocyanin pigmentation pattern in petal epidermis. Pigmentsare only produced in the overlapping expression domains of theR2R3-MYB and bHLH coregulators of anthocyanin biosyntheticgenes; the bHLH expression is confined to the petal epidermis andthe R2R3-MYB expression is specific to cells above the vascularbundles (8, 12, 13). However, the molecular basis of variation in thiscolor pattern among natural species is less clear, although in the
case of Antirrhinum, the R2R3-MYB, Venosa, was implicated as thecausal gene, explaining much of the natural variation (8, 12). An-other interesting pigmentation pattern that has been investigated isthat of petal spots. Genetic and developmental analyses of petalspot formation in Gorteria diffusa (14), Clarkia gracilis (15), andLilium spp. (16) have suggested potential genes and mechanismsunderlying spot formation, but the lack of functional analyses inthese systems has so far prevented a deeper understanding of theprecise molecular bases and developmental mechanisms, a pre-requisite for understanding the evolution of petal spot variationamong species.One way to simultaneously address how flower color patterns
are generated during the development of an individual plant, andhow these patterns are diversified among species, is to geneticallymap the causal locus (or loci) underlying pattern variation be-tween closely related species, and then examine how differentalleles generate different patterns during development. Using thisapproach we have analyzed a spatial pattern variation of antho-cyanin pigmentation between two sister species of Mimulus.The bumblebee-pollinated Mimulus lewisii bears pink flowers
colored by anthocyanins (except the yellow nectar guides asa result of carotenoid pigmentation) (Fig. 1A), whereas the
Significance
The incredible diversity of vivid color patterns in natural or-ganisms (e.g., butterfly wings, tropical fish skins, angiospermflowers) has fascinated generations of biologists. Yet, neitherthe molecular mechanisms responsible for the color patternformation nor the genetic bases underlying natural color patternvariation are well understood. In this study we have identified acausal gene underlying spatial pattern variation of floral pig-ments between two Mimulus (monkeyflowers) species: thebumblebee-pollinated Mimulus lewisii and the hummingbird-pollinated Mimulus cardinalis. We demonstrate that the com-petition between anthocyanin and flavonol biosynthesis sets a“prepattern” of pigment distribution in M. lewisii, producinga white region surrounding the throat of the otherwise pinkcorolla. This is likely to be a common mechanism underlyingflower color patterns.
Author contributions: Y.-W.Y. and H.D.B. designed research; Y.-W.Y., A.B.R., J.M.S., L.E.S.,and H.D.B. performed research; Y.-W.Y. analyzed data; and Y.-W.Y. and H.D.B. wrotethe paper.
The authors declare no conflict of interest.
This article is a PNAS Direct Submission.
Data deposition: The sequences reported in this paper has been deposited in the NCBIShort Read Archive (accession no. SRA274748) and the GenBank database (accession nos.KT224453–KT224456).1To whom correspondence may be addressed. Email: [email protected] or [email protected].
This article contains supporting information online at www.pnas.org/lookup/suppl/doi:10.1073/pnas.1515294113/-/DCSupplemental.
2448–2453 | PNAS | March 1, 2016 | vol. 113 | no. 9 www.pnas.org/cgi/doi/10.1073/pnas.1515294113
Dow
nloa
ded
by g
uest
on
Feb
ruar
y 9,
202
0
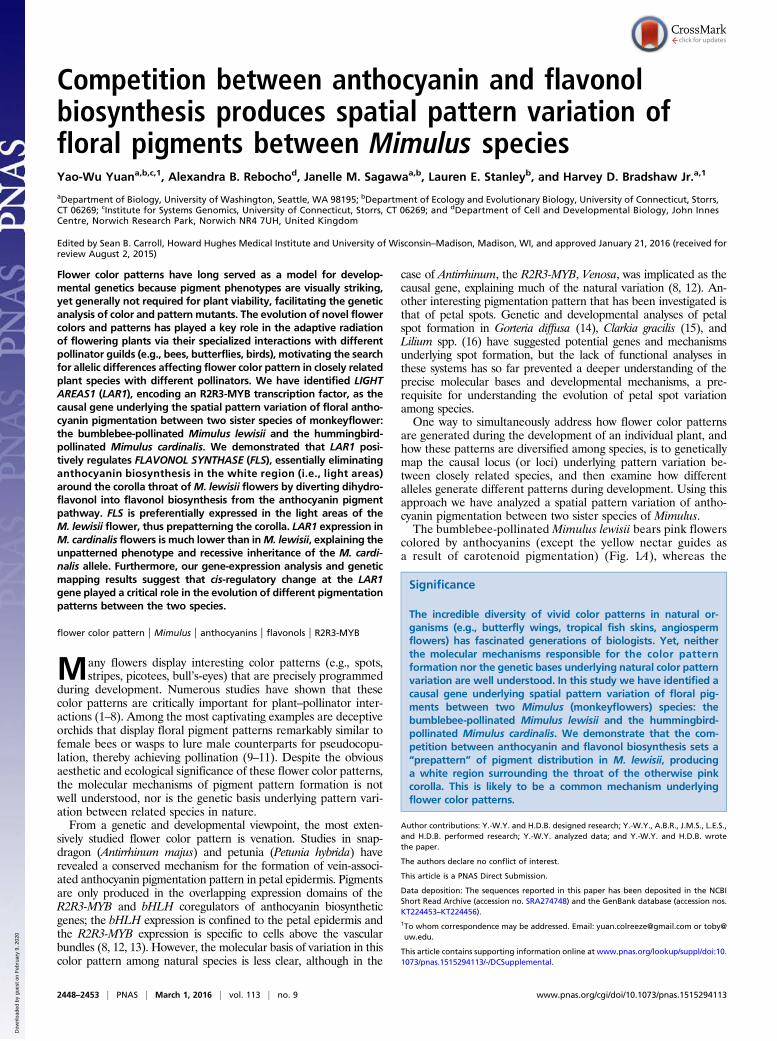
hummingbird-pollinated Mimulus cardinalis produces red flowersas a result of a combination of anthocyanins and carotenoids (Fig.1B). The petal lobes of M. lewisii display an interesting spatialpattern of anthocyanin pigmentation that is distinct from that seenin M. cardinalis: a white region surrounding the throat of theotherwise pink corolla (Fig. 1A). This is a common floral pigmentpattern characterized as marginal picotee, “in which proximal anddistal parts of the petals show different colors and the wholeflower shows a central spot of one color, encircled by a ring ofanother” (17). This phenotype has been studied by Hiesey et al.(18) and the white regions surrounding the corolla throat werenamed “light areas.” The presence vs. absence of the pattern waspostulated to be controlled by a single Mendelian locus (18), whichwe have called LIGHT AREAS1 (LAR1) (18). The M. lewisii alleleis dominant, with F1 hybrids between M. lewisii and M. cardinalisshowing the light area phenotype (Fig. 1C). Despite being a rela-tively subtle pattern, the light areas play an important role in bum-blebee pollination, as the lack of light areas in a chemically inducedM. lewsii floral mutant was shown to significantly decrease bumble-bee visitation rate (7).Here we show that the LAR1 locus encodes an R2R3-MYB
transcription factor that regulates the expression of FLAVONOLSYNTHASE (FLS). The dominant LAR1 allele inM. lewisii causeshigh expression of FLS in the light areas relative to the pink areas,which presumably redirects metabolite flux from anthocyaninbiosynthesis to the production of colorless flavonols, therebyexplaining the lack of pink color in the light areas. The recessivelar1 allele in M. cardinalis has very low expression level in thepetal lobe because of a cis-regulatory difference, which leads to alow level of FLS expression in the petal lobe and a consequentabsence of the spatial patterning.
Results and DiscussionCreation of a High-Resolution Near-Isogenic Line. In addition to thepresence vs. absence of the light areas, F2 hybrids betweenM. lewisii and M. cardinalis display a wide range of pigmentcomposition and intensity (18). To make phenotype scoring morestraightforward and to facilitate downstream gene expressionanalysis, we created a high-resolution lar1/lar1 near-isogenic line(NIL) in the M. lewisii LF10 genetic background. The recessive
M. cardinalis CE10 lar1 allele was introgressed into LF10through four rounds of backcrossing and selfing, with phenotype-based selection; after each selfing event, a single individuallacking the light areas but otherwise most similar to LF10 wasselected for the next round of backcrossing. The resulting BC4S1lar1/lar1 NIL closely resemble LF10, except in the light area trait(Fig. 1D).
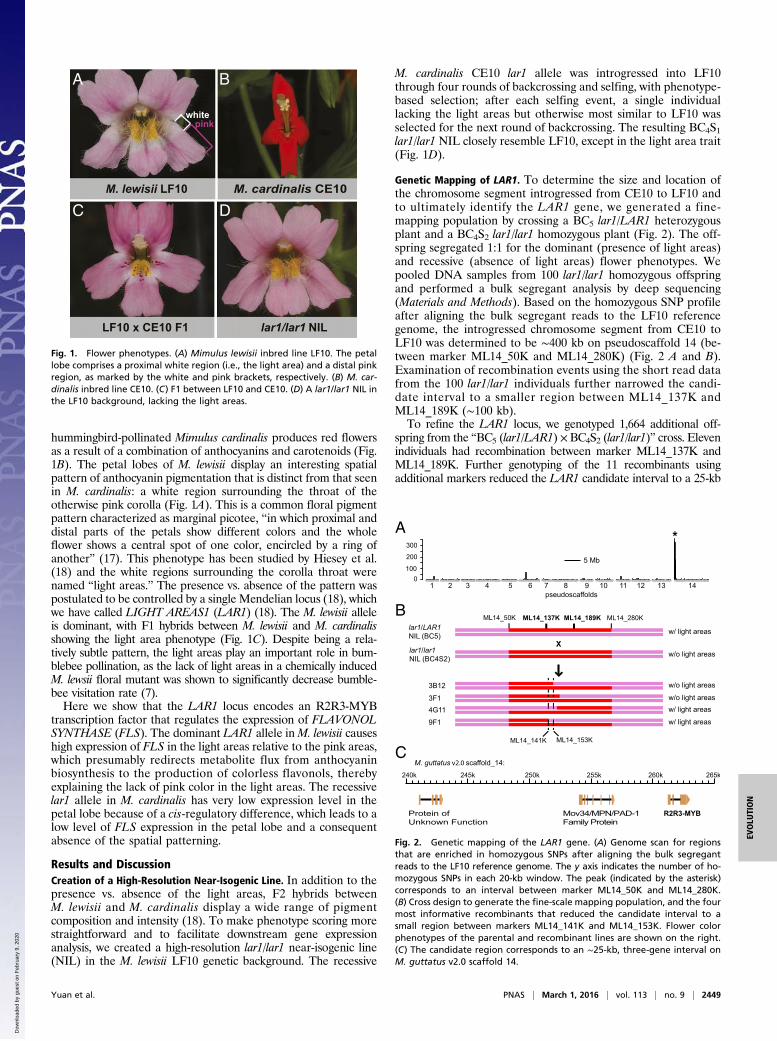
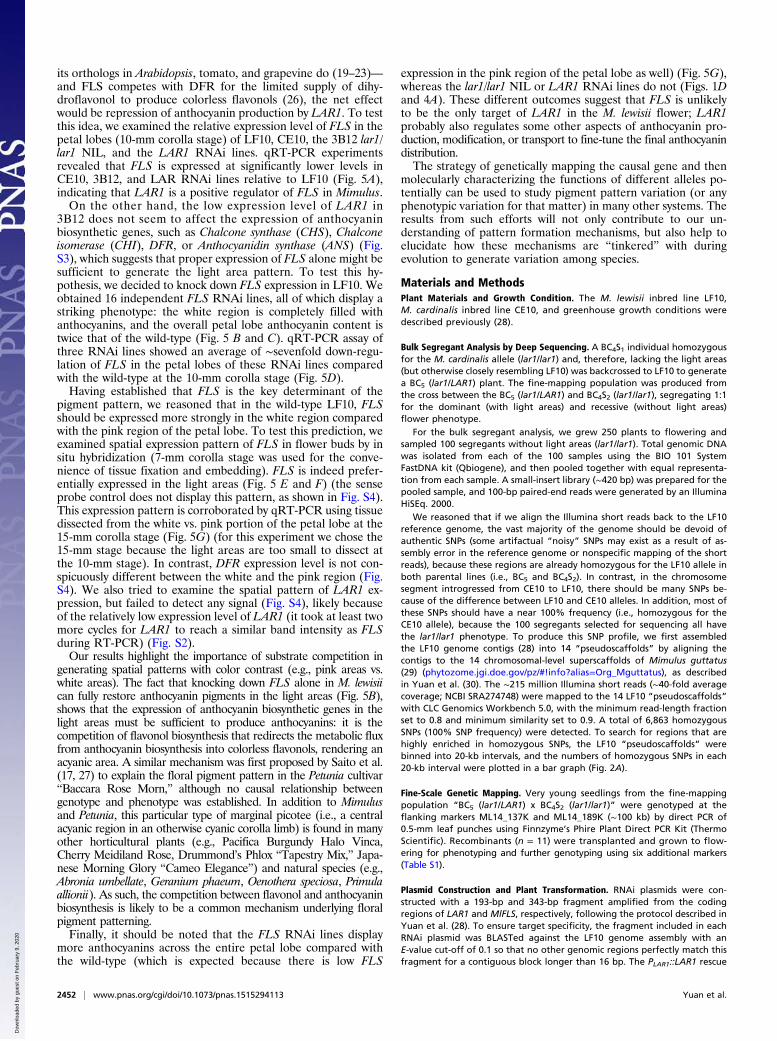
Genetic Mapping of LAR1. To determine the size and location ofthe chromosome segment introgressed from CE10 to LF10 andto ultimately identify the LAR1 gene, we generated a fine-mapping population by crossing a BC5 lar1/LAR1 heterozygousplant and a BC4S2 lar1/lar1 homozygous plant (Fig. 2). The off-spring segregated 1:1 for the dominant (presence of light areas)and recessive (absence of light areas) flower phenotypes. Wepooled DNA samples from 100 lar1/lar1 homozygous offspringand performed a bulk segregant analysis by deep sequencing(Materials and Methods). Based on the homozygous SNP profileafter aligning the bulk segregant reads to the LF10 referencegenome, the introgressed chromosome segment from CE10 toLF10 was determined to be ∼400 kb on pseudoscaffold 14 (be-tween marker ML14_50K and ML14_280K) (Fig. 2 A and B).Examination of recombination events using the short read datafrom the 100 lar1/lar1 individuals further narrowed the candi-date interval to a smaller region between ML14_137K andML14_189K (∼100 kb).To refine the LAR1 locus, we genotyped 1,664 additional off-
spring from the “BC5 (lar1/LAR1) ×BC4S2 (lar1/lar1)” cross. Elevenindividuals had recombination between marker ML14_137K andML14_189K. Further genotyping of the 11 recombinants usingadditional markers reduced the LAR1 candidate interval to a 25-kb
A B
C D
Fig. 1. Flower phenotypes. (A) Mimulus lewisii inbred line LF10. The petallobe comprises a proximal white region (i.e., the light area) and a distal pinkregion, as marked by the white and pink brackets, respectively. (B) M. car-dinalis inbred line CE10. (C) F1 between LF10 and CE10. (D) A lar1/lar1 NIL inthe LF10 background, lacking the light areas.
A
C
1 2pseudoscaffolds
3 4 5 6 7 8 9 10 12 13 1411
*
M. guttatus v2.0 scaffold_14:
5 Mb100
200
300
0
9F1
X
lar1/LAR1NIL (BC5)
lar1/lar1 NIL (BC4S2)
ML14_153KML14_141K
3F1
ML14_50K ML14_137K ML14_189K ML14_280K
4G11
w/o light areas 3B12 w/o light areas
w/ light areas
w/ light areas
w/ light areas
w/o light areas
B
Protein of Unknown Function
R2R3-MYBMov34/MPN/PAD-1Family Protein
240k 245k 250k 255k 260k 265k
Fig. 2. Genetic mapping of the LAR1 gene. (A) Genome scan for regionsthat are enriched in homozygous SNPs after aligning the bulk segregantreads to the LF10 reference genome. The y axis indicates the number of ho-mozygous SNPs in each 20-kb window. The peak (indicated by the asterisk)corresponds to an interval between marker ML14_50K and ML14_280K.(B) Cross design to generate the fine-scale mapping population, and the fourmost informative recombinants that reduced the candidate interval to asmall region between markers ML14_141K and ML14_153K. Flower colorphenotypes of the parental and recombinant lines are shown on the right.(C) The candidate region corresponds to an ∼25-kb, three-gene interval onM. guttatus v2.0 scaffold 14.
Yuan et al. PNAS | March 1, 2016 | vol. 113 | no. 9 | 2449
EVOLU
TION
Dow
nloa
ded
by g
uest
on
Feb
ruar
y 9,
202
0
region containing only three genes (Fig. 2 B and C and Fig. S1).One of the recombinants, 3B12 (Fig. 2B), was selected to generatea lar1/lar1 homozygous NIL for subsequent transgenic experimentsand gene expression analysis.
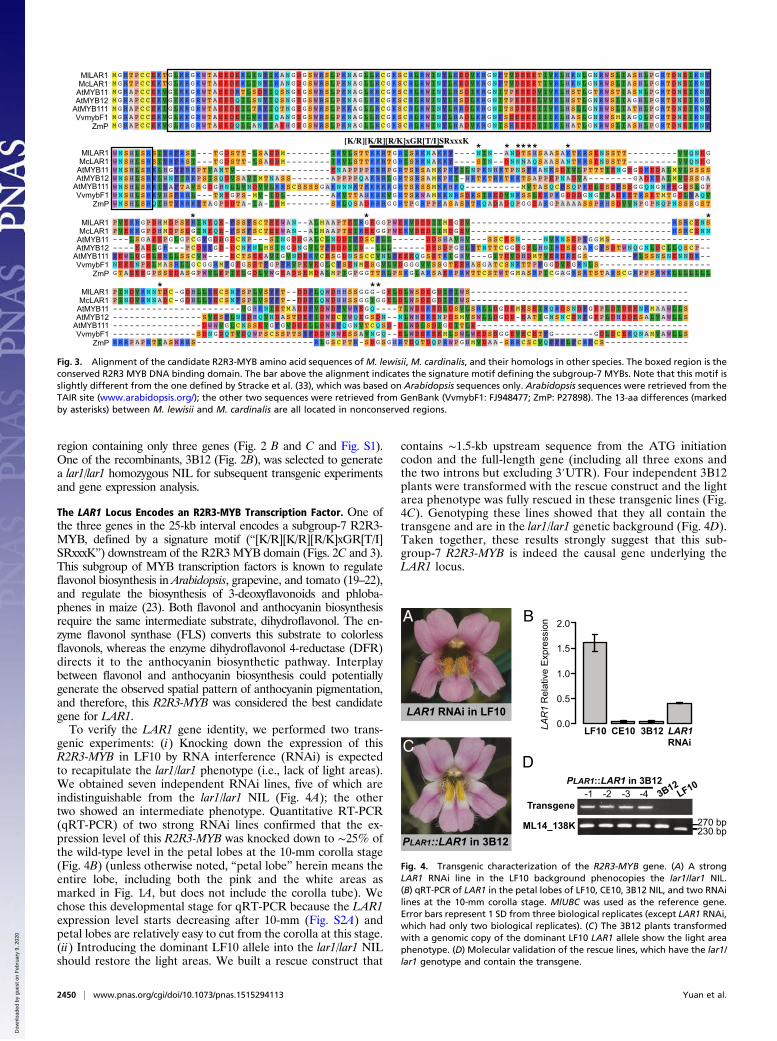
The LAR1 Locus Encodes an R2R3-MYB Transcription Factor. One ofthe three genes in the 25-kb interval encodes a subgroup-7 R2R3-MYB, defined by a signature motif (“[K/R][K/R][R/K]xGR[T/I]SRxxxK”) downstream of the R2R3MYB domain (Figs. 2C and 3).This subgroup of MYB transcription factors is known to regulateflavonol biosynthesis in Arabidopsis, grapevine, and tomato (19–22),and regulate the biosynthesis of 3-deoxyflavonoids and phloba-phenes in maize (23). Both flavonol and anthocyanin biosynthesisrequire the same intermediate substrate, dihydroflavonol. The en-zyme flavonol synthase (FLS) converts this substrate to colorlessflavonols, whereas the enzyme dihydroflavonol 4-reductase (DFR)directs it to the anthocyanin biosynthetic pathway. Interplaybetween flavonol and anthocyanin biosynthesis could potentiallygenerate the observed spatial pattern of anthocyanin pigmentation,and therefore, this R2R3-MYB was considered the best candidategene for LAR1.To verify the LAR1 gene identity, we performed two trans-
genic experiments: (i) Knocking down the expression of thisR2R3-MYB in LF10 by RNA interference (RNAi) is expectedto recapitulate the lar1/lar1 phenotype (i.e., lack of light areas).We obtained seven independent RNAi lines, five of which areindistinguishable from the lar1/lar1 NIL (Fig. 4A); the othertwo showed an intermediate phenotype. Quantitative RT-PCR(qRT-PCR) of two strong RNAi lines confirmed that the ex-pression level of this R2R3-MYB was knocked down to ∼25% ofthe wild-type level in the petal lobes at the 10-mm corolla stage(Fig. 4B) (unless otherwise noted, “petal lobe” herein means theentire lobe, including both the pink and the white areas asmarked in Fig. 1A, but does not include the corolla tube). Wechose this developmental stage for qRT-PCR because the LAR1expression level starts decreasing after 10-mm (Fig. S2A) andpetal lobes are relatively easy to cut from the corolla at this stage.(ii) Introducing the dominant LF10 allele into the lar1/lar1 NILshould restore the light areas. We built a rescue construct that
contains ∼1.5-kb upstream sequence from the ATG initiationcodon and the full-length gene (including all three exons andthe two introns but excluding 3′UTR). Four independent 3B12plants were transformed with the rescue construct and the lightarea phenotype was fully rescued in these transgenic lines (Fig.4C). Genotyping these lines showed that they all contain thetransgene and are in the lar1/lar1 genetic background (Fig. 4D).Taken together, these results strongly suggest that this sub-group-7 R2R3-MYB is indeed the causal gene underlying theLAR1 locus.
Fig. 3. Alignment of the candidate R2R3-MYB amino acid sequences of M. lewisii, M. cardinalis, and their homologs in other species. The boxed region is theconserved R2R3 MYB DNA binding domain. The bar above the alignment indicates the signature motif defining the subgroup-7 MYBs. Note that this motif isslightly different from the one defined by Stracke et al. (33), which was based on Arabidopsis sequences only. Arabidopsis sequences were retrieved from theTAIR site (www.arabidopsis.org/); the other two sequences were retrieved from GenBank (VvmybF1: FJ948477; ZmP: P27898). The 13-aa differences (markedby asterisks) between M. lewisii and M. cardinalis are all located in nonconserved regions.
A B
CD
Fig. 4. Transgenic characterization of the R2R3-MYB gene. (A) A strongLAR1 RNAi line in the LF10 background phenocopies the lar1/lar1 NIL.(B) qRT-PCR of LAR1 in the petal lobes of LF10, CE10, 3B12 NIL, and two RNAilines at the 10-mm corolla stage. MlUBC was used as the reference gene.Error bars represent 1 SD from three biological replicates (except LAR1 RNAi,which had only two biological replicates). (C) The 3B12 plants transformedwith a genomic copy of the dominant LF10 LAR1 allele show the light areaphenotype. (D) Molecular validation of the rescue lines, which have the lar1/lar1 genotype and contain the transgene.
2450 | www.pnas.org/cgi/doi/10.1073/pnas.1515294113 Yuan et al.
Dow
nloa
ded
by g
uest
on
Feb
ruar
y 9,
202
0
Cis-Regulatory Change Causes LAR1 Allelic Difference. Having identi-fied the causal gene, we next asked: What is the molecular natureof the allelic difference underlying the phenotypic difference be-tweenM. lewisii LF10 andM. cardinalis CE10? We first comparedthe amino acid sequences of the LF10 and CE10 alleles. There are13 amino acid substitutions between the two alleles (Fig. 3).However, all these substitutions are located in hypervariable re-gions (marked by asterisks in Fig. 3), and are therefore unlikely tohave functional significance.Alternatively, if the recessive M. cardinalis allele is the result
of cis-regulatory change, the LAR1 mRNA level should be lowerin M. cardinalis than in M. lewisii flowers. qRT-PCR experimentson the LAR1 gene in LF10, CE10, and 3B12 petal lobes at the10-mm corolla stage strongly support this hypothesis. The LAR1transcript level is ∼40-fold lower in CE10 than in LF10 (Fig. 4B).A similarly low level of LAR1 expression in the NIL background(Fig. 4B) suggests that the expression difference is unlikely to becaused by trans-acting factors located somewhere else in thegenome. More importantly, the fine-mapping results suggest thatwhatever the causal mutations are, they must locate in the 25-kbcandidate interval, thus ruling out trans-acting factors outside the25-kb interval as potential causes of the gene expression change.Furthermore, allele-specific restriction enzyme digestion of aLAR1 gene fragment amplified from the F1 hybrid cDNA also
showed preferential expression of the LF10 allele over the CE10allele (Fig. S2B), indicating a promoter activity (i.e., cis-element)difference between LF10 and CE10.Although we cannot completely rule out the possibility that
the coding DNA changes may also play a role, our results fromthe RNAi experiment and gene-expression analyses allow us toconclude that cis-regulatory changes in the LAR1 gene are suf-ficient to explain the allelic difference between the two species.These results on the functional divergence of the LAR1 allelesbetween M. lewisii and M. cardinalis contribute to a rapidlygrowing body of evidence that support the critical role of cis-regulatory changes in phenotypic diversification (reviewed inrefs. 24 and 25).
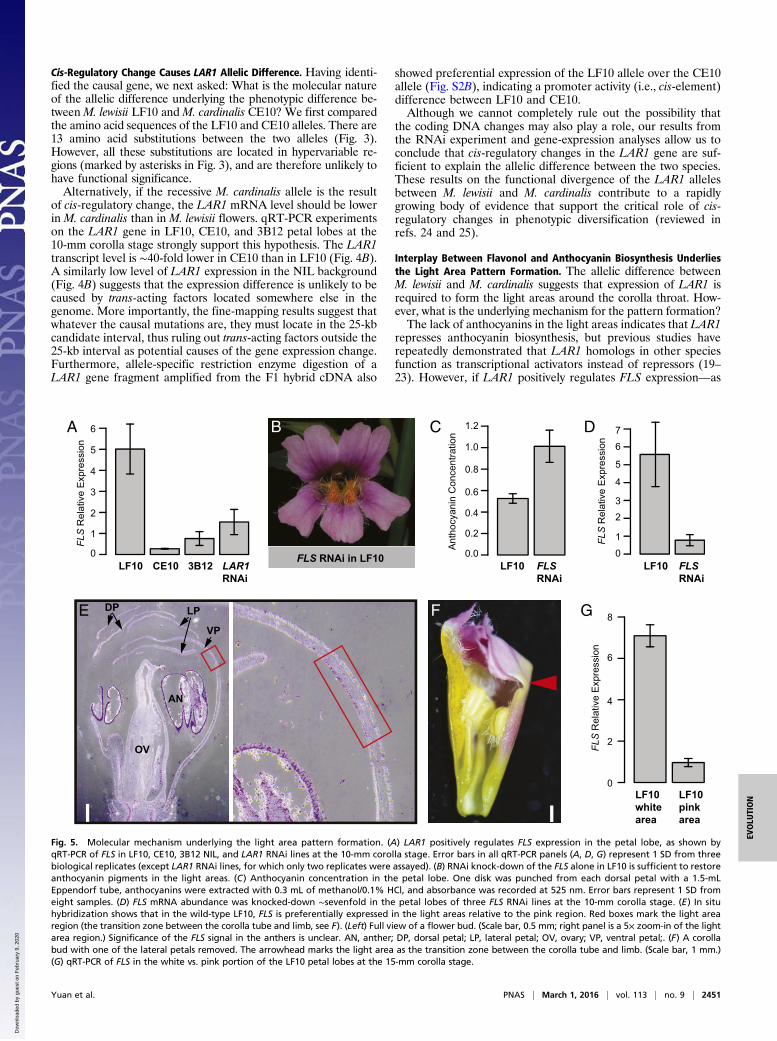
Interplay Between Flavonol and Anthocyanin Biosynthesis Underliesthe Light Area Pattern Formation. The allelic difference betweenM. lewisii and M. cardinalis suggests that expression of LAR1 isrequired to form the light areas around the corolla throat. How-ever, what is the underlying mechanism for the pattern formation?The lack of anthocyanins in the light areas indicates that LAR1
represses anthocyanin biosynthesis, but previous studies haverepeatedly demonstrated that LAR1 homologs in other speciesfunction as transcriptional activators instead of repressors (19–23). However, if LAR1 positively regulates FLS expression—as
FLS RNAi in LF10
B
LF10 CE10 LF10 FLSRNAi
LF10 FLSRNAi
3B12 LAR1RNAi
A
1
0
2
3
4
5
6
FLS
Rel
ativ
e E
xpre
ssio
n
DC
1
0
23
4
5
67
0
2
4
6
8
FLS
Rel
ativ
e E
xpre
ssio
nFL
S R
elat
ive
Exp
ress
ion
E
OV
AN
DP
VP
LP
0.0
0.2
0.4
0.6
0.8
1.0
1.2
Ant
hocy
anin
Con
cent
ratio
n
F G
LF10whitearea
LF10pinkarea
Fig. 5. Molecular mechanism underlying the light area pattern formation. (A) LAR1 positively regulates FLS expression in the petal lobe, as shown byqRT-PCR of FLS in LF10, CE10, 3B12 NIL, and LAR1 RNAi lines at the 10-mm corolla stage. Error bars in all qRT-PCR panels (A, D, G) represent 1 SD from threebiological replicates (except LAR1 RNAi lines, for which only two replicates were assayed). (B) RNAi knock-down of the FLS alone in LF10 is sufficient to restoreanthocyanin pigments in the light areas. (C) Anthocyanin concentration in the petal lobe. One disk was punched from each dorsal petal with a 1.5-mLEppendorf tube, anthocyanins were extracted with 0.3 mL of methanol/0.1% HCl, and absorbance was recorded at 525 nm. Error bars represent 1 SD fromeight samples. (D) FLS mRNA abundance was knocked-down ∼sevenfold in the petal lobes of three FLS RNAi lines at the 10-mm corolla stage. (E) In situhybridization shows that in the wild-type LF10, FLS is preferentially expressed in the light areas relative to the pink region. Red boxes mark the light arearegion (the transition zone between the corolla tube and limb, see F). (Left) Full view of a flower bud. (Scale bar, 0.5 mm; right panel is a 5× zoom-in of the lightarea region.) Significance of the FLS signal in the anthers is unclear. AN, anther; DP, dorsal petal; LP, lateral petal; OV, ovary; VP, ventral petal;. (F) A corollabud with one of the lateral petals removed. The arrowhead marks the light area as the transition zone between the corolla tube and limb. (Scale bar, 1 mm.)(G) qRT-PCR of FLS in the white vs. pink portion of the LF10 petal lobes at the 15-mm corolla stage.
Yuan et al. PNAS | March 1, 2016 | vol. 113 | no. 9 | 2451
EVOLU
TION
Dow
nloa
ded
by g
uest
on
Feb
ruar
y 9,
202
0
its orthologs in Arabidopsis, tomato, and grapevine do (19–23)—and FLS competes with DFR for the limited supply of dihy-droflavonol to produce colorless flavonols (26), the net effectwould be repression of anthocyanin production by LAR1. To testthis idea, we examined the relative expression level of FLS in thepetal lobes (10-mm corolla stage) of LF10, CE10, the 3B12 lar1/lar1 NIL, and the LAR1 RNAi lines. qRT-PCR experimentsrevealed that FLS is expressed at significantly lower levels inCE10, 3B12, and LAR RNAi lines relative to LF10 (Fig. 5A),indicating that LAR1 is a positive regulator of FLS in Mimulus.On the other hand, the low expression level of LAR1 in
3B12 does not seem to affect the expression of anthocyaninbiosynthetic genes, such as Chalcone synthase (CHS), Chalconeisomerase (CHI), DFR, or Anthocyanidin synthase (ANS) (Fig.S3), which suggests that proper expression of FLS alone might besufficient to generate the light area pattern. To test this hy-pothesis, we decided to knock down FLS expression in LF10. Weobtained 16 independent FLS RNAi lines, all of which display astriking phenotype: the white region is completely filled withanthocyanins, and the overall petal lobe anthocyanin content istwice that of the wild-type (Fig. 5 B and C). qRT-PCR assay ofthree RNAi lines showed an average of ∼sevenfold down-regu-lation of FLS in the petal lobes of these RNAi lines comparedwith the wild-type at the 10-mm corolla stage (Fig. 5D).Having established that FLS is the key determinant of the
pigment pattern, we reasoned that in the wild-type LF10, FLSshould be expressed more strongly in the white region comparedwith the pink region of the petal lobe. To test this prediction, weexamined spatial expression pattern of FLS in flower buds by insitu hybridization (7-mm corolla stage was used for the conve-nience of tissue fixation and embedding). FLS is indeed prefer-entially expressed in the light areas (Fig. 5 E and F) (the senseprobe control does not display this pattern, as shown in Fig. S4).This expression pattern is corroborated by qRT-PCR using tissuedissected from the white vs. pink portion of the petal lobe at the15-mm corolla stage (Fig. 5G) (for this experiment we chose the15-mm stage because the light areas are too small to dissect atthe 10-mm stage). In contrast, DFR expression level is not con-spicuously different between the white and the pink region (Fig.S4). We also tried to examine the spatial pattern of LAR1 ex-pression, but failed to detect any signal (Fig. S4), likely becauseof the relatively low expression level of LAR1 (it took at least twomore cycles for LAR1 to reach a similar band intensity as FLSduring RT-PCR) (Fig. S2).Our results highlight the importance of substrate competition in
generating spatial patterns with color contrast (e.g., pink areas vs.white areas). The fact that knocking down FLS alone in M. lewisiican fully restore anthocyanin pigments in the light areas (Fig. 5B),shows that the expression of anthocyanin biosynthetic genes in thelight areas must be sufficient to produce anthocyanins: it is thecompetition of flavonol biosynthesis that redirects the metabolic fluxfrom anthocyanin biosynthesis into colorless flavonols, rendering anacyanic area. A similar mechanism was first proposed by Saito et al.(17, 27) to explain the floral pigment pattern in the Petunia cultivar“Baccara Rose Morn,” although no causal relationship betweengenotype and phenotype was established. In addition to Mimulusand Petunia, this particular type of marginal picotee (i.e., a centralacyanic region in an otherwise cyanic corolla limb) is found in manyother horticultural plants (e.g., Pacifica Burgundy Halo Vinca,Cherry Meidiland Rose, Drummond’s Phlox “Tapestry Mix,” Japa-nese Morning Glory “Cameo Elegance”) and natural species (e.g.,Abronia umbellate, Geranium phaeum, Oenothera speciosa, Primulaallionii). As such, the competition between flavonol and anthocyaninbiosynthesis is likely to be a common mechanism underlying floralpigment patterning.Finally, it should be noted that the FLS RNAi lines display
more anthocyanins across the entire petal lobe compared withthe wild-type (which is expected because there is low FLS
expression in the pink region of the petal lobe as well) (Fig. 5G),whereas the lar1/lar1 NIL or LAR1 RNAi lines do not (Figs. 1Dand 4A). These different outcomes suggest that FLS is unlikelyto be the only target of LAR1 in the M. lewisii flower; LAR1probably also regulates some other aspects of anthocyanin pro-duction, modification, or transport to fine-tune the final anthocyanindistribution.The strategy of genetically mapping the causal gene and then
molecularly characterizing the functions of different alleles po-tentially can be used to study pigment pattern variation (or anyphenotypic variation for that matter) in many other systems. Theresults from such efforts will not only contribute to our un-derstanding of pattern formation mechanisms, but also help toelucidate how these mechanisms are “tinkered” with duringevolution to generate variation among species.
Materials and MethodsPlant Materials and Growth Condition. The M. lewisii inbred line LF10,M. cardinalis inbred line CE10, and greenhouse growth conditions weredescribed previously (28).
Bulk Segregant Analysis by Deep Sequencing. A BC4S1 individual homozygousfor the M. cardinalis allele (lar1/lar1) and, therefore, lacking the light areas(but otherwise closely resembling LF10) was backcrossed to LF10 to generatea BC5 (lar1/LAR1) plant. The fine-mapping population was produced fromthe cross between the BC5 (lar1/LAR1) and BC4S2 (lar1/lar1), segregating 1:1for the dominant (with light areas) and recessive (without light areas)flower phenotype.
For the bulk segregant analysis, we grew 250 plants to flowering andsampled 100 segregants without light areas (lar1/lar1). Total genomic DNAwas isolated from each of the 100 samples using the BIO 101 SystemFastDNA kit (Qbiogene), and then pooled together with equal representa-tion from each sample. A small-insert library (∼420 bp) was prepared for thepooled sample, and 100-bp paired-end reads were generated by an IlluminaHiSEq. 2000.
We reasoned that if we align the Illumina short reads back to the LF10reference genome, the vast majority of the genome should be devoid ofauthentic SNPs (some artifactual “noisy” SNPs may exist as a result of as-sembly error in the reference genome or nonspecific mapping of the shortreads), because these regions are already homozygous for the LF10 allele inboth parental lines (i.e., BC5 and BC4S2). In contrast, in the chromosomesegment introgressed from CE10 to LF10, there should be many SNPs be-cause of the difference between LF10 and CE10 alleles. In addition, most ofthese SNPs should have a near 100% frequency (i.e., homozygous for theCE10 allele), because the 100 segregants selected for sequencing all havethe lar1/lar1 phenotype. To produce this SNP profile, we first assembledthe LF10 genome contigs (28) into 14 “pseudoscaffolds” by aligning thecontigs to the 14 chromosomal-level superscaffolds of Mimulus guttatus(29) (phytozome.jgi.doe.gov/pz/#!info?alias=Org_Mguttatus), as describedin Yuan et al. (30). The ∼215 million Illumina short reads (∼40-fold averagecoverage; NCBI SRA274748) were mapped to the 14 LF10 “pseudoscaffolds”with CLC Genomics Workbench 5.0, with the minimum read-length fractionset to 0.8 and minimum similarity set to 0.9. A total of 6,863 homozygousSNPs (100% SNP frequency) were detected. To search for regions that arehighly enriched in homozygous SNPs, the LF10 “pseudoscaffolds” werebinned into 20-kb intervals, and the numbers of homozygous SNPs in each20-kb interval were plotted in a bar graph (Fig. 2A).
Fine-Scale Genetic Mapping. Very young seedlings from the fine-mappingpopulation “BC5 (lar1/LAR1) x BC4S2 (lar1/lar1)” were genotyped at theflanking markers ML14_137K and ML14_189K (∼100 kb) by direct PCR of0.5-mm leaf punches using Finnzyme’s Phire Plant Direct PCR Kit (ThermoScientific). Recombinants (n = 11) were transplanted and grown to flow-ering for phenotyping and further genotyping using six additional markers(Table S1).
Plasmid Construction and Plant Transformation. RNAi plasmids were con-structed with a 193-bp and 343-bp fragment amplified from the codingregions of LAR1 and MlFLS, respectively, following the protocol described inYuan et al. (28). To ensure target specificity, the fragment included in eachRNAi plasmid was BLASTed against the LF10 genome assembly with anE-value cut-off of 0.1 so that no other genomic regions perfectly match thisfragment for a contiguous block longer than 16 bp. The PLAR1::LAR1 rescue
2452 | www.pnas.org/cgi/doi/10.1073/pnas.1515294113 Yuan et al.
Dow
nloa
ded
by g
uest
on
Feb
ruar
y 9,
202
0
plasmid was constructed by cloning the 1,674-bp full-length LF10 LAR1 ge-nomic DNA (without the stop codon) and 1,483-bp upstream regulatorysequence into the pEarleyGate 302 vector, following Earley et al. (31). Thisvector does not contain any built-in promoter sequences. Expression of theLAR1 transgene was entirely driven by the 1,483-bp upstream regulatorysequence. Primers used for amplifying the corresponding DNA fragmentsare listed in Table S2.
The final plasmid constructs were verified by sequencing and thentransformed into Agrobacterium tumefaciens strain GV3101 for subsequentplant transformation, as described in Yuan et al. (28).
Expression Analyses by RT-PCR. Total RNA was isolated using the SpectrumPlant Total RNA Kit (Sigma-Aldrich) and then treated with amplificationgrade DNaseI (Invitrogen). cDNA was synthesized from 1 μg of the DNase-treated RNA using the SuperScript III First-Strand Synthesis System forRT-PCR (Invitrogen), then diluted 10-fold before PCR. TheM. lewisii orthologof Arabidopsis thaliana ubiquitin-conjugating enzyme gene (At5g25760),MlUBC, was used as a reference gene as described in Yuan et al. (28). qRT-PCR was performed using iQ SYBR Green Supermix (Bio-Rad) in a CFX96Touch Real-Time PCR Detection System (Bio-Rad). Samples were amplifiedfor 40 cycles of 95 °C for 15 s and 60 °C for 30 s. Reactions were run withthree biological replicates except the LAR1 RNAi lines, for which only tworeplicates (two independent lines) were analyzed. Amplification efficienciesfor each primer pair were determined using critical threshold values obtainedfrom a dilution series (1:4, 1:20, 1:100, 1:500). Gene-specific primers used forRT-PCR are listed in Table S3.
In Situ Hybridization. Flower buds (with calyx removed) were fixed in PBSpH 7.5 containing 4% (wt/vol) paraformaldehyde overnight at 4 °C. Afterdehydration, samples were embedded in paraffin (VWR) using a Tissue-TEKVIP processor (Sakura). Next, 8-μm sections were mounted on polysine slides,dewaxed in histoclear, and hydrated through a decreasing ethanol series.RNA in situ hybridization of slides was carried out as described in Coen et al.(32). Riboprobes against FLS, DFR, and LAR1 were synthesized by firstlyamplifying each fragment using primers in Table S4 and cloning eachfragment into pCR4-TOPO TA vector (Life Technologies) following themanufacturer’s instructions. The cloned fragments were amplified using aforward specific primer and the M13F primer (pCR4-TOPO kit). Antisenseprobes were obtained by RNA transcription using the T7 promoter (Roche)and DIG-UTP (Roche), according to the manufacturer’s instructions. Theprobes were hydrolyzed for 60 min at 60 °C using a 200 mM carbonatebuffer pH 10.2 solution.
ACKNOWLEDGMENTS. We thank Brian Watson, Doug Ewing, Jeanette Milne,Paul Beeman, Clinton Morse, andMatt Opel for extraordinary plant care in theUniversity of Washington and University of Connecticut greenhouses; Prof.Enrico Coen for providing the experimental environment and support forA.B.R to carry out the in situ hybridizations; and two anonymous reviewers forvaluable comments on the manuscript. This work was supported by NationalScience Foundation Frontiers in Integrative Biological Research Grant 0328636(to H.D.B.); National Institutes of Health Grant 5R01GM088805 (to H.D.B.); andUniversity of Connecticut Start-up funds (Y.-W.Y.).
1. Johnson S, Midgley J (1997) Fly pollination of Gorteria diffusa (Asteraceae), and apossible mimetic function for dark spots on the capitulum. Am J Bot 84(4):429.
2. Medel R, Botto-Mahan C, Kalin-Arroyo M (2003) Pollinator-mediated selection on thenectar guide phenotype in the Andean monkey flower, Mimulus luteus. Ecology 84(7):1721–1732.
3. Lunau K, Fieselmann G, Heuschen B, van de Loo A (2006) Visual targeting of com-ponents of floral colour patterns in flower-naïve bumblebees (Bombus terrestris;Apidae). Naturwissenschaften 93(7):325–328.
4. Shi J, et al. (2009) Pollination by deceit in Paphiopedilum barbigerum (Orchidaceae): Astaminode exploits the innate colour preferences of hoverflies (Syrphidae). Plant Biol(Stuttg) 11(1):17–28.
5. Gaskett AC (2011) Orchid pollination by sexual deception: Pollinator perspectives. BiolRev Camb Philos Soc 86(1):33–75.
6. Leonard AS, Papaj DR (2011) ‘X’ marks the spot: The possible benefits of nectar guidesto bees and plants. Funct Ecol 25(6):1293–1301.
7. Owen CR, Bradshaw HD (2011) Induced mutations affecting pollinator choice inMimulus lewisii (Phrymaceae). Arthropod-Plant Interact 5(3):235–244.
8. Shang Y, et al. (2011) The molecular basis for venation patterning of pigmentationand its effect on pollinator attraction in flowers of Antirrhinum. New Phytol 189(2):602–615.
9. Schiestl FP (2005) On the success of a swindle: Pollination by deception in orchids.Naturwissenschaften 92(6):255–264.
10. Streinzer M, Paulus HF, Spaethe J (2009) Floral colour signal increases short-rangedetectability of a sexually deceptive orchid to its bee pollinator. J Exp Biol 212(Pt 9):1365–1370.
11. Gaskett AC, Herberstein ME (2010) Colour mimicry and sexual deception by Tongueorchids (Cryptostylis). Naturwissenschaften 97(1):97–102.
12. Schwinn K, et al. (2006) A small family of MYB-regulatory genes controls floral pig-mentation intensity and patterning in the genus Antirrhinum. Plant Cell 18(4):831–851.
13. Albert NW, et al. (2011) Members of an R2R3-MYB transcription factor family in Pe-tunia are developmentally and environmentally regulated to control complex floraland vegetative pigmentation patterning. Plant J 65(5):771–784.
14. Thomas MM, Rudall PJ, Ellis AG, Savolainen V, Glover BJ (2009) Development of acomplex floral trait: The pollinator-attracting petal spots of the beetle daisy, Gorteriadiffusa (Asteraceae). Am J Bot 96(12):2184–2196.
15. Martins TR, Berg JJ, Blinka S, Rausher MD, Baum DA (2013) Precise spatio-temporalregulation of the anthocyanin biosynthetic pathway leads to petal spot formation inClarkia gracilis (Onagraceae). New Phytol 197(3):958–969.
16. Yamagishi M, Toda S, Tasaki K (2014) The novel allele of the LhMYB12 gene is in-volved in splatter-type spot formation on the flower tepals of Asiatic hybrid lilies(Lilium spp.). New Phytol 201(3):1009–1020.
17. Saito R, et al. (2006) Regulation of anthocyanin biosynthesis involved in the formationof marginal picotee petals in Petunia. Plant Sci 170(4):828–834.
18. Hiesey W, Nobs MA, Björkman O (1971) Experimental Studies on the Nature ofSpecies. V. Biosystematics, Genetics, and Physiological Ecology of the Erythranthesection of Mimulus. Carnegie Institute of Washington publication no. 628 (CarnegieInstitute, Washington, DC).
19. Mehrtens F, Kranz H, Bednarek P, Weisshaar B (2005) The Arabidopsis transcriptionfactor MYB12 is a flavonol-specific regulator of phenylpropanoid biosynthesis. PlantPhysiol 138(2):1083–1096.
20. Stracke R, et al. (2007) Differential regulation of closely related R2R3-MYB tran-scription factors controls flavonol accumulation in different parts of the Arabidopsisthaliana seedling. Plant J 50(4):660–677.
21. Luo J, et al. (2008) AtMYB12 regulates caffeoyl quinic acid and flavonol synthesis intomato: Expression in fruit results in very high levels of both types of polyphenol.Plant J 56(2):316–326.
22. Czemmel S, et al. (2009) The grapevine R2R3-MYB transcription factor VvMYBF1regulates flavonol synthesis in developing grape berries. Plant Physiol 151(3):1513–1530.
23. Grotewold E, Drummond BJ, Bowen B, Peterson T (1994) The myb-homologous Pgene controls phlobaphene pigmentation in maize floral organs by directly activatinga flavonoid biosynthetic gene subset. Cell 76(3):543–553.
24. Stern DL (2011) Evolution, Development, and the Predictable Genome (Roberts andCo., Greenwood Village, CO).
25. Martin A, Orgogozo V (2013) The Loci of repeated evolution: A catalog of genetichotspots of phenotypic variation. Evolution 67(5):1235–1250.
26. Davies KM, et al. (2003) Enhancing anthocyanin production by altering competitionfor substrate between flavonol synthase and dihydroflavonol 4-reductase. Euphytica131(3):259–268.
27. Saito R, Kuchitsu K, Ozeki Y, Nakayama M (2007) Spatiotemporal metabolic regula-tion of anthocyanin and related compounds during the development of marginalpicotee petals in Petunia hybrida (Solanaceae). J Plant Res 120(4):563–568.
28. Yuan Y-W, Sagawa JM, Young RC, Christensen BJ, Bradshaw HD, Jr (2013) Geneticdissection of a major anthocyanin QTL contributing to pollinator-mediated re-productive isolation between sister species of Mimulus. Genetics 194(1):255–263.
29. Hellsten U, et al. (2013) Fine-scale variation in meiotic recombination in Mimulusinferred from population shotgun sequencing. Proc Natl Acad Sci USA 110(48):19478–19482.
30. Yuan YW, Sagawa JM, Di Stilio VS, Bradshaw HD, Jr (2013) Bulk segregant analysis ofan induced floral mutant identifies a MIXTA-like R2R3 MYB controlling nectar guideformation in Mimulus lewisii. Genetics 194(2):523–528.
31. Earley KW, et al. (2006) Gateway-compatible vectors for plant functional genomicsand proteomics. Plant J 45(4):616–629.
32. Coen ES, et al. (1990) floricaula: a homeotic gene required for flower development inAntirrhinum majus. Cell 63(6):1311–1322.
33. Stracke R, Werber M, Weisshaar B (2001) The R2R3-MYB gene family in Arabidopsisthaliana. Curr Opin Plant Biol 4(5):447–456.
Yuan et al. PNAS | March 1, 2016 | vol. 113 | no. 9 | 2453
EVOLU
TION
Dow
nloa
ded
by g
uest
on
Feb
ruar
y 9,
202
0


![Isolation of a Regulatory Gene of Anthocyanin …...Isolation of a Regulatory Gene of Anthocyanin Biosynthesis in Tuberous Roots of Purple-Fleshed Sweet Potato[OA] Hironori Mano*,](https://img.dokumen.tips/doc/110x75/5e60c2e42cf627071c337bef/isolation-of-a-regulatory-gene-of-anthocyanin-isolation-of-a-regulatory-gene.jpg)