Embed Size (px)
Citation preview
Comparison of the Persistence of Atrazine and Metolachlor underField and Laboratory Conditions
Giovanni Dinelli,* Cesare Accinelli, Alberto Vicari, and Pietro Catizone
Department of Agronomy, University of Bologna, via Filippo Re 6/8, 40126 Bologna, Italy
A study was carried out in a loamy soil to evaluate the degradation of atrazine and metolachlorunder laboratory-controlled and field-variable conditions as a function of temperature and soilmoisture content. In laboratory trials, metolachlor showed fast degradation, with half-lives from100 to 5.7 days in a temperature range from 5 to 35 °C at 100% of field capacity, whereas in thesame conditions the degradation rate of atrazine was relatively slow, with half-lives from 407 to 23days. Modeling of laboratory degradation data to predict field persistence was carried out. Fieldpersistence of atrazine and metolachlor was measured in the same soil during the corn growingseasons in 1993, 1994, and 1996. In the three years the mean half-dissipation times for atrazineand metolachlor were 36 and 21 days, respectively. Calculations from model equations gaveacceptable prediction of field dissipation of both herbicides. Limitations and perspectives of employedmodelization procedure are discussed.
Keywords: Atrazine; metolachlor; soil degradation; field persistence; persistence modelization
INTRODUCTION
In recent years there has been an increasing interestin the study of the relationship between herbicidedegradation under laboratory and field conditions topredict the variability in environmental behavior bymathematical models and to perform risk assessmentin different situations. In Europe, pesticide regulationhas developed into a controlled system with the aim ofensuring the safety of agrochemicals for the operator,consumer, and environment (Vischetti et al., 1998).Laboratory information is an essential component forthe development and validation of computer simulationmodels. Several predictive models, including PELMO,PESTLA, LEACHP, VARLEACH, and PERSIST, con-tain similar subroutines to describe pesticide degrada-tion as a function of soil temperature and soil moisturecontent (Jurado-Exposito and Walker, 1998). Assumingpesticide degradation in agreement with first-orderkinetics, these models predict field soil degradationunder continuously variable environmental conditionsfrom degradation rates measured in the same soil underlaboratory constant conditions (Jurado-Exposito andWalker, 1998).
Field and laboratory degradation of atrazine andmetolachlor has been the focus of a number of studies(Walker and Zimdahl, 1981; Buttle, 1990; Rocha andWalker, 1995; Miller at al., 1997; Pussemier et al.,1997). In soil, dissipation of atrazine is due to bothbiochemical and chemical processes. Chemical trans-formation mainly occurs under acid conditions and iscatalyzed by soil organic matter (Armstrong et al., 1967,1968). Metolachlor soil degradation was postulated asan exclusive biochemical process (Lebaron et al., 1987).Field persistence of both chemicals is dependent onmany factors, such as weather conditions, soil pH,
moisture level, and organic matter content (Bowman,1988; Pussemier et al., 1997). Although extensiveliterature is available on the soil degradation andenvironmental fate of atrazine and metolachlor, rela-tively few papers report all of the key parameters tomodel their field persistence (Walker and Zimdahl,1981; Smith and Walker, 1989; Rocha and Walker,1995). In particular, a laboratory data set includinginformation on soil degradation in a wide range oftemperature and soil moisture conditions, representa-tive of cold and warm seasons, is the basic requirementfor successful parametrization and prediction of fielddissipation in the environment.
The objectives of this study were (i) to evaluate thedegradation kinetics of atrazine and metolachlor in auseful range of temperature and soil moisture conditionsin the laboratory, (ii) to find the best parametrizationprocedure of laboratory data to obtain model equationsfor the prediction of herbicide dissipation, and (iii) tovalidate model equations using the observed persistenceof atrazine and metolachlor under field conditionstypical of northern Italy (Po valley).
MATERIALS AND METHODS
Chemicals and Soil. For both laboratory and field studies,the water dispersible granule commercial formulations ofatrazine [2-chloro-4-(ethylamino)-6-(isopropylamino)-1,3,5-tri-azine; 90% of active ingredient (ai)] and metolachlor [2-chloro-N-(2-ethyl-6-methylphenyl)-N-(2-methoxy-1-methylethyl)ace-tamide; 80% of ai] were kindly supplied by Novartis AG (Basel,Switzerland). Analytical grade metolachlor (96.1%) and atra-zine (99.1%) were furnished by Dr. Ehrenstorfer (Augsburg,Germany) and employed as analytical standards. Solvents forhigh-performance liquid chromatography (HPLC) separationand soil extraction were of pesticide grade and supplied bySigma Chemical Co. (St. Louis, MO).
Degradation of atrazine and metolachlor under laboratoryand field conditions was investigated in the soil of the researchstation of Ozzano (Bologna, Italy). The soil is loamy with 420g kg-1 sand, 240 g kg-1 clay, 340 g kg-1 silt, organic matter
* Author to whom correspondence should be addressed(telephone +39 051 2091530; fax +39 051 2091545; [email protected]).
3037J. Agric. Food Chem. 2000, 48, 3037−3043
10.1021/jf991057b CCC: $19.00 © 2000 American Chemical SocietyPublished on Web 06/17/2000

content of 17 g kg-1, pH (1:2.5 soil/water) of 7.7, cationexchange capacity of 35.9 meq 100 g-1, and water content of24% at an applied pressure of 33 kPa.
Laboratory Studies. Degradation of atrazine and meto-lachlor was evaluated as a function of soil moisture andtemperature. The soil was collected from the top 10 cm of plotsuncropped for 5 years at the research station of Ozzano(Bologna, Italy). Before use, the soil was air-dried and passedthrough a 2-mm sieve. Twenty-five gram (oven dry weightbasis) samples of soil were weighted into 648 sterile screw-top culture tubes (3 i.d. × 10 cm) and treated with appropriateherbicide water solutions to provide final concentrations of 1.1and 2.2 mg of ai kg-1 of atrazine and metolachlor, respectively.These concentrations correspond to 1000 g of ai ha-1 ofatrazine and 2000 g of ai ha-1 of metolachlor incorporated toa depth of 10 cm, with a soil bulk density (w/v) of 1.1. Soilmoisture of the samples was adjusted to 40, 70, and 100% offield capacity (FC) by adding sterile ultrapure water. The 324sample tubes containing soil at the FC were kept in the darkand incubated under aerobic conditions in a climatic chamberat temperatures of 5, 10, 15, 20, 25, and 35 °C. Similarly, the162 sample tubes containing soil at 70% of FC and the 162sample tubes containing soil at 40% of FC were incubated attemperatures of 15, 25, and 35 °C. The moisture of soil sampleswas checked daily by weighing and was adjusted as required.For each temperature and moisture level, triplicate soilsamples of atrazine were removed at 0, 7, 14, 21, 35, 42, 56,70, and 90 days after treatment, whereas those of metolachlorwere removed at 0, 1, 3, 7, 14, 21, 35, 42, and 56 days aftertreatment. Soil samples were stored at -20 °C until extractionand residue analysis. The whole experiment was a random-ized-block design (benches being blocks) with three replicates.
Field Studies. The field research was conducted in 1993,1994, and 1996 at Ozzano Research Station, Bologna, Italy.This experiment was part of a larger study that began in 1989to examine the effect of tillage systems on runoff losses ofnutrients and herbicides. The experimental site was 200 masl and 0.7 ha-1 large and had a northern exposure, and themean slope, after laser surface-modeling, was 15%. The eightexperimental plots were rectangular and measured 7 × 50 m,with the longest side perpendicular to contour lines. The plotswere hydrologically isolated and separated by 5 × 50 m bufferplots. The experimental station was equipped for the automaticmonitoring of runoff and leaching in the eight plots (Rossi Pisaet al., 1994). Corn was planted in each plot on April 26, 1993,April 27, 1994, and April 30, 1996. Each year, four replicateplots were treated with atrazine and metolachlor soon aftercorn sowing at the rates of 1000 and 2000 g of ai ha-1,respectively. Standard crop management practices were em-ployed. Soil sampling in the four treated plots was conductedbefore herbicide application and at six (1993 and 1994) andfive (1996) time intervals over the subsequent 160 days afterherbicide application (from May 1 to September 28). On eachsampling date, 10 soil cores (5 cm diameter to a depth of 50cm) were randomly taken at each of the four treated plots witha stainless steel coring tube. Soil cores were divided into fivesegments: 0-10, 10-20, 20-30, 30-40, and 40-50 cm.Segments of like depth were bulked, ground, and thoroughlymixed in a soil mixer and passed through a 2-mm sieve. Soilsamples were stored at -20 °C until extraction and residueanalysis. Additional five soil cores (5 cm diameter to a depthof 50 cm) were taken in a similar way at weekly intervals afterherbicide application and oven-dried (24 h; 105 °C) to deter-mine the moisture content in the 0-50 cm soil profile of eachplot. During field experiments, the soil temperature of eachplot was recorded on daily basis at three depths (5, 15, and 45cm) using three-way probe soil thermographs. Air tempera-tures (maximum and minimum) and rainfall were dailyrecorded by the meteorological station located in the experi-mental area. The meteorological conditions during the fieldexperiments and soil temperature and moisture levels arereported in Table 1. Soil temperature and moisture levels wereemployed in conjunction with the laboratory-observed break-down data to calculate the rate of herbicide loss in the field.
Extraction and Soil Residue. Extraction of soil sampleswas performed by adding 10 and 20 mL of acetonitrile to glasstest tubes (5 cm i.d. × 10 cm) containing 25 g of laboratorysoil samples and 50 g of field soil samples, respectively (soil/extraction solvent ratio equivalent to 2.5). The capped testtubes were shaken for 2 h at room temperature in a horizontalshaker and sonicated for 15 min in a sonicator bath. The slurrywas centrifuged for 10 min at 9500g. The slurry was filteredat 0.2 µm and directly analyzed by reversed phase (RP) HPLC.Preliminary studies showed that the mean recoveries in soilsamples spiked in the 0.1-2 mg of ai kg-1 of soil range were93 ( 5% (n ) 10) for atrazine and 92 ( 4% for metolachlor (n) 10).
Residue analysis was carried out by RP-HPLC. The HPLCsystem was a Beckman (Palo Alto, CA) System Gold 126 withtwo pumps and a Spark Holland (Emmen, The Netherlands)Basic Marathon autosampler. A Beckman model 168 diodearray detector was used. The C18 column was a BeckmanUltrasphere (25 cm × 4.6 mm i.d., 5-µm particle size). Analyseswere done in gradient mode at the flow rate of 1 mL min-1.The gradient separation was performed by maintaining initialconditions at water/acetonitrile (70:30) for 1 min and thenincreasing the acetonitrile content linearly for 10 min to reacha final water/acetonitrile ratio of (40:60). The injection volumewas 50 µL. Detection was performed at 222 and 210 nm.Retention times were 5.4 ( 0.1 min for metolachlor and 7.5 (0.1 min for atrazine. Determination limits in soil samples were0.040 mg of ai kg-1 for both atrazine and metolachlor.Retention time and diode array scan of analytical gradeatrazine and metolachlor were employed for the identificationof the active ingredient in soil extracts. Previous experimentsconfirmed that control field samples collected before herbicideapplication contained no compounds interfering with thedetection of atrazine and metolachlor. Peak area was used forresidue determination. Herbicide remaining was expressed asa percentage of concentration before incubation (laboratorystudies) or after the first sampling (field studies). Half-livesand half-dissipation times were determined by linear regres-sion of the natural logarithm of percentage of herbicideremaining against time and the slope of each line comparedwith analysis of variance.
RESULTS AND DISCUSSION
Laboratory Studies. The results of the laboratorydegradation studies are summarized in Table 2. Deg-radation of atrazine and metolachlor as a function ofsoil moisture and temperature followed first-orderkinetics. The determination coefficients of the naturallogarithm of herbicide residue against time ranged from0.98 to 0.99 and were highly significant (P < 0.01), thusindicating that the assumption of first-order kineticswas acceptable. This observation is in agreement withthe literature (Walker and Zimdahl, 1981; Smith andWalker, 1989; Vischetti et al., 1998). As reported inprevious studies (Walker and Brown, 1985; Rocha andWalker, 1995), degradation of both chemicals wasaccelerated by the increase of soil moisture and tem-perature (Table 2). Over the entire range of temperatureand soil moisture content, metolachlor showed half-lives
Table 1. Weather Conditions, Soil Temperature, andMoisture Levels (0-20 cm Soil Profile) during theExperimental Periodsa
temp range 1993 1994 1996
av air temp (°C) 20.3 21.1 19.9total rainfall (mm) 289 475 365no. of days with rainfall (days) 40 42 38av temp of 0-20 cm soil profile (°C) 21.8 22.7 20.9av moisture of 0-20 cm soil profile (% of FCb) 65.4 63.6 63.4
a Soil temperature and moisture are the mean values of fourexperimental plots. b FC, field capacity.
3038 J. Agric. Food Chem., Vol. 48, No. 7, 2000 Dinelli et al.
lower than those of atrazine. Observed half-lives areconsistent with those reported under laboratory condi-tions with the same herbicides by Walker and Zimdahl(1981), Walker and Brown (1985), Smith and Walker(1989) and Rocha and Walker (1995).
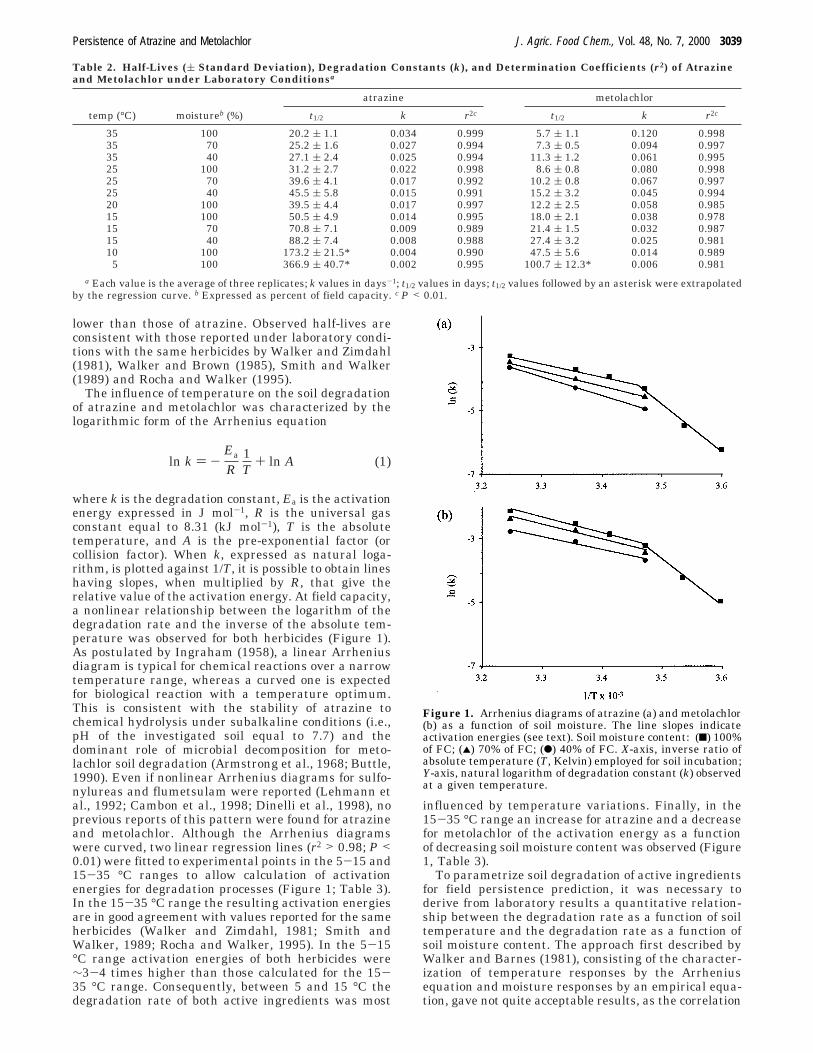
The influence of temperature on the soil degradationof atrazine and metolachlor was characterized by thelogarithmic form of the Arrhenius equation
where k is the degradation constant, Ea is the activationenergy expressed in J mol-1, R is the universal gasconstant equal to 8.31 (kJ mol-1), T is the absolutetemperature, and A is the pre-exponential factor (orcollision factor). When k, expressed as natural loga-rithm, is plotted against 1/T, it is possible to obtain lineshaving slopes, when multiplied by R, that give therelative value of the activation energy. At field capacity,a nonlinear relationship between the logarithm of thedegradation rate and the inverse of the absolute tem-perature was observed for both herbicides (Figure 1).As postulated by Ingraham (1958), a linear Arrheniusdiagram is typical for chemical reactions over a narrowtemperature range, whereas a curved one is expectedfor biological reaction with a temperature optimum.This is consistent with the stability of atrazine tochemical hydrolysis under subalkaline conditions (i.e.,pH of the investigated soil equal to 7.7) and thedominant role of microbial decomposition for meto-lachlor soil degradation (Armstrong et al., 1968; Buttle,1990). Even if nonlinear Arrhenius diagrams for sulfo-nylureas and flumetsulam were reported (Lehmann etal., 1992; Cambon et al., 1998; Dinelli et al., 1998), noprevious reports of this pattern were found for atrazineand metolachlor. Although the Arrhenius diagramswere curved, two linear regression lines (r2 > 0.98; P <0.01) were fitted to experimental points in the 5-15 and15-35 °C ranges to allow calculation of activationenergies for degradation processes (Figure 1; Table 3).In the 15-35 °C range the resulting activation energiesare in good agreement with values reported for the sameherbicides (Walker and Zimdahl, 1981; Smith andWalker, 1989; Rocha and Walker, 1995). In the 5-15°C range activation energies of both herbicides were∼3-4 times higher than those calculated for the 15-35 °C range. Consequently, between 5 and 15 °C thedegradation rate of both active ingredients was most
influenced by temperature variations. Finally, in the15-35 °C range an increase for atrazine and a decreasefor metolachlor of the activation energy as a functionof decreasing soil moisture content was observed (Figure1, Table 3).
To parametrize soil degradation of active ingredientsfor field persistence prediction, it was necessary toderive from laboratory results a quantitative relation-ship between the degradation rate as a function of soiltemperature and the degradation rate as a function ofsoil moisture content. The approach first described byWalker and Barnes (1981), consisting of the character-ization of temperature responses by the Arrheniusequation and moisture responses by an empirical equa-tion, gave not quite acceptable results, as the correlation
Table 2. Half-Lives (( Standard Deviation), Degradation Constants (k), and Determination Coefficients (r2) of Atrazineand Metolachlor under Laboratory Conditionsa
atrazine metolachlor
temp (°C) moistureb (%) t1/2 k r2c t1/2 k r2c
35 100 20.2 ( 1.1 0.034 0.999 5.7 ( 1.1 0.120 0.99835 70 25.2 ( 1.6 0.027 0.994 7.3 ( 0.5 0.094 0.99735 40 27.1 ( 2.4 0.025 0.994 11.3 ( 1.2 0.061 0.99525 100 31.2 ( 2.7 0.022 0.998 8.6 ( 0.8 0.080 0.99825 70 39.6 ( 4.1 0.017 0.992 10.2 ( 0.8 0.067 0.99725 40 45.5 ( 5.8 0.015 0.991 15.2 ( 3.2 0.045 0.99420 100 39.5 ( 4.4 0.017 0.997 12.2 ( 2.5 0.058 0.98515 100 50.5 ( 4.9 0.014 0.995 18.0 ( 2.1 0.038 0.97815 70 70.8 ( 7.1 0.009 0.989 21.4 ( 1.5 0.032 0.98715 40 88.2 ( 7.4 0.008 0.988 27.4 ( 3.2 0.025 0.98110 100 173.2 ( 21.5* 0.004 0.990 47.5 ( 5.6 0.014 0.9895 100 366.9 ( 40.7* 0.002 0.995 100.7 ( 12.3* 0.006 0.981
a Each value is the average of three replicates; k values in days-1; t1/2 values in days; t1/2 values followed by an asterisk were extrapolatedby the regression curve. b Expressed as percent of field capacity. c P < 0.01.
ln k ) -Ea
R1T
+ ln A (1)
Figure 1. Arrhenius diagrams of atrazine (a) and metolachlor(b) as a function of soil moisture. The line slopes indicateactivation energies (see text). Soil moisture content: (9) 100%of FC; (2) 70% of FC; (b) 40% of FC. X-axis, inverse ratio ofabsolute temperature (T, Kelvin) employed for soil incubation;Y-axis, natural logarithm of degradation constant (k) observedat a given temperature.
Persistence of Atrazine and Metolachlor J. Agric. Food Chem., Vol. 48, No. 7, 2000 3039

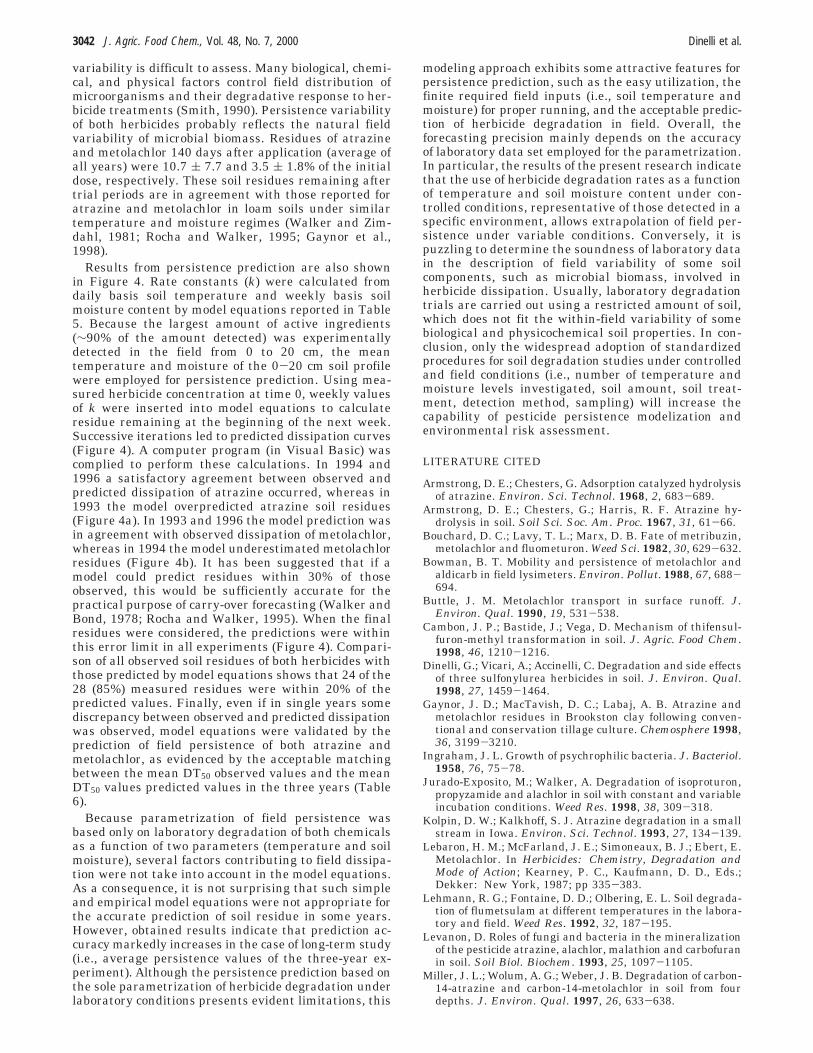
between laboratory observed and mathematically esti-mated half-lives for atrazine and metolachlor was <0.80(P > 0.01) (data not shown). The low fitting could bedue to the fact that a linear Arrhenius diagram and nochange of activation energy as a function of soil moistureare the basic requirements of the parametrizationproposed by Walker and Barnes (1981). Consequently,an alternative parametrization was employed. In the15-35 °C range a logarithmic dependence (r2 > 0.96, P< 0.01) of the slope (-Ea/R) and pre-exponential factor(ln A) of atrazine and metolachlor Arrehenius equationsas a function of soil moisture content was observed(Table 4). Due to the slow degradation rate, the moisture-dependent degradation of active ingredients was notexperimentally determined for temperature <15 °C. Asa consequence, in the 5-15 °C range extrapolatedequations were obtained by shifting the logarithmicregression lines obtained in the 15-35 °C range, withoutchanging the respective slopes, throughout the -Ea/Rand ln A values determined for both chemicals at fieldcapacity (Table 4). The -Ea/R and ln A terms of atrazineand metolachlor Ahrrenius equations were substitutedwith the respective regression, and the extrapolatedequations are shown in Table 4). For each activeingredient, the resulting model equations were two,because each herbicide was characterized by two Ahr-renius equations (5-15 and 15-35 °C ranges) (Table5). To statistically verify these equations, regressionanalysis yielded coefficients of correlation highly sig-nificant (r > 0.99; P < 0.01) between observed andestimated half-lives determined by model equations. Theslopes of the regression lines were 1.03 for atrazine and1.01 for metolachlor, demonstrating that observed andestimated half-lives were correlated near the theoreticaloptimum value (Figure 2).
Model equations were represented by three-dimen-sional graphs, which were realized by calculating half-life as a function of temperature in the temperaturerange of 5-35 °C and in the soil moisture range from
Table 3. Arrhenius Equations, Determination Coefficients (r2), and Activation Energies of Atrazine and Metolachlor asa Function of Temperature Range and Soil Moisture
atrazine metolachlor
temprange (°C)
moisturea
(%) Arrhenius equationb r2cactivationenergyd Arrhenius equationb r2c
activationenergyd
35-15 100 ln k ) -4.06 (1000/T) + 9.82 0.999 33.1 ln k ) -4.97 (1000/T) + 14.81 0.992 40.435-15 70 ln k ) -4.59 (1000/T) + 11.33 0.997 37.3 ln k ) -4.75 (1000/T) + 13.1 0.964 38.135-15 40 ln k ) -5.23 (1000/T) + 13.34 0.997 42.5 ln k ) -3.96 (1000/T) + 10.12 0.975 32.215-5 100 ln k ) -15.85 (1000/T) + 48.28 0.980 128.9 ln k ) -13.71 (1000/T) + 44.32 0.993 111.9
a Expressed as percent of field capacity. b k ) degradation constant; T ) absolute temperature (Kelvin). c P < 0.01. d kJ mol-1.
Table 4. Regression Equations, Determination Coefficients (r2), and Extrapolated Equations of the Dependence of Slope(-Ea/R) and Pre-exponential Factor (ln A) of Atrazine and Metolachlor Arrhenius Equations, Calculated in the 35-15and 15-5 °C Ranges as a Function of Soil Moisture
temprange (°C) atrazine r2a metolachlor r2
regression eqb 35-15 -Ea/R ) 1.27 ln(M%) - 9.93 0.993 -Ea/R ) -1.13 ln(M%) + 0.15 0.963ln A ) -3.83 ln(M%) + 27.48 0.997 ln A ) 4.42 ln(M%) - 6.02 0.975
extrapolated eqc 15-5 -Ea/R ) 1.27 ln(M%) - 21.69 -Ea/R ) -1.13 ln(M%) - 8.52ln A ) -3.83 ln(M%) + 68.28 ln A ) 4.42 ln(M%) + 23.98
a P < 0.01. b M% ) soil moisture expressed as percent of field capacity. c See text for the extrapolation procedure.
Table 5. Model Equations for the Prediction of the Degradation Rate of Atrazine and Metolachlor in the Loamy Soil asa Function of Soil Moisture and Temperature
herbicidetemp
range (°C) eqsa
atrazine 35-15 ln k ) [1.27 ln(M%) - 9.93](1000/T) + [-3.83 ln(M%) + 27.48]15-5 ln k ) [1.27 ln(M%) - 21.69](1000/T) + [-3.83 ln(M%) + 68.28]
metolachlor 35-15 ln k ) [-1.13 ln(M%) + 0.15](1000/T) + [4.42 ln(M%) - 6.02]15-5 ln k ) [-1.13 ln(M%) - 8.52](1000/T) + [4.42 ln(M%) + 23.98]
a k ) degradation constant; M% ) soil moisture expressed as percent of field capacity; T ) absolute temperature (Kelvin).
Figure 2. Comparison between laboratory observed andmathematically estimated half-lives of atrazine (a) and me-tolachlor (b). Regression equations and determination coef-ficients (r2) are reported.
3040 J. Agric. Food Chem., Vol. 48, No. 7, 2000 Dinelli et al.

10 to 100% of FC (Figure 3). For temperature <10 °C,independently from the soil moisture content, the half-life of atrazine was >90 days (solid black area, Figure3a). For this herbicide, the half-life was <30 days onlyfor temperature and soil moisture content higher than28 °C and 40% of FC, respectively (light gray area,Figure 3a). The three-dimensional graph of metolachlorexhibited a shape similar to that of atrazine, even if thesolid black area, indicating extremely low degradation,is limited to temperature <10 °C (Figure 3b). Moreover,the light gray area, which indicates half-life <30 days,represented ∼65% of the total surface of the three-dimensional graph, thus confirming a faster degradationof metolachlor with respect to atrazine (Figure 3b). Thehalf-lives of atrazine and metolachlor calculated withmodel equations were in agreement with the half-livesreported by different authors for a wide range oftemperatures and soil moisture contents (Bouchard etal., 1982; Lebaron et al., 1987; Levanon, 1993; Kolpinand Kalkhoff, 1993; Miller et al., 1997).
Field Studies. In all experiments no leaching ofmetolachlor was observed below 30 cm. In 1993 leachingof atrazine was confined in the 0-30 cm soil profile andin the 0-40 cm soil profile in 1994 and 1996. Inaddition, >90% of the total amounts of atrazine andmetolachlor detected during field experiments wasfound in the 0-20 cm soil profile. Loss of both herbicidesunder field conditions followed an exponential declinein agreement with a first-order kinetic of dissipation (r2
> 0.97; P < 0.01) (Table 6). In all experiments, the rateof dissipation of metolachlor (mean DT50 ) 21 days) was
more rapid than that of atrazine (mean DT50 ) 36 days),confirming the results obtained under laboratory condi-tions (Figure 4; Table 6). Field persistence of bothherbicides fits the mean DT50 values (45 and 20 daysfor atrazine and metolachlor, respectively) reportedunder normal climatic conditions by The PesticideManual (1998). For both herbicides, there were signifi-cant variations between predicted and observed carry-over concentrations in at least one of the three yearsstudied. In particular, in 1993 observed atrazine per-sistence was less than predicted, and it was approxi-mately half of that observed in 1994 and 1996. In 1994,predicted metolachlor persistence was less than wasobserved. Furthermore, observed metolachlor persis-tence was approximately double with respect to thatobserved in 1993 and 1996 (Table 6). Considering thatin the three years similar weather and soil conditionswere recorded (Table 1), the significance of the observed
Figure 3. Atrazine (a) and metolachlor (b) degradation in theloamy soil estimated by model equations (see Table 6): half-life (days; light gray area, <30; unmarked area, 30-60; grayarea, 60-90; solid black area, >90) as a function of temper-ature and soil moisture content.
Table 6. Observed and Predicted Half-Dissipation Times(DT50) of Atrazine and Metolachlor in the Loamy Soila
atrazine metolachlor
year obs DT50 r2b pred DT50 obs DT50 r2b pred DT50
1993 23.5 0.978 47.7 17.7 0.985 16.91994 39.7 0.982 43.1 28.8 0.989 15.91996 45.8 0.988 44.3 17.2 0.978 17.3
mean ( SD 36.3 ( 11.5 45.1 ( 2.4 21.2 ( 6.5 16.7 ( 0.7
a Determination coefficients (r2) of observed DT50 are reported.b P < 0.01.
Figure 4. Observed and predicted field persistence of atrazine(a) and metolachlor (b) in loamy soil: solid line, observedresidue; dotted line, predicted residue. Standard deviations ofobserved residues are reported.
Persistence of Atrazine and Metolachlor J. Agric. Food Chem., Vol. 48, No. 7, 2000 3041
variability is difficult to assess. Many biological, chemi-cal, and physical factors control field distribution ofmicroorganisms and their degradative response to her-bicide treatments (Smith, 1990). Persistence variabilityof both herbicides probably reflects the natural fieldvariability of microbial biomass. Residues of atrazineand metolachlor 140 days after application (average ofall years) were 10.7 ( 7.7 and 3.5 ( 1.8% of the initialdose, respectively. These soil residues remaining aftertrial periods are in agreement with those reported foratrazine and metolachlor in loam soils under similartemperature and moisture regimes (Walker and Zim-dahl, 1981; Rocha and Walker, 1995; Gaynor et al.,1998).
Results from persistence prediction are also shownin Figure 4. Rate constants (k) were calculated fromdaily basis soil temperature and weekly basis soilmoisture content by model equations reported in Table5. Because the largest amount of active ingredients(∼90% of the amount detected) was experimentallydetected in the field from 0 to 20 cm, the meantemperature and moisture of the 0-20 cm soil profilewere employed for persistence prediction. Using mea-sured herbicide concentration at time 0, weekly valuesof k were inserted into model equations to calculateresidue remaining at the beginning of the next week.Successive iterations led to predicted dissipation curves(Figure 4). A computer program (in Visual Basic) wascomplied to perform these calculations. In 1994 and1996 a satisfactory agreement between observed andpredicted dissipation of atrazine occurred, whereas in1993 the model overpredicted atrazine soil residues(Figure 4a). In 1993 and 1996 the model prediction wasin agreement with observed dissipation of metolachlor,whereas in 1994 the model underestimated metolachlorresidues (Figure 4b). It has been suggested that if amodel could predict residues within 30% of thoseobserved, this would be sufficiently accurate for thepractical purpose of carry-over forecasting (Walker andBond, 1978; Rocha and Walker, 1995). When the finalresidues were considered, the predictions were withinthis error limit in all experiments (Figure 4). Compari-son of all observed soil residues of both herbicides withthose predicted by model equations shows that 24 of the28 (85%) measured residues were within 20% of thepredicted values. Finally, even if in single years somediscrepancy between observed and predicted dissipationwas observed, model equations were validated by theprediction of field persistence of both atrazine andmetolachlor, as evidenced by the acceptable matchingbetween the mean DT50 observed values and the meanDT50 values predicted values in the three years (Table6).
Because parametrization of field persistence wasbased only on laboratory degradation of both chemicalsas a function of two parameters (temperature and soilmoisture), several factors contributing to field dissipa-tion were not take into account in the model equations.As a consequence, it is not surprising that such simpleand empirical model equations were not appropriate forthe accurate prediction of soil residue in some years.However, obtained results indicate that prediction ac-curacy markedly increases in the case of long-term study(i.e., average persistence values of the three-year ex-periment). Although the persistence prediction based onthe sole parametrization of herbicide degradation underlaboratory conditions presents evident limitations, this
modeling approach exhibits some attractive features forpersistence prediction, such as the easy utilization, thefinite required field inputs (i.e., soil temperature andmoisture) for proper running, and the acceptable predic-tion of herbicide degradation in field. Overall, theforecasting precision mainly depends on the accuracyof laboratory data set employed for the parametrization.In particular, the results of the present research indicatethat the use of herbicide degradation rates as a functionof temperature and soil moisture content under con-trolled conditions, representative of those detected in aspecific environment, allows extrapolation of field per-sistence under variable conditions. Conversely, it ispuzzling to determine the soundness of laboratory datain the description of field variability of some soilcomponents, such as microbial biomass, involved inherbicide dissipation. Usually, laboratory degradationtrials are carried out using a restricted amount of soil,which does not fit the within-field variability of somebiological and physicochemical soil properties. In con-clusion, only the widespread adoption of standardizedprocedures for soil degradation studies under controlledand field conditions (i.e., number of temperature andmoisture levels investigated, soil amount, soil treat-ment, detection method, sampling) will increase thecapability of pesticide persistence modelization andenvironmental risk assessment.
LITERATURE CITED
Armstrong, D. E.; Chesters, G. Adsorption catalyzed hydrolysisof atrazine. Environ. Sci. Technol. 1968, 2, 683-689.
Armstrong, D. E.; Chesters, G.; Harris, R. F. Atrazine hy-drolysis in soil. Soil Sci. Soc. Am. Proc. 1967, 31, 61-66.
Bouchard, D. C.; Lavy, T. L.; Marx, D. B. Fate of metribuzin,metolachlor and fluometuron. Weed Sci. 1982, 30, 629-632.
Bowman, B. T. Mobility and persistence of metolachlor andaldicarb in field lysimeters. Environ. Pollut. 1988, 67, 688-694.
Buttle, J. M. Metolachlor transport in surface runoff. J.Environ. Qual. 1990, 19, 531-538.
Cambon, J. P.; Bastide, J.; Vega, D. Mechanism of thifensul-furon-methyl transformation in soil. J. Agric. Food Chem.1998, 46, 1210-1216.
Dinelli, G.; Vicari, A.; Accinelli, C. Degradation and side effectsof three sulfonylurea herbicides in soil. J. Environ. Qual.1998, 27, 1459-1464.
Gaynor, J. D.; MacTavish, D. C.; Labaj, A. B. Atrazine andmetolachlor residues in Brookston clay following conven-tional and conservation tillage culture. Chemosphere 1998,36, 3199-3210.
Ingraham, J. L. Growth of psychrophilic bacteria. J. Bacteriol.1958, 76, 75-78.
Jurado-Exposito, M.; Walker, A. Degradation of isoproturon,propyzamide and alachlor in soil with constant and variableincubation conditions. Weed Res. 1998, 38, 309-318.
Kolpin, D. W.; Kalkhoff, S. J. Atrazine degradation in a smallstream in Iowa. Environ. Sci. Technol. 1993, 27, 134-139.
Lebaron, H. M.; McFarland, J. E.; Simoneaux, B. J.; Ebert, E.Metolachlor. In Herbicides: Chemistry, Degradation andMode of Action; Kearney, P. C., Kaufmann, D. D., Eds.;Dekker: New York, 1987; pp 335-383.
Lehmann, R. G.; Fontaine, D. D.; Olbering, E. L. Soil degrada-tion of flumetsulam at different temperatures in the labora-tory and field. Weed Res. 1992, 32, 187-195.
Levanon, D. Roles of fungi and bacteria in the mineralizationof the pesticide atrazine, alachlor, malathion and carbofuranin soil. Soil Biol. Biochem. 1993, 25, 1097-1105.
Miller, J. L.; Wolum, A. G.; Weber, J. B. Degradation of carbon-14-atrazine and carbon-14-metolachlor in soil from fourdepths. J. Environ. Qual. 1997, 26, 633-638.
3042 J. Agric. Food Chem., Vol. 48, No. 7, 2000 Dinelli et al.
Pussemier, L.; Goux, S.; Vanderheyden, V.; Debongnie, P.;Tresinie, I.; Foucart, G. Rapid dissipation of atrazine in soilstaken from various maize fields. Weed Res. 1997, 37, 171-179.
Rocha, F.; Walker, A. Simulation of the persistence of atrazinein soil at different sites in Portugal. Weed Res. 1995, 35,179-186.
Rossi Pisa, P.; Vicari, A.; Catizone, P. Effetto della CoperturaVegetale di Orzo (Horodeum vulgare L.) Sull’ Erosione eSulla Qualita delle Acque di Ruscellamento. Riv. Agron.1994, 28, 386-393.
Smith, A. E.; Walker, A. Prediction of the persistence of thetriazine herbicides atrazine, cyanazine and metribuzin inRegina heavy clay. Can. J. Soil Sci. 1989, 69, 587-595.
Smith, C. J. Hydrogeology with respect to undergroundcontamination. In Environmental Fate of Pesticides; Huston,D. H., Roberts, T. R., Eds.; Wiley: London, U.K., 1990; pp47-99.
The Pesticide Manual, 11th ed.; Tomlin, C., Ed.; Royal Societyof Chemistry/British Crop Protection Council: Surrey, U.K.,1998.
Vischetti, C.; Leita, L.; Marucchini, C.; Porzi, G. Degradationand mobility of metolachlor and terbuthylazine in a sandyclay loam soil. Agronomie 1998, 18, 131-137.
Walker, A.; Barnes, A. Simulation of herbicide persistence insoil: a revised computer model. Pestic. Sci. 1981, 12, 123-132.
Walker, A.; Bond, W. Simulation of the persistence ofmetamitron activity in soil. Proc. 1978 Br. Crop Prot. Conf.sWeeds 1978, 565-572.
Walker, A.; Brown, P. A. The relative persistence in soil offive acetanilide herbicides. Bull. Environ. Contam. Toxicol.1985, 34, 143-149.
Walker, A.; Zimdhal, R. L. Simulation of the persistence ofatrazine, linuron and metolachlor in soil at different sitesin the USA. Weed Res. 1981, 21, 255-265.
Received for review September 27, 1999. Revised manuscriptreceived April 11, 2000. Accepted April 26, 2000.
JF991057B
Persistence of Atrazine and Metolachlor J. Agric. Food Chem., Vol. 48, No. 7, 2000 3043