Embed Size (px)
Citation preview
TRANSPORTATION RESEARCH RECORD 1331 21
Comparison of Pulse Echo and Transient Response Pile Integrity Test Methods
FRANK RAUSCHE, SHEN REN-KUNG, AND GARLAND E. LIKINS, }R.
Pile integrity test methods of driven and cast in situ piles have been developed by several researchers using differing equipment and methods . Some methods require expensive special preparations during pile manufacture or installation. Others can be applied to randomly selected piles or to piles selected on the basis of their installation histories . The latter methods are inexpensive, easily applied, and, therefore, routinely applied worldwide. Often, all piles on a site are tested and problem piles are identified for corrective action . These methods, called low-strain tests , use signals from a hand-held hammer striking the pile top, which generates a compressive stress wave in the pile. Stress wave reflections from nonuniformities or the pile toe are observed at the pile top, processed, and interpreted by the experienced test engineer. The pulse echo method records the pile top velocity as a function of time. The transient response method displays the mobility (i .e., the ratio of frequency spectra of pile top velocity to force). How both low-strain methods can be combined into one method yielding an optimal amount of information is demonstrated. Recommendations for test preparation and data analysis are given. It is concluded that the new method contains more information than either previous method alone and recommended that analyses be made in both the frequency and time domains .
Foundation engineers need an inexpensive and quick method for the integrity testing of foundation piles when installation difficulties are expected or problems arise during construction. Both driven piles and drilled shafts may undergo serious damage during construction. When this is suspected, selected or even all piles on a construction site may require evaluation. However, in general, special advance preparations such as the installation of inspection tubes are not economically feasible.
When a concrete pile, either precast and driven or drilled and cast in situ, is struck with a small hammer, a stress wave is generated, which travels down the shaft to the pile bottom, where it is reflected. When the reflected stress wave returns to the pile top, a measurable pile top motion occurs. If this reflection occurs at the correct time and if no other earlier reflection waves are received at the pile top, the pile shaft is probably free of major defects. Using this concept, the lowstrain method of dynamic pile testing was developed. In contrast, the high-strain method measures pile top forces and velocities under a large impact hammer. A comparison of high-strain and low-strain results is given elsewhere (J) .
When a lightweight hand-held hammer strikes the pile top, a small pile top motion (velocity) is generated. The associated
F. Rausche, Goble Rausche Likins and Associates, Inc., 4535 Emery Industrial Parkway, Cleveland, Ohio 44128 . R.-K. Shen, Nanjing Hydraulic Research Institute, 34 Hu Ju Guan Road, Nanjing, China 210024. G. E. Likins, Jr., Pile Dynamics, Inc., 4535 Emery Industrial Parkway, Cleveland, Ohio 44128.
pile strains are of such a low magnitude that they would be measured in the pile only with great difficulty . However, the force applied by the hammer can easily be measured by instrumenting the hammer itself. The velocity record and to a lesser degree the force record contain information about the location and magnitude of pile nonuniformities. Under the assumption of proportional force and velocity records (2), and for short-duration impact pulses, the velocity record may be sufficient. One of the distinguishing features of the transient response method (TRM) is that it requires the measurement of both velocity and force, whereas the pulse echo method (PEM) relies only on velocity records. A second difference is the display of the TRM results in the frequency domain. PEM offers powerful record enhancement techniques and presents the resulting curves as a function of time.
Both methods have some advantages and have therefore been combined in a third method, referred to as PIT-FV. All three methods are presented. Using records taken on a drilled shaft with a known cross-sectional change, the features of all three methods are demonstrated.
STRESS WAVE PROPAGATION IN A PILE
An impact applied to the pile top generates a momentary compression and a particle motion of the pile top surface. The compression is related to the force, F; the motion causes a particle velocity, v. In concrete, the stress wave travels along the pile with a stress wave speed, c, ranging from 10 to 15 ft/ msec (3 .3 to 5.0 m/msec) . As shown by St. Venant (3), the stress wave speed in a long slender rod is given by
c2 = £/p (1)
where Eis the pile's elastic modulus and pits mass density . The low-strain methods have also been applied to timber piles. Because of the high ratio of surface area to cross-sectional area, steel piles that are not filled with concrete are difficult to test using low-strain methods. Steel piles are more easily tested with impacts of actual pile-driving hammers (high-strain method) .
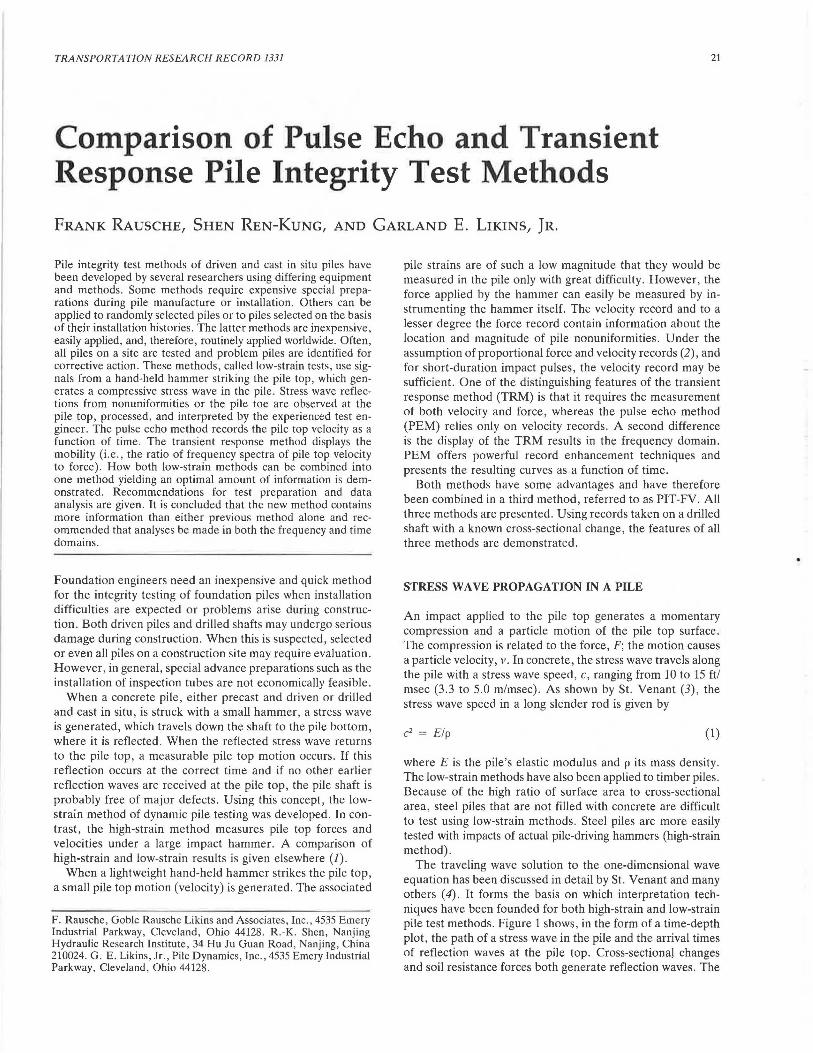
The traveling wave solution to the one-dimensional wave equation has been discussed in detail by St. Venant and many others ( 4). It forms the basis on which interpretation techniques have been founded for both high-strain and low-strain pile test methods. Figure 1 shows, in the form of a time-depth plot, the path of a stress wave in the pile and the arrival times of reflection waves at the pile top . Cross-sectional changes and soil resistance forces both generate reflection waves . The
22
l\fll\CT Pl.LSE
'
~--
(C) ------------LENGTH
FIGURE 1 Impact pulse and reflections from (A) crosssectional reduction, CR; (8) shaft resistance, R (modeled velocity proportional); and (C) pile toe.
ThE
pile top velocity is affected by and therefore indicates the arrival of both tensile and compressive reflection waves.
PEM
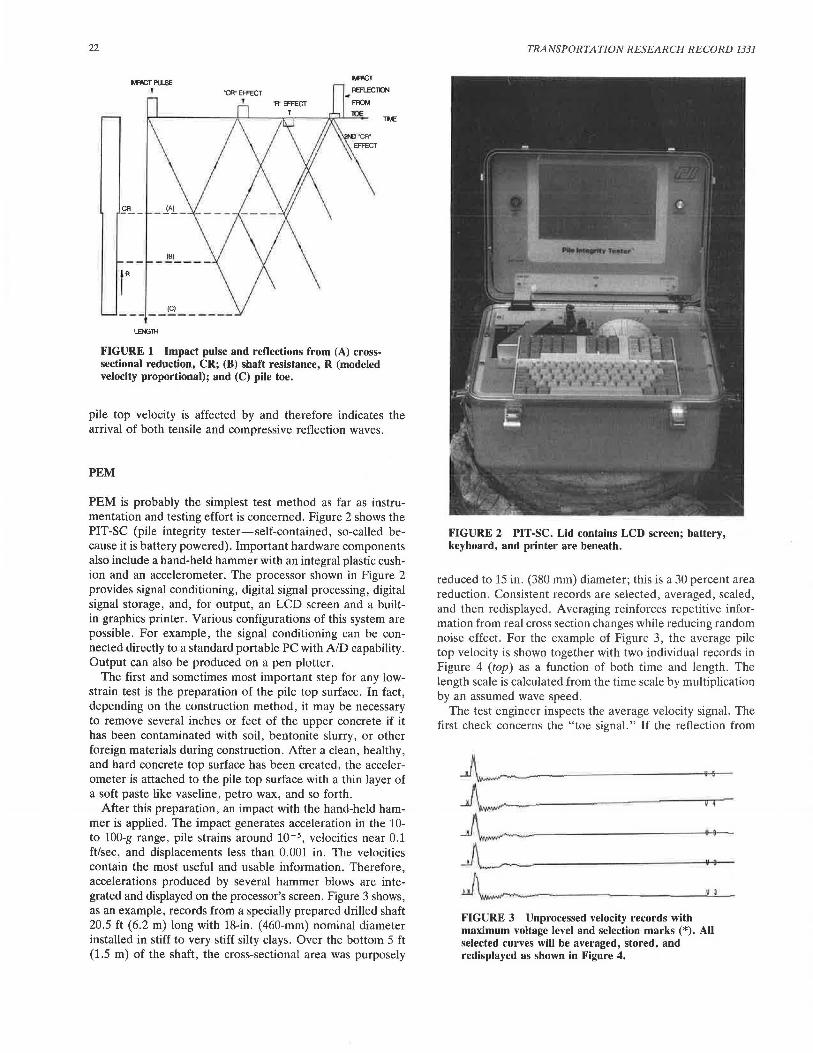
PEM is probably the simplest test method as far as instrumentation and testing effort is concerned. Figure 2 shows the PIT-SC (pile integrity tester-self-contained, so-called because it is battery powered). Important hardware components also include a hand-held hammer with an integral plastic cushion and an accelerometer. The processor shown in Figure 2 provides signal conditioning, digital signal processing, digital signal storage, and, for output, an LCD screen and a builtin graphics printer. Various configurations of this system are possible. For example, the signal conditioning can be connected directly to a standard portable PC with AID capability. Output can also be produced on a pen plotter.
The first and sometimes most important step for any lowstrain test is the preparation of the pile top surface. In fact, depending on the construction method, it may be necessary to remove several inches or feet of the upper concrete if it has been contaminated with soil, bentonite slurry, or other foreign materials during construction. After a clean, healthy, and hard concrete top surface has been created, the accelerometer is attached to the pile top surface with a thin layer of a soft paste like vaseline, petro wax, and so forth.
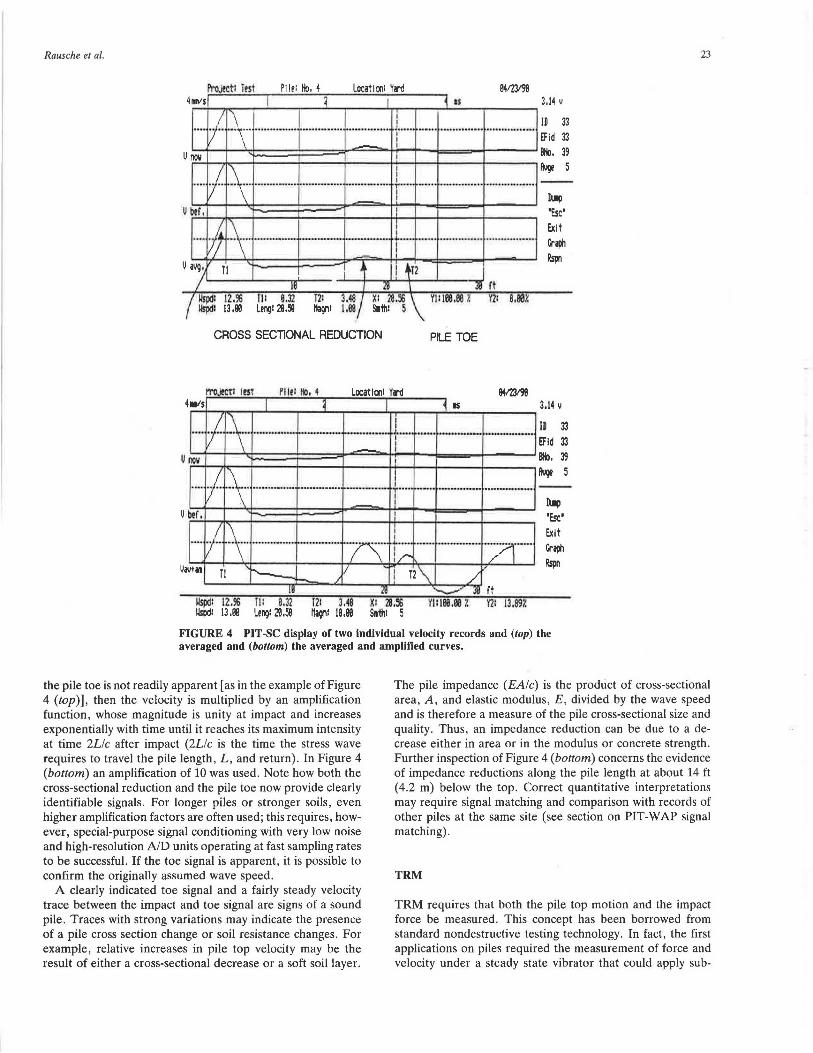
After this preparation, an impact with the hand-held hammer is applied. The impact generates acceleration in the 10-to 100-g range, pile strains around 10-s, velocities near 0.1 ft/sec, and displacements less than 0.001 in. The velocities contain the most useful and usable information. Therefore, accelerations produced by several hammer blows are integrated and displayed on the processor's screen. Figure 3 shows, as an example, records from a specially prepared drilled shaft 20.5 ft (6.2 m) long with 18-in. (460-mm) nominal diameter installed in stiff to very stiff silty clays. Over the bottom 5 ft (1.5 m) of the shaft, the cross-sectional area was purposely
TRANSPORTATION RESEARCH RECORD 1331
FIGURE 2 PIT-SC. Lid contains LCD screen; battery, keyboard, and printer are beneath.
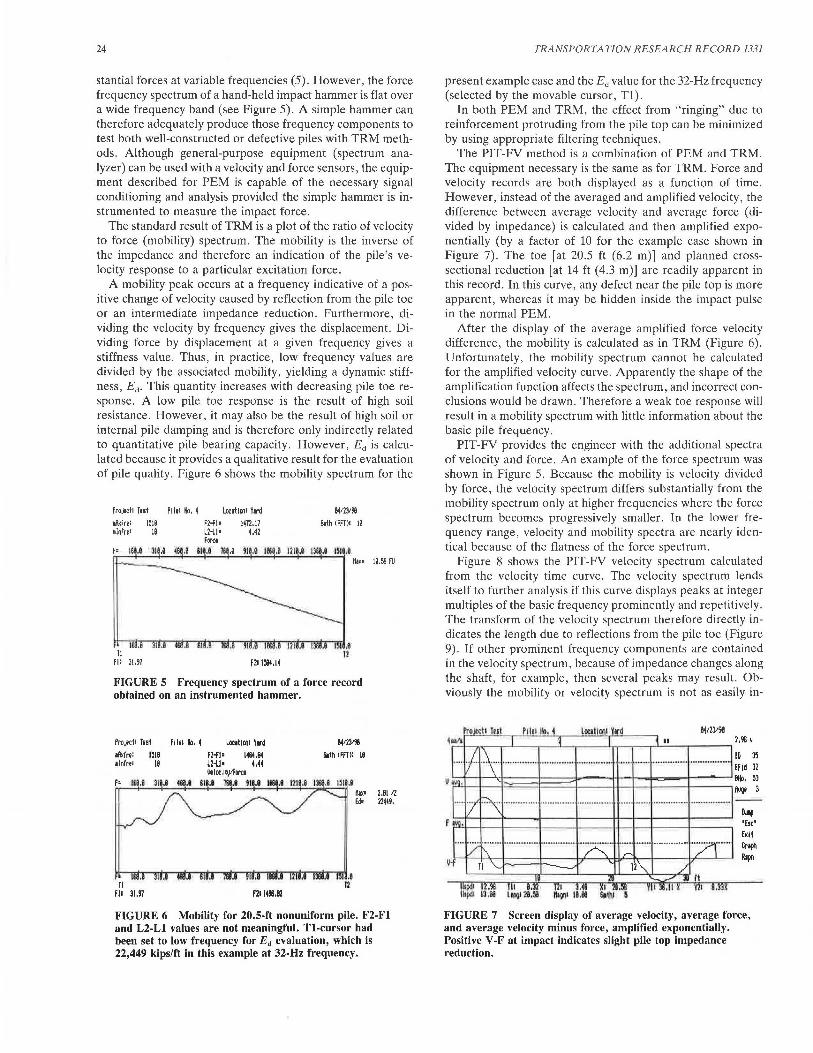
reduced to 15 in. (380 mm) diameter; this is a 30 percent area reduction. Consistent records are selected, averaged, scaled, and then redisplayed. Averaging reinforces repetitive information from real cross section changes while reducing random noise effect. For the example of Figure 3, the average pile top velocity is shown together with two individual records in Figure 4 (top) as a function of both time and length. The length scale is calculated from the time scale by multiplication by an assumed wave speed.
The test engineer inspects the average velocity signal. The first check concerns the "toe signal." If the reflection from
~_.,......___~~~~~~~~~---+i+1 ~ ~ ~~~~~~~~~~~~-,-0•1~ -11 \w~ . ....----
Aw,---- ----~--------'1--'i lt--~-~~""-'---Vl FIGURE 3 Unprocessed velocity records with maximum voltage level and selection marks (*). All selected curves will be averaged, stored, and redisplayed as shown in Figure 4.
Rausche et al.
Pro.;ect1 Test Pi le: ~. 4 Location: Yart! 04123199 41!1'11s I ~ 1 i as 3.14 v r-+-..,...,.~...,.....---~-,-~-'----.~~--' ........ --.~~"'-~--....~~~...,
····V· 1·~ .................................. = .... i ......................................... ~id: U now Bl+l. 39
.... V··\· ......................................... t···· .................................... : s
U btf, 'Esc'
1 .. ~ .\.. Exit .... {/ ''"\" ................................ = ....... , ..... ...... .............. ................ Crijih
Rspn v avg, Tl ' I .T2
/ 18 i'i 1 Ji rt (
llspdl 12.96 111 8.32 T2I 3.48 XI 28.56 \ Ylllll8.00 1. Y21 8.00?. llspdl 13 .00 Leng: 28.58 Magni 1.00 Sathl 5
CROSS SECTIONAL REDUCTION PILE TOE
ITOJtCTI IUT ftle1 It>, 4 Locat1001 Yard I ~ I 1 IS 3.14 y
r-t--~~~~~r-_.,--ir--~-1.T'T'""_,..~,...i....;;.;...~.--~~..., 411/s
.... IJ .. \.. .............. .............. . ............. i ........... ·-···--·- ................ ~id :
0~ I ~. ~
I~.. I ~ s .... / .... \ ............... " ............. ,.......= ........ r ........................................ ~ U bef, I
.... ~c\ ............................. . ?'\. L: ...................... ~;/! .... .. Tl
~spd: 12.96 ~: 13.00
18 Ill 8.32 Leng: 28.50
[2: 3.48 Magni 10.09
x: 28.56 Sathl 5
T2\ -......-' Jll rt
Yll 186.al % Y2: 13.89%
'Esc' Exit Graph Rspn
FIGURE 4 PIT-SC display of two individual velocity records and (top) the averaged and (bottom) the averaged and amplified curves.
23
the pile toe is not readily apparent [as in the example of Figure 4 (top)], then the velocity is multiplied by an amplification function, whose magnitude is unity at impact and increases exponentially with time until it reaches its maximum intensity at time 2L/c after impact (2L/c is the time the stress wave requires to travel the pile length, L, and return). In Figure 4 (bottom) an amplification of 10 was used. Note how both the cross-sectional reduction and the pile toe now provide clearly identifiable signals. For longer piles or stronger soils, even higher amplification factors are often used; this requires, however, special-purpose signal conditioning with very low noise and high-resolution AID units operating at fast sampling rates to be successful. If the toe signal is apparent, it is possible to confirm the originally assumed wave speed.
The pile impedance (EA/c) is the product of cross-sectional area, A, and elastic modulus, E, divided by the wave speed and is therefore a measure of the pile cross-sectional size and quality. Thus, an impedance reduction can be due to a decrease either in area or in the modulus or concrete strength. Further inspection of Figure 4 (bottom) concerns the evidence of impedance reductions along the pile length at about 14 ft (4.2 m) below the top. Correct quantitative interpretations may require signal matching and comparison with records of other piles at the same site (see section on PIT-W AP signal matching).
A clearly indicated toe signal and a fairly steady velocity trace between the impact and toe signal are signs of a sound pile. Traces with strong variations may indicate the presence of a pile cross section change or soil resistance changes. For example, relative increases in pile top velocity may be the result of either a cross-sectional decrease or a soft soil layer.
TRM
TRM requires that both the pile top motion and the impact force be measured. This concept has been borrowed from standard nondestructive testing technology. In fact, the first applications on piles required the measurement of force and velocity under a steady state vibrator that could apply sub-
24
stantial forces at variable frequencies (5). However, the force frequency spectrum of a hand-held impact hammer is flat over a wide frequency band (see Figure 5). A simple hammer can therefore adequately produce those frequency components to test both well-constructed or defective piles with TRM methods. Although general-purpose equipment (spectrum analyzer) can be used with a velocity and force sensors, the equipment described for PEM is capable of the necessary signal conditioning and analysis provided the simple hammer is instrumented to measure the impact force.
The standard result of TRM is a plot of the ratio of velocity to force (mobility) spectrum. The mobility is the inverse of the impedance and therefore an indication of the pile's velocity response to a particular excitation force.
A mobility peak occurs at a frequency indicative of a positive change of velocity caused by reflection from the pile toe or an intermediate impedance reduction. Furthermore, dividing the velocity by frequency gives the displacement. Dividing force by displacement at a given frequency gives a stiffness value. Thus, in practice, low frequency values are divided by the associated mobility, yielding a dynamic stiffness, Ed. This quantity increases with decreasing pile toe response. A low pile toe response is the result of high soil resistance. However, it may also be the result of high soil or internal pile damping and is therefore only indirectly related to quantitative pile bearing capacity. However, Ed is calculated because it provides a qualitative result for the evaluation of pile quality. Figure 6 shows the mobility spectrum for the
Proj!ct1 Jest Pl lei II>. 4 Locat1on1 Yrd 84123198
ollxfre: 1510 FHI• 1412.17 Sith (FFJ): Ii olnfre: 10 LH.I• Ml
Foret 11 .e .0 '1 .e 11!:11.I 111 .a 1s.·a.e m ,1
Hax• 10.56 FU
Tl Fl: 31.97 f21l~.14
FIGURE 5 Frequency spectrum of a force record obtained on an instrumented hammer.
Proj!ctl J11t Pi11111>.4
lllxfri: 1518 1lnfre• 18
JI Fii 31.97 f21 l4!6.82
114123198 Sith (Fm: 18
2.81 IZ 22449.
FIGURE 6 Mobility for 20.5-ft nonuniform pile. F2-Fl and L2-Ll values are not meaningful. Tl-cursor had been set to low frequency for Ed evaluation, which is 22,449 kips/ft in this example at 32-Hz frequency.
TRANSPORTATION RESEARCH RECORD 1331
present example case and the Ed value for the 32-Hz frequency (selected by the movable cursor, Tl).
In both PEM and TRM, the effect from "ringing" due to reinforcement protruding from the pile top can be minimized by using appropriate filtering techniques.
The PIT-FY method is a combination of PEM and TRM. The equipment necessary is the same as for TRM. Force and velocity records are both displayed as a function of time. However, instead of the averaged and amplified velocity, the difference between average velocity and average force (divided by impedance) is calculated and then amplified exponentially (by a factor of 10 for the example case shown in Figure 7). The toe [at 20.5 ft (6.2 m)] and planned crosssectional reduction [at 14 ft (4.3 m)] are readily apparent in this record. In this curve, any defect near the pile top is more apparent, whereas it may be hidden inside the impact pulse in the normal PEM.
After the display of the average amplified force velocity difference, the mobility is calculated as in TRM (Figure 6). Unfortunately, the mobility spectrum cannot be calculated for the amplified velocity curve. Apparently the shape of the amplification function affects the spectrum, and incorrect conclusions would be drawn. Therefore a weak toe response will result in a mobility spectrum with little information about the basic pile frequency.
PIT-FY provides the engineer with the additional spectra of velocity and force. An example of the force spectrum was shown in Figure 5. Because the mobility is velocity divided by force, the velocity spectrum differs substantially from the mobility spectrum only at higher frequencies where the force spectrum becomes progressively smaller. In the lower frequency range, velocity and mobility spectra are nearly identical because of the flatness of the force spectrum.
Figure 8 shows the PIT-FY velocity spectrum calculated from the velocity time curve. The velocity spectrum lends itself to further analysis if this curve displays peaks at integer multiples of the basic frequency prominently and repetitively. The transform of the velocity spectrum therefore directly indicates the length due to reflections from the pile toe (Figure 9). If other prominent frequency components are contained in the velocity spectrum, because of impedance changes along the shaft, for example, then several peaks may result. Obviously the mobility or velocity spectrum is not as easily in-
....-'C--......--.--'-~~~.L_~~--'-....-~--.-'-~-.-~~~ 2,96 v
ID 35 Efid 32
~=t-~~;;::!==::t:=:jt:l~~=t:==:~· 53 [!'.I ~ 3
bf! 1Esc 1
EMii ~iph
R1p11
FIGURE 7 Screen display of average velocity, average force, and average velocity minus force, amplified exponentially. Positive V-F at impact indicates slight pile top impedance reduction.

Rausche et al.
Profic11 Test 1Rxfre1 2000 1lnfre1 58
fll 81!.61
Pllel Ho, 1 Locat1on1 Y-r4 fl-fl• m,51 L2-LI= 16,13 Vt lot It~
83U Ii .e
11 12 f211m.12
H1K• 11.22 w
FIGURE 8 Velocity spectrum. This spectrum, divided by the force spectrum of Figure 5, yields the mobility spectrum of Figure 7. Cursors were set to a frequency interval indicating a length of 16.4 ft.
Pro~ctl Test Pi1 11 Ho. 1 Loc1t1o01 Ylf'd &jt23198
IRxlen 5:1 Sath (Ffj)i 1lnl1n 5
l• I .8 I .e 1'0.8 4U .ll LB HaK• 4.18W
II Ill 2.47 Lil 121 3.17 l21 20.le
FIGURE 9 Reflectors from Fourier transform of velocity spectrum. Tl and T2 cursors were set to the nonuniformity indicator at 16 ft (built at 15 ft) and the length indicator, which is exact.
terpreted. Again, the amplified velocity cannot be analyzed in this manner. PIT-FY offers this important additional result as an aid in interpretation. In the example presented here, the cross-sectional reduction is easily observed in the high marker, and the pile toe with a smaller reflection.
CALCULATED RESPONSE
The low-strain pile integrity test methods yield some form of pile top motion curve. Interpretation of these curves is left to the engineer. Similar curves developed analytically are an invaluable aid in interpretation. The special-purpose computer program PIT-WAP (Pile Integrity Testing Wave Analysis Program), written using CAPWAPC (CAse Pile Wave Analysis Program-Continuous version) (6) as a starting code, requires that the description of pile and soil be input and generates pile top velocity versus time or the mobility spectrum as an output. A voluminous catalog of these calculated responses was compiled as a guide for record interpretation. Only one of many demonstration cases is discussed in the following.
Figure 10 shows the calculated curves for a pile with sufficient uniform shaft resistance to reduce the pile toe reflection to a small pulse. The pile was 20 ft (6.1 m) in length. With a wave speed of 13 ft/msec, the wave travel time (2L/c) was
25
approximately 3.1 msec. The corresponding frequency is 325 Hz. This frequency is apparent in the uniform case (Figure 10). Piles with an impedance reduction (Figure 11) and with an impedance increase (Figure 12) over the lower quarter of the pile were also analyzed. A pile impedance versus depth profile separates time from frequency plots. The beginning of the cross-sectional change, in Figures 11 and 12, produces a pile top reflection at 2.3 msec or 430 Hz. Unfortunately, no really clear response frequency is apparent in the corresponding spectra. The output sheet also includes Ed values at five different frequencies.
j,661Z
p.,.l111P - C$l. aM Rlqc11lti,\ ll)C, pl • ,, p,1,1.-llf l llillitll¥l - lfllff.fl 8 OIJ 51 88181'16
[\ I V
BfFlffTIU. Ed ~8
12878 18837 23811 29m
II Ltc
f ~ ~ILllV
II IS 19
FIGURE 10 Results from PIT-WAP simulation for uniform 20-ft pile.
p,,,l,lff - ~Mid Al1QClilii1 (lj:, Pl 1 ,, P,1,1, BtliJlallllfl - ~11ii:id p(lllj 51 1111l
l.lllZ
EFt11]1tt] lOO Hz
Ed 58~
11m 16937 22H8 27lllll
f ~ ~lllTV II IS 19
FIGURE 11 Results from PIT-WAP simulation for pile with reduced impedance from 15 to 20 ft.
p 1 ·1 lff - CiO. l!il P.llQCli\iil I~. P( 1 l 1 P, 1. I .-Ill' l11illat1o0 - ncrm1 8 OIJ 54 8818ll'lll
Ed 5754 ll~ 11215 22816 28481
i
~ ~ILITY ll IS 19
FIGURE 12 Results from PIT-WAP simulation for pile with increased cross section between 15- and 20-ft depth.
26
PIT-WAP SIGNAL MATCHING
The PIT-W AP program can also be used in the interpretation of measured PIT-FY velocity or velocity and force records. Suppose that the measured force record is imposed as a pile top boundary condition for an analytical model of pile and soil. One result of this analysis would be the calculated pile top velocity. Comparison of the measured with the computed velocity allows the engineer to gain insight into pile impedance variations. Reanalyzing with a variable impedance pile model should therefore lead to an improved match of measured and calculated pile top velocity. The process of changing impedance and reanalyzing is continued until a good match is achieved. At that point, the most likely pile impedance profile has been determined. The difficulty of this simulation is that the soil resistance effects also influence the pile top velocity. However, comparison of the records of several piles may help identify the normal soil response effect.
Typically, PIT-WAP divides the pile in continuous segments of approximately 10 in. (250 mm) length. The program automatically calculates the pile impedance of all segments after the engineer has decided on a soil resistance model. Note that because of the very low magnitude force inputs, this soil resistance model bears no close relationship to static resistance or damping magnitudes encountered during pile driving. On the other hand, for accurate pile impedance predictions, it is important to realistically model the effect of soil resistance on pile top variables. Generally, it is possible to extract these relative soil resistance parameters from PIT-FY tests on reference piles. The parameters are then used to analyze neighboring piles with impedance variations.
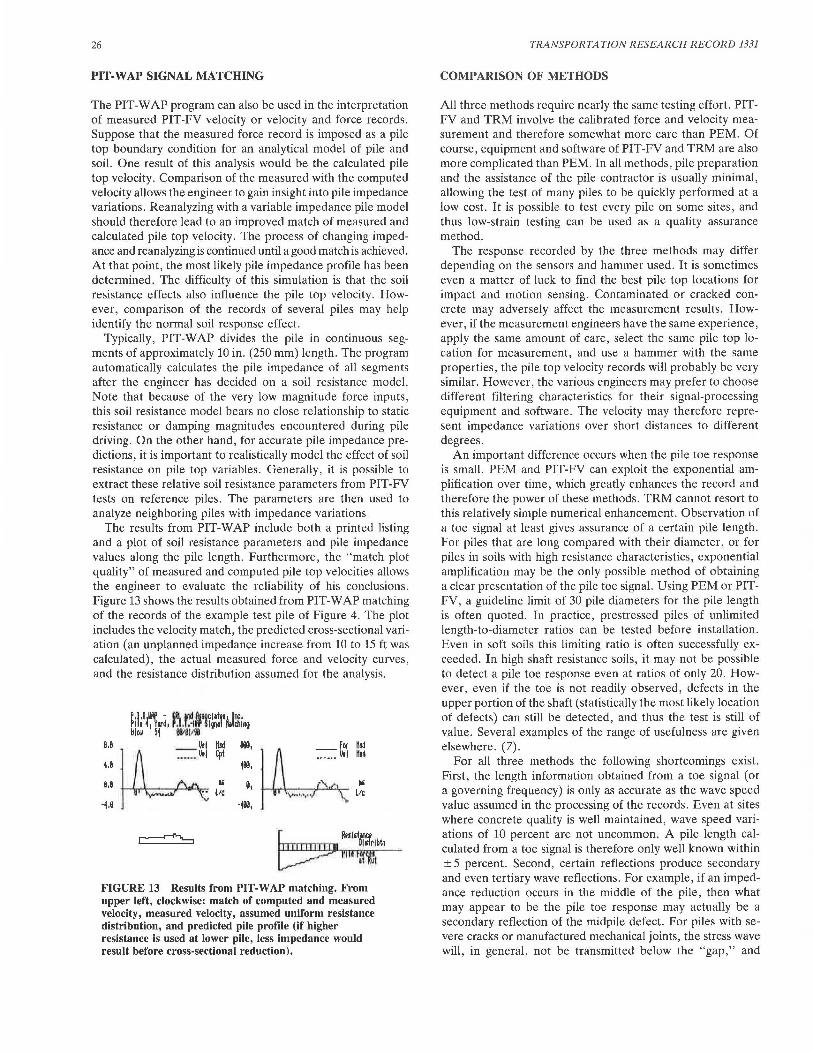
The results from PIT-W AP include both a printed listing and a plot of soil resistance parameters and pile impedance values along the pile length. Furthermore, the "match plot quality" of measured and computed pile top velocities allows the engineer to evaluate the reliability of his conclusions. Figure 13 shows the results obtained from PIT-WAP matching of the records of the example test pile of Figure 4. The plot includes the velocity match, the predicted cross-sectional variation (an unplanned impedance increase from 10 to 15 ft was calculated), the actual measured force and velocity curves, and the resistance distribution assumed for the analysis.
P.j.111if • Cit Mlj Ai~c11t11A\nc· Pl 1 ,1 Vird, P.1.T.~ff Slwia Iii diillQ BllllJ 51 Mll9tl
8.9 ~~I ~, 800, 1.e 189,
a.a Ii a, Lie
-u -189,
FIGURE 13 Results from PIT-WAP matching. From upper left, clockwise: match of computed and measured velocity, measured velocity, assumed uniform resistance distribution, and predicted pile profile (if higher resistance is used at lower pile, less impedance would result before cross-sectional reduction).
TRANSPORTATION RESEARCH RECORD 1331
COMPARISON OF METHODS
All three methods require nearly the same testing effort. PITFY and TRM involve the calibrated force and velocity measurement and therefore somewhat more care than PEM. Of course, equipment and software of PIT-FY and TRM are also more complicated than PEM. In all methods, pile preparation and the assistance of the pile contractor is usually minimal, allowing the test of many piles to be quickly performed at a low cost. It is possible to test every pile on some sites, and thus low-strain testing can be used as a quality assurance method.
The response recorded by the three methods may differ depending on the sensors and hammer used. It is sometimes even a matter of luck to find the best pile top locations for impact and motion sensing. Contaminated or cracked concrete may adversely affect the measurement results. However, if the measurement engineers have the same experience, apply the same amount of care, select the same pile top location for measurement, and use a hammer with the same properties, the pile top velocity records will probably be very similar. However, the various engineers may prefer to choose different filtering characteristics for their signal-processing equipment and software. The velocity may therefore represent impedance variations over short distances to different degrees.
An important difference occurs when the pile toe response is small. PEM and PIT-FY can exploit the exponential amplification over time, which greatly enhances the record and therefore the power of these methods. TRM cannot resort to this relatively simple numerical enhancement. Observation of a toe signal at least gives assurance of a certain pile length. For piles that are long compared with their diameter, or for piles in soils with high resistance characteristics, exponential amplification may be the only possible method of obtaining a clear presentation of the pile toe signal. Using PEM or PITFY, a guideline limit of 30 pile diameters for the pile length is often quoted. In practice, prestressed piles of unlimited length-to-diameter ratios can be tested before installation. Even in soft soils this limiting ratio is often successfully exceeded. In high shaft resistance soils, it may not be possible to detect a pile toe response even at ratios of only 20. However, even if the toe is not readily observed, defects in the upper portion of the shaft (statistically the most likely location of defects) can still be detected, and thus the test is still of value. Several examples of the range of usefulness are given elsewhere. (7).
For all three methods the following shortcomings exist. First, the length information obtained from a toe signal (or a governing frequency) is only as accurate as the wave speed value assumed in the processing of the records. Even at sites where concrete quality is well maintained, wave speed variations of 10 percent are not uncommon. A pile length calculated from a toe signal is therefore only well known within ± 5 percent. Second, certain reflections produce secondary and even tertiary wave reflections. For example, if an impedance reduction occurs in the middle of the pile, then what may appear to be the pile toe response may actually be a secondary reflection of the midpile defect. For piles with severe cracks or manufactured mechanical joints, the stress wave will, in general, not be transmitted below the "gap," and

Rausche et al.
therefore the pile below this "defect" cannot be evaluated. Third, piles with multiple or highly variable cross section changes are difficult to analyze. Piles that are still rigidly attached to other parts of the structure can sometimes be analyzed successfully, but often the analysis is much more difficult.
The additional force measurement of PIT-FY and TRM definitely provides supplemental information of cross-sectional changes occurring near the pile top (i.e., in the distance covered by the impact signal). The extra expense of the force measurement is, therefore, worthwhile whenever questions arise as to the integrity of the upper [say, 5-ft (1.5-m)] pile portion.
The record presentation in the frequency domain may, on occasion, be of benefit. For example, important record components may be hidden in a steady-state signal caused by pile top or reinforcement vibration. They also provide information on dynamic stiffness, although no low-strain method can truly give quantitative information on the ultimate capacity of a pile. In general, however, the interpretation of time records is much simpler than that of frequency records. Time records can also be analyzed simply by the PIT-WAP signal-matching technique.
SUMMARY AND CONCLUSIONS
Three different methods were presented that rely on lowstrain measurements taken on a pile struck by a hand-held hammer. These methods are quickly and simply applied at low cost and do not require special preparations during pile construction, making them a good quality assurance tool. PEM has the advantage that very small toe response signals on long piles can be enhanced. TRM provides additional information for integrity evaluation near the pile top. PIT-FY combines the advantages of both methods and provides direct length indication by the second transform of velocity. It also provides the necessary information for signal matching with the PITWAP simulation program. TRM and PIT-FY provide relative or quantitative pile stiffness information; however, these values are of limited value for capacity evaluation.
All three methods have similar limitations, which include a generally unknown wave speed and therefore an uncertainty as to the exact location of pile defects or pile toe. Piles with highly variable cross sections are difficult to analyze. Multiple reflections from the same location may mask the wave reflections from lower locations or from the pile toe. It appears
27
that these methods may provide information that can be expressed as follows:
•No significant defect was apparent in the records (the record indicated a pile toe response and no other significant reflection before the pile toe response was apparent).
•No significant defect was apparent in the records; however, the full pile length was not tested because no pile toe reflection was apparent.
•Significant impedance changes were noted. Their magnitude was approximately x percent at a depth of y ft. However, a pile toe response was clearly indicated. The pile may therefore be of limited value.
• Significant impedance changes were noted, and a pile toe signal was not apparent. The pile is highly questiomihle, :mcl
additional tests or replacement of the pile is suggested.
Inconclusive test results are also possible, particularly when very large impedance increases (e.g., a large bulge or outgrowth in shaft diameter in a soft fill) near the pile top prevent a clear stress wave transmission. Some inconclusive results stem from inadequate pile top preparation in obtaining a good testing surface. Of course, such a pile is perfectly capable of performing its service task; however, successful low-strain testing would require additional pile top preparation.
REFERENCES
1. F. Rausche, G. E. Likins, and M. Hussein. Pile Integrity by Low and High Strain Impacts. In Proc., Third International Conference on Stress Wave Theory on Piles (B. H. Fellenius, ed.), Ottawa, Ontario, Canada, 1988.
2. F. Rausche and G. G. Goble. Determination of Pile Damage by Top Measurements. Behavior of Deep Foundations, ASTM Symposium, Boston, Mass., 1978.
3. S. Timoshinko and J. N. Goodier. Theory of Elasticity. McGrawHill Book Company, Inc., New York, 1951.
4. Proc., Third International Conference on Stress Wave Theory on Piles (B. H. Fellenius, ed.), Ottawa, Ontario, Canada, 1988.
5. D. M. Lilley, W. M. Kilkenny, and R. F. Akroyd. Steady State Vibration Testing of Piles with Known Defects. In Proc., Third International Conference on Stress Wave Theory on Piles (B. H. Fellenius, ed.), Ottawa, Ontario, Canada, May 1988.
6. G. G. Goble, F. Rausche, and G. E. Likins. The Analysis of Pile Driving: A State-of-the-Art. First Seminar on the Application of Stress Wave Theory on Piles, Stockholm, Sweden, 1980.
7. J. A. Berger and D. M. Cotton. Low Strain Integrity Testing of Deep Foundations. Proc., Deep Foundation Institute Annual Meeting, Seattle, Wash., 1990.


![-[Hell]- Pif n#1331](https://img.dokumen.tips/doc/110x75/5571fa9f497959916992ac4d/-hell-pif-n1331.jpg)