Embed Size (px)
Citation preview

HYDROLOGICAL PROCESSESHydrol. Process. 18, 2681–2697 (2004)Published online in Wiley InterScience (www.interscience.wiley.com). DOI: 10.1002/hyp.5575
Comparison of nitrogen solute concentrationswithin alder (Alnus incana ssp. rugosa)
and non-alder dominated wetlands
Todd M. Hurd1* and Dudley J. Raynal21 Department of Biology, Shippensburg University, Shippensburg, PA 17257, USA
2 Department of Environmental and Forest Biology, 350 Illick Hall, SUNY College of Environmental Science and Forestry, 1 ForestryDr., Syracuse, NY 13210, USA
Abstract:
This study examined differences in nitrogen solutes and groundwater flow patterns between a riparian wetlanddominated by the N2-fixing shrub, Alnus incana ssp. rugosa, and an upstream coniferous forested riparian wetlandalong a stream of the Adirondack Mountains, where some surface waters are susceptible to nitrogen excess. Channelwater NO3
� was up to 16 µmol l�1 greater in the alder reach, with peaks following maxima in groundwater dissolvedinorganic nitrogen (DIN). NO3
� at 25 cm depth was 30 µmol greater in the alder than in the conifer reach in April, and24 µmol l�1 greater than channel water and 30 µmol l�1 greater than that of 125 cm groundwater in June. Dissolvedorganic nitrogen and NH4
C concentrations increased between 25 and 75 cm depths in both wetlands during the growingseason. Inorganic nitrogen increased between the hillslope and stream in both wetlands, with the greatest increases inthe alder reach during the dormant season. Greatest subsurface DIN (120 µmol l�1) occurred at 75 cm in the alderreach, within 1 m of the stream, between November (120 µmol l�1 NH4
C) and a January thaw (60 µmol l�1 each ofNH4
C and NO3�). Concentrations of deeper groundwater at 125 cm during this period were lower (10–30 µmol l�1).
Lateral flow from the stream channel occurred in the alder reach during the dormant season, and channel watercontribution to groundwater was correlated strongly to NO3
� at 25 cm. These results indicate that nitrification isstimulated in the presence of alders and oxidized exchange flow, producing NO3
� that may contribute to elevatedchannel water NO3
� during periods of peak flow. Copyright 2004 John Wiley & Sons, Ltd.
KEY WORDS riparian; wetlands; nitrogen; Alnus; Adirondack Mountains
INTRODUCTION
Surface waters in the Adirondack Mountains in New York State, such as seepage and drainage lakes withthin glacial till in surrounding watersheds, are sensitive to atmospheric deposition of acid anions due to lowacid neutralizing capacity (ANC; Driscoll et al., 1991, 1998). Although significant declines in SO4
2�, NO3�
and Cl� concentration in deposition have occurred in the region with correlated declines in lake water SO42�,
the ANC of many surface waters has not increased (Driscoll et al., 1998). While there has been increasedexamination of NO3
� as an acid anion (Likens et al., 1998) and of wetland influence on nitrogen transportbetween hillslopes and streams (Cirmo and McDonnell, 1997), the influence of nitrogen-fixing alder shrubson spatial and temporal patterns of nitrogen chemistry in wetlands of the region has not been quantified.
The actinorhizal N2-fixing shrub, speckled alder, Alnus incana ssp. rugosa (DuRoi) Clausen, often occursalong stream sides and in wetlands in the northeastern USA and Canada (Furlow, 1979). Speckled alderdominates the Scrub-Shrub 1 (SS1) wetland cover type (Cowardin et al., 1979), the second largest wetlandcover type after coniferous forest (FO4) in the Adirondack Mountains (Roy et al., 1996). Nitrogen fixation
* Correspondence to: Todd M. Hurd, Department of Biology, Shippensburg University, Shippensburg, PA 17257, USA.E-mail: [email protected]
Received 01 November 2001Copyright 2004 John Wiley & Sons, Ltd. Accepted 20 March 2002

2682 T. M. HURD AND D. J. RAYNAL
in a riparian SS1 alder wetland in the central Adirondacks was estimated to be 37–43 kg ha�1 year�1 (Hurdet al., 2001). In other parts of eastern North America, nitrogen accretion in speckled alder wetlands may be85–167 kg ha�1 year�1 (Daly, 1966; Voigt and Steucek, 1969). Speckled alders in the region derive 85–100%of foliar nitrogen from fixation (Hurd et al., 2001) and do not resorb foliar nitrogen prior to litter fall (Bischoffet al., 2001).
Elevated nitrification and nitrogen leaching occur in alder (A. rubra (Bongard) and A. incana ssp. tenuifolia(Nuttall) Breitung) stands of western North America (Coats et al., 1976; Van Miegroet and Cole, 1984, 1985;Binkley et al., 1992; Hart et al., 1997), flood plain soils with A. incana ssp. tenuifolia (Van Cleve et al.,1993), and drained peatlands dominated by A. glutinosa (L.) Gaertner (Kazda, 1995). In an Adirondackforested watershed, the presence of speckled alder increased NO3
� content and net nitrification rate of wetlandsoil (Ohrui et al., 1999). Stottlemyer et al. (1995) measured average soil NO3
� of 56Ð5 mg m�2 in speckledalder stands, which is three times that of sugar maple stands, seven times that of spruce stands, and 10times that of birch stands at Isle Royale in northern Michigan, USA. Stottlemyer et al. (1995) also measuredgreatest nitrification under alders between July and the following May, and noted that alder stands occurredon previously flooded low-elevation sites, where soils were saturated to within 5 cm of the surface into June.
Recent studies have focused on hydrological interactions with nitrogen transformations in riparian andhyporheic zones (Dahm et al., 1994; Cirmo and McDonnell, 1997; Hedin et al., 1998; Hill and Lymburner,1998). Goldman (1961), Dugdale and Dugdale (1961), Coats et al. (1976) and Wondzell and Swanson (1996)have considered the contribution of western A. tenuifolia or A. rubra to surface water inorganic nitrogen orprimary productivity, but the effects of alders on riparian ground and surface water nitrogen in eastern NorthAmerica remain unquantified.
This study compares seasonal and spatial patterns of nitrogen solutes between a riparian wetland dominatedby N2-fixing alders (classified as SS1) and an upstream wetland dominated by conifers (FO4), in a regionwhere many surface waters are sensitive to anthropogenic sources of nitrogen and acidity. Because densealders in these ecosystems fix nitrogen of approximately 40 kg ha�1 year�1 (85–100% of annual foliarnitrogen (Hurd et al., 2001)), and may stimulate nitrification (Ohrui et al., 1999), we expected elevatedconcentrations of nitrate and other nitrogen solutes in the alder wetland, particularly during periods of lowbiological nitrogen demand (autumn and winter). Moreover, we expected that nitrogen solute concentrations inshallow groundwater would increase between hillslope and stream in the alder wetland, due to low biologicaldemand by nitrogen-fixing vegetation (Hurd et al., 2001), stimulated riparian nitrogen mineralization (VanCleve et al. 1993) and potential oxygenation of near-stream soils by exchange flow (contribution of oxygenatedchannel water) that may stimulate nitrification but decrease denitrification (Triska et al., 1989, 1993).
SITE DESCRIPTION
Research was conducted on the upper Adjidaumo stream at the Huntington Wildlife Forest (HWF) locatedin the central Adirondack Mountain region of New York (Figure 1). The HWF is a National AtmosphericDeposition Program (NADP) and National Trends Network (NTN) monitoring site, and has been the locus ofmany biogeochemical studies (Raynal et al., 1985; Johnson and Lindberg, 1992; Mitchell et al., 1994, 1996;Ohrui et al., 1999).
Soils, surficial geology, and bedrock geology at HWF are typical of the Adirondack region and are describedin Somers (1986) and Ohrui et al. (1999). Mean annual temperature is 4Ð4 °C, with a dormant mean of�2Ð8 °C and a growing-season mean of 14Ð3 °C. Mean annual precipitation is 101 cm (Shepard et al., 1989).Upland vegetation is mixed northern hardwood forest. The lower elevations are characterized by red spruce(Picea rubens Sarg.), balsam fir (Abies balsamea (L.) Miller), eastern hemlock (Tsuga canadensis (L.) Carr.),and yellow birch (Betula alleghaniensis Britton). Speckled alder dominates a 5 ha SS1 wetland along theAdjidaumo stream, and other riparian wetlands at HWF (Bischoff et al., 2001; Hurd et al., 2001).
Copyright 2004 John Wiley & Sons, Ltd. Hydrol. Process. 18, 2681–2697 (2004)

NITROGEN SOLUTE IN RIPARIAN WETLANDS 2683
AdjidaumoFlow
HuntingtonWildlifeForest (HWF)
*Alder*
ArbutusLake
Reference
HWF
Catlin Lake
DeerLake
WolfLake
Rich Lake
N1 km0
Scale
28N
Adirondack ParkIn New York State
Figure 1. Study site locations at HWF in the Adirondack Park of New York State
METHODS
Nitrogen concentrations and groundwater flow patterns were compared in two wetland reaches of Adjidaumostream. Vegetation cover was estimated by line intercept, with three transects in each reach runningperpendicular to the stream. The first reach, classified as SS1, was dominated by speckled alder (59% cover)and A. balsamea (41%), with Calamagrostis canadensis (Michx.) P. Beauv. (36%) and Clematis virginianaL. (35%) dominating the ground layer. The distance between hillslope and stream is approximately 30 m.Beaver activity at the downstream end of this reach resulted in visible, year-round loss of channel water tothe wetland. The reference reach, classified as FO4, was approximately 500 m upstream (Figure 1), with adistance between hillslope and stream of approximately 30 m. Canopy vegetation in this reach was dominatedby P. rubens (33%), A. balsamea (16%), T. canadensis (17%) and B. alleghaniensis (15%), with C. canadensis(25%) and Rubus spp. (23%) dominating the ground layer.
Water sampling and analysis
Both wetland reaches were instrumented in May 1996 with three transects of nested piezometers to samplethe hydrologic head and the concentrations of NO3
�, NH4C, total nitrogen, and Cl� as a hydrologic tracer,
at 20–25, 70–75, and 120–125 cm depths. The 20–25 cm depth corresponded to maximum depth to watertable, immediately below the rooting zone. Organic substrate was generally present at 70–75 cm, and the125 cm piezometers penetrated till or alluvium in both wetlands. Piezometers were constructed of 2Ð54 cmID PVC capped at the bottom, and slotted and screened for the bottom 5 cm to facilitate water collection.Transects ran perpendicular to the stream between the channel and hillslope, and were spaced 10 m apart.The first three piezometer nests were spaced at 5 m intervals within transects starting �1 m from the stream(evenly throughout alder or coniferous wetland cover), with the fourth nest placed at the wetland–hillslopemargin approximately 30 m from the stream. Piezometers were installed at 125 cm at 1 and 6 m from the
Copyright 2004 John Wiley & Sons, Ltd. Hydrol. Process. 18, 2681–2697 (2004)

2684 T. M. HURD AND D. J. RAYNAL
stream in the alder site, but could only be installed in two nests in the reference site. One shallow well(1Ð5 m depth, 7Ð6 cm ID PVC) was installed in May 1997 in a hollow of each wetland to monitor water tableelevation.
Groundwater samples for chemical characterization were collected monthly between April 1997 and April1998, except for some mid-winter months. Water levels were measured monthly between April 1997 andApril 1998 to determine horizontal (75 cm depth) direction of groundwater flow. Piezometers were evacuatedfollowing water level measurement, allowed to recharge and then sampled the following day using a hand-operated vacuum pump. Channel water was sampled in duplicate in each reach. Samples were transportedfrom the field in ice chests and stored at 2 °C prior to analysis. Concentrations of NO3
� and Cl� were analysedby ion chromatography (Dionex QIC-2), NH4
C by Wescan analyser, and total dissolved nitrogen (TDN; 25and 125 cm depths) by Technicon II autoanalyser following persulphate digestion (Solorzano and Sharp, 1980;Ameel et al., 1993). Dissolved organic nitrogen (DON) was calculated by subtracting the sum of NO3
� andNH4
C (dissolved inorganic nitrogen, DIN) from TDN.
Statistical analysis
Whole-site comparisons used means of all piezometers of a given depth between 1 and 11 m from thestream �n D 9�. Piezometers at the hillslope margin, where alder did not occur, were not included in whole-site comparisons. Water chemistry data were log-transformed because of variance heterogeneity, and subjectedto analysis of variance and t tests to detect site or depth differences by sample date �˛ D 0Ð05� for all months.
Site differences in inorganic nitrogen gradients from the hillslope boundary to the stream were comparedin April 1997 (snowmelt), June 1997 (beginning of growing season), November 1997 (pre-snowpack dormantseason), and January 1998 (winter thaw), using an analysis of response curves approach for repeated measures(Meredith and Stehman, 1991) in space. Dates were selected to correspond to periods of peak nitrogenexport in channel water (McHale et al., 2002), to periods of high nitrogen demand within wetlands, and todormant periods prior to nitrogen inputs from snowpack. The response curves repeated analysis is appropriatedue to the non-randomized piezometer locations within transects, and because nitrogen gradients couldbe represented by linear (B) or quadratic (Q) polynomials. Two coefficients for polynomials of unequallyspaced samples were constructed following Robson (1959): Bij D �11yij1 � 6yij6 � yij11 C 18yij30, andQij D 98Ð3yij1 � 31Ð2yij6 � 110Ð6yij11 C 43Ð5yij30, where i indicates site, j indicates replication (experimentalunit within site) and 1, 6, 11 and 30 represent the distance in metres from the stream. Analysis of B examinesthe site by linear distance interaction and the linear distance main effect, and analysis of Q examines the siteby quadratic distance interaction and the quadratic distance main effect. Mean and cubic polynomials couldbe constructed for orthogonality. However, only linear and quadratic polynomials were used in the analysis,because cubic patterns were not observed, and differences in site means were tested previously. In January,only distances 1, 11, and 30 could be sampled, and coefficients for Q and B were calculated accordingly(Robson, 1959). All statistical analyses were conducted with SAS version 6Ð12 (SAS Institute, 1996).
Estimation of channel water and deep groundwater contributions to shallow groundwater
The influence of channel water on riparian DIN in the beaver-flooded alder wetland was estimated fromthe fractions of channel water and deep groundwater in shallow groundwater, then correlating the channelwater fraction with NO3
� and NH4C concentrations. A two-component mixing model (Sklash and Farvolden,
1979) utilizing Cl� as a hydrologic tracer was used to estimate the percentage channel water in groundwater(Hill and Lymburner, 1998) at 25 and 75 cm depths, where
Channel Water FractionQc
QsgD Csg � Cg
Cc � Cg
and Csg is the Cl� concentration of shallow groundwater, Cg is the Cl� concentration of groundwater at125 cm, and Cc is the Cl� concentration of channel water. Cl� has been used as a conservative tracer to
Copyright 2004 John Wiley & Sons, Ltd. Hydrol. Process. 18, 2681–2697 (2004)

NITROGEN SOLUTE IN RIPARIAN WETLANDS 2685
estimate ground and soil water fractions of streamflow in a similar Adirondack wetland, but such use waslimited by changing concentration in near-stream soils during storms (McHale et al., 2002). This modelassumes only two sources to shallow groundwater (channel water and deep groundwater) and, therefore, islimited under conditions of snowmelt or substantial precipitation. Nevertheless, typical groundwater dischargepatterns in riparian wetlands, visible flow of channel water through the alder wetland, and shallow groundwaterCl� concentrations that exceeded 1–3 µmol l�1 typical of rain or snow (NADP/NTN, 1999) suggest thatthis assumption was generally met. Shallow groundwater at the base of the hillslope was very similar inCl� concentration to 125 cm groundwater, and so was considered to be the same water source. If shallowgroundwater Cl� concentrations were slightly outside the range of end-member concentrations, estimateswere rounded to 0 or 100%. Estimates of percentage channel water were then used with piezometric data tointerpret potential hydrologic effects on nitrogen solutes.
RESULTS
Channel water seasonal patterns in nitrogen concentration
NO3� was consistently greater in the alder reach, with the greatest difference during spring snowmelt in
1997 (Figure 2). Peak NO3� concentrations in 1998 occurred in a January thaw (Figure 2c), with greater
NO3� in the alder reach (Figure 2a). Ammonium concentrations were �5 µmol l�1 throughout the year in
both reaches. Concentrations of DON increased through the growing season in both reaches (Figure 2b).Hence, when DIN concentrations decreased in summer, as much as 60% of TDN was DON.
Groundwater levels and flow
Groundwater levels in the wetland hollows varied between �10 and C7 cm of the surface in the alderwetland and between �15 and C10 cm of the wetland surface in the upstream coniferous wetland betweenMay 1997 and May 1998. The hollows of the alder wetland remained more saturated during the dormantseason, following increased flooding by beaver in summer 1997 (Figure 3a).
Ground elevation in both wetlands decreased approximately 15 cm between hillslope and stream. Althoughwe did not characterize the underlying substrate, approximate horizontal flow patterns were inferred frompiezometric surfaces at 75 cm (Figure 4). A beaver dam at the downstream end of the alder reach resulted invisible loss of channel water to this wetland across seasons, and an elevated water table (Figure 3a).
Seasonal trends in riparian groundwater nitrogen
25 cm depth. NO3� concentrations at 25 cm were 30 µmol l�1 greater in the alder reach during spring
snowmelt in 1997 (Figure 3b). NO3� concentrations remained greatest at this shallow depth in the alder
reach until a melt event in January 1998, and were statistically greater in the alder wetland in May,August, September, and November 1997 (Figure 3b), despite a higher water table (Figure 3a). Ammoniumconcentrations increased in both wetlands at 25 cm following snowmelt of 1997, until falling to low levelsduring the January thaw (Figure 2a). Ammonium concentrations were significantly greater in the referencewetland than in the alder reach in September 1997.
DON in shallow groundwater increased to nearly 100 µmol l�1 from 10 µmol l�1 in the alder stand duringthe growing season, then decreased gradually until after the January melt of 1998 (Figures 3c and 2c). DONcomprised 27% of TDN in May 1997, and 71% in July. This fraction gradually decreased in the alder wetlanduntil the January 1998 thaw, when DON was only 14% of TDN, then it began to increase again until spring(Figure 3c). DON in the reference wetland remained lower, but followed similar seasonal trends (Figure 3c).During the entire sampling period, Cl� concentrations at this depth did not differ (Figure 3c) in the twowetlands.
Copyright 2004 John Wiley & Sons, Ltd. Hydrol. Process. 18, 2681–2697 (2004)

2686 T. M. HURD AND D. J. RAYNAL
Figure 2. Nitrogen and chloride concentrations in channel water of alder and reference reaches. Values are means of duplicate samples:(a) NO3
� and NH4C; (b) DON and chloride; (c) runoff, measured at the adjacent Arbutus Inlet catchment (Mitchell et al., 2001)
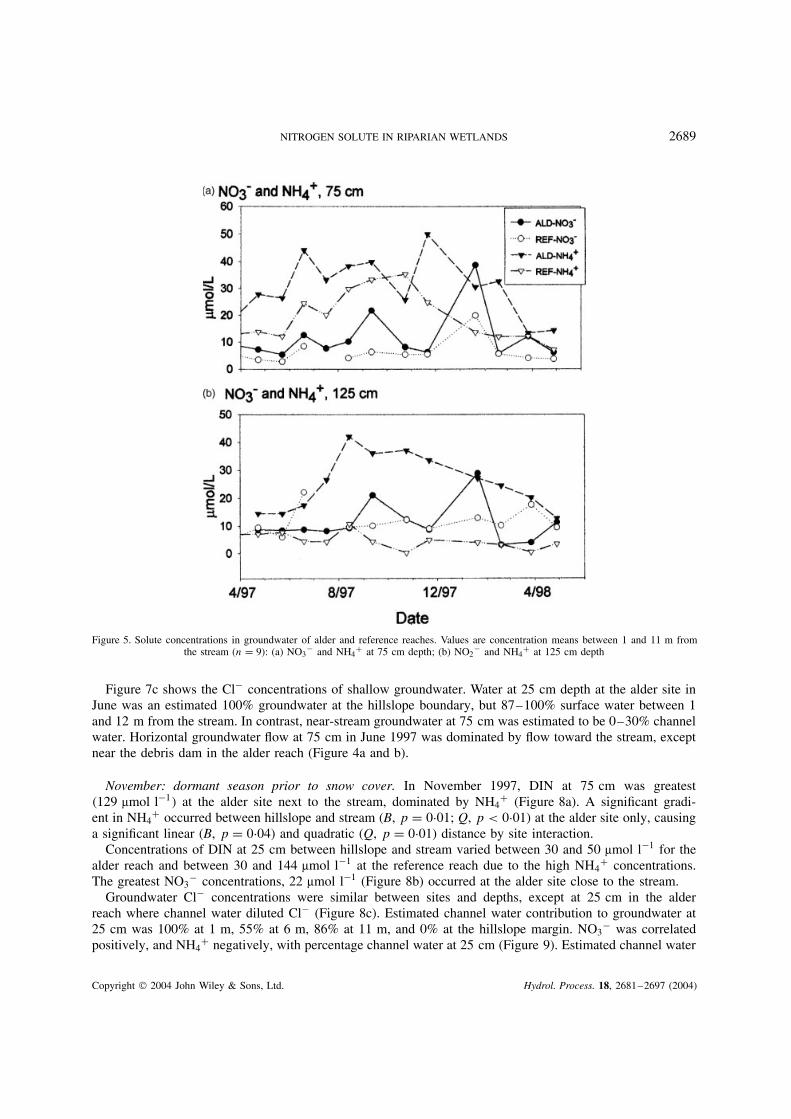
75 cm depth. Significantly greater NO3� concentrations occurred in the alder reach at 75 cm in September
1997, with the highest concentrations observed in both wetlands during the January 1998 snowmelt (Figure 5a).Ammonium was the dominant form of DIN at this depth; it peaked in autumn at both sites, then was depletedfrom or diluted in groundwater through the remainder of the dormant season (Figure 5a).
125 cm depth. NO3� concentrations in shallow till or alluvium of the alder reach were low ��10 µmol l�1�
in April 1997, the period of greatest NO3� concentrations in shallow horizons. Peaks at this depth did occur
in September 1997 and in January 1998 during the early melt (Figure 5b).Ammonium concentration at this depth increased through the growing season in the alder wetland, peaked
in August, then steadily declined through the dormant season (Figure 5b). This did not occur in the reference
Copyright 2004 John Wiley & Sons, Ltd. Hydrol. Process. 18, 2681–2697 (2004)

NITROGEN SOLUTE IN RIPARIAN WETLANDS 2687
Figure 3. Water table depth above ground surface and solute concentrations in groundwater of alder and reference reaches, 25 cm depth.Solute values are concentration means between 1 and 11 m from the stream (n D 9): (a) Water table depth; (b) NH4
C and NO3�; (c) DON
and chloride
wetland, where NH4C remained �10 µmol l�1.
DON at the alder site was significantly less at 125 cm than at 25 cm between June 1997 and April1998, except for November and January, and increased from 14 µmol l�1 in April 1997 (38% of TDN) to38 µmol l�1 (57% of TDN) in July 1997. Concentrations of DON then rapidly decreased as DIN concentrationsincreased in late summer. DON also increased in the reference site, from 11 µmol l�1 (41% of TDN) in April1997 to 27 µmol l�1 (69% of TDN) in August 1997.
Spatial gradients in riparian groundwater nitrogen
April: late snow melt. In April 1997, the greatest DIN concentrations, dominated by NH4C, occurred close
to the stream at 75 cm in the alder site (Figure 6a). DIN at 25 cm did not vary widely across the alder reach,and was dominated by NO3
� (Figure 6a and b).
Copyright 2004 John Wiley & Sons, Ltd. Hydrol. Process. 18, 2681–2697 (2004)

2688 T. M. HURD AND D. J. RAYNAL
Figure 4. Groundwater flow in alder and reference reaches. Elevations of piezometric surfaces are for 75 cm depth piezometers, relative toan arbitrary datum of 3Ð05 m: (a) June 1997, alder; (b) June, 1997, reference; (c) November 1997, alder; (d) November 1997, reference
Estimated channel water contribution to groundwater at 75 cm in the alder site was 21% at 1 m, 40% at6 m, 16% at 11 m, and 0% at the hillslope margin. Groundwater Cl� concentrations did not vary widely bysite or distance from stream at 25 cm (Figure 6c), and suggest source water fractions of 50–76% channelwater in the alder wetland at this shallow depth. Loss of channel water behind the debris dam occurred in thealder reach during this month of high flow.
June 1997: early growing season. In June 1997, no significant differences in nitrogen gradients were detectedbetween sites (B or Q), with DIN showing a general increase between the hillslope and stream. At 25 cm,near-stream DIN at the alder site was dominated by NO3
�, and a significant increase between hillslope andstream occurred for NO3
� at the alder site �p D 0Ð03� and DIN at both sites (alder p D 0Ð02; referencep D 0Ð04) (Figure 7a and b).
Copyright 2004 John Wiley & Sons, Ltd. Hydrol. Process. 18, 2681–2697 (2004)
NITROGEN SOLUTE IN RIPARIAN WETLANDS 2689
Figure 5. Solute concentrations in groundwater of alder and reference reaches. Values are concentration means between 1 and 11 m fromthe stream (n D 9): (a) NO3
� and NH4C at 75 cm depth; (b) NO2
� and NH4C at 125 cm depth
Figure 7c shows the Cl� concentrations of shallow groundwater. Water at 25 cm depth at the alder site inJune was an estimated 100% groundwater at the hillslope boundary, but 87–100% surface water between 1and 12 m from the stream. In contrast, near-stream groundwater at 75 cm was estimated to be 0–30% channelwater. Horizontal groundwater flow at 75 cm in June 1997 was dominated by flow toward the stream, exceptnear the debris dam in the alder reach (Figure 4a and b).
November: dormant season prior to snow cover. In November 1997, DIN at 75 cm was greatest�129 µmol l�1� at the alder site next to the stream, dominated by NH4
C (Figure 8a). A significant gradi-ent in NH4
C occurred between hillslope and stream (B, p D 0Ð01; Q, p < 0Ð01) at the alder site only, causinga significant linear (B, p D 0Ð04) and quadratic (Q, p D 0Ð01) distance by site interaction.
Concentrations of DIN at 25 cm between hillslope and stream varied between 30 and 50 µmol l�1 for thealder reach and between 30 and 144 µmol l�1 at the reference reach due to the high NH4
C concentrations.The greatest NO3
� concentrations, 22 µmol l�1 (Figure 8b) occurred at the alder site close to the stream.Groundwater Cl� concentrations were similar between sites and depths, except at 25 cm in the alder
reach where channel water diluted Cl� (Figure 8c). Estimated channel water contribution to groundwater at25 cm was 100% at 1 m, 55% at 6 m, 86% at 11 m, and 0% at the hillslope margin. NO3
� was correlatedpositively, and NH4
C negatively, with percentage channel water at 25 cm (Figure 9). Estimated channel water
Copyright 2004 John Wiley & Sons, Ltd. Hydrol. Process. 18, 2681–2697 (2004)

2690 T. M. HURD AND D. J. RAYNAL
Figure 6. Spatial patterns of groundwater solutes across alder and reference reaches at 25 and 75 cm depths, April 1997: (a) DON(NO3
� C NH4C); (b) NO3
�; (c) chloride. Values are mean plus/minus standard error
contribution to groundwater at 75 cm was 33% at 1 m, 55% at 6 m, 80% at 11 m and 29% at the base ofthe hillslope. Groundwater flow patterns in the alder reach in November 1997 showed channel water loss toshallow groundwater just upstream of the debris dam, and mixing with discharging and hillslope groundwater10–15 m from the stream (Figure 4c).
January 1998: mid-winter thaw. The greatest concentrations of NO3� in groundwater �60 µmol l�1�
occurred immediately next to the stream in January 1998 at 75 cm, where NO3� and NH4
C were elevatedsimilarly (Figure 10a). A significant quadratic distance by site interaction occurred at 75 cm for NH4
C (Q,p D 0Ð04), and a significant linear distance by site interaction occurred at this depth for DIN (B, p D 0Ð05).Slopes of these gradients differed from zero for NH4
C (Q, p D 0Ð02), DIN (B, p D 0Ð03), and NO3� (B,
p D 0Ð06) at the alder site only.NO3
� and NH4C did not differ between sites at 25 cm (Figure 10b). At the alder site, NO3
� at 25 cm waspositively correlated with percentage channel water �r2 D 0Ð95�, whereas greatest NO3
� and NH4C at 75 cm
occurred close to the stream with 0% channel water.
Copyright 2004 John Wiley & Sons, Ltd. Hydrol. Process. 18, 2681–2697 (2004)

NITROGEN SOLUTE IN RIPARIAN WETLANDS 2691
Figure 7. Spatial patterns of groundwater solutes across alder and reference reaches, June 1997: (a) NO3� and NH4
C at 25 cm depth;(b) DON (NO3
� C NH4C) at 25 and 75 cm depths; (c) chloride at 25 and 75 cm depths. Values are mean plus/minus standard error
Groundwater Cl� concentrations at 25 cm within the alder reach decreased strongly between the hillslopeand stream (Figure 10c). Estimated channel water contribution to groundwater at 75 cm was 0% at 1 m fromthe stream, 14% at 11 m, and 2% at the hillslope margin. Estimated channel water contribution to groundwaterat 25 cm was 100% at 1 m, 37% at 11 m, and 0% at the hillslope margin.
DISCUSSION
Channel water seasonal patterns in nitrogen concentration
NO3� concentration of channel water was consistently elevated in the alder reach (Figure 2a). Site
differences in channel water NO3� were greatest during April 1997, and peak NO3
� concentrations in1998 occurred in a January thaw. Both peaks corresponded with melt-induced discharge (Figure 2), andthus with peak NO3
� exports. Peak NO3� in summer (Figure 2a) occurred at the alder site during the
Copyright 2004 John Wiley & Sons, Ltd. Hydrol. Process. 18, 2681–2697 (2004)

2692 T. M. HURD AND D. J. RAYNAL
Figure 8. Spatial patterns of groundwater solutes across alder and reference reaches, November 1997: (a) NO3� and NH4
C at 75 cm depth;(b) NO3
� at 25 cm depth; (c) chloride at 25 and 75 cm depths. Values are mean plus/minus standard error
onset of an August rain event (33 mm), following peaks in 25 cm groundwater NO3� in June (Figure 3b).
Elevated NO3� in shallow peat of the alder wetland prior to an event-induced increase in channel water
NO3� suggests that nitrification during periods of low water table (Figure 3a) may have contributed to an
NO3� flush in the ensuing event (Creed et al., 1996). Voigt and Steucek (1969) concluded that speckled alder
contributes NO3� to surface water based on a small sample of channel water above (5 µmol l�1) and below
(8 µmol l�1) alders in Connecticut, USA. Goldman (1961) measured greater NO3� in spring water with A.
incana ssp. tenuifolia (5 µmol l�1) than without (0Ð5 µmol l�1), between June and October, at Castle LakeCalifornia, USA. Photosynthetic activity within the lake was also greater on the side of the lake with aldersprings, indicating that alder-fixed nitrogen alleviated nitrogen limitation of aquatic organisms (Goldman,1961). It is possible that till-derived NO3
� contributed to the differences in NO3� in channel water in the
present study, flowing via steep drainage patterns in the watershed and entering the stream between thetwo study reaches. However, we found relatively low NO3
� concentrations in shallow (125 cm) near-streamsubstrate.
Copyright 2004 John Wiley & Sons, Ltd. Hydrol. Process. 18, 2681–2697 (2004)

NITROGEN SOLUTE IN RIPARIAN WETLANDS 2693
Figure 9. Linear relationships between channel water fraction in groundwater and NO3� and NH4
C concentration in groundwater at 25 cmdepth, November 1997
As much as 60% of TDN in channel water during summer was DON; this shows the importance of seasonalnitrogen loss as DON in watersheds that are influenced by nitrogen deposition, as well as in undisturbedwatersheds (Hedin et al., 1995). However, DON concentration did not differ in the two reaches throughoutthe sampling period.
Seasonal trends in groundwater nitrogen
25 cm depth. Elevated NO3� in the alder wetland and similar Cl� concentrations in the two wetlands indicate
that a common source of water was enriched in NO3� in the alder reach. Estimated channel water fractions of
50–76% and the loss of water from the stream in April 1997 suggest that channel water contributed to elevatedNO3
� in shallow peat of the alder wetland. Oxidized channel water could have been a direct NO3� source,
or an O2 source to nitrifying organisms, as soil-derived NO3� may dominate NO3
� leaching in melt eventsin the region (Rascher et al., 1987; Kendall, 1998). Nitrate in the alder reach at 25 cm remained elevatedrelative to the reference after channel water concentrations had decreased and biotic uptake had commenced,suggesting net NO3
� production, concurrent with increasing DON concentrations (Figure 3).Inorganic nitrogen accumulated as NH4
C in the rooting zone of both wetlands during the growing season(Figure 3b). Summer peaks in DON in shallow groundwater were approximately two times greater at 25 cmthan at 125 cm, and preceded or coincided with peak DIN concentrations. These patterns suggest that thisDON was wetland derived and was later transformed to NH4
C or NO3�.
75 cm depth. High NH4C concentrations at 75 cm in both wetlands may have resulted from ammonification
of organic nitrogen through the summer and early autumn, or non-assimilatory reduction of NO3� (Hill, 1996)
advected from the channel. The latter mechanism seems less likely, because NH4C accumulated in the reference
wetland, where hydrologic gradients were directed toward the channel. Minimum NH4C concentrations at
depth occurred in March or April in both years, corresponding to peaks in channel water NO3�. Nitrate at
25 and 75 cm increased during the winter declines in NH4C, suggesting that NH4
C was nitrified and thenflushed from the peat. NO3
� flushing is hypothesized to occur after nitrification is facilitated by a loweredwater table, and NO3
� is flushed into the stream as the water table rises through the unsaturated zone inensuing rain or melt events (Creed et al., 1996; Cirmo and McDonnell, 1997). This mechanism seems likelyfor these systems, because more NO3
� is present during autumn in dense alder stands than in other wetlands(Kiernan et al., 2003), and because the riparian zone floods substantially during winter (Figure 3a).
Copyright 2004 John Wiley & Sons, Ltd. Hydrol. Process. 18, 2681–2697 (2004)

2694 T. M. HURD AND D. J. RAYNAL
Figure 10. Spatial patterns of groundwater solutes across alder and reference reaches, January 1998: (a) NO3� and NH4
C at 75 cm depth;(b) NO3
� and NH4C at 25 cm depth; (c) chloride at 25 and 75 cm depths. Values are mean plus/minus standard error
125 cm depth. NO3� concentrations at 125 cm in the alder stand were �10 µmol l�1 in April 1997, the
period of greatest NO3� concentrations in shallow horizons. These data indicate that groundwater in shallow
mineral substrate was not a source of NO3� during peak NO3
� discharge in April 1997.
Spatial gradients in riparian groundwater nitrogen
In April 1997, DIN dominated by NH4C was elevated close to the stream at 75 cm in the alder reach
(Figure 6a). Both piezometric and Cl� data showed channel water influx to the alder wetland. Whether near-stream nitrogen at 75 cm was derived from channel water or ammonification is uncertain. NO3
� dominatingthe DIN at 25 cm in the alder reach (Figure 6b) may have been derived from the stream, or from nitrificationwithin or above the reach, as channel water contributed strongly to shallow groundwater. It is not likely thatthis NO3
� was directly from meltwater, as low NO3� concentrations occurred in the reference wetland where
melt was still occurring, and Cl� concentrations suggested strong channel water source to shallow soils.In June 1997, water at 25 cm depth at the alder site was an estimated 100% groundwater at the hillslope
boundary, but was 87–100% channel water between 1 and 11 m from the stream. NO3� concentrations
Copyright 2004 John Wiley & Sons, Ltd. Hydrol. Process. 18, 2681–2697 (2004)

NITROGEN SOLUTE IN RIPARIAN WETLANDS 2695
at 25 cm depth 1–11 m from the stream were two or more times that of 125 cm groundwater or channelwater (Figures 2a, 5a, and 7a), suggesting that near-stream nitrification rates were elevated during a periodof low water table (Figure 3a), and that denitrification and biotic uptake were low. Triska et al. (1993)found a low denitrification potential and a high nitrification potential of near-channel sediment slurries,each attributable to high O2 supply from advected channel water. Denitrification potential further from thechannel, where exchange flow was unimportant, was limited by NO3
� (Triska et al., 1993). NO3� limitation
of denitrification also occurred in a permanently saturated A. glutinosa swamp (Westermann and Kiær Ahring1987). Hedin et al. (1998) found denitrification limited by dissolved organic carbon (DOC) in ripariansediments in Michigan, USA. Supply of DOC and associated organic acids in some Adirondack surfacewaters is positively correlated with percentage of watershed as wetland (Driscoll et al., 1998), and so DOCmay not limit wetland denitrification in these systems. Modeled DIN output from the same watersheds isnegatively correlated with % wetland area, implicating broad classes of wetlands as DIN sinks (Driscollet al., 1998). In a broad survey of temperate fens and bogs, alder-dominated fens demonstrated the highestrates of denitrification (Aerts et al., 1999), but denitrification rates and limits are expected to vary in wetlandsof different flooding regimes (Gold et al., 1998).
In November, NO3� at 25 cm increased to 22 µmol l�1 close to the stream at the alder site (Figure 8b).
The positive correlation between NO3� and the percentage channel water (Figure 9), and the hydrologic
flow lines (Figure 4c) suggest that NO3� at this shallow depth was stream derived. However, NH4
C reached129 µmol l�1 at 75 cm next to the stream in the alder reach, and may have been substrate for nitrification at theredoxcline between these two depths (Triska et al., 1989; Cirmo and McDonnell, 1997). Lack of correlationof NH4
C at 75 cm with percentage channel water (r2 D 0Ð23) shows little channel water influence on theelevated NH4
C concentrations.The greatest NO3
� concentrations at 75 cm (60 µmol l�1) occurred in the alder reach within 1 m fromthe stream in January 1998 (Figure 10a). NO3
� concentrations of channel water (Figure 2a) and 125 cmgroundwater (Figure 5b) were less, indicating that the hyporheic zone is a source for NO3
�. This pattern fitsthe conceptual model of Triska et al. (1989), where the interactive hyporheic zone hosts nitrification stimulatedby groundwater-derived NH4
C and stream-derived O2, and demonstrates higher NO3� concentration than either
channel water or groundwater. Moreover, NO3� was not derived from horizontally flowing groundwater at
this depth, because of low DIN further from the stream (Figure 10a). Slopes of NH4C and DIN increased
between hillslope and stream at the alder site only, and percentage channel water at 75 cm was low acrossthe wetland (0–14%), indicating that the alder wetland was a source of DIN to ground and stream water.Mean NO3
� concentrations at 25 cm varied little between sites or with distance from the stream (Figure 10b),indicating a similar meltwater influence on shallow NO3
� in both wetlands.
CONCLUSIONS
Subsurface DIN concentrations were consistently greatest in the alder wetland, close to the stream, andNO3
� concentrations in channel water were greater in the alder reach than in the upstream reference reach,particularly during peaks in stream water discharge and NO3
� concentration. These patterns suggest thatalder shrub wetlands do not decrease nitrogen in groundwater flowing between hillslopes and streams, butmay even increase nitrogen solutes in riparian ground and surface waters. Groundwater in shallow till oralluvium (125 cm) had low NO3
� concentrations relative to shallower groundwater in the alder reach. Theseresults suggest that nitrification is stimulated in shallow peat in the presence of alders and oxidized exchangeflow, and that the NO3
� produced is transported to the channel. Ammonium and DON concentrations increasedthrough the growing season in both wetlands, then decreased through the dormant season, suggesting thatriparian groundwater is an important transient nitrogen pool regardless of cover type. The wetlands in this studywere classified by dominant wetland cover labels in the region, forested conifer (FO4) and alder-dominatedSS1 (Roy et al., 1996), and differed in pattern, and likely in source and processing of nitrogen solutes. To
Copyright 2004 John Wiley & Sons, Ltd. Hydrol. Process. 18, 2681–2697 (2004)
2696 T. M. HURD AND D. J. RAYNAL
understand better the role of riparian wetlands in mediating nitrogen concentrations in streams, future studiesshould examine the specific fate of nitrogen fixed within alder shrub wetlands, as well as of hillslope-derivednitrogen that is discharged into these naturally nitrogen-rich wetlands, prior to entering surface waters.
ACKNOWLEDGEMENTS
This study was supported by New York State Energy Research and Development Authority—EnvironmentalMonitoring Evaluation and Protection (NYSERDA—EMEP). We are grateful to Dr Myron Mitchell, DrShreeram Inamdar, and Pat McHale for providing streamflow data; to Amanda Elliott, Jennifer Masina,Andrew Orgonik, Greg McGee, and David Hurd for assistance in the field and laboratory; to Pat McHale,Linda Galloway, and the biogeochemistry laboratory at SUNY-ESF for assisting with water analysis; and toDr Myron Mitchell, Dr Donald Leopold, Dr Christopher Cirmo, Dr Russell Briggs, and Dr Irena Creed forcomments on a previous version of the manuscript.
REFERENCES
Aerts R, Verhoeven JTA, Whigham, DF. 1999. Plant-mediated controls on nutrient cycling in temperate fens and bogs. Ecology 80:2170–2181.
Ameel JJ, Axler RP, Owen CJ. 1993. Persulfate digestion for determination of total nitrogen and phosphorus in low-nutrient waters. AmericanEnvironmental Laboratory 10/93: 1–11.
Binkley D, Bell R, Sollins P. 1992. Comparison of methods for estimating soil nitrogen transformations in adjacent conifer and alder–coniferforests. Canadian Journal of Forest Research 22: 858–863.
Bischoff JM, Bukaveckas P, Mitchell MJ, Hurd TM. 2001. Nitrogen storage and cycling in a forested wetland: implications for watershednitrogen processing. Water, Air, and Soil Pollution 128: 97–114.
Cirmo CP, McDonnell JJ. 1997. Linking the hydrologic and biogeochemical controls of nitrogen transport in near-stream zones of temperate-forested catchments: a review. Journal of Hydrology 199: 88–120.
Coats RN, Leonard RL, Goldman CR. 1976. Nitrogen uptake and release in a forested watershed, Lake Tahoe basin, California. Ecology57: 995–1004.
Cowardin LM, Carter V, Golet FC, LaRoe ET. 1979. Classification of wetlands and deepwater habitats of the United States . FWS/OBS-79/31.US Fish and Wildlife Service, Washington, DC, USA.
Creed IF, Band LE, Foster NW, Morrison IK, Nicolson JA, Semkin RS, Jefferies DS. 1996. Regulation of nitrate-N release from temperateforests: a test of the N flushing hypothesis. Water Resources Research 32: 3337–3354.
Dahm CN, Valett HM, Morrice JA, Baker MA, Campana ME, Wroblicky GJ. 1994. Ground water/surface water interactions in streamecosystems. EOS Transactions, American Geophysical Union 75: 37.
Daly GT. 1966. Nitrogen fixation by nodulated Alnus rugosa . Canadian Journal of Botany 44: 1607–1621.Driscoll CT, Newton RM, Gubala CP, Baker JP, Christensen S. 1991. Adirondack Mountains. In Acidic Deposition and Aquatic Ecosystems:
Regional Case Studies , Charles DF (ed.). Springer Verlag: New York; 133–202.Driscoll CT, Postek KM, Mateti D, Sequeira K, Aber JD, Kretser WJ, Mitchell MJ, Raynal DJ. 1998. The response of lake water in the
Adirondack region of New York to changes in acidic deposition. Environmental Science and Policy 1: 185–198.Dugdale RC, Dugdale VA. 1961. Sources of phosphorus and nitrogen for lakes on Afognak Island. Limnology and Oceanography 6: 13–23.Furlow JJ. 1979. The systematics of American species of Alnus (Betulaceae). Rhodora 81: 151–248.Gold AJ, Jacinthe PA, Groffman PM, Wright WR, Puffer RH. 1998. Patchiness in groundwater nitrate removal in a riparian forest. Journal
of Environmental Quality 27: 146–155.Goldman CR. 1961. The contribution of alder trees (Alnus tenuifolia) to the primary productivity of Castle Lake, California. Ecology 42:
282–288.Hart SC, Binkley D, Perry DA. 1997. Influence of red alder on soil nitrogen transformations in two conifer forests of contrasting productivity.
Soil Biology and Biochemistry 29: 1111–1123.Hedin LO, Armesto JJ, Johnson AH. 1995. Patterns of nutrient loss from unpolluted, old-growth temperate forests: evaluation of biogeo-
chemical theory. Ecology 76: 493–509.Hedin LO, von Fischer JC, Ostrom NE, Kennedy BP, Brown MG, Robertson GP. 1998. Thermodynamic constraints on nitrogen transfor-
mations and other biogeochemical processes at soil–stream interfaces. Ecology 79: 684–703.Hill AR. 1996. Nitrate removal in stream riparian zones. Journal of Environmental Quality 25: 743–755.Hill AR, Lymburner DJ. 1998. Hyporheic zone chemistry and stream–subsurface exchange in two groundwater-fed streams. Canadian
Journal of Fisheries and Aquatic Sciences 55: 495–506.Hurd TM, Raynal DJ, Schwintzer CR. 2001. Symbiotic N2-fixation of Alnus incana ssp. rugosa in shrub wetlands of the Adirondack
Mountains, New York, U.S.A. Oecologia 126: 94–103.Johnson DW, Lindberg SE (eds). 1992. Atmospheric Deposition and Forest Nutrient Cycling . Springer-Verlag: New York.Kazda M. 1995. Changes in alder fens following a decrease in the ground water table: results of a geographical information system
application. Journal of Applied Ecology 32: 100–110.
Copyright 2004 John Wiley & Sons, Ltd. Hydrol. Process. 18, 2681–2697 (2004)

NITROGEN SOLUTE IN RIPARIAN WETLANDS 2697
Kendall C. 1998. Tracing nitrate sources and cycling. In Isotope Tracers in Catchment Hydrology , Kendall C, McDonnell J (eds). Elsevier:Netherlands; 519–576.
Kierman BD, Hurd TM, Raynal DJ. 2003. Abundance of Aimus incana ssp. rugosa in Adirondack Mountain shrub wetlands and its influenceon inorganic nitrogen. Environmental Pollution 123: 347–354.
Likens GE, Weathers KC, Butler TJ, Buso DC. 1998. Solving the acid rain problem. Science 282: 1991–1992.McHale MR, McDonnell JJ, Mitchell MJ, Cirmo CP. 2002. A field based study of soil- and groundwater nitrate release in an Adirondack
forested watershed. Water Resources Research DOI: 10.1029/2000WR000102.Meredith MP, Stehman SV. 1991. Repeated measures experiments in forestry: focus on analysis of response curves. Canadian Journal of
Forest Research 21: 957–965.Mitchell MJ, Driscoll CT, Porter JH, Raynal DJ, Schaefer D, White EH. 1994. The Adirondack Manipulation and Modeling Project
(AMMP): design and preliminary results. Forest Ecology and Management 68: 87–100.Mitchell MJ, Driscoll CT, Raynal DJ. 1996. Biogeochemistry of a forested watershed in the central Adirondack Mountains: temporal changes
and mass balances. Water, Air, and Soil Pollution 88: 355–369.Mitchell MJ, McHale PJ, Inamdar S, Raynal DJ. 2001. Role of within lake processes and hydrobiogeochemistry changes over 16 years in
a watershed in the Adirondack Mountains of New York State. Hydrological Processes 15: 1951–1965.NAOP/NTN. 1999. National Atmospheric Deposition Program (NRSP-3)/National Trends Network, NADP Program Office, Illinois State
Water Survey, 2204 Griffith Drive, Champaign, IL 61820.Ohrui K, Mitchell MJ, Bischoff JM. 1999. Spatial patterns of N mineralization and nitrification in a forested watershed in the Adirondack
Mountains of New York. Canadian Journal of Forest Research 29: 497–508.Rascher CM, Driscoll CT, Peters NE. 1987. Concentration and flux of solutes from snow and forest floor during snowmelt in the west-central
Adirondack region of New York. Biogeochemistry 3: 209–224.Raynal DJ, Raleigh FS, Mollitor AV. 1985. Atmospheric deposition and ionic movement in Adirondack forests. In Acid Deposition:
Environmental, Economic, and Policy Issues , Adams EE, Page WP (eds). Plenum: New York; 283–302.Robson DS. 1959. A simple method for constructing orthogonal polynomials when the independent variable is unequally spaced. Biometrics
15: 187–191.Roy KM, Curran RP, Barge JW, Spada DM, Bogucki DJ, Allen EB, Kretser WA. 1996. Watershed protection for Adirondack wetlands: a
demonstration-level GIS characterization of subcatchments of the Oswegatchie/Black River watershed . New York State Adirondack ParkAgency, Final Report for State Wetlands Protection Program, US Environmental Protection Agency, Contract No. X-002777-01-0, RayBrook, NY.
SAS Institute. 1996. SAS Procedures Guide. Version 6Ð12. Cary, NC.Shepard JP, Mitchell MJ, Scott TJ, Zhang YM, Raynal DJ. 1989. Measurements of wet and dry deposition in a northern hardwood forest.
Water, Air, and Soil Pollution 48: 225–238.Sklash MG, Farvolden RN. 1979. The role of groundwater in storm runoff. Journal of Hydrology 43: 45–65.Solorzano L, Sharp JH. 1980. Determination of total dissolved nitrogen in natural waters. Limnology and Oceanography 25: 751–754.Somers RC. 1986. Soil classification, genesis, morphology, and variability of soils found within the central Adirondack region of New York .
PhD dissertation, State University of New York College of Environmental Science and Forestry, Syracuse, New York.Stottlemyer R, Travis B, Toczydlowski D. 1995. Nitrogen mineralization in boreal forest stands of Isle Royale, northern Michigan. Water,
Air, and Soil Pollution 82: 191–202.Triska FJ, Duff JH, Avanzino RJ. 1993. Patterns of hydrological exchange and nutrient transformations in the hyporheic zone of a gravel-
bottomed stream: examining terrestrial–aquatic linkages. Freshwater Biology 29: 259–274.Triska FJ, Kennedy VC, Avanzino RJ, Zellweger GW, Bencala KE. 1989. Retention and transport of nutrients in a third-order stream in
northwestern California: hyporheic processes. Ecology 70: 1893–1905.Van Cleve K, Yarie J, Erickson R, Dyrness CT. 1993. Nitrogen mineralization and nitrification in successional ecosystems on the Tanana
River floodplain, interior Alaska. Canadian Journal of Forest Research 23: 970–978.Van Miegroet H, Cole DW. 1984. The impact of nitrification on soil acidification and cation leaching in a red alder ecosystem. Journal of
Environmental Quality 13: 586–590.Van Miegroet H, Cole DW. 1985. Acidification sources in red alder and Douglas-fir soils; importance of nitrification. Soil Science Society
of America Proceedings 33: 946–949.Voigt GK, Steucek GL. 1969. Nitrogen distribution and accretion in an alder ecosystem. Soil Science Society of America Proceedings 33:
946–949.Westermann P, Kiær Ahring B. 1987. Dynamics of methane production, sulfate reduction, and denitrification in a permanently waterlogged
alder swamp. Applied and Environmental Microbiology 53: 2554–2559.Wondzell SM, Swanson FJ. 1996. Seasonal and storm dynamics of the hyporheic zone of a 4th-order mountain stream. II: nitrogen cycling.
Journal of the North American Benthological Society 15: 20–34.
Copyright 2004 John Wiley & Sons, Ltd. Hydrol. Process. 18, 2681–2697 (2004)