Embed Size (px)
Citation preview
inst
itu
te o
f H
ea
lth
Po
licy
& M
an
ag
em
en
t
Comparing the cost-effectiveness of a wide range of COPD interventions using a stochastic, dynamic,population model for COPD
Martine Hoogendoorn, MSc, iBMG/iMTA Maureen Rutten-van Mölken, PhD, iBMG/iMTA Rudolf Hoogenveen, MSc, RIVM Maiwenn Al, PhD, iBMG/iMTA Talitha Feenstra, PhD, RIVM2010.01Health Economics-iMTA
Comparing the cost-effectiveness of a wide range of COPD interventions using a stochastic, dynamic, population model for COPD
Date of publication July 2010 Authors Martine Hoogendoorn¹, MSc Maureen Rutten-van Mölken¹, PhD Rudolf Hoogenveen², MSc Maiwenn Al¹, PhD Talitha Feenstra², PhD ¹ Institute for Medical Technology Assessment, Erasmus University, Rotterdam, The Netherlands ² National Institute of Public Health and the Environment (RIVM), Bilthoven, The Netherlands

2
Correspondence:
National Institute of Public Health and the Environment (RIVM),
Department for prevention and health services research,
Dr. T.L. Feenstra
P.O. Box 1
3720 BA Bilthoven
The Netherlands
Phone: *31 (0)302744387
Fax: * 31 (0) 30 274 4407
Email: [email protected]
This study was financially supported by the Dutch Asthma Foundation, project number:
3.4.06.059
Copyright. All rights reserved. Except for exceptions stated by the law, no part of
this publication may be reproduced in any form without the prior written permission
of iMTA

3
Acknowledgements
We would like to thank Lotte Steuten for providing additional data to estimate the
maintenance costs for COPD. Paul Brekke and Ryan McGhan are thanked for providing
additional data for estimating the case fatality of a COPD exacerbation.

4
5
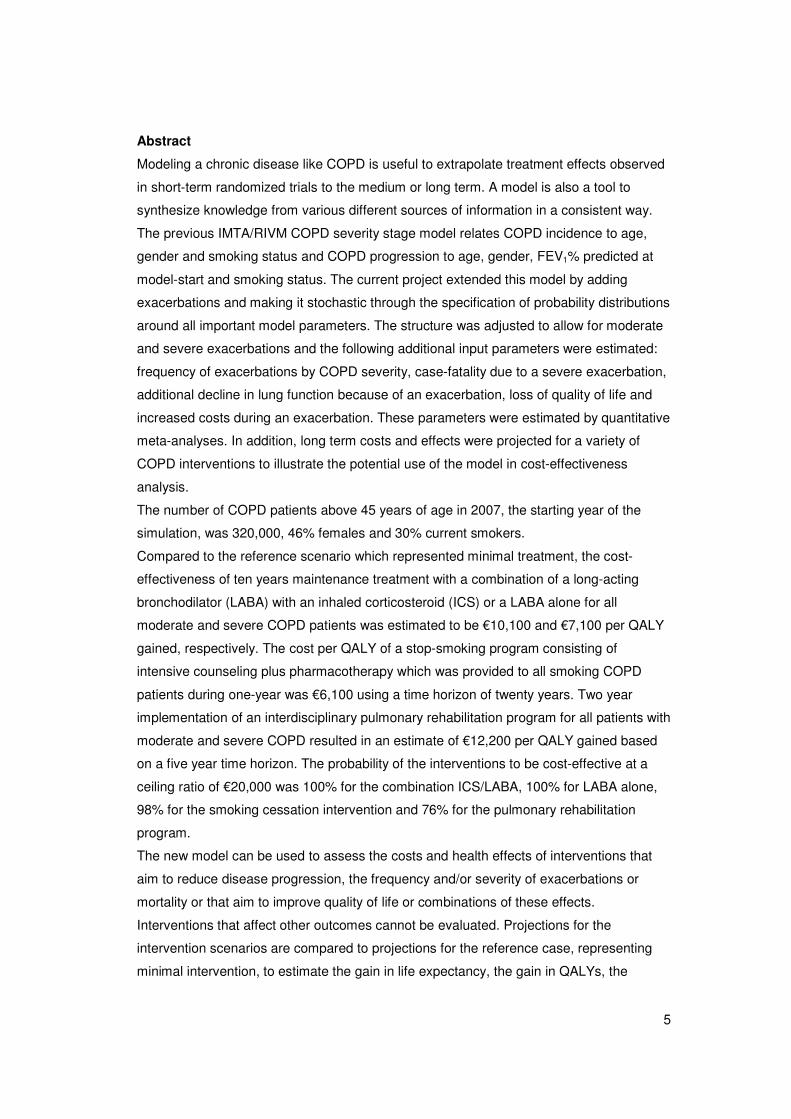
Abstract
Modeling a chronic disease like COPD is useful to extrapolate treatment effects observed
in short-term randomized trials to the medium or long term. A model is also a tool to
synthesize knowledge from various different sources of information in a consistent way.
The previous IMTA/RIVM COPD severity stage model relates COPD incidence to age,
gender and smoking status and COPD progression to age, gender, FEV1% predicted at
model-start and smoking status. The current project extended this model by adding
exacerbations and making it stochastic through the specification of probability distributions
around all important model parameters. The structure was adjusted to allow for moderate
and severe exacerbations and the following additional input parameters were estimated:
frequency of exacerbations by COPD severity, case-fatality due to a severe exacerbation,
additional decline in lung function because of an exacerbation, loss of quality of life and
increased costs during an exacerbation. These parameters were estimated by quantitative
meta-analyses. In addition, long term costs and effects were projected for a variety of
COPD interventions to illustrate the potential use of the model in cost-effectiveness
analysis.
The number of COPD patients above 45 years of age in 2007, the starting year of the
simulation, was 320,000, 46% females and 30% current smokers.
Compared to the reference scenario which represented minimal treatment, the cost-
effectiveness of ten years maintenance treatment with a combination of a long-acting
bronchodilator (LABA) with an inhaled corticosteroid (ICS) or a LABA alone for all
moderate and severe COPD patients was estimated to be €10,100 and €7,100 per QALY
gained, respectively. The cost per QALY of a stop-smoking program consisting of
intensive counseling plus pharmacotherapy which was provided to all smoking COPD
patients during one-year was €6,100 using a time horizon of twenty years. Two year
implementation of an interdisciplinary pulmonary rehabilitation program for all patients with
moderate and severe COPD resulted in an estimate of €12,200 per QALY gained based
on a five year time horizon. The probability of the interventions to be cost-effective at a
ceiling ratio of €20,000 was 100% for the combination ICS/LABA, 100% for LABA alone,
98% for the smoking cessation intervention and 76% for the pulmonary rehabilitation
program.
The new model can be used to assess the costs and health effects of interventions that
aim to reduce disease progression, the frequency and/or severity of exacerbations or
mortality or that aim to improve quality of life or combinations of these effects.
Interventions that affect other outcomes cannot be evaluated. Projections for the
intervention scenarios are compared to projections for the reference case, representing
minimal intervention, to estimate the gain in life expectancy, the gain in QALYs, the
6
number of exacerbations avoided, the difference in intervention costs and the savings in
COPD-related health care cots. The new model presents the uncertainty around the
outcomes using probabilistic sensitivity analysis, which is the current state of the art for
cost effectiveness analyses of interventions.
The extended COPD model now is a tool allowing policy makers to get an overview of
short term and long term costs and effects of interventions over the entire chain, from
primary prevention to care for very severe COPD. Furthermore, being stochastic, the
model enables to estimate the added value of doing additional research for specific
model-parameters in a value of information analysis.
7
Table of contents
1. Introduction................................................................................................................... 9
2. Model and input data for the reference scenario ..........................................................13
2.1 General description of the COPD model ................................................................13
2.2. Exacerbation frequency by GOLD stage ...............................................................15
2.3 Case fatality ...........................................................................................................17
2.4 Exacerbations and lung function decline ................................................................18
2.5 Exacerbations and quality of life.............................................................................20
2.6 Exacerbations and costs ........................................................................................23
2.7 Other parameters that were updated......................................................................24
2.8 Model implementation and internal validation.........................................................25
3. Reference and intervention scenarios ..........................................................................27
3.1 Reference scenario ................................................................................................27
3.2 Scenario one and two: pharmacotherapy...............................................................27
3.3 Scenario three: smoking cessation.........................................................................28
3.4 Scenario four: pulmonary rehabilitation ..................................................................29
4. Sensitivity analyses......................................................................................................31
4.1 One-way sensitivity analyses .................................................................................31
4.2 Probabilistic sensitivity analyses. ...........................................................................34
5. Results.........................................................................................................................39
5.1 Description of the reference scenario of the model.................................................39
5.2 Cost-effectiveness results for the scenario’s ..........................................................40
5.3 Results for the one way sensitivity analysis for the four different scenario’s ...........43
5.4 Results for the probabilistic sensitivity analysis for the four different scenario’s......51
6. Discussion ...................................................................................................................59
7. Conclusions .................................................................................................................63
References ......................................................................................................................65
8
APPENDIX A: Input parameters ......................................................................................71
APPENDIX B: The association between lung function and exacerbation frequency in
patients with COPD (working paper) ................................................................................81
APPENDIX C: Case-fatality of COPD exacerbations: a meta-analysis and statistical
modeling approach (working paper)...............................................................................101
APPENDIX D: Mathematical description of the COPD model with exacerbations ..........119
D1. Introduction..........................................................................................................119
D2. Description of the general model structure. .........................................................119
D3. Mathematical background for specific model elements. .......................................137
D4 Data used to find COPD mortality.........................................................................150
APPENDIX E: Internal validity checks............................................................................155
9
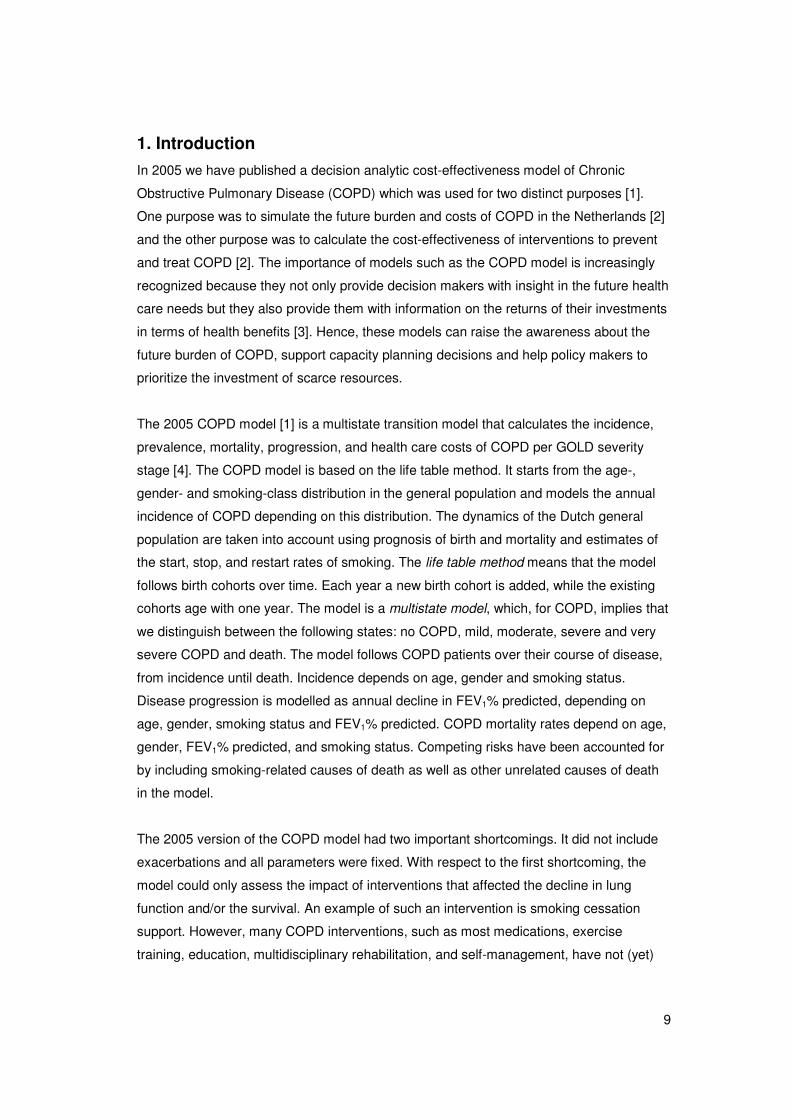
1. Introduction
In 2005 we have published a decision analytic cost-effectiveness model of Chronic
Obstructive Pulmonary Disease (COPD) which was used for two distinct purposes [1].
One purpose was to simulate the future burden and costs of COPD in the Netherlands [2]
and the other purpose was to calculate the cost-effectiveness of interventions to prevent
and treat COPD [2]. The importance of models such as the COPD model is increasingly
recognized because they not only provide decision makers with insight in the future health
care needs but they also provide them with information on the returns of their investments
in terms of health benefits [3]. Hence, these models can raise the awareness about the
future burden of COPD, support capacity planning decisions and help policy makers to
prioritize the investment of scarce resources.
The 2005 COPD model [1] is a multistate transition model that calculates the incidence,
prevalence, mortality, progression, and health care costs of COPD per GOLD severity
stage [4]. The COPD model is based on the life table method. It starts from the age-,
gender- and smoking-class distribution in the general population and models the annual
incidence of COPD depending on this distribution. The dynamics of the Dutch general
population are taken into account using prognosis of birth and mortality and estimates of
the start, stop, and restart rates of smoking. The life table method means that the model
follows birth cohorts over time. Each year a new birth cohort is added, while the existing
cohorts age with one year. The model is a multistate model, which, for COPD, implies that
we distinguish between the following states: no COPD, mild, moderate, severe and very
severe COPD and death. The model follows COPD patients over their course of disease,
from incidence until death. Incidence depends on age, gender and smoking status.
Disease progression is modelled as annual decline in FEV1% predicted, depending on
age, gender, smoking status and FEV1% predicted. COPD mortality rates depend on age,
gender, FEV1% predicted, and smoking status. Competing risks have been accounted for
by including smoking-related causes of death as well as other unrelated causes of death
in the model.
The 2005 version of the COPD model had two important shortcomings. It did not include
exacerbations and all parameters were fixed. With respect to the first shortcoming, the
model could only assess the impact of interventions that affected the decline in lung
function and/or the survival. An example of such an intervention is smoking cessation
support. However, many COPD interventions, such as most medications, exercise
training, education, multidisciplinary rehabilitation, and self-management, have not (yet)
10
been shown to influence COPD progression. These interventions rather reduce the
frequency, severity and/or duration of COPD exacerbations, improve exercise capacity,
symptoms and/or quality of life. With respect to the second shortcoming, a deterministic
model only gives point estimates of the burden and costs of COPD and the cost-
effectiveness of interventions without information about the uncertainty of these estimates.
This uncertainty results from the model input parameters being obtained from sampled
data.
The current project aimed at improving the Dutch COPD model and addressing these two
major shortcomings by including the exacerbations and making the model stochastic.
Adding exacerbations is important because they are common and contribute to poor
health-related quality of life [5-7] and high costs [8-10]. Moreover, there is some evidence
that frequent exacerbations accelerate the progression of the disease [11,12][13]. The
frequency of these exacerbations increases with the severity of COPD [14,15]. In patients
with mild to moderate COPD an exacerbation often requires medical attention by a
general practitioner or specialist. When the severity of COPD increases, exacerbations
may become major life events that require hospital admission. Hospital mortality of
patients admitted for an exacerbation of COPD is high and the long-term outcome is poor
[4]. Hence, these severe exacerbations represent a significant burden on patients as well
as on the healthcare system. This makes it very important to include them in the model.
Taking account of the uncertainty in the input parameters by making the model stochastic
is also important because it enables us to demonstrate the likelihood of certain outcomes
to occur and the likelihood of interventions being cost-effective. Crucial model parameters
were no longer entered as point estimates but as distributions from which values were
randomly drawn. The uncertainty was then quantified using Monte Carlo simulation, where
the model is run a large number of times, and iterations involve random draws from the
distributions of the input parameters. Each iteration results in an estimate of the outcomes
(e.g. prevalence, costs, and health outcomes) and the mean and 95% uncertainty interval
across these iterations represent the expected outcome values and the uncertainty
intervals. This process is referred to as a probabilistic sensitivity analysis, and is currently
regarded as the state of the art in cost-effectiveness analysis [16].
The revised version of the COPD model can be used to evaluate a series of interventions
for COPD that can be applied during various stages of the disease progression. In the
current project this was illustrated by estimating the cost-effectiveness of interventions
that either reduce the decline in lung function, reduce the exacerbation rate, improve the
quality of life, reduce mortality or combinations of these effects. More specifically, the
11
model was used to address how the cost-effectiveness of two pharmaceutical
interventions (i.e. a fixed combination of a long-acting bronchodilator with an inhaled
corticosteroid or a long-acting bronchodilator alone) compares with the cost-effectiveness
of a smoking cessation intervention (i.e. intensive counselling plus pharmaceutical
support) and the cost-effectiveness of pulmonary rehabilitation?
To summarize, this project aimed to:
1. revise the 2005 COPD model by building exacerbations into the model
2. making the model stochastic in order to allow calculating uncertainty
3. to illustrate the potential of the model by calculating the cost-effectiveness of a
number of different COPD interventions.
In chapter two a description of the revised model will be given along with a description of
how the new model input parameters were obtained and existing model parameters were
updated. Chapter three describes the scenario analyses that were done and chapter four
describes the one-way sensitivity analysis and the probabilistic sensitivity analyses. In
chapter five the results of the cost-effectiveness analyses will be presented, including
cost-effectiveness planes and cost-effectiveness acceptability curves. The analyses were
done to illustrate the potential use of the model. Chapter six contains the discussion and
chapter seven the conclusions.

12
13
2. Model and input data for the reference scenario
2.1 General description of the COPD model
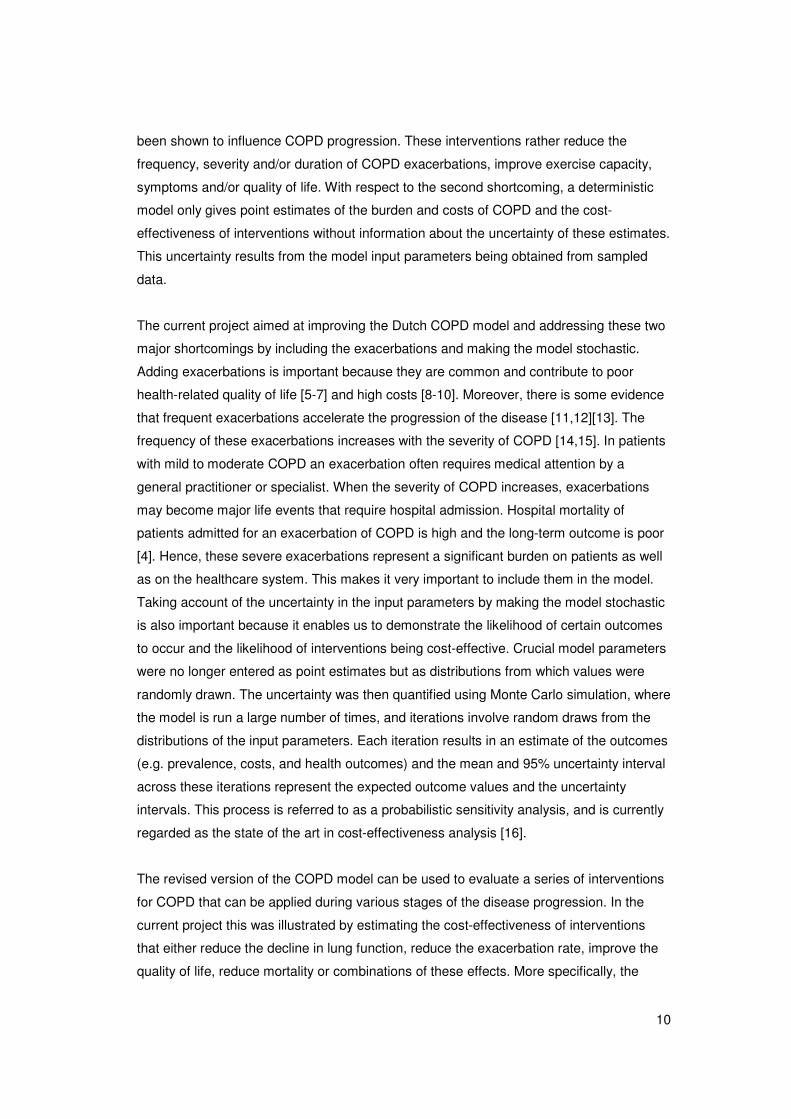
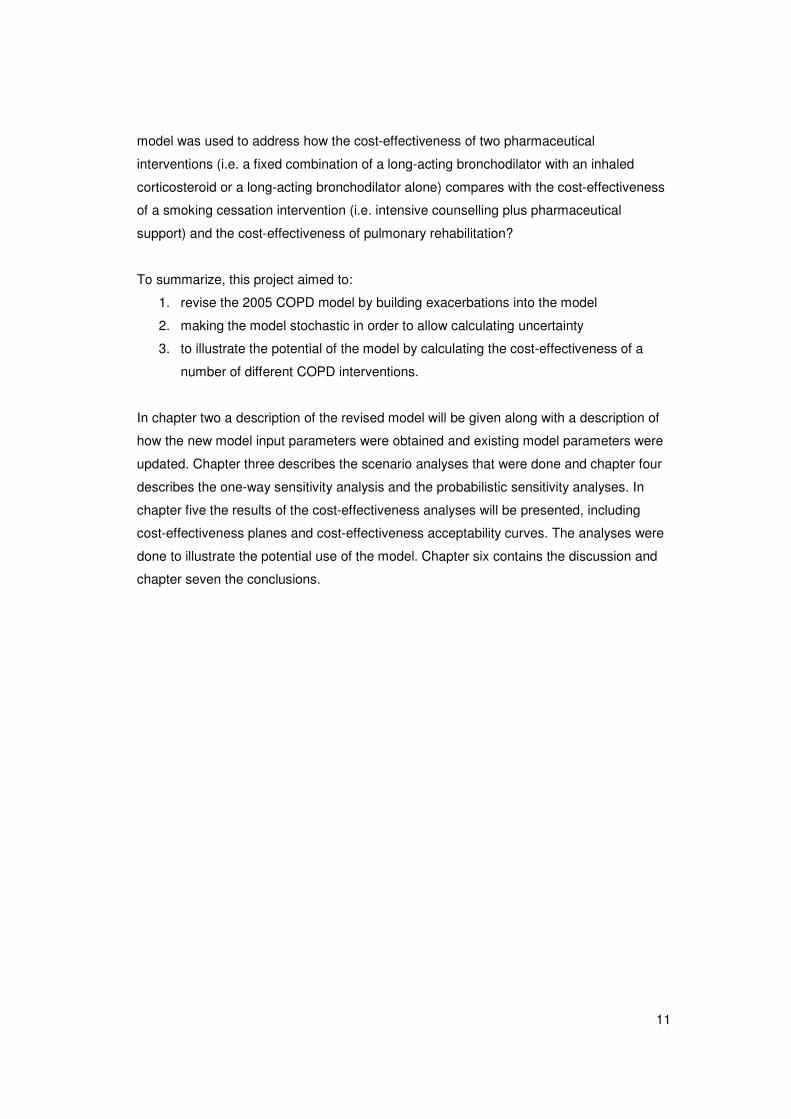
Figure 1 shows the revised version of the Markov model. The length of a Markov cycle is
one year and the future projections start in the year 2007. The time horizon of the
projections can vary between one year and lifetime.
Incidence
Mild COPD
Non-smokers
Smokers
Former smokers
Very severe COPD
Severe COPD
Moderate COPD
General population
(non) severe
exacer-bation
(non) severe
exacer-bation
(non) severe
exacer-bation
(non) severe
exacer-bation
Mortality due to other causes
COPD attributable mortality incl. exacerbation-related mortality
Figure 2.1 Description of the Dutch COPD population model
Starting point of the model simulation is a description of the Dutch general population in
terms of age, gender (Table A.1) and smoking status (smokers, former-smokers and
never-smokers) (Table A.2) and the incidence and prevalence of COPD by gender and
one-year age classes starting at age 45 and ending with age 100 (Table A.3).
The prevalence of COPD in each age and gender class is distributed over the three
smoking classes using the number of smokers in each smoking class and the relative
risks of smokers and former smokers to have COPD [17,18] (Table A.4). It assumed that
the RR of smokers and former smokers to get COPD is equal to the relative risk to have
COPD, which is assumed to be equal to the RR to die of COPD. The prevalence of COPD
in each age, gender and smoking class is further distributed over the four GOLD stages of
14
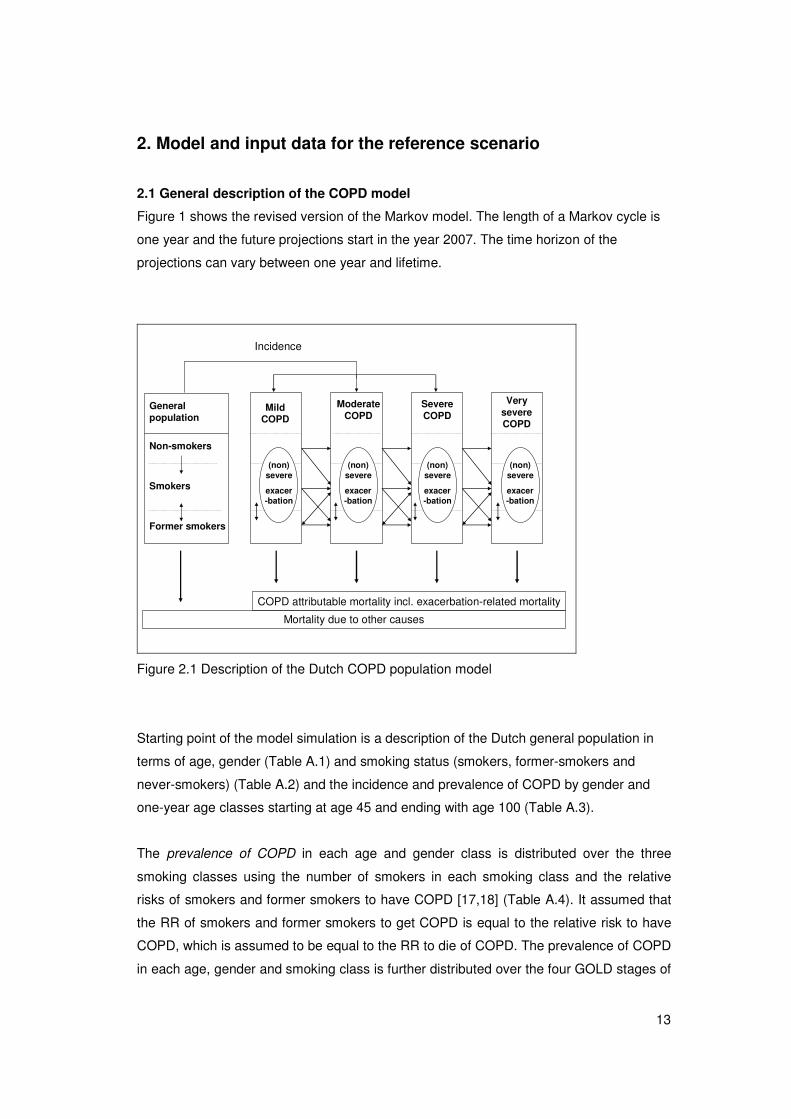
COPD severity using the frequency distribution of FEV1% predicted over all COPD
classes that was obtained from Dutch GP data [19]. Based on a normal distribution with a
mean FEV1% predicted of 68.3% (SD 19.9%) we estimated that 27% has mild COPD,
55% has moderate COPD, 15% has severe COPD and 3% has very severe COPD. The
distribution of the FEV1% predicted within each COPD severity stage is modelled as a
linear function that is obtained from the continuous normal distribution (Appendix D).
Like the prevalence, the incidence of COPD in each age and gender class is distributed
over the three smoking classes using the number of smokers in each smoking class and
the relative risks of smokers and former smokers to have COPD. The frequency
distribution of the FEV1% predicted among the incident cases was estimated by the model
and defined as the distribution that, given disease progression and mortality, would not
change the FEV1% predicted among the prevalent cases in the first year of the model.
Based on this normal distribution with a mean FEV1% predicted of 76.4% (SD 15.6%) it
was estimated that 40% of the newly diagnosed COPD patients has mild COPD, 55% has
moderate COPD, 4% has severe COPD and 0.1% has very severe COPD.
Each year transitions between smoking stages occur. Non-smoking patients can start
smoking, smoking patients can stop smoking and former smoking patients have a certain
probability to restart smoking (Table A5).
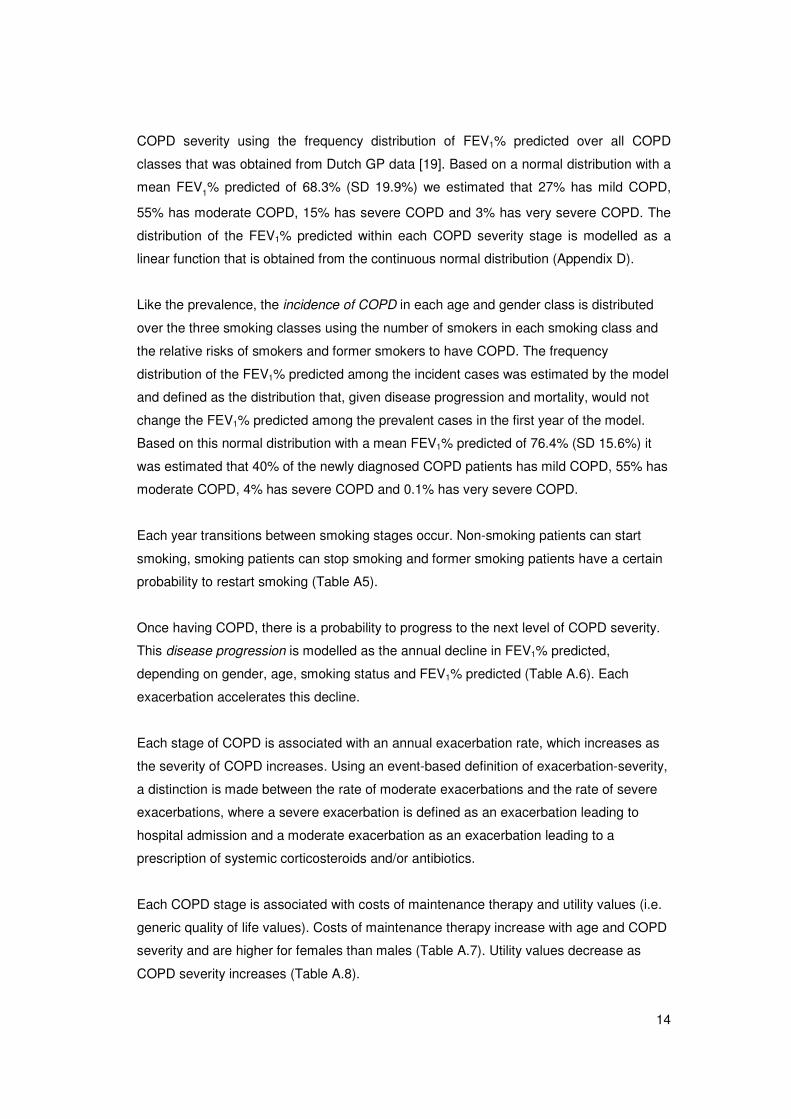
Once having COPD, there is a probability to progress to the next level of COPD severity.
This disease progression is modelled as the annual decline in FEV1% predicted,
depending on gender, age, smoking status and FEV1% predicted (Table A.6). Each
exacerbation accelerates this decline.
Each stage of COPD is associated with an annual exacerbation rate, which increases as
the severity of COPD increases. Using an event-based definition of exacerbation-severity,
a distinction is made between the rate of moderate exacerbations and the rate of severe
exacerbations, where a severe exacerbation is defined as an exacerbation leading to
hospital admission and a moderate exacerbation as an exacerbation leading to a
prescription of systemic corticosteroids and/or antibiotics.
Each COPD stage is associated with costs of maintenance therapy and utility values (i.e.
generic quality of life values). Costs of maintenance therapy increase with age and COPD
severity and are higher for females than males (Table A.7). Utility values decrease as
COPD severity increases (Table A.8).
15
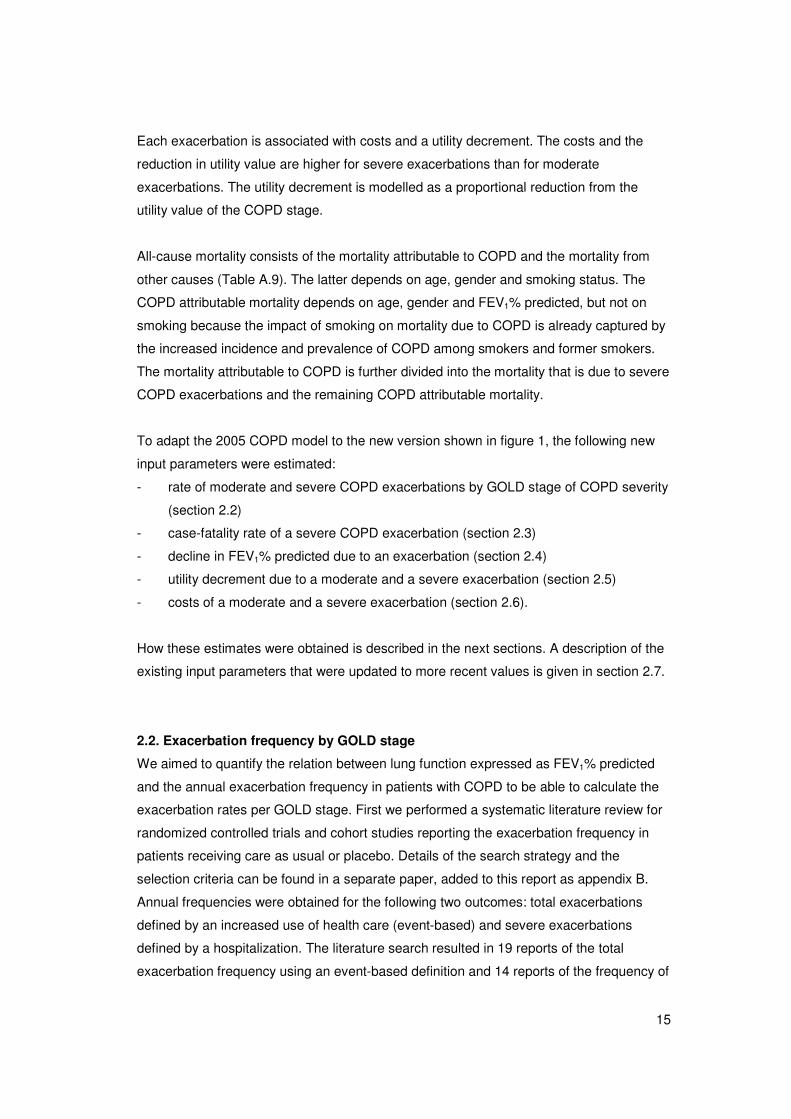
Each exacerbation is associated with costs and a utility decrement. The costs and the
reduction in utility value are higher for severe exacerbations than for moderate
exacerbations. The utility decrement is modelled as a proportional reduction from the
utility value of the COPD stage.
All-cause mortality consists of the mortality attributable to COPD and the mortality from
other causes (Table A.9). The latter depends on age, gender and smoking status. The
COPD attributable mortality depends on age, gender and FEV1% predicted, but not on
smoking because the impact of smoking on mortality due to COPD is already captured by
the increased incidence and prevalence of COPD among smokers and former smokers.
The mortality attributable to COPD is further divided into the mortality that is due to severe
COPD exacerbations and the remaining COPD attributable mortality.
To adapt the 2005 COPD model to the new version shown in figure 1, the following new
input parameters were estimated:
- rate of moderate and severe COPD exacerbations by GOLD stage of COPD severity
(section 2.2)
- case-fatality rate of a severe COPD exacerbation (section 2.3)
- decline in FEV1% predicted due to an exacerbation (section 2.4)
- utility decrement due to a moderate and a severe exacerbation (section 2.5)
- costs of a moderate and a severe exacerbation (section 2.6).
How these estimates were obtained is described in the next sections. A description of the
existing input parameters that were updated to more recent values is given in section 2.7.
2.2. Exacerbation frequency by GOLD stage
We aimed to quantify the relation between lung function expressed as FEV1% predicted
and the annual exacerbation frequency in patients with COPD to be able to calculate the
exacerbation rates per GOLD stage. First we performed a systematic literature review for
randomized controlled trials and cohort studies reporting the exacerbation frequency in
patients receiving care as usual or placebo. Details of the search strategy and the
selection criteria can be found in a separate paper, added to this report as appendix B.
Annual frequencies were obtained for the following two outcomes: total exacerbations
defined by an increased use of health care (event-based) and severe exacerbations
defined by a hospitalization. The literature search resulted in 19 reports of the total
exacerbation frequency using an event-based definition and 14 reports of the frequency of
16
severe exacerbations defined by a hospitalization. The association between the mean
FEV1% predicted of study populations in the selected studies and the annual exacerbation
frequencies was estimated using weighted log linear regression with random effects. The
resulting regression equations for total exacerbations using an event-based definition and
severe exacerbations as reported below were built into the model.
Annual total exacerbation rate (event-based definition):
Rate=0.893*exp[1.181-0.014*FEV1%predicted]
- 0.893 (se=0.093)
- 1.181 (se=0.351)
- -0.014 (se=0.007)
- Covariance between intercept 1.181 and coefficient -0.014 = -0.00227
Annual severe exacerbation rate:
Rate=1.072*exp[-1.043-0.013* FEV1%predicted]
- 1.072 (se=0.154)
- -1.043 (se=0.904)
- -0.013 (se=0.020)
- Covariance between intercept -1.043 and coefficient -0.013 = -0.00176
Each year the mean exacerbation rate per GOLD severity stage was calculated by
applying the mean FEV1% predicted for each GOLD stage at that time to the estimated
equations. In the table below (Table 2.1) the mean exacerbation rates per GOLD stage for
the starting year of the simulation are shown. As a result of changes in the mean
FEV1%predicted per GOLD stage over time the mean exacerbation rate per stage did
change.
Table 2.1: Estimated annual exacerbation frequency per GOLD stage based on the
regression equations for the starting year of the simulation
GOLD stage Mean FEV1%
predicted at
start
Total exacerbations:
event-based
definition
Severe
exacerbations
I, Mild COPD 90 0.82 (0.46-1.49) 0.11 (0.02-0.56)
II, Moderate COPD 65 1.17 (0.93-1.50) 0.16 (0.07-0.33)
III, Severe COPD 42 1.61 (1.51-1.74) 0.22 (0.20-0.23)
IV, Very severe COPD 23 2.10 (1.51-2.94) 0.28 (0.14-0.63)
17
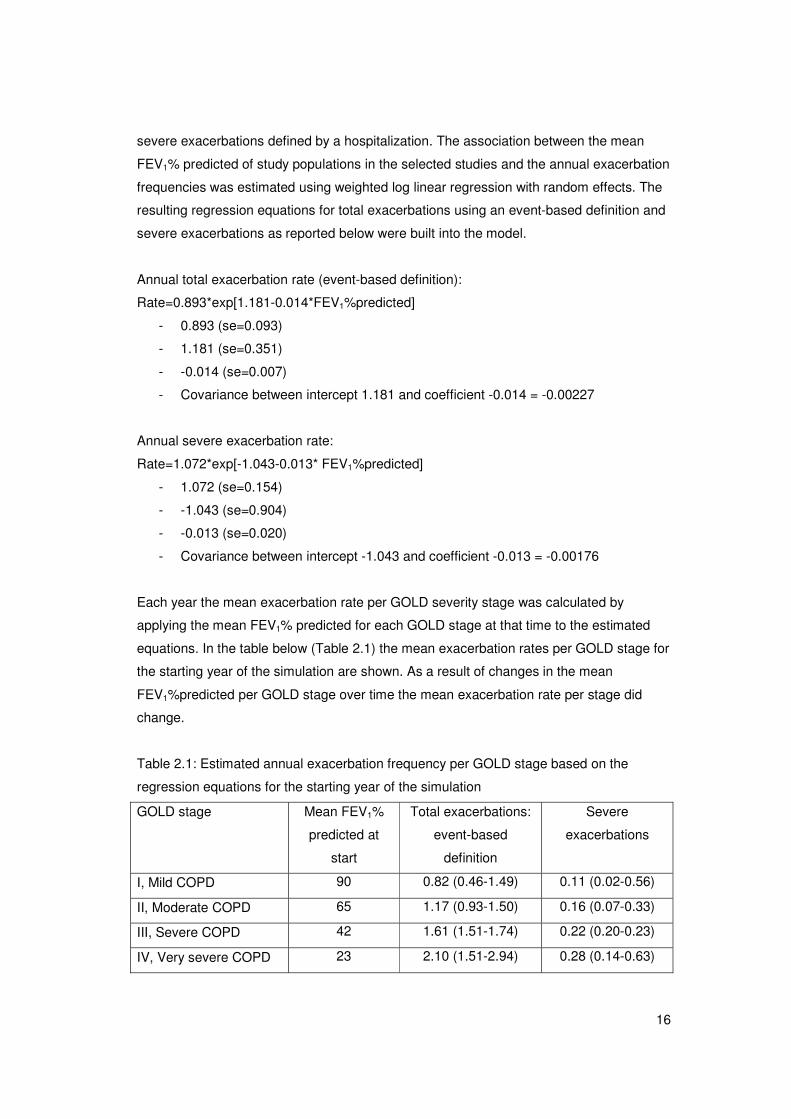
2.3 Case fatality
The methods and results of the estimation of the case fatality of a severe COPD
exacerbation have been reported in detail in a separate manuscript (see Appendix C). A
short summary is given below. We assumed mortality to be increased after a severe
exacerbation for COPD defined as a hospitalization for COPD. We performed a literature
search for studies reporting at least 1.5 year survival after a severe exacerbation resulting
in hospitalization. For each study, we extracted the presented or estimated survival curve
and distinguished between the critical and the stable period after hospital admission with
the survival curve during the stable period being flatter than the one during the critical
period. Mortality during the stable period was then estimated by extrapolating the survival
curve during the stable period back to the time of exacerbation onset (see Figure 2.2).
The case fatality was defined as the additional mortality that results from an exacerbation
and was calculated as 1 minus the (backwardly) extrapolated survival during the stable
period at the time of exacerbation onset. Based on six studies that fulfilled the inclusion
criteria the weighted average case-fatality rate was estimated to be 15.6% (95% CI: 10-
9%-20.3%).
Figure 2.2: Survival curve after hospitalization for an exacerbation of COPD. The dotted
line represents the extrapolated curve during the stable phase (Schematic figure not
based on real data).
18
As age is a significant predictor of mortality [20], we also investigated the association
between age and mortality after a severe exacerbation in the six studies selected for the
calculation of the case fatality. On average the probability to die after a hospitalization for
an exacerbation increased with 4.1% per year increase in age (RR=1.041 95%CI: 1.037-
1.045). With the use of this relative risk we made the case fatality of a COPD exacerbation
in the model dependent on age. We applied the mean case fatality of 15.6% to the mean
age of the COPD population in the papers selected from the literature, i.e. 69 years. For
each year below 69 years, the case fatality decreased with 4.1%, for each year above 69
years, it increased with 4.1%.
2.4 Exacerbations and lung function decline
To estimate the relation between exacerbations and lung function decline we performed a
search in Medline to find papers published after 1990 reporting this association. We used
the following search query:
COPD or “chronic obstructive pulmonary disease” or “chronic bronchitis” in the title
AND
FEV* or lung function in the title
AND
Decline or progression in the title
AND
Exacerbat* or inflammation* or virus* or illness* in the title or abstract
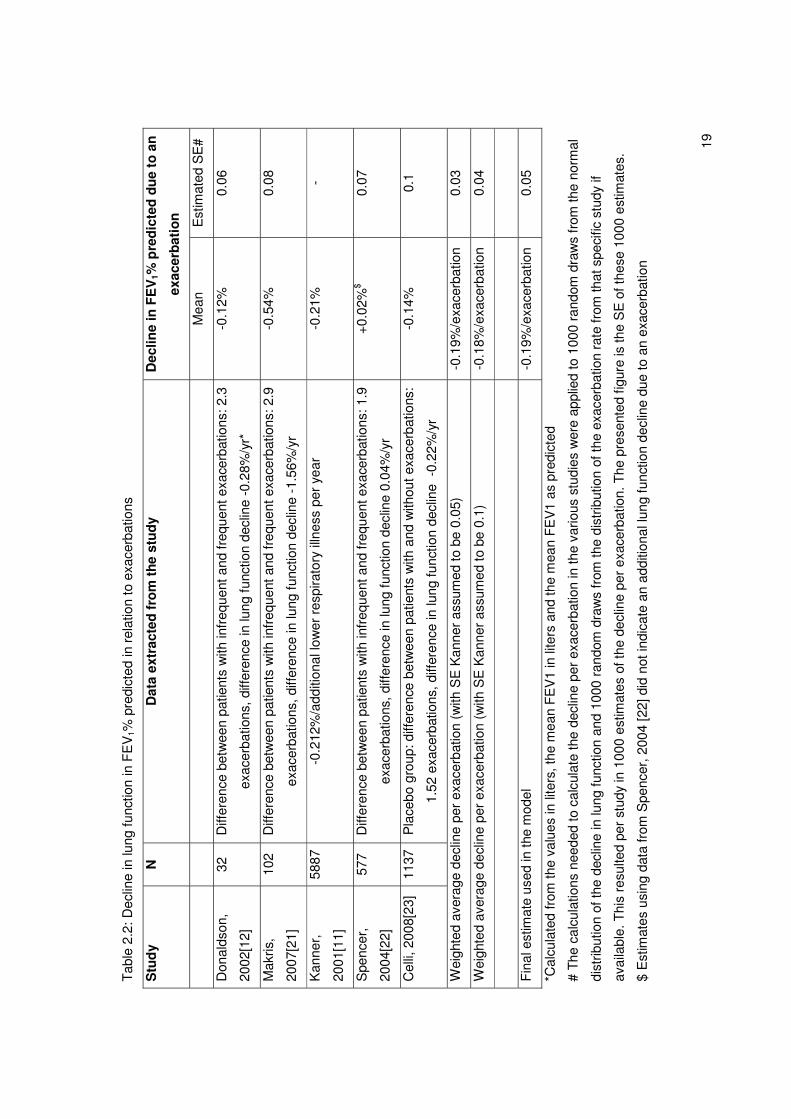
This search resulted in eleven studies of which five reported the relation between
exacerbations and decline in lung function. Results are shown in table 2.2.
The largest study, the study of Kanner et al did not provide information about the
uncertainty around their estimate [11]. If the standard error around the estimate obtained
from Kanner was assumed to be 0.05, which seems reasonable given the standard errors
of the other, though smaller, studies, the final weighted average decline per exacerbation
was estimated to be 0.19% predicted (SE of 0.03). However, due to the large number of
assumptions we needed to make in the calculations we used an SE of 0.05 in the model.
Due to the low number of studies, the weighted average decline per exacerbation could
not be specified for subgroups, such as COPD disease severity.
19
Tab
le 2
.2: D
eclin
e in
lung
func
tion
in F
EV
1% p
redi
cted
in r
elat
ion
to e
xace
rbat
ions
Stu
dy
N
Dat
a ex
trac
ted
fro
m t
he s
tud
y D
eclin
e in
FE
V1%
pre
dic
ted
du
e to
an
exac
erb
atio
n
M
ean
Est
imat
ed S
E#
Don
alds
on,
2002
[12]
32
Diff
eren
ce b
etw
een
patie
nts
with
infr
eque
nt a
nd fr
eque
nt e
xace
rbat
ions
: 2.3
exac
erba
tions
, diff
eren
ce in
lung
func
tion
decl
ine
-0.2
8%/y
r*
-0.1
2%
0.06
Mak
ris,
2007
[21]
102
Diff
eren
ce b
etw
een
patie
nts
with
infr
eque
nt a
nd fr
eque
nt e
xace
rbat
ions
: 2.9
exac
erba
tions
, diff
eren
ce in
lung
func
tion
decl
ine
-1.5
6%/y
r
-0.5
4%
0.08
Kan
ner,
2001
[11]
5887
-0
.212
%/a
dditi
onal
low
er r
espi
rato
ry il
lnes
s pe
r ye
ar
-0.2
1%
-
Spe
ncer
,
2004
[22]
577
Diff
eren
ce b
etw
een
patie
nts
with
infr
eque
nt a
nd fr
eque
nt e
xace
rbat
ions
: 1.9
exac
erba
tions
, diff
eren
ce in
lung
func
tion
decl
ine
0.04
%/y
r
+0.
02%
$ 0.
07
Cel
li, 2
008[
23]
1137
P
lace
bo g
roup
: diff
eren
ce b
etw
een
patie
nts
with
and
with
out e
xace
rbat
ions
:
1.52
exa
cerb
atio
ns, d
iffer
ence
in lu
ng fu
nctio
n de
clin
e -
0.22
%/y
r
-0.1
4%
0.1
Wei
ghte
d av
erag
e de
clin
e pe
r ex
acer
batio
n (w
ith S
E K
anne
r as
sum
ed to
be
0.05
) -0
.19%
/exa
cerb
atio
n 0.
03
Wei
ghte
d av
erag
e de
clin
e pe
r ex
acer
batio
n (w
ith S
E K
anne
r as
sum
ed to
be
0.1)
-0
.18%
/exa
cerb
atio
n 0.
04
Fin
al e
stim
ate
used
in th
e m
odel
-0
.19%
/exa
cerb
atio
n 0.
05
*Cal
cula
ted
from
the
valu
es in
lite
rs, t
he m
ean
FE
V1
in li
ters
and
the
mea
n F
EV
1 as
pre
dict
ed
# T
he c
alcu
latio
ns n
eede
d to
cal
cula
te th
e de
clin
e pe
r ex
acer
batio
n in
the
vario
us s
tudi
es w
ere
appl
ied
to 1
000
rand
om d
raw
s fr
om th
e no
rmal
dist
ribut
ion
of th
e de
clin
e in
lung
func
tion
and
1000
ran
dom
dra
ws
from
the
dist
ribut
ion
of th
e ex
acer
batio
n ra
te fr
om th
at s
peci
fic s
tudy
if
avai
labl
e. T
his
resu
lted
per
stud
y in
100
0 es
timat
es o
f the
dec
line
per
exac
erba
tion.
The
pre
sent
ed fi
gure
is th
e S
E o
f the
se 1
000
estim
ates
.
$ E
stim
ates
usi
ng d
ata
from
Spe
ncer
, 200
4 [2
2] d
id n
ot in
dica
te a
n ad
ditio
nal l
ung
func
tion
decl
ine
due
to a
n ex
acer
batio
n
20
2.5 Exacerbations and quality of life
We did not change the utility values for the different COPD severity stages. These were
kept the same as in the publication of the former version of the model[1], which were
based on EQ-5D and obtained from the study of Borg et al.[24]
Table 2.3: Mean utility scores by COPD severity stage according to GOLD
GOLD stage: Mean utility score
(SD)
Mild COPD 0.8971 (0.1117)
Moderate COPD 0.7551 (0.2747)
Severe COPD 0.7481 (0.2991)
Very severe COPD 0.5493 (0.3129)
To estimate the impact of exacerbations on the number of quality-adjusted life years
(QALYs), data about the relation between exacerbations and utility values, as measured
by generic quality of life instruments, such as the EQ-5D were needed. Therefore we
performed a literature search in Medline for studies published after 1990 using the
following search query:
COPD or “chronic obstructive pulmonary disease” or “chronic bronchitis” in the title
AND
Exacerbation* in the title
AND
“Health status” or “quality of life” in the title/abstract
AND
Utility or EQ-5D in the title/abstract
The search resulted in four studies of which two reported the relation between
exacerbations and quality of life using the EuroQol (EQ-5D), one for severe
exacerbations[10] and one for moderate exacerbations[25].
Severe exacerbations
The study of O’Reilly et al [10] provided data on the utility scores during a hospitalization
for an exacerbation valued with the UK tariff [26]. The EQ-5D was measured both at
admission and at discharge. The mean length of hospitalization was 11 days. We
assumed the utility scores after a severe exacerbation to be reduced for a period equal to
21
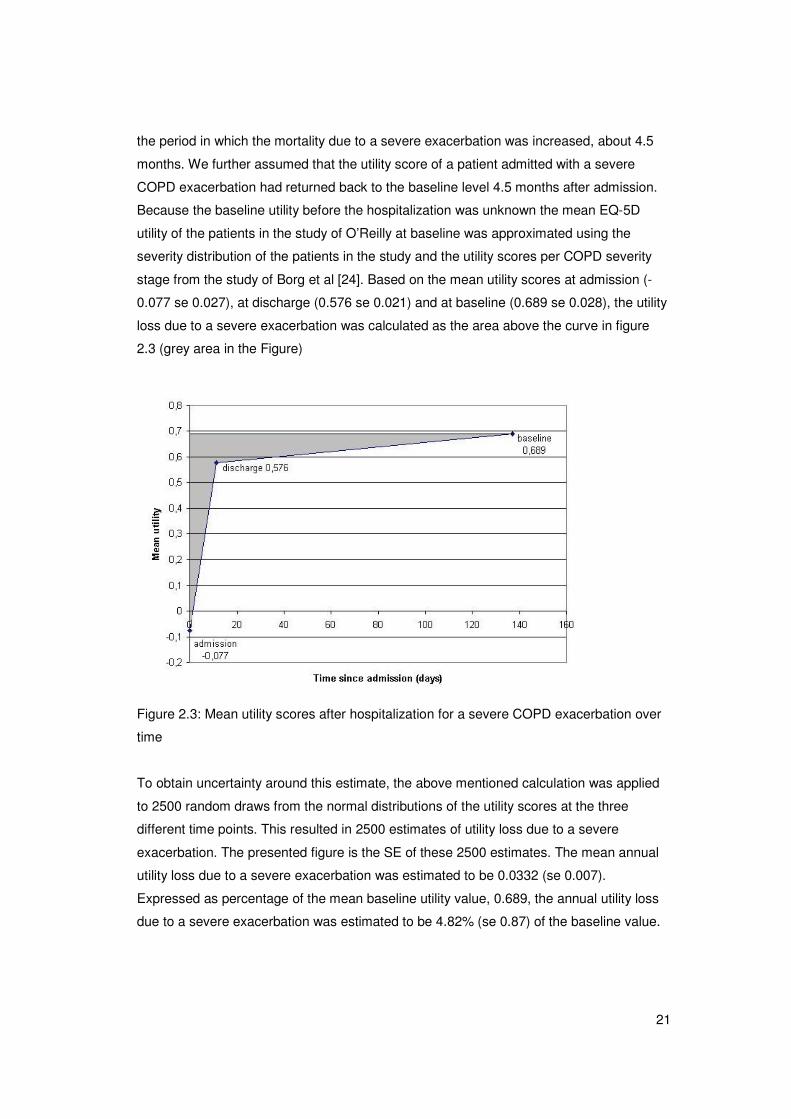
the period in which the mortality due to a severe exacerbation was increased, about 4.5
months. We further assumed that the utility score of a patient admitted with a severe
COPD exacerbation had returned back to the baseline level 4.5 months after admission.
Because the baseline utility before the hospitalization was unknown the mean EQ-5D
utility of the patients in the study of O’Reilly at baseline was approximated using the
severity distribution of the patients in the study and the utility scores per COPD severity
stage from the study of Borg et al [24]. Based on the mean utility scores at admission (-
0.077 se 0.027), at discharge (0.576 se 0.021) and at baseline (0.689 se 0.028), the utility
loss due to a severe exacerbation was calculated as the area above the curve in figure
2.3 (grey area in the Figure)
Figure 2.3: Mean utility scores after hospitalization for a severe COPD exacerbation over
time
To obtain uncertainty around this estimate, the above mentioned calculation was applied
to 2500 random draws from the normal distributions of the utility scores at the three
different time points. This resulted in 2500 estimates of utility loss due to a severe
exacerbation. The presented figure is the SE of these 2500 estimates. The mean annual
utility loss due to a severe exacerbation was estimated to be 0.0332 (se 0.007).
Expressed as percentage of the mean baseline utility value, 0.689, the annual utility loss
due to a severe exacerbation was estimated to be 4.82% (se 0.87) of the baseline value.
22
Moderate exacerbations
The second study found in our literature search, the study of Patterson et al, reported
about the utility scores during a moderate exacerbation. In this study patients with chronic
bronchitis visiting their GP for an acute exacerbation, defined as an increase in symptoms,
were included. The EQ-5D was measured at the first visit and at a follow-up visit one
week after completing treatment. Because it was unclear what the time between the two
measurements was and whether the first measurement was at the start of the
exacerbation and the last measurement was after the exacerbation, this study was less
suitable for our purpose [25].
We also had access to a submitted paper by Goossens et al [27], who measured utility
scores during a moderate exacerbation at four different time points over a period of six
weeks: i.e. within 48 hours after onset of the exacerbation and 7, 14 and 42 days
thereafter. In this study which included 59 patients a moderate exacerbation was defined
as the prescription of antibiotics or systemic steroids but no hospital admission. Utility
scores were based on the EQ-5D and valued using the UK tariff. The number of QALYs
lost due to a moderate exacerbation was estimated to be 0.013 (SE 0.0017). Expressed
as percentage of the mean baseline utility value, 0.783, the annual utility loss due to a
moderate exacerbation was estimated to be 1.66% (SE 0.22) of the baseline value.
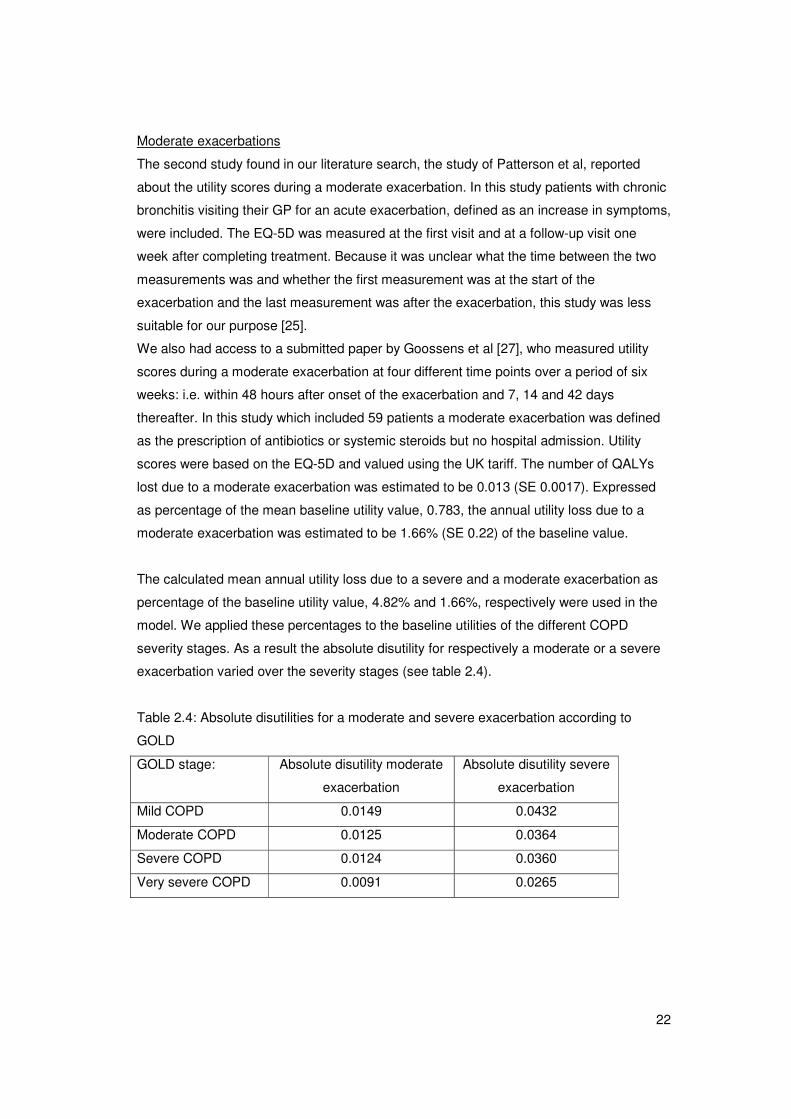
The calculated mean annual utility loss due to a severe and a moderate exacerbation as
percentage of the baseline utility value, 4.82% and 1.66%, respectively were used in the
model. We applied these percentages to the baseline utilities of the different COPD
severity stages. As a result the absolute disutility for respectively a moderate or a severe
exacerbation varied over the severity stages (see table 2.4).
Table 2.4: Absolute disutilities for a moderate and severe exacerbation according to
GOLD
GOLD stage: Absolute disutility moderate
exacerbation
Absolute disutility severe
exacerbation
Mild COPD 0.0149 0.0432
Moderate COPD 0.0125 0.0364
Severe COPD 0.0124 0.0360
Very severe COPD 0.0091 0.0265
23
2.6 Exacerbations and costs
Total direct medical costs for COPD in the Netherlands for the year 2000 specified by age
and gender were obtained from a previous cost of illness study [28]. Based on a
prevalence estimate of 305,000 patients in 2000, the total costs for COPD in 2000 were
estimated to 279.7 million euro. These costs were updated to the year 2007 using
consumer price indices [29]. For the current study the total direct medical costs needed to
be divided in exacerbation-related costs and maintenance costs.
To calculate the total exacerbation-related costs the cost per moderate and severe
exacerbation was calculated using resource use and unit costs for a moderate and severe
exacerbation from Oostenbrink et al [8]. Because that study used different definitions of
exacerbations we slightly modified the cost estimate of a moderate exacerbation as
follows: we used mean resource use as observed during a non-severe exacerbation in the
paper of Oostenbrink, after deleting the inpatient hospital costs. Resource use as
observed during a severe exacerbation was kept unchanged and assumed to reflect the
healthcare use during a severe exacerbation defined as a hospitalization. The final costs
estimates were updated to the year 2007. This resulted in a cost estimate of 94 euro (se
7) for a moderate exacerbation and 4100 euro (se 894) for a severe exacerbation.
Total exacerbation-related costs were calculated as the sum of the costs of moderate and
severe exacerbations in all four severity stage and calculated as follows: � mild-very severe
number of patients per GOLD severity stage * (moderate exacerbation rate * costs
moderate exacerbation + severe exacerbation rate * costs severe exacerbation).
COPD-related maintenance costs were calculated as the total direct medical cost per
gender and age class minus the exacerbation-related costs per gender and age class.
The maintenance costs within each gender and age class were divided over the four
COPD severity stages using ratios for the total COPD costs of a patient with moderate
(1.24), severe (1.39) or very severe COPD (2.06) compared to the costs of a patient with
mild COPD (1.0). The ratio for costs of a moderate patient compared to costs of a mild
patient were obtained from a study of Steuten et al [30]. Ratios of the costs for a severe
patient and a very severe patient compared to a moderate patient were obtained from
Oostenbrink et al [31]. As no data about uncertainty around the maintenance costs were
available, we assumed a standard error of 15% of the mean cost per patient in each
subclass.
Main input parameters used in the model were the gender, age and severity stage-specific
maintenance costs per patient (see Appendix A7) and the costs for a moderate and
severe exacerbation, 94 (se 7) and 4100 (se 894) respectively.
24
2.7 Other parameters that were updated
The incidence, prevalence and mortality input data in our COPD model are linked to the
RIVM Chronic Disease Model (CDM). These input data have been updated in 2009,
adding estimates of standard errors. The new version of the CDM was published in
VTV2010 [32], and includes a description of data sources used. The new values of the
most relevant input data for our COPD model, demography, smoking prevalence, smoking
transition rates and relative risks for smokers and former smokers to develop COPD are
presented in appendix A. Demography data for the year 2007 were obtained from
Statistics Netherlands [29]. Updated information on smoking prevalence and smoking
transition rates were obtained from STIVORO [33,34] Relative risks for smokers and
former smokers to get COPD were based on the same data source as the 2005 model
[17,18].
Appendix A also shows the new incidence, prevalence and attributable mortality for COPD
adapted from VTV-2010 [32]. Prevalence and incidence data in VTV 2010 are based on
five general practice data bases, Continue Morbiditeits Registratie (CMR) Nijmegen,
Landelijk Informatie Netwerk Huisartsenzorg (LINH), Registratienet Huisartsenpraktijken
(RNH), Registratie Netwerk Universitaire Huisartspraktijken Leiden en omstreken (RNUH-
LEO) and Transitieproject. For the Chronic Disease Model and therefore also for our
COPD model, the prevalence and incidence estimates used are based on three data
bases (CMR, RNH, RNUH-LEO), because RNH and Transitieproject were suspected to
overestimate COPD incidence. The data on COPD related mortality are the data used in
the DYNAMO-HIA project, which are originally based on the General Practice Research
Database (GPRD) from the UK (www.gprd.com). More details about the new method used
to calculate COPD-related mortality can be found in Appendix D.
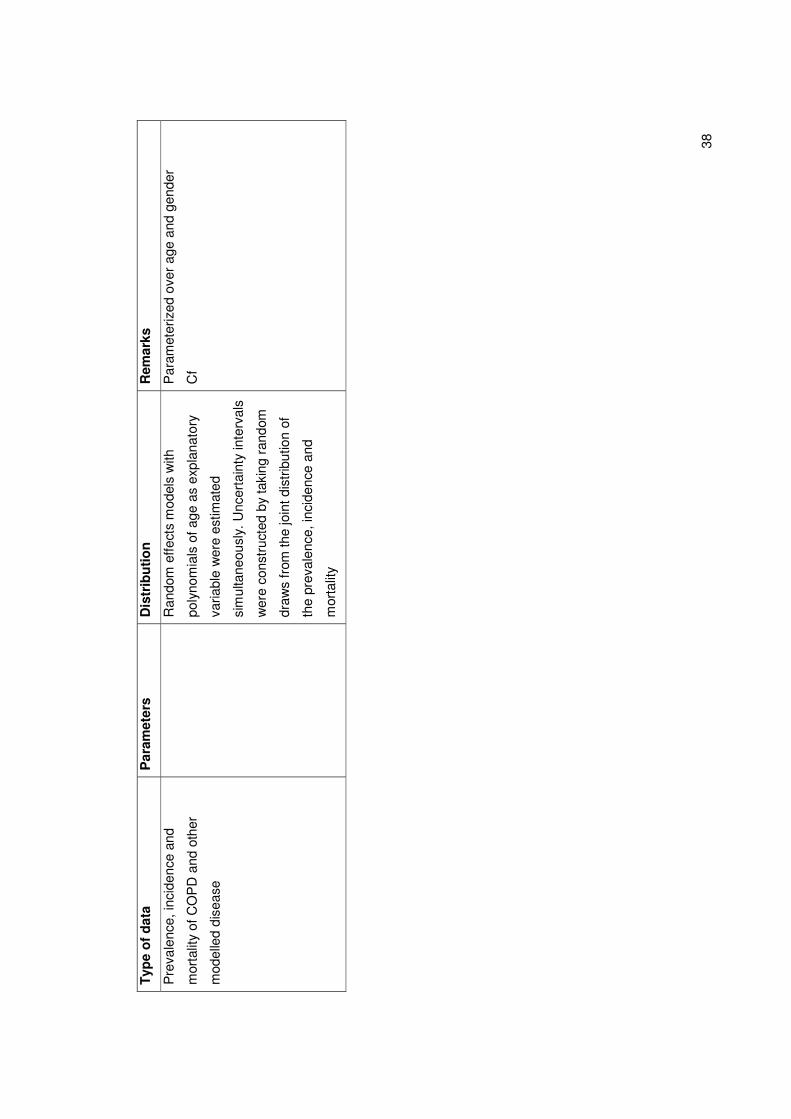
Uncertainty around the estimates of COPD incidence, prevalence and mortality was
estimated using the approach that was used for the RIVM Chronic Disease Model [32],
and based on the observed variation between the different GP registries as well as the
uncertainty within these registries. We varied the three disease parameters jointly to
account for the association between them. First, for incidence and prevalence, random
effects models with polynomials of age as an explanatory variable were simultaneously
estimated. We constructed uncertainty intervals by taking random draws from the joint
distribution of the model parameters. Likewise a model with polynomials of age was
estimated for the estimates of the COPD-related mortality. We again constructed
uncertainty intervals by taking random draws from the joint parameter distribution. For the
PSA, for each model run a random draw of the joint parameter distribution of COPD
incidence and prevalence was taken, that was used to calculate the age-dependent
25
incidence rate and prevalence probability. Likewise, a random draw was taken from the
parameter distribution of the COPD-related mortality rate.
2.8 Model implementation and internal validation
A detailed mathematical description of the model and its implementation in Mathematica
[35] is given in Appendix D. During the development of the model, the internal validity of
the model was secured by performing fifteen different model checks to prevent internal
inconsistencies. The performed model checks, results and possible actions to resolve the
problem are shown in Appendix E.

26
27
3. Reference and intervention scenarios
With the extended model it is possible to estimate the long-term effectiveness and cost-
effectiveness of pharmaceutical and non-pharmaceutical COPD interventions that have an
effect on disease progression, quality of life, mortality and/or the frequency and severity of
exacerbations. Thus consistent and long-term cost-effectiveness outcomes can be
obtained for a range of interventions.
The effect of interventions is modeled by means of multiplicators. These multiplicators are
applied to the parameters that change in an intervention scenario. The intervention
therefore needs to be specified in terms of the relative change in disease progression,
quality of life, all-cause mortality or exacerbation frequency compared to the reference
scenario.
To illustrate the potential use of the model three different types of interventions for COPD
are simulated. All scenario analyses were performed using a cohort of COPD patients,
thus assuming no newborns and no new incidence of COPD.
3.1 Reference scenario
Chapter two described the input parameters for the reference scenario. Because input
parameters are as far as possible based on data sources in which patients received
minimal treatment, the reference scenario in our model represents the COPD population
in the Netherlands receiving minimal intervention. A change in certain model parameters
due to an intervention can be evaluated in so-called scenario analyses. Comparison of
these scenarios with the projections for the reference scenario, gives an estimate of the
impact of the intervention compared to minimal intervention.
3.2 Scenario one and two: pharmacotherapy
The first two scenarios assumed implementation of a combination of a long-acting beta-
agonist and inhaled corticosteroid (ICS/LABA=salmeterol/fluticasone) or implementation of
a long-acting beta-agonist alone (LABA=salmeterol) for all COPD patients in the GOLD
stages moderate and severe COPD. Both pharmacotherapies were assumed to affect
lung function decline, exacerbation frequency and mortality. Data on short-term
effectiveness, i.e. three years, were obtained from the TORCH trial [36]. The relative risks
or the calculated ratio of the effect for lung function decline, exacerbation frequency and
all-cause mortality compared to placebo are shown in table 3.1.
28
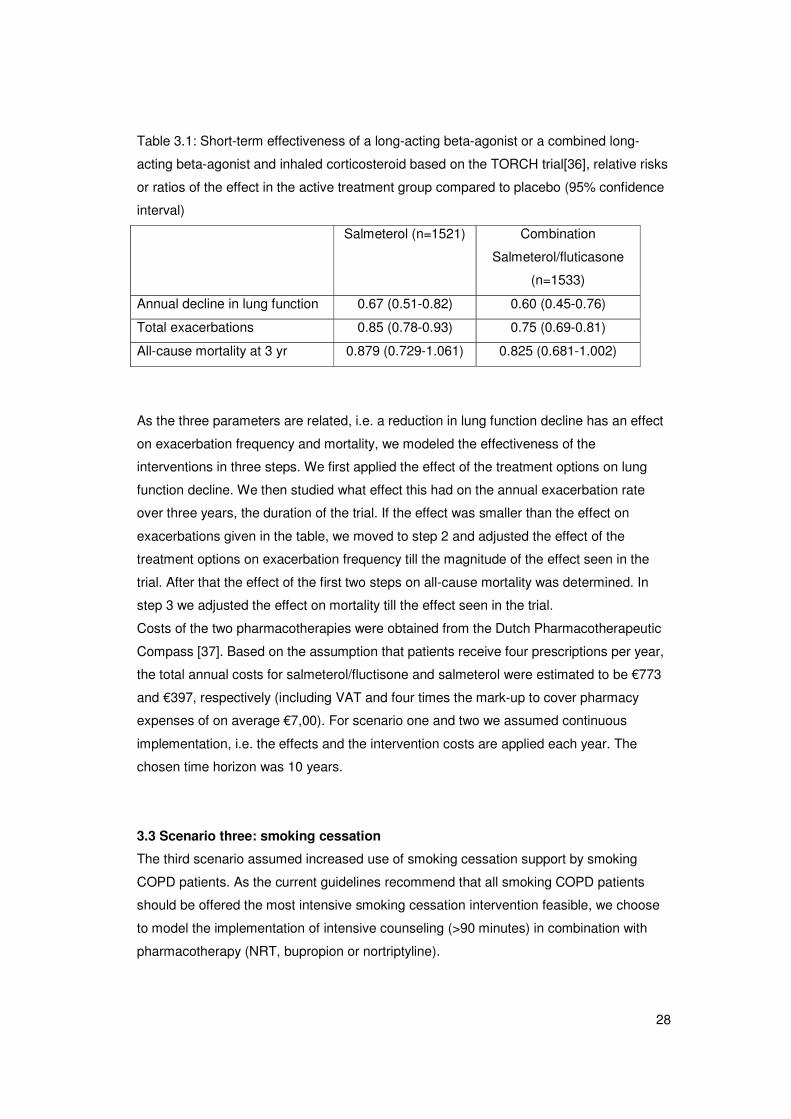
Table 3.1: Short-term effectiveness of a long-acting beta-agonist or a combined long-
acting beta-agonist and inhaled corticosteroid based on the TORCH trial[36], relative risks
or ratios of the effect in the active treatment group compared to placebo (95% confidence
interval)
Salmeterol (n=1521) Combination
Salmeterol/fluticasone
(n=1533)
Annual decline in lung function 0.67 (0.51-0.82) 0.60 (0.45-0.76)
Total exacerbations 0.85 (0.78-0.93) 0.75 (0.69-0.81)
All-cause mortality at 3 yr 0.879 (0.729-1.061) 0.825 (0.681-1.002)
As the three parameters are related, i.e. a reduction in lung function decline has an effect
on exacerbation frequency and mortality, we modeled the effectiveness of the
interventions in three steps. We first applied the effect of the treatment options on lung
function decline. We then studied what effect this had on the annual exacerbation rate
over three years, the duration of the trial. If the effect was smaller than the effect on
exacerbations given in the table, we moved to step 2 and adjusted the effect of the
treatment options on exacerbation frequency till the magnitude of the effect seen in the
trial. After that the effect of the first two steps on all-cause mortality was determined. In
step 3 we adjusted the effect on mortality till the effect seen in the trial.
Costs of the two pharmacotherapies were obtained from the Dutch Pharmacotherapeutic
Compass [37]. Based on the assumption that patients receive four prescriptions per year,
the total annual costs for salmeterol/fluctisone and salmeterol were estimated to be €773
and €397, respectively (including VAT and four times the mark-up to cover pharmacy
expenses of on average €7,00). For scenario one and two we assumed continuous
implementation, i.e. the effects and the intervention costs are applied each year. The
chosen time horizon was 10 years.
3.3 Scenario three: smoking cessation
The third scenario assumed increased use of smoking cessation support by smoking
COPD patients. As the current guidelines recommend that all smoking COPD patients
should be offered the most intensive smoking cessation intervention feasible, we choose
to model the implementation of intensive counseling (>90 minutes) in combination with
pharmacotherapy (NRT, bupropion or nortriptyline).
29
The 12 month continuous abstinence rate for intensive counseling plus pharmacotherapy
was estimated to be 10.9% (95%: 6.9-15.0) higher than the abstinence rate for usual care
[38]. Intervention costs of intensive counseling plus pharmacotherapy were estimated to
be €305 (price level 2007) [38]. The implementation of smoking cessation interventions for
COPD patients was modelled by replacing the smoking cessation rates of usual care with
the higher smoking cessation rates of the intervention for one year, for all smoking COPD
patients. The effects of smoking cessation were modelled as a one-time increase in
FEV1% predicted in the year of smoking cessation followed by a lower annual decline in
FEV1% predicted based on the Lung Health Study (see Table A6 in Appendix A)[39] and
reduced mortality due to COPD and other smoking-related diseases. The effects of one-
year implementation of intensive counselling plus pharmacotherapy were evaluated over a
time horizon of 20 years.
3.4 Scenario four: pulmonary rehabilitation
In scenario four we simulated implementation of a pulmonary rehabilitation program,
which was assumed to affect quality of life. We modeled implementation of a two-year
interdisciplinary community-based pulmonary rehabilitation program for all patients with
moderate and severe COPD. The gain in QALYs for the intervention group over two years
was assumed to be 0.08 (95% CI: -0.01-0.18) based on the INTERCOM trial. Two-year
costs of the program were €1,490 [40]. Effects of the program were assumed to remain
present one year after the intervention period. This means that effects were implemented
for three years, intervention costs for two years. The time horizon for the evaluation of
pulmonary rehabilitation was shorter than for the other scenarios, 5 years.
Results of the model simulations for the four different scenarios were compared to the
reference scenario, representing minimal intervention, to estimate the number of (quality-
adjusted) life years gained, the number of exacerbations avoided, the incremental
intervention costs and the savings in COPD-related health care costs. Health outcomes
were discounted by 1.5%, costs by 4% as recommended by Dutch guidelines [41]. The
cost per quality-adjusted life year gained was calculated as the ratio of total intervention
costs minus savings in COPD-related healthcare costs due to the intervention compared
to the reference scenario divided by the cumulative quality-adjusted life years gained
compared to the reference scenario. The cost per exacerbation avoided was calculated as
the ratio of total intervention costs minus savings in COPD-related healthcare costs
compared to the reference scenario divided by the cumulative exacerbations avoided
compared to the reference scenario representing minimal intervention.

30
31
4. Sensitivity analyses
For all scenario analyses two types of sensitivity analyses were performed. First, one-way
sensitivity analyses were performed for a number of key model assumptions and key
parameter values including the values of parameters for which a probabilistic approach
was not appropriate, for instance the discount rates. If possible, the input parameters
evaluated were varied using the lower and upper limit of their 95% confidence interval.
Second, probabilistic sensitivity analysis was performed for most input parameters
simultaneously, using Monte Carlo simulation and drawing from probability distributions
for each parameter in each simulation to result in confidence intervals around the outcome
parameters. This required building a shell for Monte Carlo simulation around the model.
The probability distributions on input parameters are described in section 4.2. To estimate
the uncertainty around the cost-effectiveness of the scenarios we used 1000 model
simulations in the probabilistic sensitivity analysis.
4.1 One-way sensitivity analyses One-way sensitivity analyses were performed on the following parameters.
a. Change of lung function over time, annual decline in FEV1% predicted.
We investigated the effect of a 50% higher or lower annual decline in FEV1% predicted.
1. 50% lower annual decline in FEV1% predicted
2. 50% higher annual decline in FEV1% predicted
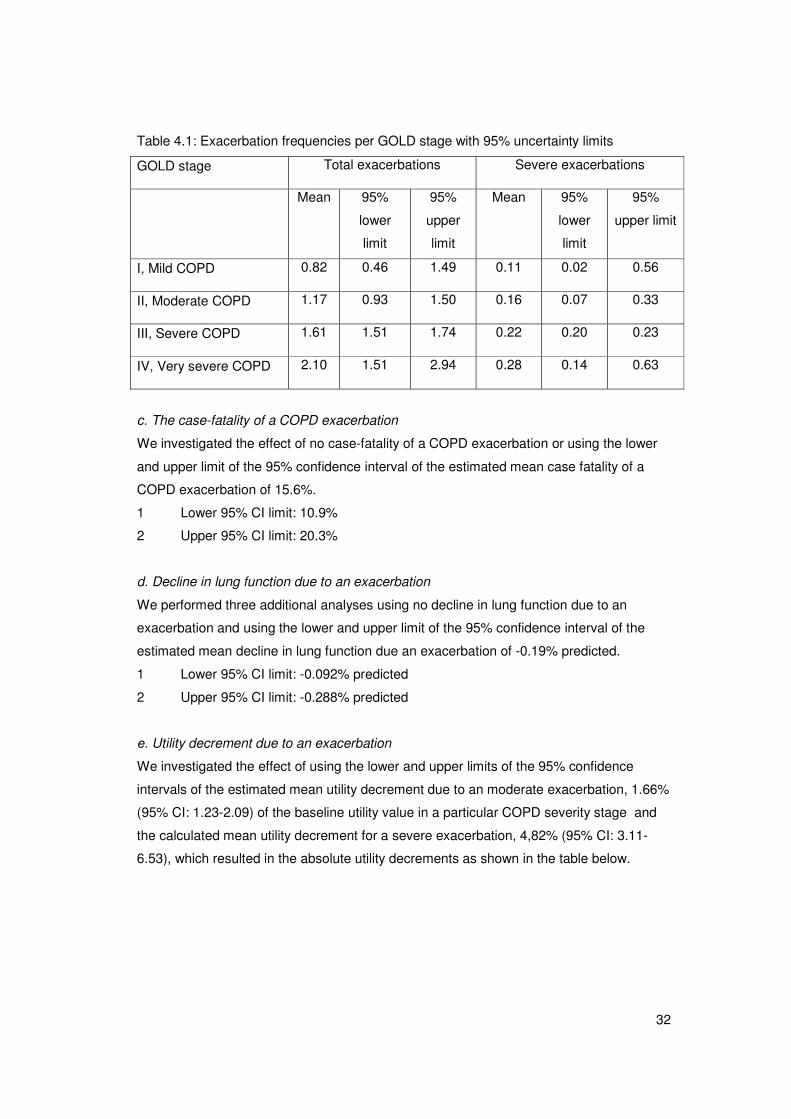
b. The baseline exacerbation frequencies per COPD severity stage
We performed two sensitivity analyses using the lower and upper limit of the 95%
uncertainty interval around the estimated mean exacerbation frequency per GOLD stage.
1. Lower 95% CI limits for each GOLD stage from the table below (or paragraph 2.2)
2. Upper 95% CI limits for each GOLD stage from the table below (or paragraph 2.2)
32
Table 4.1: Exacerbation frequencies per GOLD stage with 95% uncertainty limits
GOLD stage Total exacerbations Severe exacerbations
Mean 95%
lower
limit
95%
upper
limit
Mean 95%
lower
limit
95%
upper limit
I, Mild COPD 0.82 0.46 1.49 0.11 0.02 0.56
II, Moderate COPD 1.17 0.93 1.50 0.16 0.07 0.33
III, Severe COPD 1.61 1.51 1.74 0.22 0.20 0.23
IV, Very severe COPD 2.10 1.51 2.94 0.28 0.14 0.63
c. The case-fatality of a COPD exacerbation
We investigated the effect of no case-fatality of a COPD exacerbation or using the lower
and upper limit of the 95% confidence interval of the estimated mean case fatality of a
COPD exacerbation of 15.6%.
1 Lower 95% CI limit: 10.9%
2 Upper 95% CI limit: 20.3%
d. Decline in lung function due to an exacerbation
We performed three additional analyses using no decline in lung function due to an
exacerbation and using the lower and upper limit of the 95% confidence interval of the
estimated mean decline in lung function due an exacerbation of -0.19% predicted.
1 Lower 95% CI limit: -0.092% predicted
2 Upper 95% CI limit: -0.288% predicted
e. Utility decrement due to an exacerbation
We investigated the effect of using the lower and upper limits of the 95% confidence
intervals of the estimated mean utility decrement due to an moderate exacerbation, 1.66%
(95% CI: 1.23-2.09) of the baseline utility value in a particular COPD severity stage and
the calculated mean utility decrement for a severe exacerbation, 4,82% (95% CI: 3.11-
6.53), which resulted in the absolute utility decrements as shown in the table below.
33
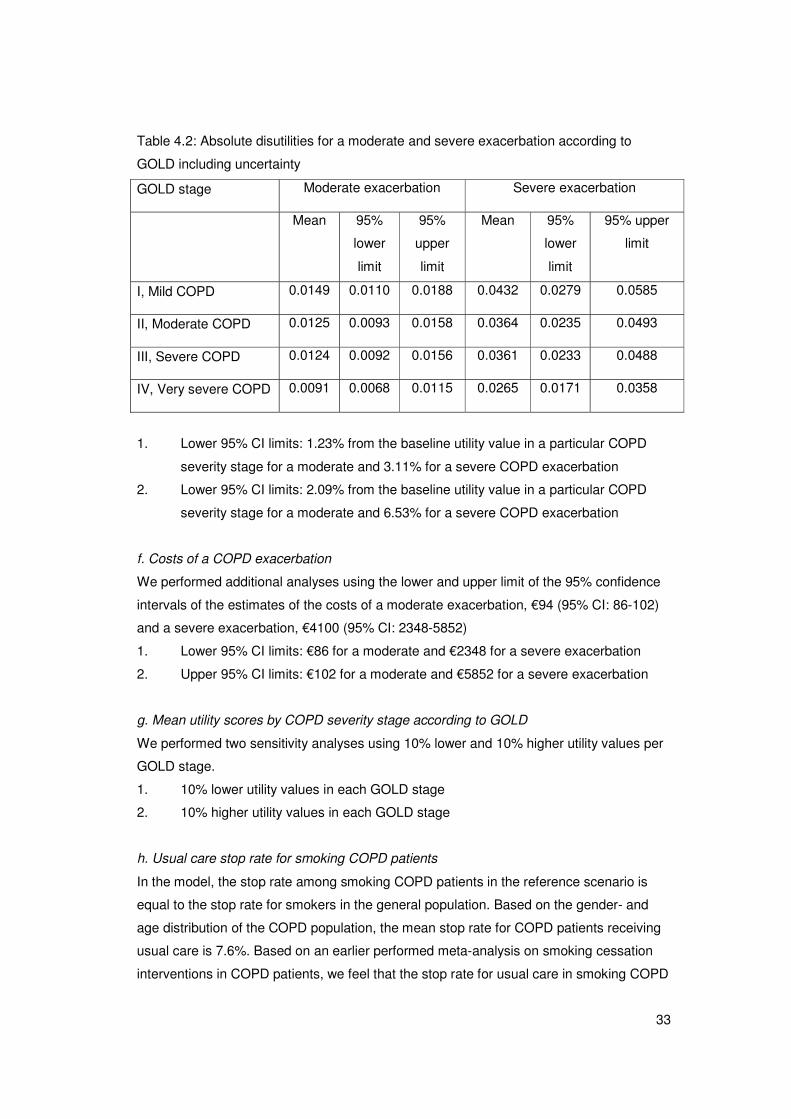
Table 4.2: Absolute disutilities for a moderate and severe exacerbation according to
GOLD including uncertainty
GOLD stage Moderate exacerbation Severe exacerbation
Mean 95%
lower
limit
95%
upper
limit
Mean 95%
lower
limit
95% upper
limit
I, Mild COPD 0.0149 0.0110 0.0188 0.0432 0.0279 0.0585
II, Moderate COPD 0.0125 0.0093 0.0158 0.0364 0.0235 0.0493
III, Severe COPD 0.0124 0.0092 0.0156 0.0361 0.0233 0.0488
IV, Very severe COPD 0.0091 0.0068 0.0115 0.0265 0.0171 0.0358
1. Lower 95% CI limits: 1.23% from the baseline utility value in a particular COPD
severity stage for a moderate and 3.11% for a severe COPD exacerbation
2. Lower 95% CI limits: 2.09% from the baseline utility value in a particular COPD
severity stage for a moderate and 6.53% for a severe COPD exacerbation
f. Costs of a COPD exacerbation
We performed additional analyses using the lower and upper limit of the 95% confidence
intervals of the estimates of the costs of a moderate exacerbation, €94 (95% CI: 86-102)
and a severe exacerbation, €4100 (95% CI: 2348-5852)
1. Lower 95% CI limits: €86 for a moderate and €2348 for a severe exacerbation
2. Upper 95% CI limits: €102 for a moderate and €5852 for a severe exacerbation
g. Mean utility scores by COPD severity stage according to GOLD
We performed two sensitivity analyses using 10% lower and 10% higher utility values per
GOLD stage.
1. 10% lower utility values in each GOLD stage
2. 10% higher utility values in each GOLD stage
h. Usual care stop rate for smoking COPD patients
In the model, the stop rate among smoking COPD patients in the reference scenario is
equal to the stop rate for smokers in the general population. Based on the gender- and
age distribution of the COPD population, the mean stop rate for COPD patients receiving
usual care is 7.6%. Based on an earlier performed meta-analysis on smoking cessation
interventions in COPD patients, we feel that the stop rate for usual care in smoking COPD
34
patients may be lower. However, there are virtually no studies on stop rates in usual care
in the Netherlands. There is one study, the SMOCC study that reported 1.4% [38]. In this
sensitivity analysis we investigated the impact of using the lower stop rate for smoking
COPD patients.
1. Using a usual care stop rate for smoking COPD patients of 1.4%
i. Costs of the intervention
For this sensitivity analysis we investigated the impact of a 10% reduction or increase in
intervention costs.
1. 10% reduction in intervention costs
2. 10% increase in intervention costs
j. Discount rates
We performed additional analyses using different discount rates than in the reference
scenario analyses in which we used 1.5% for effects and 4% for costs, which are the
Dutch standard rates[41].
1. 0% for effects and 0% for costs
2. 4% for effects and 4% for costs
k. Time horizon
The analysis for the reference scenario was performed using a time horizon of ten years
for the scenarios on salmeterol/fluticasone and salmeterol, twenty years for smoking
cessation and five years for pulmonary rehabilitation. We performed additional analyses
using a shorter time horizon or a longer time horizon.
1. Time horizon of 5, 10 or 2 years, respectively
2. Time horizon of 20, 30 or 10 years, respectively
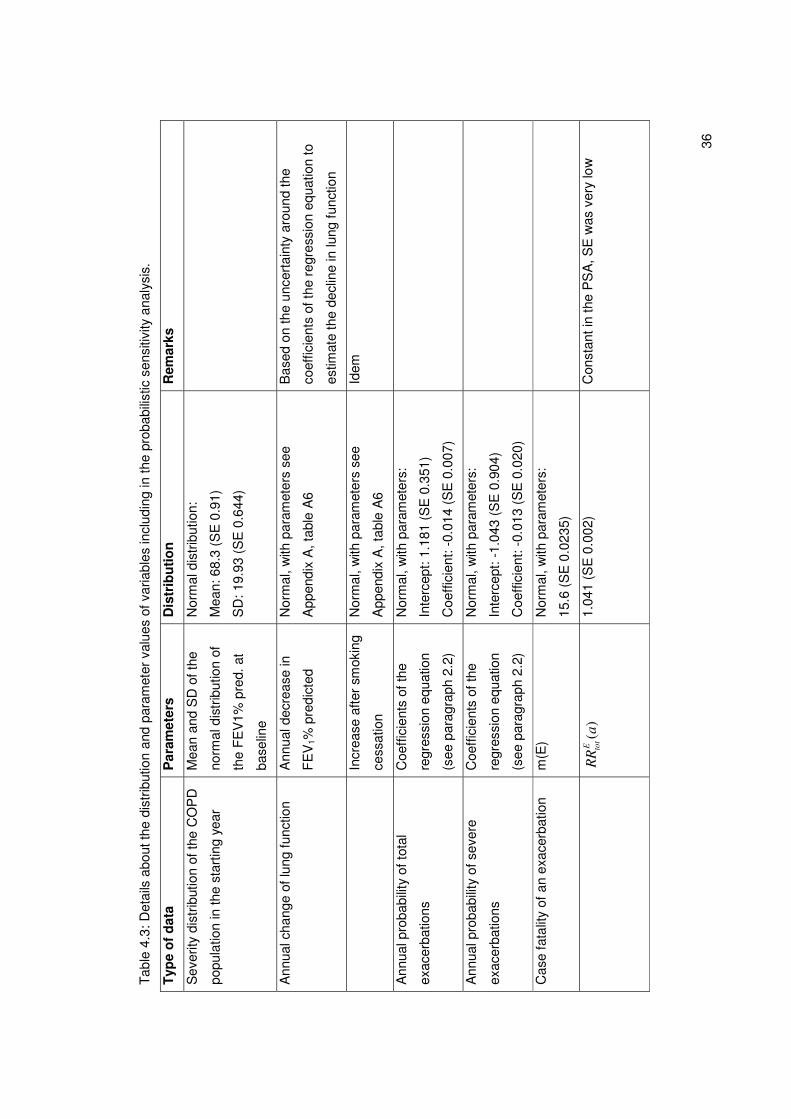
4.2 Probabilistic sensitivity analyses. In order to assess the impact of uncertainty around the different input parameters on the
outcomes, a probabilisitic sensitivity analysis (PSA) was performed. A probabilistic
sensitivity analysis considers the uncertainty around the input parameters simultaneously
by using pre-specified distributions for these parameters instead of point estimates. Table
4.3 lists all model parameters that were varied in the probabilistic sensitivity analyses, as
well as the variances used for this parameter. All parameters were assumed to be
Normally distributed. The uncertainty around the probabilistic input parameters is
propagated through the model simultaneously by conducting second-order Monte Carlo

35
simulations. This means that for the uncertain parameters random draws are made from
their probability distribution. The model is run for each set of parameters that is drawn and
the outputs from each run are collected. The current analyses were based on 1000
iterations. The results of all iterations are plotted on a cost-effectiveness plane (CE-plane)
to display the uncertainty around costs and effects. The information in the CE-plane is
summarized in a cost-effectiveness acceptability curve (CEAC), which shows the
probability that an intervention has a cost-effectiveness ratio below various threshold
values of the willingness to pay for a quality-adjusted life year gained.
36
Tab
le 4
.3: D
etai
ls a
bout
the
dist
ribut
ion
and
para
met
er v
alue
s of
var
iabl
es in
clud
ing
in th
e pr
obab
ilist
ic s
ensi
tivity
ana
lysi
s.
Typ
e o
f d
ata
Par
amet
ers
Dis
trib
uti
on
R
emar
ks
Sev
erity
dis
trib
utio
n of
the
CO
PD
popu
latio
n in
the
star
ting
year
Mea
n an
d S
D o
f the
norm
al d
istr
ibut
ion
of
the
FE
V1%
pre
d. a
t
base
line
Nor
mal
dis
trib
utio
n:
Mea
n: 6
8.3
(SE
0.9
1)
SD
: 19.
93 (
SE
0.6
44)
Ann
ual c
hang
e of
lung
func
tion
A
nnua
l dec
reas
e in
FE
V1%
pre
dict
ed
Nor
mal
, with
par
amet
ers
see
App
endi
x A
, tab
le A
6
Bas
ed o
n th
e un
cert
aint
y ar
ound
the
coef
ficie
nts
of th
e re
gres
sion
equ
atio
n to
estim
ate
the
decl
ine
in lu
ng fu
nctio
n
In
crea
se a
fter
smok
ing
cess
atio
n
Nor
mal
, with
par
amet
ers
see
App
endi
x A
, tab
le A
6
Idem
Ann
ual p
roba
bilit
y of
tota
l
exac
erba
tions
Coe
ffici
ents
of t
he
regr
essi
on e
quat
ion
(see
par
agra
ph 2
.2)
Nor
mal
, with
par
amet
ers:
Inte
rcep
t: 1.
181
(SE
0.3
51)
Coe
ffici
ent:
-0.0
14 (
SE
0.0
07)
Ann
ual p
roba
bilit
y of
sev
ere
exac
erba
tions
Coe
ffici
ents
of t
he
regr
essi
on e
quat
ion
(see
par
agra
ph 2
.2)
Nor
mal
, with
par
amet
ers:
Inte
rcep
t: -1
.043
(S
E 0
.904
)
Coe
ffici
ent:
-0.0
13 (
SE
0.0
20)
Cas
e fa
talit
y of
an
exac
erba
tion
m
(E)
Nor
mal
, with
par
amet
ers:
15.6
(S
E 0
.023
5)
)
(aR
RE to
t
1.04
1 (S
E 0
.002
) C
onst
ant i
n th
e P
SA
, SE
was
ver
y lo
w

37
Typ
e o
f d
ata
Par
amet
ers
Dis
trib
uti
on
R
emar
ks
QA
LY-w
eigh
ts fo
r 4
CO
PD
seve
rity
clas
ses
N
orm
al, w
ith p
aram
eter
s:
Mild
: 0.8
971
(se
0.01
94)
Mod
erat
e: 0
.755
1 (S
E 0
.030
9)
Sev
ere:
0.7
481
(SE
0.0
352)
Ver
y S
ever
e: 0
.549
3 (S
E 0
.059
1)
Mon
oton
icity
was
enf
orce
d:
QA
LY_s
ever
ity s
tage
> Q
ALY
_sev
erity
stag
e+1
QA
LY lo
ss a
s a
resu
lt of
an
exac
erba
tion
Mod
erat
e ex
acer
batio
n N
orm
al, w
ith p
aram
eter
s:
0.01
66 (
SE
0.0
022)
S
ever
e ex
acer
batio
n N
orm
al, w
ith p
aram
eter
s:
0.04
82 (
SE
0.0
087)
Effe
ct o
f lun
g fu
nctio
n on
mor
talit
y
RR
FE
Vto
t Lo
garit
hm o
f RR
FE
Vto
t is
norm
al
dist
ribut
ed, w
ith p
aram
eter
s
0.01
82 (
SE
0.0
015)
/ %
dec
line
Effe
ct e
xace
rbat
ions
on
lung
func
tion
decl
ine.
N
orm
al, w
ith p
aram
eter
s:
0.19
(S
E 0
.05)
CO
PD
-rel
ated
hea
lthca
re c
osts
M
aint
enan
ce c
osts
Nor
mal
, with
par
amet
ers:
(zi
e
appe
ndix
B (
SE
15%
of m
ean
valu
e)
Mon
oton
icity
was
enf
orce
d:
Cos
ts_s
ever
ity s
tage
< C
osts
_sev
erity
stag
e+1
C
osts
of e
xace
rbat
ions
N
orm
al, w
ith p
aram
eter
s:
Mod
erat
e ex
ac: 9
4 (S
E 7
)
Sev
ere
exac
erba
tion:
410
0 (S
E 8
94)
38
Typ
e o
f d
ata
Par
amet
ers
Dis
trib
uti
on
R
emar
ks
Pre
vale
nce,
inci
denc
e an
d
mor
talit
y of
CO
PD
and
oth
er
mod
elle
d di
seas
e
R
ando
m e
ffect
s m
odel
s w
ith
poly
nom
ials
of a
ge a
s ex
plan
ator
y
varia
ble
wer
e es
timat
ed
sim
ulta
neou
sly.
Unc
erta
inty
inte
rval
s
wer
e co
nstr
ucte
d by
taki
ng r
ando
m
draw
s fr
om th
e jo
int d
istr
ibut
ion
of
the
prev
alen
ce, i
ncid
ence
and
mor
talit
y
Par
amet
eriz
ed o
ver
age
and
gend
er
Cf
39
5. Results
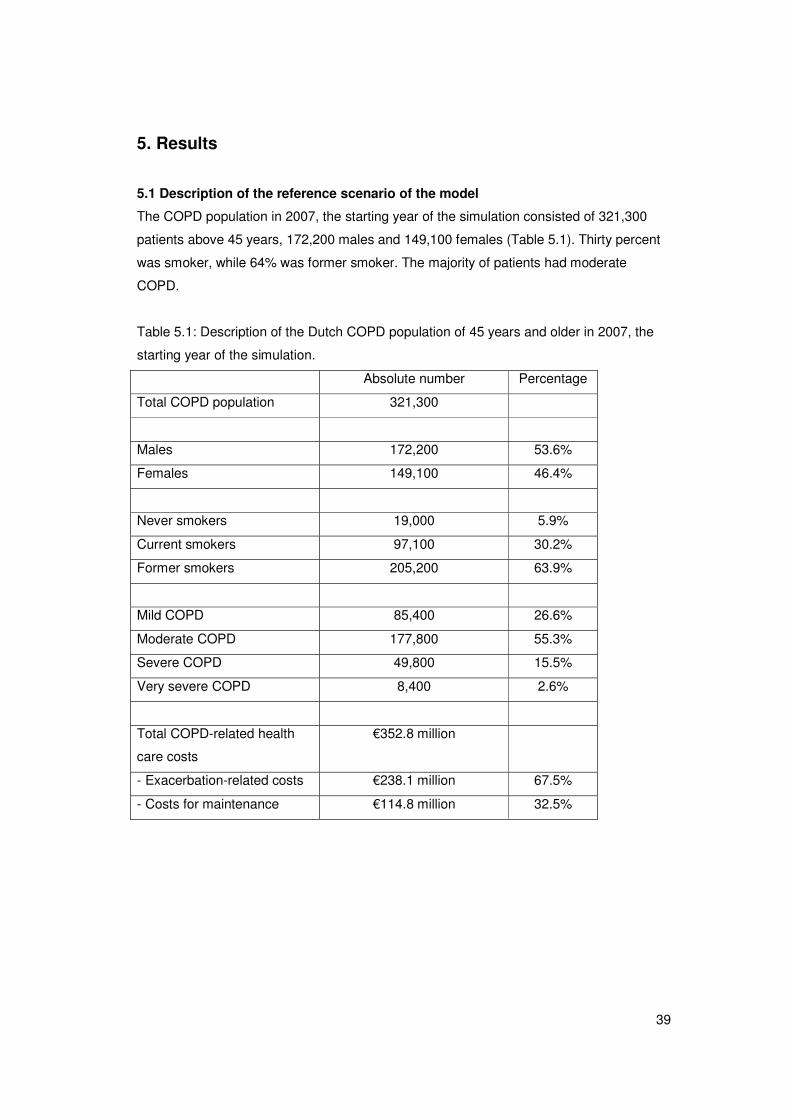
5.1 Description of the reference scenario of the model
The COPD population in 2007, the starting year of the simulation consisted of 321,300
patients above 45 years, 172,200 males and 149,100 females (Table 5.1). Thirty percent
was smoker, while 64% was former smoker. The majority of patients had moderate
COPD.
Table 5.1: Description of the Dutch COPD population of 45 years and older in 2007, the
starting year of the simulation.
Absolute number Percentage
Total COPD population 321,300
Males 172,200 53.6%
Females 149,100 46.4%
Never smokers 19,000 5.9%
Current smokers 97,100 30.2%
Former smokers 205,200 63.9%
Mild COPD 85,400 26.6%
Moderate COPD 177,800 55.3%
Severe COPD 49,800 15.5%
Very severe COPD 8,400 2.6%
Total COPD-related health
care costs
€352.8 million
- Exacerbation-related costs €238.1 million 67.5%
- Costs for maintenance €114.8 million 32.5%
40
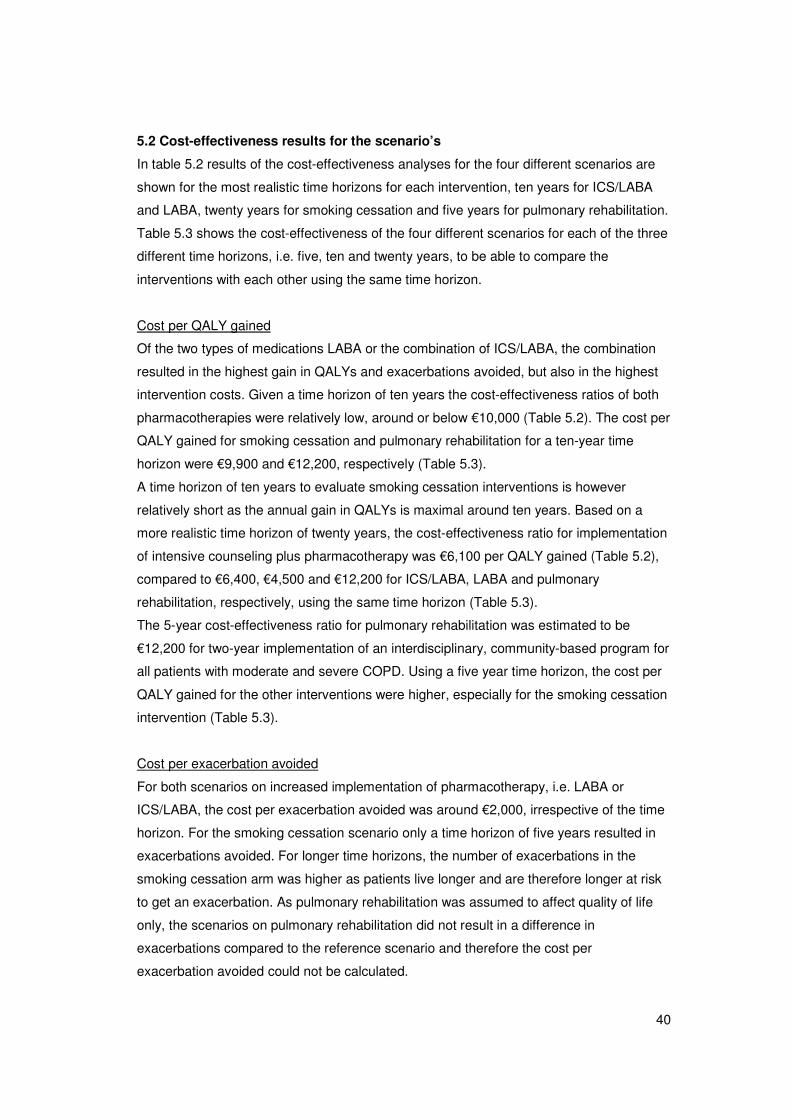
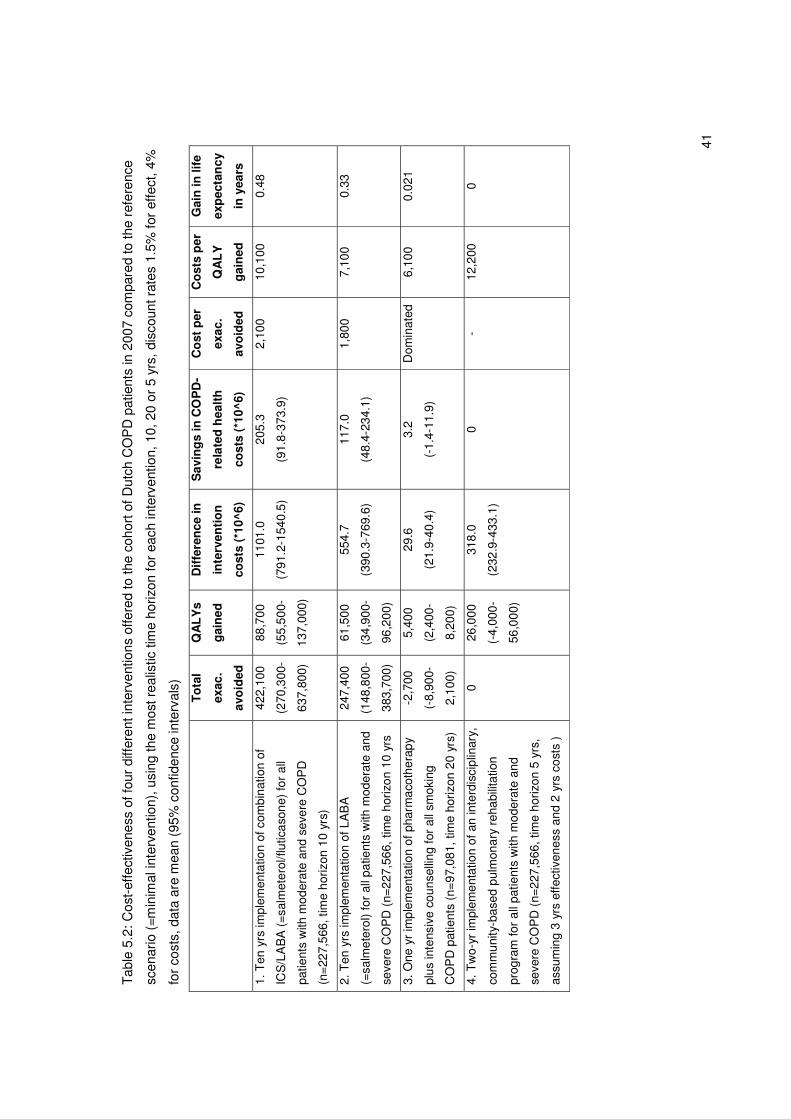
5.2 Cost-effectiveness results for the scenario’s
In table 5.2 results of the cost-effectiveness analyses for the four different scenarios are
shown for the most realistic time horizons for each intervention, ten years for ICS/LABA
and LABA, twenty years for smoking cessation and five years for pulmonary rehabilitation.
Table 5.3 shows the cost-effectiveness of the four different scenarios for each of the three
different time horizons, i.e. five, ten and twenty years, to be able to compare the
interventions with each other using the same time horizon.
Cost per QALY gained
Of the two types of medications LABA or the combination of ICS/LABA, the combination
resulted in the highest gain in QALYs and exacerbations avoided, but also in the highest
intervention costs. Given a time horizon of ten years the cost-effectiveness ratios of both
pharmacotherapies were relatively low, around or below €10,000 (Table 5.2). The cost per
QALY gained for smoking cessation and pulmonary rehabilitation for a ten-year time
horizon were €9,900 and €12,200, respectively (Table 5.3).
A time horizon of ten years to evaluate smoking cessation interventions is however
relatively short as the annual gain in QALYs is maximal around ten years. Based on a
more realistic time horizon of twenty years, the cost-effectiveness ratio for implementation
of intensive counseling plus pharmacotherapy was €6,100 per QALY gained (Table 5.2),
compared to €6,400, €4,500 and €12,200 for ICS/LABA, LABA and pulmonary
rehabilitation, respectively, using the same time horizon (Table 5.3).
The 5-year cost-effectiveness ratio for pulmonary rehabilitation was estimated to be
€12,200 for two-year implementation of an interdisciplinary, community-based program for
all patients with moderate and severe COPD. Using a five year time horizon, the cost per
QALY gained for the other interventions were higher, especially for the smoking cessation
intervention (Table 5.3).
Cost per exacerbation avoided
For both scenarios on increased implementation of pharmacotherapy, i.e. LABA or
ICS/LABA, the cost per exacerbation avoided was around €2,000, irrespective of the time
horizon. For the smoking cessation scenario only a time horizon of five years resulted in
exacerbations avoided. For longer time horizons, the number of exacerbations in the
smoking cessation arm was higher as patients live longer and are therefore longer at risk
to get an exacerbation. As pulmonary rehabilitation was assumed to affect quality of life
only, the scenarios on pulmonary rehabilitation did not result in a difference in
exacerbations compared to the reference scenario and therefore the cost per
exacerbation avoided could not be calculated.
41
Tab
le 5
.2: C
ost-
effe
ctiv
enes
s of
four
diff
eren
t int
erve
ntio
ns o
ffere
d to
the
coho
rt o
f Dut
ch C
OP
D p
atie
nts
in 2
007
com
pare
d to
the
refe
renc
e
scen
ario
(=m
inim
al in
terv
entio
n), u
sing
the
mos
t rea
listic
tim
e ho
rizon
for
each
inte
rven
tion,
10,
20
or 5
yrs
, dis
coun
t rat
es 1
.5%
for
effe
ct, 4
%
for
cost
s, d
ata
are
mea
n (9
5% c
onfid
ence
inte
rval
s)
T
ota
l
exac
.
avo
ided
QA
LY
s
gai
ned
Dif
fere
nce
in
inte
rven
tio
n
cost
s (*
10^6
)
Sav
ing
s in
CO
PD
-
rela
ted
hea
lth
cost
s (*
10^6
)
Co
st p
er
exac
.
avo
ided
Co
sts
per
QA
LY
gai
ned
Gai
n in
life
exp
ecta
ncy
in y
ears
1. T
en y
rs im
plem
enta
tion
of c
ombi
natio
n of
ICS
/LA
BA
(=
salm
eter
ol/fl
utic
ason
e) fo
r al
l
patie
nts
with
mod
erat
e an
d se
vere
CO
PD
(n=
227,
566,
tim
e ho
rizon
10
yrs)
422,
100
(270
,300
-
637,
800)
88,7
00
(55,
500-
137,
000)
1101
.0
(791
.2-1
540.
5)
205.
3
(91.
8-37
3.9)
2,10
0 10
,100
0.
48
2. T
en y
rs im
plem
enta
tion
of L
AB
A
(=sa
lmet
erol
) fo
r al
l pat
ient
s w
ith m
oder
ate
and
seve
re C
OP
D (
n=22
7,56
6, ti
me
horiz
on 1
0 yr
s
247,
400
(148
,800
-
383,
700)
61,5
00
(34,
900-
96,2
00)
554.
7
(390
.3-7
69.6
)
117.
0
(48.
4-23
4.1)
1,80
0 7,
100
0.33
3. O
ne y
r im
plem
enta
tion
of p
harm
acot
hera
py
plus
inte
nsiv
e co
unse
lling
for
all s
mok
ing
CO
PD
pat
ient
s (n
=97
,081
, tim
e ho
rizon
20
yrs)
-2,7
00
(-8,
900-
2,10
0)
5,40
0
(2,4
00-
8,20
0)
29.6
(21.
9-40
.4)
3.2
(-1.
4-11
.9)
Dom
inat
ed
6,10
0 0.
021
4. T
wo-
yr im
plem
enta
tion
of a
n in
terd
isci
plin
ary,
com
mun
ity-b
ased
pul
mon
ary
reha
bilit
atio
n
prog
ram
for
all p
atie
nts
with
mod
erat
e an
d
seve
re C
OP
D (
n=22
7,56
6, ti
me
horiz
on 5
yrs
,
assu
min
g 3
yrs
effe
ctiv
enes
s an
d 2
yrs
cost
s )
0
26,0
00
(-4,
000-
56,0
00)
318.
0
(232
.9-4
33.1
)
0
- 12
,200
0
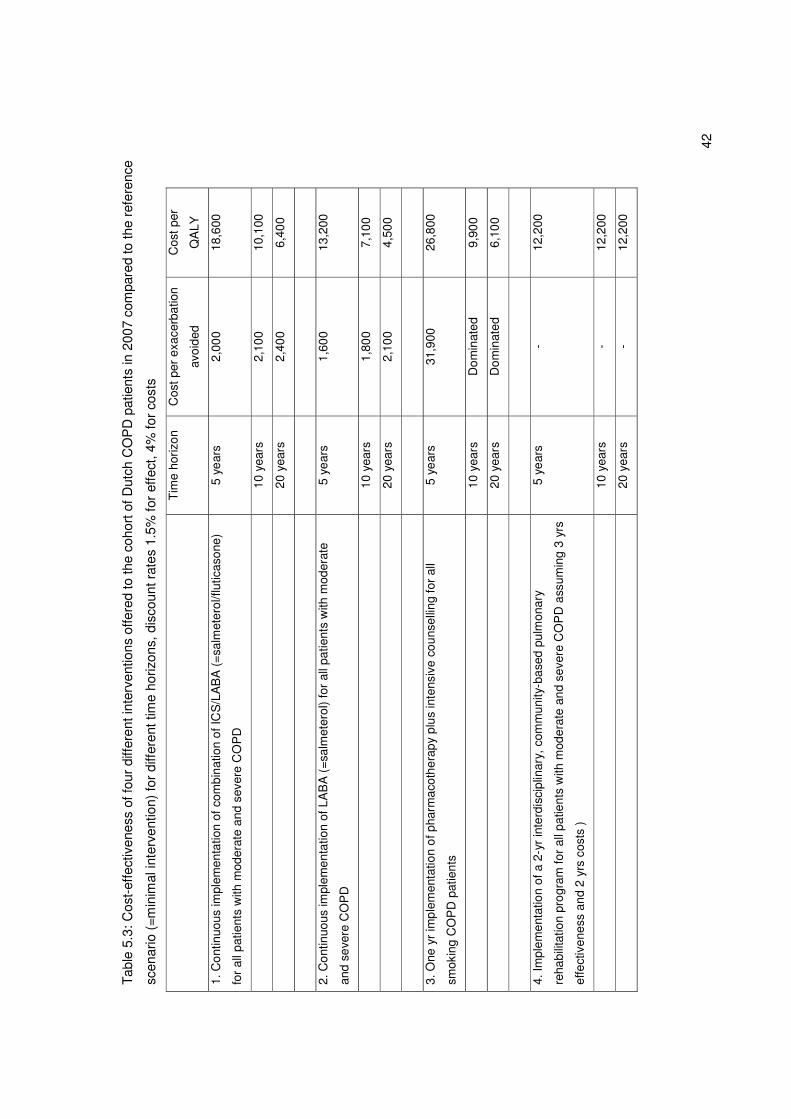
42
Tab
le 5
.3: C
ost-
effe
ctiv
enes
s of
four
diff
eren
t int
erve
ntio
ns o
ffere
d to
the
coho
rt o
f Dut
ch C
OP
D p
atie
nts
in 2
007
com
pare
d to
the
refe
renc
e
scen
ario
(=m
inim
al in
terv
entio
n) fo
r di
ffere
nt ti
me
horiz
ons,
dis
coun
t rat
es 1
.5%
for
effe
ct, 4
% fo
r co
sts
T
ime
horiz
on
Cos
t per
exa
cerb
atio
n
avoi
ded
Cos
t per
QA
LY
1. C
ontin
uous
impl
emen
tatio
n of
com
bina
tion
of IC
S/L
AB
A (
=sa
lmet
erol
/flut
icas
one)
for
all p
atie
nts
with
mod
erat
e an
d se
vere
CO
PD
5 ye
ars
2,00
0 18
,600
10
yea
rs
2,10
0 10
,100
20
yea
rs
2,40
0 6,
400
2. C
ontin
uous
impl
emen
tatio
n of
LA
BA
(=
salm
eter
ol)
for
all p
atie
nts
with
mod
erat
e
and
seve
re C
OP
D
5 ye
ars
1,60
0 13
,200
10
yea
rs
1,80
0 7,
100
20
yea
rs
2,10
0 4,
500
3. O
ne y
r im
plem
enta
tion
of p
harm
acot
hera
py p
lus
inte
nsiv
e co
unse
lling
for
all
smok
ing
CO
PD
pat
ient
s
5 ye
ars
31,9
00
26,8
00
10
yea
rs
Dom
inat
ed
9,90
0
20
yea
rs
Dom
inat
ed
6,10
0
4. Im
plem
enta
tion
of a
2-y
r in
terd
isci
plin
ary,
com
mun
ity-b
ased
pul
mon
ary
reha
bilit
atio
n pr
ogra
m fo
r al
l pat
ient
s w
ith m
oder
ate
and
seve
re C
OP
D a
ssum
ing
3 yr
s
effe
ctiv
enes
s an
d 2
yrs
cost
s )
5 ye
ars
- 12
,200
10
yea
rs
- 12
,200
20
yea
rs
- 12
,200
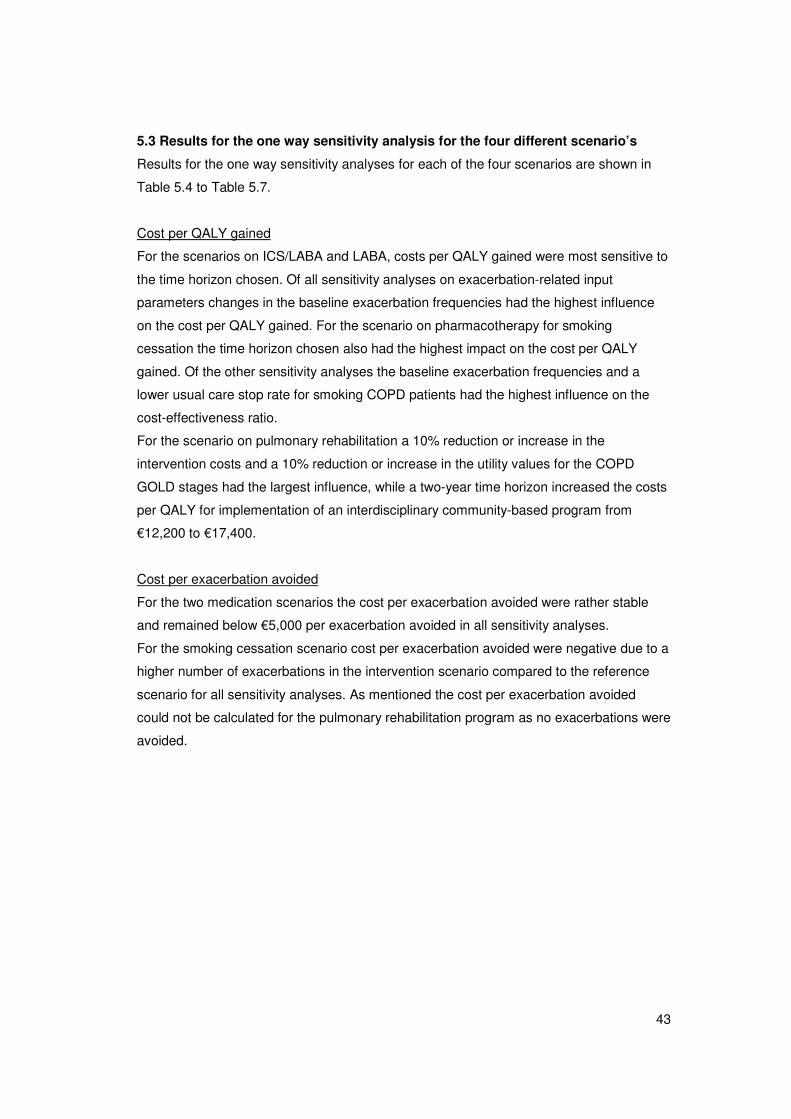
43
5.3 Results for the one way sensitivity analysis for the four different scenario’s
Results for the one way sensitivity analyses for each of the four scenarios are shown in
Table 5.4 to Table 5.7.
Cost per QALY gained
For the scenarios on ICS/LABA and LABA, costs per QALY gained were most sensitive to
the time horizon chosen. Of all sensitivity analyses on exacerbation-related input
parameters changes in the baseline exacerbation frequencies had the highest influence
on the cost per QALY gained. For the scenario on pharmacotherapy for smoking
cessation the time horizon chosen also had the highest impact on the cost per QALY
gained. Of the other sensitivity analyses the baseline exacerbation frequencies and a
lower usual care stop rate for smoking COPD patients had the highest influence on the
cost-effectiveness ratio.
For the scenario on pulmonary rehabilitation a 10% reduction or increase in the
intervention costs and a 10% reduction or increase in the utility values for the COPD
GOLD stages had the largest influence, while a two-year time horizon increased the costs
per QALY for implementation of an interdisciplinary community-based program from
€12,200 to €17,400.
Cost per exacerbation avoided
For the two medication scenarios the cost per exacerbation avoided were rather stable
and remained below €5,000 per exacerbation avoided in all sensitivity analyses.
For the smoking cessation scenario cost per exacerbation avoided were negative due to a
higher number of exacerbations in the intervention scenario compared to the reference
scenario for all sensitivity analyses. As mentioned the cost per exacerbation avoided
could not be calculated for the pulmonary rehabilitation program as no exacerbations were
avoided.
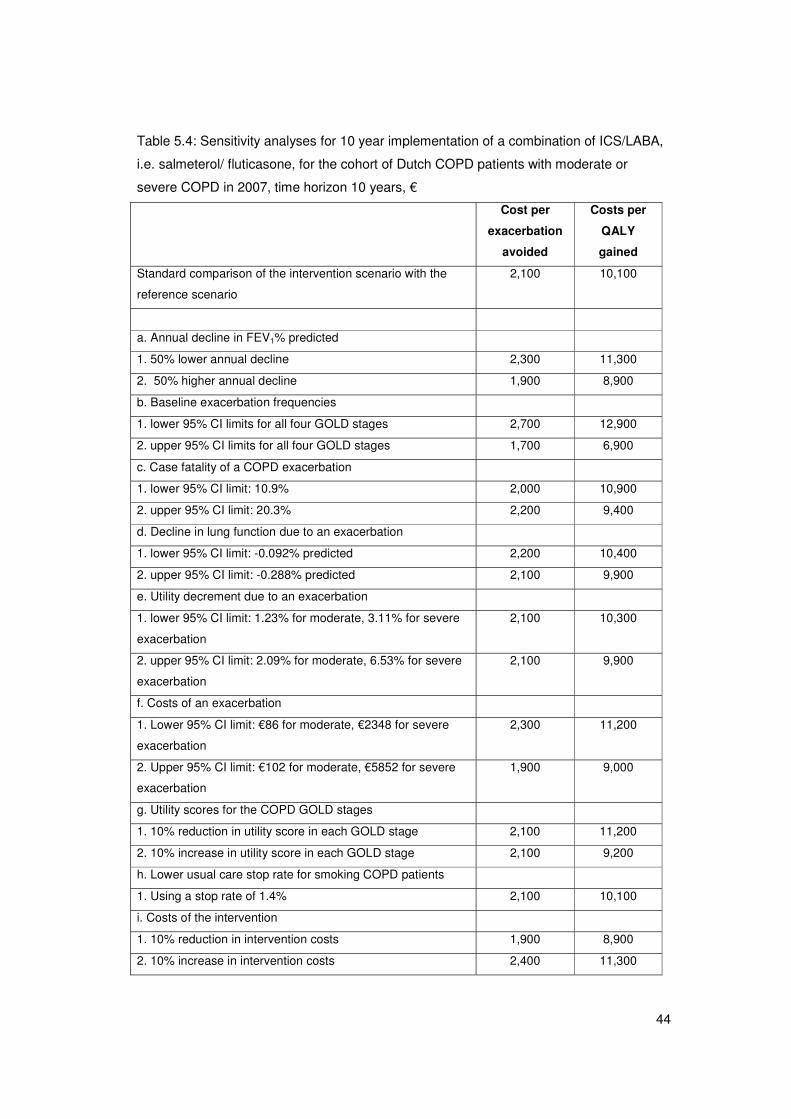
44
Table 5.4: Sensitivity analyses for 10 year implementation of a combination of ICS/LABA,
i.e. salmeterol/ fluticasone, for the cohort of Dutch COPD patients with moderate or
severe COPD in 2007, time horizon 10 years, €
Cost per
exacerbation
avoided
Costs per
QALY
gained
Standard comparison of the intervention scenario with the
reference scenario
2,100 10,100
a. Annual decline in FEV1% predicted
1. 50% lower annual decline 2,300 11,300
2. 50% higher annual decline 1,900 8,900
b. Baseline exacerbation frequencies
1. lower 95% CI limits for all four GOLD stages 2,700 12,900
2. upper 95% CI limits for all four GOLD stages 1,700 6,900
c. Case fatality of a COPD exacerbation
1. lower 95% CI limit: 10.9% 2,000 10,900
2. upper 95% CI limit: 20.3% 2,200 9,400
d. Decline in lung function due to an exacerbation
1. lower 95% CI limit: -0.092% predicted 2,200 10,400
2. upper 95% CI limit: -0.288% predicted 2,100 9,900
e. Utility decrement due to an exacerbation
1. lower 95% CI limit: 1.23% for moderate, 3.11% for severe
exacerbation
2,100 10,300
2. upper 95% CI limit: 2.09% for moderate, 6.53% for severe
exacerbation
2,100 9,900
f. Costs of an exacerbation
1. Lower 95% CI limit: €86 for moderate, €2348 for severe
exacerbation
2,300 11,200
2. Upper 95% CI limit: €102 for moderate, €5852 for severe
exacerbation
1,900 9,000
g. Utility scores for the COPD GOLD stages
1. 10% reduction in utility score in each GOLD stage 2,100 11,200
2. 10% increase in utility score in each GOLD stage 2,100 9,200
h. Lower usual care stop rate for smoking COPD patients
1. Using a stop rate of 1.4% 2,100 10,100
i. Costs of the intervention
1. 10% reduction in intervention costs 1,900 8,900
2. 10% increase in intervention costs 2,400 11,300
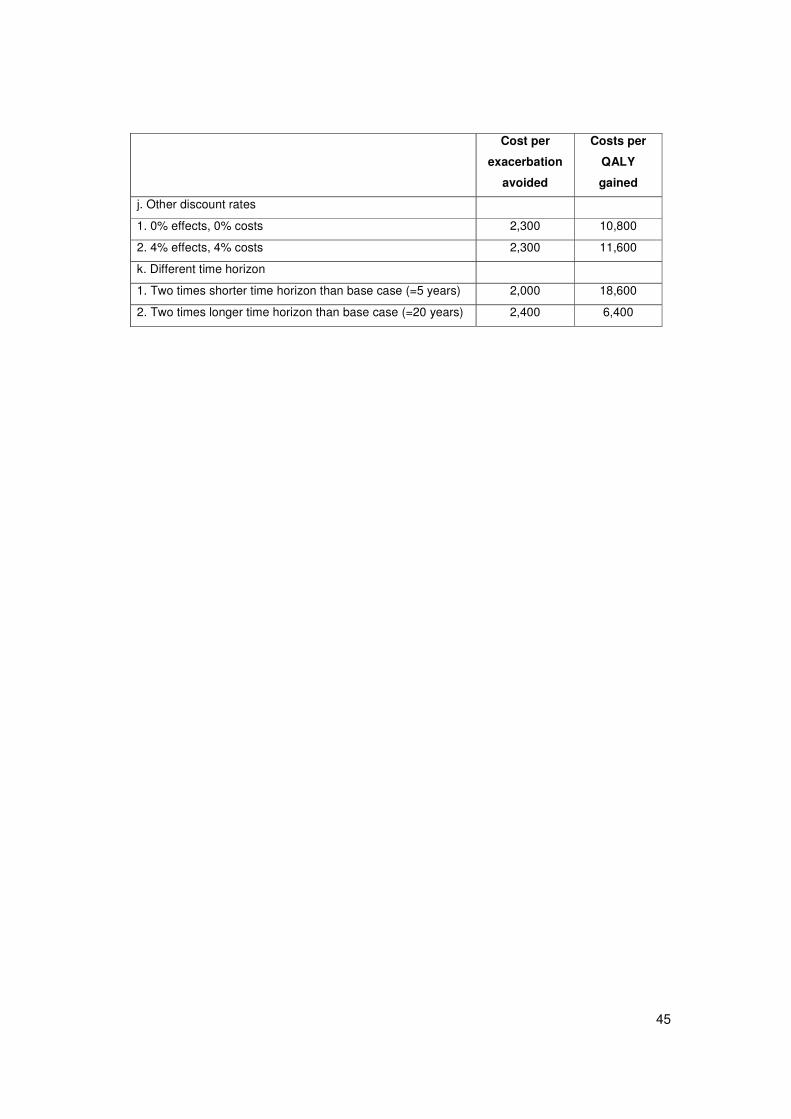
45
Cost per
exacerbation
avoided
Costs per
QALY
gained
j. Other discount rates
1. 0% effects, 0% costs 2,300 10,800
2. 4% effects, 4% costs 2,300 11,600
k. Different time horizon
1. Two times shorter time horizon than base case (=5 years) 2,000 18,600
2. Two times longer time horizon than base case (=20 years) 2,400 6,400
46
Table 5.5: Sensitivity analyses for 10 year implementation of LABA, i.e. salmeterol for the
cohort of Dutch COPD patients with moderate or severe COPD in 2007, time horizon ten
years, €�
Cost per
exacerbation
avoided
Costs per
QALY gained
Standard comparison of the intervention scenario with the
reference scenario
1,800 7,100
a. Annual decline in FEV1% predicted
1. 50% lower annual decline 2,000 8,200
2. 50% higher annual decline 1,600 6,100
b. Baseline exacerbation frequencies
1. lower 95% CI limits for all four GOLD stages 2,300 9,000
2. upper 95% CI limits for all four GOLD stages 1,400 4,900
c. Case fatality of a COPD exacerbation
1. lower 95% CI limit: 10.9% 1,700 7,600
2. upper 95% CI limit: 20.3% 1,900 6,700
d. Decline in lung function due to an exacerbation
1. lower 95% CI limit: -0.092% predicted 1,800 7,300
2. upper 95% CI limit: -0.288% predicted 1,700 6,900
e. Utility decrement due to an exacerbation
1. lower 95% CI limit: 1.23% for moderate, 3.11% for severe
exacerbation
1,800 7,200
2. upper 95% CI limit: 2.09% for moderate, 6.53% for severe
exacerbation
1,800 7,000
f. Costs of an exacerbation
1. Lower 95% CI limit: €86 for moderate, €2348 for severe
exacerbation
2,000 8,000
2. Upper 95% CI limit: €102 for moderate, €5852 for severe
exacerbation
1,500 6,200
g. Utility scores for the COPD GOLD stages
1. 10% reduction in utility score in each GOLD stage 1,800 7,900
2. 10% increase in utility score in each GOLD stage 1,800 6,500
h. Lower usual care stop rate for smoking COPD patients
1. Using a stop rate of 1.4% 1,800 7,100
i. Costs of the intervention
1. 10% reduction in intervention costs 1,500 6,200
2. 10% increase in intervention costs 2,000 8,000
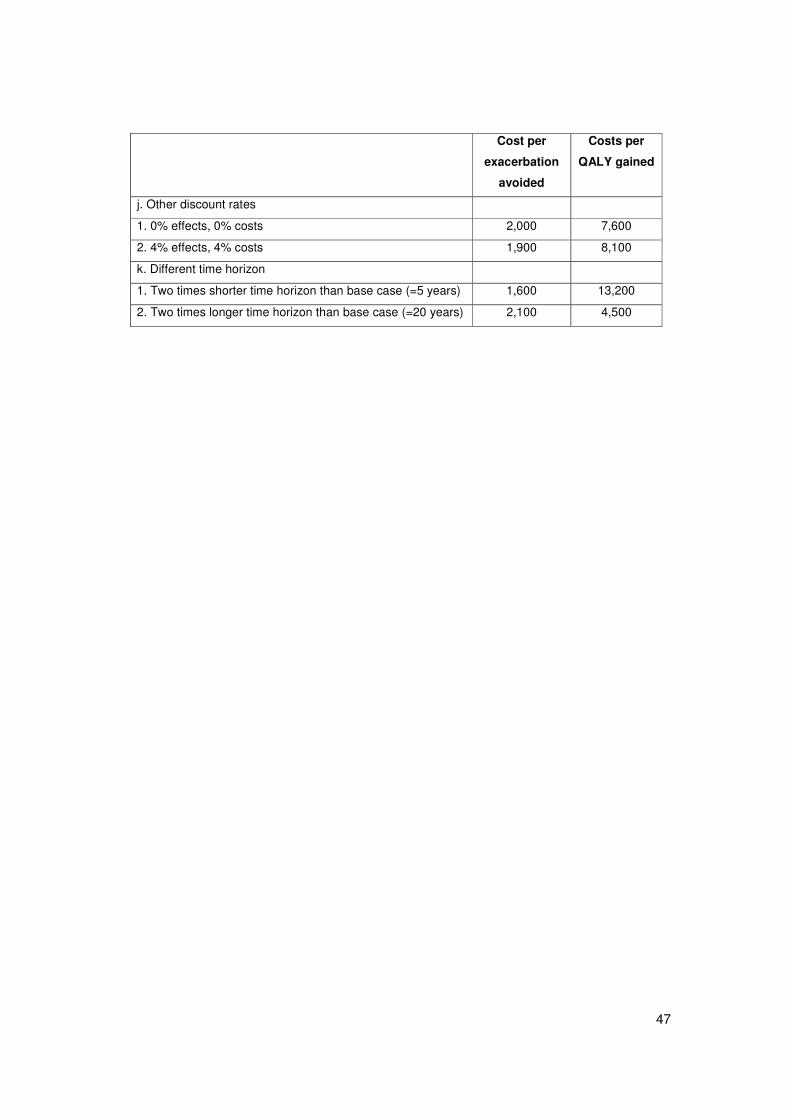
47
Cost per
exacerbation
avoided
Costs per
QALY gained
j. Other discount rates
1. 0% effects, 0% costs 2,000 7,600
2. 4% effects, 4% costs 1,900 8,100
k. Different time horizon
1. Two times shorter time horizon than base case (=5 years) 1,600 13,200
2. Two times longer time horizon than base case (=20 years) 2,100 4,500
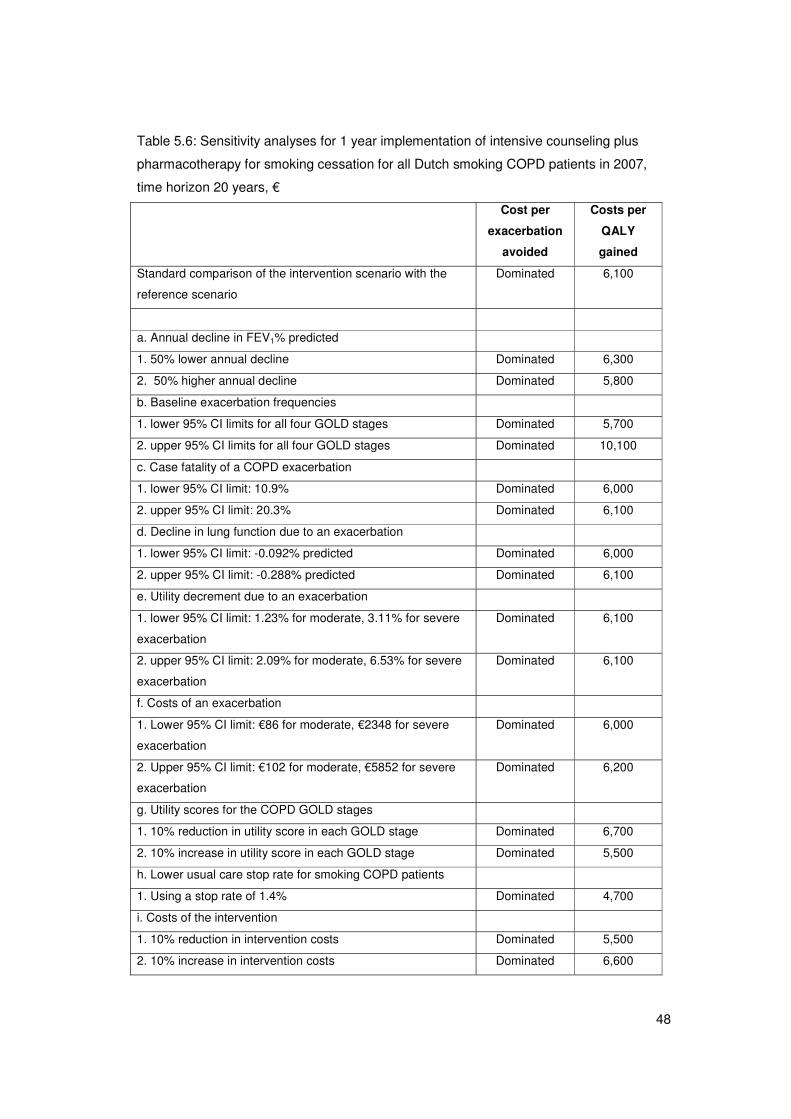
48
Table 5.6: Sensitivity analyses for 1 year implementation of intensive counseling plus
pharmacotherapy for smoking cessation for all Dutch smoking COPD patients in 2007,
time horizon 20 years, €�
Cost per
exacerbation
avoided
Costs per
QALY
gained
Standard comparison of the intervention scenario with the
reference scenario
Dominated 6,100
a. Annual decline in FEV1% predicted
1. 50% lower annual decline Dominated 6,300
2. 50% higher annual decline Dominated 5,800
b. Baseline exacerbation frequencies
1. lower 95% CI limits for all four GOLD stages Dominated 5,700
2. upper 95% CI limits for all four GOLD stages Dominated 10,100
c. Case fatality of a COPD exacerbation
1. lower 95% CI limit: 10.9% Dominated 6,000
2. upper 95% CI limit: 20.3% Dominated 6,100
d. Decline in lung function due to an exacerbation
1. lower 95% CI limit: -0.092% predicted Dominated 6,000
2. upper 95% CI limit: -0.288% predicted Dominated 6,100
e. Utility decrement due to an exacerbation
1. lower 95% CI limit: 1.23% for moderate, 3.11% for severe
exacerbation
Dominated 6,100
2. upper 95% CI limit: 2.09% for moderate, 6.53% for severe
exacerbation
Dominated 6,100
f. Costs of an exacerbation
1. Lower 95% CI limit: €86 for moderate, €2348 for severe
exacerbation
Dominated 6,000
2. Upper 95% CI limit: €102 for moderate, €5852 for severe
exacerbation
Dominated 6,200
g. Utility scores for the COPD GOLD stages
1. 10% reduction in utility score in each GOLD stage Dominated 6,700
2. 10% increase in utility score in each GOLD stage Dominated 5,500
h. Lower usual care stop rate for smoking COPD patients
1. Using a stop rate of 1.4% Dominated 4,700
i. Costs of the intervention
1. 10% reduction in intervention costs Dominated 5,500
2. 10% increase in intervention costs Dominated 6,600
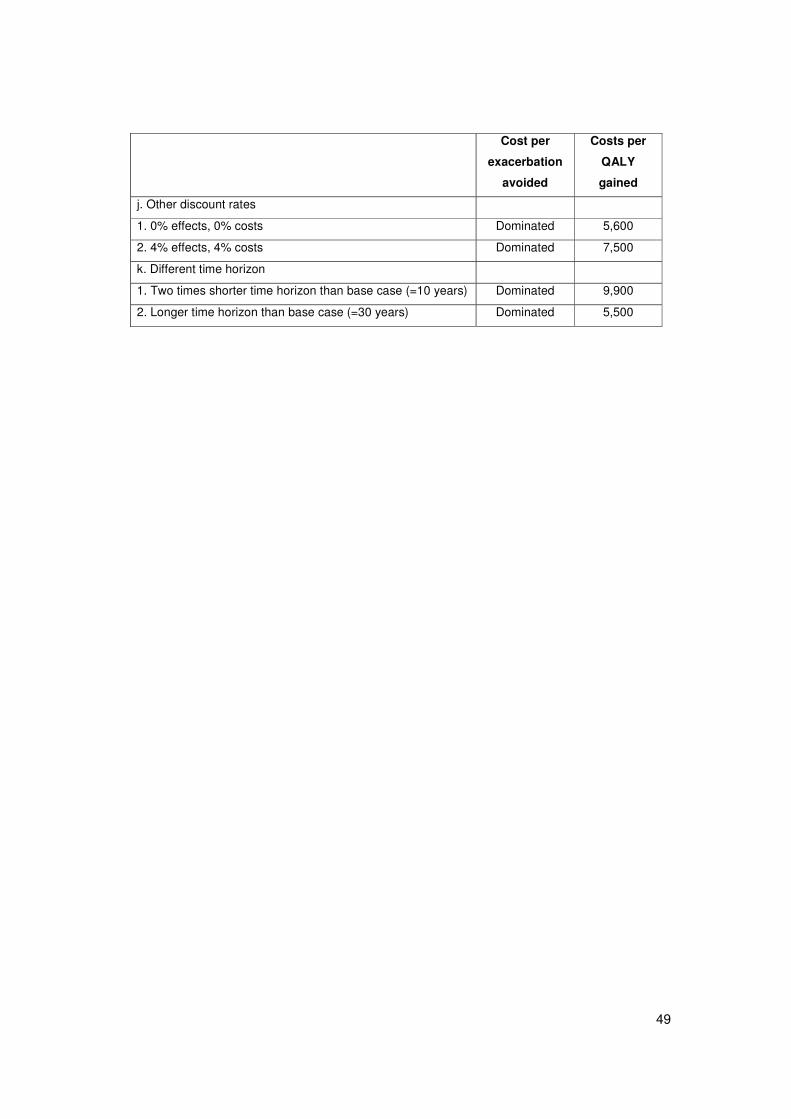
49
Cost per
exacerbation
avoided
Costs per
QALY
gained
j. Other discount rates
1. 0% effects, 0% costs Dominated 5,600
2. 4% effects, 4% costs Dominated 7,500
k. Different time horizon
1. Two times shorter time horizon than base case (=10 years) Dominated 9,900
2. Longer time horizon than base case (=30 years) Dominated 5,500
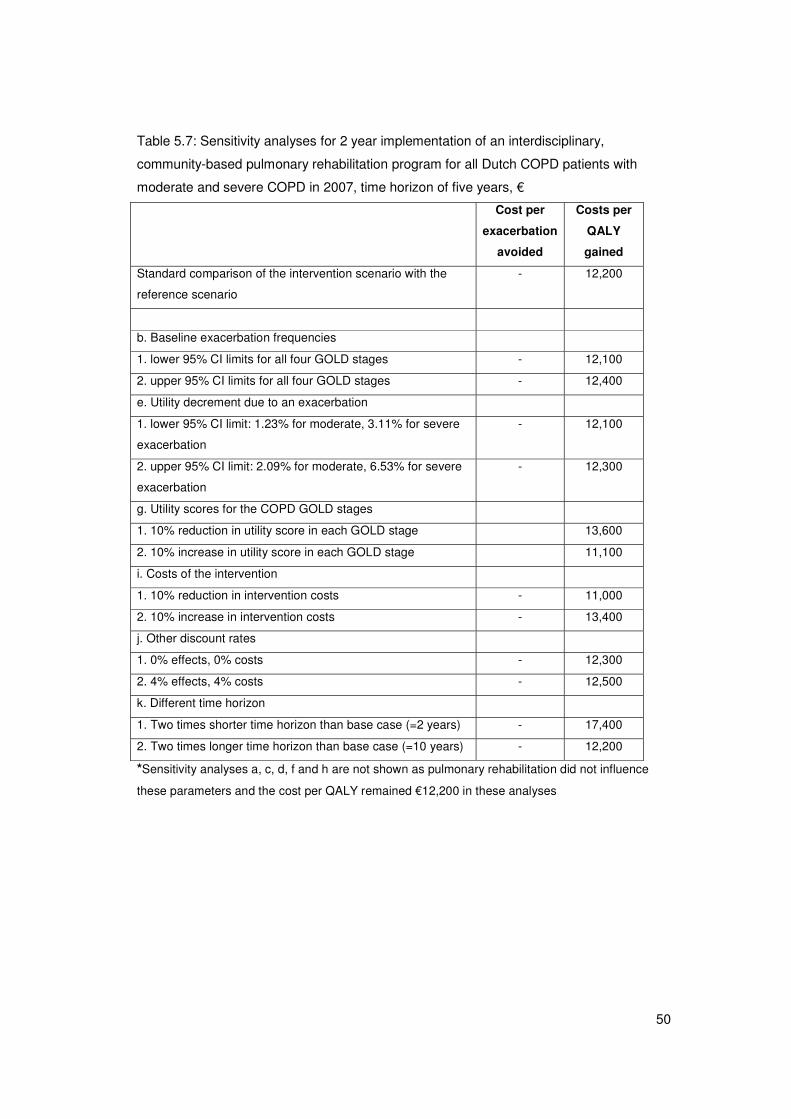
50
Table 5.7: Sensitivity analyses for 2 year implementation of an interdisciplinary,
community-based pulmonary rehabilitation program for all Dutch COPD patients with
moderate and severe COPD in 2007, time horizon of five years, €�
Cost per
exacerbation
avoided
Costs per
QALY
gained
Standard comparison of the intervention scenario with the
reference scenario
- 12,200
b. Baseline exacerbation frequencies
1. lower 95% CI limits for all four GOLD stages - 12,100
2. upper 95% CI limits for all four GOLD stages - 12,400
e. Utility decrement due to an exacerbation
1. lower 95% CI limit: 1.23% for moderate, 3.11% for severe
exacerbation
- 12,100
2. upper 95% CI limit: 2.09% for moderate, 6.53% for severe
exacerbation
- 12,300
g. Utility scores for the COPD GOLD stages
1. 10% reduction in utility score in each GOLD stage 13,600
2. 10% increase in utility score in each GOLD stage 11,100
i. Costs of the intervention
1. 10% reduction in intervention costs - 11,000
2. 10% increase in intervention costs - 13,400
j. Other discount rates
1. 0% effects, 0% costs - 12,300
2. 4% effects, 4% costs - 12,500
k. Different time horizon
1. Two times shorter time horizon than base case (=2 years) - 17,400
2. Two times longer time horizon than base case (=10 years) - 12,200
*Sensitivity analyses a, c, d, f and h are not shown as pulmonary rehabilitation did not influence
these parameters and the cost per QALY remained €12,200 in these analyses
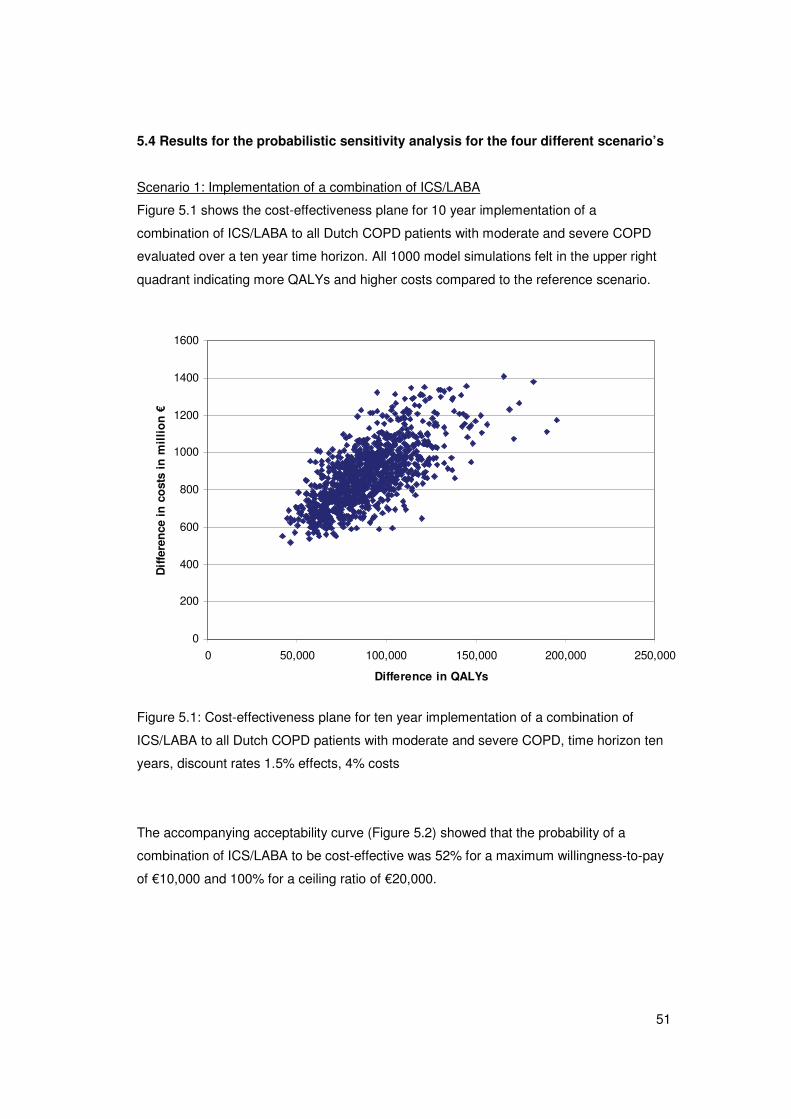
51
5.4 Results for the probabilistic sensitivity analysis for the four different scenario’s
Scenario 1: Implementation of a combination of ICS/LABA
Figure 5.1 shows the cost-effectiveness plane for 10 year implementation of a
combination of ICS/LABA to all Dutch COPD patients with moderate and severe COPD
evaluated over a ten year time horizon. All 1000 model simulations felt in the upper right
quadrant indicating more QALYs and higher costs compared to the reference scenario.
0
200
400
600
800
1000
1200
1400
1600
0 50,000 100,000 150,000 200,000 250,000
Difference in QALYs
Dif
fere
nce
in
co
sts
in m
illi
on
€
Figure 5.1: Cost-effectiveness plane for ten year implementation of a combination of
ICS/LABA to all Dutch COPD patients with moderate and severe COPD, time horizon ten
years, discount rates 1.5% effects, 4% costs
The accompanying acceptability curve (Figure 5.2) showed that the probability of a
combination of ICS/LABA to be cost-effective was 52% for a maximum willingness-to-pay
of €10,000 and 100% for a ceiling ratio of €20,000.
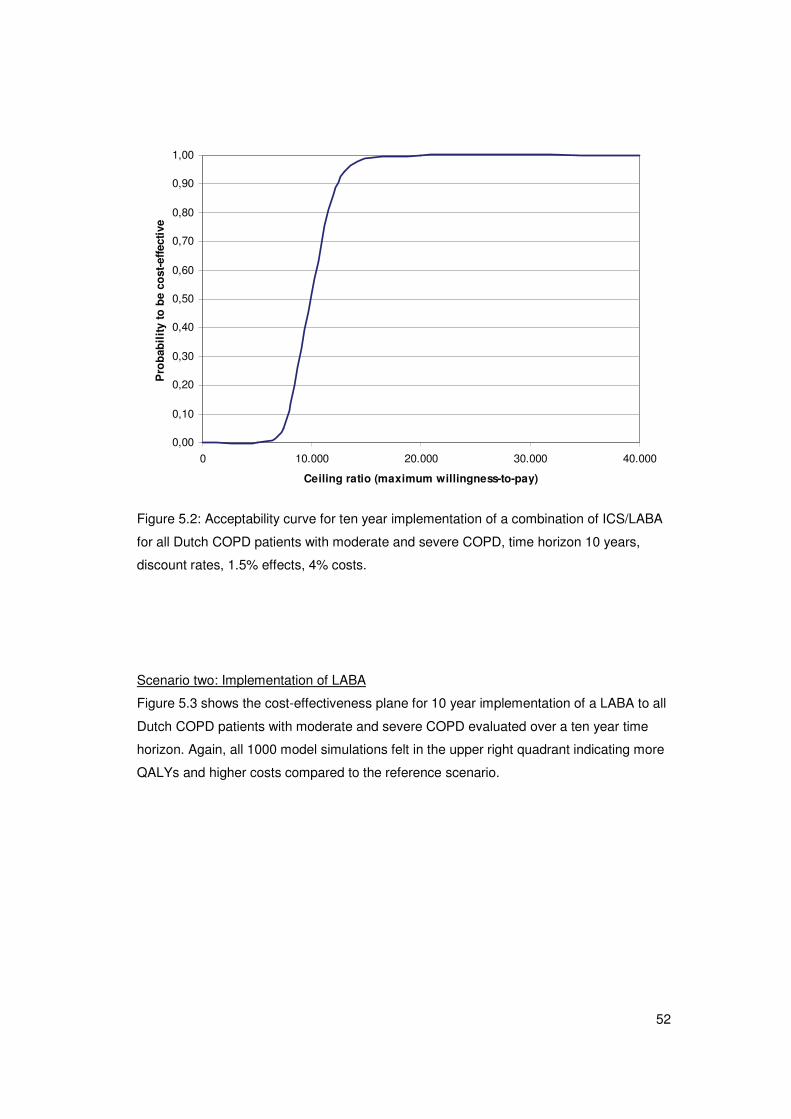
52
0,00
0,10
0,20
0,30
0,40
0,50
0,60
0,70
0,80
0,90
1,00
0 10.000 20.000 30.000 40.000
Ceiling ratio (maximum willingness-to-pay)
Pro
bab
ilit
y to
be
cost
-eff
ecti
ve
Figure 5.2: Acceptability curve for ten year implementation of a combination of ICS/LABA
for all Dutch COPD patients with moderate and severe COPD, time horizon 10 years,
discount rates, 1.5% effects, 4% costs.
Scenario two: Implementation of LABA
Figure 5.3 shows the cost-effectiveness plane for 10 year implementation of a LABA to all
Dutch COPD patients with moderate and severe COPD evaluated over a ten year time
horizon. Again, all 1000 model simulations felt in the upper right quadrant indicating more
QALYs and higher costs compared to the reference scenario.
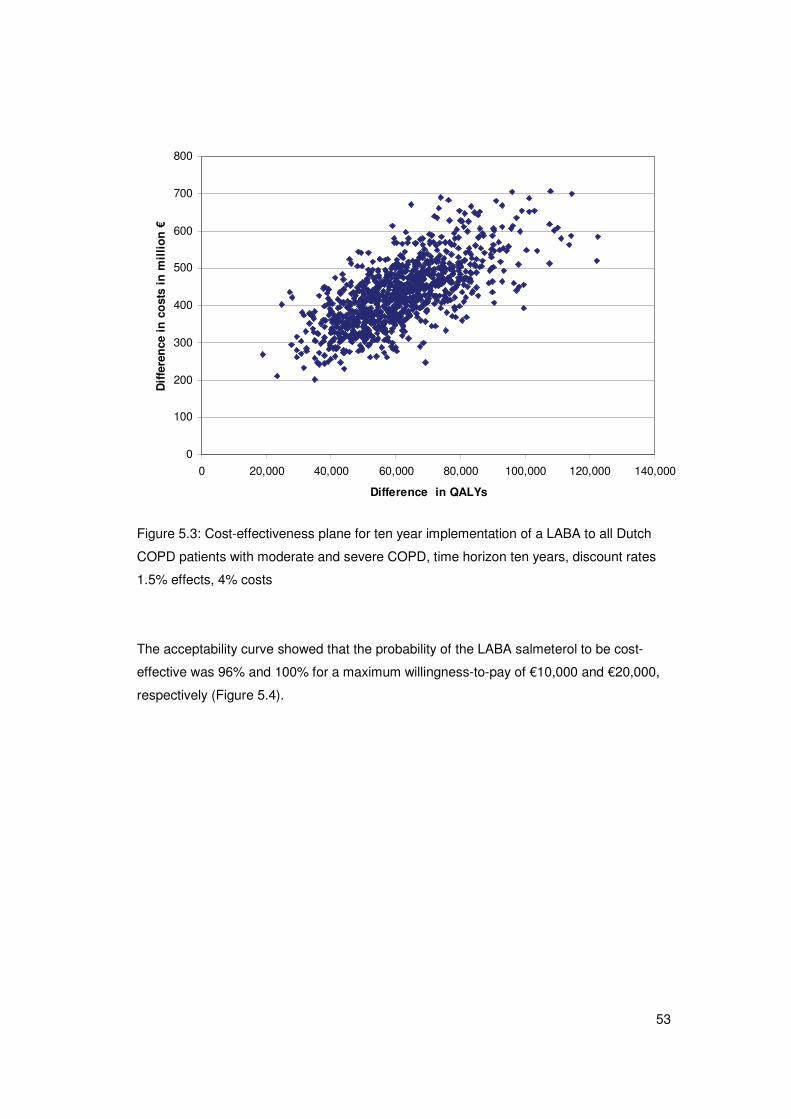
53
0
100
200
300
400
500
600
700
800
0 20,000 40,000 60,000 80,000 100,000 120,000 140,000
Difference in QALYs
Dif
fere
nce
in
co
sts
in m
illi
on
€
Figure 5.3: Cost-effectiveness plane for ten year implementation of a LABA to all Dutch
COPD patients with moderate and severe COPD, time horizon ten years, discount rates
1.5% effects, 4% costs
The acceptability curve showed that the probability of the LABA salmeterol to be cost-
effective was 96% and 100% for a maximum willingness-to-pay of €10,000 and €20,000,
respectively (Figure 5.4).
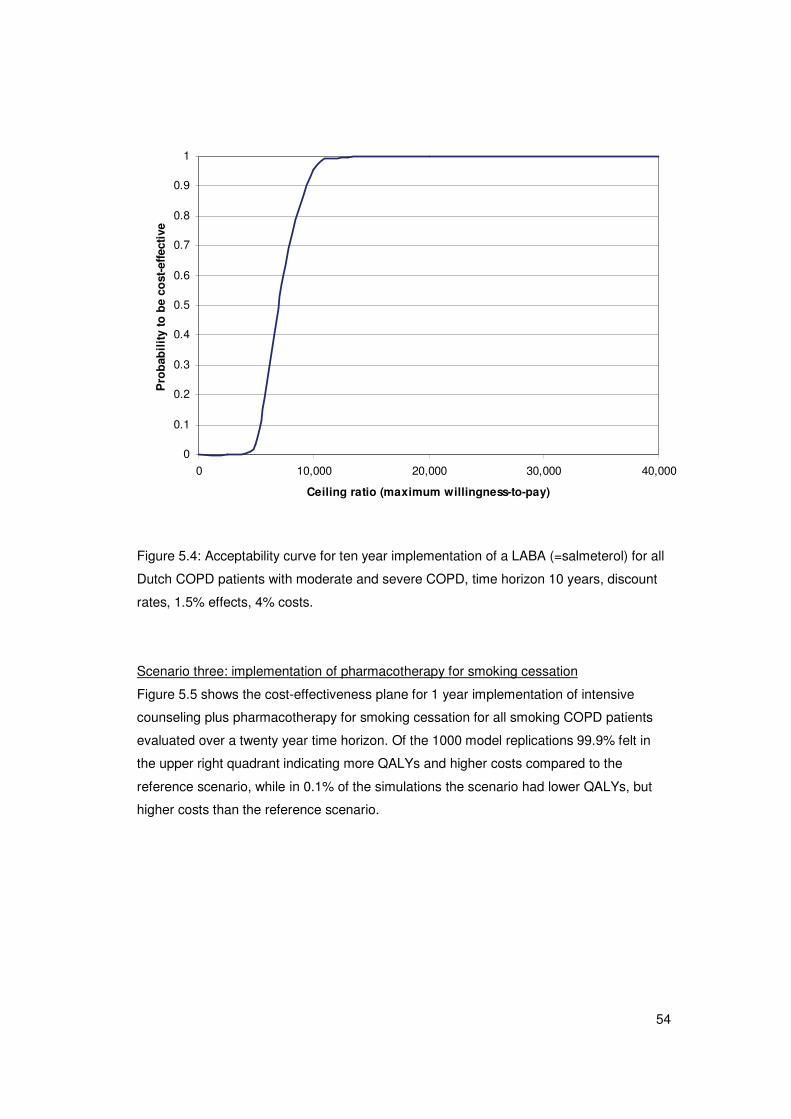
54
0
0.1
0.2
0.3
0.4
0.5
0.6
0.7
0.8
0.9
1
0 10,000 20,000 30,000 40,000
Ceiling ratio (maximum willingness-to-pay)
Pro
bab
ilit
y to
be
cost
-eff
ecti
ve
Figure 5.4: Acceptability curve for ten year implementation of a LABA (=salmeterol) for all
Dutch COPD patients with moderate and severe COPD, time horizon 10 years, discount
rates, 1.5% effects, 4% costs.
Scenario three: implementation of pharmacotherapy for smoking cessation
Figure 5.5 shows the cost-effectiveness plane for 1 year implementation of intensive
counseling plus pharmacotherapy for smoking cessation for all smoking COPD patients
evaluated over a twenty year time horizon. Of the 1000 model replications 99.9% felt in
the upper right quadrant indicating more QALYs and higher costs compared to the
reference scenario, while in 0.1% of the simulations the scenario had lower QALYs, but
higher costs than the reference scenario.
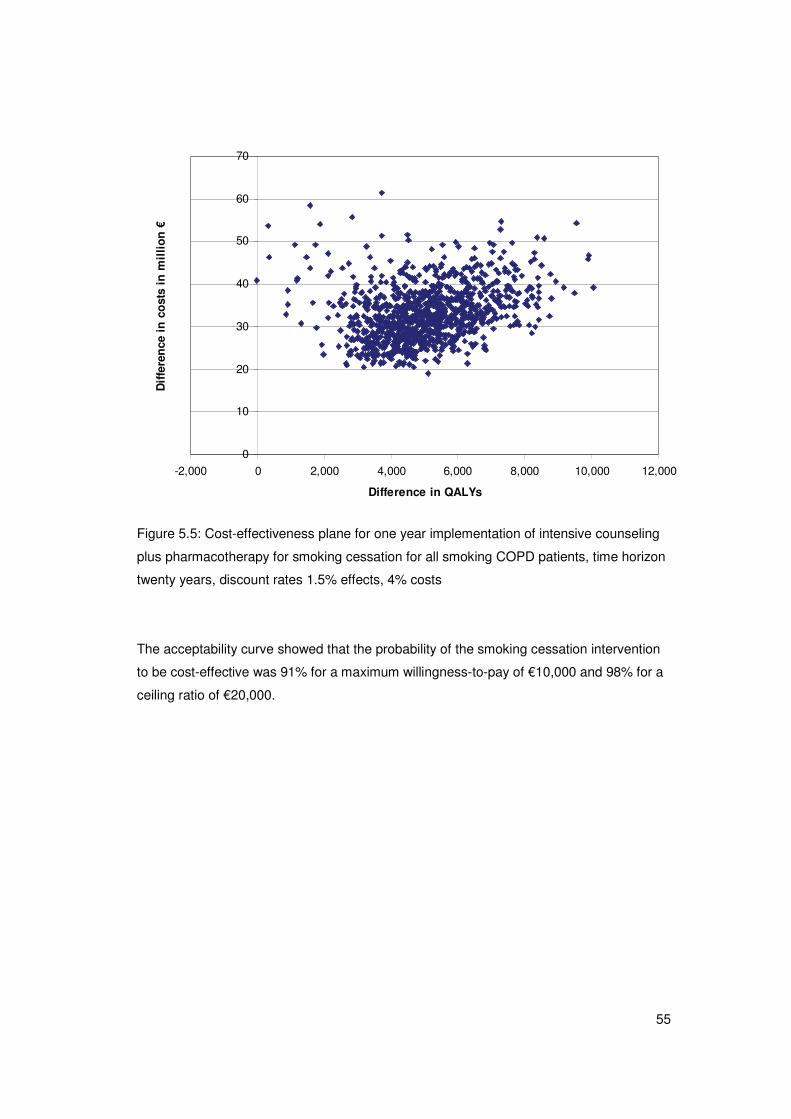
55
0
10
20
30
40
50
60
70
-2,000 0 2,000 4,000 6,000 8,000 10,000 12,000
Difference in QALYs
Dif
fere
nce
in
co
sts
in m
illi
on
€
Figure 5.5: Cost-effectiveness plane for one year implementation of intensive counseling
plus pharmacotherapy for smoking cessation for all smoking COPD patients, time horizon
twenty years, discount rates 1.5% effects, 4% costs
The acceptability curve showed that the probability of the smoking cessation intervention
to be cost-effective was 91% for a maximum willingness-to-pay of €10,000 and 98% for a
ceiling ratio of €20,000.
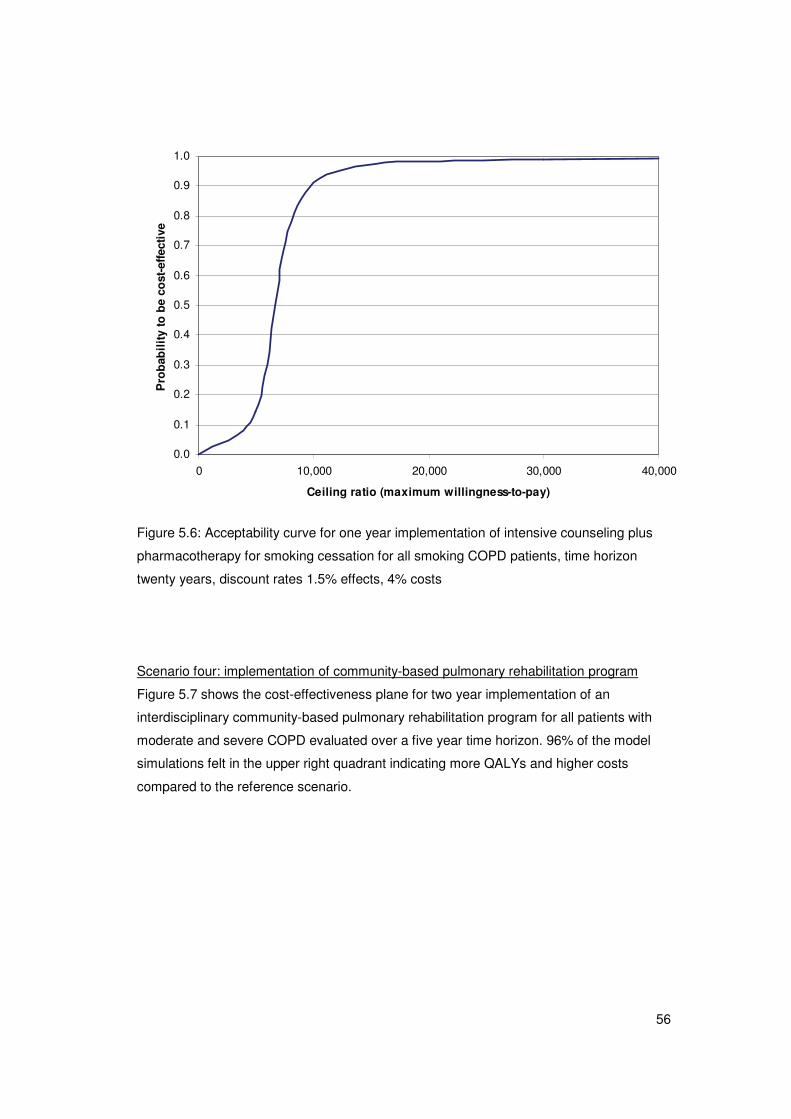
56
0.0
0.1
0.2
0.3
0.4
0.5
0.6
0.7
0.8
0.9
1.0
0 10,000 20,000 30,000 40,000
Ceiling ratio (maximum willingness-to-pay)
Pro
bab
ilit
y to
be
cost
-eff
ecti
ve
Figure 5.6: Acceptability curve for one year implementation of intensive counseling plus
pharmacotherapy for smoking cessation for all smoking COPD patients, time horizon
twenty years, discount rates 1.5% effects, 4% costs
Scenario four: implementation of community-based pulmonary rehabilitation program
Figure 5.7 shows the cost-effectiveness plane for two year implementation of an
interdisciplinary community-based pulmonary rehabilitation program for all patients with
moderate and severe COPD evaluated over a five year time horizon. 96% of the model
simulations felt in the upper right quadrant indicating more QALYs and higher costs
compared to the reference scenario.
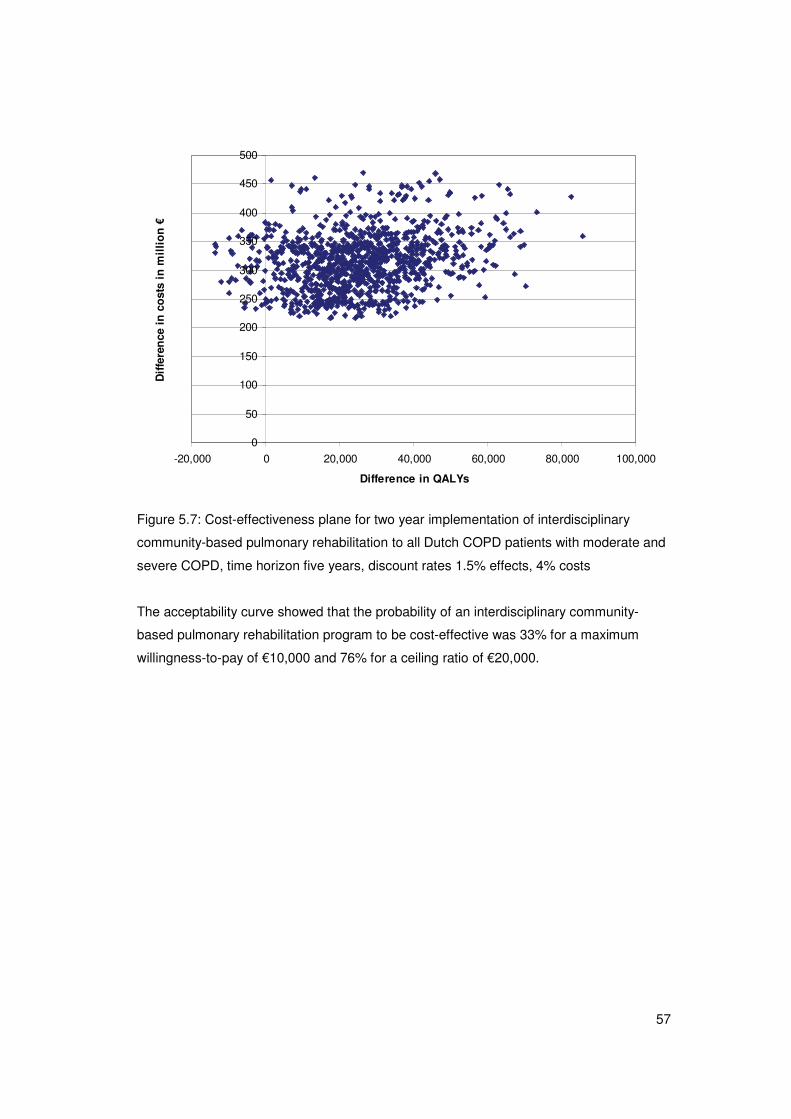
57
0
50
100
150
200
250
300
350
400
450
500
-20,000 0 20,000 40,000 60,000 80,000 100,000
Difference in QALYs
Dif
fere
nce
in
co
sts
in m
illi
on
€
Figure 5.7: Cost-effectiveness plane for two year implementation of interdisciplinary
community-based pulmonary rehabilitation to all Dutch COPD patients with moderate and
severe COPD, time horizon five years, discount rates 1.5% effects, 4% costs
The acceptability curve showed that the probability of an interdisciplinary community-
based pulmonary rehabilitation program to be cost-effective was 33% for a maximum
willingness-to-pay of €10,000 and 76% for a ceiling ratio of €20,000.
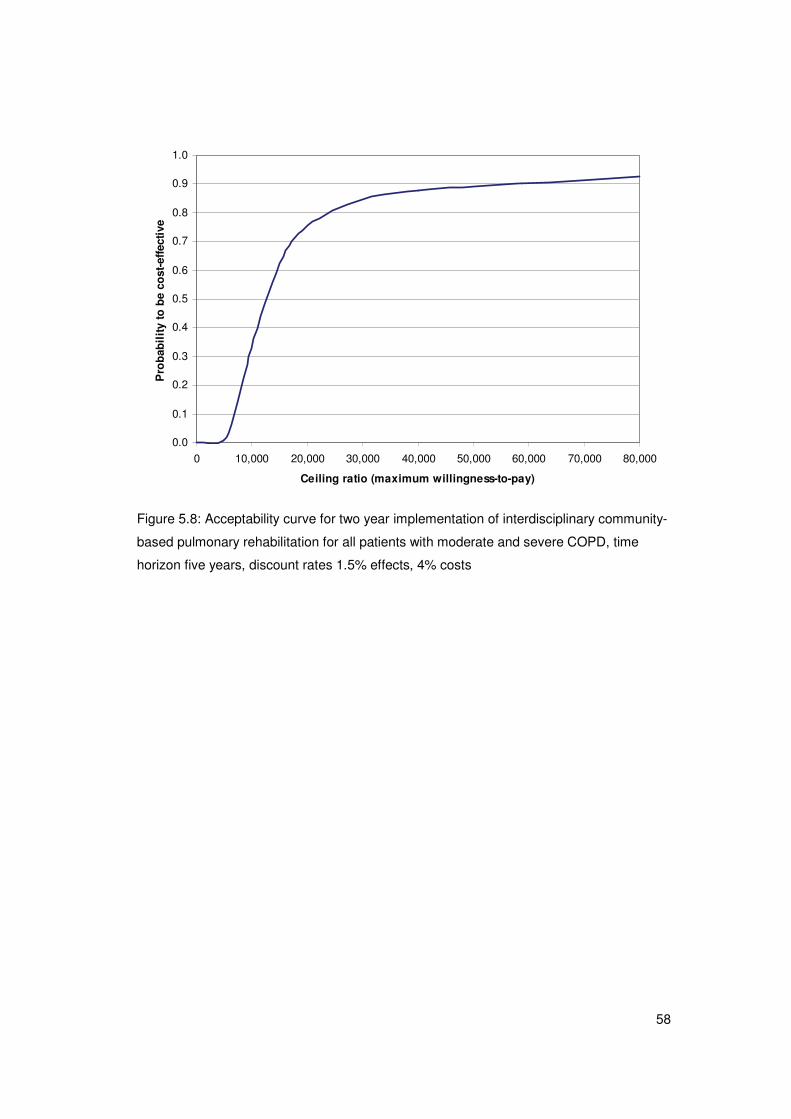
58
0.0
0.1
0.2
0.3
0.4
0.5
0.6
0.7
0.8
0.9
1.0
0 10,000 20,000 30,000 40,000 50,000 60,000 70,000 80,000
Ceiling ratio (maximum willingness-to-pay)
Pro
bab
ilit
y to
be
cost
-eff
ecti
ve
Figure 5.8: Acceptability curve for two year implementation of interdisciplinary community-
based pulmonary rehabilitation for all patients with moderate and severe COPD, time
horizon five years, discount rates 1.5% effects, 4% costs
59
6. Discussion
This study aimed at improving our previously published COPD model by including
exacerbations and making the model stochastic. To illustrate the potential of the model
four different COPD interventions were evaluated. The outcomes of these so-called
scenario analyses were only illustrative and no definite conclusions can be drawn from the
results for the following two reasons. For three scenario analyses short-term effectiveness
used to fill the model was based on one study, i.e. the TORCH trial [36] or the INTERCOM
trial [42]. To obtain more representative results effectiveness should be based on
systematic reviews as for the smoking cessation scenario [38]. Second, we did not take
into account realistic percentages of patients receiving the interventions, but applied the
effects to all Dutch moderate or severe COPD patients or all smoking COPD patients.
This is not realistic as for instance in the smoking cessation intervention, not all smoking
COPD patients are willing to participate in a smoking cessation intervention. The
percentage of smoking COPD patients reporting a willingness to stop smoking within six
months is about fifty percent [43,44]. The same applies to the pulmonary rehabilitation
scenario as not all moderate and severe COPD patients are eligible for such a program.
For example, the INTERCOM program was indicated for patients with an impaired
exercise capacity, only. To give more realistic estimates of the results in absolute
numbers, reliable estimates of the percentage of patients using the interventions would be
needed. These percentages however, do not substantially affect the estimates of the cost
per QALY gained or the cost per exacerbation avoided. A different indication however,
does affect the cost-effectiveness.
By choosing four completely different scenarios we tried to emphasize that the extended
model can be used to evaluate a wide range of interventions. The model can be used to
evaluate interventions that have an effect on lung function decline, quality of life, mortality
and/or the frequency and severity of exacerbations. In our scenario analyses, both
pharmacotherapies are assumed to affect disease progression, exacerbation frequency
and all-cause mortality. The smoking cessation intervention is assumed to affect disease
progression only. Indirectly, this affects mortality as patients reach the more severe stages
of COPD later than they would if they would not have stopped smoking. Mortality is also
directly reduced because within each severity stage smokers who quit get the lower
mortality risk of former smokers. A possible positive effect of smoking cessation on
exacerbation frequency could have been included in the scenario analysis, but no data
are available which could be used as input for the model. The third type of scenario
analysis, implementation of a pulmonary rehabilitation program, was assumed to have an
60
effect on quality of life. The model can also assess the impact of smoking cessation in the
general population on COPD incidence. However, the current analysis was restricted to a
cohort analysis among COPD patients already diagnosed.
Three different aspects with respect to the intervention scenarios should be kept in mind
when comparing the cost-effectiveness outcomes of the four scenario analyses with each
other. These aspects have a substantial impact on the absolute numbers of exacerbations
avoided, QALYs gained, intervention costs and savings in COPD-related healthcare costs
but also on the cost-effectiveness ratios. First, due to the different types of interventions
used, the most realistic time horizon to use was different for each intervention. For
pharmacotherapies ten years seemed a realistic time horizon, while for smoking cessation
a ten-year time horizon was relatively short as the annual gain in QALYs was maximal
around ten years. For pulmonary rehabilitation a ten-year time horizon is too long and a
five-year time horizon seemed more appropriate. Second, the duration of implementation
was different for all interventions. For pharmacotherapies we assumed that both ICS and
LABA/ICS were used as maintenance therapy for the whole time horizon, i.e. continuous
implementation. For the smoking cessation scenario however, we only used an
implementation period of one year because it is not realistic to assume that all COPD
patients receive smoking cessation interventions repeatedly each year. The scenario on
pulmonary rehabilitation was based on a two-year trial, but we assumed the quality of life
to be improved for three years. Finally, the patient population to which the intervention
was offered was different for the smoking cessation scenario. Both scenarios on
pharmacotherapies and pulmonary rehabilitation are assumed to be implemented for all
moderate and severe patients (n=227,600), while the smoking cessation intervention was
assumed to be given to all smoking patients, regardless of their disease severity
(n=97,100). The shorter duration of the implementation period and the smaller patient
population to which the intervention was offered explains why for example the absolute
gain in QALYs in the smoking cessation scenario was substantially lower.
For all four scenario analyses we performed extensive one-way sensitivity analyses on the
new exacerbation-related model parameters and on parameters for which a probabilistic
sensitivity analysis is not appropriate, such as discount rates. One-way sensitivity
analyses on the model parameters that were already included in the 2005 version of the
model, such as the estimated severity distribution of the COPD population at baseline, the
decline in lung function and mortality were performed previously [1]. In the 2005 version
the distribution of the incidence over the severity stages had the largest influence on the
projections but as the current scenario analyses are based on a cohort assuming no new
61
incidence, the distribution of the incidence plays no role in the current analyses. As the
decline in FEV1% predicted is the parameter defining disease progression, a very
important parameter in our model, we also included a one-way sensitivity analysis on this
parameter. In the 2005 version of the model, a 10% lower or higher annual decline in
FEV1% predicted had a moderate influence on the projections of the prevalence and costs
over twenty five years. In the current version comparing intervention scenarios with the
reference scenario the sensitivity analyses on decline did not have a large influence. For
all four scenarios the time horizon chosen had the largest influence on the results. For the
scenarios on pharmacotherapy and smoking cessation baseline exacerbation frequencies
also influenced the results substantially. The latter however are well-based estimates
obtained from a systemic review (see Appendix B). For the smoking cessation
intervention, a lower stop rate for usual care also influenced the cost per QALY. However,
because of the lack of studies reflecting usual care with respect to smoking cessation in
COPD, the abstinence rate of usual care used in the sensitivity analyses was based on
only one study.
Compared to the 2005 model, the extended model can generate uncertainty around the
estimated results using probabilistic sensitivity analyses. The overall uncertainty around
the estimates of the outcomes was relatively limited as in almost all cost-effectiveness
planes all model iterations fell in one single quadrant, the north-east quadrant, indicating
more effect but higher costs. Although the individual uncertainty around the gain in QALYs
and the costs was substantial, the positive correlation between effects and costs led to a
smaller uncertainty around the incremental cost-effectiveness ratio than would be
expected based on the uncertainty around the costs and effects alone. The uncertainty
may also be reduced by the assumption of monotonicity that was applied to the utility
values per GOLD stage and the costs per GOLD stage. For utility values for example this
means that in each simulation the randomly drawn value for the utility weight for mild
COPD needed to be higher than the randomly random drawn values for the utility weights
for moderate and the value for moderate COPD needs to be higher then the value for
severe COPD etc. Monotonicity was also indirectly included for the exacerbation
frequencies as these were based on a regression equation. The impact of the assumption
of monotonicity on the uncertainty needs to be explored in a future probabilistic sensitivity
analysis without this assumption. However, this requires an adjustment of the structure of
the model. Finally uncertainty is also influenced by the fact that we did not consider
structural model uncertainty. A decrease in number of severe exacerbations for example
always results in a reduction of the case fatality. The same is true for a reduction in
62
exacerbation frequency which always results in a gain in utility. However, assumptions like
this are medically very plausible.
A limitation of our model is of course that the severity and the progression of COPD are
only defined by lung function, i.e. FEV1% predicted. In real life, the severity of COPD is not
only determined by the degree of airflow limitation, but also by the severity of symptoms,
especially breathlessness, the level of exercise impairment and the existence of co-
morbidities [4]. Celli et al showed that the BODE index, a simple multidimensional grading
system using BMI, degree of airflow obstruction, dyspnea and exercise as parameters,
was a better predictor of mortality in COPD patients than FEV1 alone [45]. But also other
composite measures, such as the DOSE ( =Dyspnea, airflow Obstruction, Smoking status,
Exacerbation frequency) and the ADO (=Age, Dyspnea, airflow Obstruction) seem to be
better predictors of disease severity [46,47]. The same is true for disease progression.
Other factors than the decline in lung function also influence the progression of the COPD
[48]. However, parameters used in the BODE index for example are not all registered at
general practices and in hospitals and therefore input data representative for the Dutch
COPD population specified by BODE score are very difficult or impossible to obtain. For
reasons of availability and simplicity the progression of COPD in the model is therefore
only assumed to be dependent on the decline in FEV1% predicted, which in turn depends
on gender, age, smoking status and FEV1% predicted.
Up to now, six different COPD models, including our 2005 COPD model have been
published [1,24,31,49-51]. All existing models are Markov models and comparable with
respect to COPD severity based on FEV1% predicted, progression based on lung function
decline, inclusion of exacerbations, distinction between at least severe and non-severe
exacerbations and costs and utilities depending on severity stage and exacerbation
frequency. Differences between the models are among others the number of COPD
severity stages, inclusion of incidence and the allowance of backward transitions.
Furthermore, some of the models are probabilistic [1,31,50], while others are not. Only the
BOLD model described by Nielsen et al [51] and our model [1] are population-based
models, representative for a total nationwide COPD population. However, the model of
Nielsen et al is not stochastic. As our model is a probabilistic population-based model that
includes new incidence, but can also be used for cohort analysis, it can be used to
evaluate a wide range of interventions and assess the uncertainty around the results.
63
7. Conclusions
The updated and adapted model described in this report is now well equipped to provide
decision support with information about long-term health effects, costs and cost-
effectiveness of policy scenarios. Moreover it provides insight into the uncertainty of the
outcomes.
The model is innovative in that it combines modelling the incidence of COPD with the
course of disease. This allows the identification of the most cost-effective interventions
within the whole spectrum from prevention to care. Up to now this was impossible,
because only fragmented information exists on the cost-effectiveness of COPD
interventions. Moreover the information available is usually incomparable because of
methodological differences. The current model also allows comparing interventions of
different intensity and target group. It may stress the need for integrated approaches,
since single programs will probably not reduce the burden of COPD sufficiently on a
nationwide scale.
The model has been developed without any industry support (funded by the RIVM, the
Netherlands Asthma Foundation, the Dutch Ministry of Health, Welfare and Sports and the
Erasmus University), and hence provides an independent tool for evaluation.

64
65
References
1 Hoogendoorn M, Rutten-van Molken MP, Hoogenveen RT, et al. A dynamic population
model of disease progression in COPD. Eur Respir J. 2005;26 (suppl 2):223-33.
2 Hoogendoorn M, Feenstra TL, Rutten-van Molken MP. [Projections of future resource
use and the costs of asthma and COPD in the Netherlands]. Ned Tijdschr Geneeskd.
2006;150 (suppl 22):1243-50.
3 Rutten-van Molken M. Raising the awareness: projecting the future burden of COPD
with the BOLD model. Eur Respir J. 2009;34 (suppl 4):787-789.
4 Rodriguez Roisin R, Rabe KF, Anzueto A, et al. Global Inititiative for Chronic
Obstructive Lung Disease. Workshop Report: Global Strategy for the Diagnosis,
Management and Prevention of COPD: updated 2008. 2008;:Made available at
www.goldcopd.com (March, 2009).
5 Seemungal TA, Donaldson GC, Paul EA, et al. Effect of exacerbation on quality of life in
patients with chronic obstructive pulmonary disease. Am J Respir Crit Care Med.
1998;157 (suppl 5 Pt 1):1418-22.
6 Miravitlles M, Ferrer M, Pont A, et al. Effect of exacerbations on quality of life in patients
with chronic obstructive pulmonary disease: a 2 year follow up study. Thorax. 2004;59
(suppl 5):387-95.
7 Llor C, Molina J, Naberan K, et al. Exacerbations worsen the quality of life of chronic
obstructive pulmonary disease patients in primary healthcare. Int J Clin Pract. 2008;62
(suppl 4):585-92.
8 Oostenbrink JB, Rutten-van Molken MP. Resource use and risk factors in high-cost
exacerbations of COPD. Respir Med. 2004;98 (suppl 9):883-91.
9 Simoens S, Decramer M. Pharmacoeconomics of the management of acute
exacerbations of chronic obstructive pulmonary disease. Expert Opin Pharmacother.
2007;8 (suppl 5):633-648.
10 O'Reilly JF, Williams AE, Rice L. Health status impairment and costs associated with
COPD exacerbation managed in hospital. Int J Clin Pract. 2007;61 (suppl 7):1112-20.
66
11 Kanner RE, Anthonisen NR, Connett JE. Lower respiratory illnesses promote FEV(1)
decline in current smokers but not ex-smokers with mild chronic obstructive pulmonary
disease: results from the lung health study. Am J Respir Crit Care Med. 2001;164 (suppl
3):358-64.
12 Donaldson GC, Seemungal TA, Bhowmik A, et al. Relationship between exacerbation
frequency and lung function decline in chronic obstructive pulmonary disease. Thorax.
2002;57 (suppl 10):847-52.
13 Kanner RE, D. RA,Jr, Klauber MR, et al. Variables associated with changes in
spirometry in patients with obstructive lung diseases. Am J Med. 1979;67 (suppl 1):44-50.
14 McCrory DC, Brown C, Gelfand SE, et al. Management of acute exacerbations of
COPD: a summary and appraisal of published evidence. Chest. 2001;119 (suppl 4):1190-
1209.
15 Andersson F, Borg S, Jansson SA, et al. The costs of exacerbations in chronic
obstructive pulmonary disease (COPD). Respir Med. 2002;96 (suppl 9):700-8.
16 Briggs AH. Handling uncertainty in cost-effectiveness models. Pharmacoeconomics.
2000;17 (suppl 5):479-500.
17 U.S. Department of Health and Human Services. The Health Benefits of Smoking
Cessation. 1990;DHHS Publication No. (CDC) 90-8416.
18 van Oers JAMr. Gezondheid op koers? Volksgezondheid Toekomst Verkenning (VTV).
2002;.
19 Hoogendoorn M, Feenstra TL, Schermer TR, et al. Severity distribution of chronic
obstructive pulmonary disease (COPD) in Dutch general practice. Respir Med. 2006;100
(suppl 1):83-6.
20 Cazzola M, MacNee W, Martinez FJ, et al. Outcomes for COPD pharmacological trials:
from lung function to biomarkers. Eur Respir J. 2008;31 (suppl 2):416-69.
21 Makris D, Moschandreas J, Damianaki A, et al. Exacerbations and lung function
decline in COPD: new insights in current and ex-smokers. Respir Med. 2007;101 (suppl
6):1305-12.
67
22 Spencer S, Calverley PM, Burge PS, et al. Impact of preventing exacerbations on
deterioration of health status in COPD. Eur Respir J. 2004;23 (suppl 5):698-702.
23 Celli BR, Thomas NE, Anderson JA, et al. Effect of pharmacotherapy on rate of decline
of lung function in chronic obstructive pulmonary disease: results from the TORCH study.
Am J Respir Crit Care Med. 2008;178 (suppl 4):332-8.
24 Borg S, Ericsson A, Wedzicha J, et al. A computer simulation model of the natural
history and economic impact of chronic obstructive pulmonary disease. Value Health.
2004;7 (suppl 2):153-67.
25 Paterson C, Langan CE, McKaig GA, et al. Assessing patient outcomes in acute
exacerbations of chronic bronchitis: the measure your medical outcome profile (MYMOP),
medical outcomes study 6-item general health survey (MOS-6A) and EuroQol (EQ-5D).
Qual Life Res. 2000;9 (suppl 5):521-7.
26 Dolan P. Modeling valuations for EuroQol health states. Med Care. 1997;35 (suppl
11):1095-108.
27 Goossens LMA, Nivens C, Monz BU, et al. Is the EQ-5D responsive to recovery from a
moderate COPD exacerbation? ISPOR, European Annual Congress 2008, Athens.
2008;:PRS23.
28 Hoogendoorn M, Feenstra TL, Rutten-van Molken MP. [Projections of future resource
use and the costs of asthma and COPD in the Netherlands]. Ned Tijdschr Geneeskd.
2006;150 (suppl 22):1243-50.
29 Centraal Bureau voor de Statistiek (Statistics Netherlands). 2007;.
30 Steuten L, Vrijhoef B, Van Merode F, et al. Evaluation of a regional disease
management programme for patients with asthma or chronic obstructive pulmonary
disease. Int J Qual Health Care. 2006;18 (suppl 6):429-436.
31 Oostenbrink JB, Rutten-van Molken MP, Monz BU, et al. Probabilistic Markov model to
assess the cost-effectiveness of bronchodilator therapy in COPD patients in different
countries. Value Health. 2005;8 (suppl 1):32-46.
32 van der Lucht F, Polder JJ. Van gezond naar beter. Kernrapport van de
Volksgezondheid Toekomst Verkenning VTV-2010. version 1.0, 25 maart 2010;.
68
33 STIVORO. Roken, de harde feiten: Volwassen 2007. 2007;.
34 STIVORO. Roken, de harde feiten: Volwassen 2003. 2003;.
35 Wolfram Research I. Mathematica Edition: Version 7.0. Champaign, Illinois: Wolfram
Research, Inc. 2008.
36 Calverley PM, Anderson JA, Celli B, et al. Salmeterol and fluticasone propionate and
survival in chronic obstructive pulmonary disease. N Engl J Med. 2007;356 (suppl 8):775-
89.
37 Pharmacotherapeutic Compass. 2010;:www.medicijnkosten.nl.
38 Hoogendoorn M, Feenstra TL, Hoogenveen RT, et al. Long-term effectiveness and
cost-effectiveness of smoking cessation interventions in patients with chronic obstructive
pulmonary disease. Thorax.:Accepted.
39 Scanlon PD, Connett JE, Waller LA, et al. Smoking cessation and lung function in mild-
to-moderate chronic obstructive pulmonary disease. The Lung Health Study. Am J Respir
Crit Care Med. 2000;161 (suppl 2 Pt 1):381-90.
40 Hoogendoorn M, van Wetering CR, Schols AM, et al. Is INTERdisciplinary
COMmunity-based COPD management (INTERCOM) cost-effective? Eur Respir J.
2010;35 (suppl 1):79-87.
41 Rodenburg-van Dieten HEM. Richtlijnen voor farmaco-economisch onderzoek;
evaluatie en actualisatie. 2005;.
42 van Wetering CR, Hoogendoorn M, Mol SJ, et al. Short- and long-term efficacy of a
community-based COPD management programme in less advanced COPD: a
randomised controlled trial. Thorax. 2010;65 (suppl 1):7-13.
43 Jimenez-Ruiz CA, Masa F, Miravitlles M, et al. Smoking characteristics: differences in
attitudes and dependence between healthy smokers and smokers with COPD. Chest.
2001;119 (suppl 5):1365-70.
44 Hilberink SR, Jacobs JE, Bottema BJ, et al. Smoking cessation in patients with COPD
in daily general practice (SMOCC): six months' results. Prev Med. 2005;41 (suppl 5-
6):822-7.
69
45 Celli BR, Cote CG, Marin JM, et al. The body-mass index, airflow obstruction, dyspnea,
and exercise capacity index in chronic obstructive pulmonary disease. N Engl J Med.
2004;350 (suppl 10):1005-12.
46 Jones RC, Donaldson GC, Chavannes NH, et al. Derivation and validation of a
composite index of severity in chronic obstructive pulmonary disease: the DOSE Index.
Am J Respir Crit Care Med. 2009;180 (suppl 12):1189-1195.
47 Puhan MA, Garcia-Aymerich J, Frey M, et al. Expansion of the prognostic assessment
of patients with chronic obstructive pulmonary disease: the updated BODE index and the
ADO index. Lancet. 2009;374 (suppl 9691):704-711.
48 Decramer M, Gosselink R, Rutten-Van Molken M, et al. Assessment of progression of
COPD: report of a workshop held in Leuven, 11-12 March 2004. Thorax. 2005;60 (suppl
4):335-342.
49 Sin DD, Golmohammadi K, Jacobs P. Cost-effectiveness of inhaled corticosteroids for
chronic obstructive pulmonary disease according to disease severity. Am J Med.
2004;116 (suppl 5):325-31.
50 Spencer M, Briggs AH, Grossman RF, et al. Development of an economic model to
assess the cost effectiveness of treatment interventions for chronic obstructive pulmonary
disease. Pharmacoeconomics. 2005;23 (suppl 6):619-37.
51 Nielsen R, Johannessen A, Benediktsdottir B, et al. Present and future costs of COPD
in Iceland and Norway: results from the BOLD study. Eur Respir J. 2009;34 (suppl 4):850-
857.

70
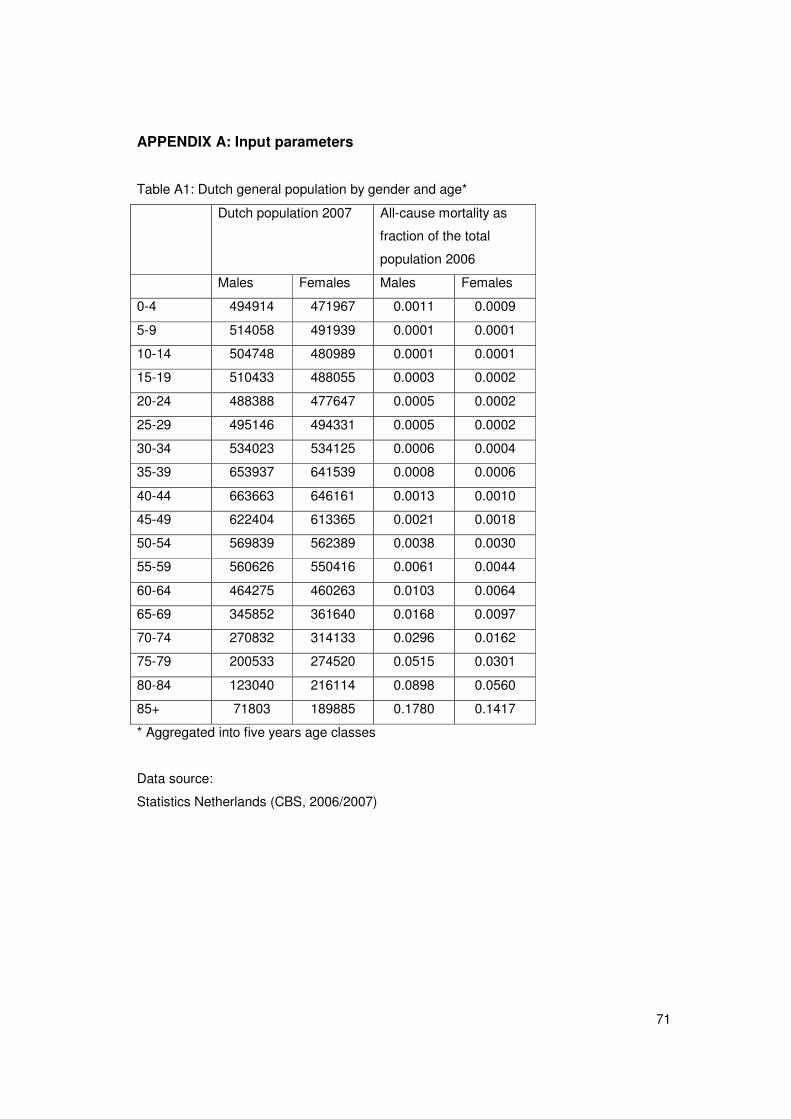
71
APPENDIX A: Input parameters
Table A1: Dutch general population by gender and age*
Dutch population 2007 All-cause mortality as
fraction of the total
population 2006
Males Females Males Females
0-4 494914 471967 0.0011 0.0009
5-9 514058 491939 0.0001 0.0001
10-14 504748 480989 0.0001 0.0001
15-19 510433 488055 0.0003 0.0002
20-24 488388 477647 0.0005 0.0002
25-29 495146 494331 0.0005 0.0002
30-34 534023 534125 0.0006 0.0004
35-39 653937 641539 0.0008 0.0006
40-44 663663 646161 0.0013 0.0010
45-49 622404 613365 0.0021 0.0018
50-54 569839 562389 0.0038 0.0030
55-59 560626 550416 0.0061 0.0044
60-64 464275 460263 0.0103 0.0064
65-69 345852 361640 0.0168 0.0097
70-74 270832 314133 0.0296 0.0162
75-79 200533 274520 0.0515 0.0301
80-84 123040 216114 0.0898 0.0560
85+ 71803 189885 0.1780 0.1417
* Aggregated into five years age classes
Data source:
Statistics Netherlands (CBS, 2006/2007)
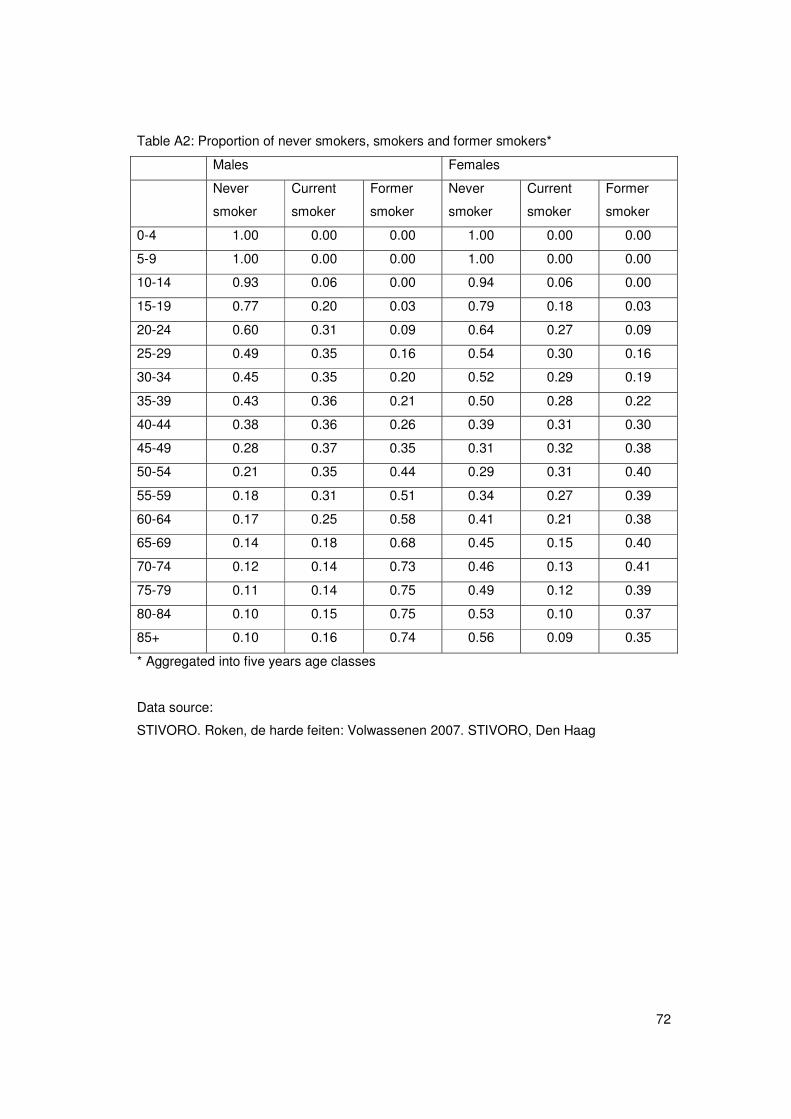
72
Table A2: Proportion of never smokers, smokers and former smokers*
Males Females
Never
smoker
Current
smoker
Former
smoker
Never
smoker
Current
smoker
Former
smoker
0-4 1.00 0.00 0.00 1.00 0.00 0.00
5-9 1.00 0.00 0.00 1.00 0.00 0.00
10-14 0.93 0.06 0.00 0.94 0.06 0.00
15-19 0.77 0.20 0.03 0.79 0.18 0.03
20-24 0.60 0.31 0.09 0.64 0.27 0.09
25-29 0.49 0.35 0.16 0.54 0.30 0.16
30-34 0.45 0.35 0.20 0.52 0.29 0.19
35-39 0.43 0.36 0.21 0.50 0.28 0.22
40-44 0.38 0.36 0.26 0.39 0.31 0.30
45-49 0.28 0.37 0.35 0.31 0.32 0.38
50-54 0.21 0.35 0.44 0.29 0.31 0.40
55-59 0.18 0.31 0.51 0.34 0.27 0.39
60-64 0.17 0.25 0.58 0.41 0.21 0.38
65-69 0.14 0.18 0.68 0.45 0.15 0.40
70-74 0.12 0.14 0.73 0.46 0.13 0.41
75-79 0.11 0.14 0.75 0.49 0.12 0.39
80-84 0.10 0.15 0.75 0.53 0.10 0.37
85+ 0.10 0.16 0.74 0.56 0.09 0.35
* Aggregated into five years age classes
Data source:
STIVORO. Roken, de harde feiten: Volwassenen 2007. STIVORO, Den Haag
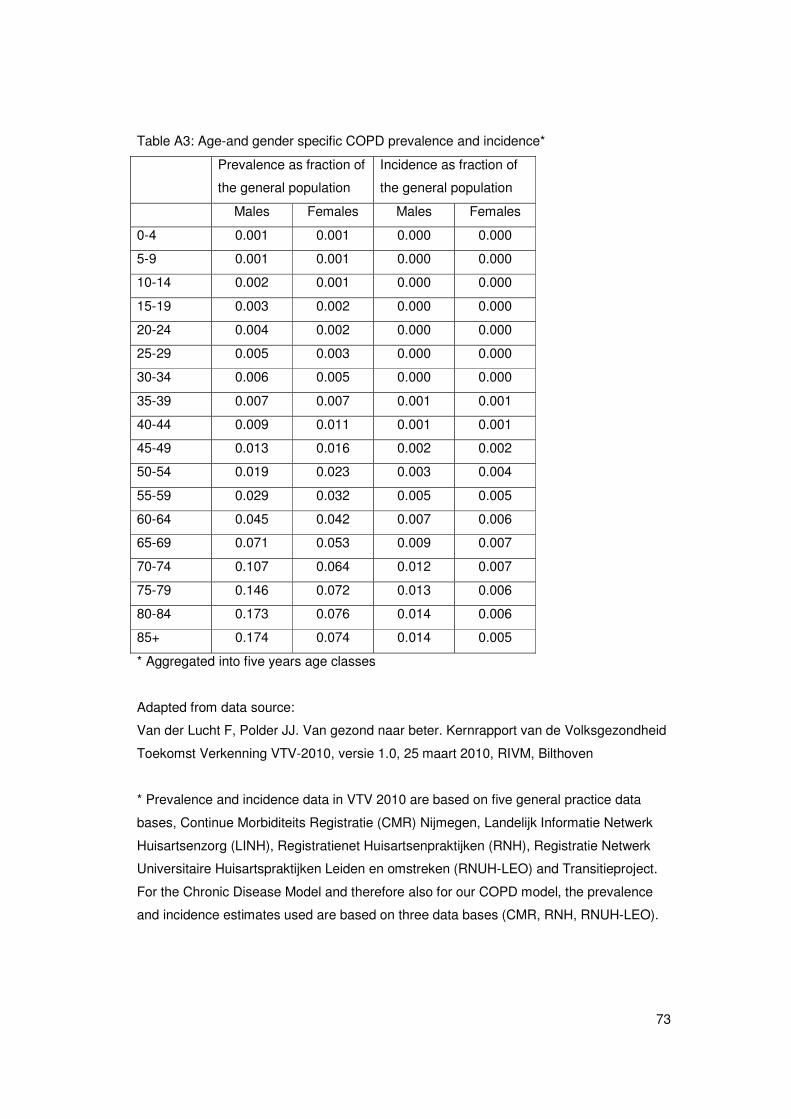
73
Table A3: Age-and gender specific COPD prevalence and incidence*
Prevalence as fraction of
the general population
Incidence as fraction of
the general population
Males Females Males Females
0-4 0.001 0.001 0.000 0.000
5-9 0.001 0.001 0.000 0.000
10-14 0.002 0.001 0.000 0.000
15-19 0.003 0.002 0.000 0.000
20-24 0.004 0.002 0.000 0.000
25-29 0.005 0.003 0.000 0.000
30-34 0.006 0.005 0.000 0.000
35-39 0.007 0.007 0.001 0.001
40-44 0.009 0.011 0.001 0.001
45-49 0.013 0.016 0.002 0.002
50-54 0.019 0.023 0.003 0.004
55-59 0.029 0.032 0.005 0.005
60-64 0.045 0.042 0.007 0.006
65-69 0.071 0.053 0.009 0.007
70-74 0.107 0.064 0.012 0.007
75-79 0.146 0.072 0.013 0.006
80-84 0.173 0.076 0.014 0.006
85+ 0.174 0.074 0.014 0.005
* Aggregated into five years age classes
Adapted from data source:
Van der Lucht F, Polder JJ. Van gezond naar beter. Kernrapport van de Volksgezondheid
Toekomst Verkenning VTV-2010, versie 1.0, 25 maart 2010, RIVM, Bilthoven
* Prevalence and incidence data in VTV 2010 are based on five general practice data
bases, Continue Morbiditeits Registratie (CMR) Nijmegen, Landelijk Informatie Netwerk
Huisartsenzorg (LINH), Registratienet Huisartsenpraktijken (RNH), Registratie Netwerk
Universitaire Huisartspraktijken Leiden en omstreken (RNUH-LEO) and Transitieproject.
For the Chronic Disease Model and therefore also for our COPD model, the prevalence
and incidence estimates used are based on three data bases (CMR, RNH, RNUH-LEO).
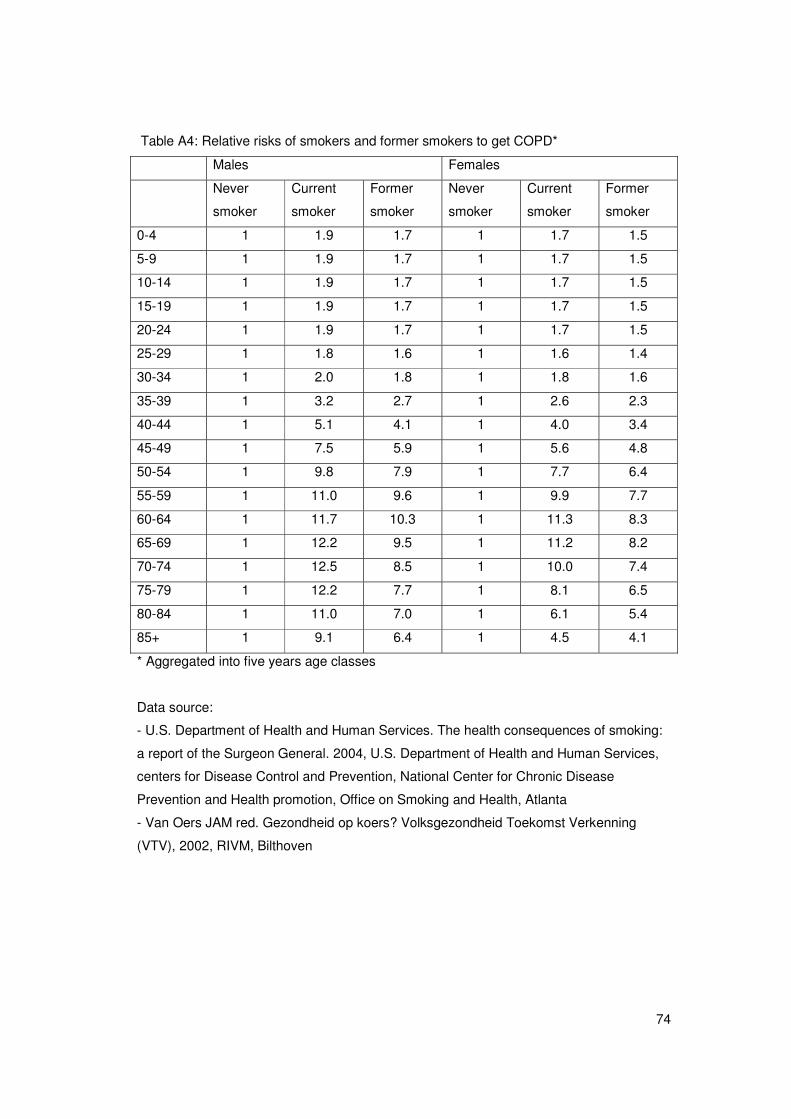
74
Table A4: Relative risks of smokers and former smokers to get COPD*
Males Females
Never
smoker
Current
smoker
Former
smoker
Never
smoker
Current
smoker
Former
smoker
0-4 1 1.9 1.7 1 1.7 1.5
5-9 1 1.9 1.7 1 1.7 1.5
10-14 1 1.9 1.7 1 1.7 1.5
15-19 1 1.9 1.7 1 1.7 1.5
20-24 1 1.9 1.7 1 1.7 1.5
25-29 1 1.8 1.6 1 1.6 1.4
30-34 1 2.0 1.8 1 1.8 1.6
35-39 1 3.2 2.7 1 2.6 2.3
40-44 1 5.1 4.1 1 4.0 3.4
45-49 1 7.5 5.9 1 5.6 4.8
50-54 1 9.8 7.9 1 7.7 6.4
55-59 1 11.0 9.6 1 9.9 7.7
60-64 1 11.7 10.3 1 11.3 8.3
65-69 1 12.2 9.5 1 11.2 8.2
70-74 1 12.5 8.5 1 10.0 7.4
75-79 1 12.2 7.7 1 8.1 6.5
80-84 1 11.0 7.0 1 6.1 5.4
85+ 1 9.1 6.4 1 4.5 4.1
* Aggregated into five years age classes
Data source:
- U.S. Department of Health and Human Services. The health consequences of smoking:
a report of the Surgeon General. 2004, U.S. Department of Health and Human Services,
centers for Disease Control and Prevention, National Center for Chronic Disease
Prevention and Health promotion, Office on Smoking and Health, Atlanta
- Van Oers JAM red. Gezondheid op koers? Volksgezondheid Toekomst Verkenning
(VTV), 2002, RIVM, Bilthoven
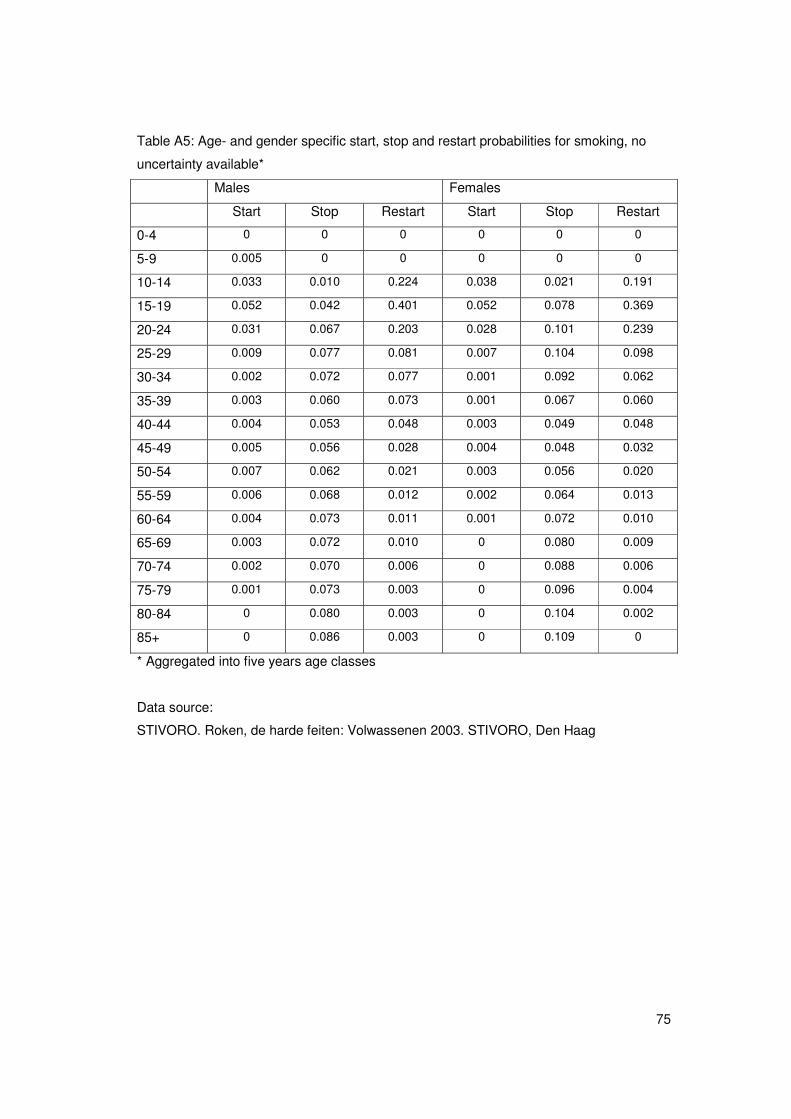
75
Table A5: Age- and gender specific start, stop and restart probabilities for smoking, no
uncertainty available*
Males Females
Start Stop Restart Start Stop Restart
0-4 0 0 0 0 0 0
5-9 0.005 0 0 0 0 0
10-14 0.033 0.010 0.224 0.038 0.021 0.191
15-19 0.052 0.042 0.401 0.052 0.078 0.369
20-24 0.031 0.067 0.203 0.028 0.101 0.239
25-29 0.009 0.077 0.081 0.007 0.104 0.098
30-34 0.002 0.072 0.077 0.001 0.092 0.062
35-39 0.003 0.060 0.073 0.001 0.067 0.060
40-44 0.004 0.053 0.048 0.003 0.049 0.048
45-49 0.005 0.056 0.028 0.004 0.048 0.032
50-54 0.007 0.062 0.021 0.003 0.056 0.020
55-59 0.006 0.068 0.012 0.002 0.064 0.013
60-64 0.004 0.073 0.011 0.001 0.072 0.010
65-69 0.003 0.072 0.010 0 0.080 0.009
70-74 0.002 0.070 0.006 0 0.088 0.006
75-79 0.001 0.073 0.003 0 0.096 0.004
80-84 0 0.080 0.003 0 0.104 0.002
85+ 0 0.086 0.003 0 0.109 0
* Aggregated into five years age classes
Data source:
STIVORO. Roken, de harde feiten: Volwassenen 2003. STIVORO, Den Haag
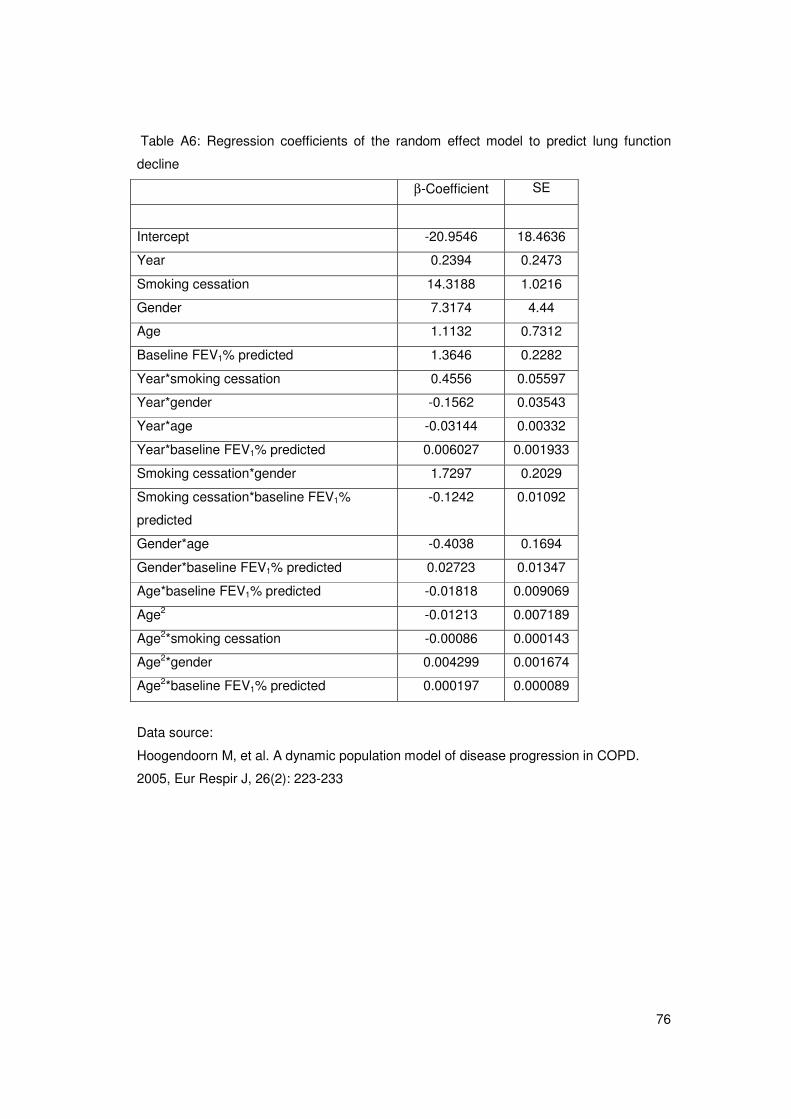
76
Table A6: Regression coefficients of the random effect model to predict lung function
decline
β-Coefficient SE
Intercept -20.9546 18.4636
Year 0.2394 0.2473
Smoking cessation 14.3188 1.0216
Gender 7.3174 4.44
Age 1.1132 0.7312
Baseline FEV1% predicted 1.3646 0.2282
Year*smoking cessation 0.4556 0.05597
Year*gender -0.1562 0.03543
Year*age -0.03144 0.00332
Year*baseline FEV1% predicted 0.006027 0.001933
Smoking cessation*gender 1.7297 0.2029
Smoking cessation*baseline FEV1%
predicted
-0.1242 0.01092
Gender*age -0.4038 0.1694
Gender*baseline FEV1% predicted 0.02723 0.01347
Age*baseline FEV1% predicted -0.01818 0.009069
Age2 -0.01213 0.007189
Age2*smoking cessation -0.00086 0.000143
Age2*gender 0.004299 0.001674
Age2*baseline FEV1% predicted 0.000197 0.000089
Data source:
Hoogendoorn M, et al. A dynamic population model of disease progression in COPD.
2005, Eur Respir J, 26(2): 223-233
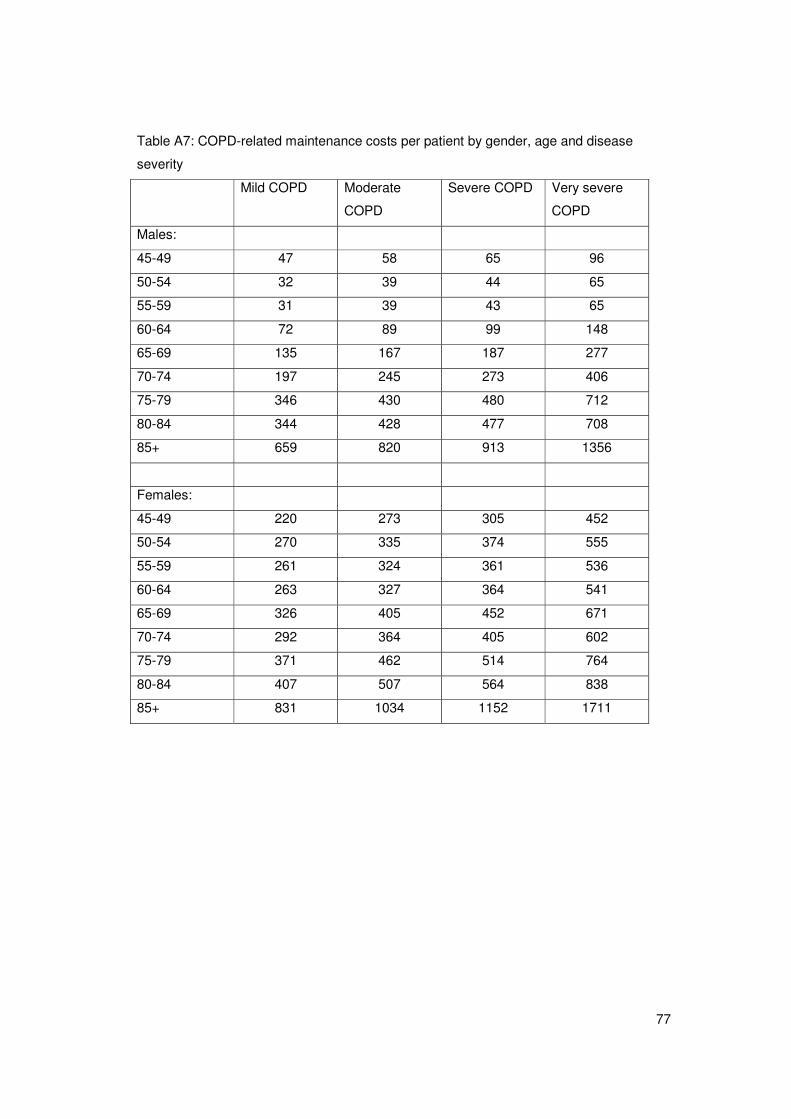
77
Table A7: COPD-related maintenance costs per patient by gender, age and disease
severity
Mild COPD Moderate
COPD
Severe COPD Very severe
COPD
Males:
45-49 47 58 65 96
50-54 32 39 44 65
55-59 31 39 43 65
60-64 72 89 99 148
65-69 135 167 187 277
70-74 197 245 273 406
75-79 346 430 480 712
80-84 344 428 477 708
85+ 659 820 913 1356
Females:
45-49 220 273 305 452
50-54 270 335 374 555
55-59 261 324 361 536
60-64 263 327 364 541
65-69 326 405 452 671
70-74 292 364 405 602
75-79 371 462 514 764
80-84 407 507 564 838
85+ 831 1034 1152 1711
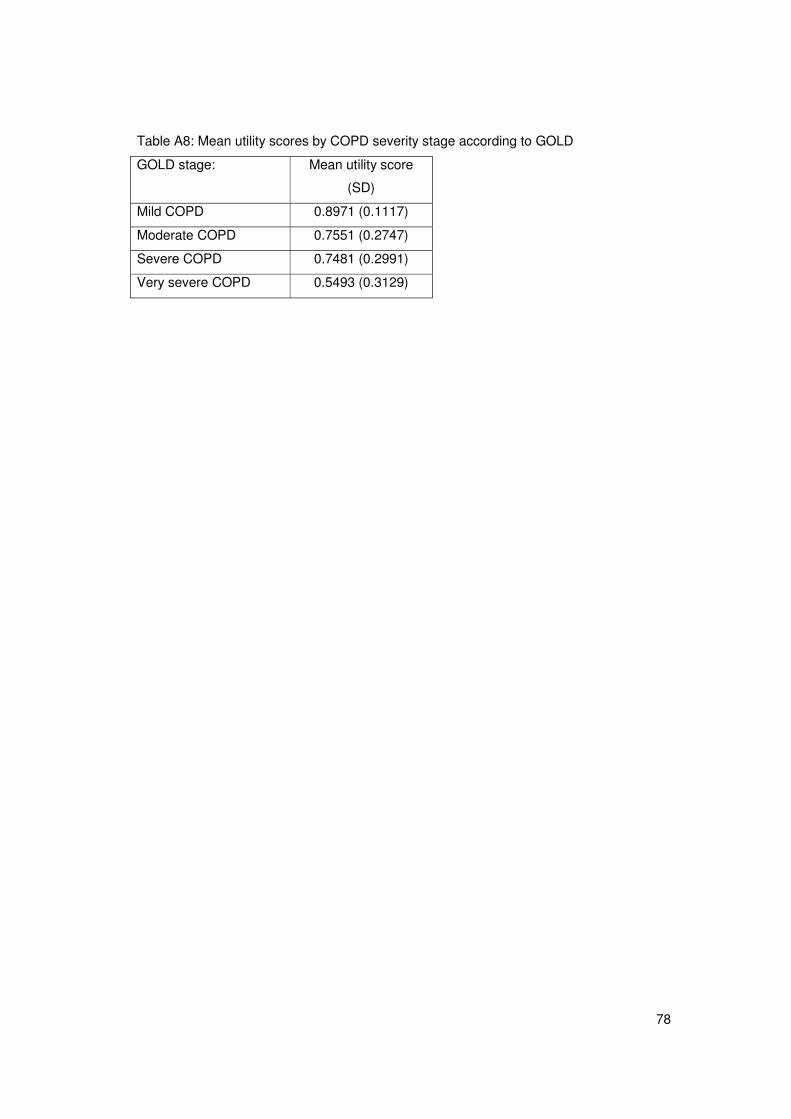
78
Table A8: Mean utility scores by COPD severity stage according to GOLD
GOLD stage: Mean utility score
(SD)
Mild COPD 0.8971 (0.1117)
Moderate COPD 0.7551 (0.2747)
Severe COPD 0.7481 (0.2991)
Very severe COPD 0.5493 (0.3129)
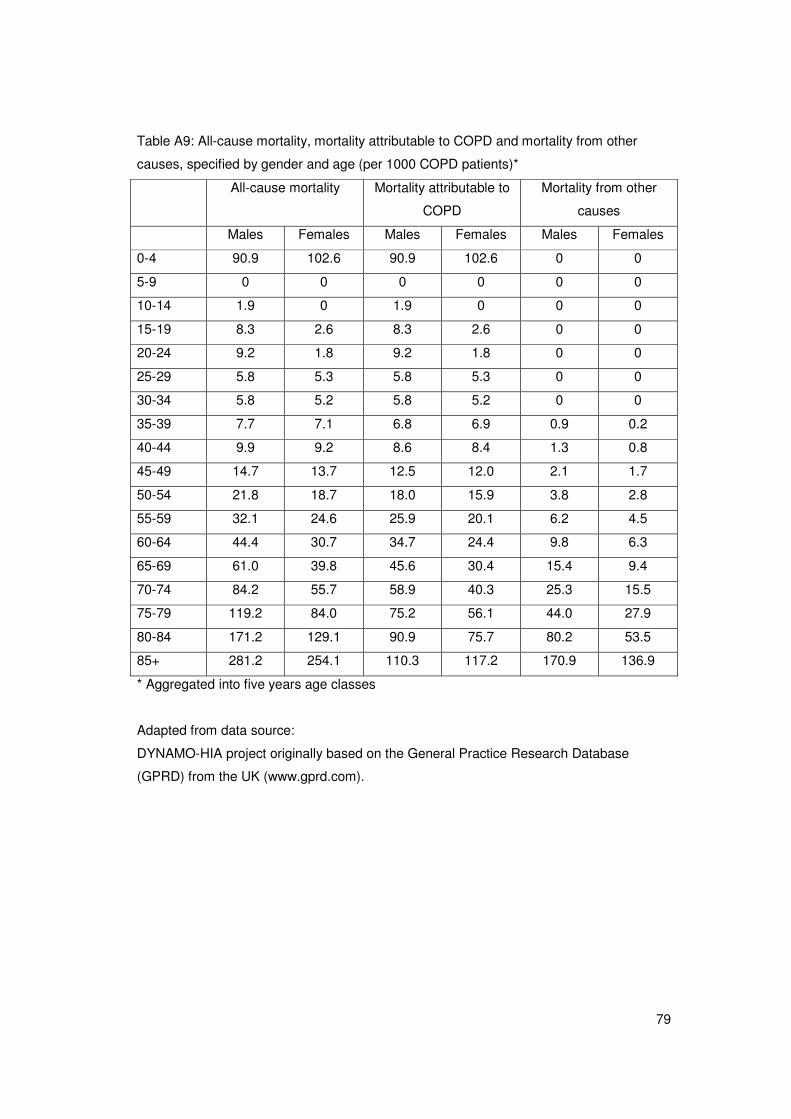
79
Table A9: All-cause mortality, mortality attributable to COPD and mortality from other
causes, specified by gender and age (per 1000 COPD patients)*
All-cause mortality Mortality attributable to
COPD
Mortality from other
causes
Males Females Males Females Males Females
0-4 90.9 102.6 90.9 102.6 0 0
5-9 0 0 0 0 0 0
10-14 1.9 0 1.9 0 0 0
15-19 8.3 2.6 8.3 2.6 0 0
20-24 9.2 1.8 9.2 1.8 0 0
25-29 5.8 5.3 5.8 5.3 0 0
30-34 5.8 5.2 5.8 5.2 0 0
35-39 7.7 7.1 6.8 6.9 0.9 0.2
40-44 9.9 9.2 8.6 8.4 1.3 0.8
45-49 14.7 13.7 12.5 12.0 2.1 1.7
50-54 21.8 18.7 18.0 15.9 3.8 2.8
55-59 32.1 24.6 25.9 20.1 6.2 4.5
60-64 44.4 30.7 34.7 24.4 9.8 6.3
65-69 61.0 39.8 45.6 30.4 15.4 9.4
70-74 84.2 55.7 58.9 40.3 25.3 15.5
75-79 119.2 84.0 75.2 56.1 44.0 27.9
80-84 171.2 129.1 90.9 75.7 80.2 53.5
85+ 281.2 254.1 110.3 117.2 170.9 136.9
* Aggregated into five years age classes
Adapted from data source:
DYNAMO-HIA project originally based on the General Practice Research Database
(GPRD) from the UK (www.gprd.com).

80
81
APPENDIX B: The association between lung function and exacerbation
frequency in patients with COPD (working paper)
Running title: Exacerbation frequency specified by COPD severity
Martine Hoogendoorn1, M.Sc.
Talitha L Feenstra2, 3, Ph.D.
Rudolf T. Hoogenveen2, M.Sc.
Maiwenn Al1, PhD
Maureen P.M.H. Rutten-van Mölken1, Ph.D.
1 Institute for Medical Technology Assessment (iMTA), Erasmus University, Rotterdam,
The Netherlands
2 Department for Prevention and Health Services Research, National Institute for Public
Health and the Environment (RIVM), Bilthoven, The Netherlands
3 Department of Epidemiology, University Medical Centre Groningen, Groningen, The
Netherlands
Correspondence and request for reprints:
M. Hoogendoorn, M.Sc.
Erasmus MC
Institute for Medical Technology Assessment
P.O. Box 1738
3000 DR Rotterdam
The Netherlands
Phone: *31 10 4088871
Fax: *31 10 4089081
Email: [email protected]
82
Abstract
Objectives: To quantify the relation between severity of COPD as expressed by GOLD
stage and the annual exacerbation frequency in patients with COPD.
Methods: We performed a systematic literature review for randomized controlled trials and
cohort studies reporting the exacerbation frequency in patients receiving usual care or
placebo. Annual frequencies were determined for the following outcomes: total
exacerbations defined by an increase use of health care (event-based), total
exacerbations defined by an increase of symptoms and severe exacerbations defined by
a hospitalization. The association between the mean FEV1% predicted of study
populations and the exacerbation frequencies was estimated using weighted log linear
regression with random effects. The regression equations were applied to the mean
FEV1% predicted for each GOLD stage to estimate the frequency per stage.
Results: 37 unique studies were found with 43 reports of the total exacerbation frequency
(event-based: 19, symptom-based: 24) and 14 reports of the frequency of severe
exacerbations. Annual event-based exacerbation frequencies per GOLD stage were
estimated at 0.82 (95%CI:0.46-1.49) for mild, 1.17 (0.93-1.50) for moderate, 1.61 (1.51-
1.74) for severe and 2.10 (1.51-2.94) for very severe COPD. Annual symptom-based
frequencies were 1.15 (95%CI:0.67-2.07), 1.44 (1.14-1.87), 1.76 (1.70-1.88) and 2.09
(1.57-2.82), respectively. For severe exacerbations, annual frequencies were 0.11
(95%CI:0.02-0.56), 0.16 (0.07-0.33), 0.22 (0.20-0.23) and 0.28 (0.14-0.63), respectively.
Study duration or type of study (cohort versus trial) did not significantly affect the
outcomes.
Conclusions: This study provides an estimate of the exacerbation frequency per GOLD
stage, which can be used for health economic and modeling purposes.
Key words: COPD, exacerbations, disease severity, GOLD, review, regression
83
Introduction:
The progression of chronic obstructive pulmonary disease (COPD) is often accompanied
by periods of increasing symptoms, such as dyspnea, cough and sputum production,
named exacerbations. Exacerbations are associated with an increase in mortality (1, 2)
and have a high impact on health-related quality of life as the number and severity of
exacerbations impairs the health status of a patient significantly (3-5). Exacerbations are
also associated with an increase in healthcare use and associated costs (6, 7), especially
in case of a hospitalization (8). Exacerbation frequency is therefore an important outcome
parameter for patients with COPD (9, 10).
Quantification of the average exacerbation frequency however, is difficult. Many studies
report the exacerbation frequency but results can not be compared directly as different
definitions are used, exacerbations are measured in different seasons (9) or data come
from different types of studies, e.g. clinical trials or cohort studies, each using specific
inclusion criteria (10). Especially the use of different definitions seems to have a large
influence. These definitions can roughly be divided in two groups: the symptom-based
definitions and the event-based definitions. Studies defining exacerbations as self-
reported changes in symptoms (symptom-based definition) generally result in higher
estimates than studies using event-based definitions, since the estimates also include the
exacerbations which are not presented to physicians (11). When symptoms are closely
monitored using diaries, these “unreported” exacerbations are thought to account for
about 50% of all exacerbations (4). Event-based definitions use more objective criteria,
such as doctor’s visit, the use of antibiotics and/or systemic steroids or hospitalization.
However, event-based definitions are sensitive to differences in treatment patterns
between settings. Besides the different criteria used to define an exacerbation, there is
also no general agreement on how to classify the severity of an exacerbation. Most
studies classify exacerbations based on the treatment required, increase of regular
medication, additional antibiotics and/or systemic corticosteroids or hospitalization (12).
Despite the difficulties in measuring exacerbations, the general pattern is that the
frequency of exacerbations increases with decreasing lung function (9, 10, 13). However,
as far as we know no studies quantified this relationship. The present study aimed to
quantify the relationship between the degree of airflow obstruction expressed as the
FEV1% predicted, and the annual exacerbation frequency, using previously published
data. The association was estimated separately for the two most important types of
definitions used, symptom-based and event-based and for total and severe exacerbations.
We also explored the impact of study duration and type of study, i.e. clinical trial or cohort
study, on this relationship. This study arose out of the need to estimate the average
exacerbation frequency for the different COPD severity stages as defined by GOLD that
84
were used as input parameters in a dynamic multistate, life table model (14, 15). As this
model aims to simulate the long-term cost-effectiveness of interventions which
successfully prevent exacerbations, the exacerbation frequency in patients receiving care
as usual was essential.
Methods
A systematic literature review was performed for randomized controlled trials and cohort
studies reporting the exacerbation frequency in patients receiving care as usual or
placebo. MEDLINE, EMBASE and the Cochrane database were searched using the key
words “chronic obstructive pulmonary disease” or COPD or “chronic bronchitis” in
combination with exacerbat* and the specification “cohort or survey or observation* or the
selection ”clinical trial”. Studies were included if they 1) were published after 1990, 2) had
a follow-up of at least three months, 3) used an event- or symptom-based definition for an
exacerbation and 4) included a group of patients that received either usual care or
placebo (e.g. the placebo arm of a long-acting bronchodilator trial or a combination
treatment trial). Studies that included a subgroup of COPD patients selected based on
other criteria than lung function were excluded (e.g. studies only including patients
admitted to hospital, studies on patients with an acute exacerbation at baseline).
Retrospective studies based on administrative or claims data were excluded because the
algorithms to identify exacerbations in these databases are often quite different from the
definitions used in prospective cohort studies or clinical trials. Finally cross-references of
the studies that met the in- and exclusion criteria were checked.
Primary outcomes
The three main outcomes of the study were the annual frequency of total exacerbations
using an event-based definition, the annual frequency of total exacerbations using a
symptom-based definition and the annual frequency of severe exacerbations as defined
by a hospitalization. One study could provide more than one estimate of the exacerbation
frequency by presenting separate rates for total and severe exacerbations or rates based
on both a symptom- and an event-based definition or by presenting rates by GOLD stage.
Data extraction
Because the comparator arm in our model needs to reflect minimal care, we only
extracted exacerbation data of the groups of patients that received either usual care or
placebo. The following data were extracted: percentage males, mean age, and mean lung
function in FEV1% predicted of the study population, follow-up time, definition of
85
exacerbation used (symptom- or event-based) and the annual exacerbation frequency. If
the mean FEV1 was only given in liters, the mean FEV1% predicted of the study
population was calculated based on other studies reporting both liters and percentages
predicted. If the exacerbation frequency was presented for different classes of the FEV1%
predicted and the within-class mean FEV1% predicted was not specified, the mean
FEV1% predicted was estimated based on the mean and the standard deviation of the
FEV1% predicted in the total population or it was assumed to be the middle FEV1%
predicted of that specific class.
Data on the exacerbation frequency were recalculated to annual exacerbation rates, if
necessary. The annual exacerbation rate was calculated by dividing the total number of
exacerbations by the total number of patient years using the assumption that drop-outs
count for half of the follow-up time.
Data analysis
As almost all studies only provided point estimates of exacerbation rates, uncertainty
around the exacerbation rates was estimated assuming the exacerbations being Poisson
distributed within each study. To quantify the relationship between the FEV1% predicted
and the annual exacerbation frequency, log linear random effect regression analysis was
performed using the logarithm of the annual exacerbation frequency as dependent
variable and the mean FEV1% predicted of the study as independent variable. This
regression analysis was performed using the S-plus routine glm for mixed-effects models
(16). Analyses were performed separately for total event-based, total symptom-based and
severe exacerbations. Retransformation of the logarithm of the exacerbations rates to
exacerbation rates was performed using a smearing factor, which was calculated using
the model fit residuals following the method of Duan et al (17, 18):
Smearing factor �= 1/n �1-n exp[exacerbationrate_observed -
exacerbationrate_predicted]
where n was the number of data points in the regression analysis. The relationship
between the annual exacerbation frequency and the FEV1% predicted was then:
Annual exacerbation frequency = � * exp[ a+b* FEV1% predicted]
� = smearing factor
a = intercept (estimated in the regression analysis)
b= coefficient for FEV1% predicted (estimated in the regression analysis)
86
This equation was used to calculate the annual exacerbation frequency in the four COPD
severity stages according to the GOLD classification (19) using a mean FEV1% predicted
of 90 for mild, 65 for moderate, 42 for severe and 23 for very severe COPD (20).
Uncertainty around the exacerbation rates per GOLD stage was estimated by Monte Carlo
simulation. That is, 1000 random draws were taken from the distribution of the intercept
and the coefficient for FEV1% predicted. Covariance between the two parameters was
taken into account by drawing random values for the coefficient for FEV1% predicted that
were dependent on the values drawn for the intercept. For each combination of intercept
and coefficient the accompanying smearing factor was calculated using the formula
described above. The mean FEV1% predicted per GOLD stage was then applied to each
of the 1000 combinations of intercept, coefficient for FEV1% predicted and smearing
factor, resulting in 1000 estimates of the exacerbation rate per GOLD stage. The 2.5%
and 97.5% percentiles of these 1000 estimates formed the 95% uncertainty interval.
Additional regression analyses were performed adding follow-up time (in months) and
type of study (cohort versus trial) to FEV1% predicted as dependent variables. The
analyses were performed with Splus 8.1 (TIBCO Spotfire S+ Version 8.1.1 HF-001 for
Microsoft Windows, 2008).
Results
The literature review resulted in 86 references of trials and cohort studies published after
1990 that seemed eligible based on the title. Of these 86 references that were obtained in
full another 44 studies were excluded because they did not present exacerbation
frequencies or numbers (n=13), were based on a selective subgroup of COPD patients
(n=11), were based on a cross-sectional study or on administrative or claims data (n=8),
had a follow-up less than 3 months (n=9) or used a deviant definition for an exacerbation
(n=3). The final 42 references referred to 37 unique studies, 28 trials (21-48) and 9 cohort
studies (3, 6, 49-55). This resulted in 43 estimates for the total exacerbation frequency
and 14 estimates of the frequency of severe exacerbations. Of the 43 estimates of the
total exacerbation frequency, 19 used the event-based definition and 24 the symptom-
based definition. Characteristics of all included studies with their annual exacerbation
rates are presented in Table B1.
Figure B1 shows the logarithm of the annual total and severe exacerbation frequency
plotted against the mean FEV1% predicted of the study with the estimated relation
between the two obtained from the regression analyses. Parameters of the relationship
between the mean FEV1% predicted of the study and the exacerbation frequency are
shown in Table B2. Lung function was a predictor of borderline significance for event-
87
based exacerbations only (p=0.053). Results for the mean exacerbation frequencies for
the different GOLD stages based on the regression equations are presented in Table B3.
Using an event-based definition the total exacerbation frequency was significantly higher
in patients with an FEV1% predicted below 50% compared to patients with an FEV1%
predicted above 50%.
Regression analyses with additional covariates showed that in general, no significant
effect of the duration of follow-up of the study or the type of study (cohort versus trial) was
found. Only for total exacerbations using the symptom-based definition the duration of
follow-up was of borderline significance with longer follow-up resulting in lower rates
(Table B4).
Discussion
Although many trials and cohort studies report on the important outcome, exacerbation
frequency, the association between lung function and exacerbation frequency is less often
investigated. The current study gathered the information contained in the literature and
combined it to an estimate of exacerbation frequency as a function of the FEV1%
predicted. The final estimates of the total exacerbation frequency per GOLD severity
stage using the event-based definition were 0.82 for mild, 1.17 for moderate, 1.61 for
severe and 2.10 for very severe COPD. The coefficient for lung function was of borderline
significance.
The reason we have not found a strong relation between lung function and exacerbation
frequency may be that regression on study summary estimates, as we did in this study,
has substantially less power than regression on patient-level data (56). There is likely to
be less variation in lung function across studies than in the patient-level data within
studies. By plotting the mean exacerbation frequency against the mean FEV1% predicted
of a particular study, the within study variation is not accounted for. The heterogeneity in
mean lung function between the studies in our review was relatively limited, especially for
severe exacerbations. The majority of studies had a mean FEV1% predicted between 35
and 60% and especially studies with a very low (<30%) and a very high mean FEV1%
predicted (>80%) were scarce or completely lacking.
In patient-level data the association of a lower FEV1% predicted resulting in higher
exacerbation frequencies is seen more clearly (6, 13, 54). Patient-level data on the
exacerbation frequency specified by subgroup of lung function are however limited. The
cohort study of Andersson et al, which was included in the review, was the only study
providing estimates for four COPD severity stages, using almost the same cut-off points
for the stages as the GOLD classification (6). The study used an event-based definition for

88
exacerbations and found an annual exacerbation frequency of 0.67 for mild, 0.70 for
moderate, 1.06 for severe and 2.56 for very severe COPD, which were lower than our
estimates, except for very severe COPD. Vestbo et al reported about the exacerbation
frequencies in several cohort studies and placebo-arms of trials in relation to the FEV1%
predicted and also found exacerbation frequencies below 1.0, for patients with an FEV1%
predicted above 50%. The average values for exacerbations for patients with an FEV1%
predicted between 40 and 50% ranged between 1 and 1.5, which was comparable with
our results (10). Burge et al showed the number of exacerbations per year in the placebo-
arm of the ISOLDE trial using an event-based definition and specified the frequency for
three lung function categories: <1.25, 1.25-1.54 and >1.54 liter (about comparable with
<45%, 44-55% and >55% predicted). Below 45% predicted a mean of 2.6 exacerbations
was found, while above >55% the average value was about 1.2 (13). From the above
described studies the general picture seems to be that above 50% predicted the total
annual exacerbation frequency is around or slightly below 1.0, while below 40-45%
predicted the exacerbation rate increases significantly, to about 2 or more exacerbations
per year. The results of our study showed the same picture.
In accordance with the general finding that using the symptom-based definition results in
higher estimates of the total exacerbation frequency, we found slightly higher estimates
for mild, moderate and severe COPD using the symptom-based definition compared to
the event-based definition. However, this difference was not significant and seemed to get
smaller with increasing severity of COPD.
We also did not see an effect of follow-up time. The mean follow-up in the studies in the
review was 14 months, ranging from 3 to 36 months. Exacerbations depend on the
season and are more likely to occur in the winter (3). According to recommendations 12,
studies therefore need to have a follow-up of at least twelve months to give reliable
estimates of the exacerbation frequency. Although we choose for a minimal follow-up of
three months to have more data points for especially the lowest and highest values of the
mean FEV1% predicted, the majority of studies, 89%, had a follow-up of at least six
months and 65% had a follow-up of at least one year. Conversion of exacerbation rates
from studies with a follow-up less than 12 months to annual rates may however have
overestimated or underestimated the exacerbation frequency, although we did not find a
significant difference between studies with a follow-up shorter and longer than 12 months.
No systematic difference was found between the cohort studies and trials. This indicates
that these selected trial populations seemed to be sufficiently representative for the COPD
population as seen in daily practice with regard to the exacerbation frequency.
In conclusion, the current study provided a well based estimate for the average relation
between the annual total and severe exacerbation frequency and FEV1% predicted in
89
COPD. Results were in line with the few studies reporting about this relation in patient-
level data. However, the general assumption that a lower FEV1% predicted is indeed
associated with a higher annual number of exacerbations was only true for total
exacerbations using an event-based definition.
Acknowledgement
This study was financially sponsored by the Netherlands Asthma Foundation (NAF:
3.4.06.059)
References
1. Patil SP, Krishnan JA, Lechtzin N, Diette GB. In-hospital mortality following acute
exacerbations of chronic obstructive pulmonary disease. Arch Intern Med.
2003;163(10):1180-6.
2. Fuso L, Incalzi RA, Pistelli R, et al. Predicting mortality of patients hospitalized for
acutely exacerbated chronic obstructive pulmonary disease. Am J Med. 1995;98(3):272-7.
3. Miravitlles M, Ferrer M, Pont A, et al. Effect of exacerbations on quality of life in patients
with chronic obstructive pulmonary disease: A 2 year follow up study. Thorax.
2004;59(5):387-95.
4. Seemungal TA, Donaldson GC, Paul EA, Bestall JC, Jeffries DJ, Wedzicha JA. Effect
of exacerbation on quality of life in patients with chronic obstructive pulmonary disease.
Am J Respir Crit Care Med. 1998;157(5 Pt 1):1418-22.
5. Spencer S, Calverley PM, Burge PS, Jones PW. Impact of preventing exacerbations on
deterioration of health status in COPD. Eur Respir J. 2004;23(5):698-702.
6. Andersson F, Borg S, Jansson SA, et al. The costs of exacerbations in chronic
obstructive pulmonary disease (COPD). Respir Med. 2002;96(9):700-8.
7. Oostenbrink JB, Rutten-van Molken MP. Resource use and risk factors in high-cost
exacerbations of COPD. Respir Med. 2004;98(9):883-91.
8. O'Reilly JF, Williams AE, Rice L. Health status impairment and costs associated with
COPD exacerbation managed in hospital. Int J Clin Pract. 2007;61(7):1112-20.
9. Donaldson GC, Wedzicha JA. COPD exacerbations .1: Epidemiology. Thorax.
2006;61(2):164-8.
10. Vestbo J. Clinical assessment, staging, and epidemiology of chronic obstructive
pulmonary disease exacerbations. Proc Am Thorac Soc. 2006;3(3):252-6.
11. Pauwels R, Calverley P, Buist AS, et al. COPD exacerbations: The importance of a
standard definition. Respir Med. 2004;98(2):99-107.
90
12. Cazzola M, MacNee W, Martinez FJ, et al. Outcomes for COPD pharmacological
trials: From lung function to biomarkers. Eur Respir J. 2008;31(2):416-69.
13. Burge S, Wedzicha JA. COPD exacerbations: Definitions and classifications. Eur
Respir J Suppl. 2003;41:46s-53s.
14. Feenstra TL, Van Genugten ML, Hoogenveen RT, Wouters EF, Rutten-van Molken
MP. The impact of aging and smoking on the future burden of chronic obstructive
pulmonary disease: A model analysis in the netherlands. Am J Respir Crit Care Med.
2001;164(4):590-6.
15. Hoogendoorn M, Rutten-van Molken MP, Hoogenveen RT, et al. A dynamic
population model of disease progression in COPD. Eur Respir J. 2005;26(2):223-33.
16. Ng ESW. A review of mixed-effects models in S-plu (version 6.2). . 2005:Available ata:
http://www.cmm.bristol.ac.uk/learning-traning/multilevel-m-software/reviewsplus.pdf.
17. Duan N. Smearing estimate: A nonparametric retransformation method. J Am Stat
Assoc. 1983;78(383):605--610.
18. Duan N, Manning WG, Morris CN, Newhouse JP. A comparison of aternative models
for the demand for medical care. Journal of Business & Economic Statistics.
1983;1(2):115-126.
19. Rodriguez Roisin R, Rabe KF, Anzueto A, et al. Global inititiative for chronic
obstructive lung disease. workshop report: Global strategy for the diagnosis, management
and prevention of COPD: Updated 2008. 2008:Made available at www.goldcopd.com
(March, 2009).
20. Hoogendoorn M, Feenstra TL, Schermer TR, Hesselink AE, Rutten-van Molken MP.
Severity distribution of chronic obstructive pulmonary disease (COPD) in dutch general
practice. Respir Med. 2006;100(1):83-6.
21. Monninkhof E, van der Valk P, van der Palen J, van Herwaarden C, Zielhuis G. Effects
of a comprehensive self-management programme in patients with chronic obstructive
pulmonary disease. Eur Respir J. 2003;22(5):815-20.
22. Coultas D, Frederick J, Barnett B, Singh G, Wludyka P. A randomized trial of two
types of nurse-assisted home care for patients with COPD. Chest. 2005;128(4):2017-24.
23. Rea H, McAuley S, Stewart A, Lamont C, Roseman P, Didsbury P. A chronic disease
management programme can reduce days in hospital for patients with chronic obstructive
pulmonary disease. Intern Med J. 2004;34(11):608-14.
24. Littlejohns P, Baveystock CM, Parnell H, Jones PW. Randomised controlled trial of the
effectiveness of a respiratory health worker in reducing impairment, disability, and
handicap due to chronic airflow limitation. Thorax. 1991;46(8):559-64.
91
25. Gallefoss F, Bakke PS. Impact of patient education and self-management on morbidity
in asthmatics and patients with chronic obstructive pulmonary disease. Respir Med.
2000;94(3):279-87.
26. Brusasco V, Hodder R, Miravitlles M, Korducki L, Towse L, Kesten S. Health
outcomes following treatment for six months with once daily tiotropium compared with
twice daily salmeterol in patients with COPD. Thorax. 2003;58(5):399-404.
27. Casaburi R, Mahler DA, Jones PW, et al. A long-term evaluation of once-daily inhaled
tiotropium in chronic obstructive pulmonary disease. Eur Respir J. 2002;19(2):217-24.
28. Niewoehner DE, Rice K, Cote C, et al. Prevention of exacerbations of chronic
obstructive pulmonary disease with tiotropium, a once-daily inhaled anticholinergic
bronchodilator: A randomized trial. Ann Intern Med. 2005;143(5):317-26.
29. Vincken W, van Noord JA, Greefhorst AP, et al. Improved health outcomes in patients
with COPD during 1 yr's treatment with tiotropium. Eur Respir J. 2002;19(2):209-16.
30. Dusser D, Bravo ML, Iacono P. The effect of tiotropium on exacerbations and airflow
in patients with COPD. Eur Respir J. 2006;27(3):547-55.
31. Calverley P, Pauwels R, Vestbo J, et al. Combined salmeterol and fluticasone in the
treatment of chronic obstructive pulmonary disease: A randomised controlled trial. Lancet.
2003;361(9356):449-56.
32. Calverley PM, Boonsawat W, Cseke Z, Zhong N, Peterson S, Olsson H. Maintenance
therapy with budesonide and formoterol in chronic obstructive pulmonary disease. Eur
Respir J. 2003;22(6):912-9.
33. Szafranski W, Cukier A, Ramirez A, et al. Efficacy and safety of budesonide/formoterol
in the management of chronic obstructive pulmonary disease. Eur Respir J.
2003;21(1):74-81.
34. Calverley PM, Anderson JA, Celli B, et al. Salmeterol and fluticasone propionate and
survival in chronic obstructive pulmonary disease. N Engl J Med. 2007;356(8):775-89.
35. Dal Negro RW, Pomari C, Tognella S, Micheletto C. Salmeterol & fluticasone 50
microg/250 microg bid in combination provides a better long-term control than salmeterol
50 microg bid alone and placebo in COPD patients already treated with theophylline. Pulm
Pharmacol Ther. 2003;16(4):241-6.
36. Wongsurakiat P, Maranetra KN, Wasi C, Kositanont U, Dejsomritrutai W,
Charoenratanakul S. Acute respiratory illness in patients with COPD and the effectiveness
of influenza vaccination: A randomized controlled study. Chest. 2004;125(6):2011-20.
37. Allegra L, Cordaro CI, Grassi C. Prevention of acute exacerbations of chronic
obstructive bronchitis with carbocysteine lysine salt monohydrate: A multicenter, double-
blind, placebo-controlled trial. Respiration. 1996;63(3):174-80.
92
38. Bontognali E. Clinical effectiveness and tolerance of cithiolone in the prophylaxis of
acute infective exacerbations in patients suffering from chronic bronchitis. Acta
Therapeutica. 1991;17:155-62.
39. Decramer M, Rutten-van Molken M, Dekhuijzen PN, et al. Effects of N-acetylcysteine
on outcomes in chronic obstructive pulmonary disease (bronchitis randomized on NAC
cost-utility study, BRONCUS): A randomised placebo-controlled trial. Lancet.
2005;365(9470):1552-60.
40. Grassi C, Casali L, Ciaccia A, et al. Terapia intervallare con l'associazione
carocisteina-sobrerolo nella profilassi delle riacutizzazioni della bronchite cronica. It J
Chest Dis. 1994;48:17-26.
41. Hansen NC, Skriver A, Brorsen-Riis L, et al. Orally administered N-acetylcysteine may
improve general well-being in patients with mild chronic bronchitis. Respir Med.
1994;88(7):531-5.
42. Malerba M, Ponticiello A, Radaeli A, Bensi G, Grassi V. Effect of twelve-months
therapy with oral ambroxol in preventing exacerbations in patients with COPD. double-
blind, randomized, multicenter, placebo-controlled study (the AMETHIST trial). Pulm
Pharmacol Ther. 2004;17(1):27-34.
43. Meister R, Wittig T, Beuscher N, de Mey C. Efficacy and tolerability of myrtol
standardized in long-term treatment of chronic bronchitis. A double-blind, placebo-
controlled study. study group investigators. Arzneimittelforschung. 1999;49(4):351-8.
44. Moretti M, Bottrighi P, Dallari R, et al. The effect of long-term treatment with
erdosteine on chronic obstructive pulmonary disease: The EQUALIFE study. Drugs Exp
Clin Res. 2004;30(4):143-52.
45. Pela R, Calcagni AM, Subiaco S, Isidori P, Tubaldi A, Sanguinetti CM. N-
acetylcysteine reduces the exacerbation rate in patients with moderate to severe COPD.
Respiration. 1999;66(6):495-500.
46. Burge PS, Calverley PM, Jones PW, Spencer S, Anderson JA, Maslen TK.
Randomised, double blind, placebo controlled study of fluticasone propionate in patients
with moderate to severe chronic obstructive pulmonary disease: The ISOLDE trial. Bmj.
2000;320(7245):1297-303.
47. van Grunsven PM, van Schayck CP, Derenne JP, et al. Long term effects of inhaled
corticosteroids in chronic obstructive pulmonary disease: A meta-analysis. Thorax.
1999;54(1):7-14.
48. Vestbo J, Sorensen T, Lange P, Brix A, Torre P, Viskum K. Long-term effect of inhaled
budesonide in mild and moderate chronic obstructive pulmonary disease: A randomised
controlled trial. Lancet. 1999;353(9167):1819-23.
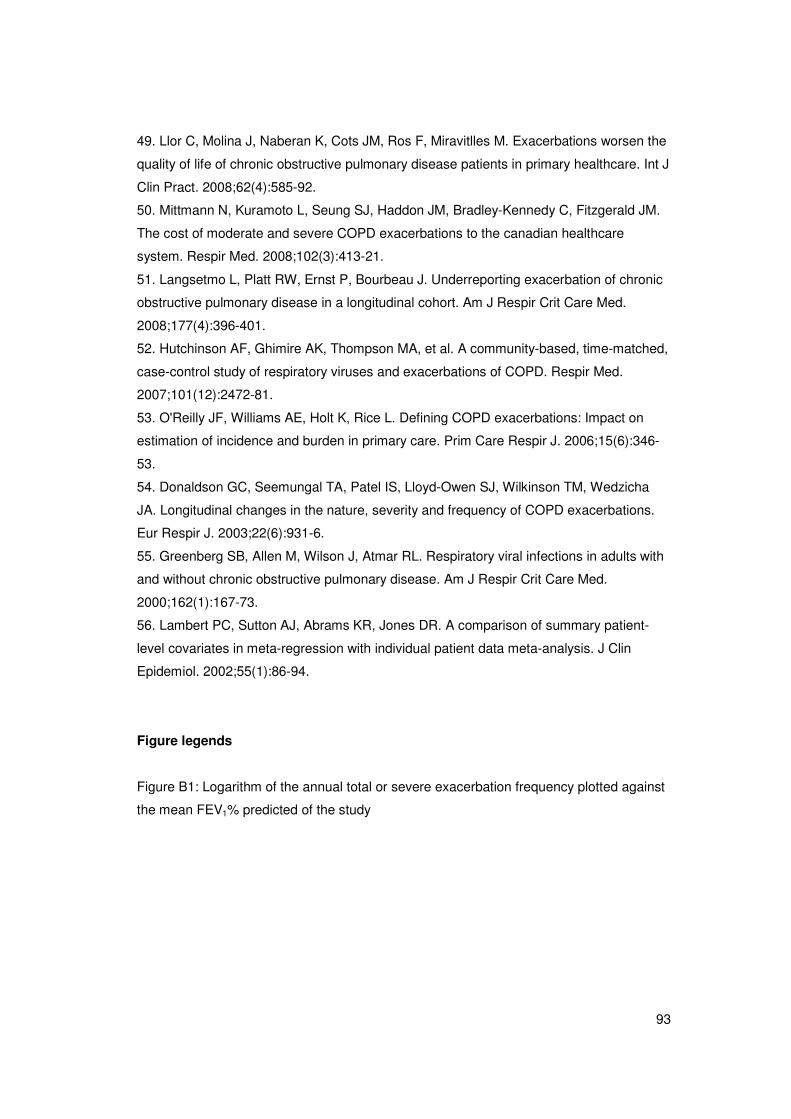
93
49. Llor C, Molina J, Naberan K, Cots JM, Ros F, Miravitlles M. Exacerbations worsen the
quality of life of chronic obstructive pulmonary disease patients in primary healthcare. Int J
Clin Pract. 2008;62(4):585-92.
50. Mittmann N, Kuramoto L, Seung SJ, Haddon JM, Bradley-Kennedy C, Fitzgerald JM.
The cost of moderate and severe COPD exacerbations to the canadian healthcare
system. Respir Med. 2008;102(3):413-21.
51. Langsetmo L, Platt RW, Ernst P, Bourbeau J. Underreporting exacerbation of chronic
obstructive pulmonary disease in a longitudinal cohort. Am J Respir Crit Care Med.
2008;177(4):396-401.
52. Hutchinson AF, Ghimire AK, Thompson MA, et al. A community-based, time-matched,
case-control study of respiratory viruses and exacerbations of COPD. Respir Med.
2007;101(12):2472-81.
53. O'Reilly JF, Williams AE, Holt K, Rice L. Defining COPD exacerbations: Impact on
estimation of incidence and burden in primary care. Prim Care Respir J. 2006;15(6):346-
53.
54. Donaldson GC, Seemungal TA, Patel IS, Lloyd-Owen SJ, Wilkinson TM, Wedzicha
JA. Longitudinal changes in the nature, severity and frequency of COPD exacerbations.
Eur Respir J. 2003;22(6):931-6.
55. Greenberg SB, Allen M, Wilson J, Atmar RL. Respiratory viral infections in adults with
and without chronic obstructive pulmonary disease. Am J Respir Crit Care Med.
2000;162(1):167-73.
56. Lambert PC, Sutton AJ, Abrams KR, Jones DR. A comparison of summary patient-
level covariates in meta-regression with individual patient data meta-analysis. J Clin
Epidemiol. 2002;55(1):86-94.
Figure legends
Figure B1: Logarithm of the annual total or severe exacerbation frequency plotted against
the mean FEV1% predicted of the study
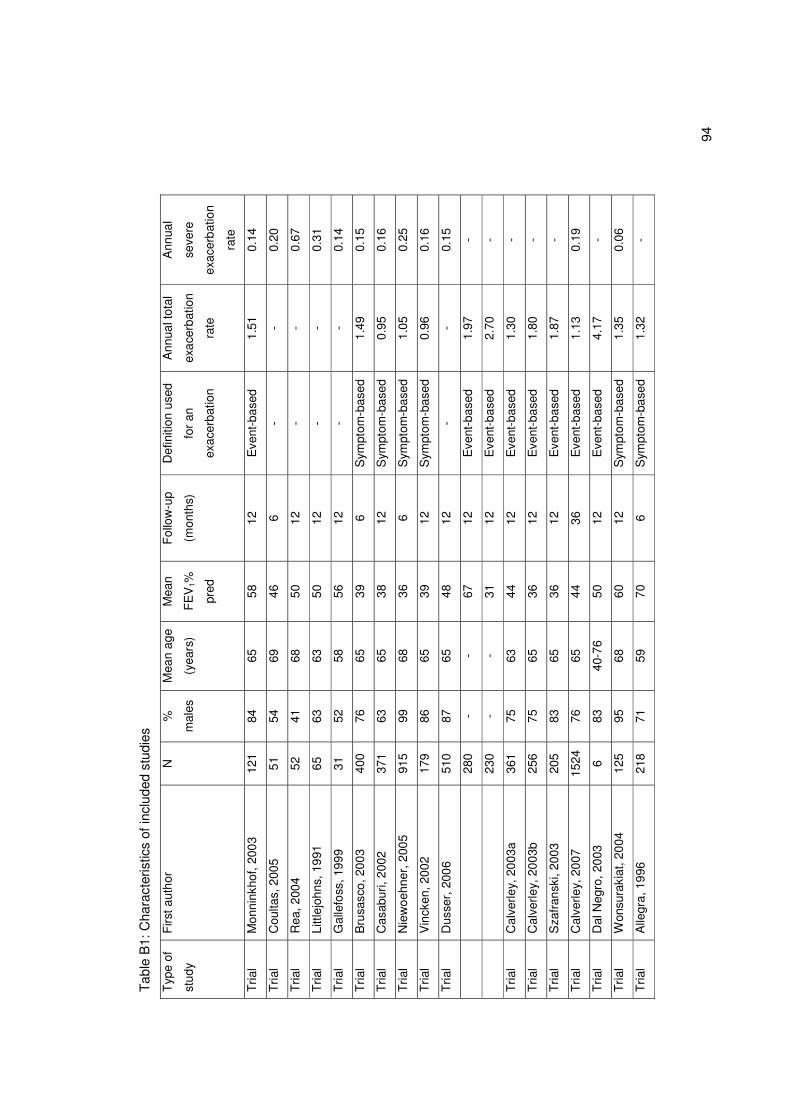
94
Tab
le B
1: C
hara
cter
istic
s of
incl
uded
stu
dies
Typ
e of
stud
y
Firs
t aut
hor
N
%
mal
es
Mea
n ag
e
(yea
rs)
Mea
n
FE
V1%
pred
Fol
low
-up
(mon
ths)
Def
initi
on u
sed
for
an
exac
erba
tion
Ann
ual t
otal
exac
erba
tion
rate
Ann
ual
seve
re
exac
erba
tion
rate
Tria
l M
onni
nkho
f, 20
03
121
84
65
58
12
Eve
nt-b
ased
1.
51
0.14
Tria
l C
oulta
s, 2
005
51
54
69
46
6
- -
0.20
Tria
l R
ea, 2
004
52
41
68
50
12
-
- 0.
67
Tria
l Li
ttlej
ohns
, 199
1
65
63
63
50
12
- -
0.31
Tria
l G
alle
foss
, 199
9
31
52
58
56
12
- -
0.14
Tria
l B
rusa
sco,
200
3
400
76
65
39
6 S
ympt
om-b
ased
1.
49
0.15
Tria
l C
asab
uri,
2002
37
1 63
65
38
12
S
ympt
om-b
ased
0.
95
0.16
Tria
l N
iew
oehn
er, 2
005
915
99
68
36
6 S
ympt
om-b
ased
1.
05
0.25
Tria
l V
inck
en, 2
002
17
9 86
65
39
12
S
ympt
om-b
ased
0.
96
0.16
Tria
l D
usse
r, 2
006
51
0 87
65
48
12
-
- 0.
15
280
- -
67
12
Eve
nt-b
ased
1.
97
-
230
- -
31
12
Eve
nt-b
ased
2.
70
-
Tria
l C
alve
rley,
200
3a
361
75
63
44
12
Eve
nt-b
ased
1.
30
-
Tria
l C
alve
rley,
200
3b
256
75
65
36
12
Eve
nt-b
ased
1.
80
-
Tria
l S
zafr
ansk
i, 20
03
205
83
65
36
12
Eve
nt-b
ased
1.
87
-
Tria
l C
alve
rley,
200
7
1524
76
65
44
36
E
vent
-bas
ed
1.13
0.
19
Tria
l D
al N
egro
, 200
3 6
83
40-7
6 50
12
E
vent
-bas
ed
4.17
-
Tria
l W
onsu
raki
at, 2
004
12
5 95
68
60
12
S
ympt
om-b
ased
1.
35
0.06
Tria
l A
llegr
a, 1
996
21
8 71
59
70
6
Sym
ptom
-bas
ed
1.32
-
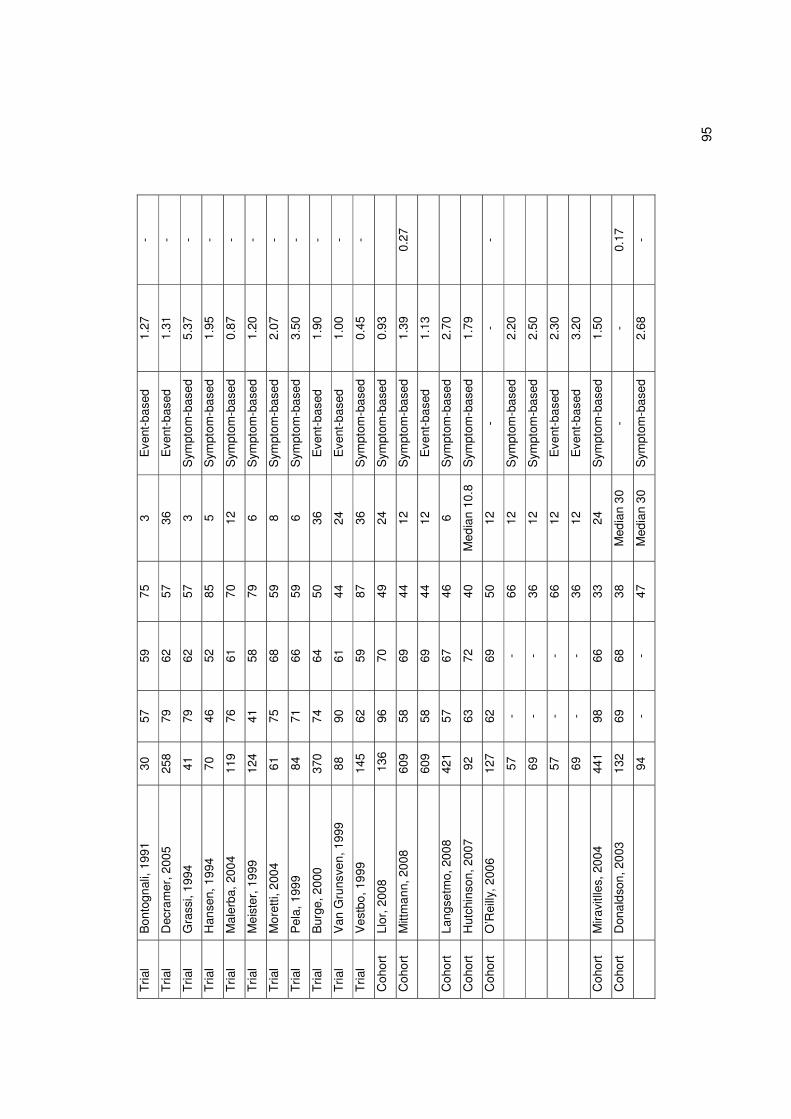
95
Tria
l B
onto
gnal
i, 19
91
30
57
59
75
3 E
vent
-bas
ed
1.27
-
Tria
l D
ecra
mer
, 200
5
258
79
62
57
36
Eve
nt-b
ased
1.
31
-
Tria
l G
rass
i, 19
94
41
79
62
57
3 S
ympt
om-b
ased
5.
37
-
Tria
l H
anse
n, 1
994
70
46
52
85
5
Sym
ptom
-bas
ed
1.95
-
Tria
l M
aler
ba, 2
004
11
9 76
61
70
12
S
ympt
om-b
ased
0.
87
-
Tria
l M
eist
er, 1
999
12
4 41
58
79
6
Sym
ptom
-bas
ed
1.20
-
Tria
l M
oret
ti, 2
004
61
75
68
59
8
Sym
ptom
-bas
ed
2.07
-
Tria
l P
ela,
199
9
84
71
66
59
6 S
ympt
om-b
ased
3.
50
-
Tria
l B
urge
, 200
0
370
74
64
50
36
Eve
nt-b
ased
1.
90
-
Tria
l V
an G
runs
ven,
199
9
88
90
61
44
24
Eve
nt-b
ased
1.
00
-
Tria
l V
estb
o, 1
999
14
5 62
59
87
36
S
ympt
om-b
ased
0.
45
-
Coh
ort
Llor
, 200
8
136
96
70
49
24
S
ympt
om-b
ased
0.
93
Coh
ort
Mitt
man
n, 2
008
60
9 58
69
44
12
S
ympt
om-b
ased
1.
39
0.27
609
58
69
44
12
Eve
nt-b
ased
1.
13
Coh
ort
Lang
setm
o, 2
008
42
1 57
67
46
6
Sym
ptom
-bas
ed
2.70
Coh
ort
Hut
chin
son,
200
7
92
63
72
40
Med
ian
10.8
S
ympt
om-b
ased
1.
79
Coh
ort
O’R
eilly
, 200
6
127
62
69
50
12
- -
-
57
- -
66
12
Sym
ptom
-bas
ed
2.20
69
- -
36
12
Sym
ptom
-bas
ed
2.50
57
- -
66
12
Eve
nt-b
ased
2.
30
69
- -
36
12
Eve
nt-b
ased
3.
20
Coh
ort
Mira
vitll
es, 2
004
44
1 98
66
33
24
S
ympt
om-b
ased
1.
50
Coh
ort
Don
alds
on, 2
003
13
2 69
68
38
M
edia
n 30
-
- 0.
17
94
- -
47
Med
ian
30
Sym
ptom
-bas
ed
2.68
-
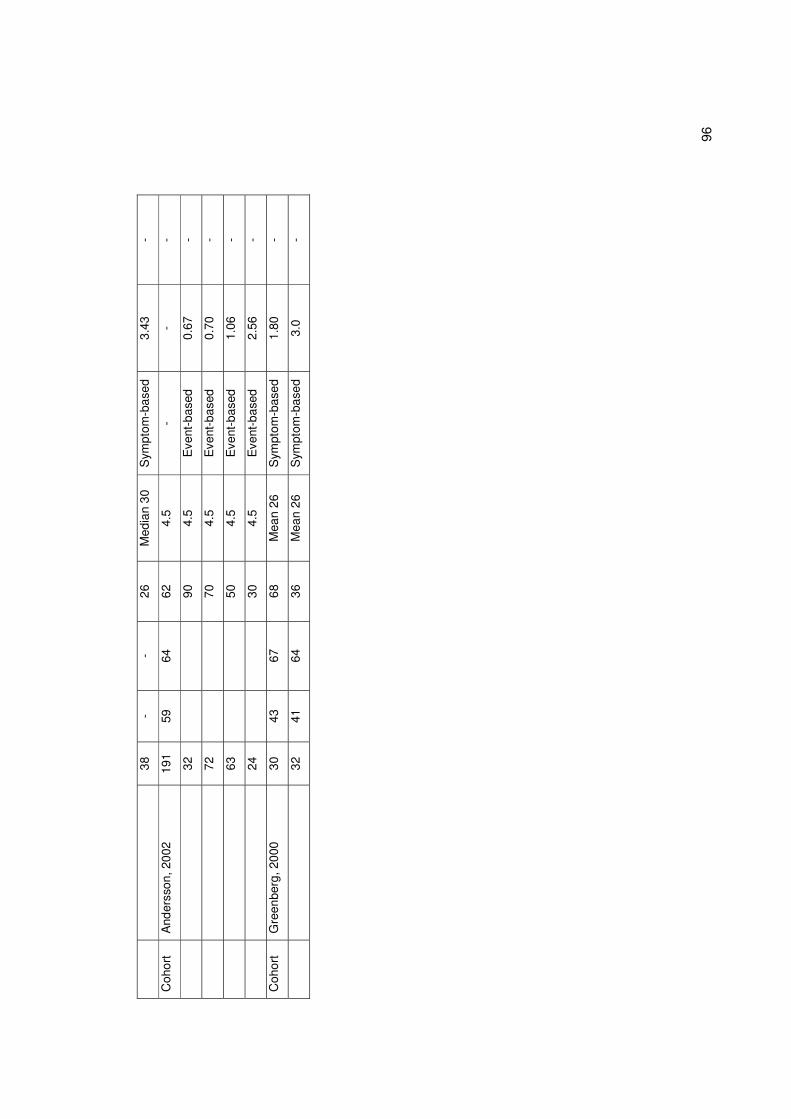
96
38
- -
26
Med
ian
30
Sym
ptom
-bas
ed
3.43
-
Coh
ort
And
erss
on, 2
002
19
1 59
64
62
4.
5 -
- -
32
90
4.5
Eve
nt-b
ased
0.
67
-
72
70
4.5
Eve
nt-b
ased
0.
70
-
63
50
4.5
Eve
nt-b
ased
1.
06
-
24
30
4.5
Eve
nt-b
ased
2.
56
-
Coh
ort
Gre
enbe
rg, 2
000
30
43
67
68
M
ean
26
Sym
ptom
-bas
ed
1.80
-
32
41
64
36
Mea
n 26
S
ympt
om-b
ased
3.
0 -
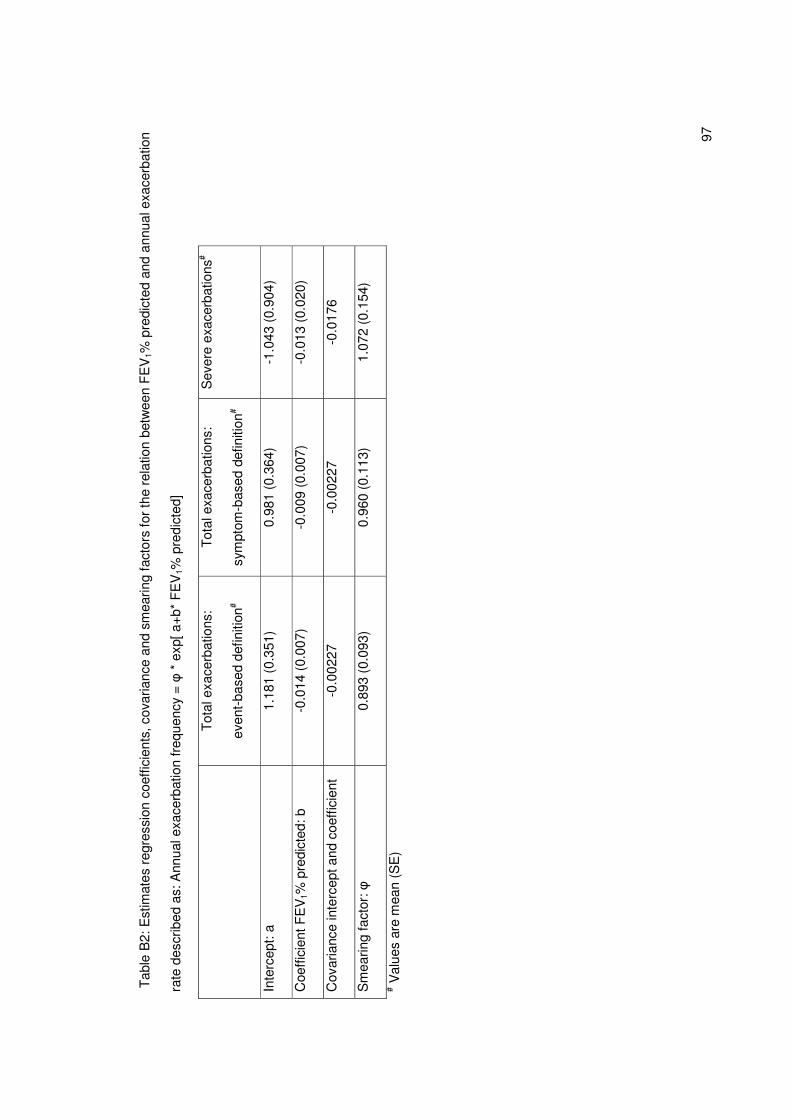
97
Tab
le B
2: E
stim
ates
reg
ress
ion
coef
ficie
nts,
cov
aria
nce
and
smea
ring
fact
ors
for
the
rela
tion
betw
een
FE
V1%
pre
dict
ed a
nd a
nnua
l exa
cerb
atio
n
rate
des
crib
ed a
s: A
nnua
l exa
cerb
atio
n fr
eque
ncy
= �
* e
xp[ a
+b*
FE
V1%
pre
dict
ed]
T
otal
exa
cerb
atio
ns:
even
t-ba
sed
defin
ition
#
Tot
al e
xace
rbat
ions
:
sym
ptom
-bas
ed d
efin
ition
#
Sev
ere
exac
erba
tions
#
Inte
rcep
t: a
1.18
1 (0
.351
) 0.
981
(0.3
64)
-1.0
43 (
0.90
4)
Coe
ffici
ent F
EV
1% p
redi
cted
: b
-0.0
14 (
0.00
7)
-0.0
09 (
0.00
7)
-0.0
13 (
0.02
0)
Cov
aria
nce
inte
rcep
t and
coe
ffic
ient
-0
.002
27
-0.0
0227
-0
.017
6
Sm
earin
g fa
ctor
: �
0.89
3 (0
.093
) 0.
960
(0.1
13)
1.07
2 (0
.154
)
# Val
ues
are
mea
n (S
E)
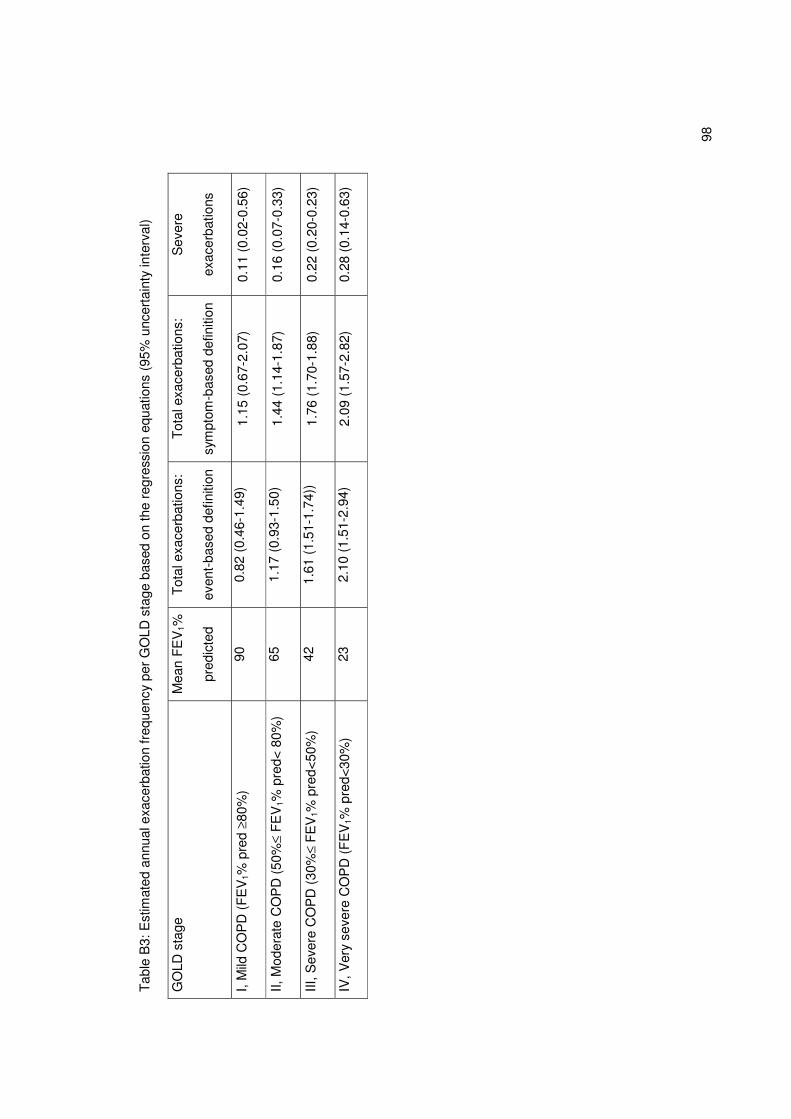
98
Tab
le B
3: E
stim
ated
ann
ual e
xace
rbat
ion
freq
uenc
y pe
r G
OLD
sta
ge b
ased
on
the
regr
essi
on e
quat
ions
(95
% u
ncer
tain
ty in
terv
al)
GO
LD s
tage
M
ean
FE
V1%
pred
icte
d
Tot
al e
xace
rbat
ions
:
even
t-ba
sed
defin
ition
Tot
al e
xace
rbat
ions
:
sym
ptom
-bas
ed d
efin
ition
Sev
ere
exac
erba
tions
I, M
ild C
OP
D (
FE
V1%
pre
d ≥80
%)
90
0.82
(0.
46-1
.49)
1.
15 (
0.67
-2.0
7)
0.11
(0.
02-0
.56)
II, M
oder
ate
CO
PD
(50
%≤ F
EV
1% p
red<
80%
) 65
1.
17 (
0.93
-1.5
0)
1.44
(1.
14-1
.87)
0.
16 (
0.07
-0.3
3)
III, S
ever
e C
OP
D (
30%
≤ F
EV
1% p
red<
50%
) 42
1.
61 (
1.51
-1.7
4))
1.76
(1.
70-1
.88)
0.
22 (
0.20
-0.2
3)
IV, V
ery
seve
re C
OP
D (
FE
V1%
pre
d<30
%)
23
2.10
(1.
51-2
.94)
2.
09 (
1.57
-2.8
2)
0.28
(0.
14-0
.63)
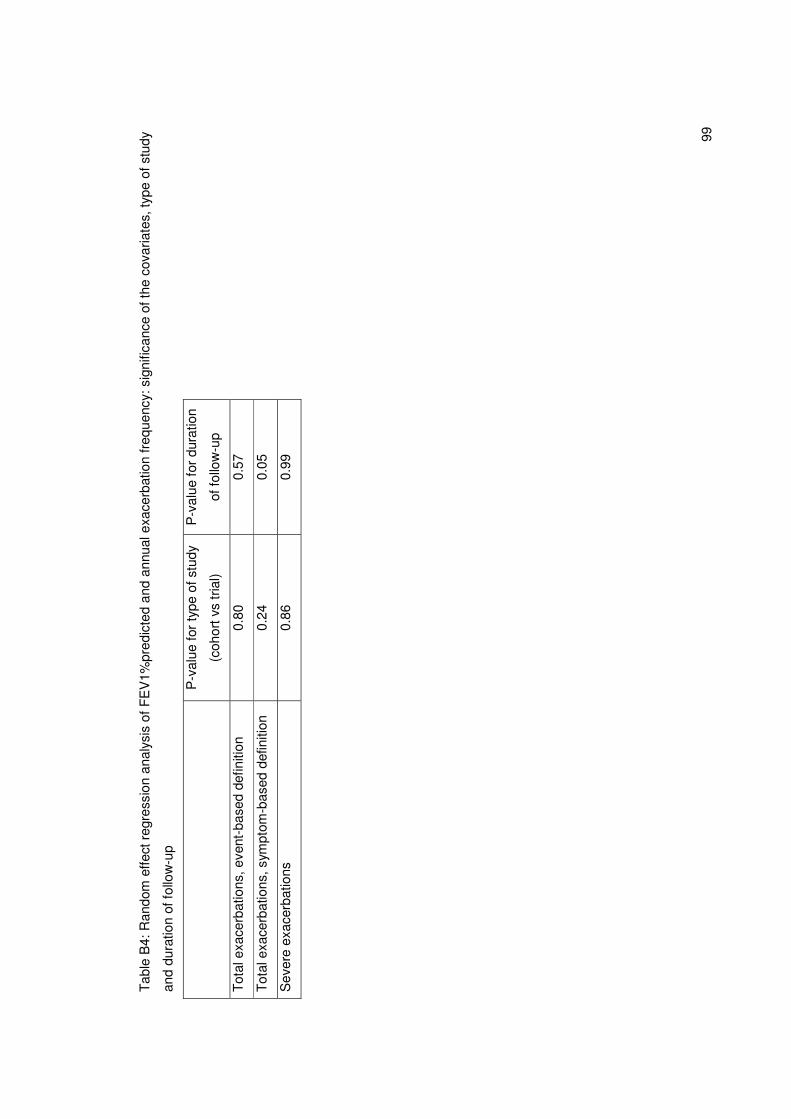
99
Tab
le B
4: R
ando
m e
ffect
reg
ress
ion
anal
ysis
of
FE
V1%
pred
icte
d an
d an
nual
exa
cerb
atio
n fr
eque
ncy:
sig
nific
ance
of t
he c
ovar
iate
s, ty
pe o
f stu
dy
and
dura
tion
of fo
llow
-up
P
-val
ue fo
r ty
pe o
f stu
dy
(coh
ort v
s tr
ial)
P-v
alue
for
dura
tion
of fo
llow
-up
Tot
al e
xace
rbat
ions
, eve
nt-b
ased
def
initi
on
0.80
0.
57
Tot
al e
xace
rbat
ions
, sym
ptom
-bas
ed d
efin
ition
0.
24
0.05
Sev
ere
exac
erba
tions
0.
86
0.99
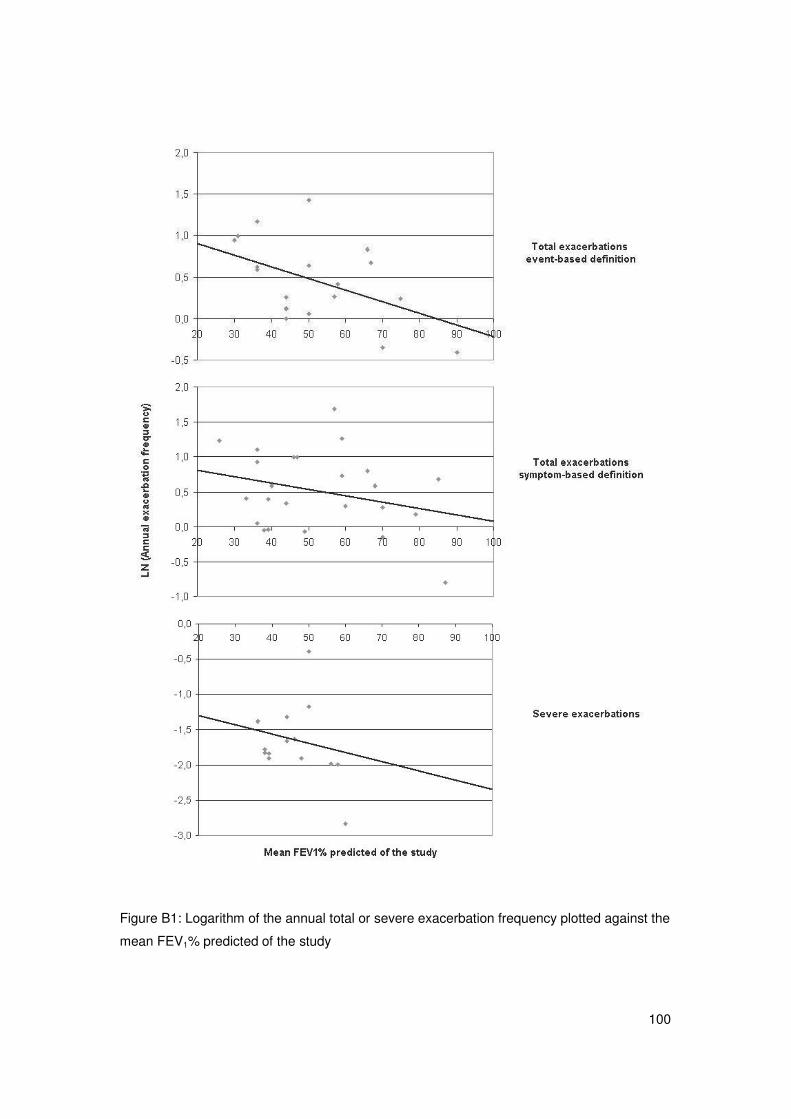
100
Figure B1: Logarithm of the annual total or severe exacerbation frequency plotted against the
mean FEV1% predicted of the study
101
APPENDIX C: Case-fatality of COPD exacerbations: a meta-analysis and
statistical modeling approach (working paper)
Note: Submitted to Eur Resp J, Accepted for first revision (May 2010)
Short title: Case-fatality of COPD exacerbations
Martine Hoogendoorn1, M.Sc.
Rudolf T Hoogenveen2, M.Sc
Maureen P Rutten-van Mölken1, Ph.D.
Jørgen Vestbo3, 4, Ph.D.
Talitha L Feenstra2, 5, Ph.D.
1 Institute for Medical Technology Assessment (IMTA), Erasmus University, Rotterdam, The
Netherlands
2 National Institute for Public Health and the Environment (RIVM), Bilthoven, The
Netherlands
3 Respiratory Medicine Research Group, Manchester Academic Health Sciences Centre,
Manchester, UK
4 Department of Cardiology & Respiratory Medicine, Hvidovre Hospital & Faculty of Health
Sciences, University of Copenhagen, Hvidovre Hospital, Hvidovre, Denmark
5 Department of Epidemiology, University Medical Centre Groningen, Groningen, The
Netherlands
Correspondence and request for reprints:
M. Hoogendoorn, M.Sc.
Institute for Medical Technology Assessment, Erasmus University
P.O. Box 1738
3000 DR Rotterdam
The Netherlands
Phone: (*31)(10) 4088871
Fax: (*31)(10) 4089081
Email: [email protected]
This study was financially sponsored by the Netherlands Asthma Foundation (NAF:
3.4.06.059)
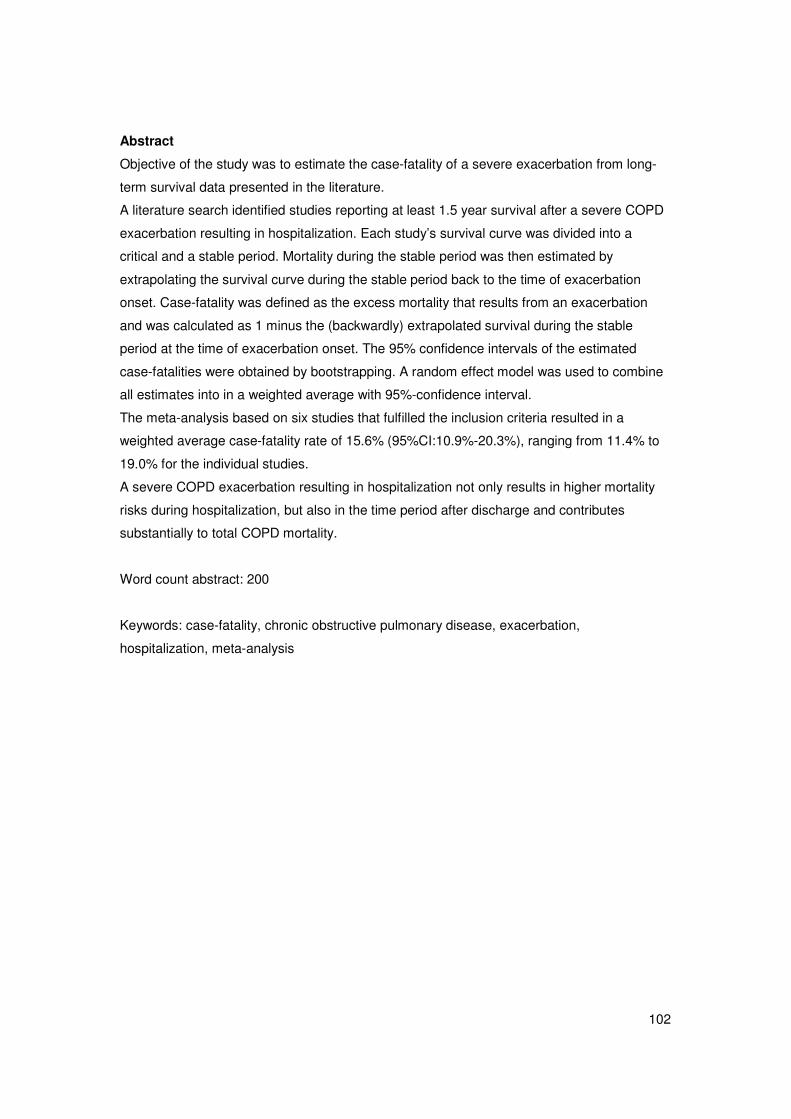
102
Abstract
Objective of the study was to estimate the case-fatality of a severe exacerbation from long-
term survival data presented in the literature.
A literature search identified studies reporting at least 1.5 year survival after a severe COPD
exacerbation resulting in hospitalization. Each study’s survival curve was divided into a
critical and a stable period. Mortality during the stable period was then estimated by
extrapolating the survival curve during the stable period back to the time of exacerbation
onset. Case-fatality was defined as the excess mortality that results from an exacerbation
and was calculated as 1 minus the (backwardly) extrapolated survival during the stable
period at the time of exacerbation onset. The 95% confidence intervals of the estimated
case-fatalities were obtained by bootstrapping. A random effect model was used to combine
all estimates into in a weighted average with 95%-confidence interval.
The meta-analysis based on six studies that fulfilled the inclusion criteria resulted in a
weighted average case-fatality rate of 15.6% (95%CI:10.9%-20.3%), ranging from 11.4% to
19.0% for the individual studies.
A severe COPD exacerbation resulting in hospitalization not only results in higher mortality
risks during hospitalization, but also in the time period after discharge and contributes
substantially to total COPD mortality.
Word count abstract: 200
Keywords: case-fatality, chronic obstructive pulmonary disease, exacerbation,
hospitalization, meta-analysis
103
Introduction
Worldwide, mortality due to COPD is high. According to the WHO, at least 2.7 million deaths
are due to COPD every year [1]. The 30-year projections from the Global Burden of Disease
Study show a striking increase in COPD as a cause of death to the third place worldwide in
2020 [2]. This increase largely results from a worldwide increase in the prevalence of
smoking - especially in the developing countries and among women - and aging of the
population. The excess mortality among patients with COPD is high, not only because of the
presence of COPD but also because of the increased prevalence of other smoking-related
diseases [3].
Many studies have analyzed predictors of mortality in COPD. Among the factors
independently associated with mortality in COPD are age, lung function (forced expiratory
volume in 1 second, inspiratory capacity divided by total lung capacity), dyspnea, co-
morbidity, body mass index (BMI), fat-free mass, exercise capacity, PaO2, C-reactive
protein, the BODE-index, incorporating BMI, airflow obstruction, dyspnea, and exercise
capacity and the number of previous hospitalizations [4,5].
Because patients with COPD are often recorded as dying from other causes, it has been
suggested that all-cause mortality is probably the best mortality measure to use in COPD [5].
Nevertheless, it is well known that many patients dying do so during a severe COPD-
exacerbation, when they experience acute respiratory failure [6]. However, there is a relative
scarcity of knowledge on mortality rates from COPD exacerbations. Unlike in myocardial
infarction and stroke [7] no estimates of the case-fatality of a COPD exacerbation exist. This
may be associated with the absence of consensus on the length of the critical period during
which the mortality risk is increased.
The most frequently reported outcome of death due to COPD exacerbations is short-term, in-
hospital mortality [8]. Previous studies have estimated in-hospital mortality after
hospitalization for a COPD exacerbation to range from 2.5% to 14% [9,10]. Mortality among
patients admitted to intensive care is much higher, i.e. up to 30% [11]. In-hospital mortality is
insufficient to assess case-fatality for at least two reasons. There is a selection bias towards
patients with longer hospital stays and it does not incorporate the mortality that occurs after
hospital discharge but is still attributable to the index exacerbation. Therefore, the present
study aimed to estimate the case-fatality of a severe COPD exacerbation including the time
period after hospitalization. This study arose out of our need to capture the impact of
exacerbations on mortality within the context of a dynamic, multistate, life-table model [12,13]
used to evaluate the impact of different COPD interventions. To fully simulate the potential
long-term impact of interventions which successfully prevent or treat exacerbations the
impact of severe exacerbations on mortality needed to be estimated. As the COPD
population in the model is specified by age and age is a significant predictor of mortality in
104
COPD [5], we also investigated the association between age and mortality after a severe
exacerbation.
Methods
We performed a comprehensive literature search in MEDLINE and EMBASE for journal
articles published after 1990 reporting mortality or survival during and after hospitalization for
an exacerbation of COPD using the MESH (sub)headings “chronic obstructive pulmonary
disease or COPD or chronic bronchitis” in combination with “mortality or dead or death* or
life expectancy or survival or prognosis” and “hospital* or admission* or admitt* or
exacerbation* or disease episodes”. We also searched references listed from articles
retrieved. Studies were excluded if the patient population was a subgroup of hospitalized
COPD patients, such as patients requiring mechanical ventilation. Inclusion criteria were:
European, American or Australian study population; a follow-up period that started at hospital
entry and lasted at least 1.5 year and presenting mortality rates at three or more time points
after hospital admission, or presenting a survival curve. Studies that fulfilled all inclusion
criteria except for a follow-up of 1.5 year or the presence of three data points were used to
obtain information on the average mortality rates at different time points after a severe
exacerbation as presented in the literature. In addition to information on the average mortality
rates at different time points, data on the association between mortality and age was
extracted from the studies.
Our general approach was as follows (see figure C1). For each study, we extracted the
presented or estimated survival curve and roughly distinguished between the critical and the
stable period after hospital admission with the survival curve during the stable period being
flatter than the one during the critical period. Several data points from the curve during the
stable period were extracted to estimate survival during this period. Only data points well
after the critical period were included. For each study, the survival function during the stable
period was then parameterized using three parameters:
S(t) = (1-g) Exp[- � t - � t2]
with t time, with t=0 being time of hospital admission
S(t) survival probability
�, � parameters that define the non-linear change in survival over time
g case-fatality of the exacerbation
105
The survival curve was fitted by minimizing the sum of squared differences with the points
that were extracted from the curve, or given in the publication. Then we extrapolated the
survival curve during the stable period back to the time of hospital admission and calculated
where the curve intersected the vertical axis (i.e. the start of hospital admission). The case-
fatality was defined as the excess mortality that results from an exacerbation and equals
g=1-S(0). Confidence intervals for each parameter were obtained from bootstrapping.
Conditional on the given initial sample size and the calculated survival probabilities for each
interval during the follow-up period, we randomly draw new survival numbers assuming
binomial distributions. In this way we generated new survival curves, resulting in newly
calculated values for the model parameters. The 2.5% and 97.5% percentile values
correspond with the 95% uncertainty interval. Finally, estimates from all studies were
combined to calculate the weighted average for g, using random effect meta-analysis [14].
The weights were based on a combination of the sampling error (variance of case-fatality
within each study) and the random-effect variance (variance of case-fatality between all
studies).
To estimate the association between age and mortality after a severe exacerbation, the
relative risks of age on mortality within a study, if reported, were extracted from the retrieved
references. The association with age within one study was investigated, as there was little
difference in the mean age between the different studies. The weighted average relative risk
was calculated using the variance in the individual studies as a weight.
Results
After first selection 60 references were obtained in full (see figure C2). Entire review of these
remaining publications resulted in exclusion of another 44 studies for different reasons (figure
C2). The main reasons for exclusion were that the association between hospitalization for
COPD and mortality was not reported (13 studies) and that the study population consisted of
a selective subgroup of hospitalized patients (13 studies). Of the latter 13 studies, six studies
included patients admitted to ICU or requiring (non-) mechanical ventilation only, three
included patients treated in ER or pre-hospital setting only, two included hospitalizations for
other diagnoses than COPD, while two studies included patients with a first admission or a
very mild exacerbation only.
Of the remaining 16 studies, 10 studies met all inclusion criteria except for the 1.5 years of
follow-up. Hence, a total of six studies were finally included in the meta-analysis to calculate
the case-fatality rate [15-20]. None of these studies evaluated the effect of an intervention;
they were all cohort studies. For one of these six studies, the study of Brekke et al [20], we
had access to the patient level data. For the other five studies results were based on the data
as presented in the article. Characteristics of the studies included are shown in Table C1.
106
Case-fatality
Table C2 presents the results of the curve fitting procedure for each of the six studies
selected. Details about the parameter values for each study are presented in the online data
supplement. The estimated average case-fatality rate for the individual studies varied
between 11.4% and 19.0%. The overall weighted mean value of the case-fatality of an
exacerbation was 15.6% (95% CI: 10.9-20.3%).
Association between mortality and age
All of the six studies reported about the association between mortality after a hospitalization
for an exacerbation and age. Age was a significant predictor of mortality in univariate
analyses (five studies) and remained an independent predictor after correction for other
explanatory variables in multivariate analyses (4 studies). On average the probability to die
after a hospitalization for an exacerbation increased with 4.1% per year increase in age
(RR=1.041 95%CI: 1.037-1.045) (six studies).
Average mortality rates at different time points presented in the literature
Characteristics of the ten studies with an insufficient length of follow-up are shown in table
C3 [9,10,21-28]. Table C4 shows the average mortality probabilities at different time points
for both these ten studies as well as the six studies that were included in the meta-analysis.
Based on all sixteen studies combined, the weighted mean in-hospital mortality rate was
4.4%. The average mortality rates at three and six months were 16% and 29%, respectively.
Discussion
In this study the case-fatality of an exacerbation was calculated by extrapolating the survival
curve during the stable period to the time of exacerbation onset. The weighted average case-
fatality rate was estimated to be 15.6%, with the individual studies varying from 11.4% to
19.0%. Comparing our results of the case-fatality with mortality probabilities at specific time
points (table C4) showed that the weighted average in-hospital mortality rate was 4.4%,
which strongly supports the notion that the critical period indeed exceeds the duration of the
hospitalization.
The exact distinction between the critical and stable period after exacerbation onset
however, could not be determined. The critical period was defined as the period in which
mortality is increased compared to the stable situation. This period therefore ranges from the
hospital admission till the point were the estimated survival curve during the stable period
approaches the actual observed survival curve (see figure 1). Estimating the point where the
two survival curves approach each other is only possible if patient-level data are available or
107
when we make additional assumptions on how the case-fatality changes over time within the
critical period. We had patient-level data of one study, the study of Brekke et al [20]. For this
study the critical period was estimated to last 4.4 months. The length of the critical period is
likely to vary according to the population studied; in patients with several co-morbidities the
exacerbation may have both more severe [9,19] and longer lasting impact and similarly the
critical period could last longer in the elderly.
Due to limited data and the homogeneity of the different studies we were not able to specify
the case-fatality by subgroups such as COPD severity, gender or age. Therefore we
searched for information about the association of these variables with mortality within the
extracted studies. Within the studies the relation of mortality due to an exacerbation with
disease severity or gender was less clear. Mortality after a hospitalization for an exacerbation
was however highly dependant on age (RR=1.041 per increase in year of age).
As the study populations of the six studies selected for the meta-analysis were almost the
same with respect to the mean age, 65 to 71 years, age did no influence the between-study
comparison of case-fatalities. The studies included have sampled data spanning a time
period of more than 10 years but no obvious pattern of change over time in case-fatality can
be seen. This could be the result of the variation in treatment and management between the
different countries but was actually also seen within one of the included studies [16]. In
contrast, a very recent study found indications of a slight improvement of exacerbation-
related mortality over time [29].
Despite the homogeneity between the studies with respect to age, the study populations may
have differed on other aspects. Although we selected studies from Western countries, the
criteria used for hospitalization are for example not similar across countries. This is related to
local treatment patterns, which in turn may be driven by local guidelines, medical traditions,
cultural aspects, financing and reimbursement schemes etc. In our selected studies the
mean length of stay was significantly longer in the European studies compared to studies
from the USA, 11 versus 7 days. The mean in-hospital mortality rate however, did not differ,
so possible differences in the characteristics of the study population do not seem to have an
important effect on the results.
In conclusion, mortality in COPD is common and severe exacerbations of COPD are one of
the major causes of death in COPD. In this study the case-fatality rate of a severe
exacerbation resulting in hospitalization was estimated to be 15.6%, showing the substantial
impact of exacerbations on mortality.
Acknowlegdements
The authors acknowledge dr. Brekke and dr. McGhan for the additional information and data
they provided. The authors also thank Maiwenn Al for her help with the statistical analyses.
108
References
1. Lopez AD, Shibuya K, Rao C, Mathers CD, Hansell AL, Held LS, Schmid V, Buist S.
Chronic obstructive pulmonary disease: current burden and future projections. Eur Respir J
2006; 27: 397-412.
2. Murray CJ, Lopez AD. Alternative projections of mortality and disability by cause 1990-
2020: Global Burden of Disease Study. Lancet 1997; 349: 1498-504.
3. Anthonisen NR, Skeans MA, Wise RA, Manfreda J, Kanner RE, Connett JE. The effects of
a smoking cessation intervention on 14.5-year mortality: a randomized clinical trial. Ann
Intern Med 2005; 142: 233-9.
4. Celli BR, Cote CG, Marin JM, Casanova C, Montes de Oca M, Mendez RA, Pinto Plata V,
Cabral HJ. The body-mass index, airflow obstruction, dyspnea, and exercise capacity index
in chronic obstructive pulmonary disease. N Engl J Med 2004; 350: 1005-12.
5. Cazzola M, MacNee W, Martinez FJ, Rabe KF, Franciosi LG, Barnes PJ, Brusasco V,
Burge PS, Calverley PM, Celli BR, Jones PW, Mahler DA, Make B, Miravitlles M, Page CP,
Palange P, Parr D, Pistolesi M, Rennard SI, Rutten-van Molken MP, Stockley R, Sullivan SD,
Wedzicha JA, Wouters EF. Outcomes for COPD pharmacological trials: from lung function to
biomarkers. Eur Respir J 2008; 31: 416-69.
6. Zielinski J, MacNee W, Wedzicha J, Ambrosino N, Braghiroli A, Dolensky J, Howard P,
Gorzelak K, Lahdensuo A, Strom K, Tobiasz M, Weitzenblum E. Causes of death in patients
with COPD and chronic respiratory failure. Monaldi Arch Chest Dis 1997; 52: 43-7.
7. Stevens RJ, Coleman RL, Adler AI, Stratton IM, Matthews DR, Holman RR. Risk factors
for myocardial infarction case fatality and stroke case fatality in type 2 diabetes: UKPDS 66.
Diabetes Care 2004; 27: 201-7.
8. Faustini A, Marino C, D'Ippoliti D, Forastiere F, Belleudi V, Perucci CA. The impact on risk-
factor analysis of different mortality outcomes in COPD patients. Eur Respir J 2008; 32: 629-
36.
9. Patil SP, Krishnan JA, Lechtzin N, Diette GB. In-hospital mortality following acute
exacerbations of chronic obstructive pulmonary disease. Arch Intern Med 2003; 163: 1180-6.
10. Fuso L, Incalzi RA, Pistelli R, Muzzolon R, Valente S, Pagliari G, Gliozzi F, Ciappi G.
Predicting mortality of patients hospitalized for acutely exacerbated chronic obstructive
pulmonary disease. Am J Med 1995; 98: 272-7.
11. Seneff MG, Wagner DP, Wagner RP, Zimmerman JE, Knaus WA. Hospital and 1-year
survival of patients admitted to intensive care units with acute exacerbation of chronic
obstructive pulmonary disease. Jama 1995; 274: 1852-7.
12. Feenstra TL, Van Genugten ML, Hoogenveen RT, Wouters EF, Rutten-van Molken MP.
The impact of aging and smoking on the future burden of chronic obstructive pulmonary
disease: a model analysis in the Netherlands. Am J Respir Crit Care Med 2001; 164: 590-6.
109
13. Hoogendoorn M, Rutten-van Molken MP, Hoogenveen RT, van Genugten ML, Buist AS,
Wouters EF, Feenstra TL. A dynamic population model of disease progression in COPD. Eur
Respir J 2005; 26: 223-33.
14. DerSimonian R, Laird N. Meta-analysis in clinical trials. Control Clin Trials 1986; 7: 177-
188.
15. F. CA,Jr, Dawson NV, Thomas C, E. HF,Jr, Desbiens N, Fulkerson WJ, Kussin P,
Bellamy P, Goldman L, Knaus WA. Outcomes following acute exacerbation of severe chronic
obstructive lung disease. The SUPPORT investigators (Study to Understand Prognoses and
Preferences for Outcomes and Risks of Treatments). Am J Respir Crit Care Med 1996; 154:
959-67.
16. Vestbo J, Prescott E, Lange P, Schnohr P, Jensen G. Vital prognosis after hospitalization
for COPD: a study of a random population sample. Respir Med 1998; 92: 772-6.
17. Groenewegen KH, Schols AM, Wouters EF. Mortality and mortality-related factors after
hospitalization for acute exacerbation of COPD. Chest 2003; 124: 459-67.
18. Gunen H, Hacievliyagil SS, Kosar F, Mutlu LC, Gulbas G, Pehlivan E, Sahin I, Kizkin O.
Factors affecting survival of hospitalised patients with COPD. Eur Respir J 2005; 26: 234-41.
19. McGhan R, Radcliff T, Fish R, Sutherland ER, Welsh C, Make B. Predictors of
rehospitalization and death after a severe exacerbation of COPD. Chest 2007; 132: 1748-55.
20. Brekke PH, Omland T, Holmedal SH, Smith P, Soyseth V. Troponin T elevation and long-
term mortality after chronic obstructive pulmonary disease exacerbation. Eur Respir J 2008;
31: 563-70.
21. Cydulka RK, R. ME,Jr, Emerman CL, Sivinski LD, Pisanelli W, Rimm AA. Patterns of
hospitalization in elderly patients with asthma and chronic obstructive pulmonary disease.
Am J Respir Crit Care Med 1997; 156: 1807-12.
22. Eriksen N, Hansen EF, Munch EP, Rasmussen FV, Vestbo J. [Chronic obstructive
pulmonary disease. Admission, course and prognosis]. Ugeskr Laeger 2003; 165: 3499-502.
23. Yohannes AM, Baldwin RC, Connolly MJ. Predictors of 1-year mortality in patients
discharged from hospital following acute exacerbation of chronic obstructive pulmonary
disease. Age Ageing 2005; 34: 491-6.
24. Wang Q, Bourbeau J. Outcomes and health-related quality of life following hospitalization
for an acute exacerbation of COPD. Respirology 2005; 10: 334-40.
25. Price LC, Lowe D, Hosker HS, Anstey K, Pearson MG, Roberts CM. UK National COPD
Audit 2003: Impact of hospital resources and organisation of care on patient outcome
following admission for acute COPD exacerbation. Thorax 2006; 61: 837-42.
26. Bustamante-Fermosel A, De Miguel-Yanes JM, Duffort-Falco M, Munoz J. Mortality-
related factors after hospitalization for acute exacerbation of chronic obstructive pulmonary
disease: the burden of clinical features. Am J Emerg Med 2007; 25: 515-22.
110
27. Kinnunen T, Saynajakangas O, Keistinen T. Features of hospitalisations for acute
exacerbation of COPD resulting in death. Monaldi Arch Chest Dis 2007; 67: 10-4.
28. Dransfield MT, Rowe SM, Johnson JE, Bailey WC, Gerald LB. Use of beta blockers and
the risk of death in hospitalised patients with acute exacerbations of COPD. Thorax 2008; 63:
301-5.
29. Eriksen N, Vestbo J. Management and survival of patients admitted with an exacerbation
of COPD. Comparison of two Danish patient cohorts. The Clinical Respiratory Journal: In
press.
Figure legends
Figure C1: Survival curve after hospitalization for an exacerbation of COPD. The dotted line
represents the extrapolated curve during the stable phase
Figure C2: Results of the systemic literature search
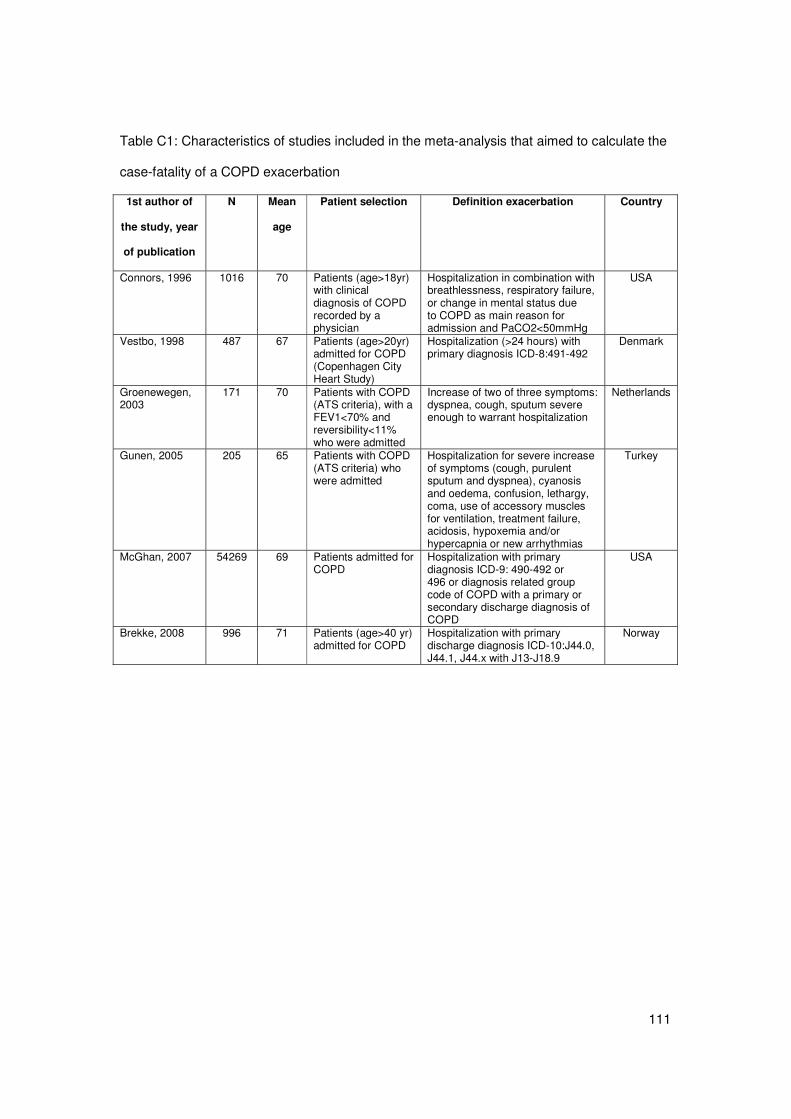
111
Table C1: Characteristics of studies included in the meta-analysis that aimed to calculate the
case-fatality of a COPD exacerbation
1st author of
the study, year
of publication
N Mean
age
Patient selection Definition exacerbation Country
Connors, 1996 1016 70 Patients (age>18yr) with clinical diagnosis of COPD recorded by a physician
Hospitalization in combination with breathlessness, respiratory failure, or change in mental status due to COPD as main reason for admission and PaCO2<50mmHg
USA
Vestbo, 1998 487 67 Patients (age>20yr) admitted for COPD (Copenhagen City Heart Study)
Hospitalization (>24 hours) with primary diagnosis ICD-8:491-492
Denmark
Groenewegen, 2003
171 70 Patients with COPD (ATS criteria), with a FEV1<70% and reversibility<11% who were admitted
Increase of two of three symptoms: dyspnea, cough, sputum severe enough to warrant hospitalization
Netherlands
Gunen, 2005 205 65 Patients with COPD (ATS criteria) who were admitted
Hospitalization for severe increase of symptoms (cough, purulent sputum and dyspnea), cyanosis and oedema, confusion, lethargy, coma, use of accessory muscles for ventilation, treatment failure, acidosis, hypoxemia and/or hypercapnia or new arrhythmias
Turkey
McGhan, 2007 54269 69 Patients admitted for COPD
Hospitalization with primary diagnosis ICD-9: 490-492 or 496 or diagnosis related group code of COPD with a primary or secondary discharge diagnosis of COPD
USA
Brekke, 2008 996 71 Patients (age>40 yr) admitted for COPD
Hospitalization with primary discharge diagnosis ICD-10:J44.0, J44.1, J44.x with J13-J18.9
Norway
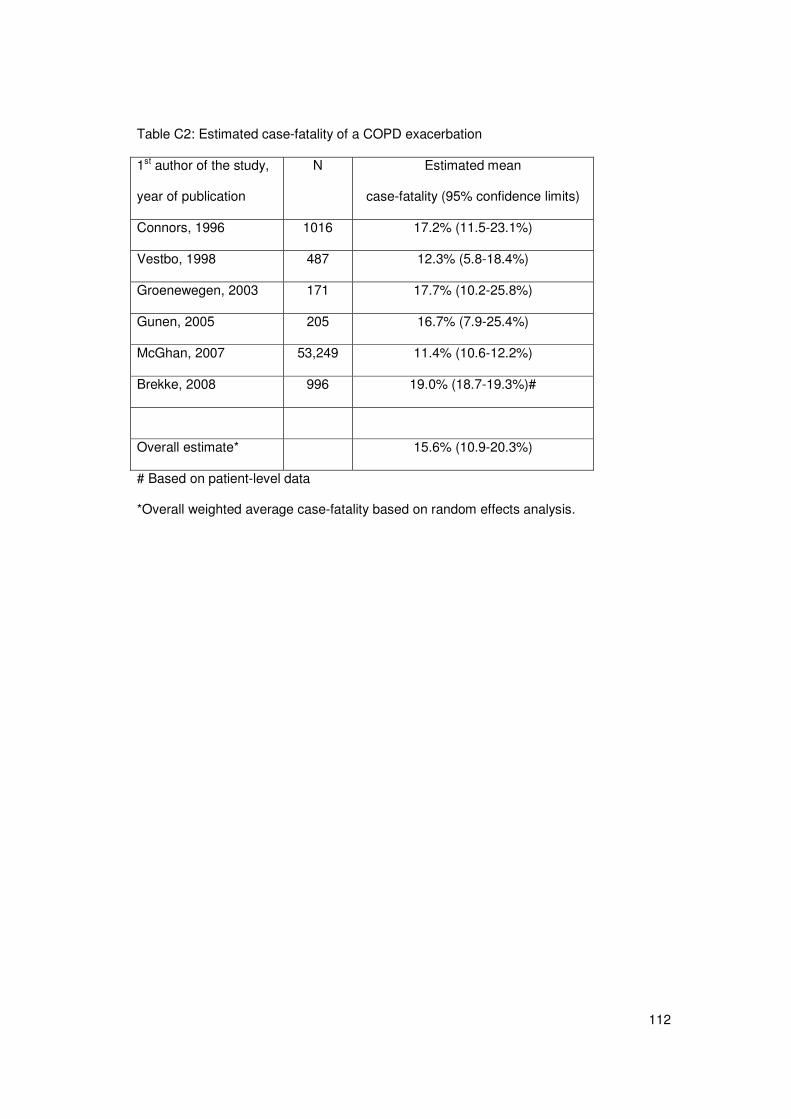
112
Table C2: Estimated case-fatality of a COPD exacerbation
1st author of the study,
year of publication
N Estimated mean
case-fatality (95% confidence limits)
Connors, 1996 1016 17.2% (11.5-23.1%)
Vestbo, 1998 487 12.3% (5.8-18.4%)
Groenewegen, 2003 171 17.7% (10.2-25.8%)
Gunen, 2005 205 16.7% (7.9-25.4%)
McGhan, 2007 53,249 11.4% (10.6-12.2%)
Brekke, 2008 996 19.0% (18.7-19.3%)#
Overall estimate* 15.6% (10.9-20.3%)
# Based on patient-level data
*Overall weighted average case-fatality based on random effects analysis.
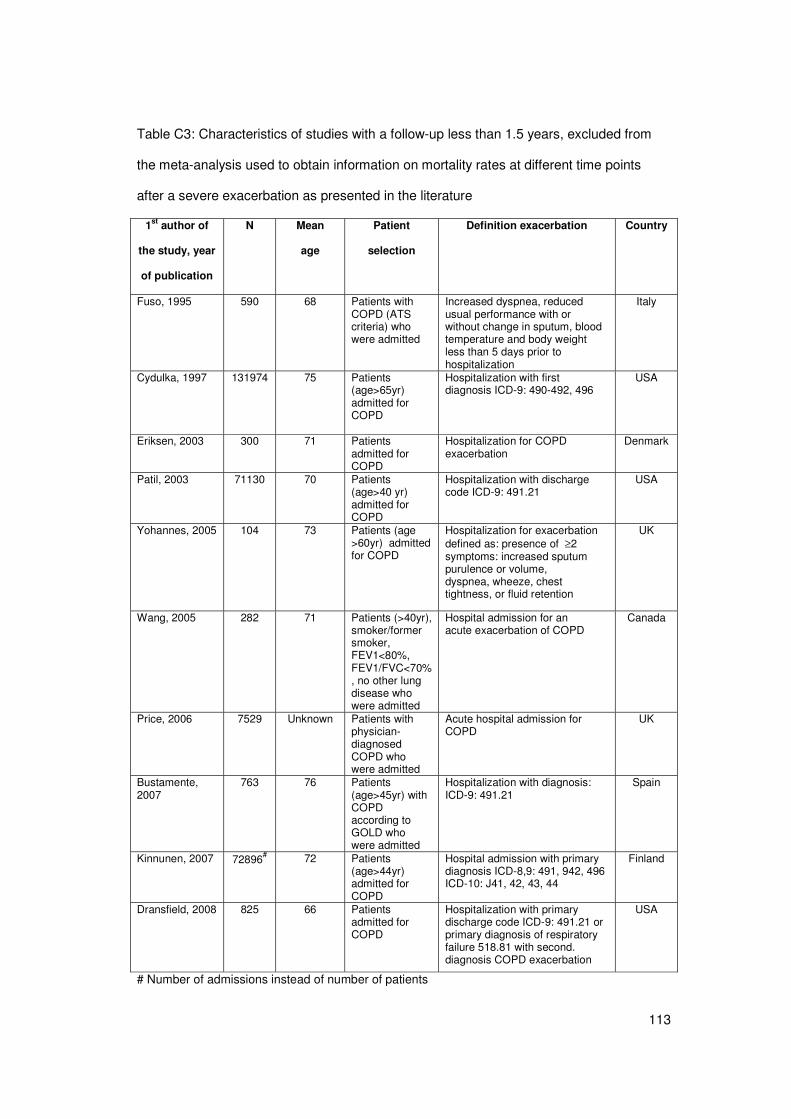
113
Table C3: Characteristics of studies with a follow-up less than 1.5 years, excluded from
the meta-analysis used to obtain information on mortality rates at different time points
after a severe exacerbation as presented in the literature
1st author of
the study, year
of publication
N Mean
age
Patient
selection
Definition exacerbation Country
Fuso, 1995 590 68 Patients with COPD (ATS criteria) who were admitted
Increased dyspnea, reduced usual performance with or without change in sputum, blood temperature and body weight less than 5 days prior to hospitalization
Italy
Cydulka, 1997 131974 75 Patients (age>65yr) admitted for COPD
Hospitalization with first diagnosis ICD-9: 490-492, 496
USA
Eriksen, 2003 300 71 Patients admitted for COPD
Hospitalization for COPD exacerbation
Denmark
Patil, 2003 71130 70 Patients (age>40 yr) admitted for COPD
Hospitalization with discharge code ICD-9: 491.21
USA
Yohannes, 2005 104 73 Patients (age >60yr) admitted for COPD
Hospitalization for exacerbation defined as: presence of ≥2 symptoms: increased sputum purulence or volume, dyspnea, wheeze, chest tightness, or fluid retention
UK
Wang, 2005 282 71 Patients (>40yr), smoker/former smoker, FEV1<80%, FEV1/FVC<70%, no other lung disease who were admitted
Hospital admission for an acute exacerbation of COPD
Canada
Price, 2006 7529 Unknown Patients with physician-diagnosed COPD who were admitted
Acute hospital admission for COPD
UK
Bustamente, 2007
763 76 Patients (age>45yr) with COPD according to GOLD who were admitted
Hospitalization with diagnosis: ICD-9: 491.21
Spain
Kinnunen, 2007 72896# 72 Patients (age>44yr) admitted for COPD
Hospital admission with primary diagnosis ICD-8,9: 491, 942, 496 ICD-10: J41, 42, 43, 44
Finland
Dransfield, 2008 825 66 Patients admitted for COPD
Hospitalization with primary discharge code ICD-9: 491.21 or primary diagnosis of respiratory failure 518.81 with second. diagnosis COPD exacerbation
USA
# Number of admissions instead of number of patients
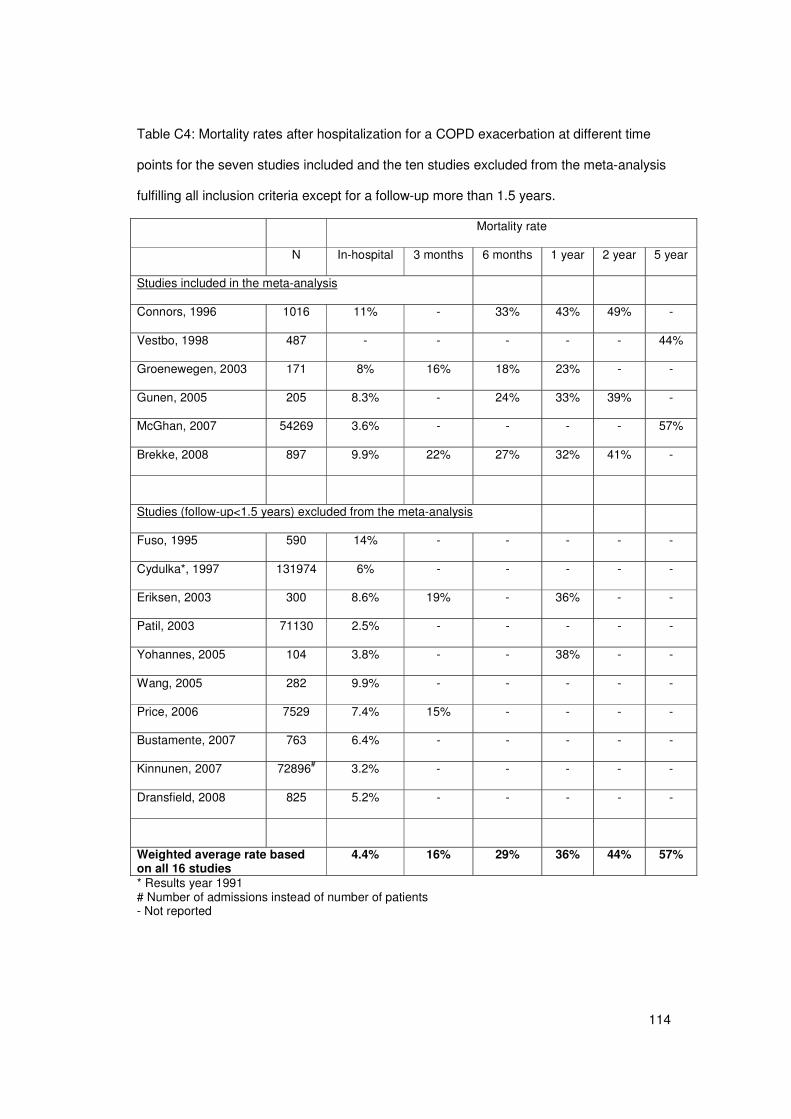
114
Table C4: Mortality rates after hospitalization for a COPD exacerbation at different time
points for the seven studies included and the ten studies excluded from the meta-analysis
fulfilling all inclusion criteria except for a follow-up more than 1.5 years.
Mortality rate
N In-hospital 3 months 6 months 1 year 2 year 5 year
Studies included in the meta-analysis
Connors, 1996 1016 11% - 33% 43% 49% -
Vestbo, 1998 487 - - - - - 44%
Groenewegen, 2003 171 8% 16% 18% 23% - -
Gunen, 2005 205 8.3% - 24% 33% 39% -
McGhan, 2007 54269 3.6% - - - - 57%
Brekke, 2008 897 9.9% 22% 27% 32% 41% -
Studies (follow-up<1.5 years) excluded from the meta-analysis
Fuso, 1995 590 14% - - - - -
Cydulka*, 1997 131974 6% - - - - -
Eriksen, 2003 300 8.6% 19% - 36% - -
Patil, 2003 71130 2.5% - - - - -
Yohannes, 2005 104 3.8% - - 38% - -
Wang, 2005 282 9.9% - - - - -
Price, 2006 7529 7.4% 15% - - - -
Bustamente, 2007 763 6.4% - - - - -
Kinnunen, 2007 72896# 3.2% - - - - -
Dransfield, 2008 825 5.2% - - - - -
Weighted average rate based on all 16 studies
4.4% 16% 29% 36% 44% 57%
* Results year 1991 # Number of admissions instead of number of patients - Not reported
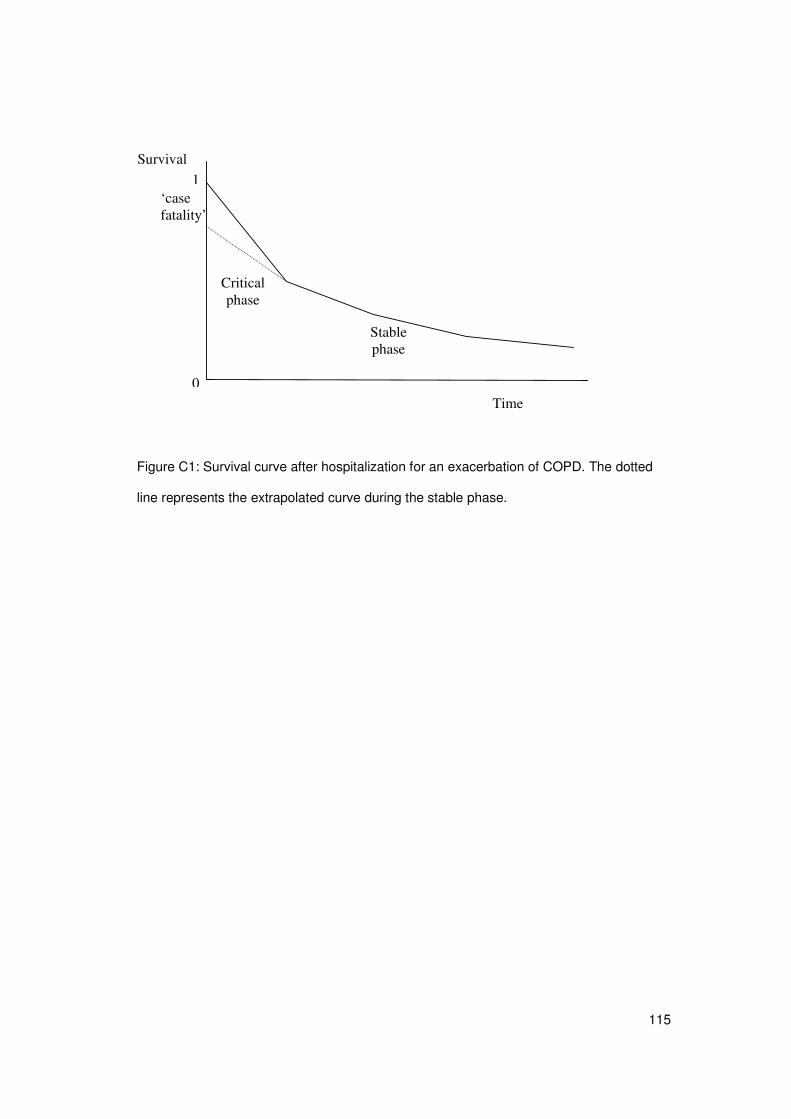
115
Figure C1: Survival curve after hospitalization for an exacerbation of COPD. The dotted
line represents the extrapolated curve during the stable phase.
‘case fatality’
Critical phase
Stable phase
1
Time 0
Survival
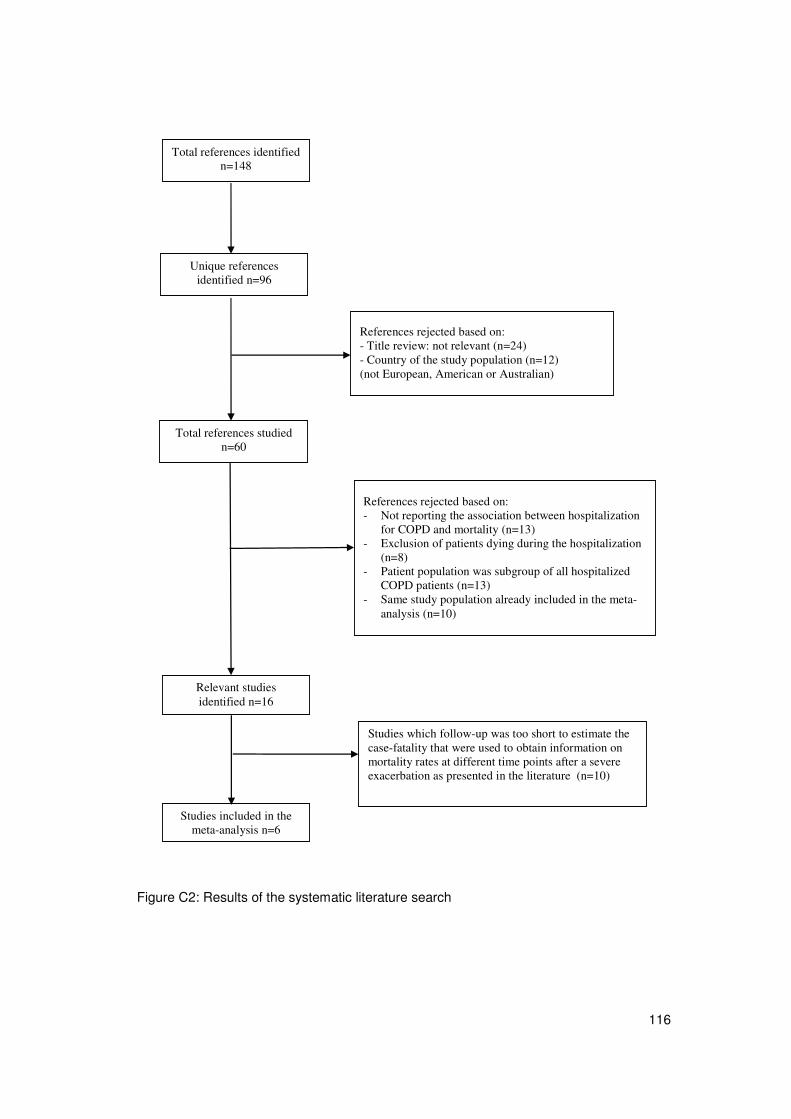
116
Figure C2: Results of the systematic literature search
Total references identified
n=148
Unique references identified n=96
Total references studied n=60
References rejected based on: - Title review: not relevant (n=24) - Country of the study population (n=12) (not European, American or Australian)
Studies included in the meta-analysis n=6
References rejected based on: - Not reporting the association between hospitalization
for COPD and mortality (n=13) - Exclusion of patients dying during the hospitalization
(n=8) - Patient population was subgroup of all hospitalized
COPD patients (n=13) - Same study population already included in the meta-
analysis (n=10)
Relevant studies identified n=16
Studies which follow-up was too short to estimate the case-fatality that were used to obtain information on mortality rates at different time points after a severe exacerbation as presented in the literature (n=10)
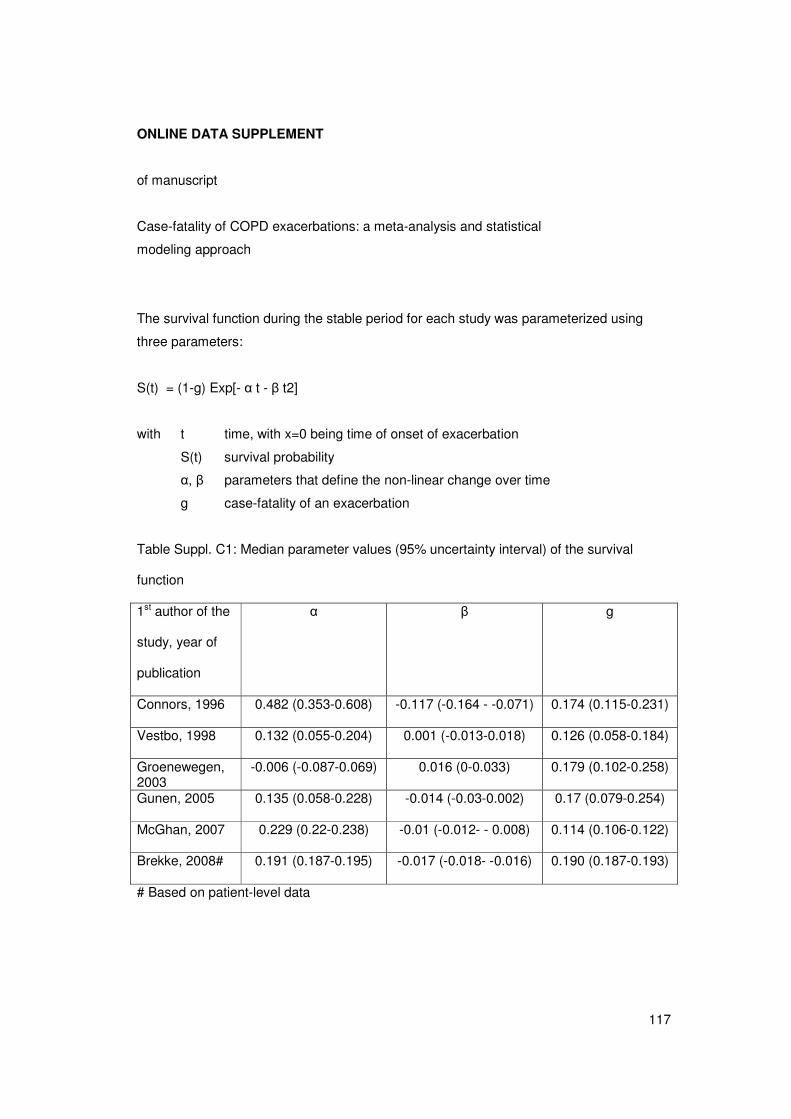
117
ONLINE DATA SUPPLEMENT
of manuscript
Case-fatality of COPD exacerbations: a meta-analysis and statistical
modeling approach
The survival function during the stable period for each study was parameterized using
three parameters:
S(t) = (1-g) Exp[- � t - � t2]
with t time, with x=0 being time of onset of exacerbation
S(t) survival probability
�, � parameters that define the non-linear change over time
g case-fatality of an exacerbation
Table Suppl. C1: Median parameter values (95% uncertainty interval) of the survival
function
1st author of the
study, year of
publication
� � g
Connors, 1996 0.482 (0.353-0.608) -0.117 (-0.164 - -0.071) 0.174 (0.115-0.231)
Vestbo, 1998 0.132 (0.055-0.204) 0.001 (-0.013-0.018) 0.126 (0.058-0.184)
Groenewegen, 2003
-0.006 (-0.087-0.069) 0.016 (0-0.033) 0.179 (0.102-0.258)
Gunen, 2005 0.135 (0.058-0.228) -0.014 (-0.03-0.002) 0.17 (0.079-0.254)
McGhan, 2007 0.229 (0.22-0.238) -0.01 (-0.012- - 0.008) 0.114 (0.106-0.122)
Brekke, 2008# 0.191 (0.187-0.195) -0.017 (-0.018- -0.016) 0.190 (0.187-0.193)
# Based on patient-level data
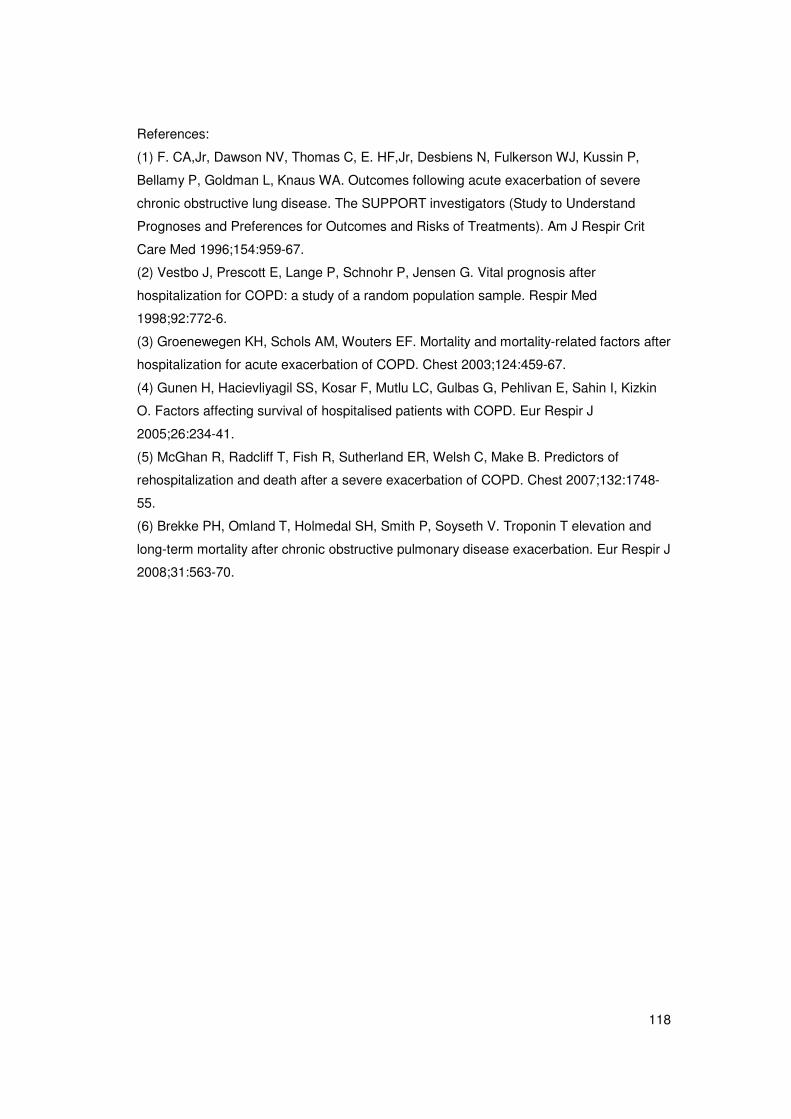
118
References:
(1) F. CA,Jr, Dawson NV, Thomas C, E. HF,Jr, Desbiens N, Fulkerson WJ, Kussin P,
Bellamy P, Goldman L, Knaus WA. Outcomes following acute exacerbation of severe
chronic obstructive lung disease. The SUPPORT investigators (Study to Understand
Prognoses and Preferences for Outcomes and Risks of Treatments). Am J Respir Crit
Care Med 1996;154:959-67.
(2) Vestbo J, Prescott E, Lange P, Schnohr P, Jensen G. Vital prognosis after
hospitalization for COPD: a study of a random population sample. Respir Med
1998;92:772-6.
(3) Groenewegen KH, Schols AM, Wouters EF. Mortality and mortality-related factors after
hospitalization for acute exacerbation of COPD. Chest 2003;124:459-67.
(4) Gunen H, Hacievliyagil SS, Kosar F, Mutlu LC, Gulbas G, Pehlivan E, Sahin I, Kizkin
O. Factors affecting survival of hospitalised patients with COPD. Eur Respir J
2005;26:234-41.
(5) McGhan R, Radcliff T, Fish R, Sutherland ER, Welsh C, Make B. Predictors of
rehospitalization and death after a severe exacerbation of COPD. Chest 2007;132:1748-
55.
(6) Brekke PH, Omland T, Holmedal SH, Smith P, Soyseth V. Troponin T elevation and
long-term mortality after chronic obstructive pulmonary disease exacerbation. Eur Respir J
2008;31:563-70.
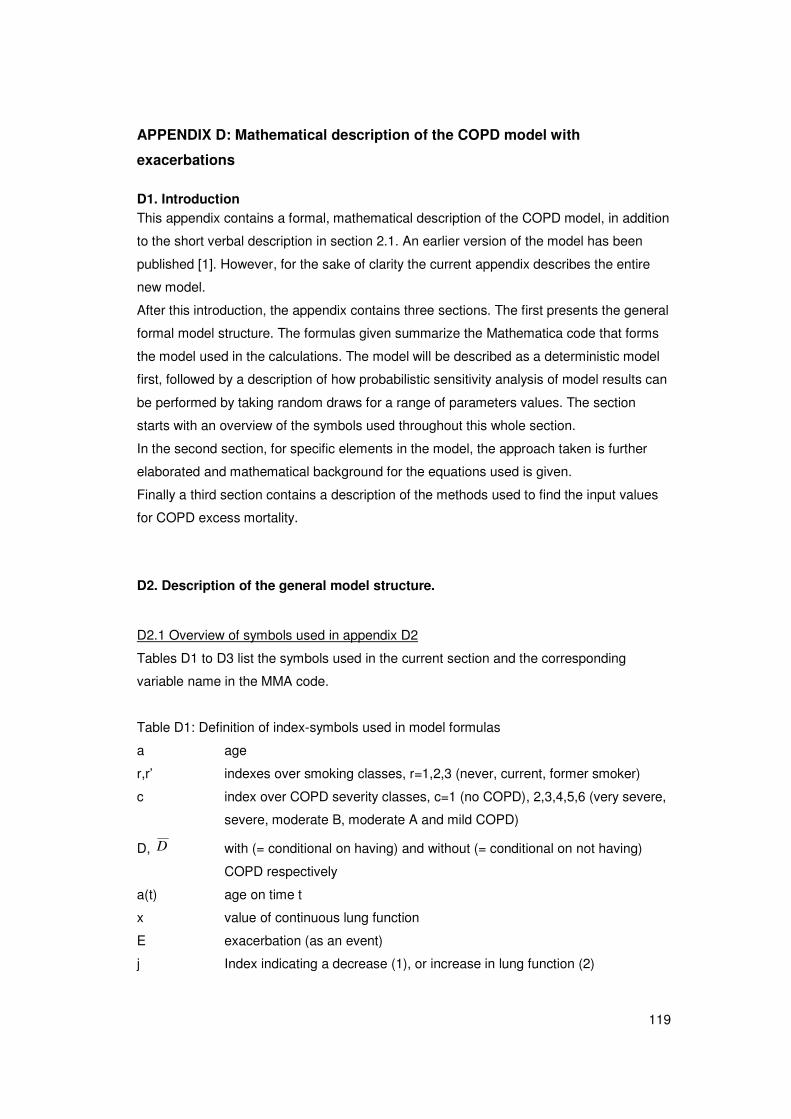
119
APPENDIX D: Mathematical description of the COPD model with
exacerbations
D1. Introduction This appendix contains a formal, mathematical description of the COPD model, in addition
to the short verbal description in section 2.1. An earlier version of the model has been
published [1]. However, for the sake of clarity the current appendix describes the entire
new model.
After this introduction, the appendix contains three sections. The first presents the general
formal model structure. The formulas given summarize the Mathematica code that forms
the model used in the calculations. The model will be described as a deterministic model
first, followed by a description of how probabilistic sensitivity analysis of model results can
be performed by taking random draws for a range of parameters values. The section
starts with an overview of the symbols used throughout this whole section.
In the second section, for specific elements in the model, the approach taken is further
elaborated and mathematical background for the equations used is given.
Finally a third section contains a description of the methods used to find the input values
for COPD excess mortality.
D2. Description of the general model structure.
D2.1 Overview of symbols used in appendix D2
Tables D1 to D3 list the symbols used in the current section and the corresponding
variable name in the MMA code.
Table D1: Definition of index-symbols used in model formulas
a age
r,r’ indexes over smoking classes, r=1,2,3 (never, current, former smoker)
c index over COPD severity classes, c=1 (no COPD), 2,3,4,5,6 (very severe,
severe, moderate B, moderate A and mild COPD)
D, D with (= conditional on having) and without (= conditional on not having)
COPD respectively
a(t) age on time t
x value of continuous lung function
E exacerbation (as an event)
j Index indicating a decrease (1), or increase in lung function (2)
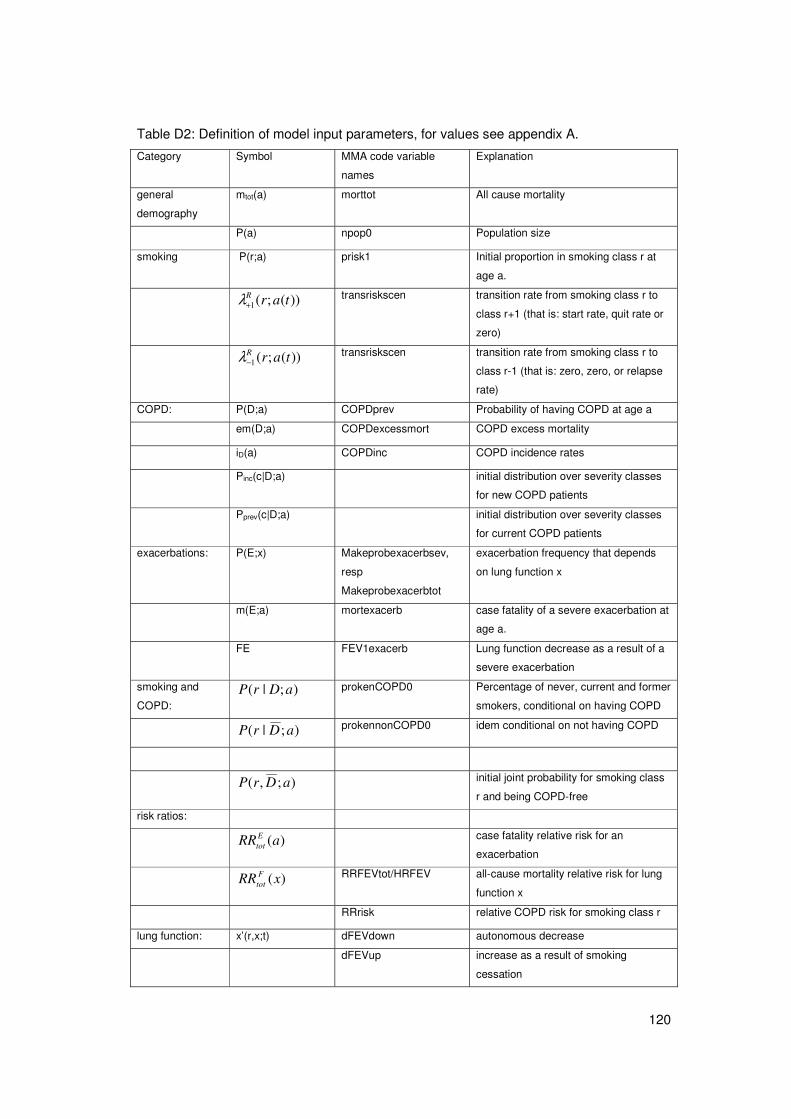
120
Table D2: Definition of model input parameters, for values see appendix A.
Category Symbol MMA code variable
names
Explanation
general
demography mtot(a) morttot All cause mortality
P(a) npop0 Population size
smoking P(r;a) prisk1 Initial proportion in smoking class r at
age a.
))(;(1 tarR+λ transriskscen transition rate from smoking class r to
class r+1 (that is: start rate, quit rate or
zero)
))(;(1 tarR−λ transriskscen transition rate from smoking class r to
class r-1 (that is: zero, zero, or relapse
rate)
COPD: P(D;a) COPDprev Probability of having COPD at age a
em(D;a) COPDexcessmort COPD excess mortality
iD(a) COPDinc COPD incidence rates
Pinc(c|D;a) initial distribution over severity classes
for new COPD patients
Pprev(c|D;a) initial distribution over severity classes
for current COPD patients
exacerbations: P(E;x) Makeprobexacerbsev,
resp
Makeprobexacerbtot
exacerbation frequency that depends
on lung function x
m(E;a) mortexacerb case fatality of a severe exacerbation at
age a.
FE FEV1exacerb Lung function decrease as a result of a
severe exacerbation
smoking and
COPD: );|( aDrP prokenCOPD0 Percentage of never, current and former
smokers, conditional on having COPD
);|( aDrP prokennonCOPD0 idem conditional on not having COPD
);,( aDrP initial joint probability for smoking class
r and being COPD-free
risk ratios:
)(aRREtot case fatality relative risk for an
exacerbation
)(xRR Ftot RRFEVtot/HRFEV
all-cause mortality relative risk for lung
function x
RRrisk relative COPD risk for smoking class r
lung function: x’(r,x;t) dFEVdown autonomous decrease
dFEVup increase as a result of smoking
cessation
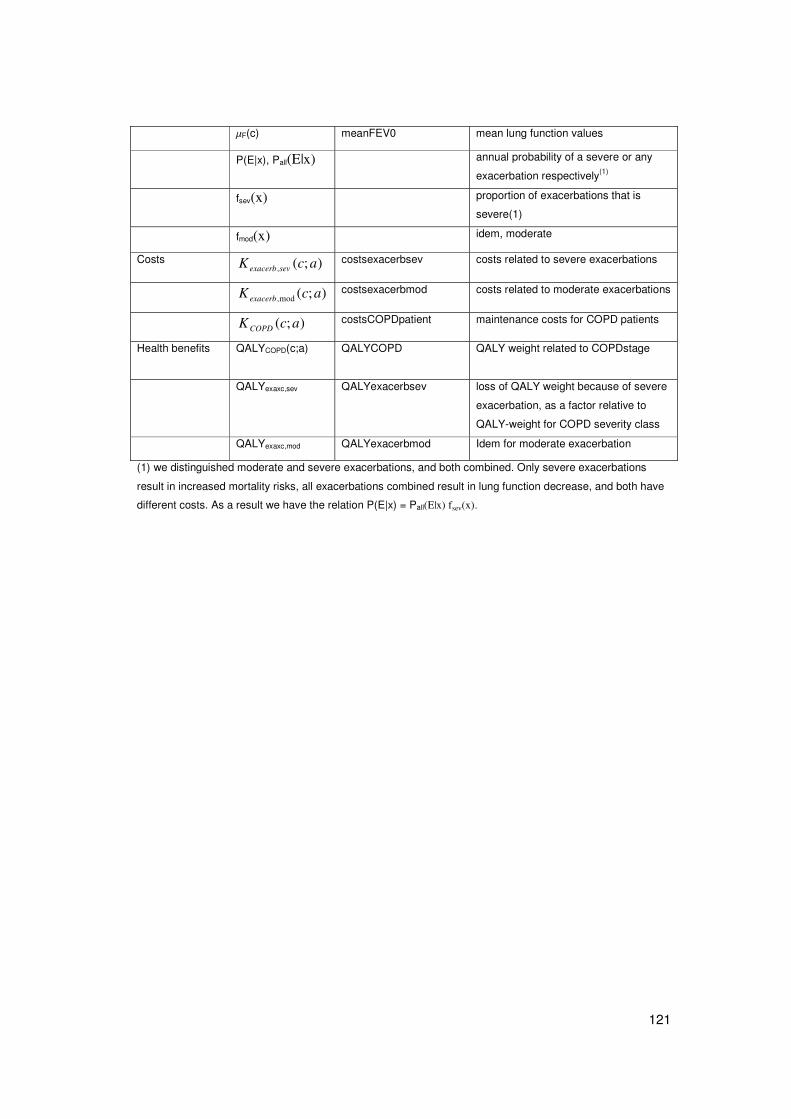
121
�F(c) meanFEV0 mean lung function values
P(E|x), Pall(E|x) annual probability of a severe or any
exacerbation respectively(1)
fsev(x) proportion of exacerbations that is
severe(1)
fmod(x) idem, moderate
Costs );(, acK sevexacerb costsexacerbsev costs related to severe exacerbations
);(mod, acKexacerb costsexacerbmod costs related to moderate exacerbations
);( acKCOPD costsCOPDpatient maintenance costs for COPD patients
Health benefits
QALYCOPD(c;a) QALYCOPD QALY weight related to COPDstage
QALYexaxc,sev QALYexacerbsev loss of QALY weight because of severe
exacerbation, as a factor relative to
QALY-weight for COPD severity class
QALYexaxc,mod QALYexacerbmod Idem for moderate exacerbation
(1) we distinguished moderate and severe exacerbations, and both combined. Only severe exacerbations
result in increased mortality risks, all exacerbations combined result in lung function decrease, and both have
different costs. As a result we have the relation P(E|x) = Pall(E|x) fsev(x).
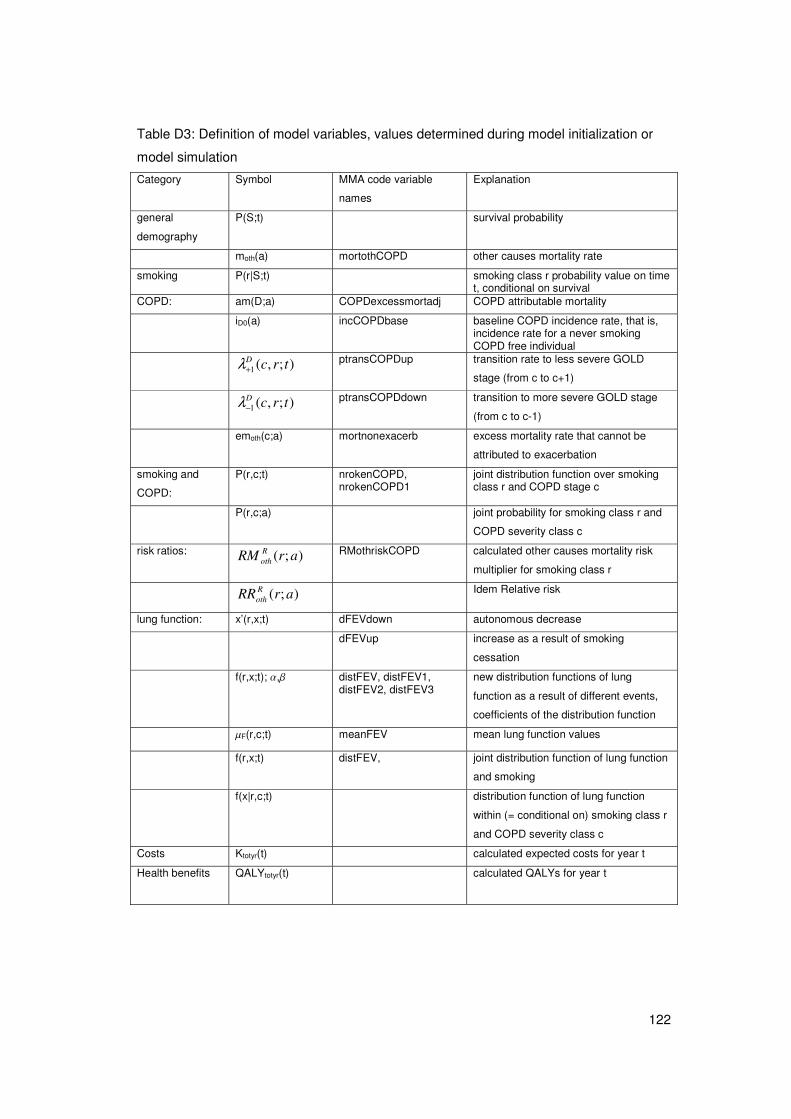
122
Table D3: Definition of model variables, values determined during model initialization or
model simulation
Category Symbol MMA code variable
names
Explanation
general
demography P(S;t) survival probability
moth(a) mortothCOPD other causes mortality rate
smoking P(r|S;t) smoking class r probability value on time t, conditional on survival
COPD: am(D;a) COPDexcessmortadj COPD attributable mortality
iD0(a) incCOPDbase baseline COPD incidence rate, that is, incidence rate for a never smoking COPD free individual
);,(1 trcD+λ ptransCOPDup transition rate to less severe GOLD
stage (from c to c+1)
);,(1 trcD−λ ptransCOPDdown transition to more severe GOLD stage
(from c to c-1)
emoth(c;a) mortnonexacerb excess mortality rate that cannot be
attributed to exacerbation
smoking and
COPD:
P(r,c;t) nrokenCOPD, nrokenCOPD1
joint distribution function over smoking class r and COPD stage c
P(r,c;a) joint probability for smoking class r and
COPD severity class c
risk ratios: );( arRM Roth RMothriskCOPD calculated other causes mortality risk
multiplier for smoking class r
);( arRR Roth Idem Relative risk
lung function: x’(r,x;t) dFEVdown autonomous decrease
dFEVup increase as a result of smoking
cessation
f(r,x;t); �,� distFEV, distFEV1, distFEV2, distFEV3
new distribution functions of lung
function as a result of different events,
coefficients of the distribution function
�F(r,c;t) meanFEV mean lung function values
f(r,x;t) distFEV, joint distribution function of lung function
and smoking
f(x|r,c;t) distribution function of lung function
within (= conditional on) smoking class r
and COPD severity class c
Costs Ktotyr(t) calculated expected costs for year t
Health benefits
QALYtotyr(t) calculated QALYs for year t
123
D2.2 Introduction to model structure.
The model describes the life course of any individual in terms of changes of smoking
class, COPD severity class, and lung function value. It is mathematically built in the form
of a Markov-type state-transition model. Difference equations describe the change of the
state variables over time, as a result of transitions from one state to the other. The cycle
length is one year. The two most important state variables in the COPD model are: 1)
probability values per COPD severity stage (this includes not having COPD as a special
stage), per smoking class, per age class, and gender, and 2) coefficients characterizing
the distribution of FEV1%pred within each COPD severity stage per smoking class. The
latter distribution has to be interpreted as the mean distribution over both genders and all
ages. Finally, the number of exacerbations in each COPD severity stage is important.
Basically the model describes how these variables evolve over time and how they are
related.
For instance, the number of current smokers with mild COPD in year t+1 is defined by the
number of current smokers with mild COPD in year t, adding new mild COPD incidence
among smokers, adding new as well as restarted ex-smokers among mild COPD patients,
subtracting smoking cessation in mild COPD patients, subtracting decrease in health
status to moderate COPD and correcting for mortality. To each state the model attaches
estimates of annual costs and a quality of life weight.
Exacerbations are considered as events, not as specific states. In each COPD state, the
total number of exacerbations per year is estimated, as well as the number of severe and
moderate exacerbations. These numbers affect several transition rates (mortality, and
lung function decline) and state specific costs and quality of life.
Lung function is modeled as a continuous variable. A normal distribution function over the
entire FEV1% range was used as input and approximated by a linear function within each
severity class, characterized by two parameters. These parameters change as a result of
transitions between COPD states, smoking classes, and mortality. In this way, the
parameters of the distribution function within each severity class also have the Markov-
property: annual changes do not depend on past values, conditional on the current values.
Almost all model variables are specific to age and gender. To increase the stability of the
model, a few variables were defined as being constant over gender and age. This refers
to the parameters of the linear distribution functions of the lung function, and the resulting
mean lung function values for each COPD severity class.
Important other smoking-related chronic diseases were included in the model, namely
myocardial infarction (AMI), stroke (CVA) and lung cancer (LC).
This section follows the computational order in the model-code. First all input parameters
are defined or read from data files and some help variables are computed. The following
124
model parameters are calculated based on input data: mortality rates from other causes
than COPD, case fatality of an exacerbation, the remaining COPD related mortality rates,
and the COPD incidence rates. Values of the model variables for the start year are
defined. These include the initial joint probability values for all smoking and COPD
severity classes and the initial values of parameters of linear distribution function of lung
function within each COPD severity class.
Second, for each year in the simulation, three calculation steps are set.
The 1st step is the calculation of the transition numbers between the smoking classes and
COPD severity stages. The smoking class transition rates are model input. The COPD
severity class transition rates are calculated based on lung function decrease and
increase, the distribution of FEV1%pred in each COPD stage and the number of
exacerbations in each state.
The 2nd step is the calculation of new COPD and smoking prevalence probabilities using
these transition rates and accounting for mortality. Mortality may be due to several
causes: case fatality of exacerbations, remaining COPD-related mortality, and other
causes of death.
The 3rd step is the calculation of the new FEV1%pred distributions in each COPD stage
using lung function decrease and increase. The effect of exacerbations was included in
the decrease and increase of lung function.
D2.3 Initialisation.
The model initialization part consists of calculating all transition rate vales (including
mortality and incidence) and the initial joint probability values for all smoking and COPD
severity classes, for both genders and all ages. Moreover, the lung function distribution
within each COPD severity class is initialized.
a. Prevalence of smoking and COPD severity in base year:
Initial values of the joint probability of all smoking and COPD severity classes were
calculated in two steps.
First, the initial smoking class probability values were calculated conditional on having
COPD. The relative risk values used to estimate smoking class specific COPD incidence
numbers were assumed to approximate the relative risk of smoking class for prevalent
COPD cases for the start year. The initial smoking class probability value conditional on
not having COPD is the complement.
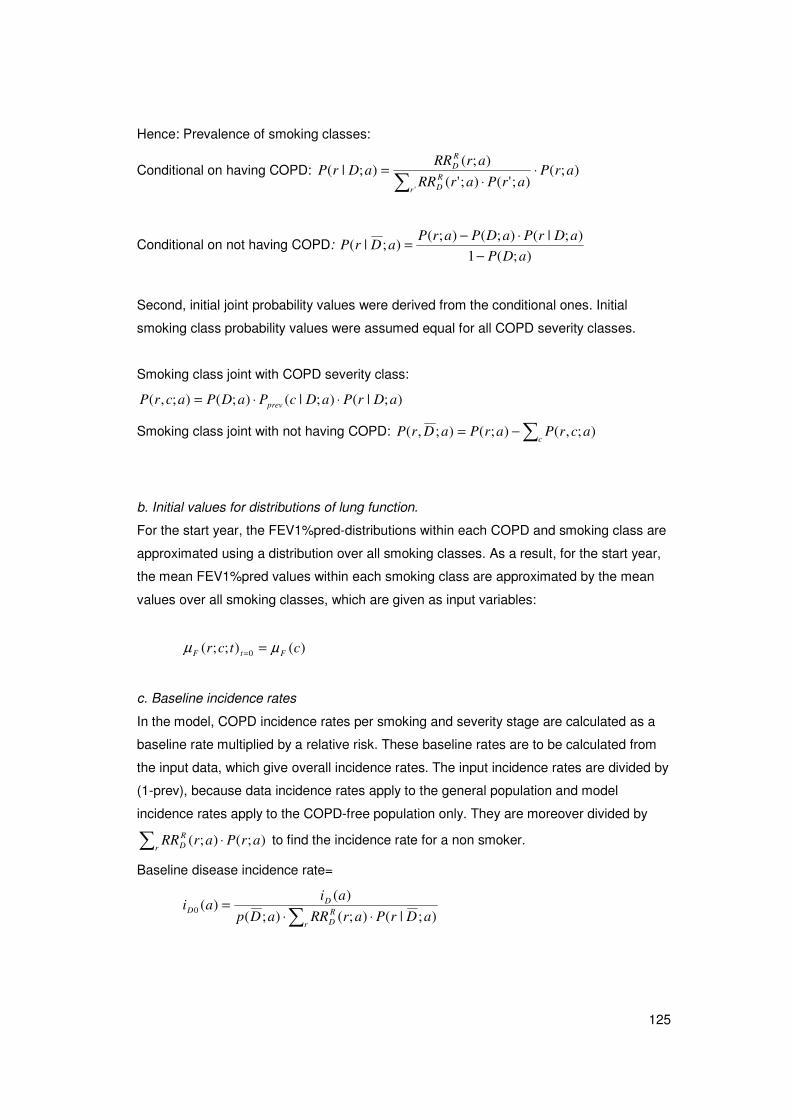
125
Hence: Prevalence of smoking classes:
Conditional on having COPD: );();'();'(
);();|(
'
arParParRR
arRRaDrP
r
RD
RD ⋅
⋅=�
Conditional on not having COPD: );(1
);|();();();|(
aDP
aDrPaDParPaDrP
−
⋅−=
Second, initial joint probability values were derived from the conditional ones. Initial
smoking class probability values were assumed equal for all COPD severity classes.
Smoking class joint with COPD severity class:
);|();|();();,( aDrPaDcPaDPacrP prev ⋅⋅=
Smoking class joint with not having COPD: �−=c
acrParPaDrP );,();();,(
b. Initial values for distributions of lung function.
For the start year, the FEV1%pred-distributions within each COPD and smoking class are
approximated using a distribution over all smoking classes. As a result, for the start year,
the mean FEV1%pred values within each smoking class are approximated by the mean
values over all smoking classes, which are given as input variables:
)();;( 0 ctcr FtF μμ ==
c. Baseline incidence rates
In the model, COPD incidence rates per smoking and severity stage are calculated as a
baseline rate multiplied by a relative risk. These baseline rates are to be calculated from
the input data, which give overall incidence rates. The input incidence rates are divided by
(1-prev), because data incidence rates apply to the general population and model
incidence rates apply to the COPD-free population only. They are moreover divided by
� ⋅r
RD arParRR );();( to find the incidence rate for a non smoker.
Baseline disease incidence rate=
� ⋅⋅=
r
RD
DD
aDrParRRaDp
aiai
);|();();(
)()(0
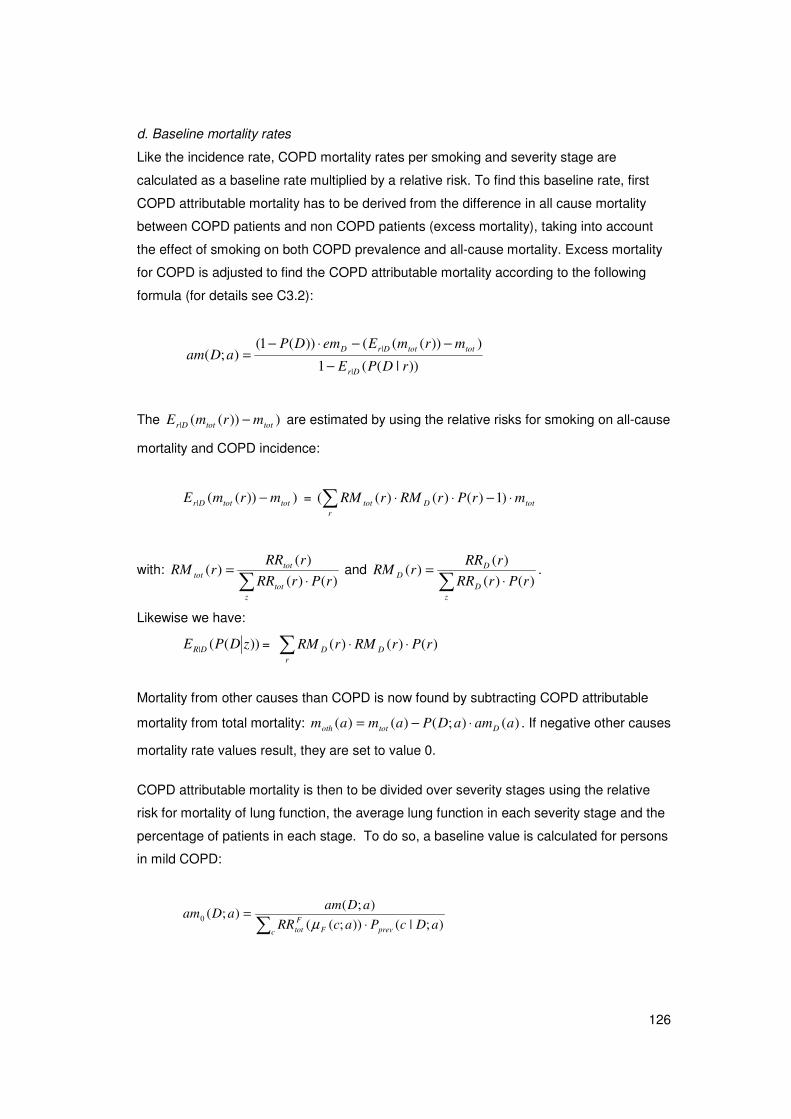
126
d. Baseline mortality rates
Like the incidence rate, COPD mortality rates per smoking and severity stage are
calculated as a baseline rate multiplied by a relative risk. To find this baseline rate, first
COPD attributable mortality has to be derived from the difference in all cause mortality
between COPD patients and non COPD patients (excess mortality), taking into account
the effect of smoking on both COPD prevalence and all-cause mortality. Excess mortality
for COPD is adjusted to find the COPD attributable mortality according to the following
formula (for details see C3.2):
))|((1
)))((())(1();(
|
|
rDPE
mrmEemDPaDam
Dr
tottotDrD
−
−−⋅−=
The )))((| tottotDr mrmE − are estimated by using the relative risks for smoking on all-cause
mortality and COPD incidence:
)))((| tottotDr mrmE − = totr
Dtot mrPrRMrRM ⋅−⋅⋅� )1)()()((
with: � ⋅
=
ztot
tottot rPrRR
rRRrRM
)()(
)()( and
� ⋅=
zD
DD rPrRR
rRRrRM
)()(
)()( .
Likewise we have:
))((| zDPE DR = � ⋅⋅r
DD rPrRMrRM )()()(
Mortality from other causes than COPD is now found by subtracting COPD attributable
mortality from total mortality: )();()()( aamaDPamam Dtototh ⋅−= . If negative other causes
mortality rate values result, they are set to value 0.
COPD attributable mortality is then to be divided over severity stages using the relative
risk for mortality of lung function, the average lung function in each severity stage and the
percentage of patients in each stage. To do so, a baseline value is calculated for persons
in mild COPD:
� ⋅=
c prevFFtot aDcPacRR
aDamaDam
);|());((
);();(0
μ
127
This mortality is then to be split into exacerbation related case fatality and a rest term. The
rest term is estimated after definition of policy scenarios that may affect exacerbation
frequency in the various COPD stages, but before the simulations. It is found by
subtracting exacerbation related mortality from severity specific COPD attributable
mortality:
);());(|();());(();( 0 aEmacEPaDamacRRacam FFFtototh ⋅−⋅= μμ
To prevent unrealistic values for specific mortality rates to occur the code contains to
external limits to the results of this calculation, setting its minimum value to 0 and its
maximum value to 0.6
D2.4 Simulation.
a. Apply the distribution of FEV1%pred on the population numbers in each severity stage
and smoking class to find the fractions flowing to and from neighboring stages
The fractions flowing from and to each severity stage as a result of the worsening of lung
function over time (or the improvement of lung function for recent quitters) are called the
COPD stage transition rates (transCOPD(j,r,c)).
These are calculated in the model for each year, using distribution characteristics for the
distribution of FEV1%pred within each severity stage, the lung function decrease/increase
in that period and changes in the distribution that result from changes in smoking
prevalences. The lung function decrease/increase in a period, f(j,r,c,g,a), is defined as a
function of lung function at the lower respectively upper boundary of each severity stage
and was estimated based on the Lung Health Study data. From the estimated function,
the f(j,r,c,g,a) are calculated as a function of age, gender, severity stage (i.e. lung function
at the boundary of the severity stage) and smoking class. To find the COPD stage
transition rates, the following steps are taken:
First, the mean decrease and increase for each severity and smoking class is found as
the weighted average over age and gender. Increases are only defined for ex smokers in
the year of quitting.
Mf(1,r,c) = �g,a (f(1,r,c,g,a) N(r,c,g,a)) / �g,a N(r,c,g,a), c=2,..6;r=1,..3
And
Mf(2,3,c)= �g,a (f(2,3,c,g,a) N(2,c,g,a) transsmok(1,2,g,a)) /�g,a [N(3,c,g,a) + N(2,c,g,a)
transsmok(1,2,g,a)] c=2,..6, with Mf(2,r,c)=0; r=1,2
128
Second, new COPD stage transition fractions are calculated for each smoking and
severity stage. These depend on the current distribution of lungfunction within the stage
(distfev), the stage, and the size of the transitions (mean decrease or increase) as follows:
transdown(distfev, c, down(c,r)) = down / (FEVlength(c)*(1+0.5*down*A) /
(1+0.5*A*FEVlength(c))
transup(distfev, c,up)= up / FEVlength(c)*(1+0.5*B*(Fevlength(c)-0.5 up)) /
(1+0.5*A*Fevlength(c))
With A=Abs(distfev(1)/distfev(2)+eps)),
B=distfev(1)/(distfev(2)+eps)
down(c,r)= P(E;x)*FE-Mf(1,r,c)
up(c,r)=Mf(2,r,c)
The transition rates are used in step b of the simulation. The mean decreases are used in
step c of the simulation.
b. Find new prevalences, i.e. new joint COPD severity and smoking prevalences
The new smoking and COPD stage prevalences are calculated. This uses the transCOPD
values from step a as well as the mFEV values.
Prevalence in each smoking and severity stage changes as a result of
1. COPD related mortality
2. Mortality from other causes, dependent on smoking class.
3. Outflow to next smoking class (i.e. from non to current and from current to former
smoker)
4. Outflow to previous smoking class (i.e. from former to current smoker)
5. Outflow to next, i.e. more severe COPD stage (equals 0 for very severe COPD)
6. Outflow to previous, i.e. less severe COPD stage (equals 0 for mild COPD)
7. COPD incidence
8. Inflow from previous smoking class (i.e. new smokers and new former smokers)
9. Inflow from next smoking class (i.e. restarting former smokers)
10. Inflow from previous, i.e. less severe COPD stage (equals 0 for mild COPD)
11. Inflow from next, i.e. more severe COPD stage (equals 0 for very severe COPD)
Because the smoking and COPD severity classes are ordered, only transitions to
neighbor classes are relevant. Another consequence of the state-transition structure of the
model is that each transition works as both an outflow and inflow. The only exception is
mortality.
This results in the following formulas for prevalence in the stages without and with COPD
respectively:
129
For c=1, i.e for being COPD-free, transitions1,5,6,10 and 11 are irrelevant, while
transition 7 causes outflow :
);,1())(;1(
);,1())(;1(
);,())(;())((
);,()))(;())(;((
);,())(())(;(
);,()1;,(
1
1
0
11
tDrPtar
tDrPtar
tDrPtarRRtai
tDrPtartar
tDrPtamtarRM
tDrPtDrP
R
R
RDD
RR
othRoth
+⋅++
−⋅−+
⋅⋅−
⋅+−
⋅⋅−
=+
−
+
++
λ
λ
λλ
For c>1, that is for persons with COPD, all transitions are relevant and transition 7 causes
inflow. Transition no 1 consists of COPD attributable mortality not through exacerbations
and case fatality from exacerbations.
);1,();,1(
);1,();,1(
);,1())(;1(
);,1())(;1(
);,())(;())(;())((
);,());,();,((
);,()))(;())(;((
);,())(())(;(
);,())(;());,(|(
);,())(;(
);,()1;,(
1
1
1
1
0
11
11
tcrPtrc
tcrPtrc
tdrPtar
tdrPtar
tDrPtacPtarRRtai
tcrPtrctrc
tcrPtartar
tcrPtamtarRM
tcrPtaEmtcrEP
tcrPtacam
tcrPtcrP
D
D
R
R
incRDD
DD
RR
othRoth
F
oth
+⋅++
−⋅−+
+⋅++
−⋅−+
⋅⋅⋅+
⋅+−
⋅+−
⋅⋅−
⋅⋅−
⋅−
=+
−
+
−
+
+−
−+
λ
λ
λ
λ
λλ
λλ
μ
Multiplication with initial population numbers results in current prevalence numbers rather
than current probabilities.
Using the above joint smoking and COPD severity class probability values, other
probability values may be calculated as follows:
Current smoking class probability values conditional on survival:
);(
);,();,();|(
tSP
tcrPtDrPtSrP c�+
=
with survival probability found as: � �+=r cr
tcrPtDrPtSP,
);,();,();(
130
c. Calculate new distributions of FEV1%pred and new meanFEV1% pred values specific
to smoking and severity stage
The new distributions of the FEV1%pred are calculated from the existing distributions, the
lung function decrease and increase for each COPD stage and smoking class (Mf(j,r,c))
found in part 1, as well as from mortality, specified by age, gender, smoking and COPD
stage. We described the lung function within each smoking and COPD state, which can
be interpreted as conditional on the state. Therefore we also have to take account of the
state (class) transitions. Class transitions result from autonomous (due to aging) and
intentional (due to smoking cessation) changes of the lung function, COPD incidence, and
smoking class transitions.
The sum (integral) of the lung function probability values for each joint smoking and
COPD severity class must equal the probability value calculated in the previous section.
However, due to the approximations we had to make this equality does not hold exactly.
By assumption the new joint smoking and COPD severity class probability values are
considered the right ones. As a result, a new lung function probability distribution function
over the entire lung function range and for each smoking class is calculated as the
product of the joint smoking and COPD class probability value times the distribution
function conditional on these classes. After each time step the opposite calculation step is
made and lung function distribution functions are calculated conditional on smoking and
COPD class. For reason of model robustness the distribution of the lung function was only
specified by smoking and COPD severity class, not by gender or age.
Consequently, for each one-year time-step the following calculation steps are set:
1. Un-conditioning the lung function probability distribution function
The distribution function over the entire lung function range and for each smoking class is
found by multiplying the class probability value with the conditional distribution function:
);,();,|();,( tcrPtcrxftxrf ⋅=
2a. Finding the mean annual change of the lung function, ignoring effects of smoking
cessation:
The annual mean change of the lung function for each smoking and COPD severity class
is found as the sum of autonomous decrease, first term, and additional decrease as a
result of exacerbations, second term. ‘Mean’ here refers to averaged over both genders
and all ages for a given smoking class.
x’(r,x;t) – � P(E|x)
131
The autonomous decrease was based on a regression formula fit on the Lung Health
Study data, and the effect of exacerbations was added.
2b. Change of parameters of linear lung function distribution due to autonomous decrease
and to incidence of newly diagnosed COPD patients:
The change of the lung function distribution function for each smoking and COPD severity
class was found given the autonomous lung function decrease calculated above. The
formulas used are described in more detail in section C3.2d below. The new parameters
are the result of drawing a new linear distribution function that combines the original linear
functions and the linear functions for the parts added from a less severe COPD severity
class. Then the effect of incidence is accounted for as follows. The probability mass
related to the incidence in the joint smoking class r and COPD class c is the 1-year
incidence probability times the proportion of new cases in class c:
. ))(;|();,())(;())((0 tadcPtDrPtarRRtai incRDD ⋅⋅⋅
The parameters of the lung function distribution for each class are updated by multiplying
this probability mass with the parameters of the initial lung function distribution within this
class.
2c. Change of lung function probability distribution function due to smoking class
transitions:
Since the lung function distribution functions are specified by smoking class, we also
calculated the effects of transitions between the smoking classes, using the smoking class
transition rates );1(1 arR −+λ and );1(1 arR −+λ . The calculation method is the same as
described in 2b.
Do[distFEV2[[ri, di]] = distFEV1[[ri, di]] (1 - Plus@@ptrsrokenCOPD[[ri, di]])+ If[(ri == 1), 0, ptrsrokenCOPD[[ri - 1, di, 1]] distFEV1[[ri - 1, di]]] + If[(ri == ncr), 0, ptrsrokenCOPD[[ri + 1, di, 2]] distFEV1[[ri + 1, di]]], {ri, ncr}, {di, nFEV}];
2d. Change of lung function probability distribution function because of increase due to
smoking cessation:
Then we calculated the change of the lung function distribution function due to smoking
cessation for each COPD severity class. This calculation step is made for the former
smokers only, and is analogous to step 2c.
132
Do[distFEV3[[3, di]] = newdistup[If[(di == 1), {0, 0}, distFEV2[[3, di - 1]]], distFEV2[[3, di]], di, dFEVup[[3, di]], If[(di == 1), 0, 1]], {di, nFEV}];
2e. Change of lung function probability distribution function due to mortality:
Mortality rates depend on the lung function, so the annual change of the probability
density function is not the same over the lung function range. Therefore we calculated the
change of the parameters of the distribution function, approximating the log-linear
mortality function by a linear one (see C3).
prevmean = Plus@@hnrokenCOPD / Plus@@Flatten[hnrokenCOPD]; emmean = Plus@@Plus@@Table[COPDexcessmortadj[[g]] *
Plus@@Plus@@nrokenCOPD[[g, All, 1 + Range[nFEV]]],
{g, ng}] / Plus@@Flatten[ nrokenCOPD[[All, All, 1 + Range[nFEV]]]]; mu0 = Exp[HRFEVtot FEVbord[[Range[nFEV]]]] /
Plus@@(Exp[HRFEVtot meanFEV0] prevmean) emmean; Do[ distFEV3[[ri, All, 1]] = (1 - mu0) distFEV3[[ri, All, 1]] –
distFEV3[[ri, All, 2]] mu0 HRFEVtot; distFEV3[[ri, All, 2]] *= (1 - mu0), {ri, ncr}];
3. Conditioning the lung function probability distribution function:
This is applying the first calculation step backwards:
� ∈
+
+=+
cuduturf
txrftcrxf
)1;,(
)1;,()1;,|(
The mean FEV values as well as the new normalized distribution functions are used in the
next simulation step.
D2.5 Cost and effect calculations
All calculated model state (smoking and COPD severity class) and event (exacerbations)
probability values can be valuated in terms of costs and effects. The expected costs for
any year t are the sum of the exacerbation related costs and COPD maintenance costs.
Exacerbation related costs are found as the costs per severe or moderate exacerbation
multiplied with their model state specific frequencies and the size of each model state and
summed over all model states (see section 2.6). Maintenance costs are found as the size
of each model state multiplied by the state specific maintenance costs.
133
��
⋅
+⋅+⋅⋅⋅
=
cr COPD
sevexacerbsevcr exacerball
totyr
tacKtcrP
tacKftacKfcEPtcrP
tK
,
,, mod,mod
))(;();,(
))](;())(;([)|();,(
)(
Similarly, the expected quality of life for any year t was calculated from state specific base
utilities and exacerbation related utility losses (see section 2.5). The latter were subtracted
for each state.
][))(;()|();,(
))(;();,(
)(
,, mod,mod
,
sevexacerbsevcr exacerbCOPDall
cr COPD
totyr
QALYfQALYftacQALYcEPtcrP
tacQALYtcrP
tQALY
⋅+⋅⋅⋅⋅
−⋅
=
��
Total costs and health benefits are then found by adding costs and benefits over the entire
time horizon. Future costs and effects are discounted using discount rates.
Running policy scenarios through the model thus results in net present values of total
costs over the entire time horizon for the different scenarios. Comparing these values to
the values for the base case scenario, or for a comparator policy scenario, results in
incremental costs and incremental health benefits. These were related and presented as
cost-effectiveness ratios.
D2.6 Structure of the probabilistic model
This section describes how the probabilistic sensitivity analysis was carried out in the
model and how this was implemented in the model code. Section 4.2 presents the
parameters included in the PSA.
The figure below pictures the basic structure for performing Monte Carlo simulations, with
different values for the model parameters in each run. In a first deterministic run, the
model applies mean parameter values for all variables (run 1). For all runs to follow
random parameter values are used. In each run the results of several scenarios can be
calculated. The results of each run are stored in working memory, and in backing store
(MMA file "outfileresmodelrun.m"). The results of each new model run overwrite the results of
the previous run in working memory. In case of multiple runs, at the end the distributions
of some model output variables are presented.
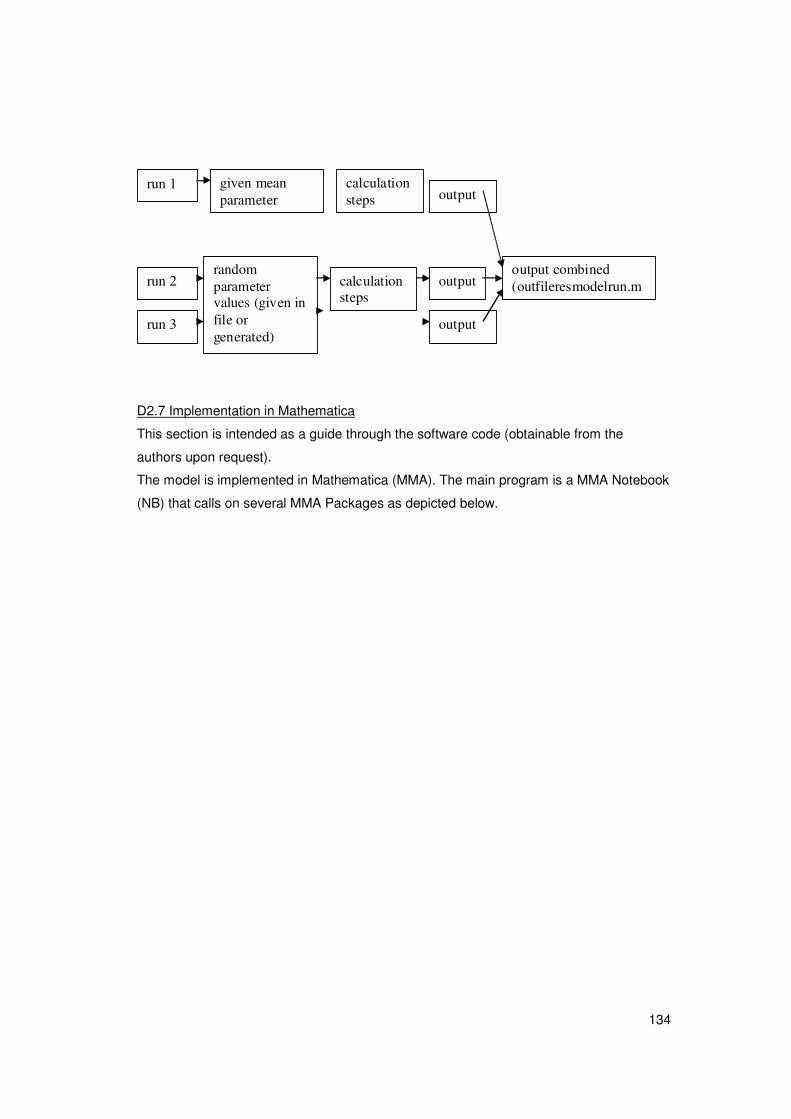
134
D2.7 Implementation in Mathematica
This section is intended as a guide through the software code (obtainable from the
authors upon request).
The model is implemented in Mathematica (MMA). The main program is a MMA Notebook
(NB) that calls on several MMA Packages as depicted below.
run 1 given mean parameter
calculation steps output
run 2 random parameter values (given in file or generated)
calculation steps
output
run 3 output
output combined (outfileresmodelrun.m
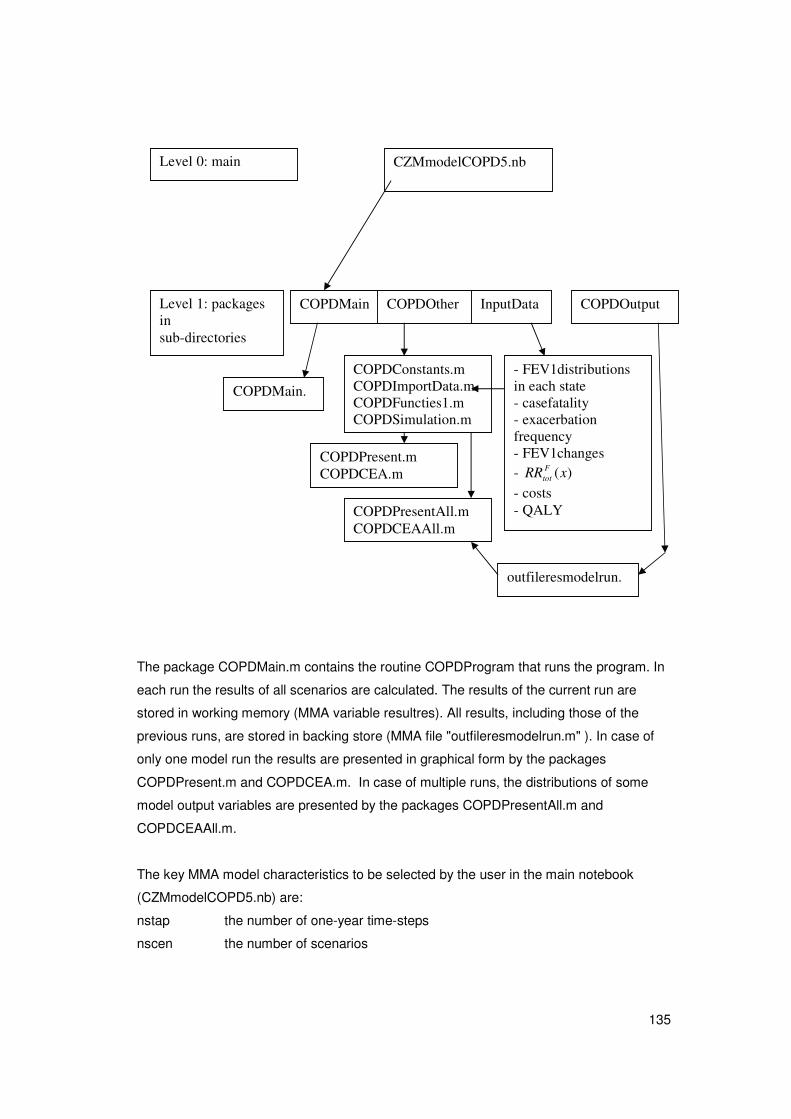
135
The package COPDMain.m contains the routine COPDProgram that runs the program. In
each run the results of all scenarios are calculated. The results of the current run are
stored in working memory (MMA variable resultres). All results, including those of the
previous runs, are stored in backing store (MMA file "outfileresmodelrun.m" ). In case of
only one model run the results are presented in graphical form by the packages
COPDPresent.m and COPDCEA.m. In case of multiple runs, the distributions of some
model output variables are presented by the packages COPDPresentAll.m and
COPDCEAAll.m.
The key MMA model characteristics to be selected by the user in the main notebook
(CZMmodelCOPD5.nb) are:
nstap the number of one-year time-steps
nscen the number of scenarios
CZMmodelCOPD5.nb Level 0: main program
Level 1: packages in sub-directories
COPDMain COPDOther InputData COPDOutput
COPDMain.
COPDConstants.m COPDImportData.m COPDFuncties1.m COPDSimulation.m
COPDPresent.m COPDCEA.m
- FEV1distributions in each state - casefatality - exacerbation frequency - FEV1changes - )(xRR F
tot
- costs - QALY
outfileresmodelrun.m
COPDPresentAll.m COPDCEAAll.m
136
nrun the number of runs (run 1 uses the mean parameter values; all other runs
random values)
The scenarios are defined in MMA programming statements that are packed in string
format. At the start of each scenario, the string is evaluated, and so the scenario-specific
values of all scenario (steering) parameters are assessed.
The MMA variable resultres contains the model results of the current model run, and the
MMA file "outfileresmodelrun.m" contains the model results of all model runs. The first
element of this file is the number of runs, and the next elements are copies of the variable
resultres. This variable is a list of the following outcome variables:
1. prevrokenCOPDres, prevalence numbers in model states with the size
nscen*nrun*ng*nr*nd*nage, ie. Number of scenarios times number of runs (time horizon)
times 2 (male and female) times number of smoking classes times number of COPD
severity stages.
2. incCOPDres, COPD incidence numbers, with the size nscen*nrun*ng*nr*nage, that is
only specific to smoking class, not to COPD severity stage.
3. mortrokenCOPDres, mortality numbers in model states with the size nscen*nrun*
ng*nr*(nd-1)*3*nage. Only COPDmortality in COPD stages. Three different types of
mortality are distinguished: mortality from other causes than COPD, COPD-attributable
mortality other than from exacerbations, and COPD-attributable mortality from
exacerbations.
4. incres, incidence numbers for other diseases, with the size nscen*nrun*ndis*ng*nage,
with ndis the number of other diseases distinguished.
5. prevres, prevalence numbers for other diseases, with the same size
6. mortcausres, mortality numbers for other diseases, with the same size
7. distFEVres, parameters of linear distribution of lung function within COPD severity
classes, with the size nscen*nrun*nr*nd-1*2, since 2 parameters for each
distribution function are estimated (a and b)
8. exacerbres, severe and total exacerbation numbers, with the size nscen*nrun*2*nd-1:
exacerbation numbers in each COPD severity stage, for severe exacerbations only and
for total exacerbations.
9. all kea outcomes.
{QALYCOPD, QALYexacerbsev, QALYexacerbmod, costsCOPDpatient,
costsexacerbsev, costsexacerbmod},
This element of the list is a compound Mathematica list that has 6 fields. The first field has
5 fields itself, one for each COPD severity stage. The second and third fields are single
figures reflecting the relative utility decrement for a severe and a moderate exacerbation,

137
respectively. The 4th field is a list of size ng*nd-1*nage, containing costs per patient,
specific to gender and age and COPD severity stage. The 5th and 6th fields are single
figures again.
For model verification and debugging several options are available. In the package
COPDMain the MMA variable bugind is defined. In case of value 1 labels are printed on
screen that enables the model user to locate program errors. In case of multiple runs
(nrun>1), no labels are printed because that would slow down the program too much. In
the package COPDSimulation.m the MMA variable plotind is defined. In case of value 1
the calculated lung function distribution functions are presented graphically.
The file maakprint.bat generates a listing in ASCII-format of all MMA packages used.
D3. Mathematical background for specific model elements.
This section provides further elaboration on specific model elements. The mathematical
model was defined in continuous time. We have made this model time-discrete using 1-
year time-steps using the Euler-method of order 1. In section C2 the description hence
was as much as possible in terms of 1 year time steps, but this section will describe the
original mathematical structure in continuous time.
Section C3.1 describes the linear approximation of the distribution function of the lung
function within each severity class. We work out the formulas for several aspects: the
calculation of the annual COPD severity class transition probability, the annual update of
the parameters of the linear distribution function, and the effect of mortality on these
parameters.
Section C3.2 discusses all parameters that are related to mortality. We start in C3.2a with
the excess mortality rate and adjust to a mortality rate that uniquely can be attributed to
COPD. The calculation method is part of the standard methodology of the RIVM Chronic
Disease Model. We proceed in C3.2b with the case fatality of an exacerbation. Then in
C3.2c, the proportion of the COPD-related excess mortality that does not result from the
case fatality of exacerbations is found. Finally mortality from other causes is defined in
C3.2d.
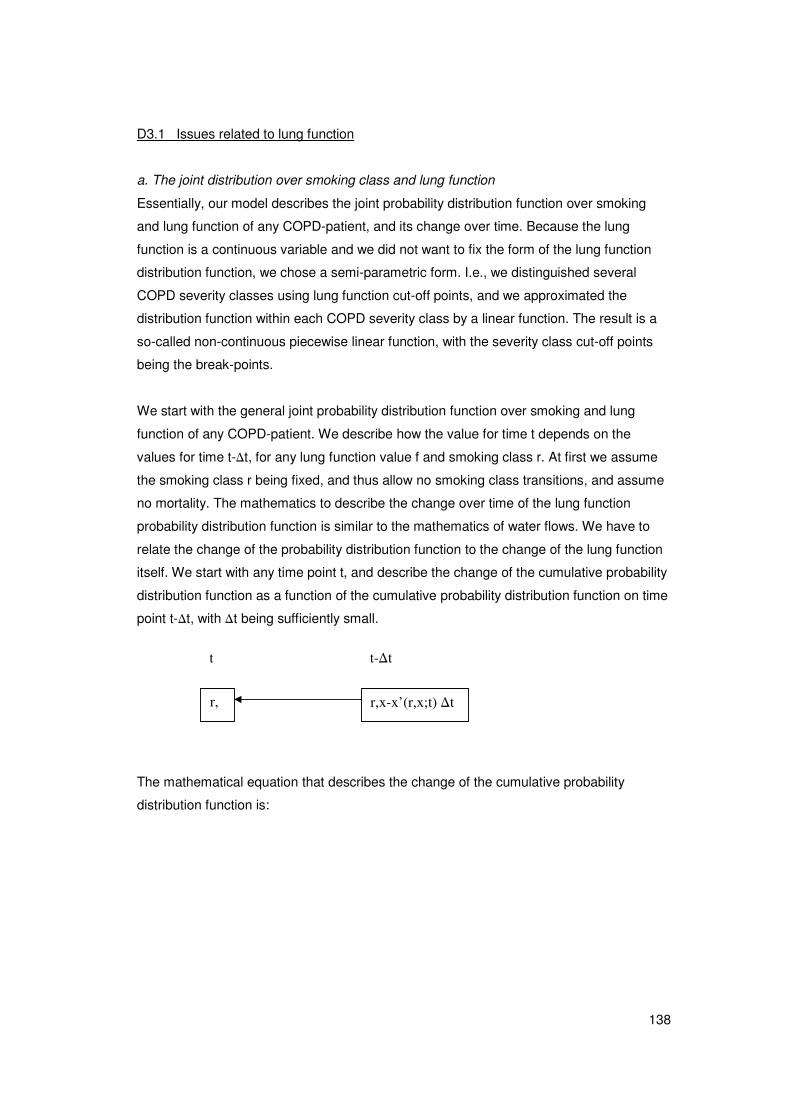
138
D3.1 Issues related to lung function
a. The joint distribution over smoking class and lung function
Essentially, our model describes the joint probability distribution function over smoking
and lung function of any COPD-patient, and its change over time. Because the lung
function is a continuous variable and we did not want to fix the form of the lung function
distribution function, we chose a semi-parametric form. I.e., we distinguished several
COPD severity classes using lung function cut-off points, and we approximated the
distribution function within each COPD severity class by a linear function. The result is a
so-called non-continuous piecewise linear function, with the severity class cut-off points
being the break-points.
We start with the general joint probability distribution function over smoking and lung
function of any COPD-patient. We describe how the value for time t depends on the
values for time t-�t, for any lung function value f and smoking class r. At first we assume
the smoking class r being fixed, and thus allow no smoking class transitions, and assume
no mortality. The mathematics to describe the change over time of the lung function
probability distribution function is similar to the mathematics of water flows. We have to
relate the change of the probability distribution function to the change of the lung function
itself. We start with any time point t, and describe the change of the cumulative probability
distribution function as a function of the cumulative probability distribution function on time
point t-�t, with �t being sufficiently small.
The mathematical equation that describes the change of the cumulative probability
distribution function is:
r, r,x-x’(r,x;t) �t
t t-�t
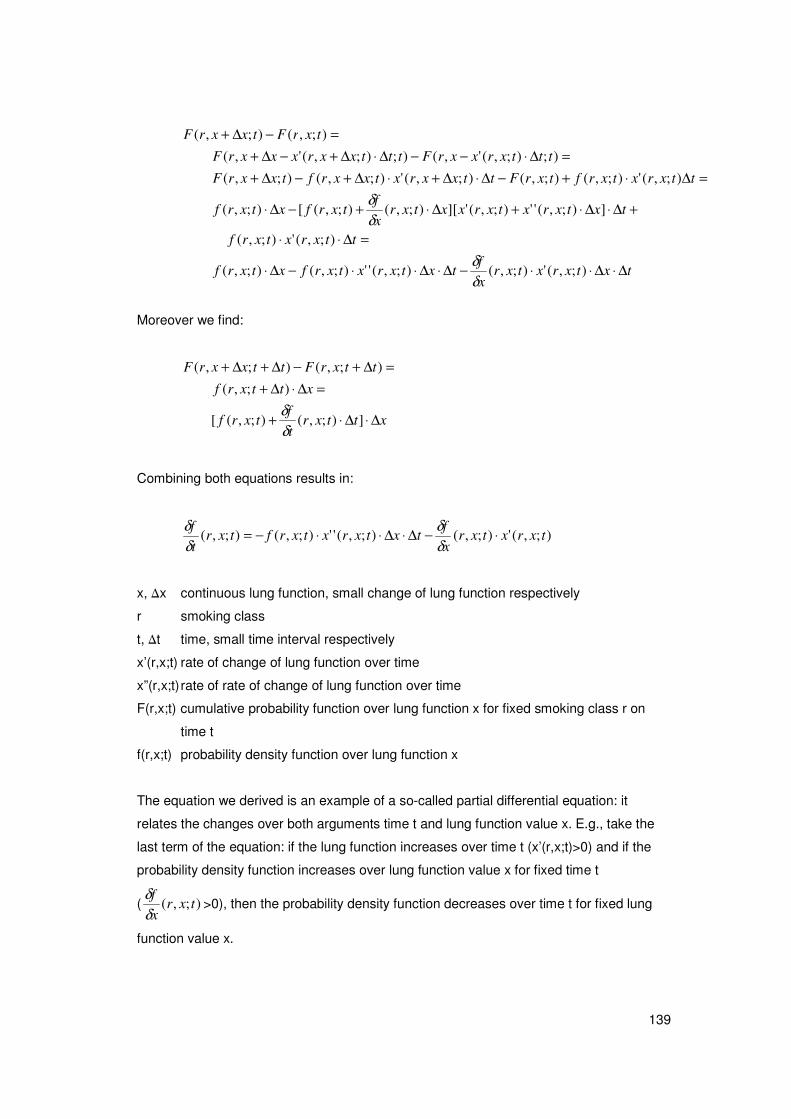
139
txtxrxtxrx
ftxtxrxtxrfxtxrf
ttxrxtxrf
txtxrxtxrxxtxrx
ftxrfxtxrf
ttxrxtxrftxrFttxxrxtxxrftxxrF
tttxrxxrFtttxxrxxxrF
txrFtxxrF
Δ⋅Δ⋅⋅−Δ⋅Δ⋅⋅−Δ⋅
=Δ⋅⋅
+Δ⋅Δ⋅+Δ⋅+−Δ⋅
=Δ⋅+−Δ⋅Δ+⋅Δ+−Δ+
=Δ⋅−−Δ⋅Δ+−Δ+
=−Δ+
);,(');,();,('');,();,(
);,(');,(
]);,('');,('][);,();,([);,(
);,(');,();,();,(');,();,(
););,(',(););,(',(
);,();,(
δ
δ
δ
δ
Moreover we find:
xttxrt
ftxrf
xttxrf
ttxrFttxxrF
Δ⋅Δ⋅+
=Δ⋅Δ+
=Δ+−Δ+Δ+
]);,();,([
);,(
);,();,(
δ
δ
Combining both equations results in:
);,(');,();,('');,();,( txrxtxrx
ftxtxrxtxrftxr
t
f⋅−Δ⋅Δ⋅⋅−=
δ
δ
δ
δ
x, �x continuous lung function, small change of lung function respectively
r smoking class
t, �t time, small time interval respectively
x’(r,x;t) rate of change of lung function over time
x”(r,x;t) rate of rate of change of lung function over time
F(r,x;t) cumulative probability function over lung function x for fixed smoking class r on
time t
f(r,x;t) probability density function over lung function x
The equation we derived is an example of a so-called partial differential equation: it
relates the changes over both arguments time t and lung function value x. E.g., take the
last term of the equation: if the lung function increases over time t (x’(r,x;t)>0) and if the
probability density function increases over lung function value x for fixed time t
( );,( txrx
f
δ
δ>0), then the probability density function decreases over time t for fixed lung
function value x.
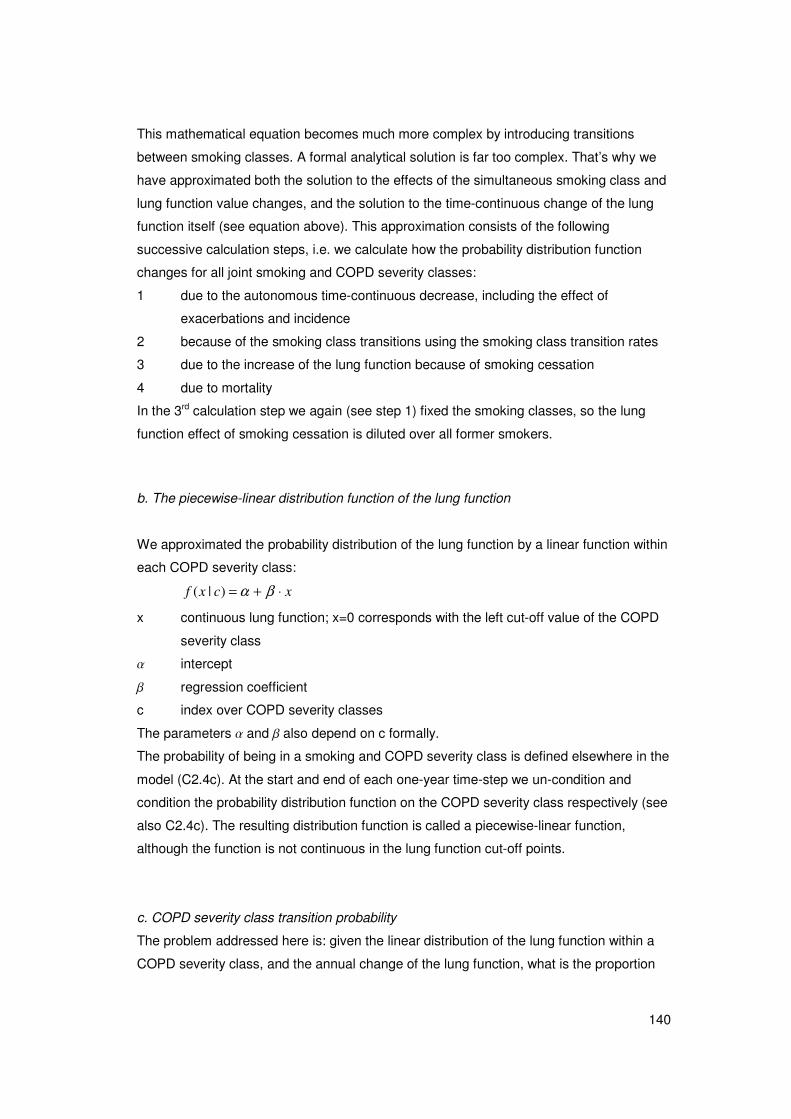
140
This mathematical equation becomes much more complex by introducing transitions
between smoking classes. A formal analytical solution is far too complex. That’s why we
have approximated both the solution to the effects of the simultaneous smoking class and
lung function value changes, and the solution to the time-continuous change of the lung
function itself (see equation above). This approximation consists of the following
successive calculation steps, i.e. we calculate how the probability distribution function
changes for all joint smoking and COPD severity classes:
1 due to the autonomous time-continuous decrease, including the effect of
exacerbations and incidence
2 because of the smoking class transitions using the smoking class transition rates
3 due to the increase of the lung function because of smoking cessation
4 due to mortality
In the 3rd calculation step we again (see step 1) fixed the smoking classes, so the lung
function effect of smoking cessation is diluted over all former smokers.
b. The piecewise-linear distribution function of the lung function
We approximated the probability distribution of the lung function by a linear function within
each COPD severity class:
xcxf ⋅+= βα)|(
x continuous lung function; x=0 corresponds with the left cut-off value of the COPD
severity class
� intercept
� regression coefficient
c index over COPD severity classes
The parameters � and � also depend on c formally.
The probability of being in a smoking and COPD severity class is defined elsewhere in the
model (C2.4c). At the start and end of each one-year time-step we un-condition and
condition the probability distribution function on the COPD severity class respectively (see
also C2.4c). The resulting distribution function is called a piecewise-linear function,
although the function is not continuous in the lung function cut-off points.
c. COPD severity class transition probability
The problem addressed here is: given the linear distribution of the lung function within a
COPD severity class, and the annual change of the lung function, what is the proportion
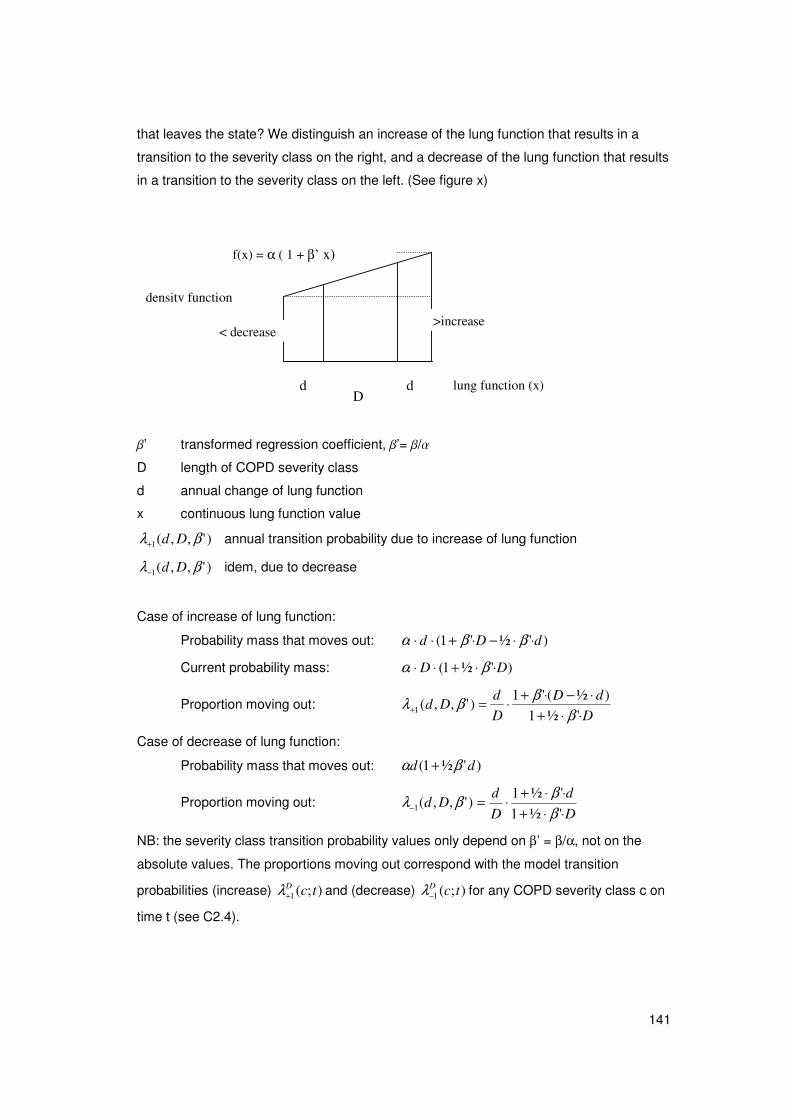
141
that leaves the state? We distinguish an increase of the lung function that results in a
transition to the severity class on the right, and a decrease of the lung function that results
in a transition to the severity class on the left. (See figure x)
�’ transformed regression coefficient, �’= �/�
D length of COPD severity class
d annual change of lung function
x continuous lung function value
)',,(1 βλ Dd+ annual transition probability due to increase of lung function
)',,(1 βλ Dd− idem, due to decrease
Case of increase of lung function:
Probability mass that moves out: )'½'1( dDd ⋅⋅−⋅+⋅⋅ ββα
Current probability mass: )'½1( DD ⋅⋅+⋅⋅ βα
Proportion moving out: D
dD
D
dDd
⋅⋅+
⋅−⋅+⋅=+ '½1
)½('1)',,(1
β
ββλ
Case of decrease of lung function:
Probability mass that moves out: )'½1( dd βα +
Proportion moving out: D
d
D
dDd
⋅⋅+
⋅⋅+⋅=− '½1
'½1)',,(1
β
ββλ
NB: the severity class transition probability values only depend on β’ = β/α, not on the
absolute values. The proportions moving out correspond with the model transition
probabilities (increase) );(1 tcD+λ and (decrease) );(1 tcD
−λ for any COPD severity class c on
time t (see C2.4).
lung function (x) D
d
>increase
d
f(x) = α ( 1 + β’ x)
density function
< decrease
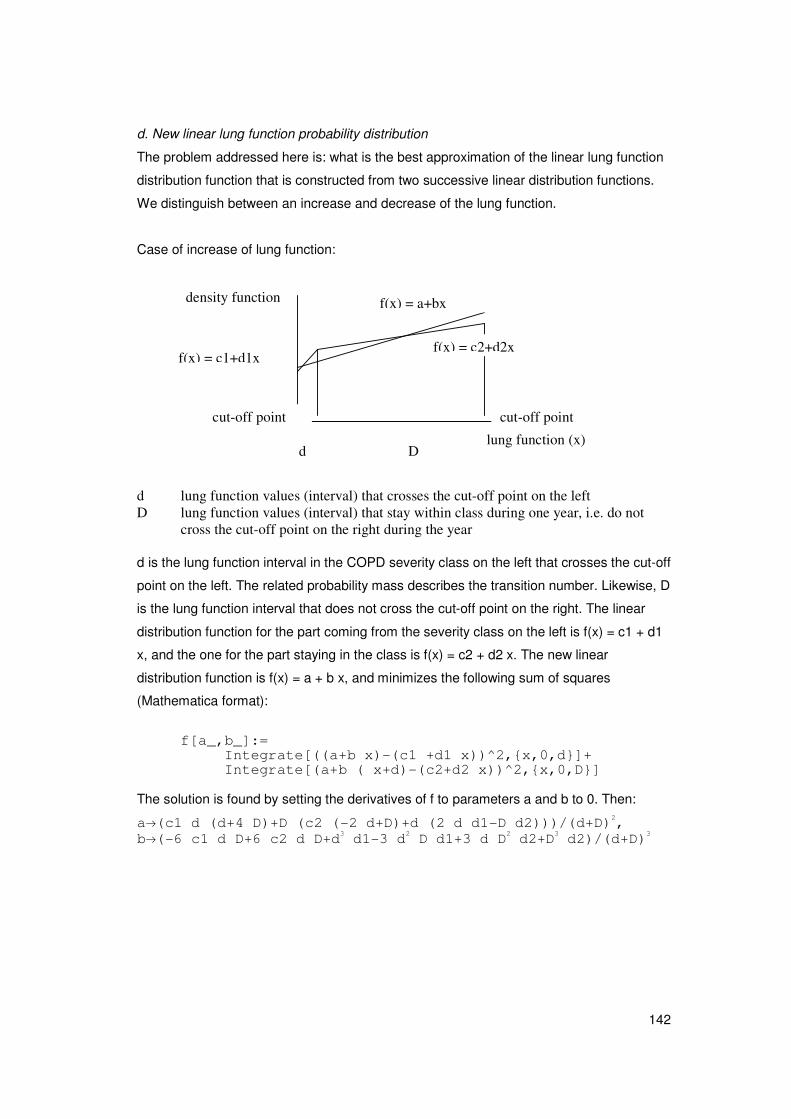
142
d. New linear lung function probability distribution
The problem addressed here is: what is the best approximation of the linear lung function
distribution function that is constructed from two successive linear distribution functions.
We distinguish between an increase and decrease of the lung function.
Case of increase of lung function:
d lung function values (interval) that crosses the cut-off point on the left D lung function values (interval) that stay within class during one year, i.e. do not
cross the cut-off point on the right during the year d is the lung function interval in the COPD severity class on the left that crosses the cut-off
point on the left. The related probability mass describes the transition number. Likewise, D
is the lung function interval that does not cross the cut-off point on the right. The linear
distribution function for the part coming from the severity class on the left is f(x) = c1 + d1
x, and the one for the part staying in the class is f(x) = c2 + d2 x. The new linear
distribution function is f(x) = a + b x, and minimizes the following sum of squares
(Mathematica format):
f[a_,b_]:=
Integrate[((a+b x)-(c1 +d1 x))^2,{x,0,d}]+ Integrate[(a+b ( x+d)-(c2+d2 x))^2,{x,0,D}]
The solution is found by setting the derivatives of f to parameters a and b to 0. Then:
a�(c1 d (d+4 D)+D (c2 (-2 d+D)+d (2 d d1-D d2)))/(d+D)2, b�(-6 c1 d D+6 c2 d D+d3 d1-3 d2 D d1+3 d D2 d2+D3 d2)/(d+D)3
lung function (x)
density function
D d
f(x) = a+bx
f(x) = c2+d2x f(x) = c1+d1x
cut-off point
cut-off point
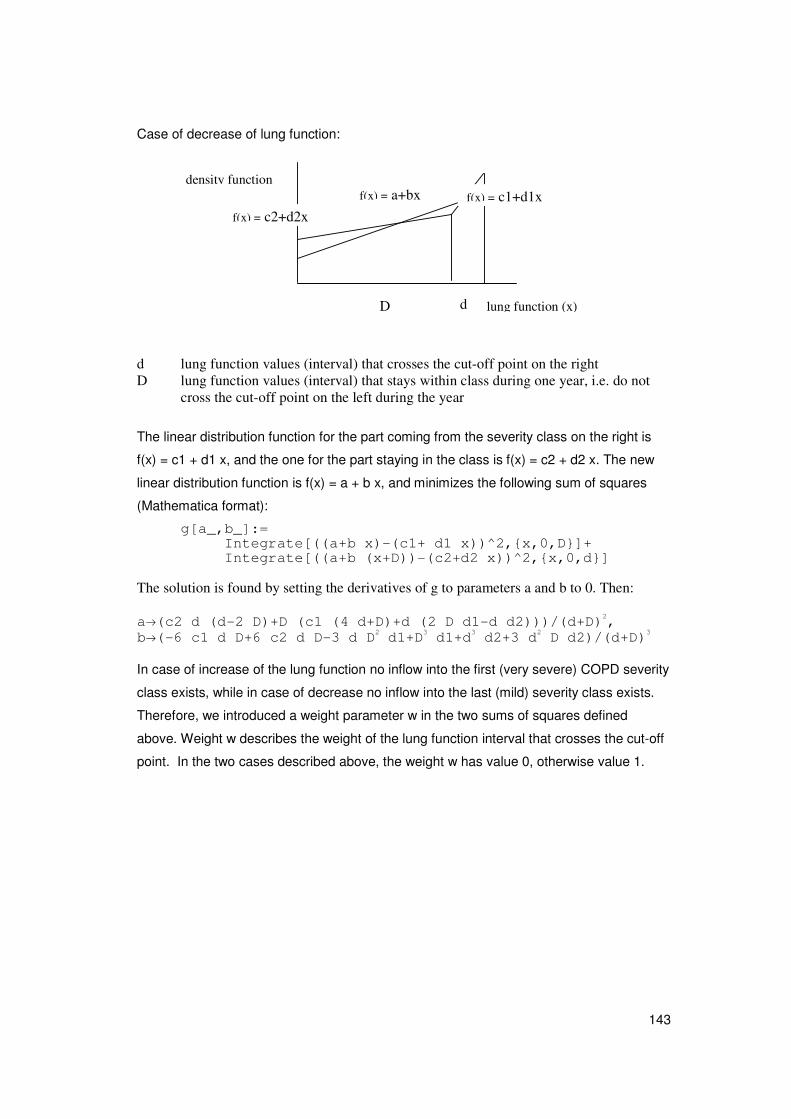
143
Case of decrease of lung function:
d lung function values (interval) that crosses the cut-off point on the right D lung function values (interval) that stays within class during one year, i.e. do not
cross the cut-off point on the left during the year
The linear distribution function for the part coming from the severity class on the right is
f(x) = c1 + d1 x, and the one for the part staying in the class is f(x) = c2 + d2 x. The new
linear distribution function is f(x) = a + b x, and minimizes the following sum of squares
(Mathematica format):
g[a_,b_]:= Integrate[((a+b x)-(c1+ d1 x))^2,{x,0,D}]+ Integrate[((a+b (x+D))-(c2+d2 x))^2,{x,0,d}]
The solution is found by setting the derivatives of g to parameters a and b to 0. Then: a�(c2 d (d-2 D)+D (c1 (4 d+D)+d (2 D d1-d d2)))/(d+D)2, b�(-6 c1 d D+6 c2 d D-3 d D2 d1+D3 d1+d3 d2+3 d2 D d2)/(d+D)3 In case of increase of the lung function no inflow into the first (very severe) COPD severity
class exists, while in case of decrease no inflow into the last (mild) severity class exists.
Therefore, we introduced a weight parameter w in the two sums of squares defined
above. Weight w describes the weight of the lung function interval that crosses the cut-off
point. In the two cases described above, the weight w has value 0, otherwise value 1.
lung function (x)
density function
D d
f(x) = a+bx f(x) = c1+d1x f(x) = c2+d2x
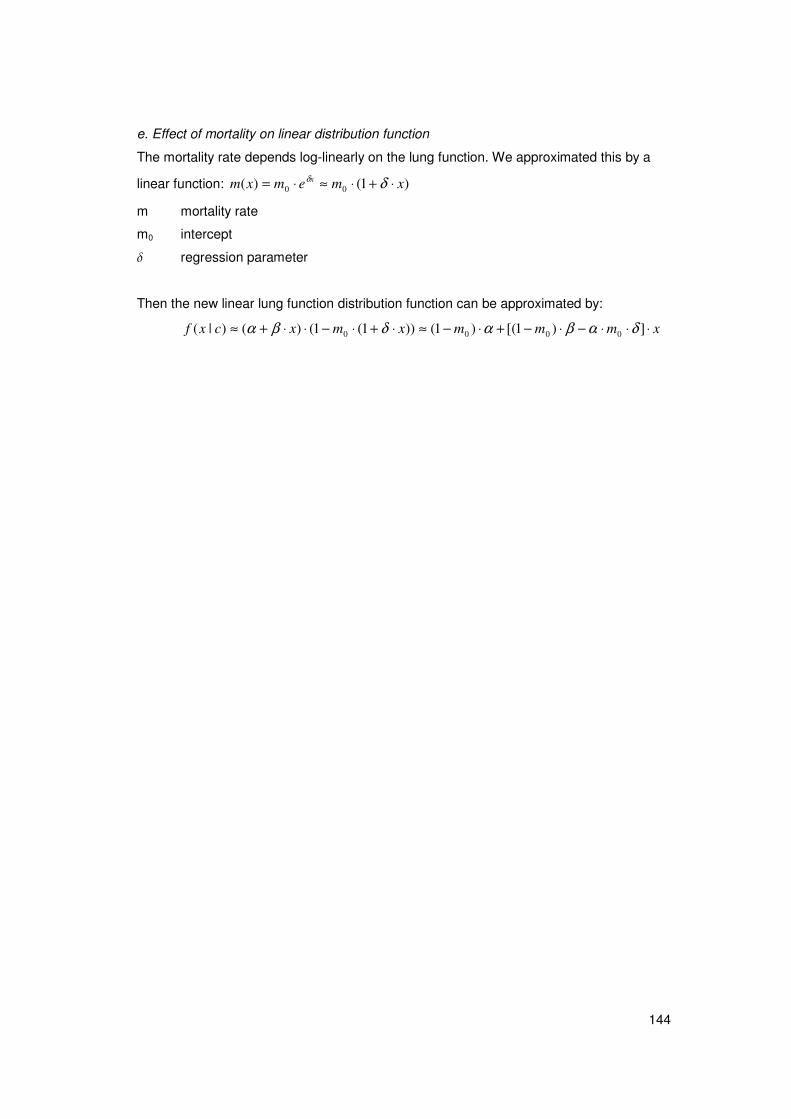
144
e. Effect of mortality on linear distribution function
The mortality rate depends log-linearly on the lung function. We approximated this by a
linear function: )1()( 00 xmemxm x ⋅+⋅≈⋅= δδ
m mortality rate
m0 intercept
� regression parameter
Then the new linear lung function distribution function can be approximated by:
xmmmxmxcxf ⋅⋅⋅−⋅−+⋅−≈⋅+⋅−⋅⋅+≈ ])1[()1())1(1()()|( 0000 δαβαδβα
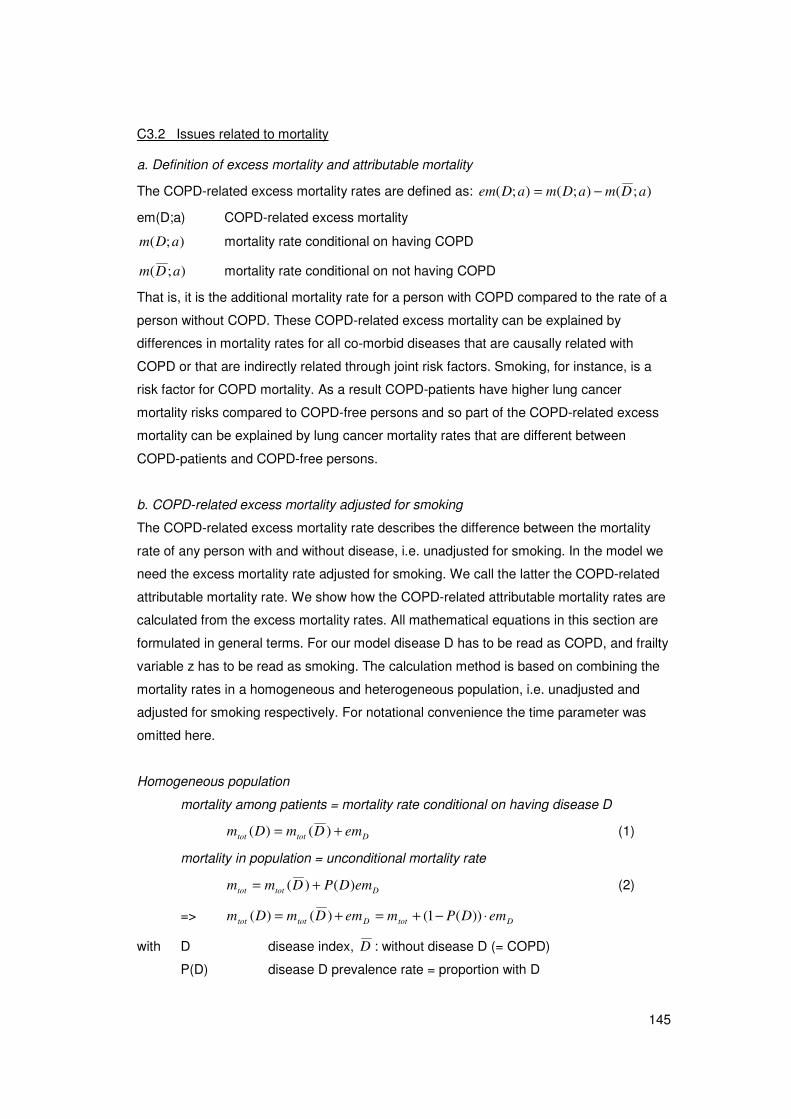
145
C3.2 Issues related to mortality a. Definition of excess mortality and attributable mortality
The COPD-related excess mortality rates are defined as: );();();( aDmaDmaDem −=
em(D;a) COPD-related excess mortality
);( aDm mortality rate conditional on having COPD
);( aDm mortality rate conditional on not having COPD
That is, it is the additional mortality rate for a person with COPD compared to the rate of a
person without COPD. These COPD-related excess mortality can be explained by
differences in mortality rates for all co-morbid diseases that are causally related with
COPD or that are indirectly related through joint risk factors. Smoking, for instance, is a
risk factor for COPD mortality. As a result COPD-patients have higher lung cancer
mortality risks compared to COPD-free persons and so part of the COPD-related excess
mortality can be explained by lung cancer mortality rates that are different between
COPD-patients and COPD-free persons.
b. COPD-related excess mortality adjusted for smoking
The COPD-related excess mortality rate describes the difference between the mortality
rate of any person with and without disease, i.e. unadjusted for smoking. In the model we
need the excess mortality rate adjusted for smoking. We call the latter the COPD-related
attributable mortality rate. We show how the COPD-related attributable mortality rates are
calculated from the excess mortality rates. All mathematical equations in this section are
formulated in general terms. For our model disease D has to be read as COPD, and frailty
variable z has to be read as smoking. The calculation method is based on combining the
mortality rates in a homogeneous and heterogeneous population, i.e. unadjusted and
adjusted for smoking respectively. For notational convenience the time parameter was
omitted here.
Homogeneous population
mortality among patients = mortality rate conditional on having disease D
Dtottot emDmDm += )()( (1)
mortality in population = unconditional mortality rate
Dtottot emDPDmm )()( += (2)
=> DtotDtottot emDPmemDmDm ⋅−+=+= ))(1()()(
with D disease index, D : without disease D (= COPD)
P(D) disease D prevalence rate = proportion with D
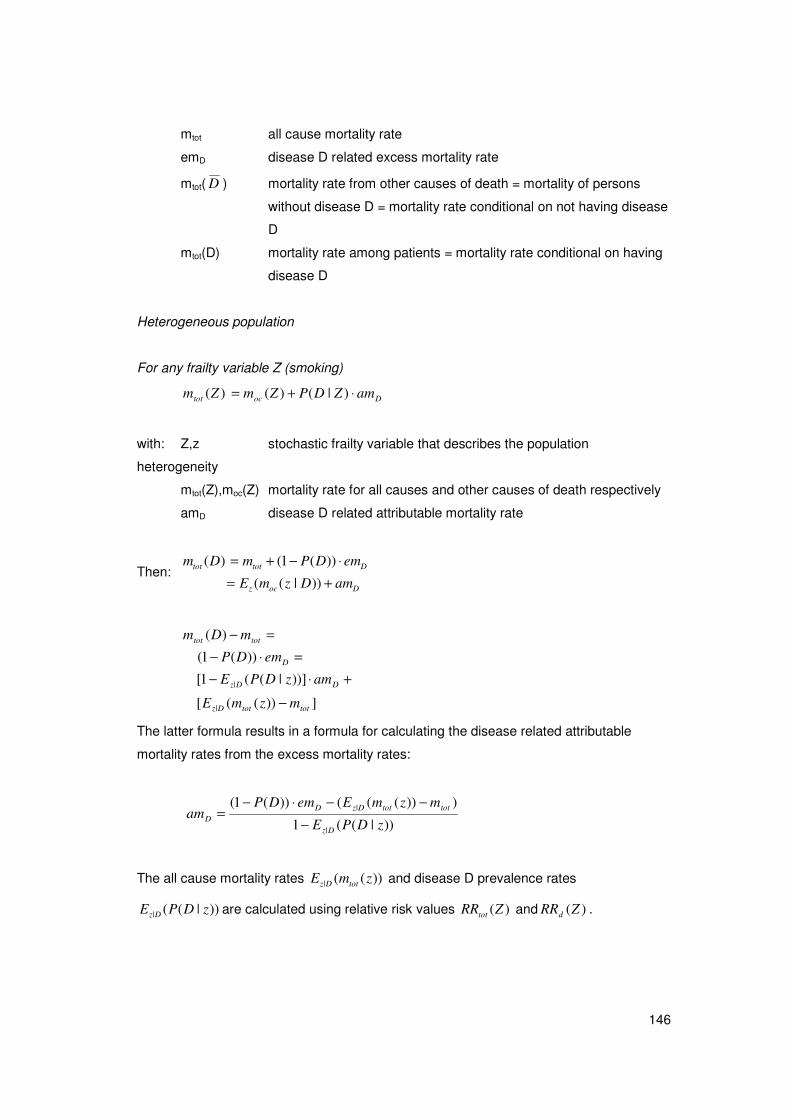
146
mtot all cause mortality rate
emD disease D related excess mortality rate
mtot( D ) mortality rate from other causes of death = mortality of persons
without disease D = mortality rate conditional on not having disease
D
mtot(D) mortality rate among patients = mortality rate conditional on having
disease D
Heterogeneous population
For any frailty variable Z (smoking)
Doctot amZDPZmZm ⋅+= )|()()(
with: Z,z stochastic frailty variable that describes the population
heterogeneity
mtot(Z),moc(Z) mortality rate for all causes and other causes of death respectively
amD disease D related attributable mortality rate
Then: Docz
Dtottot
amDzmE
emDPmDm
+=
⋅−+=
))|((
))(1()(
]))(([
))]|((1[
))(1(
)(
|
|
tottotDz
DDz
D
tottot
mzmE
amzDPE
emDP
mDm
−
+⋅−
=⋅−
=−
The latter formula results in a formula for calculating the disease related attributable
mortality rates from the excess mortality rates:
))|((1
)))((())(1(
|
|
zDPE
mzmEemDPam
Dz
tottotDzDD
−
−−⋅−=
The all cause mortality rates ))((| zmE totDz and disease D prevalence rates
))|((| zDPE Dz are calculated using relative risk values )(ZRRtot and )(ZRRd .
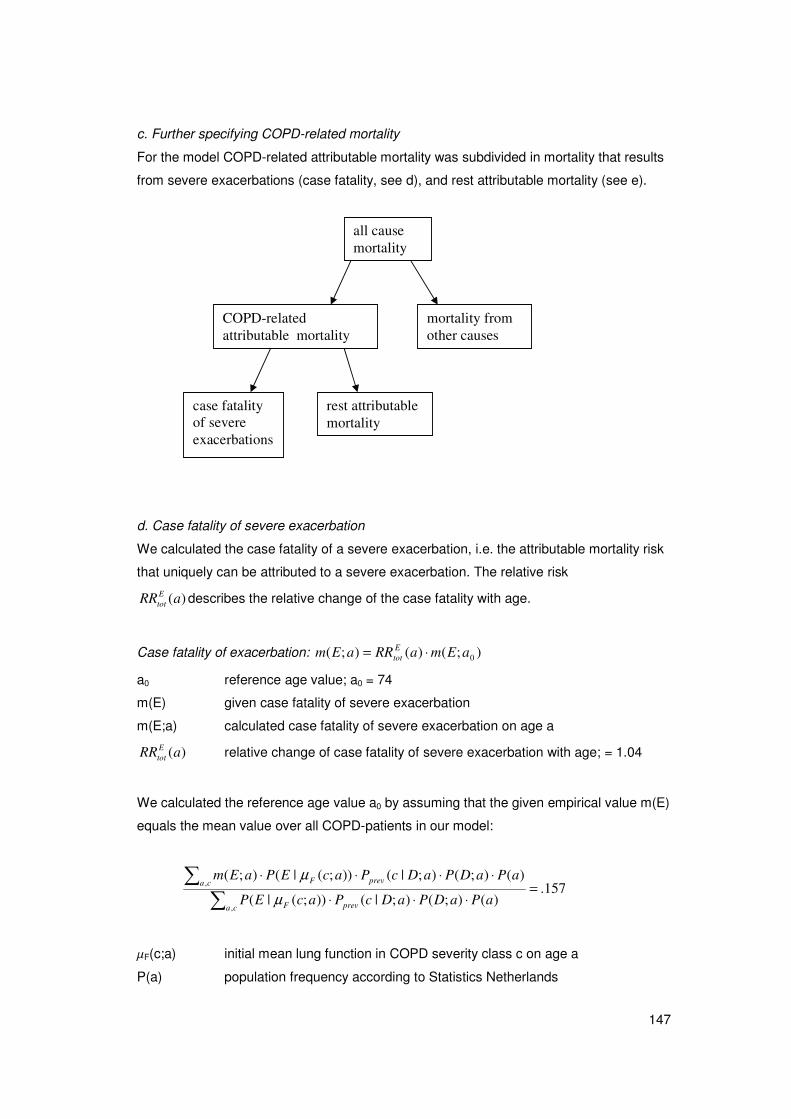
147
c. Further specifying COPD-related mortality
For the model COPD-related attributable mortality was subdivided in mortality that results
from severe exacerbations (case fatality, see d), and rest attributable mortality (see e).
d. Case fatality of severe exacerbation
We calculated the case fatality of a severe exacerbation, i.e. the attributable mortality risk
that uniquely can be attributed to a severe exacerbation. The relative risk
)(aRREtot describes the relative change of the case fatality with age.
Case fatality of exacerbation: );()();( 0aEmaRRaEm Etot ⋅=
a0 reference age value; a0 = 74
m(E) given case fatality of severe exacerbation
m(E;a) calculated case fatality of severe exacerbation on age a
)(aRREtot relative change of case fatality of severe exacerbation with age; = 1.04
We calculated the reference age value a0 by assuming that the given empirical value m(E)
equals the mean value over all COPD-patients in our model:
157.)();();|());(|(
)();();|());(|();(
,
,=
⋅⋅⋅
⋅⋅⋅⋅
��
ca prevF
ca prevF
aPaDPaDcPacEP
aPaDPaDcPacEPaEm
μ
μ
�F(c;a) initial mean lung function in COPD severity class c on age a
P(a) population frequency according to Statistics Netherlands
all cause mortality
COPD-related attributable mortality
mortality from other causes
case fatality of severe exacerbations
rest attributable mortality
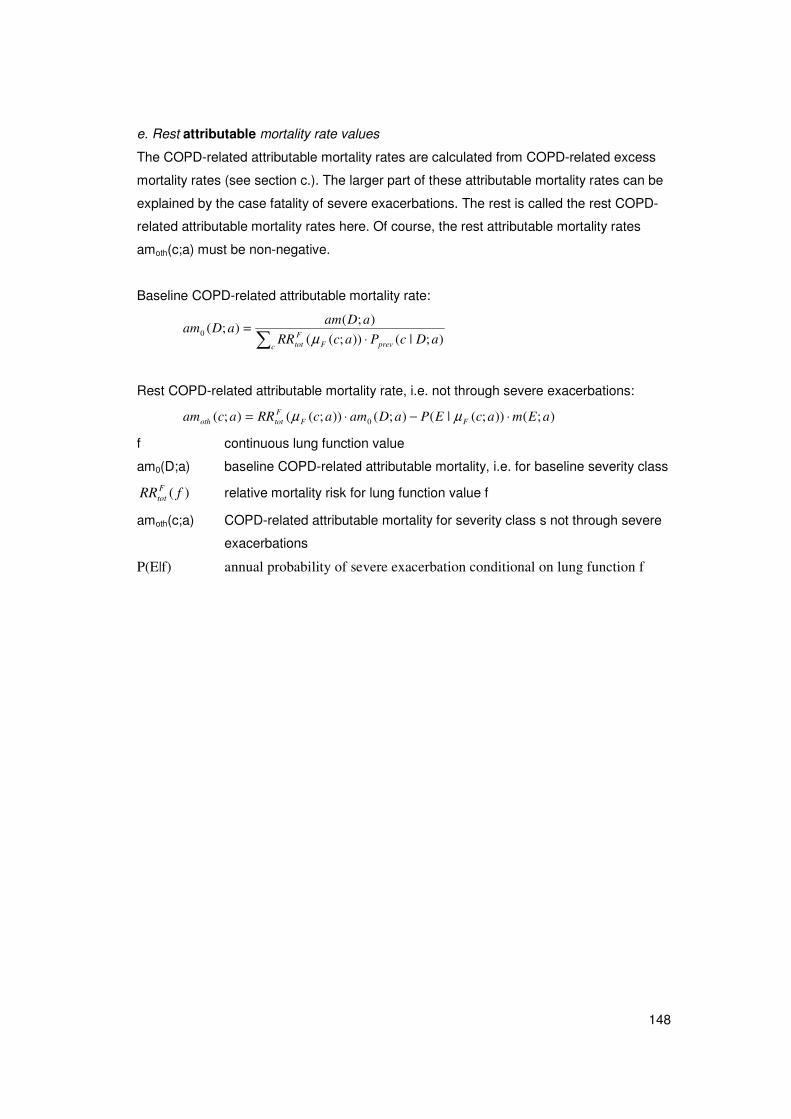
148
e. Rest attributable mortality rate values
The COPD-related attributable mortality rates are calculated from COPD-related excess
mortality rates (see section c.). The larger part of these attributable mortality rates can be
explained by the case fatality of severe exacerbations. The rest is called the rest COPD-
related attributable mortality rates here. Of course, the rest attributable mortality rates
amoth(c;a) must be non-negative.
Baseline COPD-related attributable mortality rate:
� ⋅=
c prevFFtot aDcPacRR
aDamaDam
);|());((
);();(0
μ
Rest COPD-related attributable mortality rate, i.e. not through severe exacerbations:
);());(|();());(();( 0 aEmacEPaDamacRRacam FFFtototh ⋅−⋅= μμ
f continuous lung function value
am0(D;a) baseline COPD-related attributable mortality, i.e. for baseline severity class
)( fRR Ftot relative mortality risk for lung function value f
amoth(c;a) COPD-related attributable mortality for severity class s not through severe
exacerbations
P(E|f) annual probability of severe exacerbation conditional on lung function f
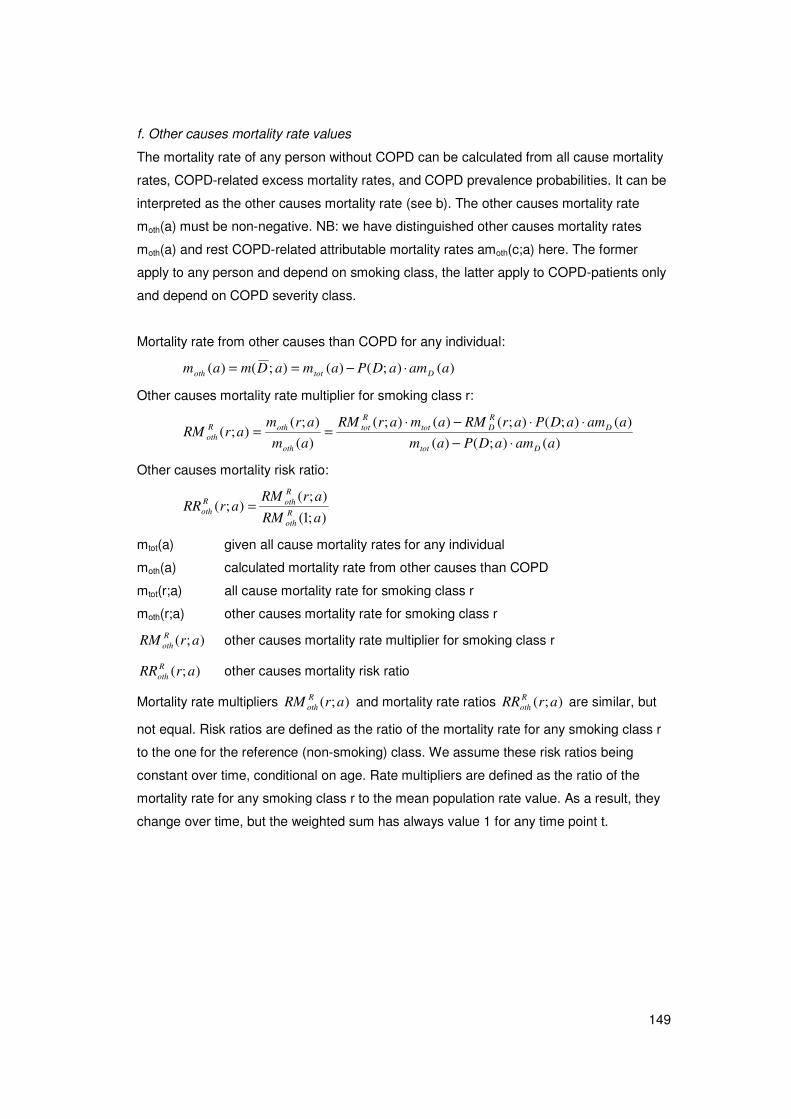
149
f. Other causes mortality rate values
The mortality rate of any person without COPD can be calculated from all cause mortality
rates, COPD-related excess mortality rates, and COPD prevalence probabilities. It can be
interpreted as the other causes mortality rate (see b). The other causes mortality rate
moth(a) must be non-negative. NB: we have distinguished other causes mortality rates
moth(a) and rest COPD-related attributable mortality rates amoth(c;a) here. The former
apply to any person and depend on smoking class, the latter apply to COPD-patients only
and depend on COPD severity class.
Mortality rate from other causes than COPD for any individual:
)();()();()( aamaDPamaDmam Dtototh ⋅−==
Other causes mortality rate multiplier for smoking class r:
)();()(
)();();()();(
)(
);();(
aamaDPam
aamaDParRMamarRM
am
armarRM
Dtot
DRDtot
Rtot
oth
othRoth
⋅−
⋅⋅−⋅==
Other causes mortality risk ratio:
);1(
);();(
aRM
arRMarRR
Roth
RothR
oth =
mtot(a) given all cause mortality rates for any individual
moth(a) calculated mortality rate from other causes than COPD
mtot(r;a) all cause mortality rate for smoking class r
moth(r;a) other causes mortality rate for smoking class r
);( arRM Roth other causes mortality rate multiplier for smoking class r
);( arRR Roth other causes mortality risk ratio
Mortality rate multipliers );( arRM Roth and mortality rate ratios );( arRR R
oth are similar, but
not equal. Risk ratios are defined as the ratio of the mortality rate for any smoking class r
to the one for the reference (non-smoking) class. We assume these risk ratios being
constant over time, conditional on age. Rate multipliers are defined as the ratio of the
mortality rate for any smoking class r to the mean population rate value. As a result, they
change over time, but the weighted sum has always value 1 for any time point t.
150
D4 Data used to find COPD mortality
The input parameters for unadjusted COPD excess-mortality were taken from the RIVM
Chronic Disease Model. The following is a short summary description of the COPD
specific input data. Further details can be found in publications on the RIVM Chronic
Disease Model.
Data used are:
1. the UK GP registration (DYNAMO-HIA project/GPRD) concerning mortality in COPD
and non-COPD patients over the period 2000-2008 [2]. The total number of persons in the
DYNAMO-HIA/GPRD consists of more than 3,5 million and the number of COPD deaths
over the period 2000-2008 was 37000.
2. Dutch GP registrations of COPD incidence and prevalence. [3]
The DYNAMO-HIA/GPRD data were used to estimate a RR for mortality in COPD
patients. The RR was estimates using Poisson regression, with as explanatory variables
polynomials of age, COPD status, gender and interaction terms. Using the BIC criterion,
the best model was selected. Results are presented in figure D4.1 below.
Figure D4.2 then presents the resulting relative risks and excess mortality rates, if the
regression model is applied. Confidence intervals were obtained using Monte Carlo
simulation.
The RRs were then combined with COPD prevalence estimates based on Dutch GP
registrations and Dutch overall mortality rates (statistics Netherlands) to find estimates for
COPD mortality in the Netherlands as follows:
Othercause_mortalityNL = total_mortalityNL/{ prev COPD NL*RR_DYNAMO-HIA/GPRD+
(1- prev OCPD NL)}
Exces_mortalityNL= { RR_DYNAMO-HIA/GPRD-1}* Othercause_mortalityNL
Figure D4.3 shows the resulting excess mortality rates and life expectancies for men and
women with COPD.
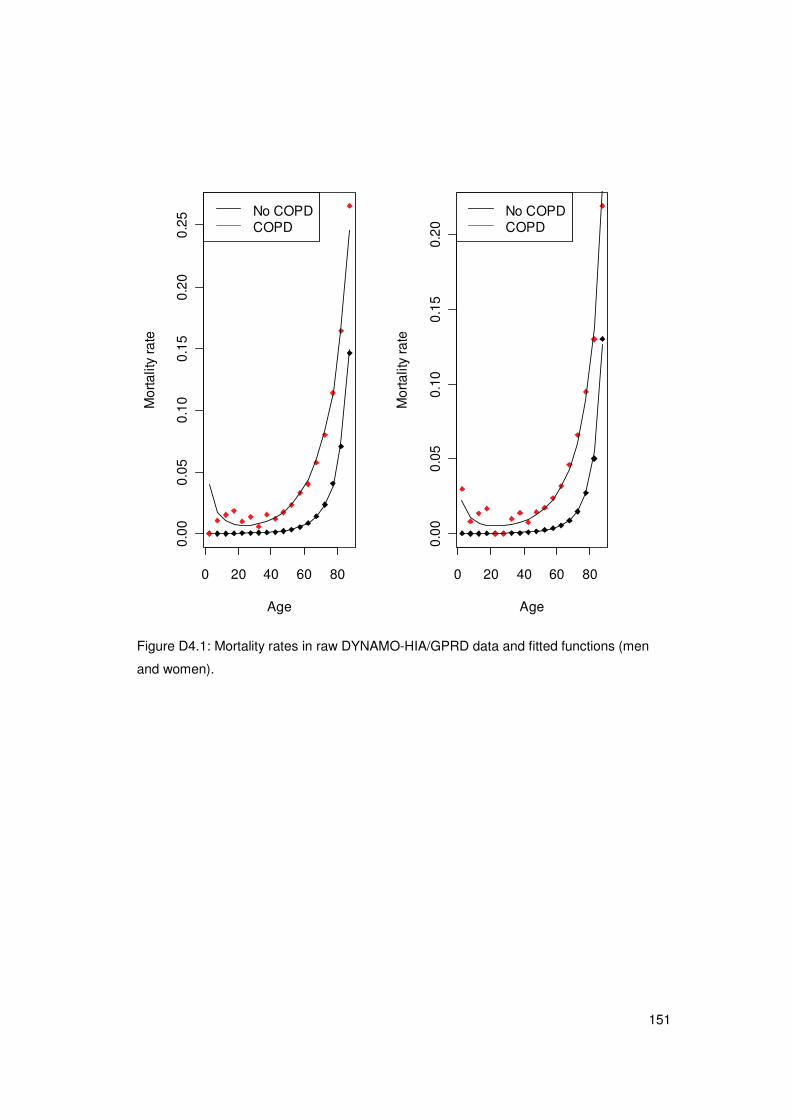
151
0 20 40 60 80
0.00
0.05
0.10
0.15
0.20
0.25
Age
Mor
talit
y ra
te
No COPDCOPD
0 20 40 60 80
0.00
0.05
0.10
0.15
0.20
Age
Mor
talit
y ra
te
No COPDCOPD
Figure D4.1: Mortality rates in raw DYNAMO-HIA/GPRD data and fitted functions (men
and women).
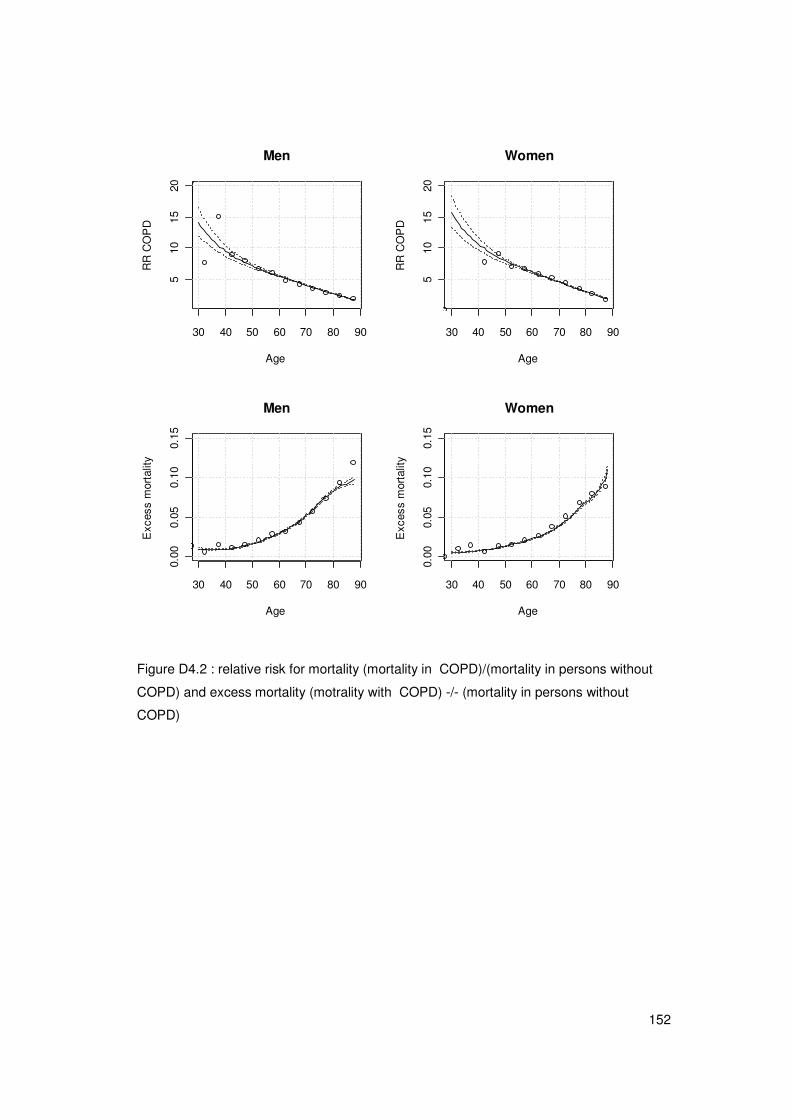
152
30 40 50 60 70 80 90
510
1520
Men
Age
RR
CO
PD
30 40 50 60 70 80 90
510
1520
Women
Age
RR
CO
PD
30 40 50 60 70 80 90
0.00
0.05
0.10
0.15
Men
Age
Exc
ess
mor
talit
y
30 40 50 60 70 80 90
0.00
0.05
0.10
0.15
Women
Age
Exc
ess
mor
talit
y
Figure D4.2 : relative risk for mortality (mortality in COPD)/(mortality in persons without
COPD) and excess mortality (motrality with COPD) -/- (mortality in persons without
COPD)
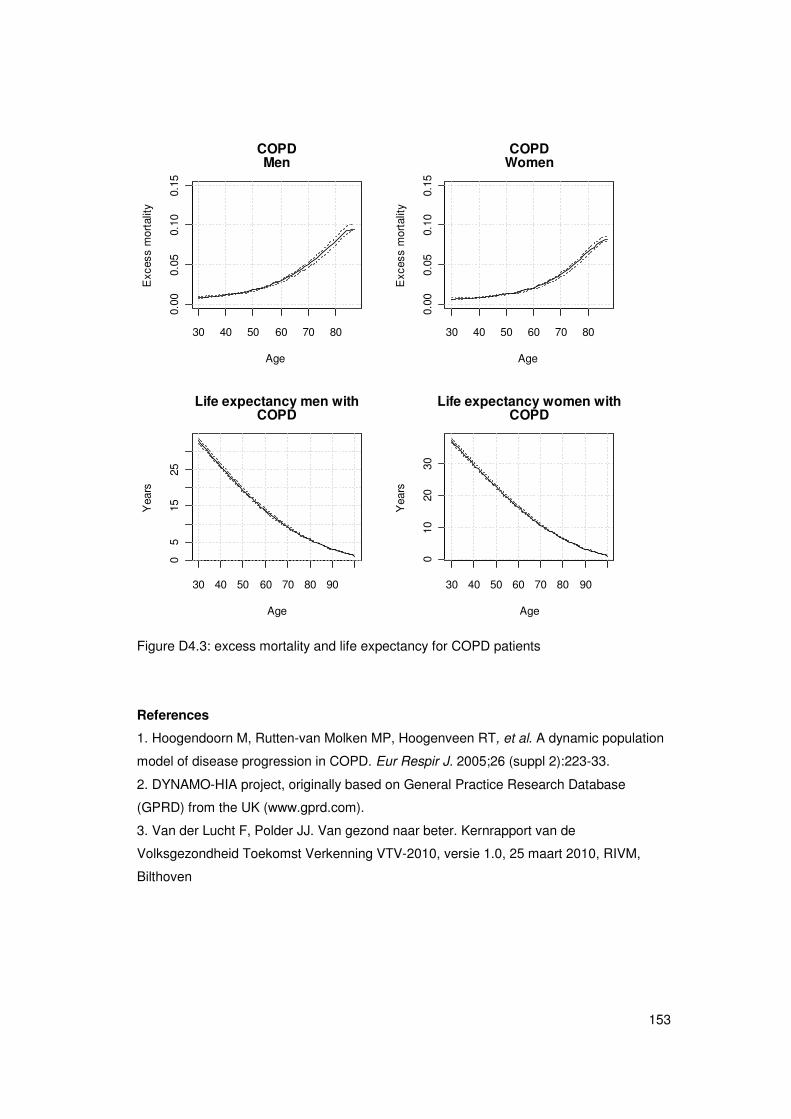
153
30 40 50 60 70 80
0.00
0.05
0.10
0.15
COPDMen
Age
Exc
ess
mor
talit
y
30 40 50 60 70 80
0.00
0.05
0.10
0.15
COPDWomen
Age
Exc
ess
mor
talit
y
30 40 50 60 70 80 90
05
1525
Life expectancy men withCOPD
Age
Yea
rs
30 40 50 60 70 80 90
010
2030
Life expectancy women withCOPD
Age
Yea
rs
Figure D4.3: excess mortality and life expectancy for COPD patients
References
1. Hoogendoorn M, Rutten-van Molken MP, Hoogenveen RT, et al. A dynamic population
model of disease progression in COPD. Eur Respir J. 2005;26 (suppl 2):223-33.
2. DYNAMO-HIA project, originally based on General Practice Research Database
(GPRD) from the UK (www.gprd.com).
3. Van der Lucht F, Polder JJ. Van gezond naar beter. Kernrapport van de
Volksgezondheid Toekomst Verkenning VTV-2010, versie 1.0, 25 maart 2010, RIVM,
Bilthoven

154

155
APPENDIX E: Internal validity checks
During the development of the model, the internal validity of the model was secured by
performing fifteen different model checks to prevent internal inconsistencies. The
performed model checks, results and possible actions to resolve the problem are shown in
the Table below.
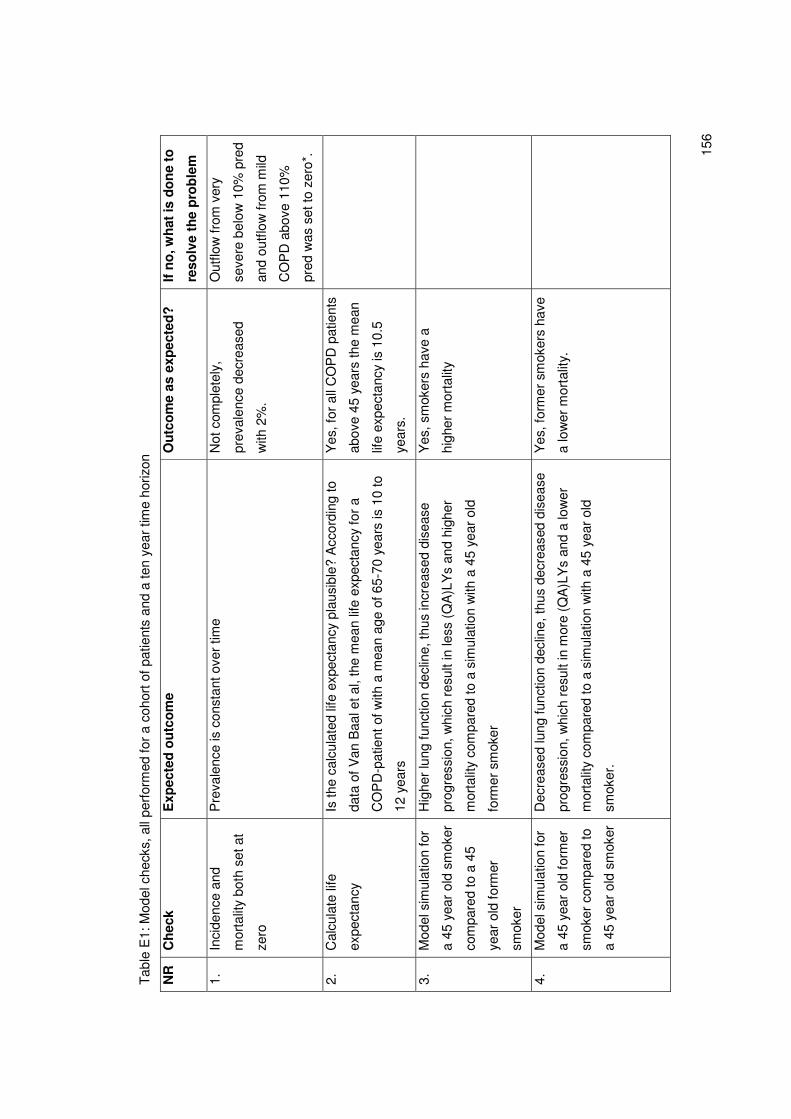
15
6
Tab
le E
1: M
odel
che
cks,
all
perf
orm
ed fo
r a
coho
rt o
f pat
ient
s an
d a
ten
year
tim
e ho
rizon
NR
C
hec
k E
xpec
ted
ou
tco
me
Ou
tco
me
as e
xpec
ted
?
If n
o, w
hat
is d
on
e to
reso
lve
the
pro
ble
m
1.
Inci
denc
e an
d
mor
talit
y bo
th s
et a
t
zero
Pre
vale
nce
is c
onst
ant o
ver
time
Not
com
plet
ely,
prev
alen
ce d
ecre
ased
with
2%
.
Out
flow
from
ver
y
seve
re b
elow
10%
pre
d
and
outfl
ow fr
om m
ild
CO
PD
abo
ve 1
10%
pred
was
set
to z
ero*
.
2.
Cal
cula
te li
fe
expe
ctan
cy
Is th
e ca
lcul
ated
life
exp
ecta
ncy
plau
sibl
e? A
ccor
ding
to
data
of V
an B
aal e
t al,
the
mea
n lif
e ex
pect
ancy
for
a
CO
PD
-pat
ient
of w
ith a
mea
n ag
e of
65-
70 y
ears
is 1
0 to
12 y
ears
Yes
, for
all
CO
PD
pat
ient
s
abov
e 45
yea
rs th
e m
ean
life
expe
ctan
cy is
10.
5
year
s.
3.
Mod
el s
imul
atio
n fo
r
a 45
yea
r ol
d sm
oker
com
pare
d to
a 4
5
year
old
form
er
smok
er
Hig
her
lung
func
tion
decl
ine,
thus
incr
ease
d di
seas
e
prog
ress
ion,
whi
ch r
esul
t in
less
(Q
A)L
Ys
and
high
er
mor
talit
y co
mpa
red
to a
sim
ulat
ion
with
a 4
5 ye
ar o
ld
form
er s
mok
er
Yes
, sm
oker
s ha
ve a
high
er m
orta
lity
4.
Mod
el s
imul
atio
n fo
r
a 45
yea
r ol
d fo
rmer
smok
er c
ompa
red
to
a 45
yea
r ol
d sm
oker
Dec
reas
ed lu
ng fu
nctio
n de
clin
e, th
us d
ecre
ased
dis
ease
prog
ress
ion,
whi
ch r
esul
t in
mor
e (Q
A)L
Ys
and
a lo
wer
mor
talit
y co
mpa
red
to a
sim
ulat
ion
with
a 4
5 ye
ar o
ld
smok
er.
Yes
, for
mer
sm
oker
s ha
ve
a lo
wer
mor
talit
y.
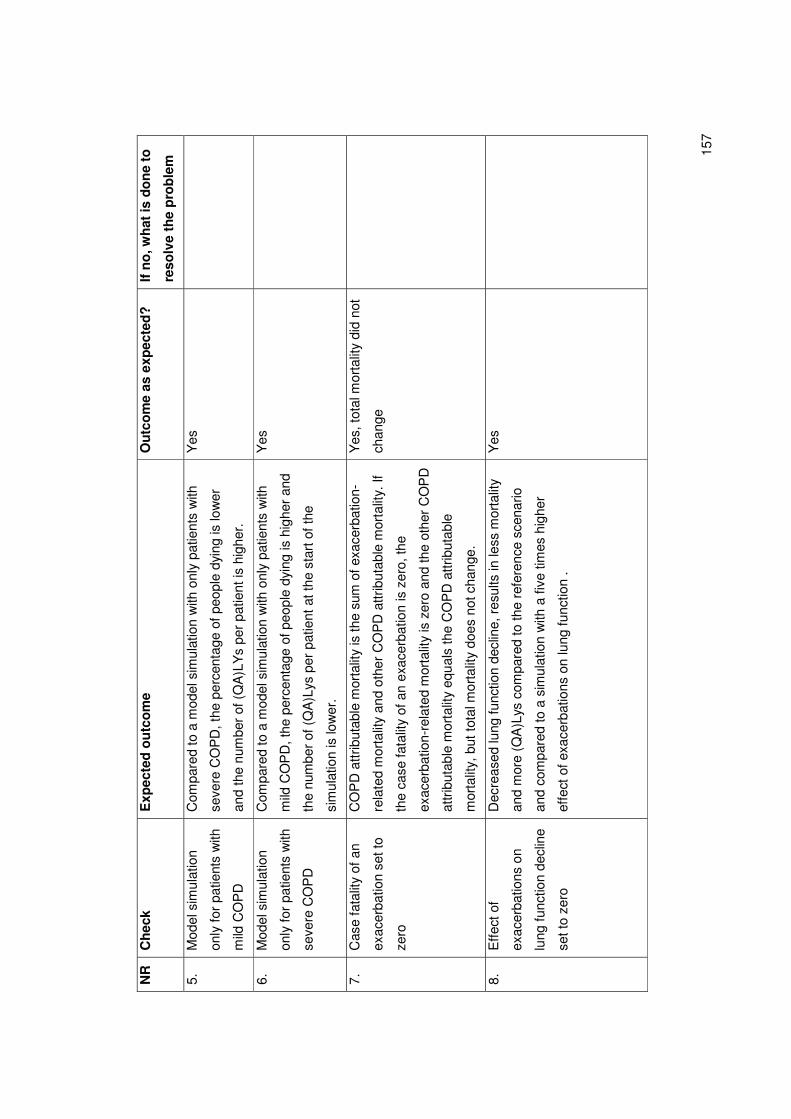
15
7
NR
C
hec
k E
xpec
ted
ou
tco
me
Ou
tco
me
as e
xpec
ted
?
If n
o, w
hat
is d
on
e to
reso
lve
the
pro
ble
m
5.
Mod
el s
imul
atio
n
only
for
pat
ient
s w
ith
mild
CO
PD
Com
pare
d to
a m
odel
sim
ulat
ion
with
onl
y pa
tient
s w
ith
seve
re C
OP
D, t
he p
erce
ntag
e of
peo
ple
dyin
g is
low
er
and
the
num
ber
of (
QA
)LY
s pe
r pa
tient
is h
ighe
r.
Yes
6.
Mod
el s
imul
atio
n
only
for
pat
ient
s w
ith
seve
re C
OP
D
Com
pare
d to
a m
odel
sim
ulat
ion
with
onl
y pa
tient
s w
ith
mild
CO
PD
, the
per
cent
age
of p
eopl
e dy
ing
is h
ighe
r an
d
the
num
ber
of (
QA
)Lys
per
pat
ient
at t
he s
tart
of t
he
sim
ulat
ion
is lo
wer
.
Yes
7.
Cas
e fa
talit
y of
an
exac
erba
tion
set t
o
zero
CO
PD
attr
ibut
able
mor
talit
y is
the
sum
of e
xace
rbat
ion-
rela
ted
mor
talit
y an
d ot
her
CO
PD
attr
ibut
able
mor
talit
y. If
the
case
fata
lity
of a
n ex
acer
batio
n is
zer
o, th
e
exac
erba
tion-
rela
ted
mor
talit
y is
zer
o an
d th
e ot
her
CO
PD
attr
ibut
able
mor
talit
y eq
uals
the
CO
PD
attr
ibut
able
mor
talit
y, b
ut to
tal m
orta
lity
does
not
cha
nge.
Yes
, tot
al m
orta
lity
did
not
chan
ge
8.
Effe
ct o
f
exac
erba
tions
on
lung
func
tion
decl
ine
set t
o ze
ro
Dec
reas
ed lu
ng fu
nctio
n de
clin
e, r
esul
ts in
less
mor
talit
y
and
mor
e (Q
A)L
ys c
ompa
red
to th
e re
fere
nce
scen
ario
and
com
pare
d to
a s
imul
atio
n w
ith a
five
tim
es h
ighe
r
effe
ct o
f exa
cerb
atio
ns o
n lu
ng fu
nctio
n .
Yes
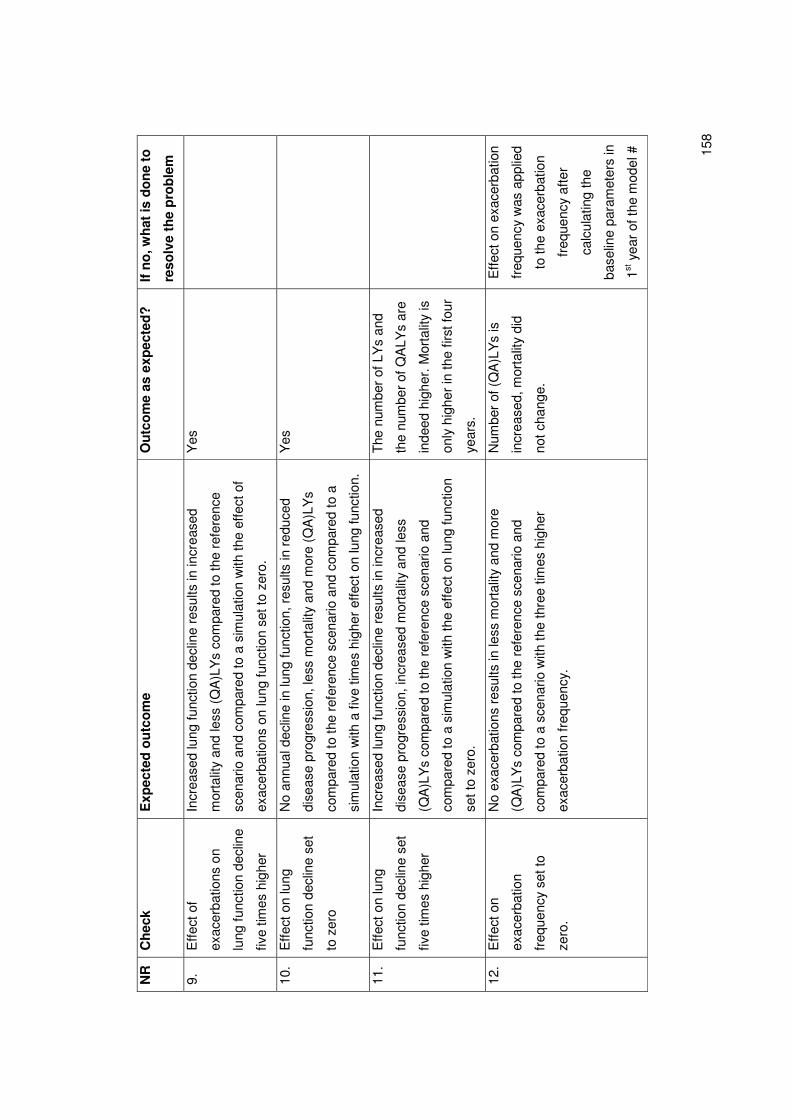
15
8
NR
C
hec
k E
xpec
ted
ou
tco
me
Ou
tco
me
as e
xpec
ted
?
If n
o, w
hat
is d
on
e to
reso
lve
the
pro
ble
m
9.
Effe
ct o
f
exac
erba
tions
on
lung
func
tion
decl
ine
five
times
hig
her
Incr
ease
d lu
ng fu
nctio
n de
clin
e re
sults
in in
crea
sed
mor
talit
y an
d le
ss (
QA
)LY
s co
mpa
red
to th
e re
fere
nce
scen
ario
and
com
pare
d to
a s
imul
atio
n w
ith th
e ef
fect
of
exac
erba
tions
on
lung
func
tion
set t
o ze
ro.
Yes
10.
Effe
ct o
n lu
ng
func
tion
decl
ine
set
to z
ero
No
annu
al d
eclin
e in
lung
func
tion,
res
ults
in r
educ
ed
dise
ase
prog
ress
ion,
less
mor
talit
y an
d m
ore
(QA
)LY
s
com
pare
d to
the
refe
renc
e sc
enar
io a
nd c
ompa
red
to a
sim
ulat
ion
with
a fi
ve ti
mes
hig
her
effe
ct o
n lu
ng fu
nctio
n.
Yes
11.
Effe
ct o
n lu
ng
func
tion
decl
ine
set
five
times
hig
her
Incr
ease
d lu
ng fu
nctio
n de
clin
e re
sults
in in
crea
sed
dise
ase
prog
ress
ion,
incr
ease
d m
orta
lity
and
less
(QA
)LY
s co
mpa
red
to th
e re
fere
nce
scen
ario
and
com
pare
d to
a s
imul
atio
n w
ith th
e ef
fect
on
lung
func
tion
set t
o ze
ro.
The
num
ber
of L
Ys
and
the
num
ber
of Q
ALY
s ar
e
inde
ed h
ighe
r. M
orta
lity
is
only
hig
her
in th
e fir
st fo
ur
year
s.
12.
Effe
ct o
n
exac
erba
tion
freq
uenc
y se
t to
zero
.
No
exac
erba
tions
res
ults
in le
ss m
orta
lity
and
mor
e
(QA
)LY
s co
mpa
red
to th
e re
fere
nce
scen
ario
and
com
pare
d to
a s
cena
rio w
ith th
e th
ree
times
hig
her
exac
erba
tion
freq
uenc
y.
Num
ber
of (
QA
)LY
s is
incr
ease
d, m
orta
lity
did
not c
hang
e.
Effe
ct o
n ex
acer
batio
n
freq
uenc
y w
as a
pplie
d
to th
e ex
acer
batio
n
freq
uenc
y af
ter
calc
ulat
ing
the
base
line
para
met
ers
in
1st y
ear
of th
e m
odel
#
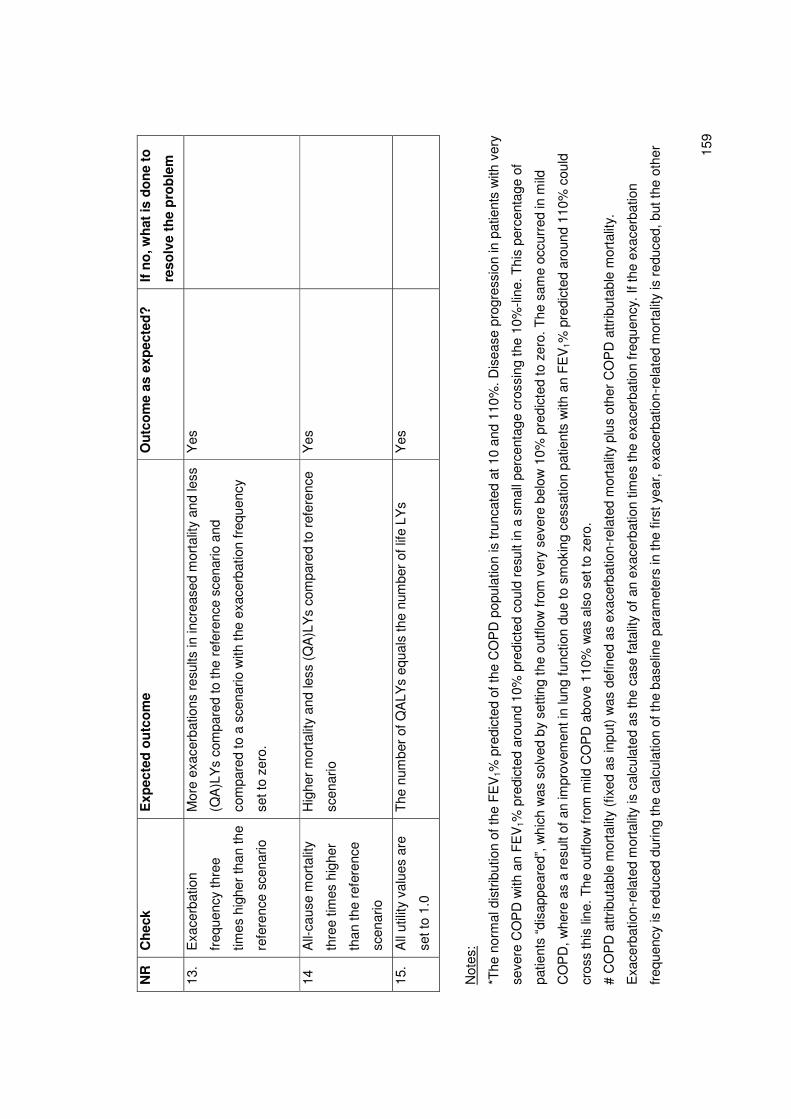
15
9
NR
C
hec
k E
xpec
ted
ou
tco
me
Ou
tco
me
as e
xpec
ted
?
If n
o, w
hat
is d
on
e to
reso
lve
the
pro
ble
m
13.
Exa
cerb
atio
n
freq
uenc
y th
ree
times
hig
her
than
the
refe
renc
e sc
enar
io
Mor
e ex
acer
batio
ns r
esul
ts in
incr
ease
d m
orta
lity
and
less
(QA
)LY
s co
mpa
red
to th
e re
fere
nce
scen
ario
and
com
pare
d to
a s
cena
rio w
ith th
e ex
acer
batio
n fr
eque
ncy
set t
o ze
ro.
Yes
14
All-
caus
e m
orta
lity
thre
e tim
es h
ighe
r
than
the
refe
renc
e
scen
ario
Hig
her
mor
talit
y an
d le
ss (
QA
)LY
s co
mpa
red
to r
efer
ence
scen
ario
Yes
15.
All
utili
ty v
alue
s ar
e
set t
o 1.
0
The
num
ber
of Q
ALY
s eq
uals
the
num
ber
of li
fe L
Ys
Y
es
Not
es:
*The
nor
mal
dis
trib
utio
n of
the
FE
V1%
pre
dict
ed o
f the
CO
PD
pop
ulat
ion
is tr
unca
ted
at 1
0 an
d 11
0%. D
isea
se p
rogr
essi
on in
pat
ient
s w
ith v
ery
seve
re C
OP
D w
ith a
n F
EV
1% p
redi
cted
aro
und
10%
pre
dict
ed c
ould
res
ult i
n a
smal
l per
cent
age
cros
sing
the
10%
-line
. Thi
s pe
rcen
tage
of
patie
nts
“dis
appe
ared
”, w
hich
was
sol
ved
by s
ettin
g th
e ou
tflow
from
ver
y se
vere
bel
ow 1
0% p
redi
cted
to z
ero.
The
sam
e oc
curr
ed in
mild
CO
PD
, whe
re a
s a
resu
lt of
an
impr
ovem
ent i
n lu
ng fu
nctio
n du
e to
sm
okin
g ce
ssat
ion
patie
nts
with
an
FE
V1%
pre
dict
ed a
roun
d 11
0% c
ould
cros
s th
is li
ne. T
he o
utflo
w f
rom
mild
CO
PD
abo
ve 1
10%
was
als
o se
t to
zero
.
# C
OP
D a
ttrib
utab
le m
orta
lity
(fix
ed a
s in
put)
was
def
ined
as
exac
erba
tion-
rela
ted
mor
talit
y pl
us o
ther
CO
PD
attr
ibut
able
mor
talit
y.
Exa
cerb
atio
n-re
late
d m
orta
lity
is c
alcu
late
d as
the
case
fata
lity
of a
n ex
acer
batio
n tim
es th
e ex
acer
batio
n fr
eque
ncy.
If th
e ex
acer
batio
n
freq
uenc
y is
red
uced
dur
ing
the
calc
ulat
ion
of th
e ba
selin
e pa
ram
eter
s in
the
first
yea
r, e
xace
rbat
ion-
rela
ted
mor
talit
y is
red
uced
, but
the
othe
r

16
0
CO
PD
attr
ibut
able
mor
talit
y is
incr
ease
d, s
uch
that
the
CO
PD
attr
ibut
able
mor
talit
y an
d to
tal m
orta
lity
did
not c
hang
e. In
the
scen
ario
s th
e
exac
erba
tion
freq
uenc
y w
as a
djus
ted
afte
r in
itial
izat
ion
of th
e ba
selin
e pa
ram
eter
s an
d th
eref
ore
a ch
ange
in e
xace
rbat
ion
freq
uenc
y in
the
scen
ario
s do
es h
ave
an e
ffec
t on
the
CO
PD
attr
ibut
able
mor
talit
y.

Erasmus University RotterdamINSTITUTE OF HEALTH, POLICY & MANAGEMENT
Visiting address
Burgemeester Oudlaan 503062 PA Rotterdam
Postal address
P.O. Box 1738 3000 DR RotterdamThe Netherlands
Telephone +31 10 408 85 55Fax +31 10 408 90 94Internet www.bmg.eur.nlE-mail [email protected]
ISBN: 9789490420086