Embed Size (px)
Citation preview
1
Dale J. Greenwell1 and Marc Y Menetrez, Ph.D.1
Comparing Moisture Meter Readings with Measured
Equilibrium Moisture Content of Gypsum Board
ABSTRACT: Moisture meters routinely used in the field to determine the moisture content in gypsum wallboard
are primarily designed and manufactured to measure the moisture content of wood. Often they are used to decide
whether to replace wallboard by determining if moisture is qualitatively higher or lower than another location.
Because the moisture meter is so widely used, it is necessary to establish methods to ensure their usefulness and
dependability as an aid in wallboard moisture detection and remediation. A method was developed to create a series
of gypsum wallboard moisture content reference standards by exposing wallboard sample sections to static moisture
content levels. Gravimetric analysis revealed good accuracy and precision of the reference standards to their
theoretical values. A moisture meter was then compared against these reference standards to determine the meter’s
accuracy and precision.
KEYWORDS: Gypsum wallboard, moisture meter, moisture content, water activity, remediation, mold.
1 , U.S. Environmental Protection Agency, National Risk Management Research Laboratory, Air Pollution Prevention and Control Division, Indoor Environment Management Branch, 109 T.W. Alexander Drive, RTP, NC, 27711.
2
Introduction
Background
Regular core gypsum wallboard is the most common interior finish for residential and
commercial walls and ceilings. Gypsum wallboard exposed to water or high humidity for
extended time is known to support and promote mold and fungi growth [1-3]. The ability to
accurately detect and measure the moisture content in wallboard is critical to remediate
effectively. Current limitations in gypsum wallboard remediation are associated with the
moisture detection instrumentation available. The hand-held instruments routinely used in the
field to determine the moisture content in gypsum wallboard are primarily designed and
manufactured to measure the moisture content of wood [4-6]. These moisture meters are often
used simply to determine relative moisture content of one location to another. Water activity
meters are another means of moisture detection. These meters are primarily laboratory tools for
the microbial and food industry. Although water activity meters are a good measure of available
moisture for microbial growth, they may be time consuming and awkward to use in the field.
Whereas moisture meters typically produce moisture readings within seconds, water activity
meters require several minutes per reading. Additionally, moisture meters obtain readings by
direct contact with the wallboard surface, whereas water activity meters traditionally require a
sample specimen placed within a sealed measurement chamber to obtain a reading.
There is no direct translation of moisture content between wood and wallboard materials due
in part to their differing physical properties. Wood is a natural fibrous substance containing
relatively high moisture content. Dependent upon the species, this type of structure when dried
can result in a highly porous, low-density material. The primary component of gypsum
3
wallboard core material is gypsum, or calcium sulfate dihydrate (CaSO4 2H2O), a naturally
occurring mineral. The gypsum core is a mixture of dried, ground, and calcined gypsum, various
additives, water, and trace impurities. Calcination is the evaporation of gypsum’s chemically-
bound water, decomposing the gypsum to form calcium sulfate hemi-hydrate (CaSO4 0.5H2O).
During the wallboard manufacturing process the gypsum is re-hydrated providing the finished
wallboard with stable chemically-bound water.
Percent moisture content (% MC) is calculated on a dry-basis as the weight of water (moist
material weight minus dry material weight) divided by the dry material weight multiplied by
100. Total weight is often substituted for the nomenclature moist material weight. For gypsum
wallboard, the moist weight includes the weight of the material and its chemically-bound water,
plus water located within the pores and interstitial spaces (free water). The dry weight does not
include the water located within the pores and interstitial spaces. Since moisture content is a
measure of weight and wallboard is generally denser than wood, an equal volume of water added
to equal volumes of wallboard and wood will produce different % MC readings, therefore
moisture content readings can be significantly higher in wood than gypsum wallboard due to
density differences
Whether expressed as % MC, equilibrium relative humidity (ERH), or water activity (Aw),
the amount of moisture available in the wallboard is the key factor affecting mold growth [7].
ERH is associated with steady state water exchange. ERH occurs when a material’s water vapor
pressure and temperature are equal with the ambient atmosphere. Aw, a term used widely in the
microbiology field, is the available water in a material that can support mold growth versus the
total water within the material. Because gypsum wallboard is a porous, hygroscopic material, it
will seek to attain moisture equilibrium with the surrounding humidity. Both wood products and
4
finished wallboard contain numerous pores and interstitial spaces. It is within these spaces that
moisture penetrates and accumulates to reach equilibrium with the surrounding environment.
Free water in the porous structure of the wallboard can support microbial growth under suitable
environmental conditions.
% MC and ERH are related through sorption isotherms. A sorption isotherm graphically
represents the relationship of a material’s moisture content at equilibrium relative humidity for a
specific temperature. Sorption isotherms are both material specific and temperature dependent
[8]. Because of the complexity and dependency of the sorption process, isotherms must be
experimentally determined for each material or product. Materials often differ in their
absorption and desorption rates. Most building materials follow sorption curves that are non-
linear in shape [12]. A sorption isotherm with the study data is given in the Results and
Discussion section. The pharmaceutical industry has studied this relationship extensively due to
its dependency on powder materials, but little data exists regarding sorption isotherms of gypsum
wallboard. Data from previous gypsum wallboard studies show isotherm relationships between
% MC and % relative humidity at equilibrium of 0.7% MC at 80% RH [2], 0.3% MC at 50% RH
[13], 0.4-0.5% MC at 80-85% RH, and 0.7-0.8% MC at 90-95% RH [9]. Note the disparity
between the sources referenced. Wallboard at equilibrium in an 80% RH environment is equated
with moisture contents of both 0.7% and 0.4-0.5%. Additionally, 0.7% MC is associated with
ERH environments of 80% RH and 90-95% RH. The usefulness of the reference data is unclear
since neither methodology nor instrumentation used in obtaining the results was provided.
ERH and Aw have a direct relationship that varies slightly with temperature. In an
environment of water vapor pressure and temperature equilibrium (no further moisture
exchange), the Aw within a material is considered equal to % RH/100.
5
Objective
The research objective is to develop a method to determine the accuracy and precision of
moisture meters that are primarily designed for wood products, but used on gypsum wallboard.
The intent is to validate their use for remediation of water-damaged gypsum wallboard to prevent
mold contamination. This initial laboratory testing will provide a baseline for the development
of a standard test method for moisture meter evaluation and its practical field application. Future
methods development will be modified based on the test results and data obtained.
Materials and Methods
Materials
Gypsum Wallboard─regular core gypsum wallboard was purchased from local home
improvement suppliers with no preference toward manufacturer. The wallboard measured 2.4 m
(8 ft) in length by 1.2 m (4 ft) in width by 1.27 cm (½ inch) thick. Gypsum wallboard has a
paper covering often referred to as “cream stock” applied to the front or face and “gray stock”
applied to the back. The face of gypsum wallboard is the side that faces out upon installation.
The wallboard was manufactured to the following standards: ASTM C1396, Standard
Specification for Gypsum Wallboard and CAN/CSA-A82.27-M Standard, Gypsum Board
Building Materials and Products. The wallboard was tested as purchased: no surface coatings
were applied or physical changes made to the surface structure.
Instrumentation
Delmhorst, Model BD-2100 Moisture Meter─the meter is a hand held device that determines
the moisture level by measuring the electrical resistance between two contact pins inserted into
the material. The two contact pins are mounted on the top of the meter and are identical in
6
length with a fixed distance between them. The meter readings are based on the relationship
between electrical resistance and moisture content within hygroscopic materials. The meter has
a 0.2 to 50% moisture range with gypsum when set to scale #3, Gypsum Scale. The Delmhorst
Instrument Company states a ± 20% tolerance of the reading [9]. The meter was purchased with
primary certification of its electrical resistance traceable to NIST. No data was received with the
instrument relating electrical resistance to moisture content, nor regarding the accuracy of the
instrument readings.
Rotronic, Model HygroPalm Aw1 Water Activity Meter─the meter is a hand held device that
determines the active (unbound) moisture content by measuring the humidity and temperature
within a sealed volume of air containing the sample material. The water activity measurement is
a measure of the ERH influenced by moisture vapor pressure and the temperature. Equilibrium
is met when the humidity signal rate of change is less than 0.0001 Aw per minute and the
temperature signal rate of change is less than 0.01 C per minute. o The small product sample
probe, Model Aw-DIO, has humidity and temperature sensors positioned on its bottom face. An
imbedded o-ring in the bottom face provides an airtight sensing volume with the sample
specimen chamber. The HygroPalm Aw1 meter has a range of 0 to 1 Aw, with system accuracy
at 23 C of o ± 0.015 Aw (± 1.5% RH) and ± 0.2oC.
The meter has three modes of operation: Standard, AwE, and AwQuick. Standard mode is
used for calibrating the humidity-temperature probe and measuring the equilibrium of the
product. Typical measurement time to reach full equilibrium is 30 to 60 minutes. AwE mode
performs as the standard mode but automatically ends the measurement when equilibrium is
detected. AwQuick mode accelerates the measurement process, providing results within
approximately five minutes. During the AwQuick measurement process, the value of the
7
humidity signal and the stability of the temperature signal are constantly monitored. After a four
minute dwell time, an algorithm projects the final equilibrium value (water activity) based on the
humidity data. The measurement ends when the projected Aw value is stable. Depending on the
moisture content, the final measurement is obtained within seconds to just over one minute
following the dwell time. The AwQuick mode results are stated to be within ± 0.005Aw or less
of the full equilibrium measurement [10].
During this experiment, the meter was operated in the AwQuick mode with a slight
procedure modification. The sample probe’s o-ring face was placed against the wallboard to
form the sealed air space for humidity and temperature measurement. Normal procedure is to
place a sample of the test material into the sample specimen chamber and seal in place with the
probe.
Vaisala, Model HMD70Y Temperature and Humidity Transmitter─the transmitter provided
continuous laboratory space monitoring of humidity and temperature throughout the experiment.
The transmitter utilizes an HUMICAP 180 humidity sensor with a range of 0 to 100% RH at ±
2.0% RH accuracy and a Pt 1000 IEC 751class B temperature sensor with a range of -20 to 80 oC
at ± 0.1 oC accuracy. The output signal is set at 0 to 1 volts. The temperature and humidity
transmitter was used in conjunction with a Measurement Computing data acquisition board,
Model PMD-1208LS with the manufacturer supplied software, InstaCal™ Version 5.44.
An electronic top-loading balance was used to obtain the mass of the wallboard specimens
and moisture standards. The balance has two weighing ranges; 2100 gram and 500 gram with
readability of 0.01 or 0.001 gram respectively. Repeatability is less than or equal to ± 0.001
gram. The balance has a combined uncertainty of 0.005 gram for the 500 gram range.
8
Method
A series of moisture content standards were generated covering the range from dry to
saturation. Gravimetric weighing was performed daily to provide a benchmark for comparative
analysis. Electronic measurements of moisture content were performed using the moisture meter
and water activity meter. The meter readings were taken on the face side of the wallboard to
mimic the typical sampling method applied in the field. Consideration was also given to
simplify the research.
Six-inch square sections of gypsum wallboard were cut from one randomly selected sheet of
wallboard. All specimens were dried in an oven at 75 oC for three hours to remove existing free
moisture (non chemically-bound water). The drying temperature and time were selected as a
reasonable compromise for this first set of experiments after a review of numerous gypsum
manufacturing, testing and calcination literature. The specimens were then weighed to obtain a
moisture free baseline (dry) mass and placed in a desiccator to prevent moisture uptake prior to
generating the moisture content standards. Indicating silica gel was used as the drying agent in
the desiccator. The desiccator was equipped with a built-in hygrometer for humidity monitoring.
The moisture content standards were generated by equilibrating wallboard specimens in
relative humidity environments or by adding water directly to the specimens. The standards
remained in their respective humidity environments or sealed in plastic to maintain the
appropriate moisture content throughout the experiment. Moisture distribution was assumed
uniform throughout the wallboard for this study. This assumption may not reflect all field
conditions but was determined acceptable for this study. This determination was based in part on
previous experimental observations and discussions of “real world” findings.
9
Four moisture content standards were prepared using saturated salt solutions in accordance
with the ASTM Standard E104-85 (Re-approved 1996), Standard Practice for Maintaining
Constant Relative Humidity by Means of Aqueous Solutions [11]. The wallboard specimens
were placed into the sealed humidity chambers containing saturated salt solutions. Saturated salt
solutions have a unique constant relative humidity range that varies with temperature. The salt
solutions chosen provided nominal RH values of 11%, 33%, 75%, and 85%. Theoretical % MC
values were calculated for each RH value selected by dividing the density of water content in air
by the dry air density multiplied by 100. Water content and dry air density values were based on
20 oC and 760 mmHg. The theoretical % MC values associated with the salt solutions were 0.16,
0.47, 1.08, and 1.22 respectively. Applying a linear regression through the theoretical % MC
values, an equilibrium environment of 100% RH would have a % MC of 1.44.
Four moisture content standards were prepared by directly applying demineralized (DI) water
to the wallboard specimens. A density of one gram per milliliter (1 g/ml) was assumed for
water. Three specimens were placed on the electronic balance face side up and the mass
equivalent volume of water equal to 1, 5, and 10 percent of the specimen’s dry weight was
slowly poured/dripped onto each respectively. Prior to absorbing into the wallboard the water
was spread across the face side of each specimen to cover as much surface area as possible. The
nominal targeted % MC values were 1, 5, and 10 % MC. The calculated % MC values were
equal to 0.90, 4.90, and 9.96 respectively. The standards were double sealed in plastic zip-lock
bags. The fourth standard (complete saturation) was generated by initially submersing a
wallboard specimen horizontally inside a container of DI water. As the water was absorbed,
additional water was added to ensure the wallboard specimen remained in a saturated state
10
through continuous contact with a thin film layer of water remaining in the container. The
container’s lid was kept in place to minimize evaporative water loss.
One wallboard specimen remained in the desiccator to provide a dry baseline standard.
Another wallboard specimen was placed on the laboratory workbench where it remained
throughout the experiment. The % MC of this ambient moisture content standard was expected
to reflect the nominal laboratory % RH.The moisture content standards were allowed to
equilibrate within their respective environments for three days prior to the initial weighing. The
standards within sealed environments were removed only to perform measurements of mass,
water activity, and percent moisture content. The time outside the sealed environment was
minimized to prevent moisture loss and was less than ten minutes in duration with the exception
of the ambient standard, which had no time constraint. Only one standard at a time was exposed
to the laboratory environment for measurement with the exception of the ambient and saturated
standards.
Each sampling day, the balance was checked with five and 100-gram reference standards to
monitor its performance prior to weighing the moisture content standards. Moisture content
standards were removed from their environment and placed on the balance. The saturation
standard was lightly patted dry to remove the non-absorbed surface water prior to measure.
Once stable, the mass was recorded and the standard was placed face side up on the laboratory
bench to perform the moisture content and water activity measurements.
The moisture content measurement recorded was the average of five readings. A reading
was obtained by inserting the moisture meter’s contact pins into the gypsum wallboard material.
The meter’s contact pins were inserted steadily and firmly to the depth prescribe in the operating
manual. One reading was obtained from the center of the moisture standard and the remaining
11
four were one inch inward from each corner. The initial contact pin-holes were used repeatedly
until they became loose in fit at which time a new sampling position was generated next to the
existing or previous position. This was performed to provide the most reliable contact between
the meter and wallboard.
The water activity meter was operated in the AwQuick mode (sample time of approximately
5 minutes). The humidity–temperature probe was placed centrally on the surface of the
wallboard face and the measurement process started. Once the process was complete, the water
activity measurement was recorded and the meter reset.
The experiments were conducted in a standard laboratory space lacking precise temperature
and humidity control. The Vaisala transmitter continuously monitored the lab space humidity
and temperature throughout the experiment series. Temperature and humidity were reasonably
consistent throughout the weekdays (20 ± 0.5 oC, 50 ± 3% RH), with occasional episodic
behavior observed over weekends (18 ± 3 oC, 60 ± 10% RH).
Sigma Plot 2004 for Windows, Version 9.0 was used to plot and model the data obtained in
this study.
Results and Discussion
Gravimetric % MC Benchmark Standards
Gravimetric data were used to calculate the % MC of the wallboard moisture content
standards. This gravimetric % MC was then used as the benchmark standard (value) for the
moisture meter and water activity meter readings. To calculate the gravimetric % MC, a
standard’s dry weight was subtracted from its average moist (equilibrium state) weight to obtain

12
an average water uptake weight. The moist weight is the dry weight plus the weight of the water
absorbed. This water uptake weight was then divided by the standard’s dry weight and
multiplied by 100.
Within the first week of the experiment the desiccator (dry) standard lost an additional
average water weight (mass) of 0.192g. This data suggests the wallboard specimen drying
method (75 oC for 3 hours) was not sufficient in removing all of the free moisture (unbound
water). A review of and modification to the drying method was deemed necessary for future
research. The gravimetric % MC values obtained were corrected by normalizing for water loss
of the desiccator standard. These normalized gravimetric % MC values were used in the
remaining data analysis and meter reading comparisons.
The gravimetric % MC standard data are presented in Table 1. The gravimetric % MC
values are given with the uncertainty of the mean. The uncertainty was derived by taking the
square root of the sum of the errors squared, divided by the square root of the sample number. A
factor of 2 was applied to the value derived to provide an uncertainty confidence level of 95%.
The errors summed were the mass measurement errors and the balance error.
TABLE 1—Normalized gravimetric moisture content standards data.
N~Grava % MC % MC ± Unc.b
N~Grav % RSE c
Theoretical Calculated
% MC N~Grav/Theory
% Error Desiccator 0.000 ± 0.08 na 0.00 Na 11% RH Chamber 0.25 ± 0.01 5 0.16 +58 33% RH Chamber 0.47 ± 0.01 3 0.47 -2 Ambientd 0.67 ± 0.03 4 0.72 -6 75% RH Chamber 0.93 ± 0.02 2 1.08 -14 85% RH Chamber 1.35 ± 0.06 4 1.22 +11 1% MC 0.90 ± 0.41 45 0.96 ± 0.02 b -5 5% MC 4.90 ± 0.47 10 5.07 ± 0.02 -3 10% MC 9.96 ± 0.50 5 10.17 ± 0.02 -2
13
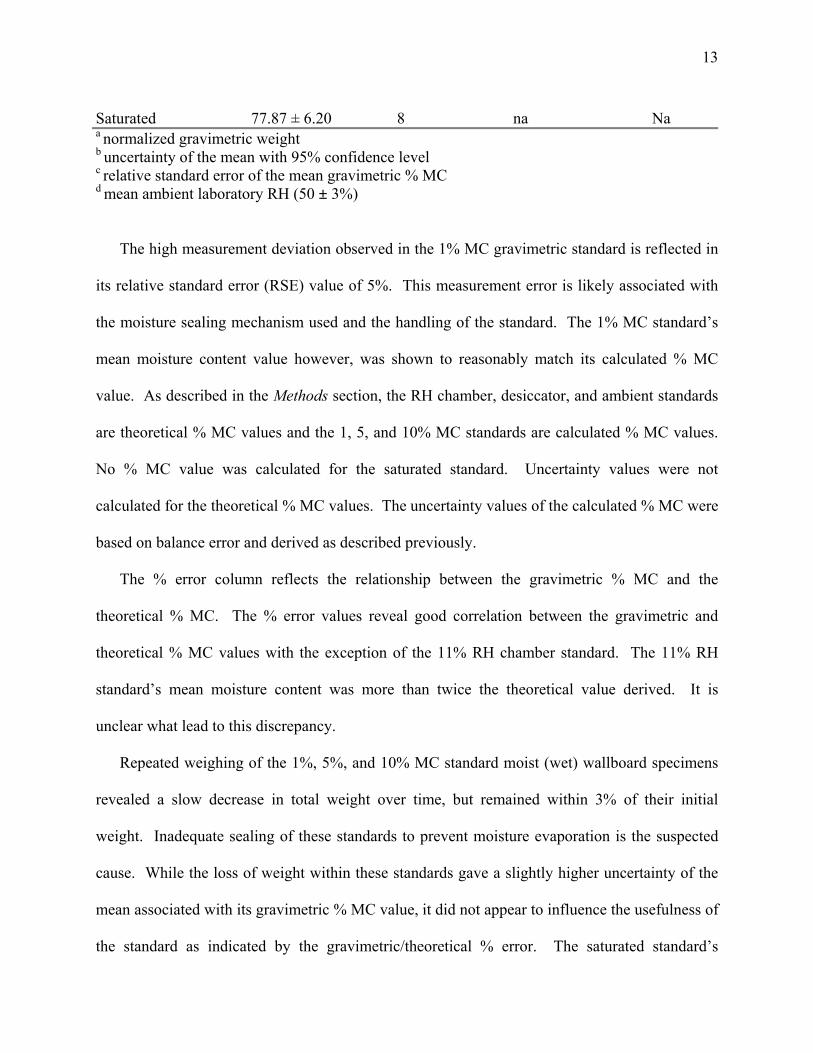
Saturated 77.87 ± 6.20 8 na Na a normalized gravimetric weight b uncertainty of the mean with 95% confidence level
c relative standard error of the mean gravimetric % MC
d mean ambient laboratory RH (50 ± 3%)
The high measurement deviation observed in the 1% MC gravimetric standard is reflected in
its relative standard error (RSE) value of 5%. This measurement error is likely associated with
the moisture sealing mechanism used and the handling of the standard. The 1% MC standard’s
mean moisture content value however, was shown to reasonably match its calculated % MC
value. As described in the Methods section, the RH chamber, desiccator, and ambient standards
are theoretical % MC values and the 1, 5, and 10% MC standards are calculated % MC values.
No % MC value was calculated for the saturated standard. Uncertainty values were not
calculated for the theoretical % MC values. The uncertainty values of the calculated % MC were
based on balance error and derived as described previously.
The % error column reflects the relationship between the gravimetric % MC and the
theoretical % MC. The % error values reveal good correlation between the gravimetric and
theoretical % MC values with the exception of the 11% RH chamber standard. The 11% RH
standard’s mean moisture content was more than twice the theoretical value derived. It is
unclear what lead to this discrepancy.
Repeated weighing of the 1%, 5%, and 10% MC standard moist (wet) wallboard specimens
revealed a slow decrease in total weight over time, but remained within 3% of their initial
weight. Inadequate sealing of these standards to prevent moisture evaporation is the suspected
cause. While the loss of weight within these standards gave a slightly higher uncertainty of the
mean associated with its gravimetric % MC value, it did not appear to influence the usefulness of
the standard as indicated by the gravimetric/theoretical % error. The saturated standard’s
14
wallboard specimen weight varied within ± 10% of its averaged weight throughout the
experiment. This fluctuation in weight was attributed to inadequate experimental conditions
(temperature and humidity control) and procedures such as not maintaining a consistent water
level in the storage container, thus causing water absorption and desorption.
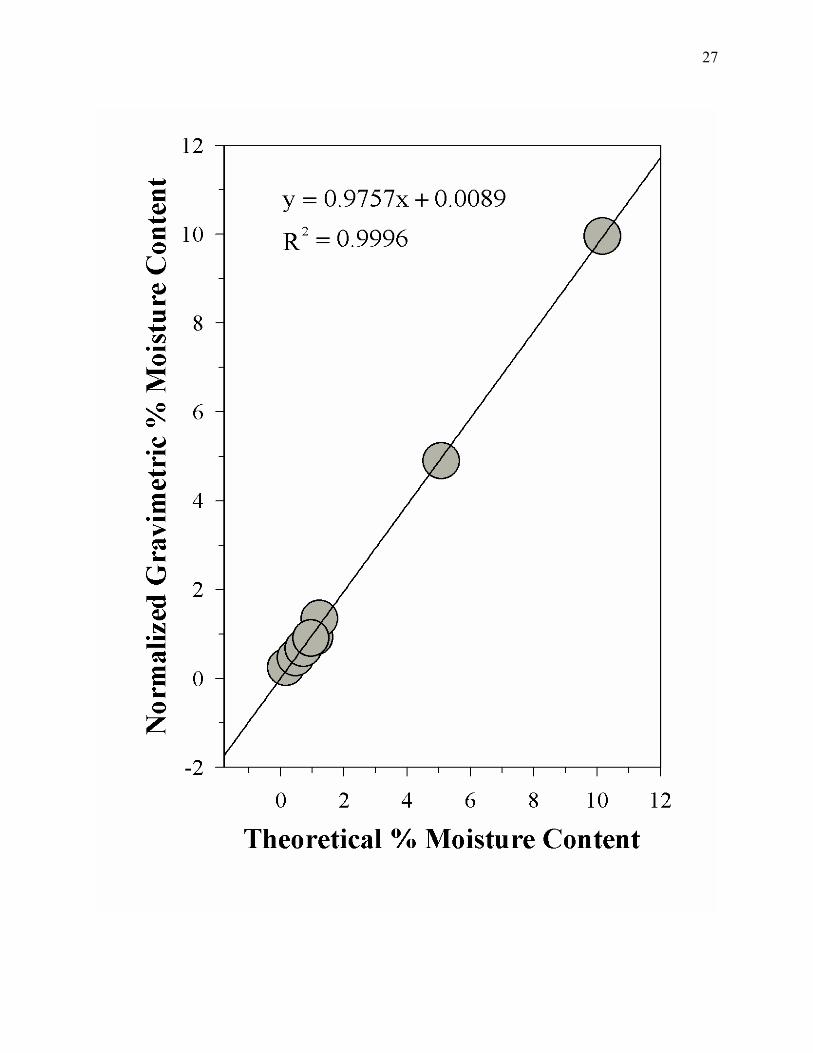
The gravimetric % MC standards were plotted against their theoretical % MC values and
presented in Figure 1. The desiccator and saturation gravimetric standards were not included in
the plot. A linear regression fit to the data had an R2 value greater than 0.99, a slope coefficient
estimate of approximately 1 with a p-value less than 0.001, and a standard estimate of error
(SEE) of approximately 0.09. The p-value reflects the significance of the coefficient term and
acts as an indication of confidence in the coefficient value. A p-value of 0.05 (95% confidence
level) was used as the significance criteria limit. The SEE reflects the error associated with the
residuals (the observed response minus the predicted response).
Based on the gravimetric to theoretical correlation and the regression fit parameters, seven of
the ten benchmark % MC standards are considered adequate for use in evaluating the moisture
meter’s accuracy and precision. The 11% RH standard’s poor gravimetric to theoretical
correlation makes it unacceptable for use. The desiccator and saturated standard’s insufficient
gravimetric to theoretical correlation data render them uncertain.
Comparison of Moisture Meter Readings with the Calculated Gravimetric % MC
To determine the accuracy and precision of the moisture meter, the meter % MC readings
were compared against the gravimetric standard % MC values. The moisture meter data are
given in Table 2. The moisture meter readings are limited to one decimal place, but two decimal
places are given for the standard deviation of the 33%, 75%, and 85% RH chamber standards and
the ambient standard to remove ambiguity of a zero standard deviation value due to rounding.
15
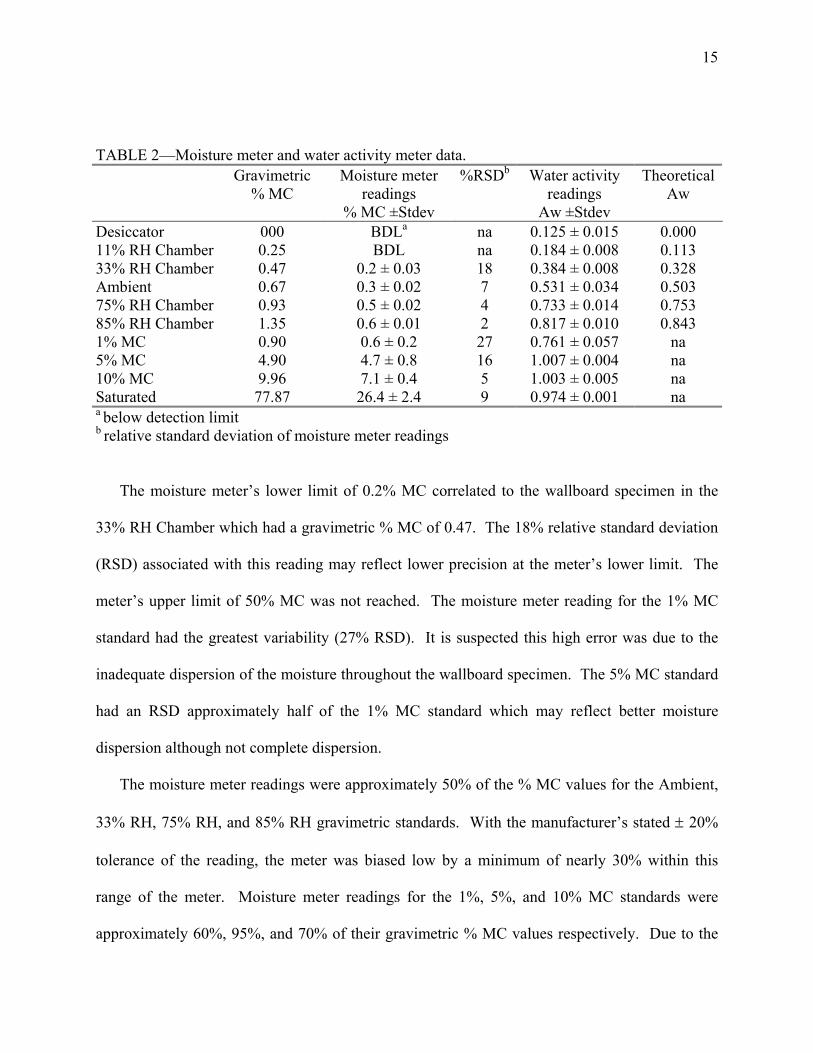
TABLE 2—Moisture meter and water activity meter data.
Gravimetric
% MC Moisture meter
readings % MC ±Stdev
%RSDb Water activity readings
Aw ±Stdev
Theoretical Aw
Desiccator 000 BDLa na 0.125 ± 0.015 0.000 11% RH Chamber 0.25 BDL na 0.184 ± 0.008 0.113 33% RH Chamber 0.47 0.2 ± 0.03 18 0.384 ± 0.008 0.328 Ambient 0.67 0.3 ± 0.02 7 0.531 ± 0.034 0.503 75% RH Chamber 0.93 0.5 ± 0.02 4 0.733 ± 0.014 0.753 85% RH Chamber 1.35 0.6 ± 0.01 2 0.817 ± 0.010 0.843 1% MC 0.90 0.6 ± 0.2 27 0.761 ± 0.057 na 5% MC 4.90 4.7 ± 0.8 16 1.007 ± 0.004 na 10% MC 9.96 7.1 ± 0.4 5 1.003 ± 0.005 na Saturated 77.87 26.4 ± 2.4 9 0.974 ± 0.001 na a below detection limit b relative standard deviation of moisture meter readings
The moisture meter’s lower limit of 0.2% MC correlated to the wallboard specimen in the
33% RH Chamber which had a gravimetric % MC of 0.47. The 18% relative standard deviation
(RSD) associated with this reading may reflect lower precision at the meter’s lower limit. The
meter’s upper limit of 50% MC was not reached. The moisture meter reading for the 1% MC
standard had the greatest variability (27% RSD). It is suspected this high error was due to the
inadequate dispersion of the moisture throughout the wallboard specimen. The 5% MC standard
had an RSD approximately half of the 1% MC standard which may reflect better moisture
dispersion although not complete dispersion.
The moisture meter readings were approximately 50% of the % MC values for the Ambient,
33% RH, 75% RH, and 85% RH gravimetric standards. With the manufacturer’s stated ± 20%
tolerance of the reading, the meter was biased low by a minimum of nearly 30% within this
range of the meter. Moisture meter readings for the 1%, 5%, and 10% MC standards were
approximately 60%, 95%, and 70% of their gravimetric % MC values respectively. Due to the
16
higher variability in meter response (%RSD) of the 1% and 5% MC standards, there is
uncertainty in the response accuracy for these two standards. The water activity values provided
in Table 2 are described in the following section: Water Activity Meter Reading Analysis.
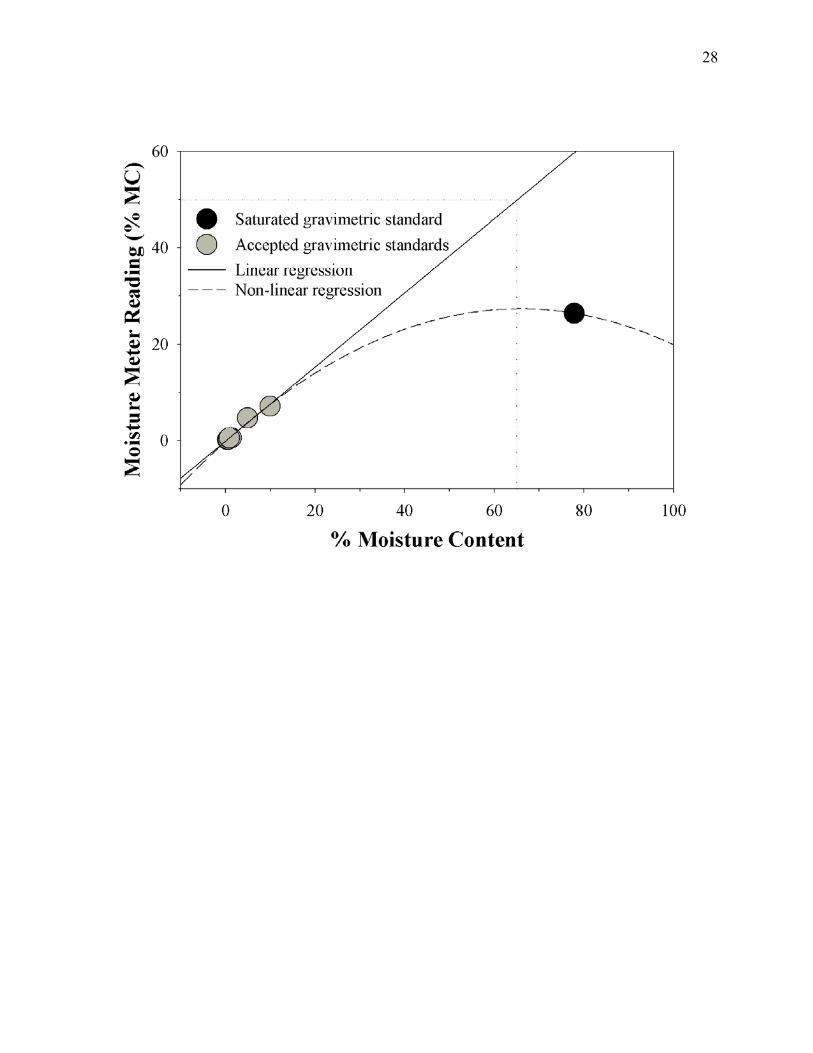
Figure 2 shows the relationship between the moisture meter readings and the accepted
gravimetric standards (final paragraph of previous section). A simple linear regression model
was applied to the data plot. The linear model had a good statistical fit with an adjusted R2 value
greater than 0.98, a slope coefficient p-value less than 0.05, and low residual error (SEE).
Although the saturated % MC standard was not initially considered sufficiently validated for
use, its meter response data was added to the existing data plot. The addition of this data point
did not fit within the linear relationship between the existing gravimetric standards and the meter
response. A non-linear (second-degree polynomial) regression model applied to this new
extended data set gave slight statistical improvement over the linear fit. The model curve of the
extended data set was observed to nearly overlay the linear fit of the initial data points (pre-
saturation standard meter response) up to the 10% MC standard. Beyond this 10% MC data
point, the non-linear model’s curve became more apparent. Due to the location of the saturation
standard data point along the non-linear fit it is unclear what contribution is gained in
understanding the relationship between the percent moisture content and meter response for
wallboard moisture content greater than 10%. Of note however, is the appearance of a
relationship between the non-linear curve’s maxima, the % MC and the linear regression
projected forward. A seen in Figure 2, a line perpendicular to the non-linear curve’s maxima
intersects with the linear response curve at a value equal to the meter’s maximum range (50%
MC). Following the line downward it equates to a MC of ~65%. Manufacturer calibration data
for the meter was not provided, but statistical analysis appears to support a piece-wise (linear or

17
linear/non-linear combination) or full range non-linear response to moisture within gypsum
wallboard.
The moisture meter used in this comparison study was chosen in part due to the
manufacturers built-in Gypsum Scale. Along with the digital reading, three LEDs located on the
front panel provide visual aid in the moisture level determination. Green (0% to 0.5% MC),
yellow (0.5% to 1% MC), and red (>1% MC) colored lights provide guidance with regard to
painting or wallpapering gypsum, as defined in the operating manual. Literature cites moisture
conditions for mold growth from an ERH of 65% to 100% (Aw of 0.65 to 1.0). This study has
determined that an ERH of 65% equates to a MC of approximately 0.85% for gypsum wallboard.
Other literature sources give values as low as 0.7% MC for an ERH of 65%. Data are presented
in the Sorption Isotherm Section.
Prolonged exposure of gypsum wallboard to moisture environments greater than or equal to
an ERH of 100% (MC of 1.4% to 1.7% based on this study) is essentially guaranteed to support
mold growth. Therefore, the more important, useful range of the moisture meter used in this
study is from 0.2% to approximately 3.0% MC. This is based on the relationship of the moisture
meter reading to the gravimetric measurement observed for this meter, where the meter readings
in this range are approximately one half of the gravimetric values. Improper interpretation of the
readings in this range could lead to further or future mold related issues.
Water Activity Meter Reading Analysis
Water activity meter readings and theoretical Aw values are provided in Table 2 for the
gypsum wallboard reference standards. Meter Aw readings are given for all reference standards
with their standard deviation. Theoretical Aw values are provided only for the reference
18
standards generated by equilibrating wallboard specimens in relative humidity environments.
The theoretical Aw value was considered equivalent to % RH/100 (temperature dependent).
For the salt solution environmental chambers, the theoretical Aw values were calculated
using the mean % RH value obtained from ASTM Standard E104-85 at a temperature of 20oC.
Results of 0.113, 0.328, 0.753, and 0.843Aw were obtained for the 11%, 33%, 75%, and 85%
RH salt solutions respectively. The ambient standard’s Aw value of 0.503 was calculated using
the weekday mean laboratory % RH. The desiccator standard’s Aw value was assumed equal to
zero.
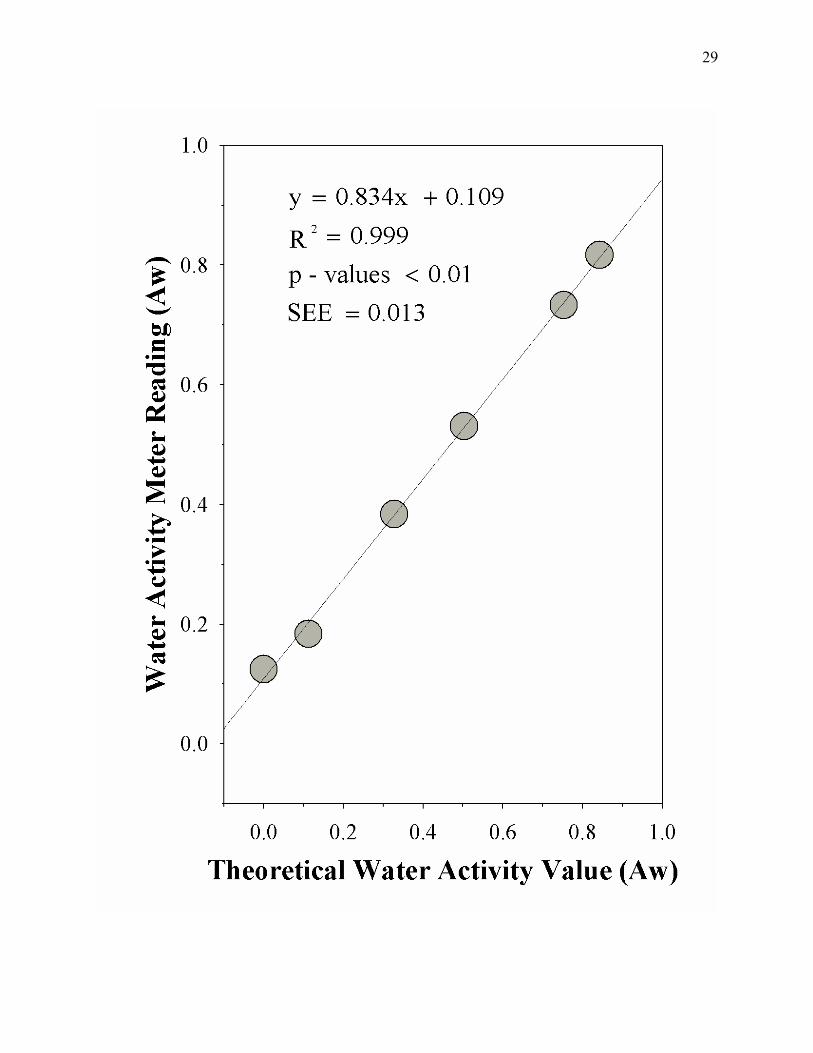
The water activity meter readings were compared against the theoretical values associated
with the reference standards for their respective equilibrium relative humidity environment. A
least-squares linear regression was applied to the water activity data plot and is presented in
Figure 3. The model had a very good fit as indicated by the R2 value, coefficient p-values, and
SEE value. The lack of 1:1 correlation between the theoretical value and meter reading may be
attributed to using the meter in the quick mode or operating the meter in a modified manner.
This reduction in correlation may be an acceptable trade-off for the sample time savings gained.
The baseline offset may be due to instrument bias, water vapor trapped within the sensing
volume of the meter probe during readings, or the actual presence of free moisture within the
wallboard. Another possibility is the detection of chemically bound water, although, based on
the water activity meter’s theory of operation, chemically bound water should not be detected.
The baseline offset was nearly equivalent to the Aw reading for the desiccator standard and
the 11% RH theoretical value. The desiccator standard’s 0.125 Aw meter reading was
unexpected as the theoretical Aw was presumed equal to zero for the desiccator standard: no free
moisture in the wallboard specimen. One possible explanation for the desiccator standard’s non-
19
zero Aw reading was in the desiccator’s performance. An assumption was made that the
desiccator, containing silica gel, would keep the wallboard specimens dry and free of unbound
moisture. The desiccator’s built-in hygrometer however, indicated a reading of approximately
10% RH during the study. The hygrometer was not calibrated so the desiccator’s actual RH was
unknown.
The water activity meter readings were also compared with the theoretical % MC values,
gravimetric % MC values, and moisture meter % MC readings. Only those standards with
values equal to or less than 1.4% MC were included: equivalent to the upper limit of the water
activity meter. This upper limit of 1.4% MC was based on the theoretical relationship of water
activity and moisture content, where a 0.7 Aw unit corresponds to approximately of one % MC
unit (100% ERH ≈ 1.0Aw ≈ 1.4% MC). See Method section.
Due to the nearly 1:1 correlation between the theoretical % MC and the gravimetric % MC
values seen in Table 1, the relationship of each with the Aw meter were essentially equivalent.
The results of these two comparisons reveal a 0.6 Aw unit corresponding to approximately one
unit of % MC. The difference in the theoretical and measured relationship (0.6 versus 0.7) is
likely error associated with the meter’s method of use. Comparison of the Aw meter and % MC
meter readings revealed a nearly direct correlation with a baseline offset of approximately 0.2.
These results suggest a water activity meter could be used in place of a moisture meter if
warranted. Caution must be emphasized however, due to the water activity meter’s readings
relative to their equivalent gravimetric moisture content and the meter’s upper limit of
approximately 1.4% MC (1.0 Aw). Similar precautions regarding interpretation of the moisture
meter reading should be heeded with the water activity meter readings; for regular gypsum
wallboard, the water activity readings represent approximately one-half of the gravimetric %
20
MC. Water activity readings approaching the upper limit of 1.0 Aw will provide only relative
measure of available moisture to support biological growth.
Sorption Isotherm
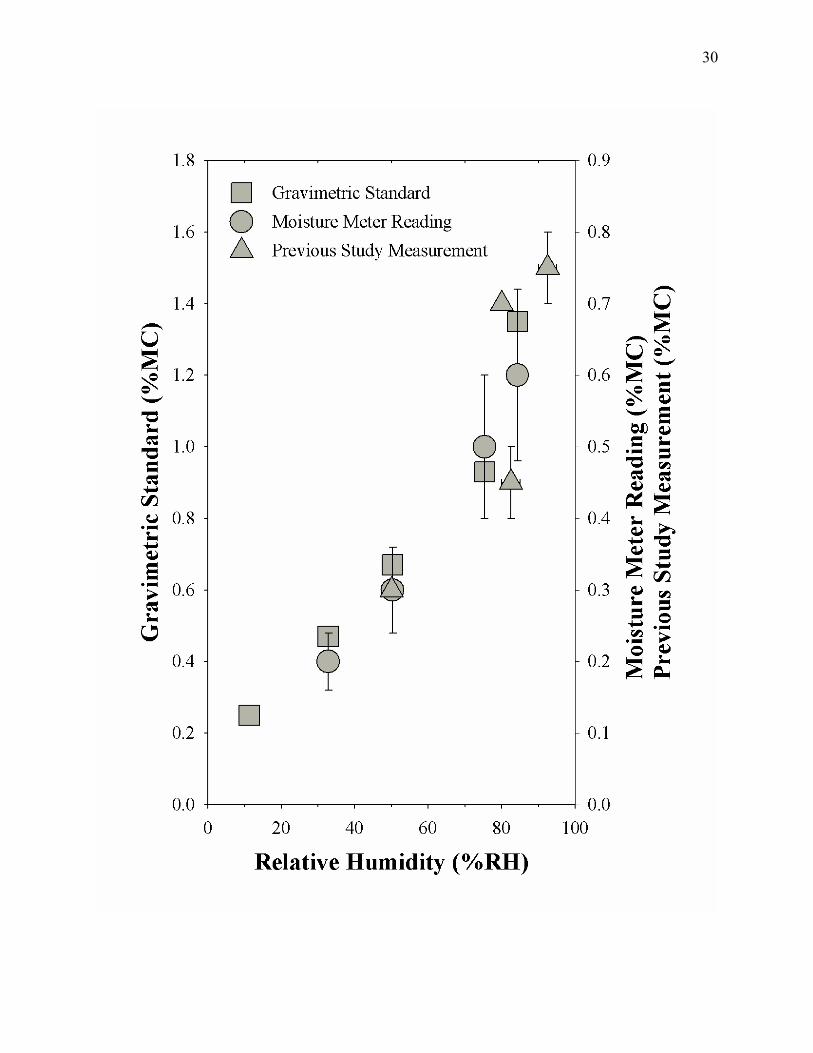
A sorption isotherm plot of moisture uptake was generated using the gravimetric % MC
standard values. The moisture meter readings obtained from this study and previous wallboard
moisture studies were plotted as well. See Figure 4. The gravimetric % MC values are read on
the left y-axis and the moisture meter and previous % MC readings are read on the right y-axis.
With the 2:1 ratio of the y-axis scales, the relationship described previously between the
gravimetric % MC values and the moisture meter % MC readings is more easily seen
(Comparison of Moisture Meter Readings with the Calculated Gravimetric % MC Section). The
non-linear shape of the data also fits the previous description given for building material
isotherms.
The manufacturer’s stated 20% tolerance of the reading is reflected in the error bars given
with the moisture meter readings. Two of the previous wallboard moisture study data points
were averaged for plotting. The 0.4-0.5% MC for 80-85% RH range was plotted as 0.45% MC
at 82.5% RH and the 0.7-0.8% MC for 90-95% RH was plotted as 0.75% MC at 92.5% RH. X
and y-axis error bars reflect the averaging range. The true errors associated with the previous
study data points are unknown.
The data plots reveal reasonable correlation between the moisture meter readings obtained in
this study and moisture content values from previously reported studies. Similarly, the previous
study data values are approximately half of the gravimetric % MC measurements. This may
imply the previous data was not determined gravimetrically but by some type of moisture meter.
21
Conclusion
The wide use of moisture meters designed for wood products in wallboard remediation may
not be providing the information necessary to make sound decisions. Knowing the limitations
and errors associated with any moisture meter is critical to adequately detect and measure
wallboard moisture content.
The moisture meter validation method developed was simple in design, and easy to assemble
and utilize. The measured gravimetric % MC of the wallboard moisture content standards had
good correlation with 7 of the 10-theoretical/calculated % MC values. The ambient, 33% RH,
75% RH, 85% RH, 1% MC, 5% MC, and 10% MC standards were considered valid for use in
this study: determination of the moisture meter’s accuracy and precision. The three exceptions
were the desiccator, 11% RH chamber, and the saturation standards. The 11% RH chamber had
an error approaching 60% and the desiccator and saturation standards lacked sufficient data to
calculate their % error.
Issues affecting the results of the moisture content standards included moisture loss,
inadequate sealing mechanisms, moisture dispersion, and laboratory temperature and humidity
control. Additional moisture loss from the desiccator wallboard sample section suggested the
initial drying method was inadequate and required the normalization of the remaining data. Lack
of stable gravimetric mass in the direct water generated reference standards suggest an improved
sealing mechanism is needed. The moisture meter readings associated with the 1% and 5%
direct water generated standards indicated inadequate dispersion of the moisture throughout
those standard specimens. A better means to distribute the moisture throughout the wallboard
specimens is needed. Laboratory environmental conditions were reasonably stable throughout
the weekdays but fluctuated over the weekends due to facility operating procedures regarding

22
energy conservation. There is no direct link to the affect on the moisture standards resulting
from the temperature and humidity variation, but it is suspected the ambient, saturation, and
direct water generated standards were influenced partially as determined by the measurement
standard errors.
The meter tested in this study, determined moisture content by measuring the electrical
resistance between two pins inserted into the substrate. The moisture meter readings were
compared against the gravimetric % MC standards produced in this study. The meter readings
had good reproducibility although the meter’s accuracy did not meet expectations. The % MC
readings were approximately 50% of the gravimetric standard % MC values. Considering the
manufacturer stated ± 20% tolerance of the reading, the moisture meter readings were still well
below the gravimetric standard % MC values. Several meter response curves over the range of
the instrument were considered possible from the data observed: piece-wise (linear or linear/non-
linear combination) or full range non-linear response.
This study showed that the use of moisture meters might not reflect the actual moisture
content within gypsum wallboard. This could be critical in the range below 1% MC, where the
measured moisture content is used to determine the potential for mold growth or the application
of surface treatments (i.e. paint).
The water activity meter readings were approximately 60% of the gravimetric % MC values.
The results tend to support the theoretical relationship of water activity and moisture content,
(0.7 units Aw to 1 unit % MC), when consideration of experimental error is applied. This error
likely resulted from the sampling technique used: a combination of the sampling mode and a
non-traditional sampling method. Based on the results obtained, water activity meters could be
utilized to determine moisture availability for mold growth in gypsum wallboard. As with the

23
moisture meter, caution in interpreting the actual moisture content should be considered. The
water activity meter is restricted in its range of usefulness, with an upper limit of 1.0 Aw or 1.4%
MC (theoretical).
The moisture isotherm plot supported the nonlinear relationship of gypsum wallboard’s
moisture uptake to its % RH equilibrium environment presented in previous findings. The 2:1
ratio of the gravimetric standard % MC to moisture meter reading from this study was seen more
clearly in the isotherm plot. The % MC data values from previous studies mimicked those of the
moisture meter readings obtained in this research, suggesting earlier data were not obtained
gravimetrically.
Continued work to fine-tune the method is needed with emphasis placed on replicate
sampling and the use of multiple manufacturer wallboard brands. Additionally, a field reference
method is needed to support on-site moisture content measurements of gypsum wallboard using
the current instrumentation designed for wood products.

24
References
1. Menetrez, M. Y., Foarde, K. K., Webber, T. D., Betancourt, D., and Dean, T., "Growth
Response of Stachybotrys chartarum to Moisture Variation on Common Building Materials,"
Indoor and Built Environment, No. 13, 2004, pp. 183-187.
2. Pasanen, A. L., Kasanen, J. P., Rautiala, S., Ikaheimo, M., Rantamaki, J., Kaarianen, H., and
Kalliokoski, P., "Fungal growth and survival in building materials under fluctuating moisture
and temperature conditions," International Biodeterioration & Biodegration, No. 46, 2000,
pp. 117-127.
3. Flannigan, B., Morey, P. R., “Control of moisture problems affecting biological indoor air
quality”, ISIAQ-guideline TFI-1996, International Society of Indoor Air Quality and Climate,
1996.
4. Powitz, R. W., and Balsamo, J. J., "Moisture Detection Meters: Tools for All Occasions,"
Environmental Health, April, 1999, pp. 36, 49.
5. AWCI NETFORUM, http://www.awci.org/netforum/awci/a/8--28.1.0.1, February, 3, 2004.
6. Walker, J., “All Things Gypsum – The Moisture in Gypsum”,
http://www.wconline.com/CDA/ArticleInformation/features/BNP_Features_Item/0,3299,883
07,00.html, November 30, 2002.
7. Nielson, K.F., “Mould growth on building materials, Secondary metabolites, mycotoxins,
and biomarkers,” Thesis paper, The Mycology Group, Biocentrum-DTU, Technical
University of Denmark, December 2001.
8. Pasanen, A. L., Rautiala, S., Kasanen, J. P., Raunio, P., Rantamaki, J., and Kalliokoski, P.,
"The Relationship between Measured Moisture Conditions and Fungal Concentrations in
Water-Damaged Building Materials," Indoor Air, No. 11, 2000, pp. 111-120.
25
9. Baldassari, V., “Subject: origin of gypsum cal – 24 jul 03.doc”, email correspondence with
Delmhorst Instrument Co., 10 February, 2004.
10. HygroPalm AW1, Portable Water Activity Indicator Instruction Manual, v3, 20020715.
11. ASTM Designation: E 104-85 (Reapproved 1996), Standard Practice for Maintaining
Constant Relative Humidity by Means of Aqueous Solutions.
12. Hansen, K., K., “Sorption Isotherms, A Catalogue”, The Technical University of Denmark,
Department of Civil Engineering, Building Materials Laboratory (1986), Copenhagen,
Denmark, Technical Report 162/86, TT Tryl, DTH.
13. National Institute of Science and Technology, “MOIST A PC Program for Predicting Heat
and Moisture Transfer in Building Envelopes, Release 3.0”, NIST Special Publication 917.
26
FIGURE LIST
Figure 1. Relationship of the normalized gravimetric % MC standards to their theoretical values.
A simple linear regression model is fit to the data with the equation and R2 value shown.
Figure 2. Relationship of the gravimetric standards (% MC) and moisture meter readings (%
MC). Both linear regression and non-linear quadratic fits are shown.
Figure 3. Relationship of the water activity meter readings to their theoretical Aw value. A
simple linear regression model is fit to the data with the equation and R2 value shown.
Figure 4. Sorption (moisture uptake) isotherm of gypsum wallboard composed of the gravimetric
standard values, the moisture meter readings, and the previous study data. Points along each
curve represent the relationship between gypsum wallboard’s moisture content and the relative
humidity at equilibrium at constant temperature.
27
28
29
30