Embed Size (px)
Citation preview
Comparative Studies of Alternative Anaerobic Digestion Technologies
David C. Inman
Thesis submitted to the faculty of the Virginia Polytechnic Institute and State University in partial fulfillment of the requirements for the degree of
Master of Science
in Environmental Engineering
John T. Novak, Ph.D., Chair Gregory D. Boardman, Ph.D. Clifford W. Randall, Ph.D.
October 14, 2004 Blacksburg, Virginia
Keywords: anaerobic, digestion, thermophilic, temperature phased, mesophilic, biosolids
Copyright 2004, David C. Inman
Comparative Studies of Alternative Anaerobic Digestion Technologies
David C. Inman
Abstract
Washington D.C. Water and Sewage Authority is planning to construct a new
anaerobic digestion facility at its Blue Plains WWTP by 2008. The research conducted in
this study is to aid the designers of this facility by evaluating alternative digestion
technologies. Alternative anaerobic digestion technologies include thermophilic, acid/gas
phased, and temperature phased digestion. In order to evaluate the relative merits of
each, a year long study evaluated the performance of bench scale digestion systems at
varying solids retention times (SRT) and organic loading rates (OLR). The digesters
were fed a blend of primary and secondary residuals from the Blue Plains wastewater
treatment facility.
In each study phase, temperature phased anaerobic digestion was compared to
single stage mesophilic digestion (the industry standard) at the same SRT. Single stage
thermophilic digestion was evaluated by sampling the first thermophilic stage of the
temperature phased digestion systems throughout the study. Additionally, the first phase
study compared acid/gas phased digestion to temperature phased and single stage
mesophilic digestion.
Results of the study demonstrated that the temperature phased digestion system
consistently performed better than the other systems during each study phase by having
higher volatile solids reduction (VSR), higher methane production, and lower residual
biological activity. The highest observed VSR during the study (67%) occurred in a
temperature phased digestion system operated at 7.5 days in each stage. Based on these
results, it seems a suitable candidate for the Blue Plains digestion facility. Additionally,
odor studies performed in conjunction with the research presented in this paper have
shown distinct advantages for the temperature phased process.
Acknowledgements Words cannot express the depth of gratitude I have for all who have helped me
achieve my academic goals and research accomplishments at Virginia Tech. Foremost, I
give thanks to God and to my family at the Blacksburg Church of Christ. I look forward
to continued years of work and service with them.
I give special thanks to the Washington D.C. Water and Sewage Authority for
their monetary support and to Dr. Sudhir Murthy for his enthusiasm towards the research
efforts of our laboratory. My warm regards go to Dr. John Novak for the freedom of
thinking and experimentation he allows in his research group, and for his tireless work to
support students in the Environmental Engineering program.
Fellow students and Environmental Engineering staff have provided much help
during the course of my research. Chris, Jared, Nitin V., Nitin K., Rahul, and Saurabh,
my friends and laboratory partners, thank you all for your contributions. Thanks to Julie
Petruska and Jodey Smiley for teaching me methods and manners necessary to
accomplish my research. Also, I can’t forget to thank Betty Wingate and Sherry Burke
for administrative support and for prompt notification when my coolers of sample arrived
at the office!
Lastly, I give thanks for the good advice I’ve received from coworkers, who
urged me to pursue education at Virginia Tech, and from my parents, who have been my
cheerleaders throughout the years.
iii

Dedication To my wife, Sara: Thank you for your love, patience, and willingness to leave the
familiar and support me in this pursuit. I look forward to the next phase of our lives
together.
iv
Table of Contents Abstract ............................................................................................................................... ii Acknowledgements............................................................................................................ iii Dedication .......................................................................................................................... iv Table of Contents................................................................................................................ v List of Figures .................................................................................................................... vi List of Tables .................................................................................................................... vii Literature Review................................................................................................................ 1
Introduction..................................................................................................................... 1 Anaerobic metabolism .................................................................................................... 1 Developments in digestion.............................................................................................. 3 Thermophilic Digestion .................................................................................................. 4 Acid/Gas Phased Digestion............................................................................................. 5 Temperature Phased Digestion ....................................................................................... 7 Summary ......................................................................................................................... 8 References..................................................................................................................... 10
Manuscript 1: Comparing Acid/Gas-Phased to Temperature-Phased and Conventional Mesophilic Digestion........................................................................................................ 13
Abstract ......................................................................................................................... 13 Keywords ...................................................................................................................... 13 Introduction................................................................................................................... 14 Objectives ..................................................................................................................... 16 Methods and materials .................................................................................................. 16 Results and discussion .................................................................................................. 20 Conclusions................................................................................................................... 24 References..................................................................................................................... 26
Manuscript 2: A Comparative Study of Temperature-Phased Digestion to Single Stage Thermophilic and Mesophilic Digestion .......................................................................... 42
Abstract ......................................................................................................................... 42 Keywords ...................................................................................................................... 42 Introduction................................................................................................................... 42 Objectives ..................................................................................................................... 45 Methods and materials .................................................................................................. 45 Results and discussion .................................................................................................. 49 Conclusions................................................................................................................... 54 References..................................................................................................................... 56
Vita.................................................................................................................................... 74
v
List of Figures Literature Review Figure 1 - Compounds and metabolic processes occurring in sewage sludge digestion. ... 2 Manuscript 1 Figure 1- Flow diagram for temperature-phased digestion system. ................................. 33 Figure 2 – Gas recirculation diagram for experimental setup........................................... 34 Figure 3 –Volatile solids reduction (10 day moving average) with time. ........................ 35 Figure 4 – Volatile solids reduction after thinned primary sludge. .................................. 36 Figure 5– Volatile solids reduction after 74 days. ............................................................ 37 Figure 6 – Residual biological activity test results. .......................................................... 38 Figure 7 - Normalized methane production for each digester system at STP. ................. 39 Figure 8 – Effluent volatile fatty acids (VFA) and reactor pH. ........................................ 40 Figure 9 – Distribution of volatile fatty acids (VFA) and organic loading rate (OLR).... 41 Manuscript 2 Figure 1 – General flow diagram for temperature-phased digestion systems .................. 66 Figure 2 – Gas recirculation diagram for experimental setup........................................... 67 Figure 3 – Volatile solids reduction comparison .............................................................. 68 Figure 4 – Volatile solids reduction versus SRT and OLR for the digesters.................... 69 Figure 5 – Speculated differences if feed degradation...................................................... 70 Figure 6– Residual biological activity test results. ........................................................... 71 Figure 7 – Methane production rate (MPR) during each test phase. ................................ 72 Figure 8 – Specific methane yield (STP) for each digester system .................................. 73
vi
List of Tables Manuscript 1 Table 1 - Operational parameters for digestion systems evaluated during the study. ...... 28 Table 2 – Digester pH and alkalinity during the study..................................................... 29 Table 3 - Statistical analysis results of volatile solids reduction data. ............................. 30 Table 4– Summary of gas testing data.............................................................................. 31 Table 5 – Digester cation concentrations during the study.) ............................................ 32 Manuscript 2 Table 1 - Operational parameters for digestion systems................................................... 58 Table 2 – Feed characteristics for all study phases........................................................... 59 Table 3 – Organic loading rate (OLR) during each study phase. ..................................... 60 Table 4 – Average alkalinity and pH conditions. ............................................................. 61 Table 5– Free ammonia concentration.............................................................................. 62 Table 6 – VFA concentration and distribution for each digester...................................... 63 Table 7 –Composition of biogas in each digester............................................................. 64 Table 8 – Average NH4-N concentration (mg/L) in the digesters. ................................... 65
vii
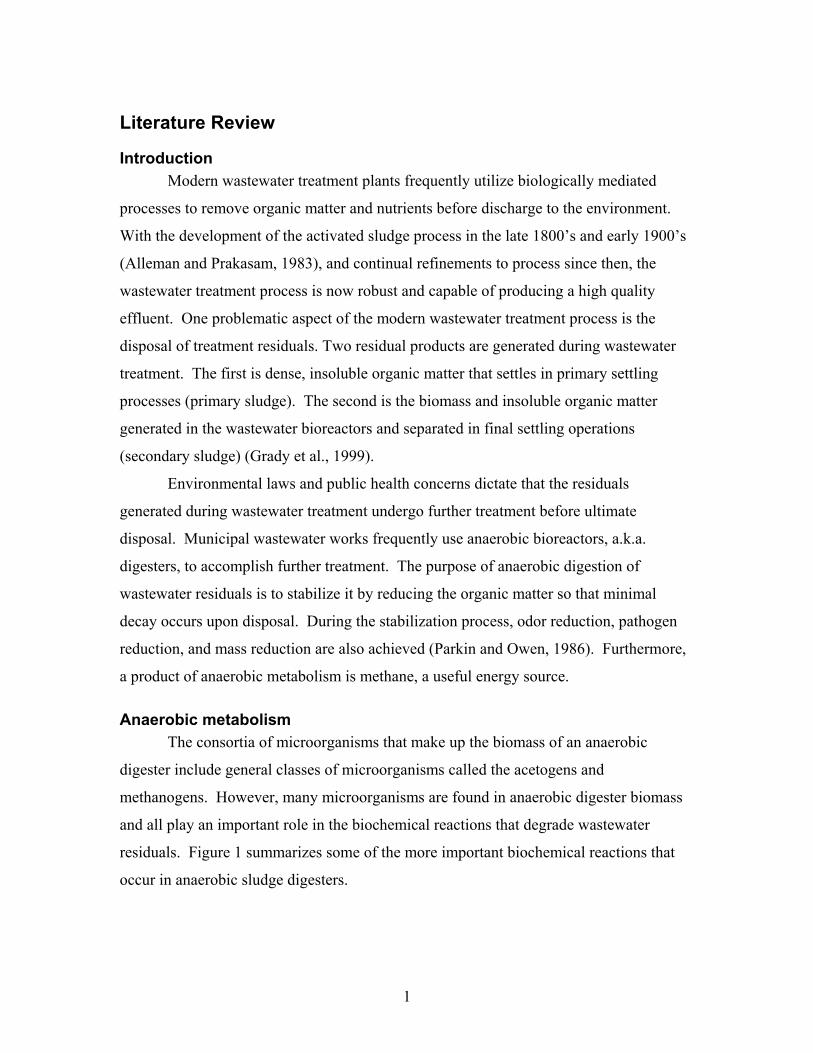
Literature Review
Introduction Modern wastewater treatment plants frequently utilize biologically mediated
processes to remove organic matter and nutrients before discharge to the environment.
With the development of the activated sludge process in the late 1800’s and early 1900’s
(Alleman and Prakasam, 1983), and continual refinements to process since then, the
wastewater treatment process is now robust and capable of producing a high quality
effluent. One problematic aspect of the modern wastewater treatment process is the
disposal of treatment residuals. Two residual products are generated during wastewater
treatment. The first is dense, insoluble organic matter that settles in primary settling
processes (primary sludge). The second is the biomass and insoluble organic matter
generated in the wastewater bioreactors and separated in final settling operations
(secondary sludge) (Grady et al., 1999).
Environmental laws and public health concerns dictate that the residuals
generated during wastewater treatment undergo further treatment before ultimate
disposal. Municipal wastewater works frequently use anaerobic bioreactors, a.k.a.
digesters, to accomplish further treatment. The purpose of anaerobic digestion of
wastewater residuals is to stabilize it by reducing the organic matter so that minimal
decay occurs upon disposal. During the stabilization process, odor reduction, pathogen
reduction, and mass reduction are also achieved (Parkin and Owen, 1986). Furthermore,
a product of anaerobic metabolism is methane, a useful energy source.
Anaerobic metabolism The consortia of microorganisms that make up the biomass of an anaerobic
digester include general classes of microorganisms called the acetogens and
methanogens. However, many microorganisms are found in anaerobic digester biomass
and all play an important role in the biochemical reactions that degrade wastewater
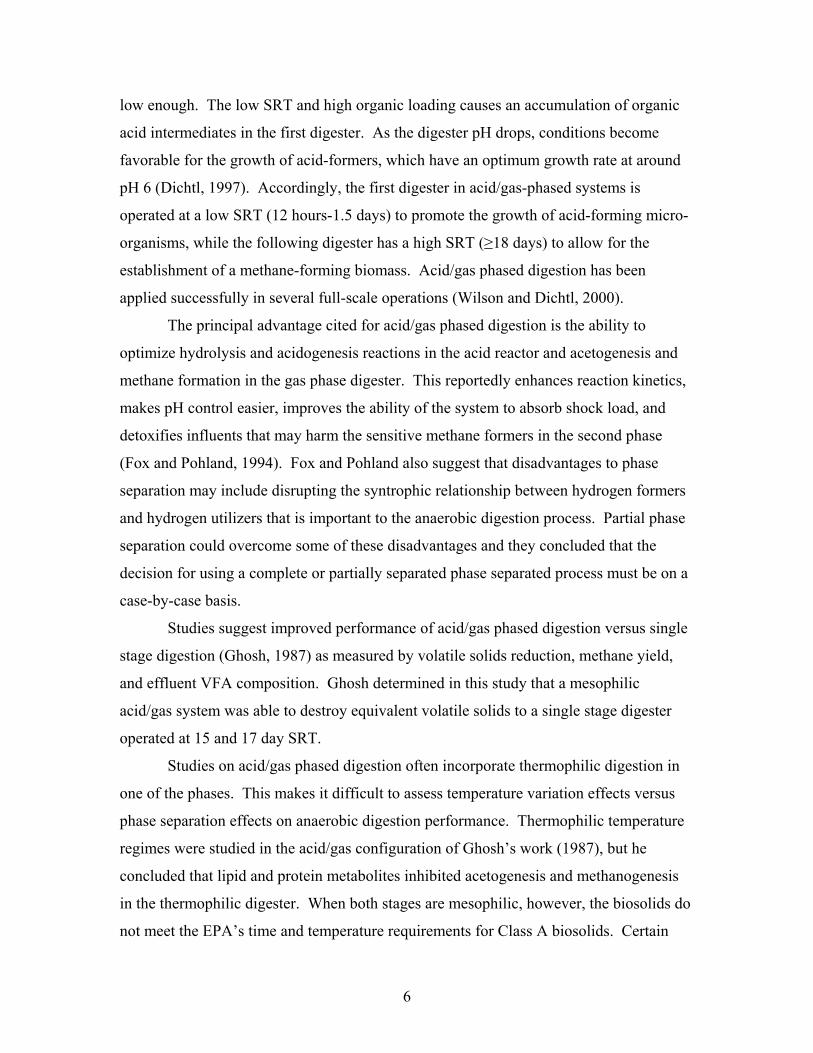
residuals. Figure 1 summarizes some of the more important biochemical reactions that
occur in anaerobic sludge digesters.
1
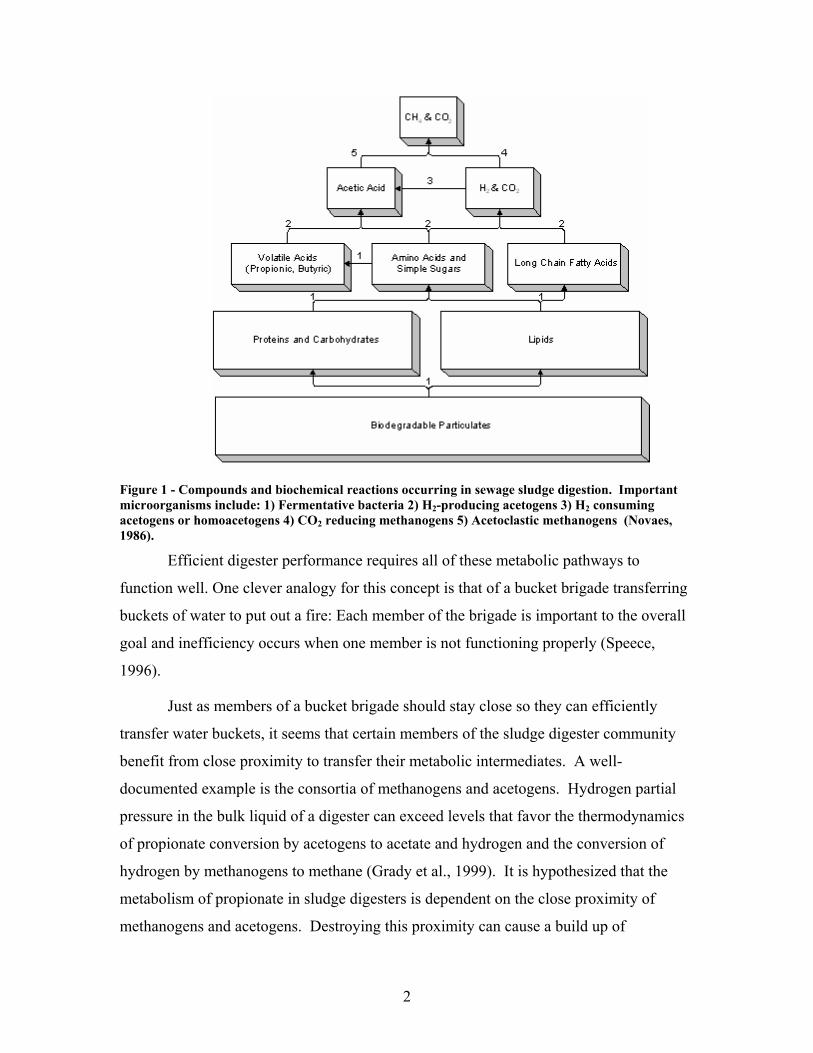
Figure 1 - Compounds and biochemical reactions occurring in sewage sludge digestion. Important microorganisms include: 1) Fermentative bacteria 2) H2-producing acetogens 3) H2 consuming acetogens or homoacetogens 4) CO2 reducing methanogens 5) Acetoclastic methanogens (Novaes, 1986).
Efficient digester performance requires all of these metabolic pathways to
function well. One clever analogy for this concept is that of a bucket brigade transferring
buckets of water to put out a fire: Each member of the brigade is important to the overall
goal and inefficiency occurs when one member is not functioning properly (Speece,
1996).
Just as members of a bucket brigade should stay close so they can efficiently
transfer water buckets, it seems that certain members of the sludge digester community
benefit from close proximity to transfer their metabolic intermediates. A well-
documented example is the consortia of methanogens and acetogens. Hydrogen partial
pressure in the bulk liquid of a digester can exceed levels that favor the thermodynamics
of propionate conversion by acetogens to acetate and hydrogen and the conversion of
hydrogen by methanogens to methane (Grady et al., 1999). It is hypothesized that the
metabolism of propionate in sludge digesters is dependent on the close proximity of
methanogens and acetogens. Destroying this proximity can cause a build up of
2
propionate and butyrate and the digester can become unstable or even fail due to a
subsequent decrease in pH (Parkin and Owen, 1986).
Developments in digestion Before digesters were used, anaerobic treatment of residuals occurred to some
extent in sludge storage tanks at wastewater facilities. History is inconclusive whether
German or UK municipal wastewater works were the first to build anaerobic digesters for
the express purpose of residuals treatment in the 1930’s (Noone, 1990). Designers
sought to enhance the natural microbial activity with heating and mixing, usually at
mesophilic (30-40°C) temperatures.
Today, digestion performed in a single stage mesophilic digester is the common
method utilized for residuals stabilization in municipal wastewater treatment. Biosolids
are the byproduct of residuals stabilization. In the past several decades, practitioners
have looked to alternative technologies to improve digestion performance and produce
higher quality biosolids.
Land application laws and public health concerns have driven the development of
technologies to reduce pathogens in digested biosolids. For example, the US EPA
implemented standards in 40 CFR Part 503 (1993) that govern biosolids disposal based
on the pathogen reduction criteria. The 40 CFR Part 503 regulation is a technology based
standard and defines the processes suitable to achieve Class A and Class B biosolids.
Class A biosolids, those treated with a process that reduces pathogen levels below
detectable limits, have few restrictions for ultimate disposal. Biosolids with pathogen
levels above detectable limits, termed Class B biosolids, must be disposed of on restricted
sites.
In addition to pathogen reduction goals, rising transportation, disposal, and
handling costs have driven the search for digestion processes that have higher volatile
solids reduction and better dewaterability in biosolids. Some alternative anaerobic
digestion technologies include thermophilic digestion, acid/gas phased digestion, and
temperature-phased digestion. These processes can destroy more volatile solids, produce
more methane, and reduce pathogens, sometimes to a point capable of meeting Class A
biosolids standards. They are of increasing interest to regulators and the wastewater
industry.
3
Thermophilic Digestion Thermophilic digestion is one example of an alternative technology, though it is
by no means a newly developed process. The main interest in thermophilic digestion is
due to its pathogen reducing potential that was documented at least 75 years ago (Rudolfs
and Heulekian, 1930). Other cited advantages of thermophilic treatment over mesophilic
treatment include higher reaction rates, better dewaterability, and increased volatile solids
reduction (VSR)(Buhr and Andrews, 1977).
Some of the earliest full-scale studies of thermophilic digestion in the U.S.
occurred at the Hyperion WWTP in Los Angeles, CA, from 1953 to 1957 (Garber, 1954).
The thermophilic digesters at Hyperion treated a blend of primary and waste activated
sludges (70:30 ratio) and were operated at several different organic loading rates. Results
demonstrated that thermophilic digestion was capable of destroying equal or more
volatile solids than digesters operated at mesophilic temperatures. Subsequent studies at
Hyperion showed that thermophilic digester produced biosolids that were easier to
dewater but the supernatant had higher levels of volatile fatty acid than the mesophilic
digesters (Garber et al., 1975).
High volatile fatty acids in the effluent are frequently cited as a problem with
thermophilic digestion, causing malodorous waste streams that are difficult to handle
(WEF, 1987). Moen et al. (2003) tested mesophilic and thermophilic digesters at varying
solids retention time (SRT) and organic loading rate (OLR) conditions. The digesters in
this study treated a blend of primary and waste activated sludges. Their results
demonstrated that volatile fatty acids (VFA) increased with decreasing SRT, ranging
from around 400 mg/L at 20 day SRT to over 2500 mg/L at the 4 day SRT. The acetic
acid concentration was higher than the propionic acid concentration in all but the 4 day
SRT, where propionate was the dominant species of VFA. High effluent volatile fatty
acids might be due to a flawed operational approach of thermophilic digesters. Kim et al.
(2002) showed that a non-mixed thermophilic reactor treating dog food (similar to
primary sludge) had equal VSR to a mixed thermophilic reactors, but produced much less
effluent propionic acid and total VFA. The non-mixed thermophilic reactor in Kim et
al.’s study also had higher VSR, produced more biogas, and was able to operate at a
higher OLR until failure than the mesophilic digesters.
4
Researchers do not always observe higher volatile solids reduction in
thermophilic treatment. Data from Moen et al.’s study suggested that at SRT of 10 days
or longer there was no difference in VSR between mesophilic and thermophilic digesters.
They concluded that volatile suspended solids (VSS) reduction may be more suitable for
comparison because soluble COD levels were higher in the thermophilic reactor than in
the mesophilic digester, causing an error in the volatile solids test procedure. If soluble
COD levels are similar in digesters, there would be no error associated with comparing
VSR. Based on VSS reduction, they demonstrated slightly better performance from the
thermophilic reactor at 6, 10, and 15 day SRT.
Higher destruction of organics can sometimes be problematic in thermophilic
digestion because of the protein content of the influent. Too much protein degradation in
thermophilic digestion may cause ammonia inhibition of the thermophilic biomass. This
may be a potential disadvantage to thermophilic digestion versus mesophilic digestion.
Sung and Liu (2003) reported the chronic and acute toxicity effects of ammonia on
thermophilic biomass in 7 day SRT reactors treating non-fat dry milk. They operated
these digesters at various loading rates and sequentially increased the total ammonia
nitrogen levels in the feed. Results demonstrated that the specific methane yield
generally decreased as the feed ammonia nitrogen level was increased. Through
modeling simulations, it was also demonstrated that acclimation to increased total
ammonia nitrogen levels diminished the effects of ammonia inhibition on specific
methane yield in thermophilic digesters. Their study demonstrated the complex
interaction between pH and unionized ammonia concentration as it relates to biomass
toxicity. Since the pKa of ammonia is inversely proportional to temperature, it seems
reasonable that at lower temperatures, the toxicity effect of unionized ammonia might
diminish, though Sung and Liu did not investigate that possibility.
Acid/Gas Phased Digestion Drawing on the growing knowledge of anaerobic microorganism metabolisms,
Pohland and Ghosh (1971) first proposed acid/gas phased digestion. In acid/gas phased
digestion, operators can vary the SRT to kinetically select for either acid-forming or
methane-forming microorganisms (Massey and Pohland, 1978). Methane-forming
microorganisms, having a slow growth rate, are washed out of a digester if the SRT is
5
low enough. The low SRT and high organic loading causes an accumulation of organic
acid intermediates in the first digester. As the digester pH drops, conditions become
favorable for the growth of acid-formers, which have an optimum growth rate at around
pH 6 (Dichtl, 1997). Accordingly, the first digester in acid/gas-phased systems is
operated at a low SRT (12 hours-1.5 days) to promote the growth of acid-forming micro-
organisms, while the following digester has a high SRT (≥18 days) to allow for the
establishment of a methane-forming biomass. Acid/gas phased digestion has been
applied successfully in several full-scale operations (Wilson and Dichtl, 2000).
The principal advantage cited for acid/gas phased digestion is the ability to
optimize hydrolysis and acidogenesis reactions in the acid reactor and acetogenesis and
methane formation in the gas phase digester. This reportedly enhances reaction kinetics,
makes pH control easier, improves the ability of the system to absorb shock load, and
detoxifies influents that may harm the sensitive methane formers in the second phase
(Fox and Pohland, 1994). Fox and Pohland also suggest that disadvantages to phase
separation may include disrupting the syntrophic relationship between hydrogen formers
and hydrogen utilizers that is important to the anaerobic digestion process. Partial phase
separation could overcome some of these disadvantages and they concluded that the
decision for using a complete or partially separated phase separated process must be on a
case-by-case basis.
Studies suggest improved performance of acid/gas phased digestion versus single
stage digestion (Ghosh, 1987) as measured by volatile solids reduction, methane yield,
and effluent VFA composition. Ghosh determined in this study that a mesophilic
acid/gas system was able to destroy equivalent volatile solids to a single stage digester
operated at 15 and 17 day SRT.
Studies on acid/gas phased digestion often incorporate thermophilic digestion in
one of the phases. This makes it difficult to assess temperature variation effects versus
phase separation effects on anaerobic digestion performance. Thermophilic temperature
regimes were studied in the acid/gas configuration of Ghosh’s work (1987), but he
concluded that lipid and protein metabolites inhibited acetogenesis and methanogenesis
in the thermophilic digester. When both stages are mesophilic, however, the biosolids do
not meet the EPA’s time and temperature requirements for Class A biosolids. Certain
6
systems, such as the two phase anaerobic digestion process (2PAD), seek to incorporate
complete phase separation and thermophilic digestion in the first reactor (Huyard et al.,
2000) in order to meet Class A biosolids requirements. Complete phase separation is
achieved in the 2PAD digester by chemically lowering the pH to a level that is ideal for
acid formers and harmful to methanogens.
Temperature Phased Digestion Another alternative digestion technology seeks to combine the benefits of the
thermophilic digestion process and partial phase separation instead of complete phase
separation as in the 2PAD process. This technology is called temperature-phased
anaerobic digestion (TPAD) in the U.S. (Dague et al., 1996) and the Anaerobic
Stabilization Thermophilic/Mesophilic system (ASTM) in Europe (Oles et al., 1997). In
temperature-phased digestion, the temperature is varied between digesters to select for
mesophilic or thermophilic microorganisms. Digesters are usually operated from 30-38°
C for mesophilic conditions and 50-60°C for thermophilic.
Partial phase separation is accomplished in the first thermophilic stage of the
TPAD process by lowering SRT. The argument is that true phase separation cannot
occur in thermophilic digestion because thermophilic temperatures preclude the
development of a sole acid-forming stage (Dichtl, 1997). Because of this, Dichtl suggests
that a thermophilic digester in the TPAD system should be operated between 3 and 5
days, which achieves an adequate balance between acid-formers and methane-formers
and minimizes propionic acid accumulation. Commonly, TPAD processes include a
thermophilic reactor (3-5 day SRT) followed by a mesophilic digester (>18 days)
(Metcalf and Eddy, 2003).
Han and Dague (1997) demonstrated 18% higher VSR and methane production
from a TPAD process versus a single stage mesophilic digester across a range of SRT
from 10 to 15 days. Yet improved volatile solids reduction may come at the cost of poor
dewatering. Bivins and Novak (2001) observed poor biosolids dewatering characteristics
in a bench-scale TPAD system: Dewaterability, as measured by capillary suction time
and optimal polymer dose, became worse when the 1st stage thermophilic reactor was
increased from a detention time of 1.5 to 3 days. Nevertheless, class A biosolids
production capability may outweigh the disadvantage of poor dewatering characteristics.
7
Vandenburgh and Ellis (2002) showed a TPAD process capable of meeting Class A
biosolids requirements across a range of solids loading conditions. The first stage
thermophilic reactor in their study also tolerated high levels of un-ionized ammonia (326
mg/L), suggesting its suitability for treatment of high nitrogen wastes. As later studies
have suggested, this tolerance of un-ionized ammonia may be due to acclimation of the
thermophilic biomass (Sung and Liu, 2003). An ammonia tolerant thermophilic biomass
would certainly be advantageous to a wastewater treatment facility that generates high
nitrogen sludges during biological nutrient removal.
Schmit and Ellis (2001) compared the performance of TPAD digestion to 2PAD
digestion while digesting mixed primary sludge and municipal solid waste. The
distinguishing characteristic between the two systems was that the 1st stage thermophilic
digester of the 2PAD system was operated at pH of 5.6 and the 1st stage thermophilic
digester of the TPAD system was operated at pH 7. Both systems had total system SRT
of 13 days initially, but were later switched to 15 days. Results demonstrated that when
the feed had up to 60% of the organic fraction of solid waste, the TPAD system destroyed
more VS and had a higher specific methane yield. When the organic fraction of
municipal solid waste was higher than 60% in the influent, the performance of TPAD and
2PAD digesters was similar. This is reflective of Fox and Pohland’s comments regarding
substrate specificity when considering the appropriateness of complete or partial phase
separation.
Summary While thermophilic digestion has demonstrated capability of reducing pathogens
to a point suitable for production of Class A biosolids, the EPA has not listed it as an
alternative technology suitable for this purpose because of operational stability issues
(Metcalf and Eddy, 2003). Fluctuating volatile fatty acid (VFA) levels, odorous effluent,
and foaming problems have all been attributed to thermophilic digester operation (WEF,
1987). A better understanding of optimal operating conditions may one day minimize
such problems.
Acid/gas phased digestion may have certain advantages over single stage
digestion. However, the suitability of acid/gas phased digestion will depend on the
nature of the waste being treated as certain wastes may upset environmental conditions
8
that are important for methane formation (Fox and Pohland, 1994). Acid/gas phased
digestion may be conducted at thermophilic temperatures, such as in the 2PAD system,
but studies are unclear as to whether the advantages in such systems come from
temperature variation or phase separation.
Temperature phased digestion takes advantage of phase separation and
thermophilic digestion. While the EPA lists it as a suitable technology for producing
Class A biosolids, relatively few full scale installations are in operation in the United
States. Studies suggest that the TPAD process can alleviate some of the problems
associated with single stage thermophilic digestion, such as high effluent VFA.
Furthermore, TPAD digesters that utilize a first stage thermophilic digester may be
appropriate for treating certain wastes due to the advantages of thermophilic temperatures
and partial phase separation.
Though the practical objective of the research conducted for this thesis work is to
help Blue Plains determine design parameters for the construction of a new anaerobic
digestion facility, it is of academic interest as well. It is difficult to find any studies that
compare TPAD digestion to acid/gas phased separation performed at mesophilic
temperatures digesting a blend of waste activated and primary sludge. In this regard, the
research conducted as part of this thesis is unique.
9
References Alleman, J.E., Prakasam, T.B.S. (1983) Reflections on seven decades of AS history. J. Water Pollut. Control Fed. 55, 436-443. Bivins,J.L., Novak, J.T. (2001) Changes in dewatering properties between the thermophilic and mesophilic stages in temperature-phased anaerobic digestion systems. Water Environ. Res. 73, 4, 444-449. Buhr, H.O., Andrews, J.F. (1977) The thermophilic anaerobic digestion process. Water Res., 11, 129-143. Dague, R.R., Kaiser, S.K., Harris, W.L. (1996) Temperature-phased anaerobic waste treatment process. U.S. Patent Office. Patent Number 5,525,228. Dichtl, N. (1997) Thermophilic and mesophilic (two-stage) anaerobic digestion. Water and Env. Mgmt: Journal of CIWEM. 11, 2, 98-104. Fox, P., Pohland, F.G. (1994) Anaerobic treatment applications and fundamentals: substrate specificity during phase separation. Water Env. Res. 66, 5, 716-724. Garber, W.F., Ohara, G.T., Colbaugh, J.E., Raksit, S.K. (1975) Thermophilic digestion at the Hyperion treatment plant. J. Water Pollut. Control Fed. 47, 5, 951-961. Garber, W.F. (1954). Plant-scale studies of thermophilic digestion at Los Angeles. Sewage Ind. Wastes. 26, 1202. Ghosh, S. (1987) Improved sludge gasification by two-phase anaerobic digestion. ASCE J. Environ. Eng., 113, 6, 1265-1284. Grady, C.P., Daigger, G.T., Lim, H.C., (1999) Biological wastewater treatment. 2nd Edition. Marcel Dekker, New York, NY: . Han, Y., Dague, R.R. (1997) Laboratory studies on the temperature-phased anaerobic digestion of domestic primary sludge. Water Environ. Res., 69, 6, 1139-1143. Huyard, A., Ferran, B., Audic, J.M. (2000) The two phase anaerobic digestion process: sludge stabilization and pathogens reduction. Water Sci. Technol.,42, 9, 41-47. Kim, M., Ahn, Y.H., Speece, R.E. (2002) Comparative process stability and efficiency of anaerobic digestion; mesophilic vs. thermophilic. Water Res. 36, 4369-4385. Massey, W.L., Pohland, F.G. (1978) Phase separation of of anaerobic stabilization by kinetic controls. J. Water Pollut. Control Fed., 50, 2204.
10
Metcalf and Eddy Inc. (2003) Wastewater engineering: Treatment and reuse. 4th Edition. McGraw-Hill, New York, NY. Moen, G.H., Stensel, D., Lepisto, R., Ferguson, J.F. (2003). Effects of solids retention time on the performance of thermophilic and mesophilic digestion of combined municipal wastewater sludges. Water Env. Res. 75, 6, 539-548. Noone, G.P. (1990) The treatment of domestic wastes. In: Wheatley, A., (Ed.), Anaerobic Digestion: A Waste Treatment Technology. Elsevier Applied Science Publishers, London, pp. 139-170. Novaes R. F. V. (1986) Microbiology of anaerobic digestion. Water Sci. Technol. 18, 1–14. Oles, J., Dichtl, N., Niehoff, H.H. (1997) Full scale experience of two stage thermophilic/mesophilic sludge digestestion. Water Sci. Technol. 36, 6/7, 449-456. Parkin, G. F., Owen, W.F. (1986) Fundamentals of anaerobic digestion of wastewater sludges. J. Environ. Eng., 112, 867-920. Pohland, F.G., Ghosh, S. (1971) Developments in anaerobic stagilization of organic wastes—the two-phase concept. Env. Letters, 1, 4, 255-266. Rudolfs, W., Heukelekian, H. (1930) Thermophilic digestion of sewage solids. Preliminary paper. Ind. Eng. Chem. 22, 96. Schmit, K.H, Ellis, T.G. (2001) Comparison of temperature-phased and two-phase anaerobic co-digestion of primary sludge and municipal solid waste. Water Environ. Res., 73, 3, 314-321. Speece, R.E. (1996) Anaerobic biotechnology for industrial wastewaters. Nashville, TN: Archae Press. Sung, S., Liu, T. (2003) Ammonia inhibition on thermophilic anaerobic digestion. Chemosphere, 53, 43-52. U.S. Environmental Protection Agency (1993) Standards for the disposal of sewage sludge. Fed. Regist., 58, 32, 40 CFR Part 503. Vandenburgh, S.R., Ellis, T.G. (2002) Effects of varying solids concentration and organic loading on the performance of temperature phased anaerobic digestion process. Water Env. Res. 74, 2, 142-148. WEF (1987) Anaerobic Digestion, Manual of Practice No. 16, 2nd Edition. Water Environment Federation, Alexandria, VA.
11
Wilson, T.E., Dichtl, N.A. (2000) Two-phase anaerobic digestion: An update on the AG process. Proceedings of WEFTEC 2000. Water Environment Federation, Alexandria, VA.
12
Manuscript 1
Comparing Acid/Gas-Phased to Temperature-Phased and Conventional Mesophilic Digestion
David C. Inman, Jared A. Webb, John T. Novak
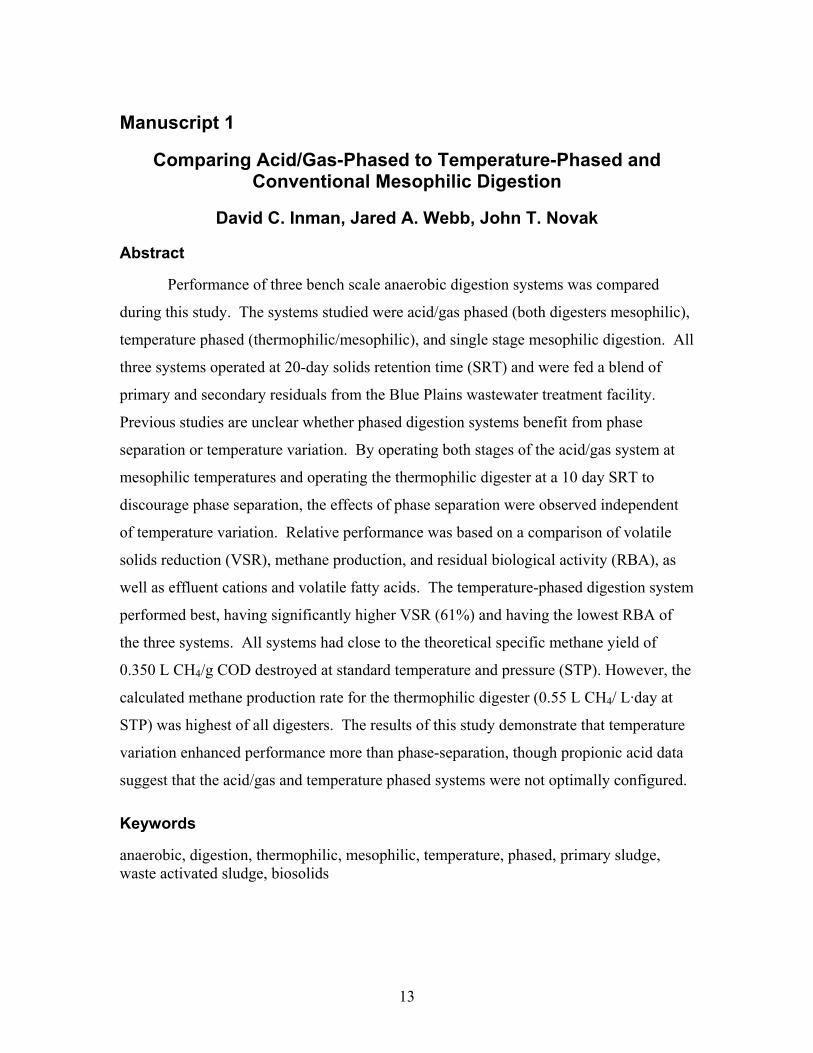
Abstract
Performance of three bench scale anaerobic digestion systems was compared
during this study. The systems studied were acid/gas phased (both digesters mesophilic),
temperature phased (thermophilic/mesophilic), and single stage mesophilic digestion. All
three systems operated at 20-day solids retention time (SRT) and were fed a blend of
primary and secondary residuals from the Blue Plains wastewater treatment facility.
Previous studies are unclear whether phased digestion systems benefit from phase
separation or temperature variation. By operating both stages of the acid/gas system at
mesophilic temperatures and operating the thermophilic digester at a 10 day SRT to
discourage phase separation, the effects of phase separation were observed independent
of temperature variation. Relative performance was based on a comparison of volatile
solids reduction (VSR), methane production, and residual biological activity (RBA), as
well as effluent cations and volatile fatty acids. The temperature-phased digestion system
performed best, having significantly higher VSR (61%) and having the lowest RBA of
the three systems. All systems had close to the theoretical specific methane yield of
0.350 L CH4/g COD destroyed at standard temperature and pressure (STP). However, the
calculated methane production rate for the thermophilic digester (0.55 L CH4/ L·day at
STP) was highest of all digesters. The results of this study demonstrate that temperature
variation enhanced performance more than phase-separation, though propionic acid data
suggest that the acid/gas and temperature phased systems were not optimally configured.
Keywords
anaerobic, digestion, thermophilic, mesophilic, temperature, phased, primary sludge, waste activated sludge, biosolids
13
Introduction
Anaerobic digestion is a common method used to stabilize municipal wastewater
treatment residuals and phased anaerobic digestion is a recent technology for digestion
facilities. Metcalf and Eddy (2003) list four digestion phasing configurations: staged
mesophilic digestion, temperature-phased digestion, acid/gas phased digestion, and
staged thermophilic digestion. Often the words “phasing” and “staging” are used
interchangeably in the literature regarding multiple reactor digestion systems. For clarity,
phased anaerobic digestion is defined as a digestion system having two or more tanks,
each with exclusive operating conditions that support unique biomass populations.
Unique biomass populations may be acid-forming, methane-forming, thermophilic, or
mesophilic organism populations. Operational parameters manipulated in these systems
include solids retention time (SRT) and temperature.
Acid/Gas Phased Digestion
Drawing on the growing knowledge of anaerobic microorganism metabolisms,
Pohland and Ghosh (1971) first proposed acid/gas phased digestion. In acid/gas phased
digestion, operators vary the SRT to kinetically select for either acid-forming or methane-
forming microorganisms. Methane- forming microorganisms, having a slow growth rate,
are washed out of a digester if the SRT is low enough. The low SRT and high organic
loading causes an accumulation of organic acid intermediates in the first digester. The
digester pH drops, creating conditions favorable for the growth of acid-formers, who
have an optimum growth rate at around pH 6 (Dichtl, 1997). Accordingly, the first
digester in acid/gas-phased systems is operated at a low SRT (12 hours-1.5 days) to
promote the growth of acid-forming micro-organisms, while the following digester has a
high SRT (≥18 days) to allow for the establishment of a methane forming biomass.
Studies suggest improved performance of acid/gas phased digestion versus single stage
digestion (Ghosh, 1985) as measured by volatile solids reduction. Furthermore, several
full-scale installations are in operation in the United States with proven success (Wilson
and Dichtl, 2000).
14
Temperature Phased Digestion
In temperature-phased digestion, the temperature is varied between digesters to
select for mesophilic or thermophilic microorganisms. Digesters are usually operated
from 30-38° C for mesophilic conditions and 50-60°C for thermophilic. Thermophilic
digestion is of interest to regulators and the wastewater industry due to its pathogen
reducing potential. In addition to the pathogen reducing potential of thermophilic
digestion, other reported benefits include increased volatile solids VSR and improved
dewatering (Parkin and Owen, 1986). Thermophilic digestion is thought to enhance
digestion due to increased biochemical reaction rates of thermophilic microorganisms
(Buhr and Andrews, 1977). Faster biochemical reactions allow for smaller tank volumes
for thermophilic digesters, thereby decreasing the footprint for construction (Dichtl,
1997). However, thermophilic digestion has a reputation for instability caused by
fluctuations in the pH and odor problems caused by high levels of volatile fatty acids
(VFA) in the effluent (WEF, 1987).
Temperature-phased digestion takes advantage of the aforementioned benefits of
thermophilic digestion, while utilizing a second mesophilic digester to increase the
stability of the thermophilic digester and decrease the odor potential of thermophilically
digested biosolids (Han and Dague, 1997). The temperature-phased anaerobic digestion
process, or TPAD, received a U.S. patent in 1996 (Dague et al., 1996). This process is
very similar to the European equivalent anaerobic stabilization thermophilic/mesophilic
(ASTM) process (Oles et al., 1997). Though the TPAD patent application included a
broad range of operational temperatures and digester configurations, a typical TPAD
configuration is a thermophilic digester operated at 55°C with an SRT of 3-5 days,
followed by a mesophilic digester operated at 35°C operated at 10 or more days (Metcalf
and Eddy, 2003).
It seems that for TPAD systems utilizing a first-stage thermophilic digester, the
phasing operation that Pohland and Ghosh proposed is not optimized because it is
difficult to achieve complete phase-separation at thermophilic temperatures. Research
has shown that thermophilic digesters do not achieve optimal pH conditions to solely
support acid-formers at SRT’s less than 3 days. Accordingly, they are operated at
15
retention periods between 3 and 5 days to achieve a balance between the acid-formers
and methane-formers (Dichtl, 1997).
Objectives
When comparing temperature-phased and acid-gas phased digestion, it is unclear
whether the improved performance of these phased digestion systems is due to phase
separation or to temperature variation. This study compares the performance of
temperature phased thermophilic/mesophilic digestion (TPTM), acid/gas-phased
mesophilic/mesophilic (AGMM) digestion, and single stage mesophilic digestion (SSM).
The SSM digester is used as a control for comparison. The SRT of the 1st stage
thermophilic digester in the temperature-phased system is sufficiently long to prevent
acid-phase development. In this manner, a comparison can be made between the effects
of varying temperature without the influence of phase development. It was part of a
larger study to aid designers of the Blue Plains anaerobic digestion facility, scheduled for
completion in 2008.
Methods and materials
The digesters selected for this study all had a total system SRT of 20 days. The
SRT and temperature regime was selected to operate the multiple digester systems as an
acid-gas phased system and a temperature-phased system (Table 1). The SRT of the
digesters was maintained by operating at a constant volume through a mass balance
approach, with feed volume equal to waste volume (Figure 1). The digesters were in a
controlled temperature room set at 36.5 °C, keeping the digester temperature at 35±1 °C.
Thermophilic temperatures were achieved by circulating 65 °C water in flexible vinyl
tubing that encircled the thermophilic digesters. This kept the thermophilic temperature
at 55±1 °C.
Vessels used for digestion were conical shaped tanks commonly used for home
beer making. Two models were used: A 6.5 gallon stainless steel Fermenator™
manufactured by Blinchmann Engineering was used for the 1st stage thermophilic, 2nd
stage mesophilic, and single stage mesophilic reactors. A 6.5 gallon plastic Affordable
Conical Fermenter manufactured by Hobby Beverage Equipment Company was used for
16
the gas phase digester. Both of these models were available from Grape and Granary in
Akron, OH. Silicone was used to seal the lids on these digesters and a large rubber
stopper was substituted for the standard lid of the Affordable Conical Fermenter. Due to
the short SRT and small operating volume of the acid phase digester, a six-liter low –
profile spinner flask (Bellco Glass Inc., Vineland, NJ) was used instead of the larger
volume conical vessels.
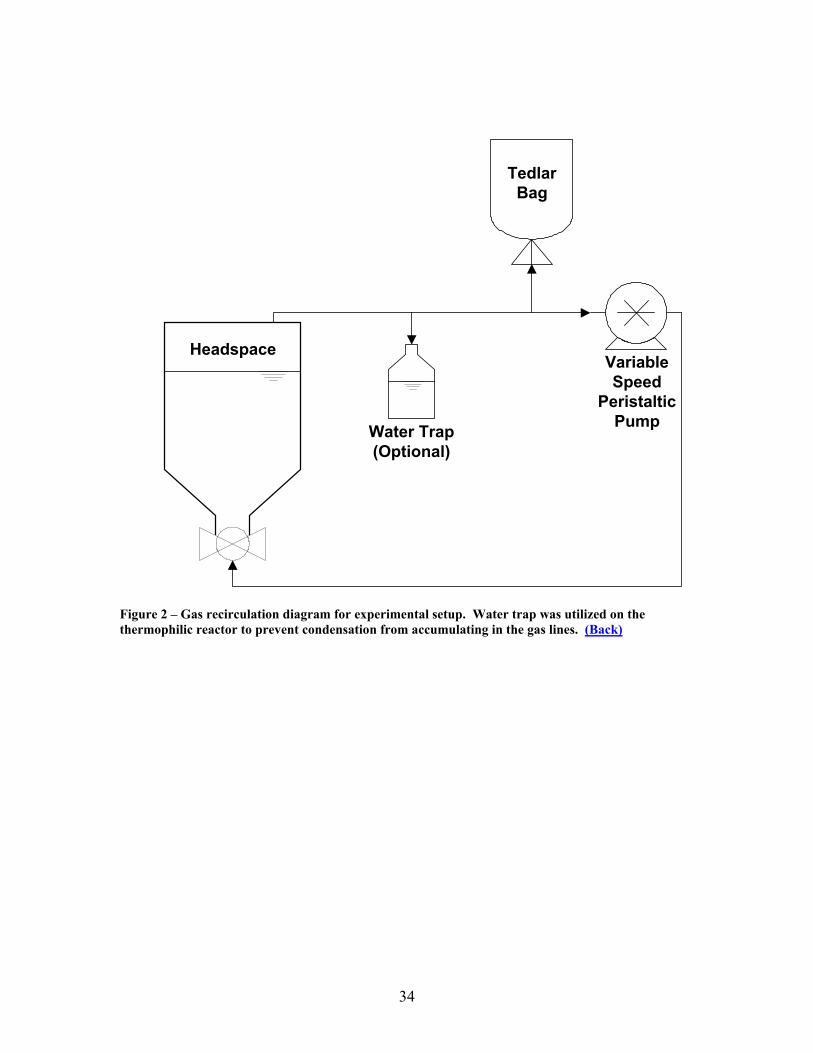
Mixing was achieved by circulating gas from the headspace of each digester and
injecting it into a valve at the bottom of the digester (Figure 2). . The relatively deep
cylindrical shape, combined with steeply sloped conical bottom of the digesters was
thought to enhance mixing efficiency in a similar manner to egg-shaped digesters. In the
case of the acid digester, gas was injected into a manifold that distributed the gas across
the bottom of the vessel. The degree of mixing could be increased or decreased using 6-
600 RPM variable speed peristaltic pumps that circulated the gas (Cole-Parmer, Vernon
Hills, Illinois). Normally, the pumps were set at 40% of their maximum speed. This
corresponds to approximately 0.7 L/minute with the Cole-Parmer “L/S-18” tubing used
on the pump heads. At least five minutes before wasting and feeding, the gas flow rate
was increased to 1.4 L/minute to ensure that waste samples were representative of the
digester contents. The flow rate was maintained at 1.4 L/minute for about 10 minutes
after feeding to disperse the feed.
Gas from each digester accumulated in Tedlar bags (Fisher Scientific, Hampton,
NH) attached to the digester’s collection/recirculation system (Figure 2). The gas flow
rate was calculated by measuring the volume of gas in the bags and dividing by the time
between measurements. Large volume Tedlar bags were used to prevent the systems
from becoming pressurized. Gas composition samples were obtained by transferring one
liter of gas from the large bags to smaller bags that had syringe-sampling ports. The
thermophilic digester required a water trap to capture about 50 milliliters per day of
moisture that condensed in the gas lines and it was put back into the digester every other
day.
The digesters were started using thickened waste activated sludge from the
Blacksburg-VPI Sanitation Authority, Lower Stroubles Creek WWTP. Previous studies
17
showed favorable results of starting thermophilic and mesophilic digesters with waste
activated sludge (Kim and Speece, 2002). Waste activated sludge equal to one half of the
operating volume of each digester sat un-mixed in the digesters for about 10 days, and
then feed was added in 0.5 liter increments each day until the final operating volume was
achieved. Upon reaching operating volume, daily wasting and feeding operations
commenced.
The feed was a blend of thickened primary and waste activated sludge from Blue
Plains. The sludges were composited at Blue Plains over several days and shipped
overnight to the laboratory twice per week. Upon arrival, they were mixed (1:1 volume
ratio) and stored in a bulk tank in a walk-in cooler set at 4°C. Screening of both sludges
to remove large particles occurred at the time of collection and additional screening
occurred prior to feeding. The screen was a semi-spherical kitchen colander, with
approximately 3-millimeter diameter holes distributed at about 2 per square centimeter.
Total solids concentration of the feed was diluted to 3% at startup and was increased to ≥
4% at 39 days into the experiment. Tap water was used to dilute the sludge, when
necessary, to achieve the desired total solids concentration. Daily batch feeding and
wasting was initially conducted until day 62 (3 SRTs) at which point a timer and pump
system that cycled five times per day was used for semi-continuous feeding. Clogging in
the feed line made it necessary to begin daily batch feeding and wasting at day 106 (~5
SRTs). At day 118 the total solids of the primary sludge from Blue Plains decreased to
approximately 2.5% to 3%. Prior to this, the total solids of primary and waste activated
sludge total solids was similar at around 5% to 6%. Therefore, from day 118 to the end
of the study there was a higher mass proportion of waste activated sludge to primary
sludge in the feed.
The following tests were used to compare the performance of the digesters:
• Total and volatile solids
• Gas production and composition
• COD
• pH
• Alkalinity
18
• Effluent volatile fatty acids (acetic, propionic, butyric)
• Soluble cations (Na+, NH4+, K+, Mg++, Ca++)
Additional tests during the study included residual biological activity tests which were
conducted once at the end of the study.
COD, pH, alkalinity, and solids testing were conducted according to Standard
Methods (APHA, 1999).
Gas samples were analyzed with a Shimadzu model GC-14A gas chromatograph
(Shimadzu Scientific Instruments, Columbia, MD) using the thermal conductivity
detector (TCD). The column used was made from a 4 meter length of copper tubing with
a 0.25 inch inner diameter. The column was coiled to fit in the GC-14A oven and packed
with Haysep Q media (Supelco, Bellefonte, PA). Helium was the carrier gas, with
column flow set at 17 mL/min.
In order to prepare samples for cation and effluent volatile fatty acid (VFA)
analyses, a 500 mL sample of digester biosolids was centrifuged at 13,500 x g for 25
minutes. 50 mL of the supernatant was frozen for storage until the analyses were
performed. Samples were usually frozen for no more than 7 days. At the time of
analysis, the sample was thawed, centrifuged at 6,000 x g for 15 minutes, and then
filtered through a 0.45 micron syringe filter. From this filtered sample, dilutions were
made for cation testing and VFA testing.
Diluted VFA samples were acidified in their individual GC vial by adding
concentrated phosphoric acid at a ratio of 1:10. The VFA samples were analyzed on a
Hewlett Packard Model 5890 gas chromatograph using a flame ionization detector. A
Nukol capillary column (Supelco) was used and samples were injected in splitless mode.
The column flow gas was helium with a flow rate of 17 mL/min. Flow rates for the other
gases used were as follows: Nitrogen – 13 mL/min, Hydrogen – 45 mL/min, Air – 450
mL/min.
Diluted cation samples were analyzed on a Dionex D-120 ion chromatograph
utilizing a CS-12 column and conductivity detection with self-generating suppression of
the eluent (Dionex Corp., Sunnyvale, CA). 20mM methanesulfonic acid was used for
eluent at a flow rate of 1 mL/min.
19
The residual biological activity test (RBA) was a simplified modification of the
additional digestion test method outlined by EPA (1993). It was conducted by incubating
100mL digester samples in serum vials at 36.5°C for at least 20 days. During the
incubation period, the vials were periodically degassed and weighed. The weight lost
from each vial was assumed to be from gasification of the VS in each sample. RBA was
calculated by dividing the weight lost from each sample at the end of incubation by the
weight of its VS content (analyzed prior to incubation) and is reported as percent VS lost.
Statistical analyses were conducted with SigmaStat 3.10 (SPSS Software Inc.,
Chicago, IL).
Results and Discussion
Operational notes: The digesters achieved stable operation within 3 SRTs.
Stable operation was defined by steady pH, gas production, and volatile solids reduction
(VSR). All the digesters, except for the acid digester, were within optimal pH and
alkalinity ranges for normal anaerobic digestion (Parkin and Owen, 1986)(Table 2). The
average pH in the acid phase digester was slightly higher than the optimal pH 6 for acid
phase digestion and approximately 36% of the samples collected were between pH 5.45
and 6. While no foaming was observed in the other digesters, the acid digester
experienced several episodes of foaming during the experiment.
Volatile solids reduction: The average VSR in the TPTM was 61% and differed
significantly from the other two digesters. The AGMM and SSM reactors were not
significantly different from each other at 54% and 52% VSR respectively (ANOVA on
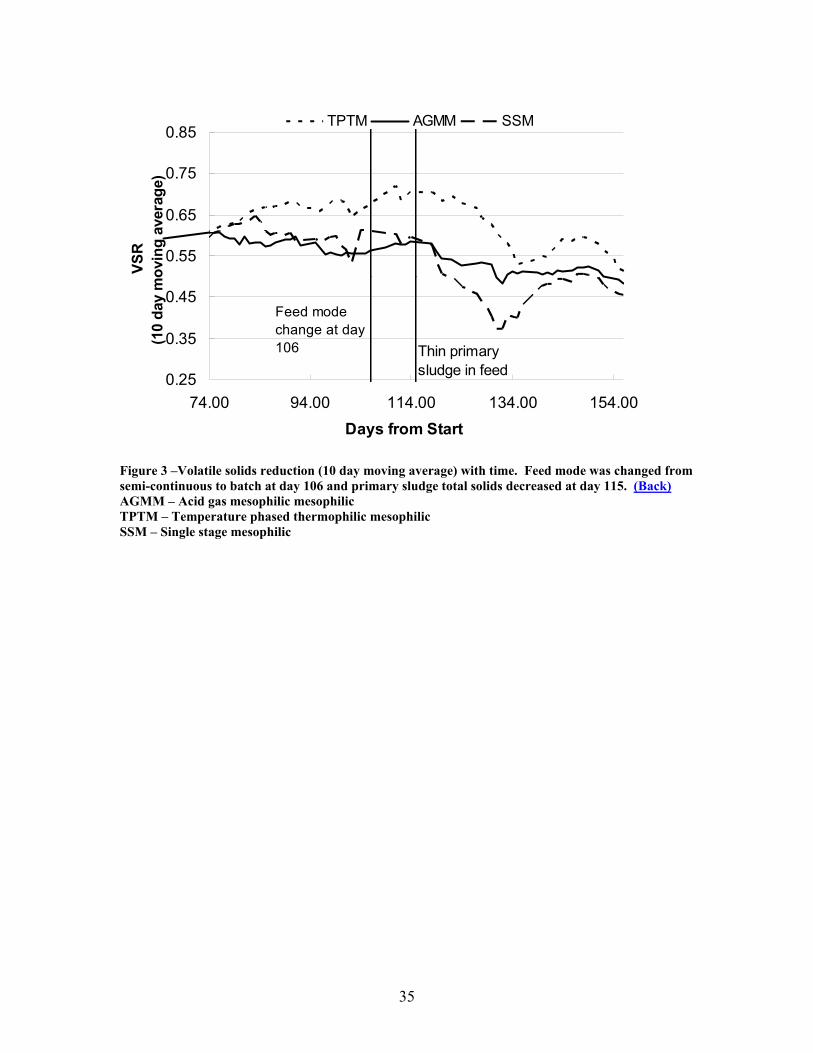
ranks: Dunn’s Method, 95% confidence interval) (Table 3). The average VSR versus
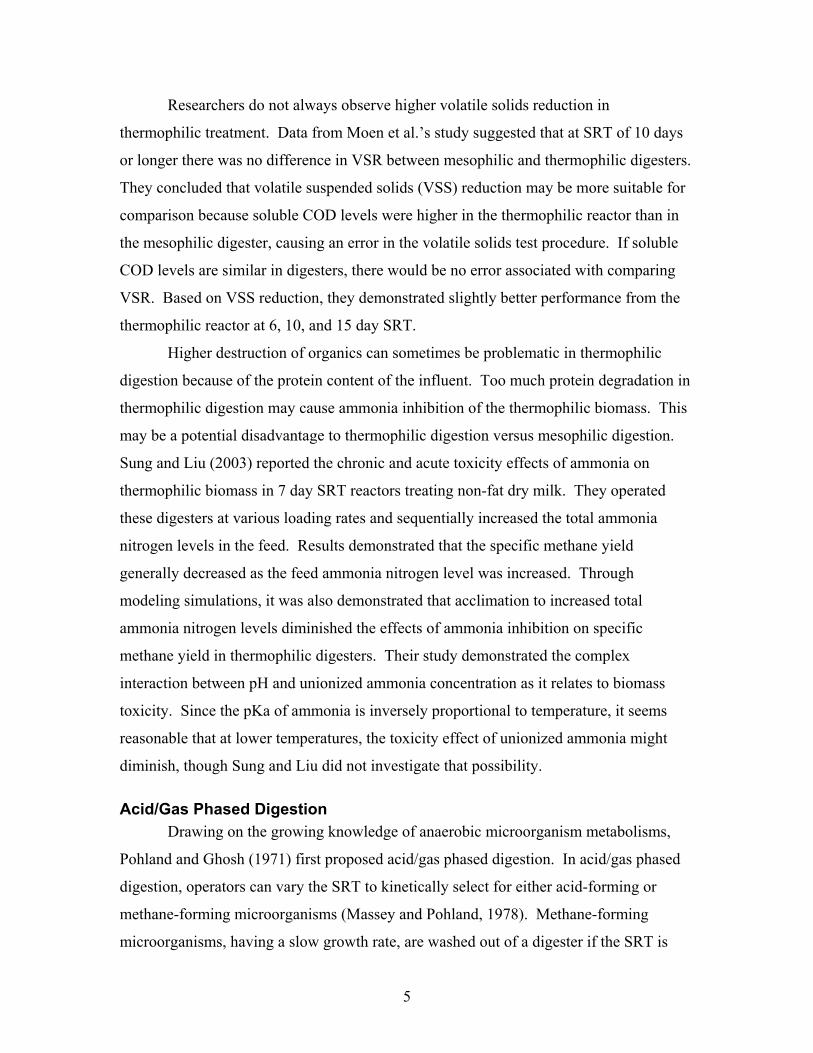
time shows that the TPTM system VSR was consistently higher than the other digesters
during the study (Figure 3). Though not an objective of the study, it was also observed
that the VSR was similar after switching from semi-continuous to batch feed mode
(Figure 3). However, it is difficult to make a conclusion from this observation because at
day 115 the total solids content of the primary sludge began to decrease. Since the feed
was composed of primary and waste activated sludge mixed at equal volumes, the lower
total solids content of the primary sludge means that the mass proportion of primary to
waste activated sludge decreased. It seems that the decrease in VSR observed in Figure 3
20
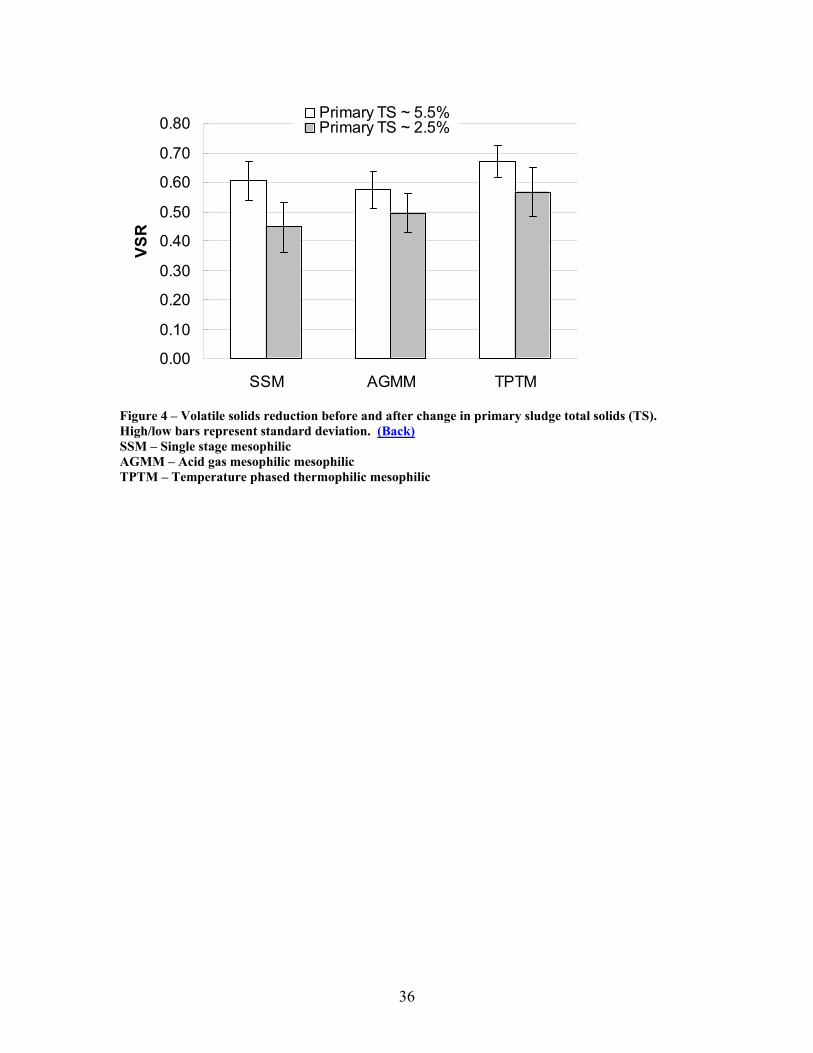
may be due to the thinned primary sludge instead of the change in feed mode. While the
VSR decreased for all reactors after a change to the primary sludge total solids (Figure 4),
the SSM digester seemed to be effected the most at around a 26% decrease.
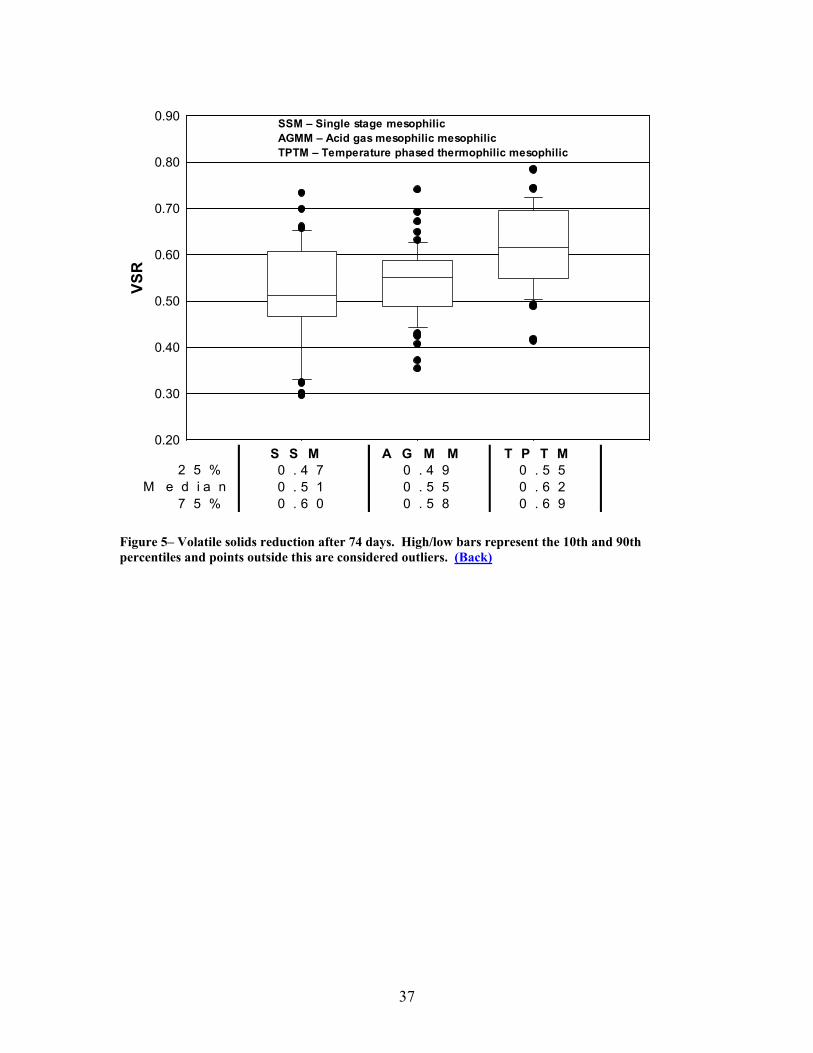
Variability in the data over time makes it is useful to compare several ranges of
data (Figure 5). The 10th, 25th, median, 75th, and 90th percentiles are labeled on Figure 5
as reference. From these data, it can be seen that the 75th percentile of VSR for the
AGMM and SSM systems was lower than the median for the TPTM system. This
reflects the better VSR efficiency of the TPTM system over the time of observation,
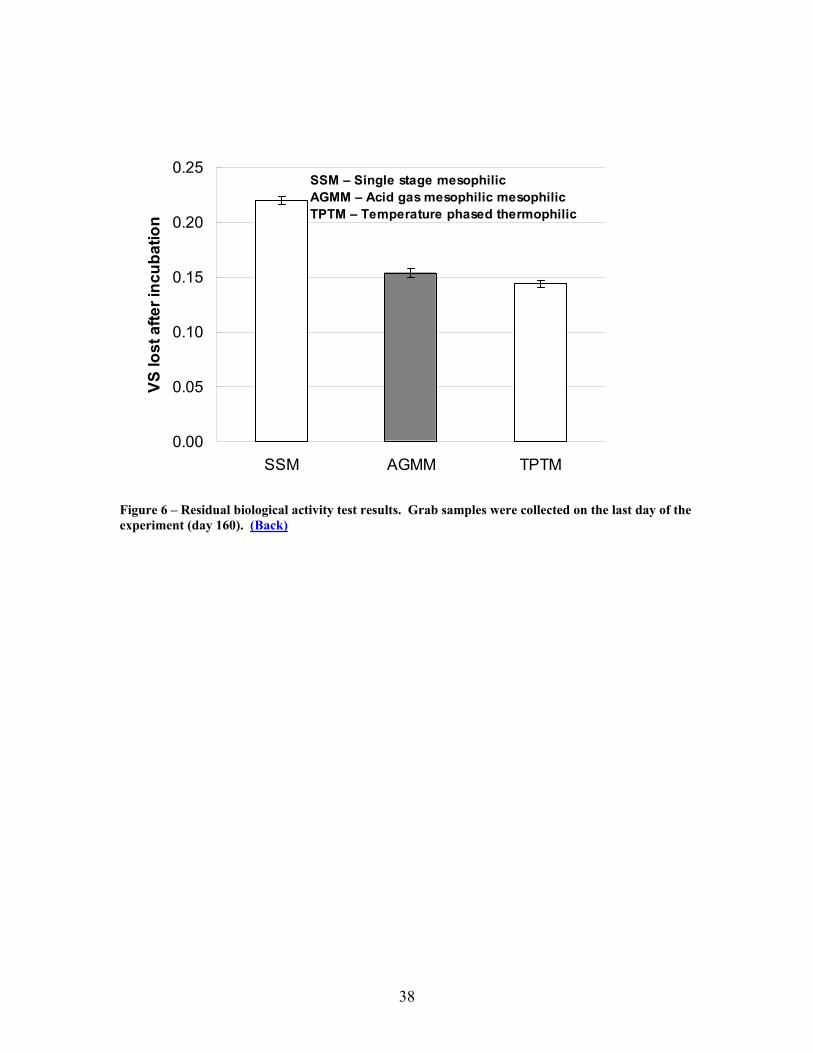
regardless of the feed mode. The residual biological activity test for each digestion
system supported the higher VSR observed in the TPTM system (Figure 6) in that the
TPTM system had the lowest RBA at 14. Similarly, the AGMM system had an RBA of
15% and the SSM had an RBA of 22%. A similar RBA for the AGMM and TPTM
system was probably observed because the RBA was a batch test conducted on a single
grab sample at the conclusion of the study.
Approximately 46% VSR occurred in the 1st thermophilic stage of the TPTM
system, while 28% VSR occurred in the acid digester. The VSR was expected to be
lower in the acid phase digester than in the thermophilic digester since the SRT of the
thermophilic digester was 8 days longer. However, the better VSR from the TPTM
system suggests that temperature differences played a more important role in VSR than
phase separation. If hydrolysis was rate limiting for this feed then it might be that the
thermophilic temperature enhanced hydrolysis better than phase separation and increased
the VSR. On the other hand, complete phase separation was not always achieved in the
acid digester as suggested by periods of pH higher than 6.0 and some methane was found
in the biogas of the acid phase digester. An acid phase digester operated at an SRT of 1
to 1.5 days would be desirable for better comparison between AGMM and TPTM
systems.
Gas production and composition: The 1st stage thermophilic digester of the
TPTM system had significantly higher daily biogas production (18.9 L/day at STP) than
the other digester at (Table 4)(ANOVA on ranks: Dunn’s method, 95% confidence
interval). However, the methane biogas content was highest in the gas phase digester of
21
the AGMM system at 72%, though the statistical difference was not evaluated (Table 4).
The acid phase digester had an average of 30% methane in its biogas and was highly
variable with a standard deviation of 15%. It was observed that the mixing in the acid
phase digester was not always effective. Multiple factors, including high loading rates
due to low SRT, foaming, clogging of the gas distribution manifold, and digester shape
contributed to the mixing problem.
The 2nd stage mesophilic digester of the TPTM system had low daily biogas
production at around 0.3 L/day, as compared to the biogas production in the other
digesters that ranged from 5 to 19 L/day. Two explanations are likely: An undetected
gas leak may have lowered observed daily production or non-optimal conditions existed
in the digester.
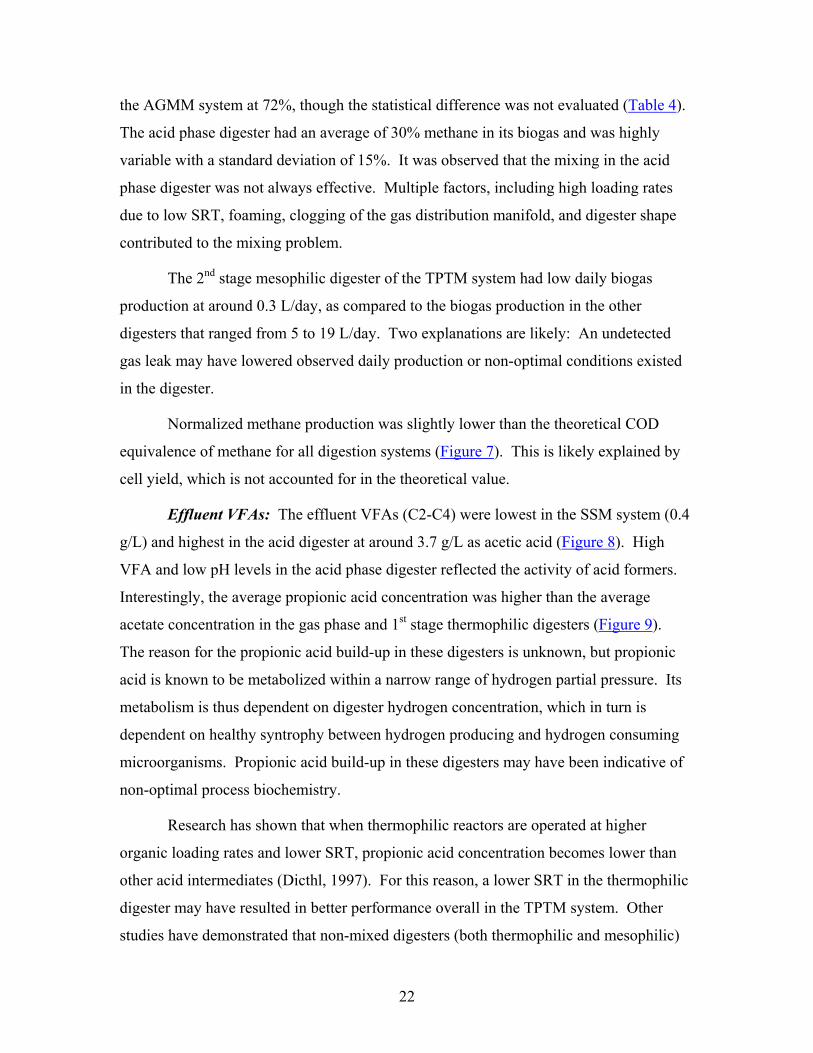
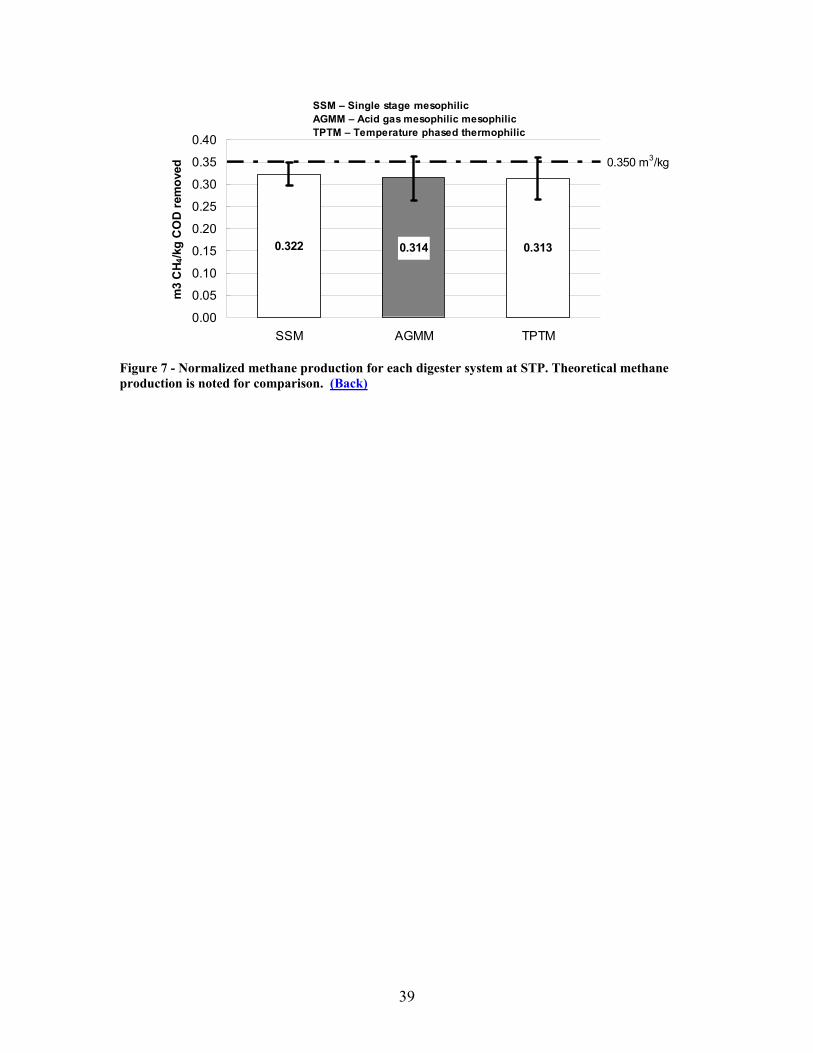
Normalized methane production was slightly lower than the theoretical COD
equivalence of methane for all digestion systems (Figure 7). This is likely explained by
cell yield, which is not accounted for in the theoretical value.
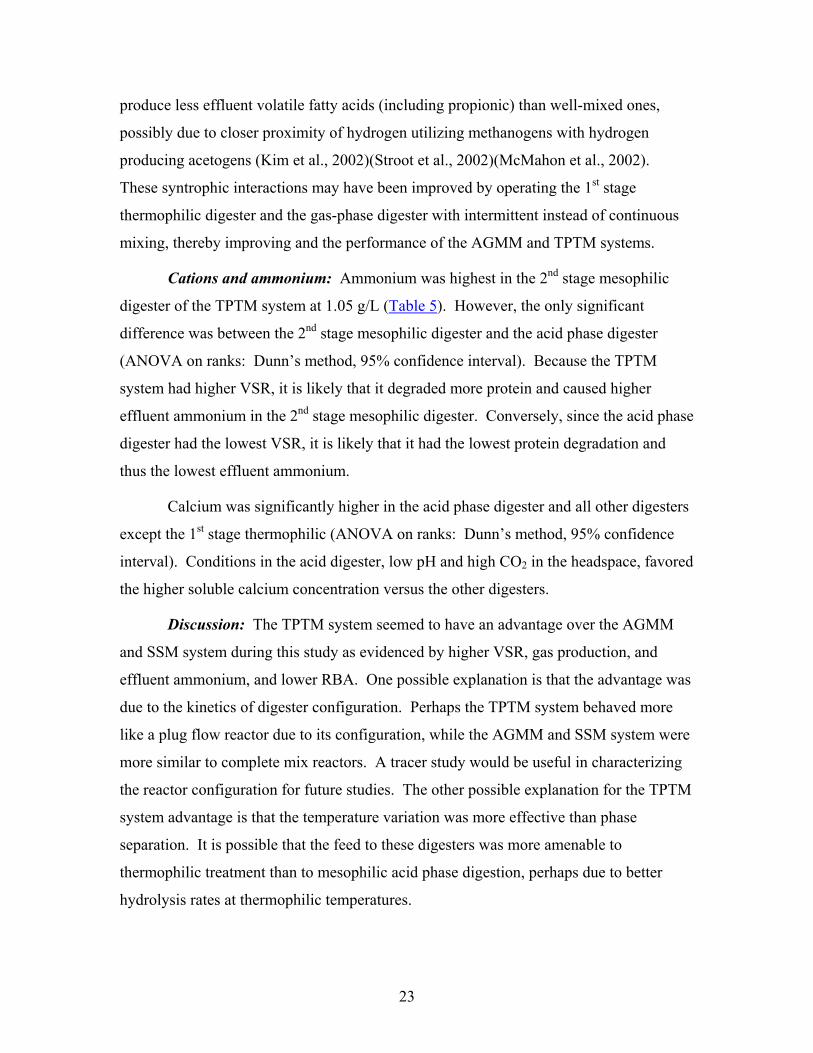
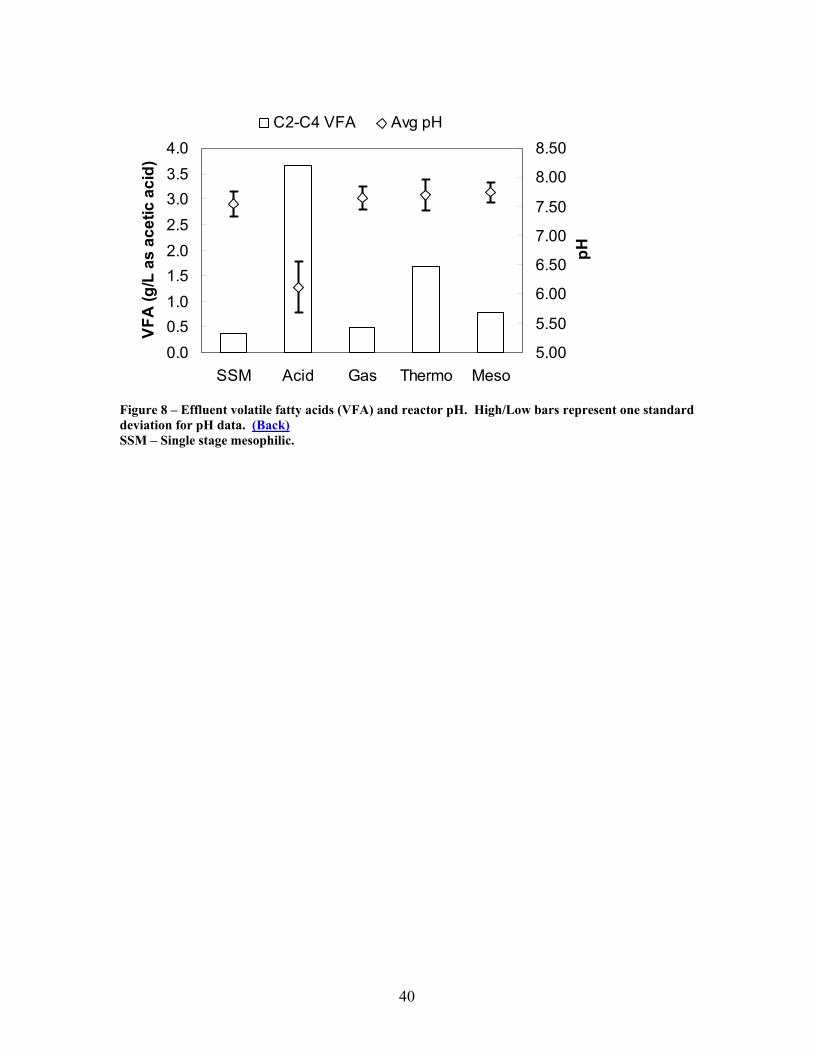
Effluent VFAs: The effluent VFAs (C2-C4) were lowest in the SSM system (0.4
g/L) and highest in the acid digester at around 3.7 g/L as acetic acid (Figure 8). High
VFA and low pH levels in the acid phase digester reflected the activity of acid formers.
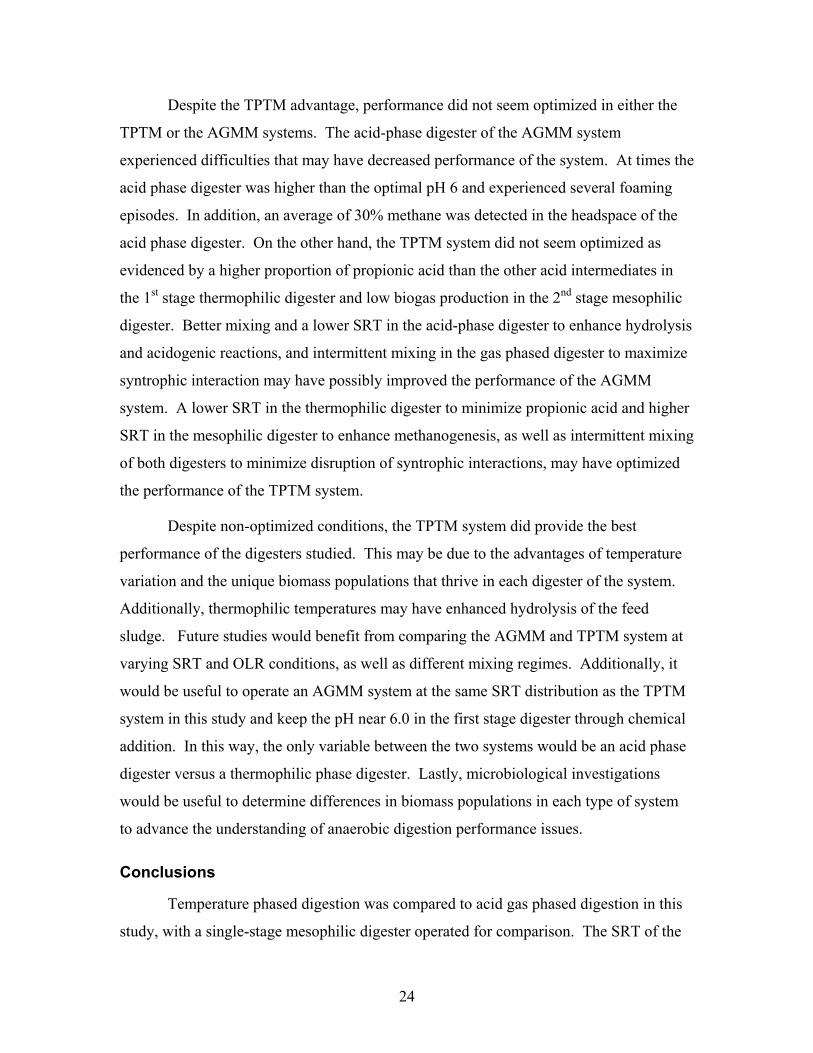
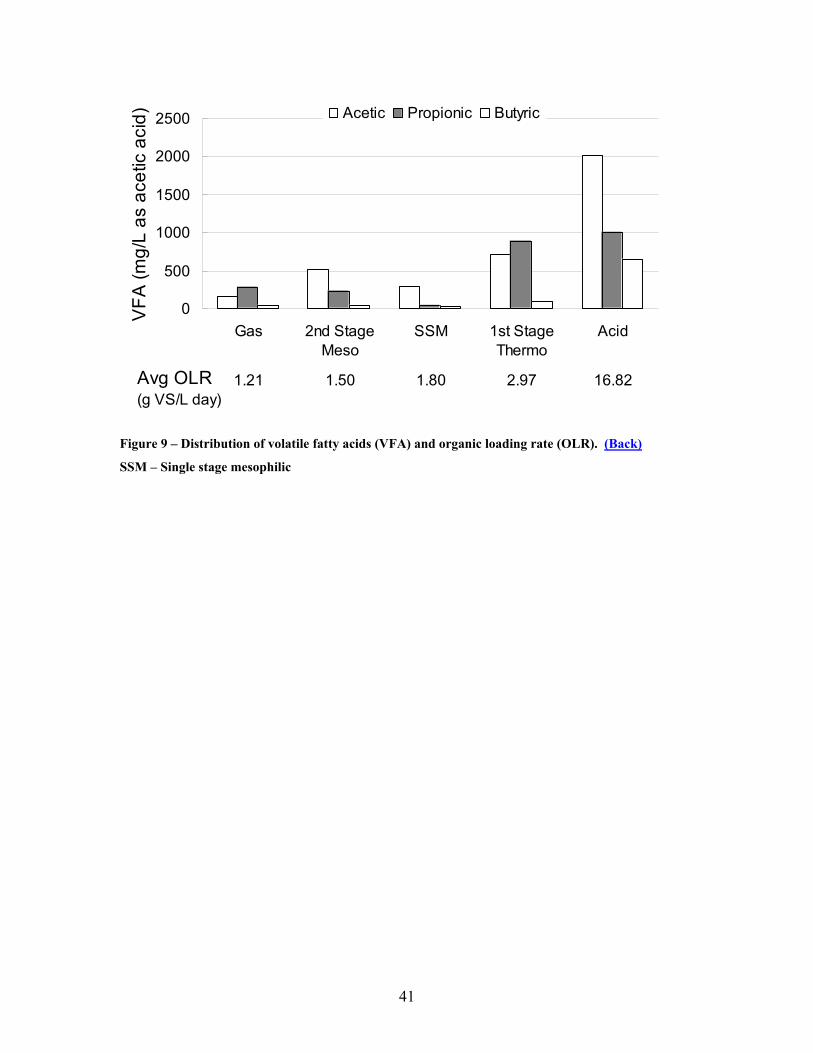
Interestingly, the average propionic acid concentration was higher than the average
acetate concentration in the gas phase and 1st stage thermophilic digesters (Figure 9).
The reason for the propionic acid build-up in these digesters is unknown, but propionic
acid is known to be metabolized within a narrow range of hydrogen partial pressure. Its
metabolism is thus dependent on digester hydrogen concentration, which in turn is
dependent on healthy syntrophy between hydrogen producing and hydrogen consuming
microorganisms. Propionic acid build-up in these digesters may have been indicative of
non-optimal process biochemistry.
Research has shown that when thermophilic reactors are operated at higher
organic loading rates and lower SRT, propionic acid concentration becomes lower than
other acid intermediates (Dicthl, 1997). For this reason, a lower SRT in the thermophilic
digester may have resulted in better performance overall in the TPTM system. Other
studies have demonstrated that non-mixed digesters (both thermophilic and mesophilic)
22
produce less effluent volatile fatty acids (including propionic) than well-mixed ones,
possibly due to closer proximity of hydrogen utilizing methanogens with hydrogen
producing acetogens (Kim et al., 2002)(Stroot et al., 2002)(McMahon et al., 2002).
These syntrophic interactions may have been improved by operating the 1st stage
thermophilic digester and the gas-phase digester with intermittent instead of continuous
mixing, thereby improving and the performance of the AGMM and TPTM systems.
Cations and ammonium: Ammonium was highest in the 2nd stage mesophilic
digester of the TPTM system at 1.05 g/L (Table 5). However, the only significant
difference was between the 2nd stage mesophilic digester and the acid phase digester
(ANOVA on ranks: Dunn’s method, 95% confidence interval). Because the TPTM
system had higher VSR, it is likely that it degraded more protein and caused higher
effluent ammonium in the 2nd stage mesophilic digester. Conversely, since the acid phase
digester had the lowest VSR, it is likely that it had the lowest protein degradation and
thus the lowest effluent ammonium.
Calcium was significantly higher in the acid phase digester and all other digesters
except the 1st stage thermophilic (ANOVA on ranks: Dunn’s method, 95% confidence
interval). Conditions in the acid digester, low pH and high CO2 in the headspace, favored
the higher soluble calcium concentration versus the other digesters.
Discussion: The TPTM system seemed to have an advantage over the AGMM
and SSM system during this study as evidenced by higher VSR, gas production, and
effluent ammonium, and lower RBA. One possible explanation is that the advantage was
due to the kinetics of digester configuration. Perhaps the TPTM system behaved more
like a plug flow reactor due to its configuration, while the AGMM and SSM system were
more similar to complete mix reactors. A tracer study would be useful in characterizing
the reactor configuration for future studies. The other possible explanation for the TPTM
system advantage is that the temperature variation was more effective than phase
separation. It is possible that the feed to these digesters was more amenable to
thermophilic treatment than to mesophilic acid phase digestion, perhaps due to better
hydrolysis rates at thermophilic temperatures.
23
Despite the TPTM advantage, performance did not seem optimized in either the
TPTM or the AGMM systems. The acid-phase digester of the AGMM system
experienced difficulties that may have decreased performance of the system. At times the
acid phase digester was higher than the optimal pH 6 and experienced several foaming
episodes. In addition, an average of 30% methane was detected in the headspace of the
acid phase digester. On the other hand, the TPTM system did not seem optimized as
evidenced by a higher proportion of propionic acid than the other acid intermediates in
the 1st stage thermophilic digester and low biogas production in the 2nd stage mesophilic
digester. Better mixing and a lower SRT in the acid-phase digester to enhance hydrolysis
and acidogenic reactions, and intermittent mixing in the gas phased digester to maximize
syntrophic interaction may have possibly improved the performance of the AGMM
system. A lower SRT in the thermophilic digester to minimize propionic acid and higher
SRT in the mesophilic digester to enhance methanogenesis, as well as intermittent mixing
of both digesters to minimize disruption of syntrophic interactions, may have optimized
the performance of the TPTM system.
Despite non-optimized conditions, the TPTM system did provide the best
performance of the digesters studied. This may be due to the advantages of temperature
variation and the unique biomass populations that thrive in each digester of the system.
Additionally, thermophilic temperatures may have enhanced hydrolysis of the feed
sludge. Future studies would benefit from comparing the AGMM and TPTM system at
varying SRT and OLR conditions, as well as different mixing regimes. Additionally, it
would be useful to operate an AGMM system at the same SRT distribution as the TPTM
system in this study and keep the pH near 6.0 in the first stage digester through chemical
addition. In this way, the only variable between the two systems would be an acid phase
digester versus a thermophilic phase digester. Lastly, microbiological investigations
would be useful to determine differences in biomass populations in each type of system
to advance the understanding of anaerobic digestion performance issues.
Conclusions
Temperature phased digestion was compared to acid gas phased digestion in this
study, with a single-stage mesophilic digester operated for comparison. The SRT of the
24
temperature phased digestion system was set to prevent phase separation so that
temperature effects could be evaluated independently from phase separation. The TPTM
system performed best during this study as supported by the following observations:
• The TPTM system had the highest average volatile solids reduction of all the
systems studied at close to 61%. AGMM was second best at 54%, followed by
SSM at 52%.
• The 1st stage thermophilic digester of the TPTM system had the highest biogas
production at 18.9L/day (at STP).
• Total volatile fatty acid levels were highest in the acid phase digester, though
propionic acid levels were at times higher in the gas phase digester than in the
acid phase digester.
• Propionic acid was higher than acetic acid in both the gas-phase and 1st stage
thermophilic digester.
• Ammonium was highest in the 2nd stage mesophilic digester of the TPTM system,
suggesting higher protein degradation.
The results of this study indicate that temperature phased digestion may be a suitable
candidate for an anaerobic digestion process at the Blue Plains anaerobic digestion
facility. Continued studies for Blue Plains in this laboratory have focused on comparing
temperature phased digestion to single stage mesophilic digestion and optimizing SRT
for the temperature phased system.
25
References
Buhr, H.O., Andrews, J.F. (1977) The thermophilic anaerobic digestion process. Water Res., 11, 129-143. Dague, R.R., Kaiser, S.K., Harris, W.L. (1996) Temperature-phased anaerobic waste treatment process. U.S. Patent Office. Patent Number 5,525,228. Dichtl, N. (1997) Thermophilic and mesophilic (two-stage) anaerobic digestion. Water and Env. Mgmt: Journal of CIWEM. 11, 2, 98-104. Ghosh, S. (1985) Improved sludge gasification by two-phase anaerobic digestion. J. Environ. Eng., 113, 1265-1284. Han, Y., Dague, R.R. (1997) Laboratory studies on the temperature-phased anaerobic digestion of domestic primary sludge. Water Environ. Res., 69, 6, 1139-1143. Kim, M., Ahn, Y.H., Speece, R.E. (2002) Comparative process stability and efficiency of anaerobic digestion; mesophilic vs. thermophilic. Water Res. 36, 4369-4385. Kim, M., Speece, R.E. (2002) Aerobic waste activated sludge (WAS) for start-up seed of mesophilic and thermophilic anaerobic digestion. Water Res. 36, 3860-3866. McMahon K. D., Stroot P. G., Mackie R. I. and Raskin L. (2001) Anaerobic codigestion of municipal solid waste and biosolids under various mixing conditions—II. Microbial population dynamics. Water Res. 35, 1817–1827. Metcalf and Eddy Inc. (2003) Wastewater engineering: Treatment and reuse. 4th Edition. McGraw-Hill, New York, NY. Oles, J., Dichtl, N., Niehoff, H.H. (1997) Full scale experience of two stage thermophilic/mesophilic sludge digestestion. Water Sci. Technol. 36, 6/7, 449-456. Parkin, G. F., Owen, W.F. (1986) Fundamentals of anaerobic digestion of wastewater sludges. J. Environ. Eng., 112, 867-920. Pohland, F.G., Ghosh, S. (1971) Developments in anaerobic stagilization of organic wastes—the two-phase concept. Env. Letters, 1, 4, 255-266. Stroot P. G., McMahon K. D., Mackie R. I. and Raskin L. (2001) Anaerobic codigestion of municipal solid waste and biosolids under various mixing conditions - I. Digester performance. Water Res. 35, 1804–1816. WEF (1987) Anaerobic Digestion, Manual of Practice No. 16, 2nd Edition. Water Environment Federation, Alexandria, VA.
26
Wilson, T.E., Dichtl, N.A. (2000) Two-phase anaerobic digestion: An update on the AG process. Proceedings of WEFTEC 2000. Water Environment Federation, Alexandria, VA.
27
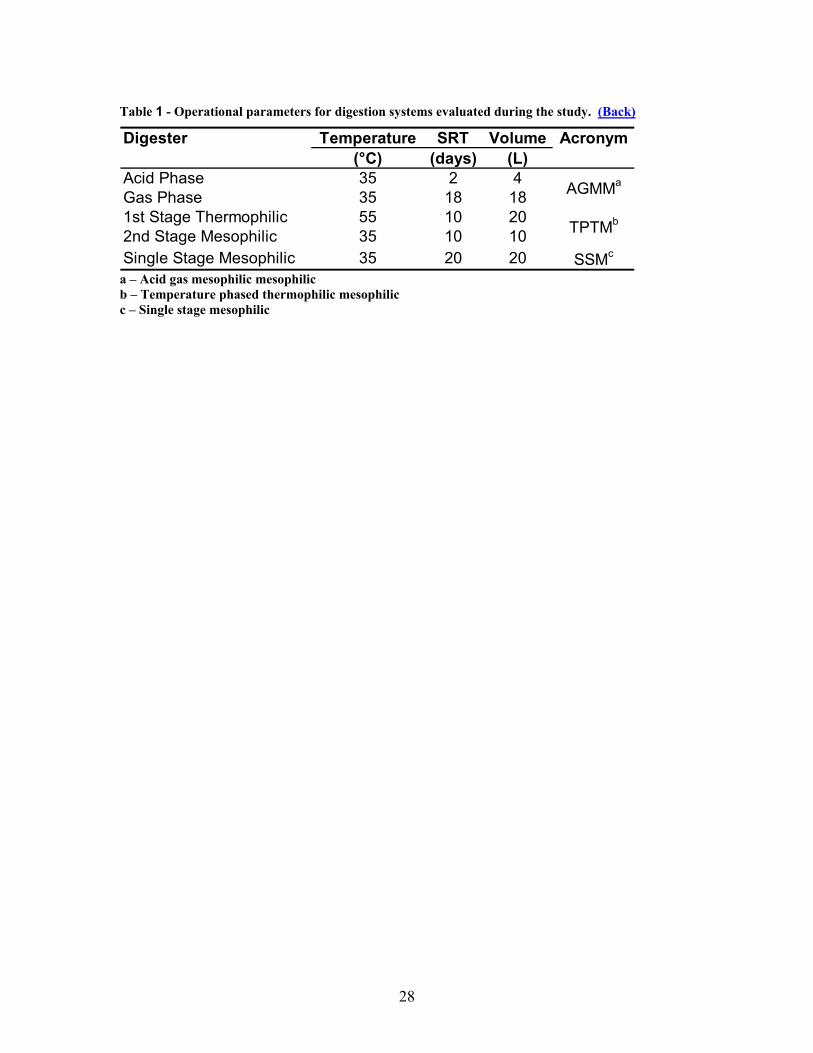
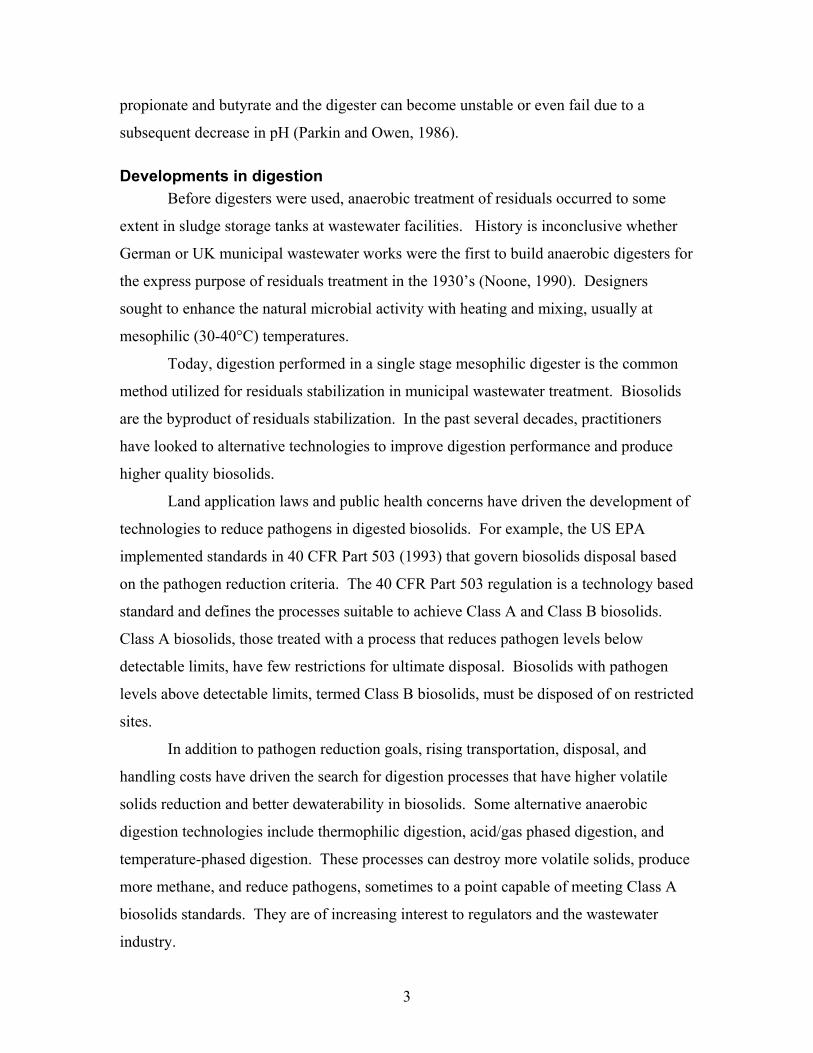
Table 1 - Operational parameters for digestion systems evaluated during the study. (Back)
Temperature SRT Volume(°C) (days) (L)
Acid Phase 35 2 4Gas Phase 35 18 181st Stage Thermophilic 55 10 202nd Stage Mesophilic 35 10 10Single Stage Mesophilic 35 20 20 SSMc
AGMMa
Digester Acronym
TPTMb
a – Acid gas mesophilic mesophilic b – Temperature phased thermophilic mesophilic c – Single stage mesophilic
28
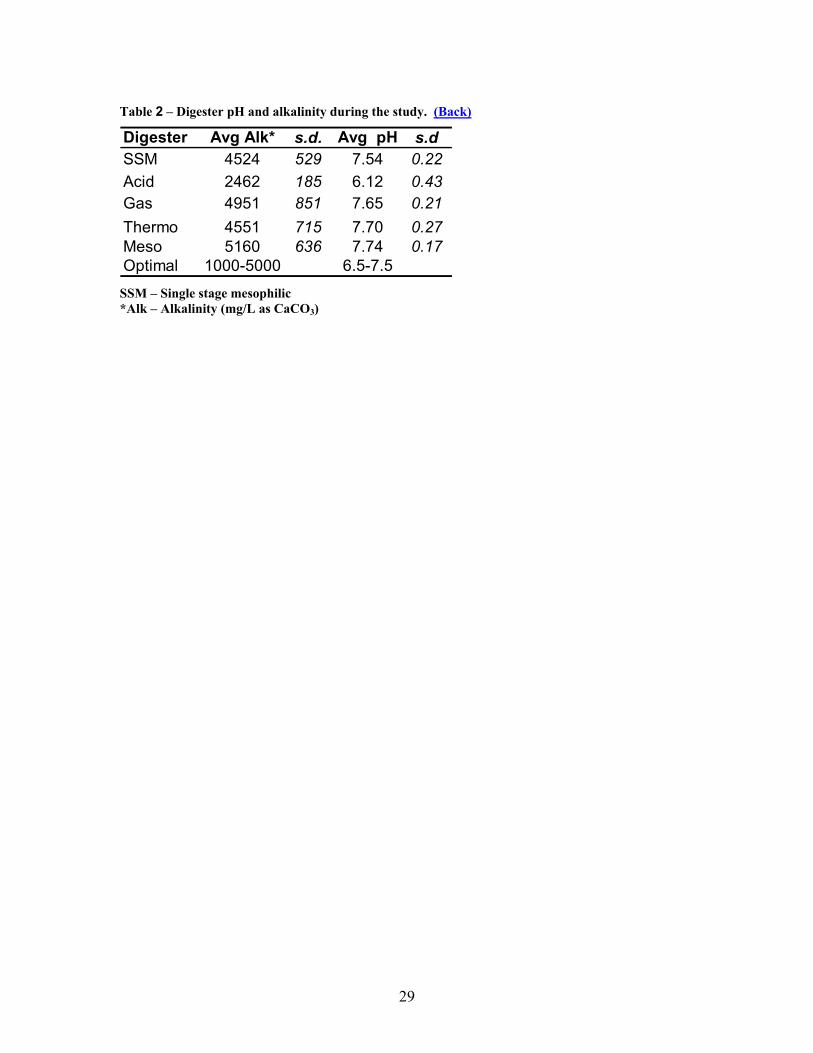
Table 2 – Digester pH and alkalinity during the study. (Back)
Digester Avg Alk* s.d. Avg pH s.dSSM 4524 529 7.54 0.22Acid 2462 185 6.12 0.43Gas 4951 851 7.65 0.21Thermo 4551 715 7.70 0.27Meso 5160 636 7.74 0.17Optimal 1000-5000 6.5-7.5
SSM – Single stage mesophilic *Alk – Alkalinity (mg/L as CaCO3)
29
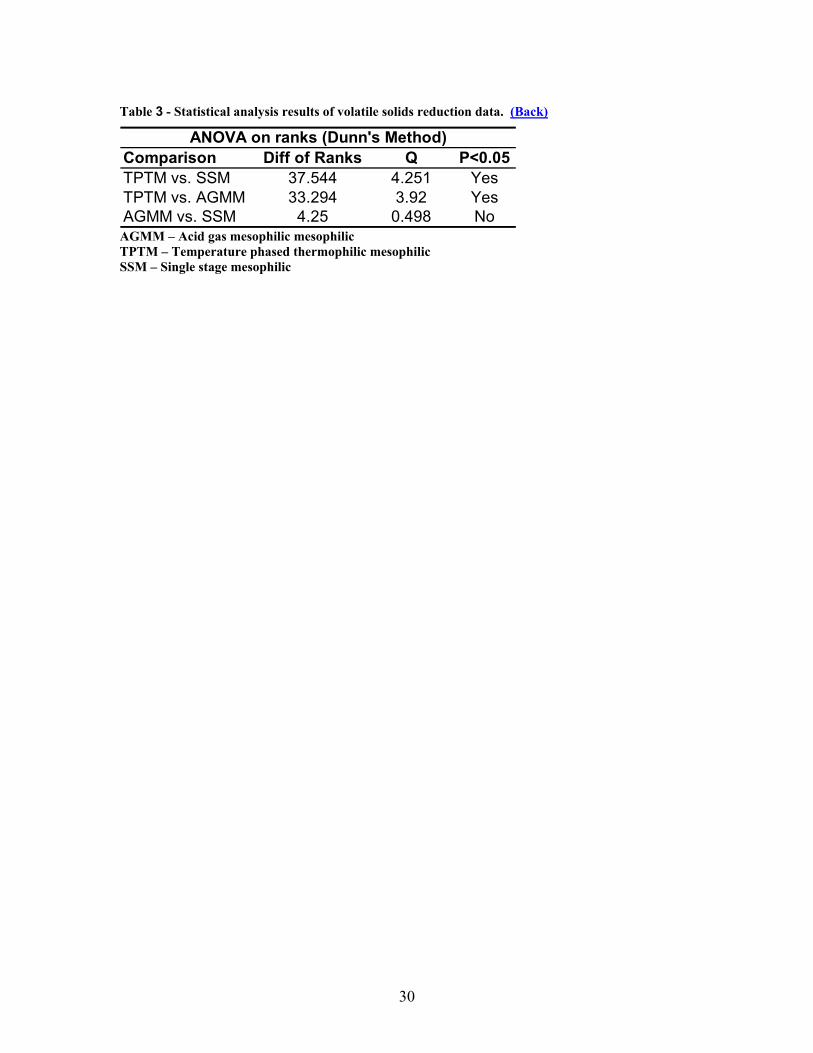
Table 3 - Statistical analysis results of volatile solids reduction data. (Back)
Comparison Diff of Ranks Q P<0.05TPTM vs. SSM 37.544 4.251 YesTPTM vs. AGMM 33.294 3.92 YesAGMM vs. SSM 4.25 0.498 No
ANOVA on ranks (Dunn's Method)
AGMM – Acid gas mesophilic mesophilic TPTM – Temperature phased thermophilic mesophilic SSM – Single stage mesophilic
30
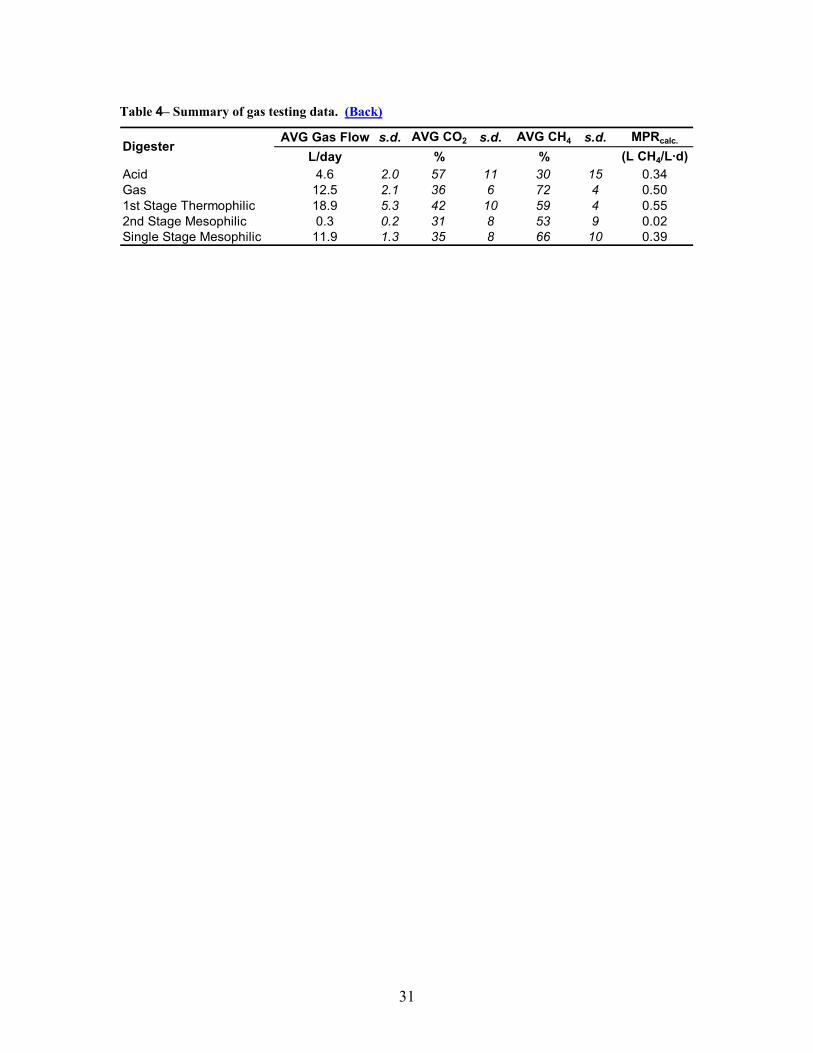
Table 4– Summary of gas testing data. (Back)
AVG Gas Flow s.d. AVG CO2 s.d. AVG CH4 s.d. MPRcalc.
L/day % % (L CH4/L·d)Acid 4.6 2.0 57 11 30 15 0.34Gas 12.5 2.1 36 6 72 4 0.501st Stage Thermophilic 18.9 5.3 42 10 59 4 0.552nd Stage Mesophilic 0.3 0.2 31 8 53 9 0.02Single Stage Mesophilic 11.9 1.3 35 8 66 10 0.39
Digester
31
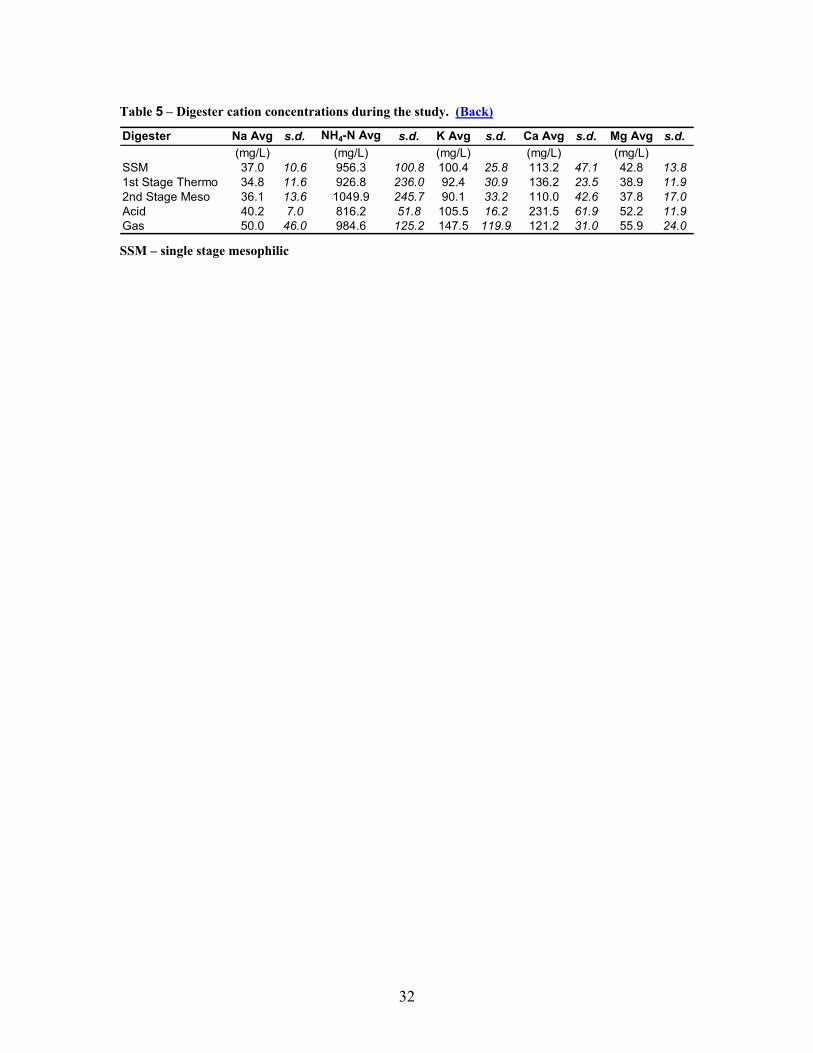
Table 5 – Digester cation concentrations during the study. (Back)
Digester Na Avg s.d. NH4-N Avg s.d. K Avg s.d. Ca Avg s.d. Mg Avg s.d.(mg/L) (mg/L) (mg/L) (mg/L) (mg/L)
SSM 37.0 10.6 956.3 100.8 100.4 25.8 113.2 47.1 42.8 13.81st Stage Thermo 34.8 11.6 926.8 236.0 92.4 30.9 136.2 23.5 38.9 11.92nd Stage Meso 36.1 13.6 1049.9 245.7 90.1 33.2 110.0 42.6 37.8 17.0Acid 40.2 7.0 816.2 51.8 105.5 16.2 231.5 61.9 52.2 11.9Gas 50.0 46.0 984.6 125.2 147.5 119.9 121.2 31.0 55.9 24.0 SSM – single stage mesophilic
32
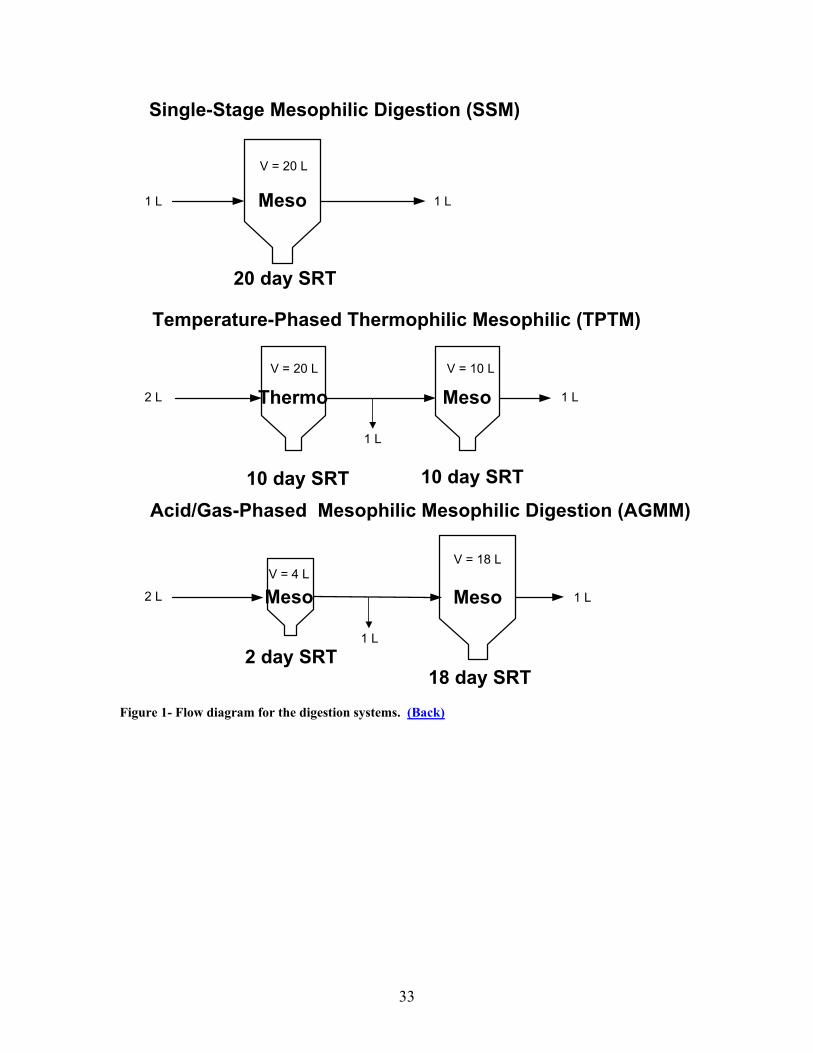
Single-Stage Mesophilic Digestion (SSM)
Temperature-Phased Thermophilic Mesophilic (TPTM)
Acid/Gas-Phased Mesophilic Mesophilic Digestion (AGMM)
2 day SRT
Meso
18 day SRT
Meso
20 day SRT
Meso
10 day SRT
Thermo Meso
10 day SRT
V = 20 L
V = 20 L V = 10 L
1 L 1 L
1 L2 L
1 L
2 L
1 L
1 L
V = 4 LV = 18 L
Figure 1- Flow diagram for the digestion systems. (Back)
33
TedlarBag
Water Trap(Optional)
VariableSpeed
PeristalticPump
Headspace
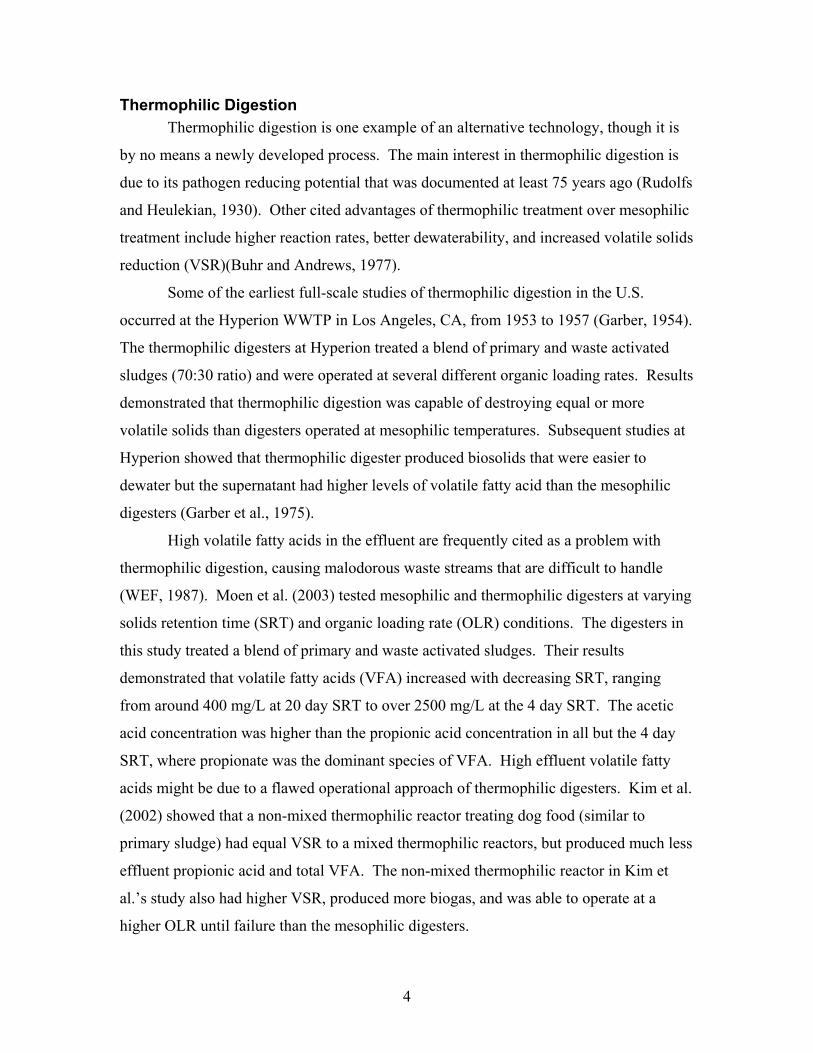
Figure 2 – Gas recirculation diagram for experimental setup. Water trap was utilized on the thermophilic reactor to prevent condensation from accumulating in the gas lines. (Back)
34
Feed mode change at day 106 Thin primary
sludge in feed0.25
0.35
0.45
0.55
0.65
0.75
0.85
74.00 94.00 114.00 134.00 154.00Days from Start
VSR
(1
0 da
y m
ovin
g av
erag
e)
TPTM AGMM SSM
Figure 3 –Volatile solids reduction (10 day moving average) with time. Feed mode was changed from semi-continuous to batch at day 106 and primary sludge total solids decreased at day 115. (Back) AGMM – Acid gas mesophilic mesophilic TPTM – Temperature phased thermophilic mesophilic SSM – Single stage mesophilic
35
0.00
0.10
0.20
0.30
0.40
0.50
0.60
0.70
0.80
SSM AGMM TPTM
VSR
Primary TS ~ 5.5%Primary TS ~ 2.5%
Figure 4 – Volatile solids reduction before and after change in primary sludge total solids (TS). High/low bars represent standard deviation. (Back) SSM – Single stage mesophilic AGMM – Acid gas mesophilic mesophilic TPTM – Temperature phased thermophilic mesophilic
36
VSR
0.20
0.30
0.40
0.50
0.60
0.70
0.80
0.90
S S M A G M M T P T M 2 5 % 0 . 4 7 0 . 4 9 0 . 5 5
M e d i a n 0 . 5 1 0 . 5 5 0 . 6 27 5 % 0 . 6 0 0 . 5 8 0 . 6 9
SSM – Single stage mesophilicAGMM – Acid gas mesophilic mesophilicTPTM – Temperature phased thermophilic mesophilic
Figure 5– Volatile solids reduction after 74 days. High/low bars represent the 10th and 90th percentiles and points outside this are considered outliers. (Back)
37
0.00
0.05
0.10
0.15
0.20
0.25
SSM AGMM TPTM
VS lo
st a
fter i
ncub
atio
nSSM – Single stage mesophilicAGMM – Acid gas mesophilic mesophilicTPTM – Temperature phased thermophilic
Figure 6 – Residual biological activity test results. Grab samples were collected on the last day of the experiment (day 160). (Back)
38
0.322 0.314 0.313
0.350 m3/kg
0.00
0.05
0.10
0.15
0.20
0.25
0.30
0.35
0.40
SSM AGMM TPTM
m3
CH 4
/kg
CO
D re
mov
ed
SSM – Single stage mesophilicAGMM – Acid gas mesophilic mesophilicTPTM – Temperature phased thermophilic
Figure 7 - Normalized methane production for each digester system at STP. Theoretical methane production is noted for comparison. (Back)
39
0.00.51.01.52.02.53.03.54.0
SSM Acid Gas Thermo Meso
VFA
(g/L
as
acet
ic a
cid)
5.00
5.50
6.00
6.50
7.00
7.50
8.00
8.50
pH
C2-C4 VFA Avg pH
Figure 8 – Effluent volatile fatty acids (VFA) and reactor pH. High/Low bars represent one standard deviation for pH data. (Back) SSM – Single stage mesophilic.
40
0
500
1000
1500
2000
2500
Gas 2nd StageMeso
SSM 1st StageThermo
Acid
1.21 1.50 1.80 2.97 16.82
VFA
(mg/
L as
ace
tic a
cid) Acetic Propionic Butyric
Avg OLR (g VS/L day)
Figure 9 – Distribution of volatile fatty acids (VFA) and organic loading rate (OLR). (Back)
SSM – Single stage mesophilic
41
Manuscript 2
A Comparative Study of Temperature-Phased Digestion to Single Stage Thermophilic and Mesophilic Digestion
David Inman, Jared Webb, John Novak
Abstract
Three bench scale anaerobic digestion systems, operating in parallel, treated a
blend of primary and secondary residuals (at 4% total solids) from Blue Plains
wastewater treatment plant (WWTP), Washington, D.C. The digestion systems were
temperature-phased anaerobic digestion (TPAD), single stage thermophilic (SST) and
single stage mesophilic (SSM) anaerobic digestion. Solids retention time (SRT) and
organic loading rates (OLR) were changed between each of three study phases. The
TPAD system demonstrated the best performance by destroying more volatile solids and
having lower residual biological activity than the other digesters during each phase of the
study. Maximum volatile solids reduction (VSR) was 67% by the TPAD system with a
15 day SRT (each stage at 7.5 days). The SSM digester had a VS reduction of 63%,
which was 9% higher VSR than the SST digester when both were operated at 20 days
SRT. This indicated that perhaps a fraction of the feed sludge was degraded only under
mesophilic temperatures. The results of this study, combined with additional studies on
odor production and dewatering, have demonstrated an advantage to TPAD digestion as a
process for Blue Plains to implement in their anaerobic digestion facility that will be
constructed by 2008.
Keywords
Thermophilic, temperature phased, mesophilic, staged, anaerobic, digestion, biosolids,
Introduction
Mesophilic digestion performed in a single digester is the most common method
utilized for residuals stabilization in municipal wastewater treatment. In the past several
decades, practitioners have looked to alternative digestion technologies to improve
pathogen destruction and volatile solids reduction (VSR). Land application requirements
42
and public health concerns have lead to the development of technologies to reduce
pathogens in digested biosolids. Rising transportation, disposal, and handling costs have
driven the search for higher volatile solids reduction and better dewaterability.
Thermophilic digestion is one example of an alternative technology, though it is
by no means a new process. The main interest in thermophilic digestion is due to its
pathogen reducing potential that was documented at least 75 years ago (Rudolfs and
Heulekian, 1930). Other cited advantages of thermophilic treatment over mesophilic
treatment include higher reaction rates, better dewaterability, and increased volatile solids
reduction (Buhr and Andrews, 1977).
While thermophilic digestion has demonstrated the capability for reducing
pathogens to a point suitable for classification as Class A biosolids (i.e. pathogen levels
below detectable limits), the EPA has not listed it as an alternative technology suitable
for this purpose because of operational stability issues (Metcalf and Eddy, 2003).
Fluctuating volatile fatty acid (VFA) levels, odorous effluent, and foaming problems
have all been attributed to thermophilic digester operation (WEF, 1987). A better
understanding of optimal operating conditions may one day minimize such problems.
For example, Kim et al. (2002) showed that a non-mixed thermophilic reactor had VSR
equal to a well mixed thermophilic reactor, but produced much less effluent propionic
acid and total VFA.
A recently developed alternative digestion technology seeks to enhance the
benefits of thermophilic digestion while minimizing its risks. This system is called
temperature-phased anaerobic digestion (TPAD) in the U.S. (Dague et al., 1996) and the
Anaerobic Stabilization Thermophilic/Mesophilic system (ASTM) in Europe (Oles et al.,
1997). The U.S. patent application for the TPAD process lists a wide range of solids
retention time (SRT) and temperature under which TPAD processes may be operated
(Dague et al., 1996). Commonly, TPAD processes include a thermophilic reactor (3-5
day SRT) followed by a mesophilic digester (>18 day SRT) (Metcalf and Eddy, 2003).
These systems benefit from both temperature variation and partial phase separation.
Phased-digestion refers to the separation of acid-formers from methane-formers
through environmental selection (Massey and Pohland, 1978). In practice, this is
accomplished by adjusting digester pH through chemical control or kinetically by
43
lowering SRT to wash out methane formers. Pohland and Ghosh (1971) developed the
concept of kinetic phase separation and Ghosh’s subsequent research cited advantages of
phase separation, such as enhanced volatile solids reduction, gasification, and stability
(Ghosh, 1987). Other research has suggested the costs may outweigh the benefits to
phase separation (Bhattacharya et al., 1996). However, it has been applied successfully
in several full-scale operations (Wilson and Dichtl, 2000). Two phased anaerobic
digestion (2PAD) is a variation of acid gas phased anaerobic digestion and includes a
thermophilic digester as the first acidogenic digester, where the pH is maintained in
acidophilic ranges through chemical control (Huyard et al., 2000). The thermophilic
temperatures allow the 2PAD process to destroy pathogens to meet Class A biosolids
requirements.
Some claim that true phase separation cannot occur in thermophilic digestion
because thermophilic temperatures preclude the development of a sole acid-forming stage
(Dichtl, 1997). Because of this, Dichtl suggests that a thermophilic digester in the TPAD
system should be operated between 3 and 5 days, which achieves an adequate balance
between acid-formers and methane-formers and minimizes propionic acid accumulation.
Research conducted in this laboratory showed that a temperature phased system with a
thermophilic followed by mesophilic configuration (both reactors at 10 day SRT)
destroyed significantly more volatile solids than an acid-gas phased system with a 2 day
SRT acid digester and an 18 day SRT gas digester (both stages mesophilic)(Inman,
2004). The long SRT of the thermophilic reactor prevented phase-separation and
indicates that thermophilic temperatures may be more important than phase-separation
for improved performance in temperature-phased digestion of wastewater residuals.
However, a short SRT in the first stage thermophilic digester is economically desirable
due to a smaller operating volume.
Many researchers have demonstrated advantages to TPAD processes. Han and
Dague (1997) demonstrated 18% higher volatile solids reduction and methane production
from a TPAD process versus a single stage mesophilic digester across a range of SRTs
from 10 to 15 days. Yet improved VSR may come at the cost of poor dewatering. Bivins
and Novak (2001) observed poor biosolids dewatering characteristics in a bench-scale
TPAD system: Dewaterability, as measured by capillary suction time and optimal
44
polymer dose, became worse when the 1st stage thermophilic reactor was increased from
a detention time of 1.5 to 3 days. Nevertheless, class A biosolids production capability
may outweigh the disadvantage of poor dewatering characteristics. Vandenburgh and
Ellis (2002) showed a TPAD process capable of meeting Class A biosolids requirements
across a range of solids loading conditions. The first stage thermophilic reactor in their
study also tolerated high levels of un-ionized ammonia (326 mg/L), suggesting its
suitability for treatment of high nitrogen wastes.
Objectives
The main objective of this study is to compare the performance of temperature-
phased digestion (TPAD) and single stage mesophilic digestion (SSM) as measured by
volatile solids reduction. Additionally, single stage thermophilic (SST) digestion is
investigated since the TPAD system is configured for sampling the first stage
thermophilic digester. Other tests used for comparison include methane production,
residual biological activity, effluent volatile fatty acids and ammonium. The purpose of
the study is to aid designers of an anaerobic digestion facility for Blue Plains WWTP,
scheduled for completion in 2008. Temperature-phased digestion is a potential process
configuration for this facility. The study was conducted in three testing phases, with each
testing phase evaluating different operational conditions.
Methods and materials
Selected solids retention time (SRT) and temperature regimes were chosen to
compare the performance of the digesters over a range of values (Table 1) and to
calibrate design models for Blue Plains. All figures, graphs, and tables refer to the
digesters by the acronyms listed on this table. The operating volume of the 1st stage
thermophilic digester was larger than the 2nd stage mesophilic reactor. This was done so
that excess waste was available for sampling (Figure 1). The SRT of the digesters was
maintained by feeding and wasting equal volumes each day at around the same time (±1
hour).
Digesters were fed with a blend of thickened primary and waste activated sludge
from the Blue Plains wastewater treatment plant in Washington, D.C. The sludges were
45
composited at Blue Plains over several days and shipped overnight bi-weekly. For the
first phase of testing, the sludges were mixed at a 1:1 volume ratio and in the second and
third phase they were mixed at a 1:1 weight ratio. Though the feed characteristics were
very similar throughout each phase of the study (Table 2) it is important to note that the
proportion of primary sludge to secondary sludge was unknown in the first study phase
since they were mixed volumetrically. Also, the organic loading rate was not the same
between the digesters in each phase since they were operated at different volumes (Table
3). Screening of both sludges to remove large particles occurred at the time of collection
and additional screening occurred prior to feeding. The screen was a semi-spherical
kitchen colander, with approximately 3-millimeter diameter holes distributed at about 2
per square centimeter. Total solids concentration of the feed was diluted to 3% at startup
in the first phase and was increased to ≥ 4% at 39 days into the first phase experiment.
Data presented for the first study phase only includes samples collected after the feed
solids were increased. In subsequent testing phases the feed was maintained at around
4% throughout the experiments. Tap water was used to dilute the sludge, when
necessary, to achieve the desired total solids concentration. Daily batch feeding and
wasting was utilized in all three test phases.
The digesters were set up in a controlled temperature room set at 36.5 °C, keeping
the digester temperature at 35±1 °C. Thermophilic temperatures were achieved by
circulating 65 °C water in flexible vinyl tubing that encircled the thermophilic digesters.
This kept the thermophilic temperature at 55±1 °C. Internal digester temperature was
confirmed with a digital temperature gauge connected to thermocouples positioned inside
the digesters. Since batch feeding was performed, digester temperature dropped once
each day. This was most notable in the thermophilic digesters. During thermophilic
digester feeding the temperature dropped to 45-48 °C and recovered in two to three
hours.
Vessels used for digestion were conical shaped tanks commonly used for home
beer making. Two models were used: A 6.5 gallon stainless steel Fermenator™
manufactured by Blinchmann Engineering and a 7 gallon plastic Mini-Conical
manufactured by Hobby Beverage Equipment Company. Both of these models were
46
available from Grape and Granary in Akron, OH. To prevent digester biogas from
escaping, the lids were sealed with silicone caulk.
Mixing was achieved by circulating gas from the headspace of each digester and
injecting it into a valve at the bottom of the digester (Figure 2). The relatively deep
cylindrical shape, combined with steeply sloped conical bottom of the digesters was
thought to enhance mixing efficiency in a similar manner to egg-shaped digesters. The
degree of mixing could be increased or decreased because 6-600 RPM variable speed
peristaltic pumps circulated the gas (Cole-Parmer, Vernon Hills, Illinois). Normally, the
pumps were set at 40% of their maximum speed. This corresponds to approximately 0.7
liters/minute with the Cole-Parmer L/S 18 tubing used on the pumps. At least five
minutes before wasting and feeding, the gas flow rate was increased to 1.4 LPM to ensure
that waste samples were representative of the digester contents. After feeding, the flow
rate was maintained at 1.4 LPM for about 10 minutes to disperse the feed.
Gas from each digester accumulated in Tedlar bags (Fisher Scientific, Hampton,
NH) attached to the digester’s collection/recirculation system (Figure 2). The gas flow
rate was calculated by measuring the volume of gas in the bags and dividing by the time
between measurements. Large volume Tedlar bags were used to prevent the systems
from becoming pressurized. Gas composition samples were obtained by transferring one
liter of gas from the large bags to smaller bags that had syringe-sampling ports. The
thermophilic digester required a water trap to capture about 50 milliliters per day of
moisture that condensed in the gas lines and it was put back into the digester every other
day.
The digesters in the first testing phase were started using thickened waste
activated sludge from the Blacksburg-VPI Sanitation Authority, Lower Stroubles Creek
WWTP. Previous studies showed favorable results of starting thermophilic and
mesophilic digesters with waste activated sludge (Kim and Speece, 2002). Waste
activated sludge equal to one half of the operating volume of each digester sat un-mixed
in the digesters for about 10 days, and then feed was added in 0.5 liter increments each
day until the final operating volume was achieved. Upon reaching operating volume,
daily wasting and feeding operations commenced. Digesters in the second and third test
47
phases were seeded with the reactor contents from the previous testing phases, except for
the 25 day SSM, which was started with mesophilically digested sludge from the
Pepper’s Ferry WWTP.
Tests conducted during the study included:
• Total and volatile solids
• Gas production and composition
• Total chemical oxygen demand (COD)
• pH
• Alkalinity
• Effluent volatile fatty acids (acetic, propionic, and butyric/isobutyric)
• Soluble cations (Na+, NH4+, K+, Mg++, Ca++)
Additional tests during the study included residual biological activity tests which were
conducted once at the end of the study.
COD, pH, alkalinity, and solids testing were conducted according to Standard
Methods (APHA, 1999).
Gas samples were analyzed with a Shimadzu model GC-14A gas chromatograph
(Shimadzu Scientific Instruments, Columbia, MD) using the thermal conductivity
detector (TCD). The column used was made from a 6 ft x 0.25 inch copper tubing. The
column was coiled to fit in the GC-14A oven and packed with Haysep Q media (Supelco,
Bellefonte, PA). Helium was the carrier gas, with column flow set at 17 mL/min.
In order to prepare samples for cations and effluent volatile fatty acids (VFA)
analysis, a 500 mL sample of digester biosolids was centrifuged at 13,500 x g for 25
minutes. Fifty mL of the supernatant was frozen for storage until the analyses were
performed. Samples were usually frozen for no more than 7 days. At the time of
analysis, the sample was thawed, centrifuged at 6,000 x g for 15 minutes, and then
filtered through a 0.45 micron syringe filter (Fisher Scientific). From this filtered sample,
dilutions were made for cation testing and VFA testing.
Diluted VFA samples were acidified in their individual GC vial by adding
concentrated phosphoric acid at a ratio of 1:10. The VFA samples were analyzed on a
48
Hewlett Packard Model 5890 gas chromatograph using a flame ionization detector. A
Nukol capillary column (Supelco) was used and samples were injected in splitless mode.
The column flow gas was helium with a flow rate of 17 mL/min. Flow rates for the other
gases used were as follows: Nitrogen – 13 mL/min, Hydrogen – 45 mL/min, Air – 450
mL/min.
Diluted cation samples were analyzed on a Dionex D-120 ion chromatograph
utilizing a CS-12 column and conductivity detection with self-generating suppression of
the eluent (Dionex Corp., Sunnyvale, CA). 20mM methanesulfonic acid was used for
eluent at a flow rate of 1 mL/min.
The residual biological activity test (RBA) was a simplified modification of the
additional digestion test method outlined by EPA (1993). It was conducted by incubating
100mL digester samples in serum vials at 36.5°C for at least 20 days. During the
incubation period, the vials were periodically degassed and weighed. The weight lost
from each vial was assumed to be from gasification of the VS in each sample. RBA was
calculated by dividing the weight lost from each sample at the end of incubation by the
weight of its VS content (analyzed prior to incubation) and is reported as percent VS lost.
Non-parametric statistical methods were utilized when comparing data. The
Mann-Whitney rank sum method was used when comparing two groups. This is the non-
parametric equivalent of the student’s t-test. A one-way ANOVA on ranks with Dunn’s
method was used for pairwise comparison between three or more groups and is the non-
parametric equivalent of the one-way ANOVA. These methods were necessary due to the
data not always meeting normality or equal variance requirements of parametric
statistical methods. Statistical analysis of results was conducted with SigmaStat 3.10
(SPSS Software Inc., Chicago, IL).
Results and discussion
Digester pH and alkalinity: The digester pH and alkalinity conditions during the
study are shown in Table 4. These are typical values for anaerobic digestion (Parkin and
Owen, 1986).
49
Volatile solids reduction calculation method: VSR was calculated by the
approximate mass balance method (Equation 1).
100:1 ×−
=FeedVS
FeedVSWasteVSVSREquation
This equation assumes that daily flows are steady, reasonably uniform, and that
digester volume and composition does not vary substantially on a daily basis (EPA,
1999). These were reasonable assumptions to apply to this experiment.
Volatile solids reduction: During the second and third testing phase, the TPAD
system destroyed significantly more volatile solids compared to the other digesters in
those phases (ANOVA on ranks: Dunn’s method, 95% confidence interval). The highest
VSR of 67% occurred in the TPAD7.5/7.5 system during the third testing phase (Figure
3). During the second phase, the TPAD5/10 system destroyed about 10% more VS than
the SST20 system and around 7% more than the SSM15 digester. In the third phase, the
TPAD7.5/7.5 system destroyed approximately 4% more VS than a SSM25 and 7% more
than the SSM15 digester. However, in the first study phase, the SSM20 and TPAD10/10
systems were statistically equal (Mann-Whitney rank sum, 95% confidence interval). At
all study phases, the TPAD digester was operated at a significantly higher OLR than the
SSM digesters (ANOVA on ranks: Dunn’s method, 95% confidence interval).
The VSR for the SST digesters in this study (48.5% to 53.6%) were lower than
recently reported by Moen et al.(2003). However, the feed in this study had a lower
average VS/TS ratio than the Moen et al. work (0.77 versus 0.83). The difference could
also be from a higher proportion of waste activated sludge in the present study than in the
Moen et al. study. There was no statistical difference between the VSR of any of the
TPAD systems (ANOVA on ranks: Dunn’s method, 95% confidence interval).
VSR for all reactors varied with SRT and OLR (Figure 4). Two data points from
a SSM digester at 10 days SRT and a SST digester at 20 days SRT are included in Figure
4.. They are identified as solid points and were collected during a continuance of the
overall study for Blue Plains that took place after the conclusion of study phase 3. The
general trend observed was that VSR increased with increasing SRT and decreased with
increasing OLR, except with the TPAD systems where VSR remained relatively constant
50
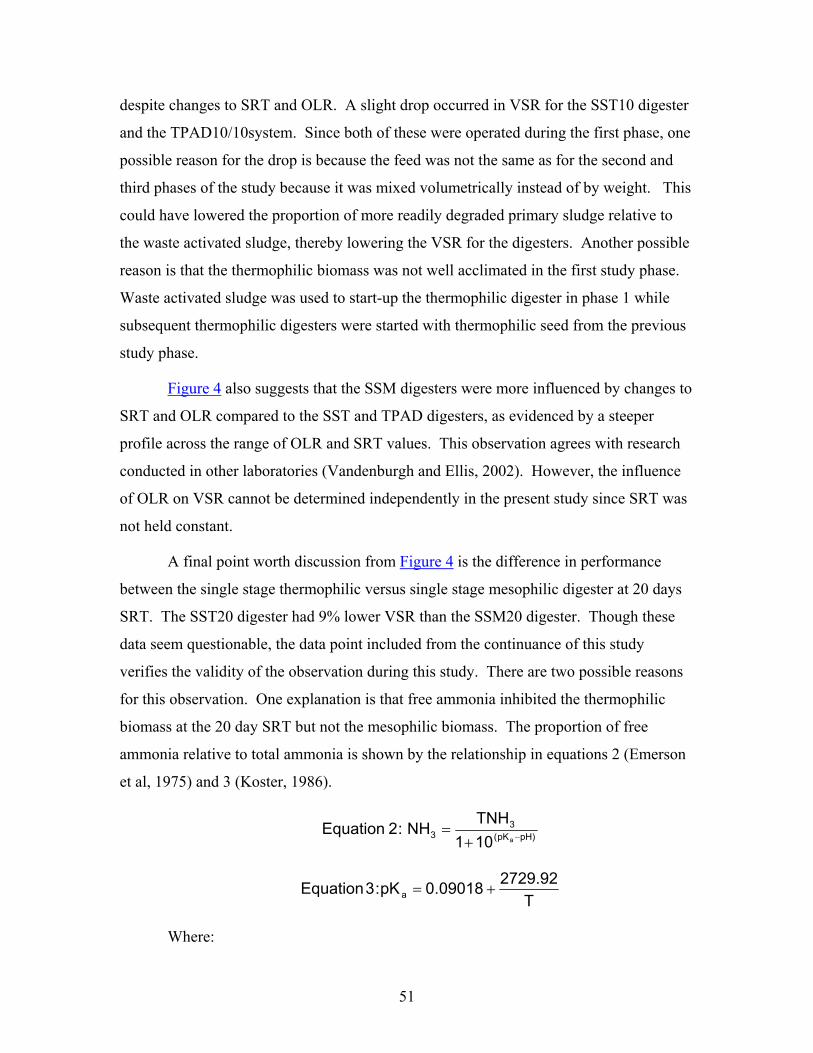
despite changes to SRT and OLR. A slight drop occurred in VSR for the SST10 digester
and the TPAD10/10system. Since both of these were operated during the first phase, one
possible reason for the drop is because the feed was not the same as for the second and
third phases of the study because it was mixed volumetrically instead of by weight. This
could have lowered the proportion of more readily degraded primary sludge relative to
the waste activated sludge, thereby lowering the VSR for the digesters. Another possible
reason is that the thermophilic biomass was not well acclimated in the first study phase.
Waste activated sludge was used to start-up the thermophilic digester in phase 1 while
subsequent thermophilic digesters were started with thermophilic seed from the previous
study phase.
Figure 4 also suggests that the SSM digesters were more influenced by changes to
SRT and OLR compared to the SST and TPAD digesters, as evidenced by a steeper
profile across the range of OLR and SRT values. This observation agrees with research
conducted in other laboratories (Vandenburgh and Ellis, 2002). However, the influence
of OLR on VSR cannot be determined independently in the present study since SRT was
not held constant.
A final point worth discussion from Figure 4 is the difference in performance
between the single stage thermophilic versus single stage mesophilic digester at 20 days
SRT. The SST20 digester had 9% lower VSR than the SSM20 digester. Though these
data seem questionable, the data point included from the continuance of this study
verifies the validity of the observation during this study. There are two possible reasons
for this observation. One explanation is that free ammonia inhibited the thermophilic
biomass at the 20 day SRT but not the mesophilic biomass. The proportion of free
ammonia relative to total ammonia is shown by the relationship in equations 2 (Emerson
et al, 1975) and 3 (Koster, 1986).
pH)pK(3
3 a101TNHNH :2 Equation
−+=
T2729.9209018.0pK:3Equation a +=
Where:
51
NH3 = free ammonia concentration (mg/L as N) TNH3 = total ammonia concentration (mg/L as N) = (NH3 + NH4
+) Ka = equilibrium ionization constant; and T = Temperature (K).
Since total ammonia was not analyzed, the ammonium concentration was substituted for
the total ammonia concentration in these equations. Though using the ammonium
concentration would likely under-estimate the true free ammonia concentration it still
provides a useful comparison. The calculated free ammonia concentration in the SST
digester (230 mg/L) was about 7 times higher than in the mesophilic digester (Table 5)
and higher than the reported toxic levels for mesophilic biomass. Studies have indicated
no problems when operating thermophilic digesters at levels as high as 326 mg/L free
ammonia (Vandenburgh and Ellis, 2002) and an analysis of Moen et al.’s data (2003)
shows that thermophilic and mesophilic digesters destroyed similar amounts of volatile
solids even with a large difference in digester free ammonia concentration. Therefore,
ammonia inhibition in the thermophilic digester may not be as plausible as the second
speculated reason: the mesophilic biomass was able to degrade a portion of the feed not
degraded by thermophilic biomass. This concept is depicted in Figure 5, where different
portions of the feed are degraded differently by thermophilic and mesophilic biomass,
though the net effect is that the mesophilic digester destroys more of the feed VS. It is
well understood that anaerobic microorganisms in sludge digesters require certain
substrates to perform their metabolism (Novaes, 1986). Studies have even shown how
broad categories of microorganisms, such as the acidogens, may degrade certain
substrates better than others(Fox and Pohland, 1994) What is not known is if particular
species of anaerobic microorganisms are more efficient at degrading certain fractions of
wastewater residuals than others, or how the biomass in digesters might adapt to degrade
its food source. It is certain that many living organisms, plants and animals, have adapted
to efficiently feed on specific food sources. By extending this logic to the present study,
it is speculated that the mesophilic biomass was either better adapted to degrade or had a
preference for a portion of the feed relative to the thermophilic biomass, as evidenced by
the higher volatile solids destruction in the mesophilic digester.
Residual biological activity: The RBA values generally decreased with
increasing SRT for the digesters and were lowest in the TPAD systems, which is in
52
agreement with the VSR data (Figure 6).. It is important to note that the RBA tests were
conducted once at the end of each study phase and represented a single grab sample.
Also, the RBA values are likely higher than what would be determined through the EPA
additional digestion method (1999) due to loss of water vapor when venting the gas from
the sample bottles.
Digester volatile fatty acids: As expected, VFA was highest in the SST digesters
during each testing phase (Table 6), with the highest average value of about 2.4 grams/L
as acetic occurring in the SST5 digester. The proportion of propionic acid was also
highest in the SST5 digester, which may indicate non-optimal conditions for anaerobic
digestion, though this did not seem to effect the VSR performance of the TPAD5/10
system. It is notable that in all phases except the first, the TPAD effluent had
considerably lower levels of VFA than the first stage thermophilic digester of the system,
with higher proportions of acetic acid relative to propionic acid. In the TPAD10/10
system in the first study phase, the 2nd stage mesophilic effluent contained similar
amounts of VFA to the SST10 effluent, suggesting that the mesophilic digester was not
performing optimally. This may further explain the decreased VSR performance
observed in the TPAD10/10 system.
Biogas characteristics: The highest methane content was found in the SSM20
digester, at close to 66% (Table 7). The methane production rate, however, was highest
in the thermophilic reactor during each test phase (Figure 7) because the thermophilic
digesters had higher biogas production. Since OLR varied with each change in SRT
during the study, it is difficult to evaluate the effects of SRT on specific methane yield
without also considering the OLR. Figure 8 portrays the interactions between OLR, SRT,
and specific methane yield. It is generally seen that as OLR increases, specific methane
yield decreases, while SRT and specific methane yield increase with each other.
However, the specific methane yield in the mesophilic digester remained fairly constant
during each test phase, regardless of SRT and OLR.
Ammonium ion concentration:: The NH4-N levels ranged from 0.93 g/L to 1.4
g/L during the study and were highest in the SST20 digester (Table 8). The SST20
digester was significantly higher than all digesters in the study, except for the SST5,
53
TPAD5/10, and TPAD7.5/7.5 (ANOVA on ranks: Dunn’s method, 95% confidence
interval). It is likely that the reason for higher ammonium concentration in the
thermophilic digesters and the TPAD systems was due to higher protein degradation.
Discussion: One disadvantage of the laboratory setup for this study is that SRT and
OLR were changed together and that the OLR was higher for the TPAD system than the
SSM digester. This makes comparing of the effect of SRT on digester performance
difficult. Despite this drawback, it was observed that the TPAD digestion system
destroyed significantly more VS than the SSM digesters(at significantly higher OLR) in
the second and third phases of the study. The enhanced performance of the TPAD
digester suggests that it is a suitable candidate for digestion processes at Blue Plains.
Furthermore, odor tests conducted on these digesters have shown a distinct advantage to
TPAD digested biosolids versus single stage mesophilic and single stage thermophilic.
Future comparative studies on TPAD digestion would benefit from operating at
either a constant OLR, as in Han and Dague’s work (1997), or by operating at a constant
SRT with varying OLR, as in Vandenburgh and Ellis’s study (2002). Both SRT and
OLR have important implications in design and operation of TPAD digesters and such a
study would help answer the question of how to optimize the performance of a TPAD
system for Blue Plains.
Conclusions
The main study objective was to compare the performance of TPAD digestion to
single stage mesophilic digestion as measured by VSR. To this end, three separate study
phases were conducted with a TPAD system and a SSM digester operated at equal SRTs.
Additionally, the performance of single stage thermophilic digestion was compared to
TPAD and SSM digestion by sampling the first thermophilic stage of the TPAD system.
Single stage thermophilic digestion had the highest observed specific methane yield
(SST20 digester - 0.55 L CH4 per gram VS destroyed) and the highest observed methane
production rate ( SST5 digester, at over 0.86 liter CH4 per liter digester volume).
Furthermore, the SST20 digester had the highest observed effluent ammonium at 1.4 g/L,
suggesting high protein degradation. Nevertheless, it was concluded that thermophilic
digestion alone was not as effective as mesophilic digestion at SRTs greater than 10 days
54
as supported by the data presented in Figure 4. However, TPAD digestion seemed to
have an advantage to both SST and SSM digestion. It was concluded that the TPAD
system demonstrated better performance throughout the study as supported by the
following observations:
• At a 15 day SRT the TPAD system destroyed significantly more VS than the SSM
digesters, though at a 20 day SRT there was no significant difference.
Additionally, the TPAD system was operated at a significantly higher OLR than
the SSM digesters at all SRTs.
• The TPAD7.5/7.5 digester in the third study phase destroyed the highest amount
of VS during the entire study (67%) and destroyed significantly more VS (~4%)
than a SSM digester operated at 25 days.
• The TPAD system was less influenced by increased OLR than the SSM and SST
digesters.
• Residual biological activity tests indicated the most stable biosolids were
produced by the TPAD10/10 and TPAD7.5/7.5 system.
55
References
Bhattacharya, S.K., Madura, R.L., Walling, D.A., Farrell, J.B. (1996) Volatile solids reduction in two-phase and conventional anaerobic sludge digestion. Water Res. 30, 5, 1041-1048. Bivins,J.L., Novak, J.T. (2001) Changes in dewatering properties between the thermophilic and mesophilic stages in temperature-phased anaerobic digestion systems. Water Environ. Res. 73, 4, 444-449. Buhr, H.O., Andrews, J.F. (1977) The thermophilic anaerobic digestion process. Water Res., 11, 129-143. Dague, R.R., Kaiser, S.K., Harris, W.L. (1996) Temperature-phased anaerobic waste treatment process. U.S. Patent Office. Patent Number 5,525,228. Dichtl, N. (1997) Thermophilic and mesophilic (two-stage) anaerobic digestion. Water and Env. Mgmt: Journal of CIWEM. 11, 2, 98-104. Emerson, K., Russo, R.C., Lund, R.E., Thurston, R.V. (1975) Aqueous ammonia equilibrium concentrations: effect of pH and temperature. J. Fish. Res. Bd. Can., 32, 2379. EPA (1999) Environmental regulations and technology: Control of pathogens and vector attraction in sewage sludge. Office of Research and Development, Washington, D.C. Fox, P., Pohland, F.G. (1994) Anaerobic treatment applications and fundamentals: substrate specificity during phase separation. Water Env. Res. 66, 5, 716-724. Ghosh, S. (1987) Improved sludge gasification by two-phase anaerobic digestion. ASCE J. Environ. Eng., 113, 6, 1265-1284. Han, Y., Dague, R.R. (1997) Laboratory studies on the temperature-phased anaerobic digestion of domestic primary sludge. Water Environ. Res., 69, 6, 1139-1143. Huyard, A., Ferran, B., Audic, J.M. (2000) The two phase anaerobic digestion process: sludge stabilization and pathogens reduction. Water Sci. Technol.,42, 9, 41-47. Inman, D.C. (2004) Manuscript 1: Comparing acid/gas-phased to temperature-phased and conventional mesophilic digestion. M.S. Thesis, Virginia Polytechnic Institute and State University, Blacksburg. Kim, M., Ahn, Y.H., Speece, R.E. (2002) Comparative process stability and efficiency of anaerobic digestion; mesophilic vs. thermophilic. Water Res. 36, 4369-4385.
56
Kim, M., Speece, R.E. (2002) Aerobic waste activated sludge (WAS) for start-up seed of mesophilic and thermophilic anaerobic digestion. Water Res. 36, 3860-3866. Koster, I. (1986) Characteristics of the pH-influenced adaptation of methanogenic sludge to ammonia toxicity. J. Chem. Technol. Biotechnol., 36, 445. Massey, W.L., Pohland, F.G. (1978) Phase separation of of anaerobic stabilization by kinetic controls. J. Water Pollut. Control Fed., 50, 2204. Metcalf and Eddy Inc. (2003) Wastewater engineering: Treatment and reuse. 4th Edition. McGraw-Hill, New York, NY. Moen, G.H., Stensel, D., Lepisto, R., Ferguson, J.F. (2003). Effects of solids retention time on the performance of thermophilic and mesophilic digestion of combined municipal wastewater sludges. Water Env. Res. 75, 6, 539-548. Novaes R. F. V. (1986) Microbiology of anaerobic digestion. Water Sci. Technol. 18, 1–14. Oles, J., Dichtl, N., Niehoff, H.H. (1997) Full scale experience of two stage thermophilic/mesophilic sludge digestestion. Water Sci. Technol. 36, 6/7, 449-456. Parkin, G. F., Owen, W.F. (1986) Fundamentals of anaerobic digestion of wastewater sludges. J. Environ. Eng., 112, 867-920. Pohland, F.G., Ghosh, S. (1971) Developments in anaerobic stabilization of organic wastes—the two-phase concept. Env. Letters, 1, 4, 255-266. Rudolfs, W., Heukelekian, H. (1930) Thermophilic digestion of sewage solids. Preliminary paper. Ind. Eng. Chem. 22, 96. Vandenburgh, S.R., Ellis, T.G. (2002) Effects of varying solids concentration and organic loading on the performance of temperature phased anaerobic digestion process. Water Env. Res. 74, 2, 142-148. WEF (1987) Anaerobic Digestion, Manual of Practice No. 16, 2nd Edition. Water Environment Federation, Alexandria, VA. Wilson, T.E., Dichtl, N.A. (2000) Two-phase anaerobic digestion: An update on the AG process. Proceedings of WEFTEC 2000. Water Environment Federation, Alexandria, VA.
57
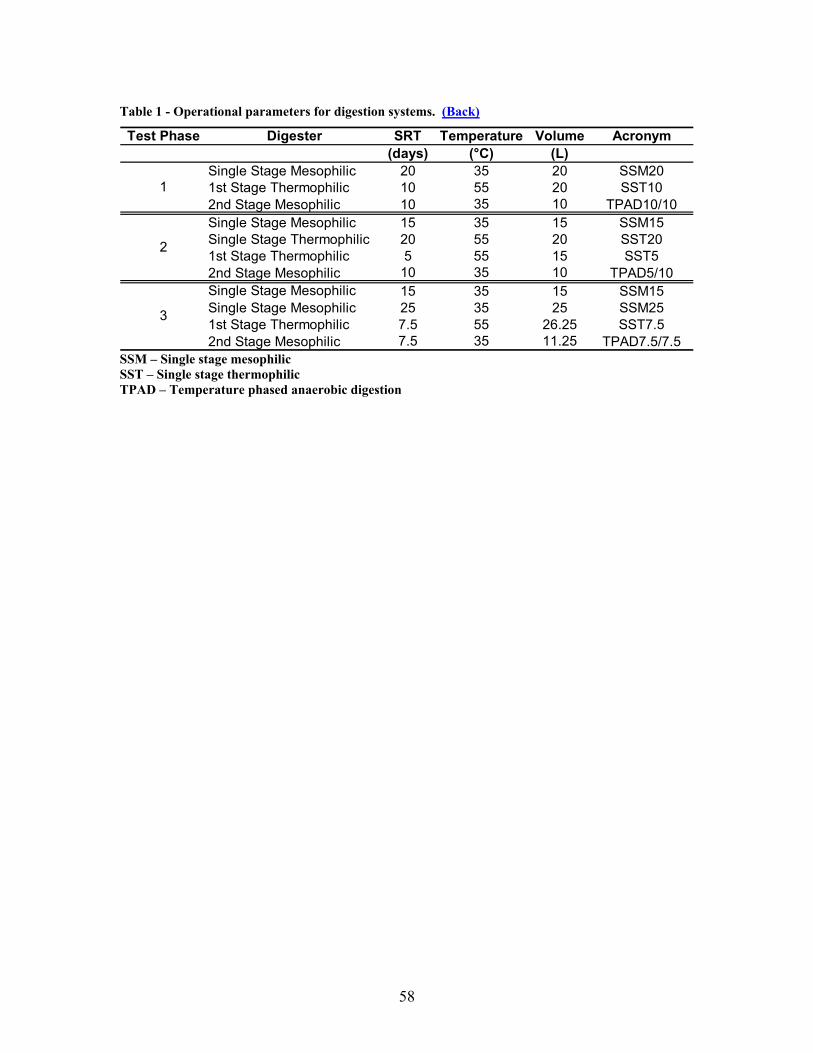
Table 1 - Operational parameters for digestion systems. (Back)
Test Phase Digester SRT Temperature Volume Acronym(days) (°C) (L)
Single Stage Mesophilic 20 35 20 SSM201st Stage Thermophilic 10 55 20 SST102nd Stage Mesophilic 10 35 10 TPAD10/10Single Stage Mesophilic 15 35 15 SSM15Single Stage Thermophilic 20 55 20 SST201st Stage Thermophilic 5 55 15 SST52nd Stage Mesophilic 10 35 10 TPAD5/10Single Stage Mesophilic 15 35 15 SSM15Single Stage Mesophilic 25 35 25 SSM251st Stage Thermophilic 7.5 55 26.25 SST7.52nd Stage Mesophilic 7.5 35 11.25 TPAD7.5/7.5
1
2
3
SSM – Single stage mesophilic SST – Single stage thermophilic TPAD – Temperature phased anaerobic digestion
58
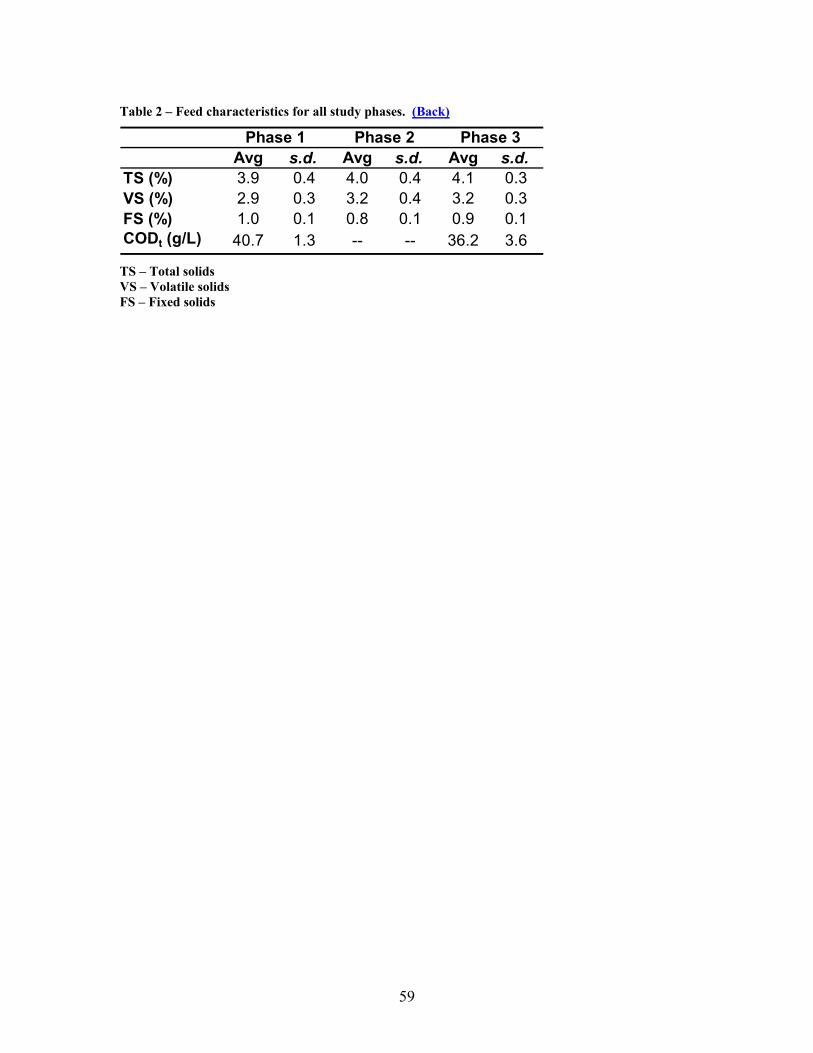
Table 2 – Feed characteristics for all study phases. (Back)
Avg s.d. Avg s.d. Avg s.d.TS (%) 3.9 0.4 4.0 0.4 4.1 0.3VS (%) 2.9 0.3 3.2 0.4 3.2 0.3FS (%) 1.0 0.1 0.8 0.1 0.9 0.1CODt (g/L) 40.7 1.3 -- -- 36.2 3.6
Phase 1 Phase 2 Phase 3
TS – Total solids VS – Volatile solids FS – Fixed solids
59
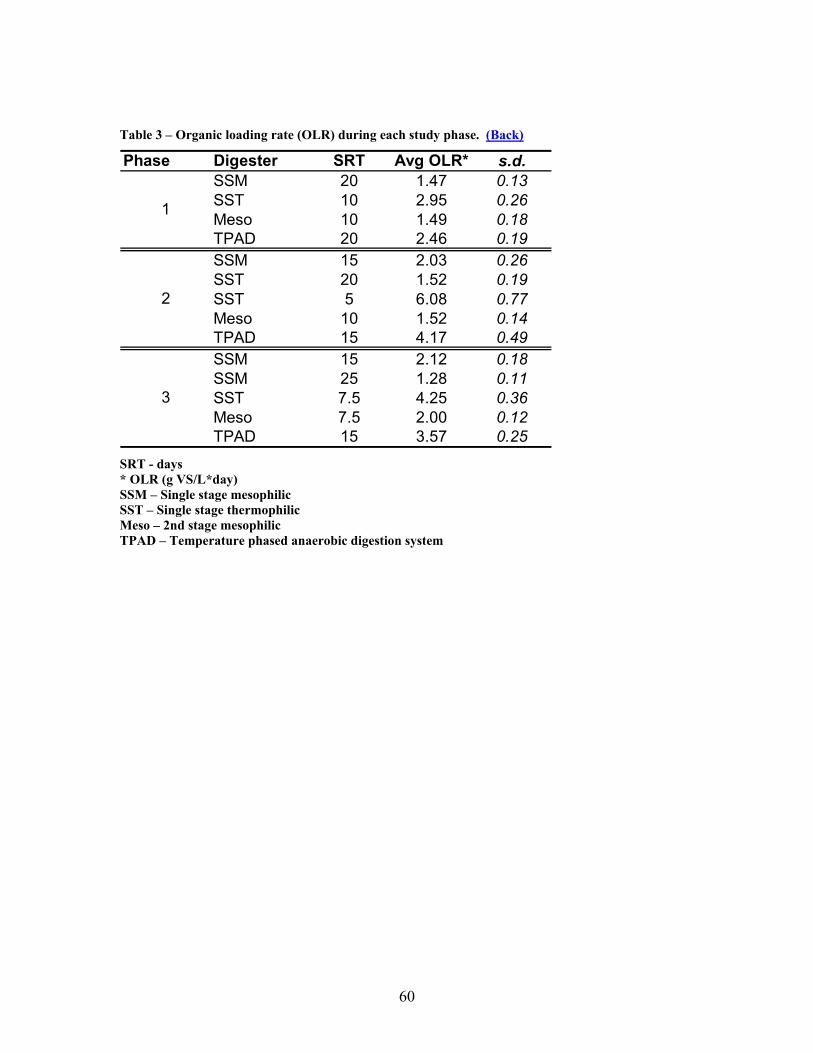
Table 3 – Organic loading rate (OLR) during each study phase. (Back)
Phase Digester SRT Avg OLR* s.d.SSM 20 1.47 0.13SST 10 2.95 0.26Meso 10 1.49 0.18TPAD 20 2.46 0.19SSM 15 2.03 0.26SST 20 1.52 0.19SST 5 6.08 0.77Meso 10 1.52 0.14TPAD 15 4.17 0.49SSM 15 2.12 0.18SSM 25 1.28 0.11SST 7.5 4.25 0.36Meso 7.5 2.00 0.12TPAD 15 3.57 0.25
1
2
3
SRT - days * OLR (g VS/L*day) SSM – Single stage mesophilic SST – Single stage thermophilic Meso – 2nd stage mesophilic TPAD – Temperature phased anaerobic digestion system
60
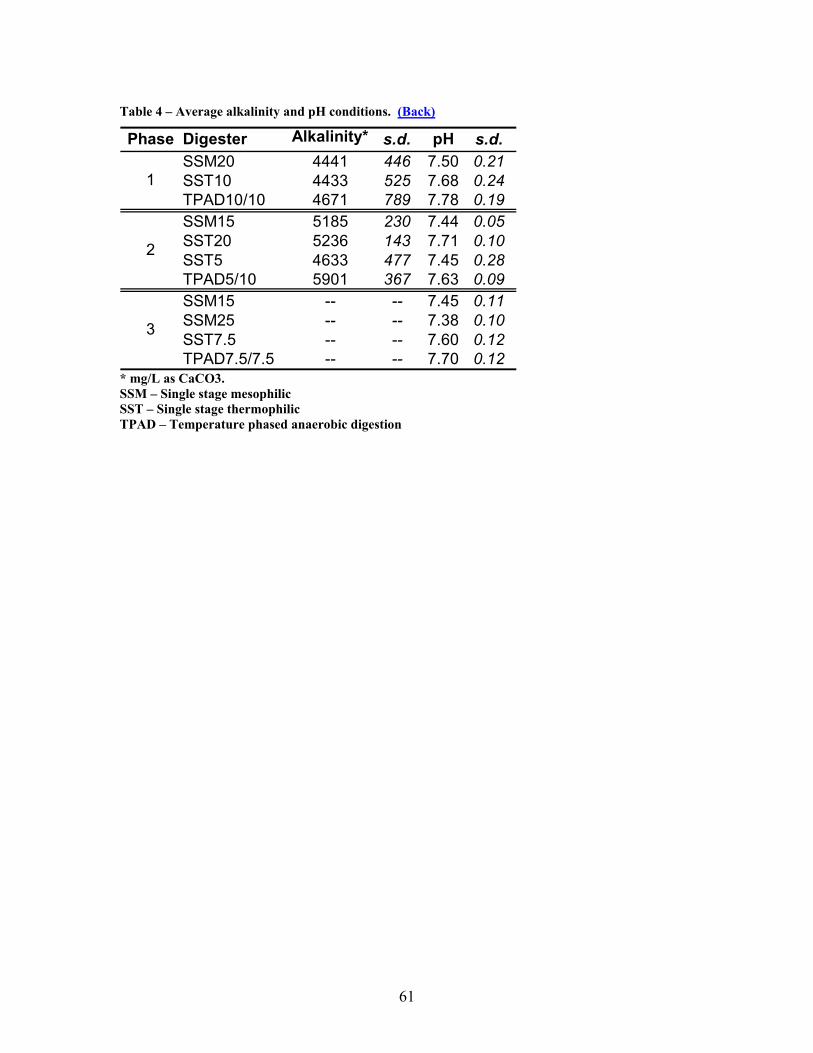
Table 4 – Average alkalinity and pH conditions. (Back)
Phase Digester Alkalinity* s.d. pH s.d.SSM20 4441 446 7.50 0.21SST10 4433 525 7.68 0.24TPAD10/10 4671 789 7.78 0.19SSM15 5185 230 7.44 0.05SST20 5236 143 7.71 0.10SST5 4633 477 7.45 0.28TPAD5/10 5901 367 7.63 0.09SSM15 -- -- 7.45 0.11SSM25 -- -- 7.38 0.10SST7.5 -- -- 7.60 0.12TPAD7.5/7.5 -- -- 7.70 0.12
1
2
3
* mg/L as CaCO3. SSM – Single stage mesophilic SST – Single stage thermophilic TPAD – Temperature phased anaerobic digestion
61
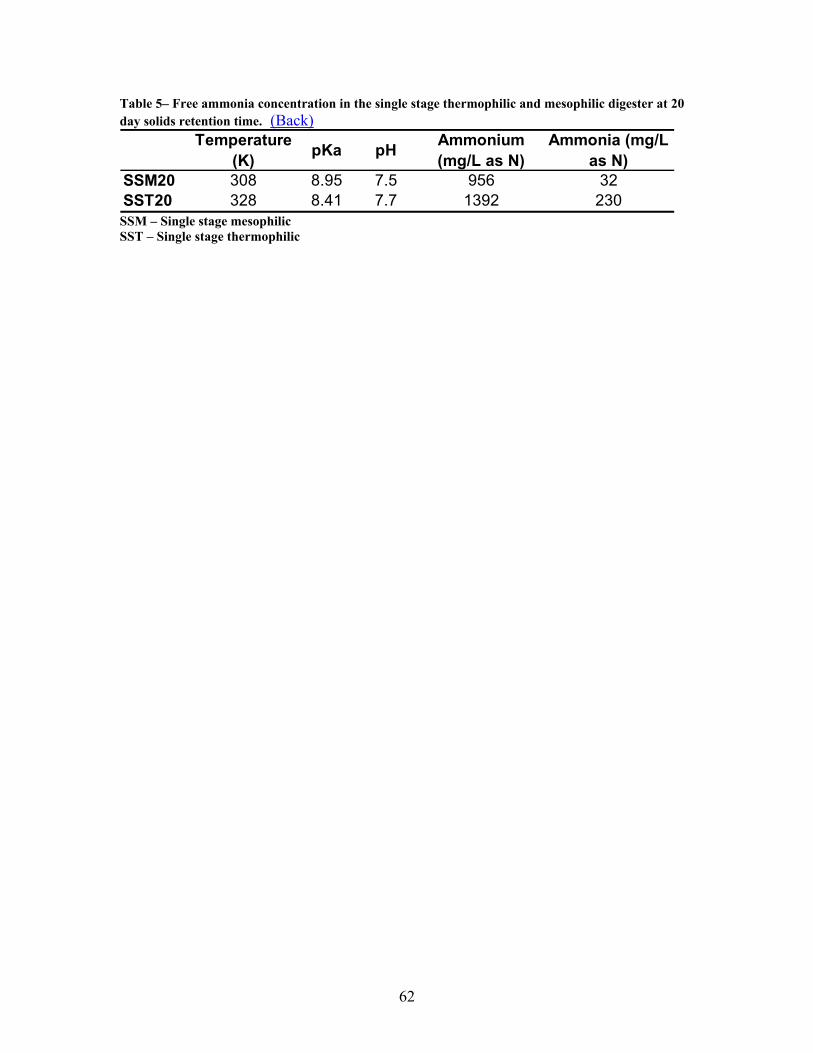
Table 5– Free ammonia concentration in the single stage thermophilic and mesophilic digester at 20 day solids retention time. (Back)
Temperature (K) pKa pH Ammonium
(mg/L as N)Ammonia (mg/L
as N)SSM20 308 8.95 7.5 956 32SST20 328 8.41 7.7 1392 230
SSM – Single stage mesophilic SST – Single stage thermophilic
62
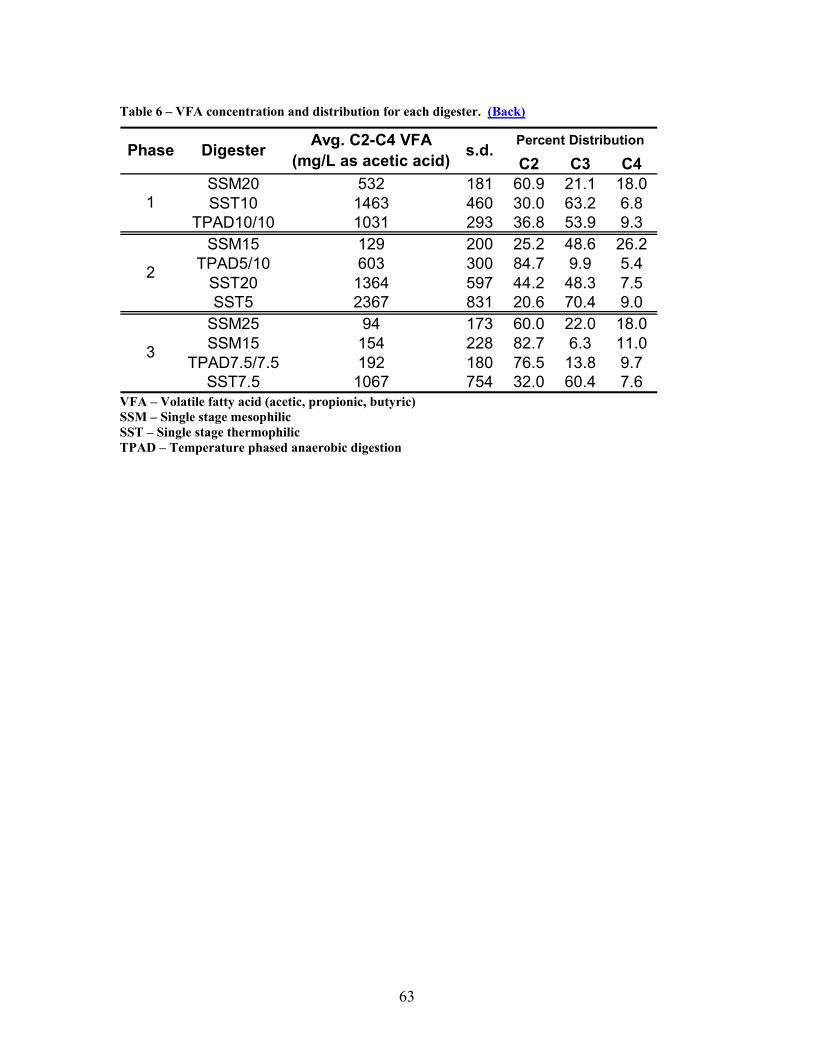
Table 6 – VFA concentration and distribution for each digester. (Back)
C2 C3 C4SSM20 532 181 60.9 21.1 18.0SST10 1463 460 30.0 63.2 6.8
TPAD10/10 1031 293 36.8 53.9 9.3SSM15 129 200 25.2 48.6 26.2
TPAD5/10 603 300 84.7 9.9 5.4SST20 1364 597 44.2 48.3 7.5SST5 2367 831 20.6 70.4 9.0
SSM25 94 173 60.0 22.0 18.0SSM15 154 228 82.7 6.3 11.0
TPAD7.5/7.5 192 180 76.5 13.8 9.7SST7.5 1067 754 32.0 60.4 7.6
3
2
1
Percent DistributionAvg. C2-C4 VFA (mg/L as acetic acid)DigesterPhase s.d.
VFA – Volatile fatty acid (acetic, propionic, butyric) SSM – Single stage mesophilic SST – Single stage thermophilic TPAD – Temperature phased anaerobic digestion
63
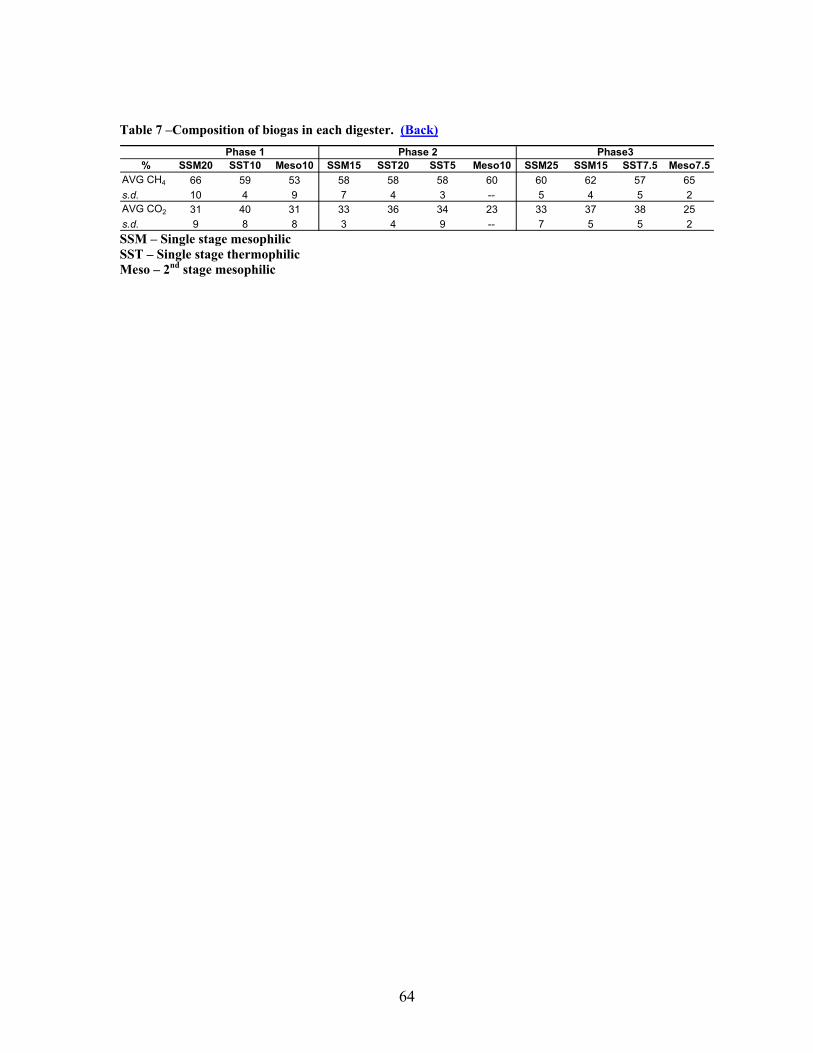
Table 7 –Composition of biogas in each digester. (Back)
% SSM20 SST10 Meso10 SSM15 SST20 SST5 Meso10 SSM25 SSM15 SST7.5 Meso7.5AVG CH4 66 59 53 58 58 58 60 60 62 57 65s.d. 10 4 9 7 4 3 -- 5 4 5 2AVG CO2 31 40 31 33 36 34 23 33 37 38 25s.d. 9 8 8 3 4 9 -- 7 5 5 2
Phase 1 Phase 2 Phase3
SSM – Single stage mesophilic SST – Single stage thermophilic Meso – 2nd stage mesophilic
64
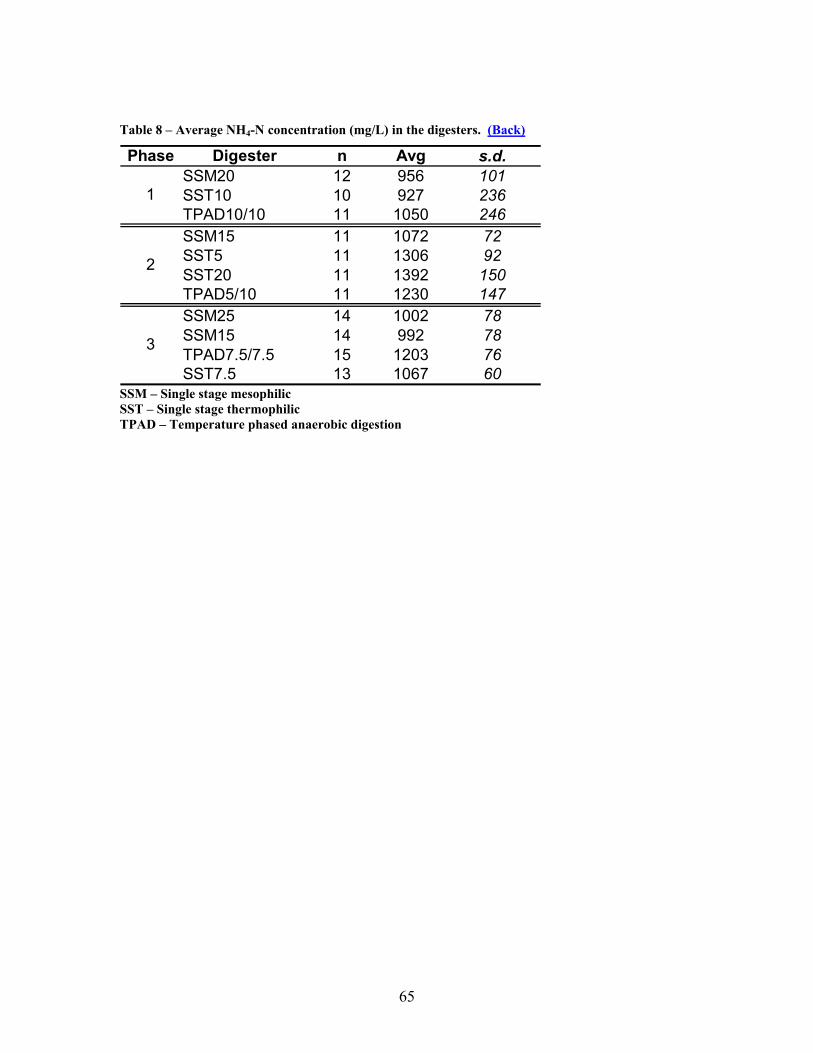
Table 8 – Average NH4-N concentration (mg/L) in the digesters. (Back)
Phase Digester n Avg s.d.SSM20 12 956 101SST10 10 927 236TPAD10/10 11 1050 246SSM15 11 1072 72SST5 11 1306 92SST20 11 1392 150TPAD5/10 11 1230 147SSM25 14 1002 78SSM15 14 992 78TPAD7.5/7.5 15 1203 76SST7.5 13 1067 60
1
2
3
SSM – Single stage mesophilic SST – Single stage thermophilic TPAD – Temperature phased anaerobic digestion
65
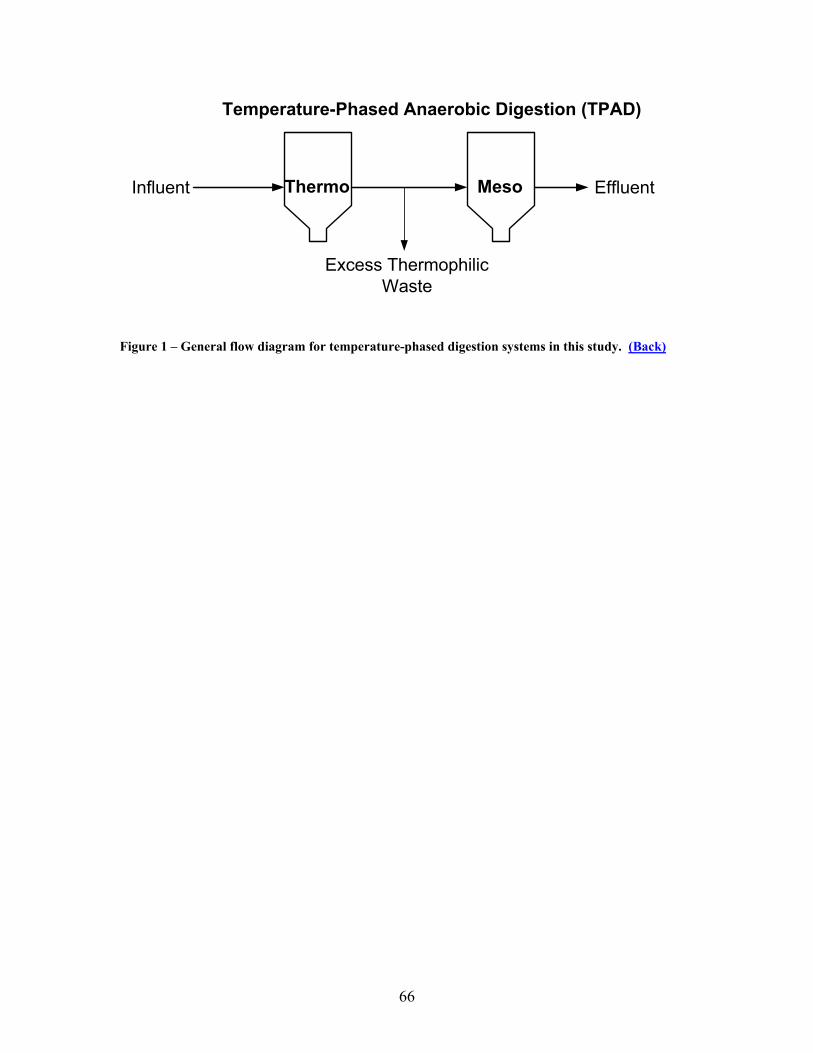
Temperature-Phased Anaerobic Digestion (TPAD)
Thermo Meso
Excess ThermophilicWaste
Influent Effluent
Figure 1 – General flow diagram for temperature-phased digestion systems in this study. (Back)
66

TedlarBag
Water Trap(Optional)
VariableSpeed
PeristalticPump
Headspace
Figure 2 – Gas recirculation diagram for experimental setup. Water trap was utilized on the thermophilic reactor to prevent condensation from accumulating in the gas lines. (Back)
67
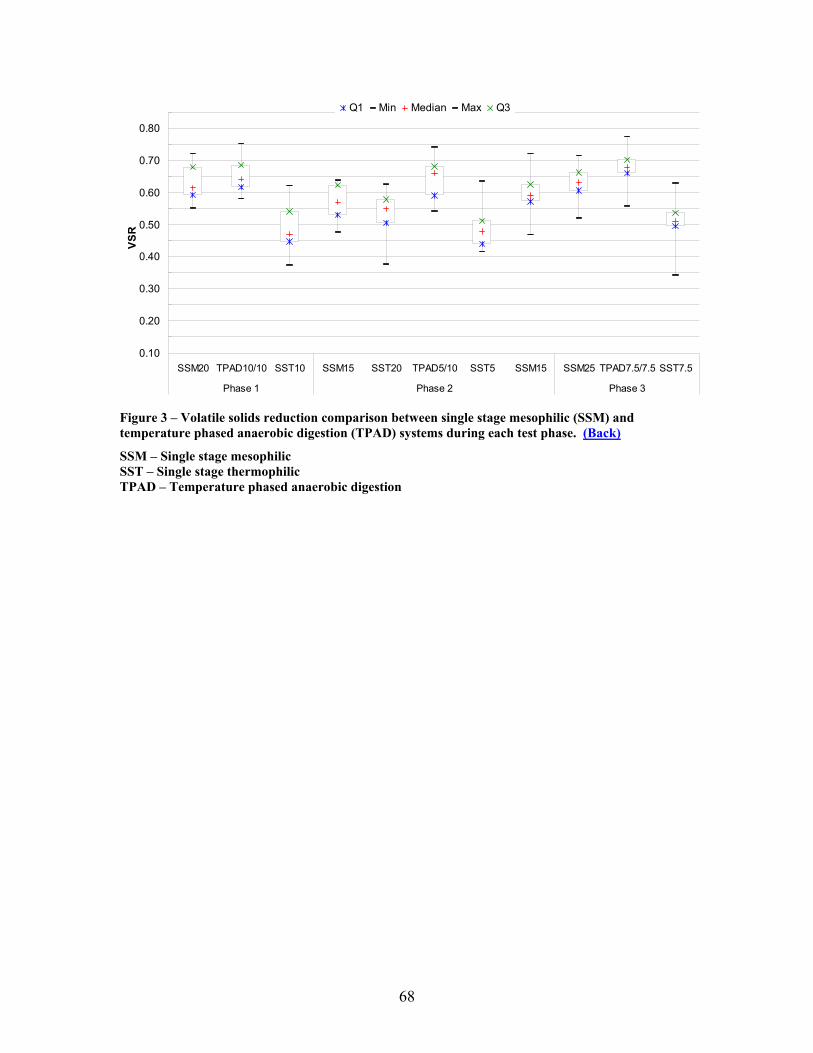
0.10
0.20
0.30
0.40
0.50
0.60
0.70
0.80
SSM20 TPAD10/10 SST10 SSM15 SST20 TPAD5/10 SST5 SSM15 SSM25 TPAD7.5/7.5 SST7.5
Phase 1 Phase 2 Phase 3
VSR
Q1 Min Median Max Q3
Figure 3 – Volatile solids reduction comparison between single stage mesophilic (SSM) and temperature phased anaerobic digestion (TPAD) systems during each test phase. (Back)
SSM – Single stage mesophilic SST – Single stage thermophilic TPAD – Temperature phased anaerobic digestion
68
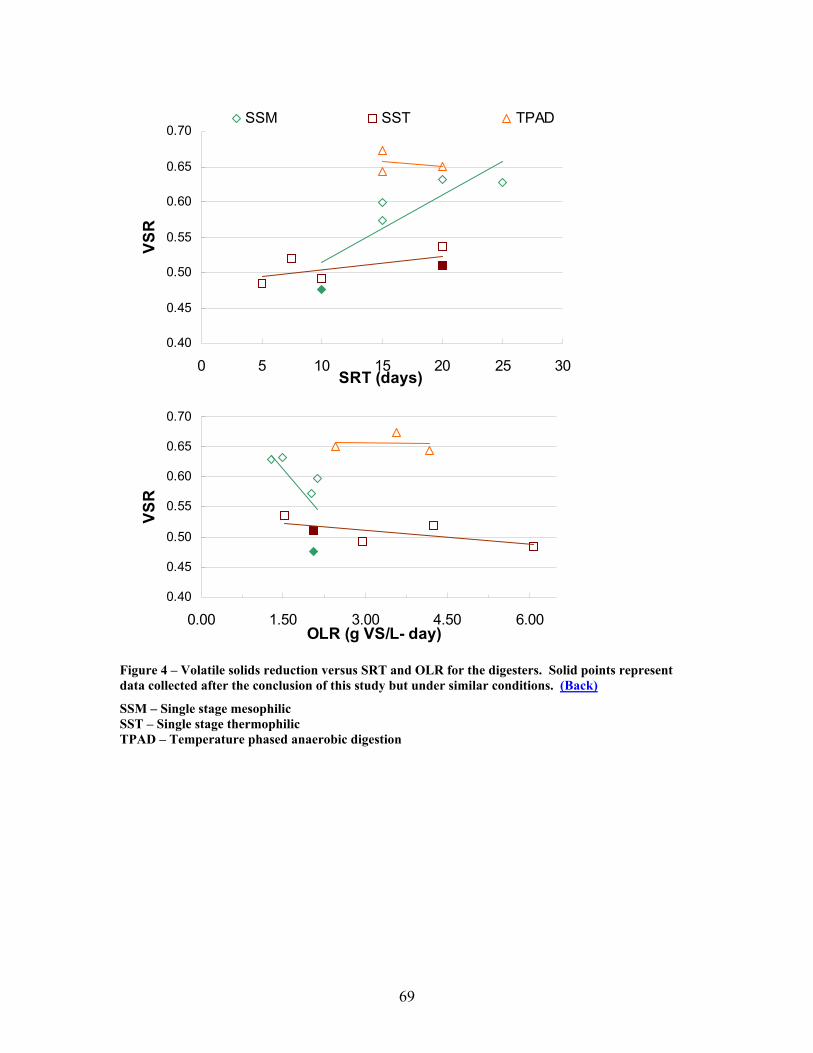
0.40
0.45
0.50
0.55
0.60
0.65
0.70
0 5 10 15 20 25 30SRT (days)
VSR
SSM SST TPAD
0.40
0.45
0.50
0.55
0.60
0.65
0.70
0.00 1.50 3.00 4.50 6.00OLR (g VS/L- day)
VSR
Figure 4 – Volatile solids reduction versus SRT and OLR for the digesters. Solid points represent data collected after the conclusion of this study but under similar conditions. (Back)
SSM – Single stage mesophilic SST – Single stage thermophilic TPAD – Temperature phased anaerobic digestion
69
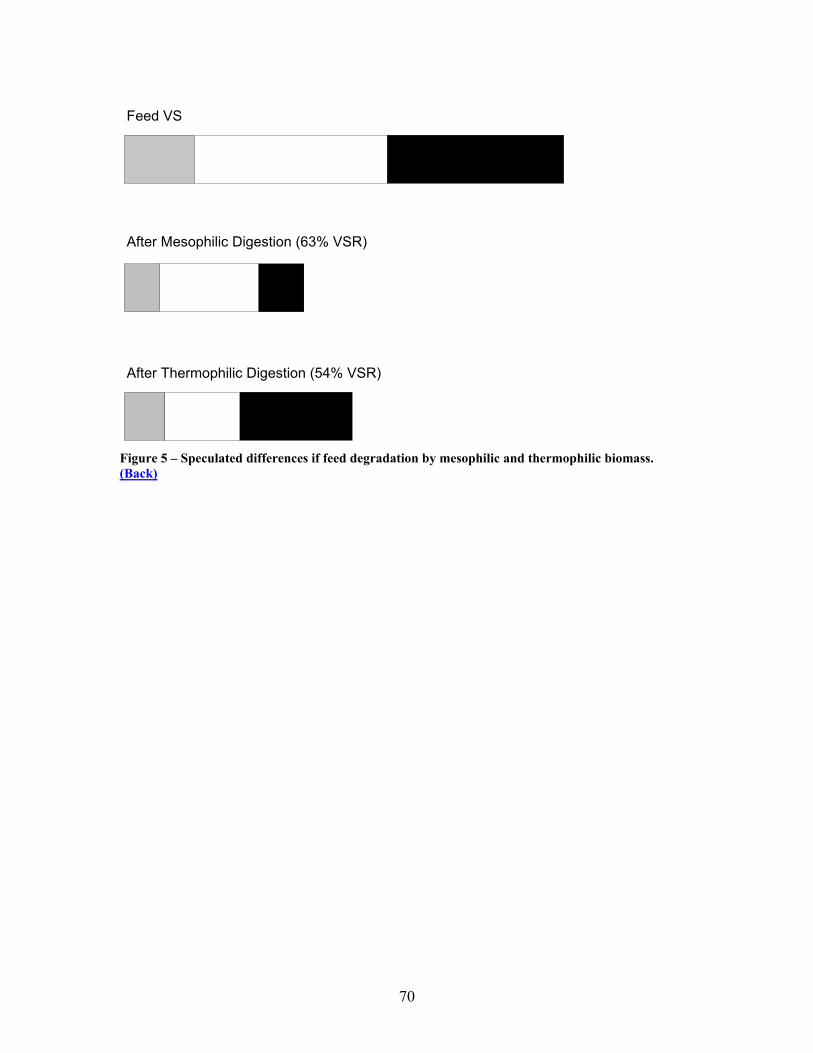
Feed VS
After Mesophilic Digestion (63% VSR)
After Thermophilic Digestion (54% VSR)
Figure 5 – Speculated differences if feed degradation by mesophilic and thermophilic biomass. (Back)
70
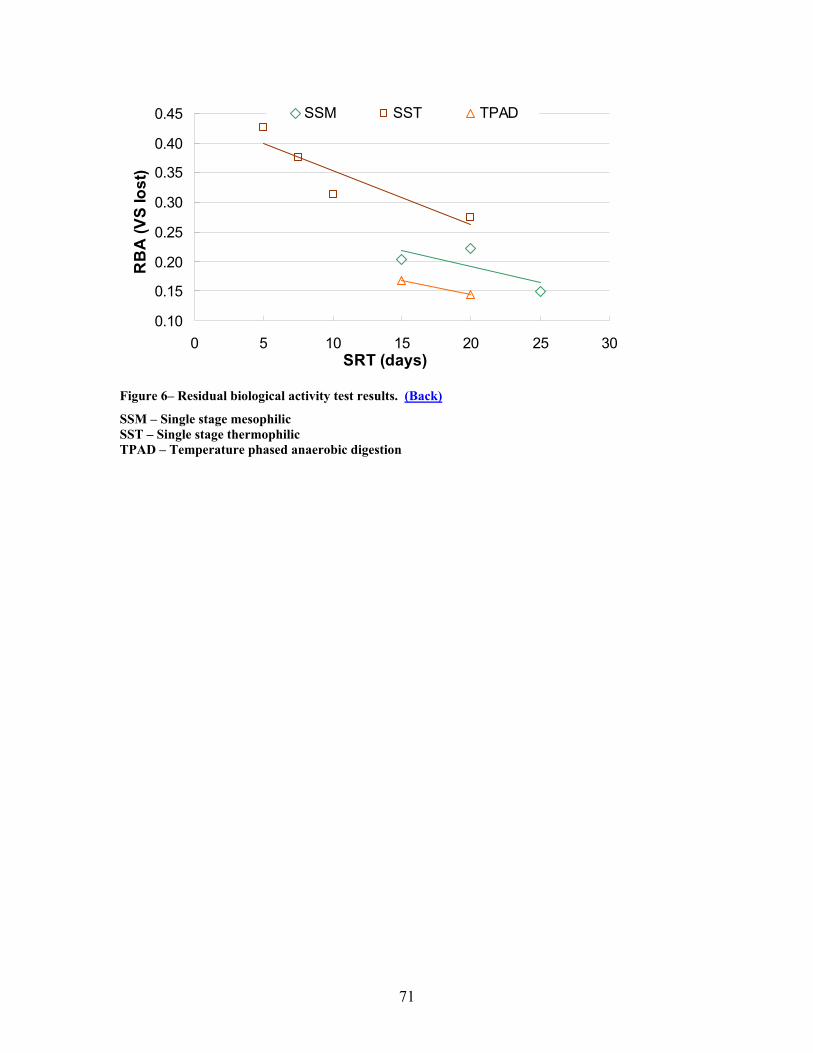
0.10
0.15
0.20
0.25
0.30
0.35
0.40
0.45
0 5 10 15 20 25 30SRT (days)
RB
A (V
S lo
st)
SSM SST TPAD
Figure 6– Residual biological activity test results. (Back)
SSM – Single stage mesophilic SST – Single stage thermophilic TPAD – Temperature phased anaerobic digestion
71
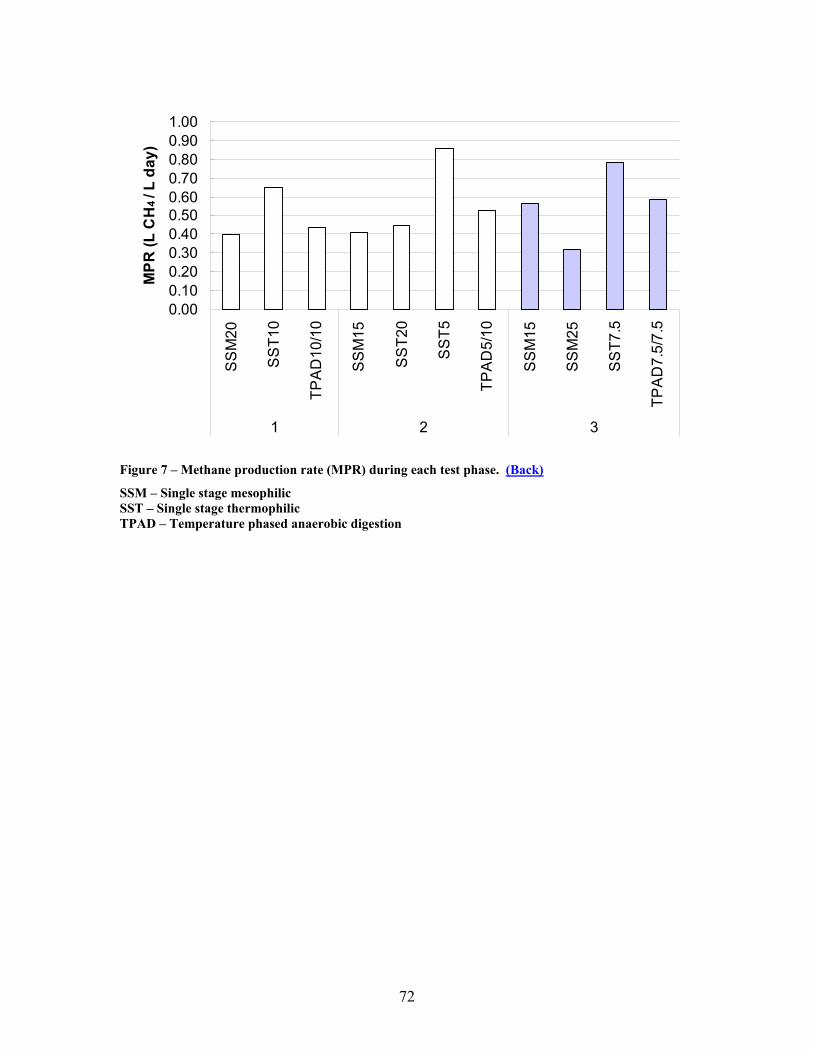
0.000.100.200.300.400.500.600.700.800.901.00
SS
M20
SS
T10
TPA
D10
/10
SS
M15
SS
T20
SS
T5
TPA
D5/
10
SS
M15
SS
M25
SS
T7.5
TPA
D7.
5/7.
5
1 2 3
MPR
(L C
H4
/ L d
ay)
Figure 7 – Methane production rate (MPR) during each test phase. (Back)
SSM – Single stage mesophilic SST – Single stage thermophilic TPAD – Temperature phased anaerobic digestion
72
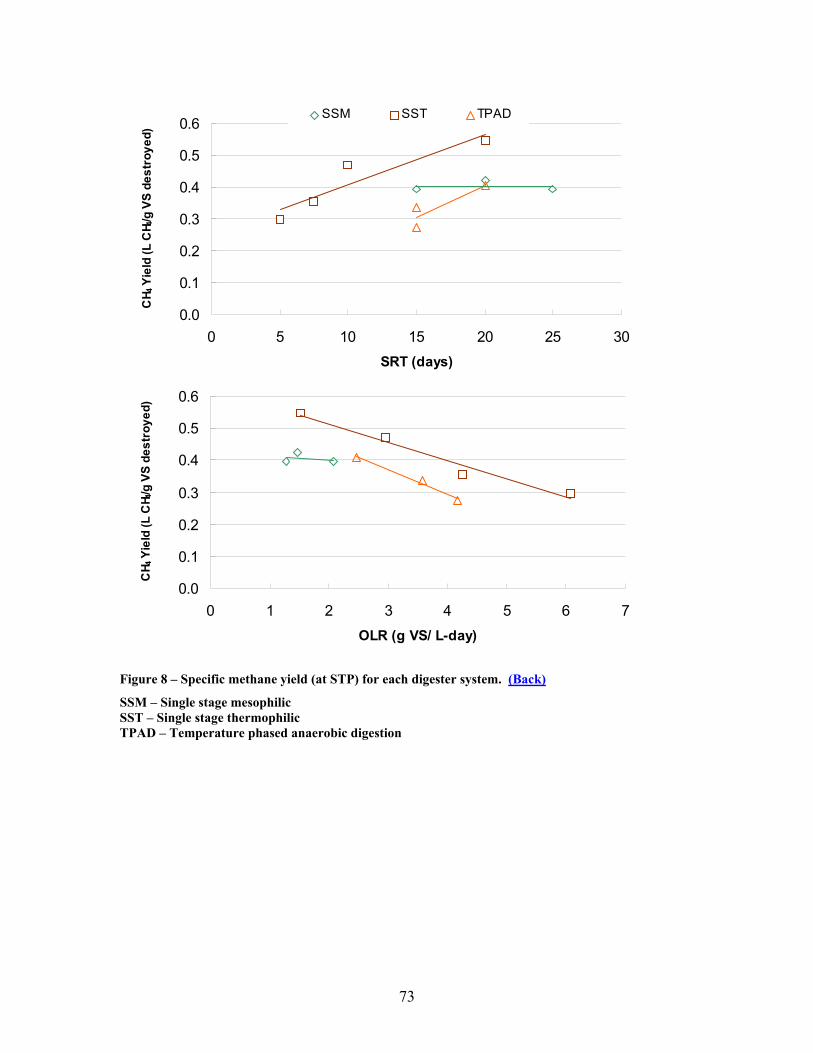
0.0
0.1
0.2
0.3
0.4
0.5
0.6
0 5 10 15 20 25 30SRT (days)
CH 4
Yie
ld (L
CH 4
/g V
S de
stro
yed)
SSM SST TPAD
0.0
0.1
0.2
0.3
0.4
0.5
0.6
0 1 2 3 4 5 6 7OLR (g VS/ L-day)
CH 4
Yie
ld (L
CH 4
/g V
S de
stro
yed)
Figure 8 – Specific methane yield (at STP) for each digester system. (Back)
SSM – Single stage mesophilic SST – Single stage thermophilic TPAD – Temperature phased anaerobic digestion
73
74
Vita
David Inman was born on March 28, 1976, in Wichita Falls, TX. Graduating in
1994 from Tishomingo High School, Tishomingo, OK, he then attended the United States
Naval Academy, Annapolis, MD, from 1994 to 1996. He graduated from Salisbury
University, Salisbury, MD, with a B.S. in Environmental Health Science in December
1998.
His professional experience includes working for Perdue Farms Incorporated, a
Mid-Atlantic agribusiness, as an Environmental Manager from 1999 to 2002. Job duties
in this position included monitoring permit compliance at several of the company’s
processing and support facilities. The experience with wastewater treatment and
biological nutrient removal at Perdue Farms led him to begin pursuing an Environmental
Engineering degree at Virginia Tech in August 2002. Currently, he is employed as a
Project Engineer at Anderson and Associates, Inc., Blacksburg, VA.
He and his wife, Sara, reside in Blacksburg where in his spare time he enjoys
woodworking, spending time outdoors, and reading.