Embed Size (px)
Citation preview

132The Journal of Cotton Science 20:132–144 (2016) http://journal.cotton.org, © The Cotton Foundation 2016
BREEDING AND GENETICSComparative Phenotypic Analysis of Gossypium raimondii with Upland Cotton
Hee Jin Kim*, Yongliang Liu, Michael K. Dowd, James Frelichowski, Christopher D. Delhom, James E. Rodgers, Devron P. Thibodeaux
H.J. Kim* Cotton Fiber Bioscience Research Unit, USDA-ARS-SRRC, 1100 Robert E. Lee Blvd., New Orleans, LA 70124; Y. Liu, C.D. Delhom and J.E. Rodgers, Cotton Structure and Quality Research Unit, USDA-ARS-SRRC, 1100 Robert E. Lee Blvd., New Orleans, LA 70124; M.K. Dowd, Commodity Utilization Research Unit, USDA-ARS-SRRC, Robert E. Lee Blvd., New Orleans, LA 70124; J. Frelichowski, Crop Germplasm Research Unit, USDA-ARS-SPARC, 2881 F&B Rd., College Station, TX 77845; and D.P. Thibodeaux, Fiber Physics, 103 Longview Court, Pickens, SC 29671 Corresponding author: [email protected]
ABSTRACT
Gossypium raimondii Ulbrich, a wild diploid spe-cies of cotton, was sequenced due to its small genome size and similarity with the cultivated allotetraploid Upland cotton. The D-genome of G. raimondii has become the reference sequence used extensively in cotton genomic and genetic studies. However, phenotypic information is limited because photope-riodicity prevents flowering outside its native envi-ronment and its fiber quality cannot be measured by conventional methods. Fiber and seed properties of G. raimondii were measured and compared with those of Upland cotton cultivars. Fiber length, fine-ness, cellulose content, and seed lint percentage were all significantly reduced in G. raimondii compared to Upland cotton, whereas fiber maturities were comparable. Spectophotometric properties of G. raimondii fibers were similar to green Upland cotton fibers but differed from white and brown Upland fibers. Seed kernels of G. raimondii were smaller but their chemical compositions were similar to those of Upland cotton. Quantitative traits of G. raimondii will aid in interpreting its genome and accelerating comparative genomics approaches for identifying potential genes regulating fiber and kernel proper-ties among Gossypium species.
Cotton is an important source of textile fiber, animal feed, and food-grade vegetable oil
(Wakelyn et al., 2010). Greater than 90% of the world’s cotton production is derived from Gossypium
hirsutum L, known as Upland cotton, due to its high yield and generally good fiber properties (Zhang et al., 2008). The remaining cotton supply is produced from the closely related G. barbadense L., G. arboretum L., and G. herbaceum L. species.
The Gossypium genus includes approximately 35 species, including more than 30 species with diploid (n = 13) genetics designated by classes A, B, C, D, E, F, G, and K (based on chromosome pairing relation-ships) and five species with polyploidy genetics (n = 26) designated as AD1 to AD5. Diploid Gossypium spp. with A and D genomes and the polyploid Upland cotton with the AD1 genome have been used to study plant genome size evolution and plant polyploidiza-tion (Adams, 2003; Chaudhary et al., 2009; Hovav et al., 2008; Senchina, 2003). Among the diploid species, G. raimondii Ulbrich (D5 genome) is a wild Peruvian species that is cytologically, morphologi-cally, and phenogenetically similar to Upland cot-ton plants (Endrizzi et al., 1985; Hutchinson et al., 1947; Wendel et al., 1989). G. raimondii is believed to have served as the pollen parent for the allotet-raploid Upland cotton (Fig. 1). G. herbaceum (A1) and G. arboreum (A2) are the closest relatives to the maternal parent of Upland cotton (Applequist et al., 2001; Wendel and Cronn, 2003).
Figure 1. Polyploidization of G. hirsutum or Upland cotton (AD1) from diploid cotton species, with G. raimondii (D5) as the pollen parent, and G. herbaceum (A1) or G. arbo-reum (A2) as the maternal parent.
Because of the relatively large size of the G. ar-boreum (1745 Mbp) and Upland cotton (2400 Mbp) genomes, the G. raimondii genome (885 Mb) was the first cotton species to be sequenced. Monsanto and Illumina deposited raw sequences of the species into Genbank (www.ncbi.nlm.nih.gov/sra/SRP003645) in 2010. The D-genome draft sequence (Wang et al., 2012) and the D-genome reference sequence (Paterson et al., 2012) were later sequenced from G. raimondii

133KIM ET AL.: PHENOTYPIC ANALYSIS OF GOSSYPIUM RAIMONDII
and assembled. Several other draft genomes have been reported recently from cultivated cotton species: G. arboreum (Li et al., 2014), Upland cotton (Li et al., 2015; Zhang et al., 2015), and G. barbadense (Liu et al., 2015). However, the G. raimondii reference sequence, which represents approximately 99% of the D-genome (Paterson et al., 2012), has been used widely to identify candidate genes for Upland cotton genetic improvement (Fang et al., 2013; Gore et al., 2014; Islam et al., 2014), to determine transcriptome profiles of Upland cotton varieties (Gilbert et al., 2014; Kim et al., 2013; Naoumkina et al., 2014), and to gain insight into the genomes of cultivated species (Jin et al., 2013; Li et al., 2014; Olsen and Wendel, 2013; Page et al., 2013; Yoo and Wendel, 2014).
Phenotypic data have been crucial for deciphering genomic information and identifying candidate genes responsible for fiber quality (Islam et al., 2016; Kim et al., 2013). Conventional methods using High Volume Instrument (HVI) and Advanced Fiber Information System (AFIS) instruments generally have been used to determine indirectly cotton fiber properties for clas-sifying commercial value of cotton, evaluating fiber quality, and performing genetic and genomic research. Advanced and innovative techniques also are available to determine directly quantitative traits of cotton fibers that are botanically unicellular trichomes elongating from epidemical cells of cotton ovules (Kim, 2015; Kim and Triplett, 2001). However, G. ramondii fibers described as tightly bound or non-spinnable (Fryxell, 2000; Paterson et al., 2012; Saunders, 1961) have not been characterized by conventional methods or advanced techniques. Among major fiber properties of G. ramondii such as length, maturity, fineness, and cellulose content, the short fiber lengths (~10 mm) were reported frequently (Applequist et al., 2001; Boza and Madoo, 1941; Hutchinson et al., 1947; Li et al., 2014). Other properties have not been reported because they are below the detection limit of the conventional meth-ods. Hutchinson et al. (1947) reported G. raimondii from northern Peru had seeds of a greenish color that were covered with hairs. In naturally colored Upland cotton, green and brown colors are caused by suberin and proanthocyanidin, respectively (Ryser et al., 1983; Xiao et al., 2014). In green lint of an Upland cotton va-riety, suberin is associated with wax that is localized in the secondary cell wall and generates florescence (Ryser et al., 1983). The natural green color is not stable and fades to brown when exposed to light (Dickerson et al., 1999). The color pigments in the naturally colored Upland cotton can be characterized by near-infrared
(NIR) spectroscopy (Conard and Neely, 1943; Dick-erson et al., 1999; Elesini et al., 2002; Pan et al., 2010; Xiao et al., 2014), whereas those in G. raimondii fibers have yet to be identified. Among seed kernel proper-ties, gossypol containing insecticidal and antimicrobial activities was measured previously from G. raimondii seeds (Benbouza et al., 2002; Stipanovic et al., 2005), but other major properties including sugar, protein, and fatty acid profiles have not been characterized.
In this paper, we determined quantitative traits of G. raimondii fibers and seeds and compared their phenotypes with Upland cotton varieties. We grew G. ramondii and Upland cotton at three locations that differed in geographical and environmental conditions. Fiber properties from non-spinnable G. raimondii and spinnable Upland cotton Texas Marker-1 (TM-1) were compared by advanced instrumental techniques (Kim et al., 2014; Liu and Kim, 2015; Liu et al., 1998) as well as other methods, including image analysis microscopy, cellulose chemical analysis, and gravimetric methods (Kim, 2015). Seed kernel properties were measured by chemical analyses, including nitrogen analyzer, gas chromatography (GC), and high-performance liquid chromatography (HPLC). The results showed that G. raimondii was a naturally green-colored cotton contain-ing suberin. G. raimondii fibers have a lower cellulose content and were significantly shorter and finer than Upland cotton fibers composed of higher cellulose con-tent. Fiber maturity and seed kernel chemical profiles of G. raimondii were similar to those of the Upland cotton TM-1, despite the size differences.
MATERIALS AND METHODS
Plant Materials and Growth Conditions. Three G. raimondii accessions, D5-3 (PI530900), D5-6 (PI530903), and D5-8 (PI5309050), were grown in a 44 gallon pot (one plant per pot, two replica-tions) at greenhouses located at the National Cotton Germplasm Center (College Station, TX) during the winters of 2008 to 2010 that were naturally short-day conditions. Each plant produced on average two bolls during a winter season. The bolls became mature and opened approximately 45 d after floral anthesis. These plants were used for leaf and seedling charac-terization and for fiber trait tests. To obtain sufficient G. raimondii seeds for the tests, three G. raimondii plants (D5-31, PI 530928) were grown perennially in the ground at the Cotton Winter Nursery (Kothari et al., 2011) at Tecoman, Colima, Mexico during the 2011 to 2013 seasons. The plants grew 8 ft tall

134JOURNAL OF COTTON SCIENCE, Volume 20, Issue 2, 2016
and 8 ft wide and produced 400 bolls (340 g) in the second winter season that were naturally short-day conditions. Fiber samples were manually collected from G. raimondii seeds that were harvested at the two locations. Upland cotton varieties TM-1 (Texas Marker-1, PI 607172), SA-1 (PI 528418), and SA-481 (PI 528787) as well as the three G. raimondii acces-sions (D5-3, D5-6, and D5-8) were grown side by side in 5-gal pots (one plant per pot, three replications) with Metro-Mix 350 soil at the greenhouses located at the Southern Regional Research Center (New Orleans, LA) during the winters of 2008 to 2009 that were naturally neutral-day conditions. TM-1 has been a standard variety for cotton genetics analyses (Kohel et al., 1970). The SA-1 and SA-481 varieties were included as representative examples of brown and green cotton fiber types, respectively.
Fiber Length. Fiber lengths of both G. raimon-dii and Upland cotton were measured as described by Schubert et al. (1973). After dispersing the seed in warm acidic water, the relaxed fibers at the cha-lazal end of the seed were measured to the nearest 0.01 mm with a digital caliper. Thirty seeds were measured to determine an average value.
Single-Seed Weight, Fiber Weight, and Lint Percentage. Fibers from the Upland cotton TM-1 va-riety were ginned with a laboratory roller gin; hence, linters were not included with the lint. G. raimondii fibers were removed by hand with tweezers. Single seed and fiber weights were calculated based on 30 seed samples, with each seed type analyzed in triplicate. Lint percentage was calculated from the triple measurements by dividing the lint weight by the initial seed cotton weight.
Fiber Maturity Determination by Image Analysis Microscopy. Approximately 300 mg of fibers were manually ginned from 200 seeds from G. raimondii and 10 seeds from TM-1 that were randomly selected. The fiber samples were mixed, combed, and used to make multiple fiber bundles composed of several thousand individual fibers. They were embedded, thin-section cut, and pho-tographed using a light microscope. Average wall area excluding lumen (A) and perimeter (P) of the fiber cross sections were measured from 300 cross sections using image analysis software (Xu and Huang, 2004). Circularity representing the degree of fiber cell wall thickness was obtained from the equation, θ = 4πA/P2, and the maturity ratio (MR) was converted from circularity by the equation, MR
= θ/0.577 (Thibodeaux and Rajasekarn, 1999).
Cottonscope Measurements. Fiber fineness, MR, and ribbon width were measured with the Cottonscope software version 1.54 (Cottonscope Pty Ltd, Perth, Aus-tralia) according to the procedure described by Rodgers et al. (2013). Five hundred G. raimondii seeds and 20 TM-1 seeds were used to collect 500 mg of fibers from each cotton species. The ginned fibers were first equilibrated at 65 ± 2 % relative humidity and 21 ± 1
°C for a minimum of 24 h. G. raimondii and Upland cotton fiber samples were chopped into segments (i.e., snippets) with a knife-blade cutter. The snippets (50 mg mass, approximately 0.7 mm length) were then placed in a water bowl where they were dispersed by agitation. The snippet population was digitally measured with a polarized color camera. Birefringence was used to esti-mate maturity, whereas length and width of the snippet population were used to measure fineness and ribbon width. Approximately 20,000 snippets were counted in each loading. Each replicate instrument loading was measured twice and the results were averaged to give a value for the sample. Two to three instrument loadings were evaluated for each sample.
Gravimetric Fineness. Fiber fineness was mea-sured as mass-per-unit length and reported as millitex (mtex = milligrams per kilometer of fiber length) (ASTM, 2012a). Upland cotton fibers were combed into a parallel tuft and then trimmed from the top and bottom to leave 15 mm of length. G. raimondii fiber samples were prepared using a comb-sorter (ASTM, 2012b) to isolate fibers of a known average length of 14.3 mm. Three hundred fibers were counted and weighed with a microbalance. Each sample was replicated three times.
Cellulose Content. Fiber cellulose content was measured as described by Updegraff (1969) with mi-nor modifications. Dried fiber samples were cut into small pieces. Ten milligrams of each sample were added to a 5 ml heavy-walled glass vial. Noncellulos-ic material was hydrolyzed with a solution of acetic and nitric acids. The cellulose was then hydrolyzed with sulfuric acid and measured by colorimetric as-say with anthrone. Avicel PH-101 (FMC, Rockland, ME) was used as a cellulose standard. Each sample was measured three times. Average cellulose content was calculated from two replications.
NIR and Fourier Transform Infrared (FTIR) Spectral Measurements. A Foss XDS rapid content analyzer (Foss NIR Systems Inc., Laurel, MD) was used to acquire visible and NIR reflectance spectra of the fibers. Each sample was pressed into a sample round in a cylindrical cell (3.8-cm diameter x 1-cm
135KIM ET AL.: PHENOTYPIC ANALYSIS OF GOSSYPIUM RAIMONDII
were transesterified with Methanolic base (Supelco, Belefonte, PA), and the resulting methyl esters were separated and detected by gas chromatography. All analyses were conducted in duplicate. Full details of these methods can be found in a prior report (Pet-tigrew and Dowd, 2011).
Statistical Analyses. Statistical analyses and construction of graphs were performed using t-test, two-way ANOVA, and Prism version 5 software (Graph-Pad Software, Inc., San Diego, CA). Paired comparisons were conducted by the Tukey method with p < 0.05. For the cellulose analyses, the dif-ferences between individual plants of the same ac-cession were minor; hence, the individual plant and replicate samples were combined and the analysis was conducted with the pooled dataset.
RESULTS AND DISCUSSION
Plant Characteristics. G. raimondii consists of creamy flowers similar to those commonly found in Upland cotton (Fig. 2). Unlike most Upland cotton genotypes, the bottom parts of petals from G. rai-mondii have a large deep-red petal spot. G. raimondii leaves on the sympodial branch are cordate (heart shaped) unlike the corresponding Upland cotton leaves, which are palmate (hand-like) with three to five lobes. Both G. raimondii and Upland cotton seed capsules (i.e., bolls) contain three to five locules, each containing up to several seeds. A comparison between pre-ginned and ginned seeds showed short fibers extending from the surface of the G. raimon-dii seeds (Fig. 2). On average, G. raimondii seed weighed approximately one-third of Upland cotton seed (Table 1), and the fiber yield per seed from the D5-31 accession seed was 3 mg compared to 71.5 mg for Upland cotton seed (Table 1). This gives a fiber-to-seed ratio of 1:12.0 for the D5-31 seed com-pared to a ratio of 1:1.8 for the TM-1 seed. Typical cotton fiber-to-seed ratios are approximately 1:1.7 (Tharp, 1948), although this number has varied in recent years and ratios as low as 1:1.5 are common.
thick). Log (1/Reflectance) readings were obtained over a 400 to 2500 nm range at 0.5-nm intervals. Thirty-two scans were recorded for each spectrum. Three spectra were obtained for each sample by re-packing the samples and these spectra were averaged.
Attenuated total reflection Fourier transform infrared (ATR-FTIR) spectra were collected in absorbance units with an FTS model 3000MX spectrometer (Varian Instruments, Randolph, MA) equipped with a ceramic source, a KBr beam splitter, and a deuterated triglycine sulfate detector. The ATR sampling device utilized a DuraSamplIR single-pass diamond-coated internal reflection accessory (Smiths Detection, Danbury, CT), and consistent contact pressure was applied by a stainless steel rod and an electronic load display. Ten spectra were collected for each sample over the range of 4000 to 600 cm-1 at a 4-cm-1 resolution with 16 co-added scans. Their average was taken as the spectra for the sample. Spectra were imported to Grams/AI software (Version 9.1, Thermo Fisher Scientific, Waltham, MA) and were smoothed with a Savitzky–Golay function (polynomial = 2; points = 11). The dataset was then loaded into Microsoft Excel to calculate the MR from a previously reported algorithm (Liu et al., 2011, 2012).
Microscope Imaging. Images of glands on leaves and seeds were taken with an Olympus SZX stereomicroscope and model DP11 digital camera. Image composites were constructed with Adobe Photoshop CS6 software.
Seed Kernel Analyses. Seeds of G. raimondii and Upland cotton were dehulled by a brief milling in a Waring blender and the hull and kernels pieces were separated using a series of screens followed by hand removal of hull fragments. The kernel pieces were then ground with a food processor to pass through a #20 sieve and freeze dried. Kernel protein was determined by combustion and measurement of the resulting nitrogen with a Leco FP-528 nitrogen analyzer (St. Joseph, MI). Oil was extracted with petroleum ether in a Foss HT-6 Soxtec apparatus (Prairie Eden, MN) and was determined gravi-metrically. Soluble carbohydrates were measured by derivatizing 50-mg samples of ground kernel tissue with hexamethyldisilazane followed by gas chromatographic separation of the silyl sugars. Isomeric and total gossypol was measured by form-ing a diastereometic complex with R-(−)-2-amino-1-propanol and the individual enantiomers were separated by reverse-phase HPLC. Oil fatty acids
Figure 2. Phenotype of G. raimondii. The photos were taken from a flower (day of anthesis, G. raimondii, D5-3), a leaf, a cotton boll, pre-ginned single seed, and ginned single seed (G. raimondii, D5-8).
136JOURNAL OF COTTON SCIENCE, Volume 20, Issue 2, 2016
Fiber Length. G. raimondii fiber length of the D5-6, D5-8, and D5-31 accessions averaged between 10.1 and 11.7 mm (Table 1). These lengths were ap-proximately one-third the length of the fibers from the TM-1 cotton variety (Fig. 3). Cotton fiber properties, including fiber length, are measured with HVI, defined as a standard method by the International Cotton Ad-visory Committee. HVI cannot be used on the small quantities of short, non-spinnable G. raimondii fibers available. Thus, fiber lengths of both G. raimondii and Upland cotton were manually measured by the method described by Schubert et al. (1973).
1947), the short fibers are lint fibers that are initiated on the day of anthesis (Applequist et al., 2001) and are different from the linter fibers that are initiated a few days post anthesis on Upland cotton seed (Lang, 1938). The G. raimondii fiber lengths grown at two different locations (College Station, TX and Tecoman, Mexico) were in good agreement with the lengths reported by others (Applequist et al., 2001; Fryxell, 2000; Hutchinson et al., 1947; Li et al., 2014) for the species.
Fiber Color. G. raimondii is naturally colored cotton (Fig. 4). IR and NIR spectral differences are known for naturally colored Upland cottons fibers, with green and brown fibers tending to show increased reflectance band intensities in the 400- to 800-nm range compared with white cotton fibers (Elesini et al., 2002; Liu et al., 1998). The reflectance band position and intensities of the D5-31 G. raimon-dii spectrum were almost identical to the spectrum for the green fibers of Upland cotton variety SA-481 (Fig. 5A). Notably, these fibers show greater log (1/R) intensities at 632 and 675 nm within the visible region (400-750 nm), a small additional band near 2312 nm, and unusual band shapes between 1700 to 1800 nm and 2340 to 2380 nm when compared to the spectra of the TM-1 (white) and SA-1 (brown) cotton fibers.
Table 1. Fiber properties of G. raimondii and Upland cotton accessions
G. raimondii Upland cotton
D5-6 D5-8 D5-31 TM-1 SA-481Z SA-1Y
Single seed wt., mg 35.9 ± 1.1 b 129.0 ± 6.6 a
Single seed lint wt., mg 3.0 ± 0.1 b 71.5 ± 10.3 a
Lint % 7.8 ± 0.2 b 35.6 ± 2.1 a
Length, mm 11.7 ± 1.0 b 11.3 ± 1.5 b 10.1 ± 0.9 c 31.1 ± 1.3 a
Gravimetric fineness, mtex 29 ± 1 e 51 ± 2 d 28 ± 1 e 170 ± 6 b 110 ± 1 c 254 ± 3 a
Fineness, mtex, by Cottonscope 73 ± 2 d 165 ± 5 b 129 ± 2 c 289 ± 7 a
MR, by image analysis 1.04 ± 0.26 a 0.92 ± 0.26 b 0.54 ± 0.33 d 0.84 ± 0.37 c
MR, by FTIR spectroscopy 0.52 ± 0.06c 0.59 ± 0.06 c 0.55 ± 0.07 c 0.70 ± 0.17 b 0.57 ± 0.07 c 0.89 ± 0.07 a
MR, by Cottonscope 1.27 ± 0.03 a 0.88 ± 0.01 b 0.60 ± 0.01 d 0.79 ± 0.01 c
Ribbon width, µm 10.5 ± 0.1 d 15.6 ± 0.01 c 16.4 ± 0.1 b 17.3 ± 0.2 a
Cellulose content, % 75 ± 2 b 78 ± 2 b 74 ± 2 b 96 ± 3 a
Water insoluble, % 96.1 ± 0.9 a 93.7 ± 0.6 a
Acetic/nitric acid insoluble, % 74 ± 2 a 96 ± 3 bZ green cotton.Y brown cotton.X means within a row followed by a different letter are significantly different by Tukey’s mean comparison test at the 5%
level.
Figure 3. Comparison of fiber length between G. raimondii (D5-6, D5-8, and D5-31) and Upland cotton TM-1 fibers (AD1). The bar represents 1 cm of length.
Although G. raimondii has been classified in literature as a lintless species (Hutchinson et al.,

137KIM ET AL.: PHENOTYPIC ANALYSIS OF GOSSYPIUM RAIMONDII
Differences in the spectral band shapes and intensi-ties can be enhanced by viewing the second-derivative spectral response. Between 2200 to 2500 nm (Fig. 5B), the second-derivative spectra for the SA-481 and D5-31 fibers were different from the spectra of the white and brown Upland cotton fibers. A new second-derivative band at 2352 nm was present, and the band at 2312 nm was more intense, whereas the band at 2271 nm decreased in intensity. These three bands are assigned to the second overtone of the C-H deformation vibration (2352 nm), a combination of C-H stretching and C-H deformation modes (2312 nm), and the combination of the O-H stretching and C-C/C-O stretching modes (2271 nm), respectively. Their intensity differences suggest that the green SA-481 fiber and G. raimondii fiber have components with more C-H and fewer O-H and C-C/C-O moieties than other cotton fibers.
NIR light reflectance showed that G. raimondii fibers appear spectrally similar to Upland cotton green fibers. The color trait in cottons is genetically inherited; however, fiber color has been observed to vary over seasons and geographic locations due
to climate and soil differences (Dickerson et al., 1999). Additionally, colored cotton fibers tend to be unstable; some darkening when exposed to light and others fading. Green fibers tend to be light sensitive (Dickerson et al., 1999; Pan et al., 2010).
The ultrastructure of Upland cotton green fibers is characterized by a high content (14-17%) of wax material that is referred to as suberin (Conard and Neely, 1943; Pan et al., 2010). This material is depos-ited in concentric, osmiophilic layers that alternate with layers of cellulose in the secondary cell wall of the cotton fibers (Ryser et al., 1983). In contrast, brown cotton fiber pigments are derived from proan-thocyanidins (Xiao et al., 2014). The suberin of the green color fibers appears to be a complex material that has not been well characterized. It is composed of both polyaliphatic and polyaromatic domains, possibly cross-linked, and could function to regulate intercellular transport processes (Ranathunge et al., 2011). The aliphatic components are believed to be ω-hydroxyacids, α,ω-diacids, fatty acids, and primary alcohols, whereas hydroxycinnamic acids, especially ferulic acid, make up the polyaromatic domain. The similar spectral patterns indicate similar chemical and physical components between G. rai-mondii fibers and Upland cotton green fibers.
Fiber Fineness. Average fineness values were manually measured by gravimetric fineness methods because the short G. raimondii fibers could not be mea-sured by AFIS, which generally is used to determine fineness values from Upland cotton fibers. Average gravimetric fineness of the fibers from G. raimondii accessions D5-6, D5-8, and D5-31 was 29.0, 51.1, and 28.1 mtex, respectively. Hence, these samples exhibited some variation, but all of the accessions evaluated were significantly finer than the fibers from the three studied G. hirsutum varieties (Table 1). In addition to gravimet-ric fineness, the Cottonscope method also confirmed that G. raimondii fibers (73 mtex) were finer than TM-1 fibers (165 mtex). Previous evaluations have shown that, even though these methods yield different values, the gravimetric and Cottonscope fineness results tend to track each other (Rodgers et al., 2013), which was observed here. Fiber ribbon width, also determined by Cottonscope, was smaller for D5-31 fibers (10.5 µm) than it was for TM-1 fibers (15.6 µm). The green Up-land cotton fibers are known to have lower micronaire (2.0-3.0) than brown or white cottons (4.0-5.5) (Pan et al., 2010). The lower fineness of green fibers was consistent with low micronaire value found for these fibers in this study.
Figure 4. Comparisons of fiber colors between G. raimondii and three Upland cotton colored cottons. Fiber color of G. raimondii D5-31 (left) compared with SA-481 green (G), SA-1 brown (B), and TM-1 white (W) fibers from Upland cottons.
Figure 5. NIR spectroscopic analyses of cotton fibers. A. Visible/NIR log (1/R) spectra of G. raimondii D5-31 fiber, Upland cotton SA-481 green (G), SA-1 brown (B), and TM-1 white (W) fibers. B. The second derivative of visible/NIR spectra of color and white cottons.

138JOURNAL OF COTTON SCIENCE, Volume 20, Issue 2, 2016
Fiber Cellulose Content. The cellulose con-tents of the D5-6, D5-8, and D5-31 accessions were 75.3, 78.1, and 74.5%, respectively (Table 1). The cellulose levels of G. raimondii accessions were approximately 20% lower than for the TM-1 variety of Upland cotton. To further characterize the non-cellulosic material, G. raimondii D5-31 fibers were extracted with water and then subsequently with an acetic acid/nitric acid reagent. The noncellulosic components from G. raimondii fibers were insoluble in water, but soluble in the acid solution, unlike the noncellulosic components of the TM-1 fibers that were soluble in water. A recent analysis of cellulosic and noncellulosic components from various cotton lines and hybrids has shown that a high content of noncellulosic components also is found in naturally green fibers (Pan et al., 2010), but not in white or brown fibers.
Fiber Maturity. Fiber maturity describes the de-gree of fiber thickening relative to the fiber perimeter. Among various methods and measurements used to estimate MR values, cross-section image analysis microscopy has been considered as the reference method because it directly measures the degree of fiber thickness, despite being a time consuming and difficult assay to perform (Kim et al., 2014; Thibodeaux and Rajasekaran, 1999). The direct image analysis showed that the D5-31 G. ramondii accession exhibited a high MR value of 1.04 ± 0.26, which was 1.1-fold greater than the TM-1 fibers (0.92 ± 0.26) (Table 1).
An indirect method, Cottonscope, was used as a supplement to the direct image analysis. Cottonscope measures the degree of birefringence intensity of the fiber’s crystalline cellulose. The birefringence inten-sity is converted to MR values using calibrations versus standard MR values measured from Upland cotton and normalized with the fiber ribbon width as a proxy for fineness (Brims and Hwang, 2010; Kim et al., 2014; Rodgers et al., 2013). Only the D5-31 G. raimondii accession was tested because insufficient fiber was available from the other accessions. The average MR of G. raimondii was 1.266, which was 1.4-fold greater than that of the TM-1 fibers (0.882). Cottonscope MR values suggest that G. raimondii fibers are substantially more mature than Upland TM-1 fibers.
Another indirect FTIR method also was used to compare MR values between G. raimondii and TM-1 fibers (Table 1). The FTIR spectra of the three avail-able G. raimondii accessions gave FTIR MR values
of 0.52 (D5-6), 0.59 (D5-8), and 0.55 (D5-31). In com-parison, TM-1, SA-1, and SA-481 fibers produced values of 0.79, 0.91, and 0.55, respectively (Table 1). The FTIR approach is based on the reflected light that results from the functional chemical groups present on the near-surface of the fiber cellulose (Abidi et al., 2014; Liu, 2013; Liu et al., 2011). If MR is as-sociated with the presence of more cellulose in the fibers, then it might be possible to exhibit distinctive IR bands whose intensities change with cellulose amount. The measured FTIR MR value of the green SA-481 fiber was lower compared to the other G. hirsutum fibers, but was similar to the G. raimondii fibers, suggesting that the green trait could affect cellulose deposition in both plant species. Smaller relative standard deviations for the G. raimondii values indicate a narrower maturity distribution than what was observed for the TM-1 fibers.
Direct image analysis determines MR values from cross-sectional areas of the fiber cell wall, and the result of this technique showed that the G. raimondii fibers were slightly more mature than Upland cotton TM-1. The two indirect methods also suggested that G. raimondii fibers were relatively mature, but there were some variations in the ma-turity values between the indirect methods and the direct image analysis (Table 1). Cottonscope data suggested the G. raimondii fibers to be substantially more mature than the Upland cotton TM-1 fibers, whereas the FTIR spectra showed the G. raimondii fibers to be somewhat less mature than the Upland cotton TM-1 fibers.
Those variations of MR values between di-rect and indirect methods were likely caused by differences of calibration methods among the three measurement methods. Unlike the image analysis microscopy that directly measured MR from the cross-sectioned fiber cell wall, the indi-rect measurement methods detect birefringence (Cottonscope) and cellulose (FTIR) from cotton fibers and convert them to MR values using the algorithms developed from the calibrated fibers ranging various MR. Due to a lack of calibrated G. raimondii fibers, the Upland cotton fibers whose birefringence and cellulose levels are different from G. raimondii fibers were used as calibrations for determining MR values from G. raimondii. The differences of birefringence and cellulose levels between the calibrated fibers and sample fibers potentially cause the variations of the MR values between direct and indirect methods.
139KIM ET AL.: PHENOTYPIC ANALYSIS OF GOSSYPIUM RAIMONDII
The different MR values between the two indirect methods were likely caused by distinct principles be-tween Cottonscope and FTIR. With the Cottonscope, polarized light is used to measure the birefringence intensity that would be generated from crystalline cel-lulose. The polarized microscope can detect not only birefringence from the cellulose but also fluorescence generated from the suberin that is autofluorescent in G. raimondii green fibers (Hewitt, 1938; Ryser et al., 1983). Thus, Cottonscope tended to inflate MR values of the G. raimondii green fibers containing the fluo-rescent suberin. In contrast, the FTIR spectroscopy method measured the IR band intensities generated from cellulose and converted to MR using algorithms (Liu et al., 2011). Standard Upland cotton fibers com-posed of nearly pure cellulose (> 90%) are used as calibrator to determine G. raimondii fibers consisted of substantially lower cellulose content (74%). The lower cellulose content of the G. raimondii fibers reduced the IR band intensities, and the FTIR tended to exclude fiber maturity that was contributed by non-cellulosic materials (26%) in the G. raimondii green fibers. As results of both direct and indirect methods, we concluded that the maturity of G. raimondii green fibers is similar to that of Upland cotton white fibers, although noncellulosic materials contributed more to the maturity of G. raimondii green fibers than the Upland cotton white fibers.
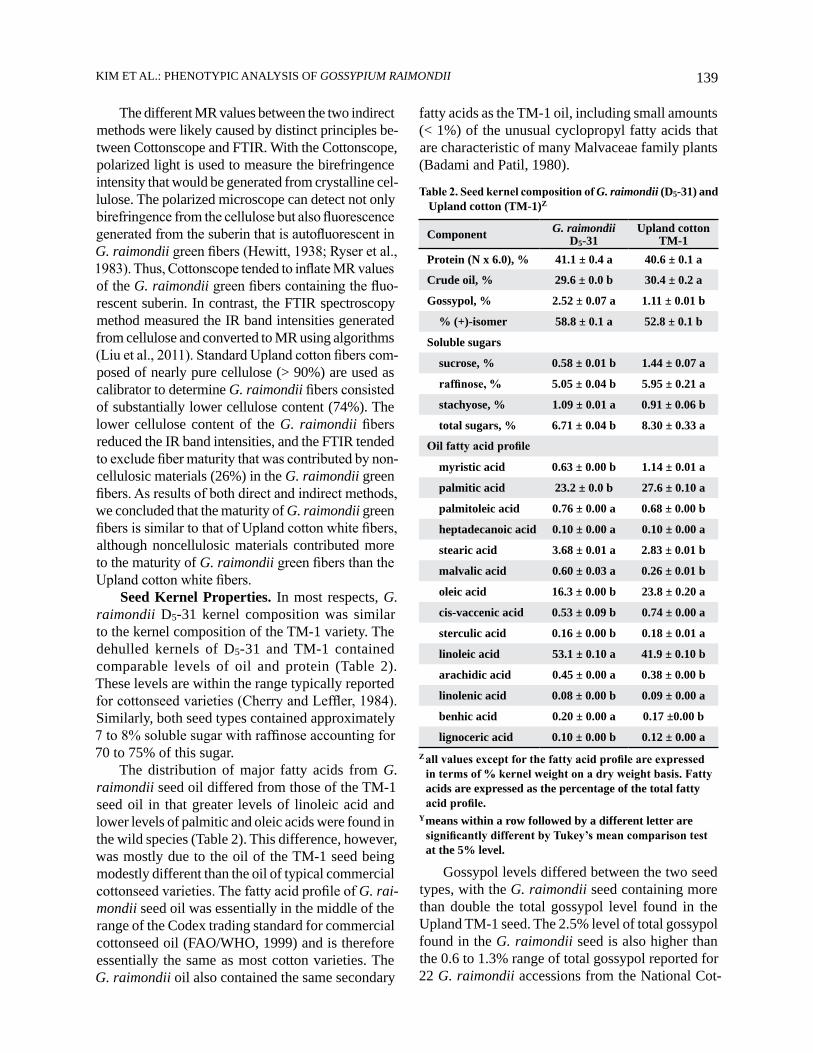
Seed Kernel Properties. In most respects, G. raimondii D5-31 kernel composition was similar to the kernel composition of the TM-1 variety. The dehulled kernels of D5-31 and TM-1 contained comparable levels of oil and protein (Table 2). These levels are within the range typically reported for cottonseed varieties (Cherry and Leffler, 1984). Similarly, both seed types contained approximately 7 to 8% soluble sugar with raffinose accounting for 70 to 75% of this sugar.
The distribution of major fatty acids from G. raimondii seed oil differed from those of the TM-1 seed oil in that greater levels of linoleic acid and lower levels of palmitic and oleic acids were found in the wild species (Table 2). This difference, however, was mostly due to the oil of the TM-1 seed being modestly different than the oil of typical commercial cottonseed varieties. The fatty acid profile of G. rai-mondii seed oil was essentially in the middle of the range of the Codex trading standard for commercial cottonseed oil (FAO/WHO, 1999) and is therefore essentially the same as most cotton varieties. The G. raimondii oil also contained the same secondary
fatty acids as the TM-1 oil, including small amounts (< 1%) of the unusual cyclopropyl fatty acids that are characteristic of many Malvaceae family plants (Badami and Patil, 1980).
Table 2. Seed kernel composition of G. raimondii (D5-31) and Upland cotton (TM-1)Z
Component G. raimondiiD5-31
Upland cottonTM-1
Protein (N x 6.0), % 41.1 ± 0.4 a 40.6 ± 0.1 a
Crude oil, % 29.6 ± 0.0 b 30.4 ± 0.2 a
Gossypol, % 2.52 ± 0.07 a 1.11 ± 0.01 b
% (+)-isomer 58.8 ± 0.1 a 52.8 ± 0.1 b
Soluble sugars
sucrose, % 0.58 ± 0.01 b 1.44 ± 0.07 a
raffinose, % 5.05 ± 0.04 b 5.95 ± 0.21 a
stachyose, % 1.09 ± 0.01 a 0.91 ± 0.06 b
total sugars, % 6.71 ± 0.04 b 8.30 ± 0.33 a
Oil fatty acid profile
myristic acid 0.63 ± 0.00 b 1.14 ± 0.01 a
palmitic acid 23.2 ± 0.0 b 27.6 ± 0.10 a
palmitoleic acid 0.76 ± 0.00 a 0.68 ± 0.00 b
heptadecanoic acid 0.10 ± 0.00 a 0.10 ± 0.00 a
stearic acid 3.68 ± 0.01 a 2.83 ± 0.01 b
malvalic acid 0.60 ± 0.03 a 0.26 ± 0.01 b
oleic acid 16.3 ± 0.00 b 23.8 ± 0.20 a
cis-vaccenic acid 0.53 ± 0.09 b 0.74 ± 0.00 a
sterculic acid 0.16 ± 0.00 b 0.18 ± 0.01 a
linoleic acid 53.1 ± 0.10 a 41.9 ± 0.10 b
arachidic acid 0.45 ± 0.00 a 0.38 ± 0.00 b
linolenic acid 0.08 ± 0.00 b 0.09 ± 0.00 a
benhic acid 0.20 ± 0.00 a 0.17 ±0.00 b
lignoceric acid 0.10 ± 0.00 b 0.12 ± 0.00 aZ all values except for the fatty acid profile are expressed
in terms of % kernel weight on a dry weight basis. Fatty acids are expressed as the percentage of the total fatty acid profile.
Y means within a row followed by a different letter are significantly different by Tukey’s mean comparison test at the 5% level.
Gossypol levels differed between the two seed types, with the G. raimondii seed containing more than double the total gossypol level found in the Upland TM-1 seed. The 2.5% level of total gossypol found in the G. raimondii seed is also higher than the 0.6 to 1.3% range of total gossypol reported for 22 G. raimondii accessions from the National Cot-

140JOURNAL OF COTTON SCIENCE, Volume 20, Issue 2, 2016
ton Germplasm Collection (Stipanovic et al., 2005). Kernel and half-kernel images showed distinct pigments glands that are typical of Gossypium spp. seed (Fig. 6) and are the storage sites for gossypol. Gland density was not measured formally but ap-peared to be greater in the G. raimondii kernels than in the Upland cotton kernels, which is likely a direct manifestation of the greater gossypol levels in these seed. This difference is likely related to the condi-tions used to grow the plants, because seed gossypol levels are sensitive to environmental conditions, with increased seed gossypol levels resulting from lower field temperatures and increased rainfall (Pons et al., 1953). Although this factor has not been studied for wild Gossypium species, gossypol level differences of greater than 50% are known for seeds of plants grown in dryland and irrigated fields for the same variety (Pettigrew and Dowd, 2011).
Similar MR values (0.52-0.59), cellulose contents (74.5-78.1%), and color also were observed from G. raimondii fibers grown in two different environ-ments (Table 1; Fig. 4). We also observed similar fiber and seed properties from the Upland TM-1 grown at New Orleans, LA and College Station, TX (Kim et al., 2013) and concluded that the different environmental conditions in the US and Mexico did not impose serious implications to the properties of the G. raimondii and TM-1.
Photoperiod Sensitivity. Photoperiodic condi-tions were crucial for producing flowers in G. rai-mondii. G. raimondii produced flowers in short-day conditions during winter seasons at College Station, TX and Tecoman, Mexico. In contrast, they were unable to produce flowers in neutral-day condi-tions during winter seasons at New Orleans, LA. The photoperiod sensitivity appears to a barrier for utilizing G. raimondii in Upland cotton breeding programs. Several genes were suggested to involve in the short-day photoperiod response in an Upland cotton variety (Lewis and Richmond, 1957) and a G. barbadense line (Lewis and Richmond, 1960).
Due to the differences in photoperiod sensitivity between G. raimondii and Upland cotton, we grew G. raimondii in short-day conditions and Upland cotton varieties in neutral-day conditions, and compared quantitative traits of the two species.
CONCLUSION
Fiber properties and kernel tissue composition were compared between G. raimondii and Upland cotton varieties. G. raimondii generally had inferior properties for lint percentage, length, fineness, cel-lulose content, and seed size, compared with Upland cotton. In contrast, similar fiber maturity and seed kernel composition were found between G. raimon-dii and Upland cotton. The results also showed that G. raimondii fibers were spectrometrically similar to green Upland cotton fibers but differed from white and brown Upland cotton cottons.
The comparative and quantitative phenotypic results of G. raimondii with Upland cotton varieties will be useful for cotton researchers to better interpret the D5 and AD1 genome data and apply the findings for improving Upland cotton. The results also sug-gest that the G. raimondii genome data can be useful for mining information pertaining to photoperiod and naturally green color biosynthesis in addition to the fiber and seed development.
Figure 6. Half sections of individual G. hirsutum TM-1 (A) and G. raimondii D5-31 (B) seed showing the glanding pattern. Seeds are shown at comparable scale.
Environmental Effects. There were insig-nificant differences among fiber properties obtained from G. raimondii grown in two separate locations that differed in geographical and environmental conditions. G. raimondii plants were grown in pots at College Station, TX, whereas they were grown in the ground at Tecoman, Mexico. Regardless of the conditions, average fiber lengths (10.1-11.7 mm) of G. raimondii were similar to each other (Fig. 3). The fineness values of the two G. raimondii accessions grown at College Station (29-51 mtex) were similar to those grown at Tecoman (28 mtex) (Table 1).
141KIM ET AL.: PHENOTYPIC ANALYSIS OF GOSSYPIUM RAIMONDII
ACKNOWLEDGMENTS
This research was supported by the USDA-ARS CRIS project 6435-21000-016-00D and Cotton, Inc., projects 12-199 and 12-216. The authors acknowl-edge Tracy Condon, Holly King, Jeannine Moraitis, and Scott Pelitire for assisting with fiber and seed property measurements. We also thank Wes Malloy and the staff of the Cotton Winter Nursery for help with the cultivation and harvest of G. raimondii seed.
DISCLAIMER
Mention of trade names or commercial prod-ucts in this publication is solely for the purpose of providing specific information and does not imply recommendation or endorsement by the USDA that is an equal opportunity employer.
REFERENCES
Abidi, N., L. Cabrales, and C.H. Haigler. 2014. Changes in the cell wall and cellulose content of developing cotton fibers investigated by FTIR spectroscopy. Carbohydr. Polym. 100:9–16.
Adams, K.L. 2003. Genes duplicated by polyploidy show unequal contributions to the transcriptome and organ-specific reciprocal silencing. Proc. Nat. Acad. Sci. 100:4649–4654.
American Society for Testing and Materials (ASTM). 2012a. Standard test method for linear density of textile fibers. Option A, Fiber bundle weighing (D1577-07). In Annual Book of ASTM Standards. ASTM, West Conshohocken, PA.
American Society for Testing and Materials (ASTM) 7. 2012b. Standard test method for length and length distribution of cotton fibers (Array method) (D1440-0). In Annual Book of ASTM Standards. ASTM, West Conshohocken, PA.
Applequist, W.L., R. Cronn, and J.F. Wendel. 2001. Compara-tive development of fiber in wild and cultivated cotton. Evol. Dev. 3:3–17.
Badami, R., and K. Patil. 1980. Structure and occurrence of unusual fatty acids in minor seed oils. Prog. Lipid Res. 19:119–153.
Benbouza, H., G. Lognay, R. Palm, J.P. Baudoin, and G. Mergeai. 2002. Development of visual method to quantify the gossypol content in cotton seeds. Crop Sci. 42:1937–1942.
Boza B.T., and R.M. Madoo. 1941. Investigaciones acerca del parentesco de la especie Silvestre Peruana de algodonero Gossypium raimondii, Ulbrich. Bol. Estac. Exp. Agric. La Molina 22.
Brims, M., and H. Hwang. 2010. Introducing Cottonscope: A rapid and precise measurement of cotton fibre maturity based on siromat. p. 1417–1423 In Proc. Beltwide Cot-ton Conf., New Orleans, LA. 4-7 Jan. 2010. Natl. Cotton Counc. Am., Memphis, TN.
Chaudhary, B., L. Flagel, R.M. Stupar, J.A. Udall, N. Verma, N.M. Springer, and J.F. Wendel. 2009. Reciprocal silenc-ing, transcriptional bias and functional divergence of homeologs in polyploid cotton (Gossypium). Genetics 182:503–517.
Cherry, J.P., and H.R. Leffler. 1984. Seed. p. 511–569 In R.J. Kohel and C.F. Lewis (eds.). Cotton. American Society of Agronomy, Crop Science Society of America, Soil Science of America, Madison, WI.
Conard, C.M., and J.W. Neely. 1943. Heritable relation of wax content and green pigmentation of lint in upland cotton. J. Agric. Res. 66:307–312.
Dickerson, D.K., E.F. Lane, and D.F. Rodriguez. 1999. Natu-rally colored cotton: resistance to changes in color and durability when refurbished with selected laundry aids. California Agricultural Technology Institute, California State University, Fresno.
Elesini, U.S., A.P. Cuden, and A.F. Richards. 2002. Study of the green cotton fibres. Acta Chim. Slov. 49:815–833.
Endrizzi, J., E. Turcotte, and R. Kohel. 1985. Genetics, cytol-ogy and evolution of Gossypium. Adv. Genet. 23:271–375.
Fang, D.D., L.L. Hinze, R.G. Percy, P. Li, D. Deng, and G. Thyssen. 2013. A microsatellite-based genome-wide analysis of genetic diversity and linkage disequilibrium in Upland cotton (Gossypium hirsutum L.) cultivars from major cotton-growing countries. Euphytica. 191:391–401.
Food and Agriculture Organization/World Health Organiza-tion (FAO/WHO). 1999. Standard #210. Standard for named vegetable oils. Available at http://www.fao.org/docrep/004/y2774e/y2774e04.htm#bm4.1 (verified 7 April 2016).
Fryxell, P.A. 2000. The Natural History of the Cotton Tribe. Texas A&M University Press, College Station, TX.
Gilbert, M.K., H.J. Kim, Y. Tang, M. Naoumkina, and D.D. Fang. 2014. Comparative transcriptome analysis of short fiber mutants ligon-lintless 1 and 2 reveals common mechanisms pertinent to fiber elongation in cotton (Gos-sypium hirsutum L.). PLoS ONE. 9:e95554.

142JOURNAL OF COTTON SCIENCE, Volume 20, Issue 2, 2016
Gore, M.A., D.D. Fang, J.A. Poland, J. Zhang, R.G. Percy, R.G. Cantrell, G. Thyssen, and A.E. Lipka. 2014. Link-age map construction and quantitative trait locus analysis of agronomic and fiber quality traits in cotton. Plant Genome. 7:1–10.
Hewitt, W.B. 1938. Leaf scar infection in relation to the olive knot disease. Hilgardia. 12:41–71.
Hovav, R., J.A. Udall, B. Chaudhary, E. Hovav, L. Flagel, G. Hu, and J.F. Wendel. 2008. The evolution of spinnable cotton fiber entailed prolonged development and a novel metabolism. PLoS Genetics. 4:e25.
Hutchinson, J.B., R.A. Silow, and S.G. Stephens. 1947. The Evolution of Gossypium and the Differentiation of the Cultivated Cottons. Oxford University Press, London, UK.
Islam, M.S., L. Zeng, C.D. Delhom, X. Song, H.J. Kim, P. Li, and D.D. Fang. 2014. Identification of cotton fiber quality quantitative trait loci using intraspecific crosses derived from two near-isogenic lines differing in fiber bundle strength. Mol. Breed. 34:373–384.
Islam, M.S., D.D. Fang, G.N.Thyssen, C.D. Delhom, Y. Liu, and H.J. Kim. 2016. Comparative fiber property and transcriptome analyses reveal key genes potentially related to high fiber strength in cotton (Gossypium hirsu-tum L.) line MD52ne. BMC Plant Biol. 16:36.
Jin, X., Q. Li, G. Xiao, and Y.X. Zhu. 2013. Using genome‐referenced expressed sequence tag assembly to analyze the origin and expression patterns of Gossypium hirsu-tum transcripts. J. Integr. Plant Biol. 55:576–585.
Kim, H.J. 2015. Fiber biology. p. 97–127. In D.D. Fang, and R.G. Percy (eds.). Cotton, 2nd ed. American Society of Agronomy, Crop Science Society of America, and Soil Science Society of America, Madison, WI.
Kim, H.J., and B.A. Triplett. 2001. Cotton fiber growth in planta and in vitro. Models for plant cell elongation and cell wall biogenesis. Plant Physiol. 127:1361–1366.
Kim, H.J., J. Rodgers, C. Delhom, and X. Cui. 2014. Compar-isons of methods measuring fiber maturity and fineness of Upland cotton fibers containing different degree of fi-ber cell wall development. Textile Res. J. 84:1622–1633.
Kim, H.J., Y. Tang, H.S. Moon, C.D. Delhom, and D.D. Fang. 2013. Functional analyses of cotton (Gossypium hirsutum L.) immature fiber (im) mutant infer that fiber cell wall development is associated with stress responses. BMC Genomics. 14:889.
Kohel, R., T. Richmond, and C. Lewis. 1970. Texas marker-1. Description of a genetic standard for Gossypium hirsu-tum L. Crop Sci. 10:670–671.
Kothari, N., S.S. Hague, J. Frelichowski, R.L. Nichols, and D.C. Jones. 2011. Utilization of cotton germplasm in the winter nursery at Tecoman, Mexico, for plant breeding training and research. J. Cotton Sci. 15:271–273.
Lang, A.G. 1938. The origin of lint and fuzz hairs of cotton. J. Agric. Res. 56:507–521.
Lewis C.F., and T.R. Richmond. 1957. The genetics of flower-ing response in cotton. I. Fruiting behavior of Gossypium hirsutum Var. marie-galante in a cross with a variety of cultivated american upland cotton. Genetics. 42: 499–509.
Lewis C.F., and T.R. Richmond. 1960. The genetics of flowering response in cotton. II. Inheritance of flowering response in a Gossypium barbadense cross. Genetics. 45: 79–85.
Li, F., G. Fan, C. Lu, G. Xiao, C. Zou, R.J. Kohel, Z. Ma, H. Shang, X. Ma, J. Wu, X. Liang, G. Huang, R.G. Percy, K. Liu, W. Yang, W. Chen, X. Du, C. Shi, Y. Yuan, W. Ye, X. Liu, X. Zhang, W. Liu, H. Wei, S. Wei, G. Huang, X. Zhang, S. Zhu, H. Zhang, F. Sun, X. Wang, J. Liang, J. Wang, Q. He, L. Huang, J. Wang, J. Cui, G. Song, K. Wang, X. Xu, J.Z. Yu, Y. Zhu, and S. Yu. 2015. Genome sequence of cultivated Upland cotton (Gossypium hirsutum TM-1) provides insights into genome evolution. Nature Biotechnol. 33:524–530.
Li, F., G. Fan, K. Wang, F. Sun, Y. Yuan, G. Song, Q. Li, Z. Ma, C. Lu, C. Zou. W. Chen, X. Liang, H. Shang, W. Liu, C. Shi, G. Xiao, C. Gou, W. Ye, X. Xu, X. Zhang, H. Wei, Z. Li, G. Zhang, J. Wang, K. Liu, R.J. Kohel, R.G. Percy, J.Z. Yu, Y. Zhu, J. Wang, and S. Yu. 2014. Genome sequence of the cultivated cotton Gossypium arboreum. Nature Genet. 46:567–572.
Liu, Y. 2013. Recent progress in Fourier transform infrared (FTIR) spectroscopy study of compositional, structural and physical attributes of developmental cotton fibers. Materials. 6:299–313.
Liu, Y., and H.J. Kim. 2015. Use of attenuated total reflection fourier transform infrared (ATR-FTIR) spectroscopy in direct, non-destructive, and rapid assessment of develop-mental cotton fibers grown in planta and in culture. Appl. Spectrosc. 69: 1004–1010.
Liu, Y., S. Kokot, and T.A. Sambi. 1998. Vibrational spectro-scopic investigation of Australian cotton cellulose fibres Part 2. A Fourier transform near-infrared preliminary study. Analyst. 123:1725–1728.
Liu, Y., D. Thibodeaux, and G. Gamble. 2011. Development of Fourier transform infrared spectroscopy in direct, non-destructive, and rapid determination of cotton fiber maturity. Textile Res. J. 81: 1559–1567.

143KIM ET AL.: PHENOTYPIC ANALYSIS OF GOSSYPIUM RAIMONDII
Liu, Y., D. Thibodeaux, G. Gamble, P. Bauer, and D. VanDerveer. 2012. Comparative investigation of Fourier transform infrared (FT-IR) spectroscopy and X-ray Diffraction (XRD) in the determination of cotton fiber crystallinity. Appl. Spectrosc. 66:983-986.
Liu, X., B. Zhao, H. Zheng, Y. Hu, G. Lu, C. Yang, J. Chen, J. Chen, D. Chen, L. Zhang, Y. Zhou, L. Wang, W. Guo, Y. Bai, J. Ruan, X. Shangguan, Y. Mao, C. Shan, J. Jiang, Y. Zhu, L. Jin, H. Kang, S. Chen, X. He, R. Wang, Y. Wang, J. Chen, L. Wang, S. Yu, B. Wang, J. Wei, S. Song, X. Lu, Z. Gao, W. Gu, X. Deng, D. Ma, S. Wang, W. Liang, L. Fang, C. Cai, X. Zhu, B. Zhou, J. Z. Chen, S. Xu, Y. Zhang, S. Wang, T. Zhang, G. Zhao, and X. Chen. 2015. Gossypium barbadense genome sequence provides insight into the evolution of extra-long staple fiber and specialized metabolites. Scientific Rep. 5: 14139.
Naoumkina, M., G. Thyssen, D.D. Fang, D.J. Hinchliffe, C. Florane, K.M. Yeater, J.T. Page, and J.A. Udall. 2014. The Li2 mutation results in reduced subgenome expres-sion bias in elongating fibers of allotetraploid cotton (Gossypium hirsutum L.). PLoS ONE. 9:e90830.
Olsen, K.M., and J.F. Wendel. 2013. Crop plants as models for understanding plant adaptation and diversification. Frontiers Plant Sci. 4:290
Page, J.T., A.R. Gingle, and J.A. Udall. 2013. PolyCat: a resource for genome categorization of sequencing reads from allopolyploid organisms. G3: Genes, Genomes. Genetics. 3:517–525.
Pan, Z., D. Sun, J. Sun, Z. Zhou, Y. Jia, B. Pang, Z. Ma, and X. Du. 2010. Effects of fiber wax and cellulose content on colored cotton fiber quality. Euphytica. 173:141–149.
Paterson, A.H., J.F. Wendel, H. Gundlach, H. Guo, J. Jenkins, D. Jin, D. Llewellyn, K.C. Showmaker, S. Shu, J. Udall, M.-J. Yoo, R. Byers, W. Chen, A. Doron-Faigenboim, M.V. Duke, L. Gong, J. Grimwood, C. Grover, K. Grupp, G. Hu, T.-H. Lee, J. Li, L. Lin, T. Liu, B.S. Marler, J.T. Page, A.W. Roberts, E. Romanel, W.S. Sanders, E. Sza-dkowski, X. Tan, H. Tang, C. Xu, J. Wang, Z. Wang, D. Zhang, L. Zhang, H. Ashrafi, F. Bedon, J.E. Bowers, C.L. Brubaker, P.W. Chee, S. Das, A.R. Gingle, C.H. Haigler, D. Harker, L.V. Hoffmann, R. Hovav, D.C. Jones, C. Lemke, S. Mansoor, M.U. Rahman, L.N. Rainville, A. Rambani, U.K. Reddy, J.-K. Rong, Y. Saranga, B.E. Scheffler, J.A. Scheffler, D.M. Stelly, B.A. Triplett, A. Van Deynze, M.F.S. Vaslin, V.N. Waghmare, S.A. Walford, R.J. Wright, E.A. Zaki, T. Zhang, E.S. Dennis, K.F.X. Mayer, D.G. Peterson, D.S. Rokhsar, X. Wang, and J. Schmutz. 2012. Repeated polyploidization of Gos-sypium genomes and the evolution of spinnable cotton fibres. Nature. 492:423–427.
Pettigrew, W.T., and M.K. Dowd. 2011. Varying planting dates or irrigation regimes alters cottonseed composition. Crop Sci. 51:2155–2164.
Pons, W., C. Hoffpauir, and T. Hopper. 1953. Gossypol in cot-tonseed. Influence of variety of cottonseed and environ-ment. J. Agric. Food Chem. 1:1115–1118.
Ranathunge, K., L. Schreiber, and R. Franke. 2011. Suberin research in the genomics era—new interest for an old polymer. Plant Sci. 180:399–413.
Rodgers, J., C. Delhom, D. Hinchliffe, H.J. Kim, and X. Cui. 2013. A rapid measurement for cotton breeders of maturity and fineness from developing and mature fibers. Textile Res. J. 83:1439–1451.
Ryser, U., H. Meier, and P. Holloway. 1983. Identification and localization of suberin in the cell walls of green cotton fibres (Gossypium hirsutum L., var. green lint). Proto-plasma. 117:196–205.
Saunders, J. H. 1961. The Wild Species of Gossypium and Their Evolutionary History. Empire Cotton Growing Corp. Oxford University Press, London, UK.
Schubert, A., C. Benedict, J. Berlin, and R. Kohel. 1973. Cotton fiber development-kinetics of cell elongation and secondary wall thickening. Crop Sci. 13:704–709.
Senchina, D.S. 2003. Rate variation among nuclear genes and the age of polyploidy in Gossypium. Mol. Biol. Evol. 20:633–643.
Stipanovic R.D., L.S. Puckhaber, A. A. Bell, A.E. Percival, and J. Jacobs. 2005. Occurrence of (+)-and (-)-gossypol in wild species of cotton and in Gossypium hirsutum var. marie-galante (Watt) Hutchinson. J. Agric. Food Chem. 53:6266–6271.
Tharp, W.H. 1948. Cottonseed composition—Relation to va-riety, maturity, and environment of the plant. p. 117–156. In A.E. Bailey (ed.). Cottonseed and Cottonseed Prod-ucts. Interscience, New York, NY.
Thibodeaux D.P., and K. Rajasekaran. 1999. Development of new reference standards for cotton fiber maturity. J. Cot-ton Sci. 3:188–193.
Updegraff, D.M. 1969. Semimicro determination of cellulose in biological materials. Anal. Biochem. 32:420–424.
Wakelyn P.J., N.R. Bertoniere, A.D. French, D.P. Thibodeaux, B.A. Triplett, M.-A. Rousselle, W.R. Goynes, Jr., J.V. Edwards, L. Hunter, and D.D. McAlister. 2010. Cotton Fiber Chemistry and Technology. CRC Press, New York, NY.
Wang, K., Z. Wang, F. Li, W. Ye, J. Wang, G. Song, Z. Yue, L. Cong, H. Shang, and S. Zhu. 2012. The draft genome of a diploid cotton Gossypium raimondii. Nature Genet. 44:1098–1103.
Wendel, J.F., and R.C. Cronn. 2003. Polyploidy and the evolu-tionary history of cotton. Adv. Agron. 78:139–186.
144JOURNAL OF COTTON SCIENCE, Volume 20, Issue 2, 2016
Wendel, J.F., P.D. Olson, and J.M. Stewart. 1989. Genetic diversity, introgression, and independent domestication of old world cultivated cottons. Am. J. Bot. 1795–1806.
Xiao, Y.-H., Q. Yan, H. Ding, M. Luo, L. Hou, M. Zhang, D. Yao, H.-S. Liu, X. Li, and J. Zhao. 2014. Transcriptome and biochemical analyses revealed a detailed proantho-cyanidin biosynthesis pathway in brown cotton fiber. PLoS ONE. 9:e86344.
Xu, B., and Y. Huang. 2004. Image analysis for cotton fibers part II: Cross-sectional measurements. Textile Res. J. 74:409–416.
Yoo, M.-J., and J.F. Wendel. 2014. Comparative evolution-ary and developmental dynamics of the cotton (Gos-sypium hirsutum) fiber transcriptome. PLoS Genetics. 10:e1004073.
Zhang, H.-B., Y. Li, B. Wang, and P.W. Chee. 2008. Recent advances in cotton genomics. Int. J. Plant Genom. 2008:1–20.
Zhang, T., Y. Hu, W. Jiang, L. Fang, X. Guan, J. Chen, J. Zhang, C.A. Saski, B.E. Scheffler, D.M. Stelly, A.M. Hulse-Kemp, Q. Wan, B. Liu, C. Liu, S. Wang, M. Pan, Y. Wang, D. Wang, W. Ye, L. Chang, W. Zhang, Q. Song, R.C. Kirkbride, X. Chen, E. Dennis, D.J. Llewellyn, D.G. Peterson, P. Thaxton, D.C. Jones, Q. Wang, X. Xu, H. Zhang, H. Wu, L. Zhou, G. Mei, S. Chen, Y. Tian, D. Xiang, X. Li, J. Ding, Q. Zuo, L. Tao, Y. Liu, J. Li, Y. Lin, Y. Hui, Z. Cao, C. Cai, X. Zhu, Z. Jiang, B. Zhou, W. Guo, R. Li, and Z.J. Chen. 2015. Sequencing of al-lotetraploid cotton (Gossypium hirsutum L. acc. TM-1) provides a resource for fiber improvement. Nature Biotechnol. 33:531–537.